Dixie, WA Map & Demographics
Dixie Map
Dixie Overview
$48,309
PER CAPITA INCOME
$118,125
AVG FAMILY INCOME
$69,688
AVG HOUSEHOLD INCOME
0.52
INEQUALITY / GINI INDEX
156
TOTAL POPULATION
84
MALE POPULATION
72
FEMALE POPULATION
116.67
MALES / 100 FEMALES
85.71
FEMALES / 100 MALES
47.0
MEDIAN AGE
2.9
AVG FAMILY SIZE
2.4
AVG HOUSEHOLD SIZE
67
LABOR FORCE [ PEOPLE ]
48.9%
PERCENT IN LABOR FORCE
Dixie Zip Codes
Dixie Area Codes
Income in Dixie
Income Overview in Dixie
Per Capita Income in Dixie is $48,309, while median incomes of families and households are $118,125 and $69,688 respectively.
| Characteristic | Number | Measure |
| Per Capita Income | 156 | $48,309 |
| Median Family Income | 47 | $118,125 |
| Mean Family Income | 47 | $156,070 |
| Median Household Income | 65 | $69,688 |
| Mean Household Income | 65 | $126,438 |
| Income Deficit | 47 | $0 |
| Wage / Income Gap (%) | 156 | 0.00% |
| Wage / Income Gap ($) | 156 | 100.00¢ per $1 |
| Gini / Inequality Index | 156 | 0.52 |
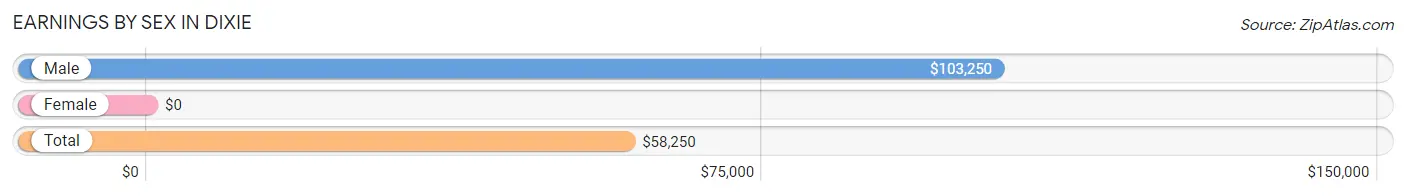
Earnings by Sex in Dixie
| Sex | Number | Average Earnings |
| Male | 41 (53.2%) | $103,250 |
| Female | 36 (46.8%) | $0 |
| Total | 77 (100.0%) | $58,250 |
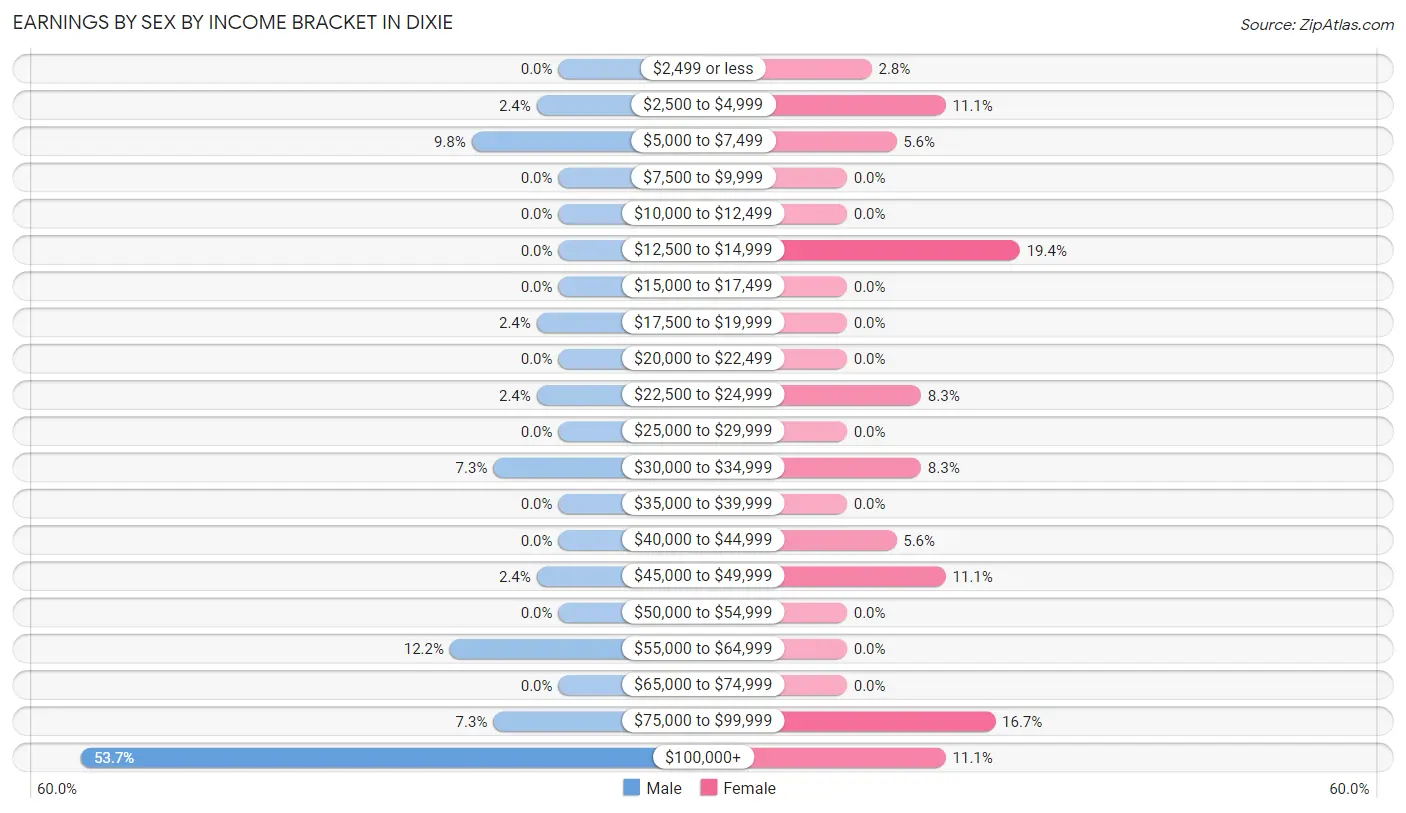
Earnings by Sex by Income Bracket in Dixie
The most common earnings brackets in Dixie are $100,000+ for men (22 | 53.7%) and $12,500 to $14,999 for women (7 | 19.4%).
| Income | Male | Female |
| $2,499 or less | 0 (0.0%) | 1 (2.8%) |
| $2,500 to $4,999 | 1 (2.4%) | 4 (11.1%) |
| $5,000 to $7,499 | 4 (9.8%) | 2 (5.6%) |
| $7,500 to $9,999 | 0 (0.0%) | 0 (0.0%) |
| $10,000 to $12,499 | 0 (0.0%) | 0 (0.0%) |
| $12,500 to $14,999 | 0 (0.0%) | 7 (19.4%) |
| $15,000 to $17,499 | 0 (0.0%) | 0 (0.0%) |
| $17,500 to $19,999 | 1 (2.4%) | 0 (0.0%) |
| $20,000 to $22,499 | 0 (0.0%) | 0 (0.0%) |
| $22,500 to $24,999 | 1 (2.4%) | 3 (8.3%) |
| $25,000 to $29,999 | 0 (0.0%) | 0 (0.0%) |
| $30,000 to $34,999 | 3 (7.3%) | 3 (8.3%) |
| $35,000 to $39,999 | 0 (0.0%) | 0 (0.0%) |
| $40,000 to $44,999 | 0 (0.0%) | 2 (5.6%) |
| $45,000 to $49,999 | 1 (2.4%) | 4 (11.1%) |
| $50,000 to $54,999 | 0 (0.0%) | 0 (0.0%) |
| $55,000 to $64,999 | 5 (12.2%) | 0 (0.0%) |
| $65,000 to $74,999 | 0 (0.0%) | 0 (0.0%) |
| $75,000 to $99,999 | 3 (7.3%) | 6 (16.7%) |
| $100,000+ | 22 (53.7%) | 4 (11.1%) |
| Total | 41 (100.0%) | 36 (100.0%) |
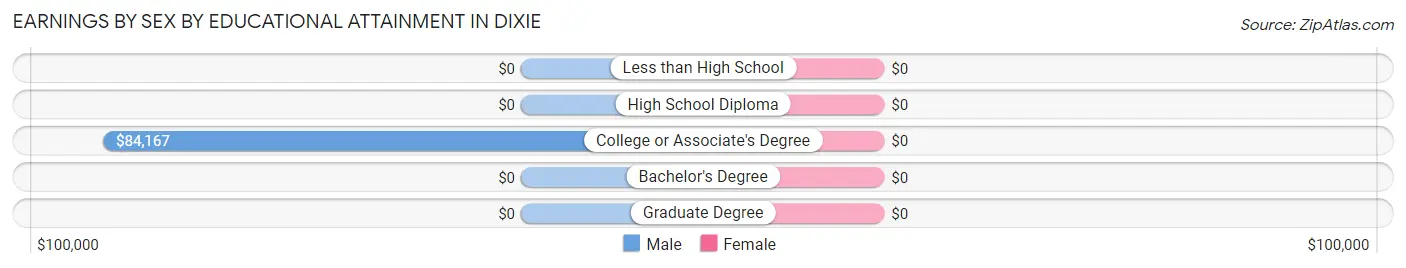
Earnings by Sex by Educational Attainment in Dixie
| Educational Attainment | Male Income | Female Income |
| Less than High School | - | - |
| High School Diploma | - | - |
| College or Associate's Degree | $84,167 | $0 |
| Bachelor's Degree | - | - |
| Graduate Degree | - | - |
| Total | $104,250 | $37,500 |
Family Income in Dixie
Family Income Brackets in Dixie
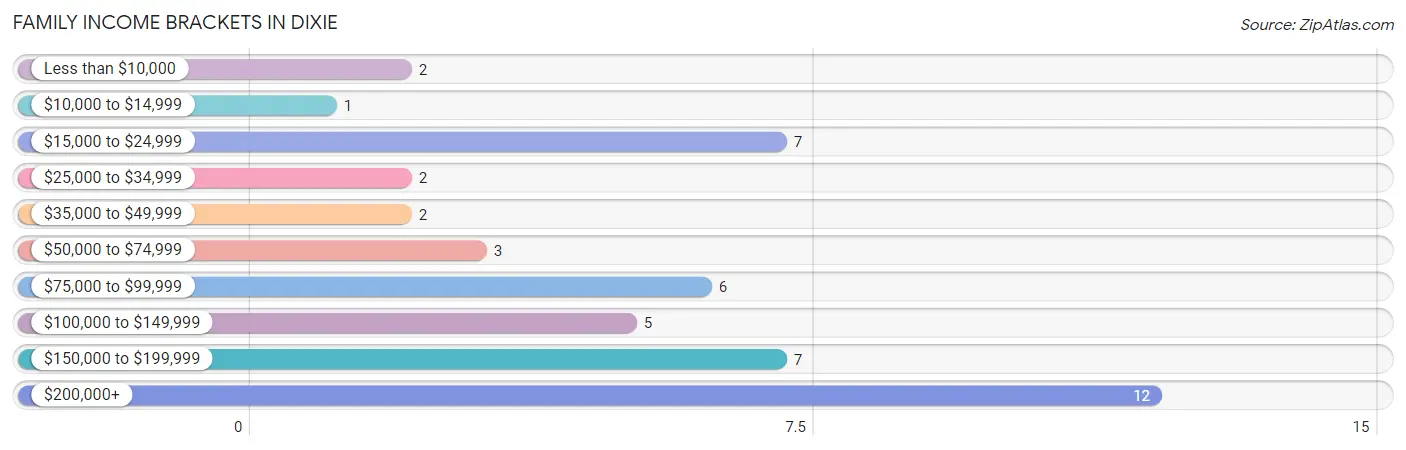
According to the Dixie family income data, there are 12 families falling into the $200,000+ income range, which is the most common income bracket and makes up 25.5% of all families. Conversely, the $10,000 to $14,999 income bracket is the least frequent group with only 1 families (2.1%) belonging to this category.
| Income Bracket | # Families | % Families |
| Less than $10,000 | 2 | 4.3% |
| $10,000 to $14,999 | 1 | 2.1% |
| $15,000 to $24,999 | 7 | 14.9% |
| $25,000 to $34,999 | 2 | 4.3% |
| $35,000 to $49,999 | 2 | 4.3% |
| $50,000 to $74,999 | 3 | 6.4% |
| $75,000 to $99,999 | 6 | 12.8% |
| $100,000 to $149,999 | 5 | 10.6% |
| $150,000 to $199,999 | 7 | 14.9% |
| $200,000+ | 12 | 25.5% |
Family Income by Famaliy Size in Dixie
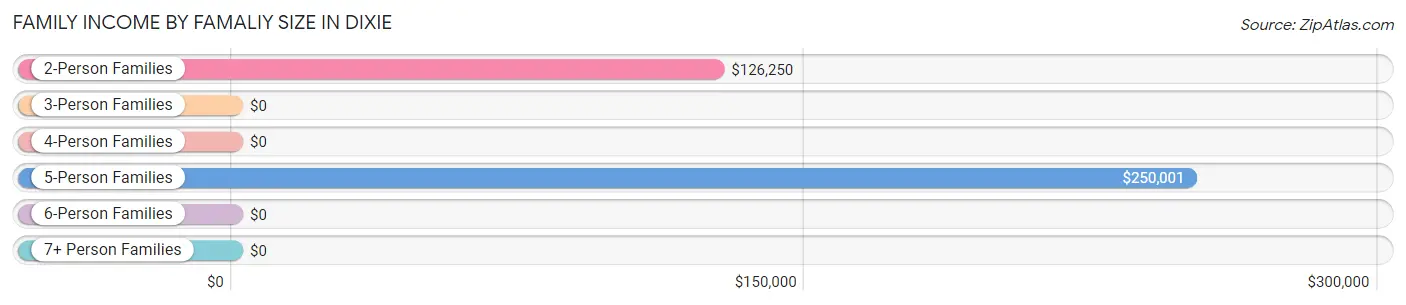
5-person families (13 | 27.7%) account for the highest median family income in Dixie with $250,001 per family, while 2-person families (22 | 46.8%) have the highest median income of $63,125 per family member.
| Income Bracket | # Families | Median Income |
| 2-Person Families | 22 (46.8%) | $126,250 |
| 3-Person Families | 9 (19.2%) | $0 |
| 4-Person Families | 3 (6.4%) | $0 |
| 5-Person Families | 13 (27.7%) | $250,001 |
| 6-Person Families | 0 (0.0%) | $0 |
| 7+ Person Families | 0 (0.0%) | $0 |
| Total | 47 (100.0%) | $118,125 |
Family Income by Number of Earners in Dixie
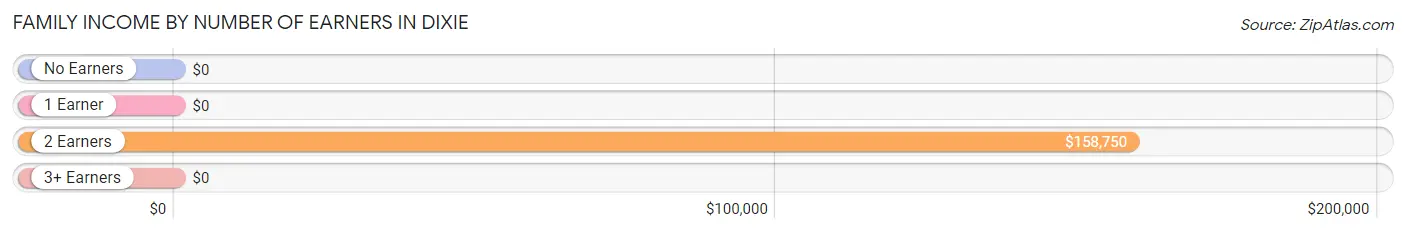
| Number of Earners | # Families | Median Income |
| No Earners | 6 (12.8%) | $0 |
| 1 Earner | 15 (31.9%) | $0 |
| 2 Earners | 18 (38.3%) | $158,750 |
| 3+ Earners | 8 (17.0%) | $0 |
| Total | 47 (100.0%) | $118,125 |
Household Income in Dixie
Household Income Brackets in Dixie
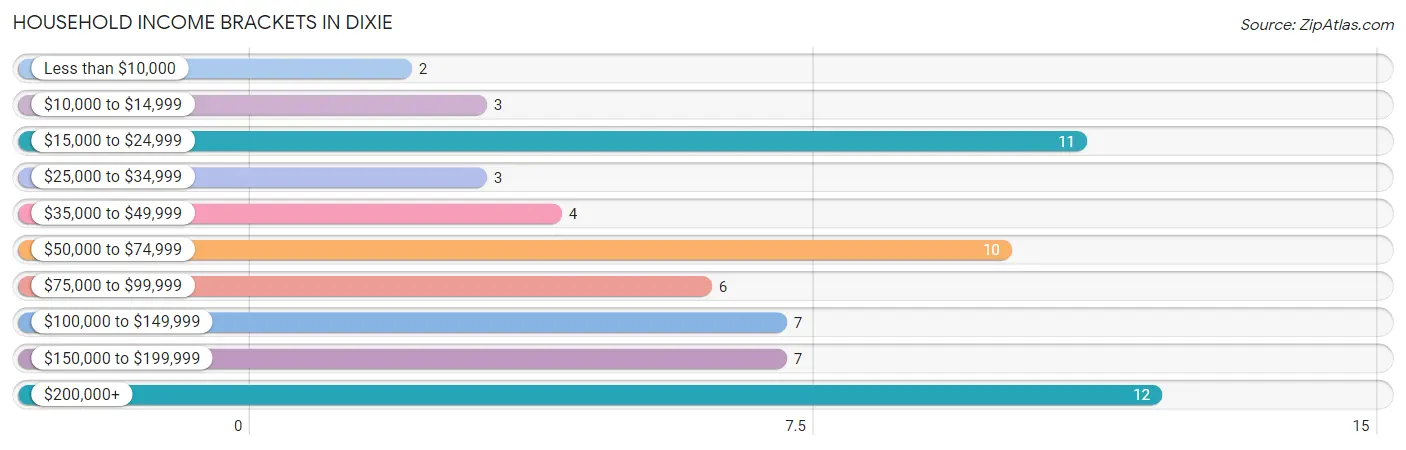
With 12 households falling in the category, the $200,000+ income range is the most frequent in Dixie, accounting for 18.5% of all households. In contrast, only 2 households (3.1%) fall into the less than $10,000 income bracket, making it the least populous group.
| Income Bracket | # Households | % Households |
| Less than $10,000 | 2 | 3.1% |
| $10,000 to $14,999 | 3 | 4.6% |
| $15,000 to $24,999 | 11 | 16.9% |
| $25,000 to $34,999 | 3 | 4.6% |
| $35,000 to $49,999 | 4 | 6.2% |
| $50,000 to $74,999 | 10 | 15.4% |
| $75,000 to $99,999 | 6 | 9.2% |
| $100,000 to $149,999 | 7 | 10.8% |
| $150,000 to $199,999 | 7 | 10.8% |
| $200,000+ | 12 | 18.5% |
Household Income by Householder Age in Dixie
The median household income in Dixie is $69,688, with the highest median household income of $197,750 found in the 45 to 64 years age bracket for the primary householder. A total of 25 households (38.5%) fall into this category.
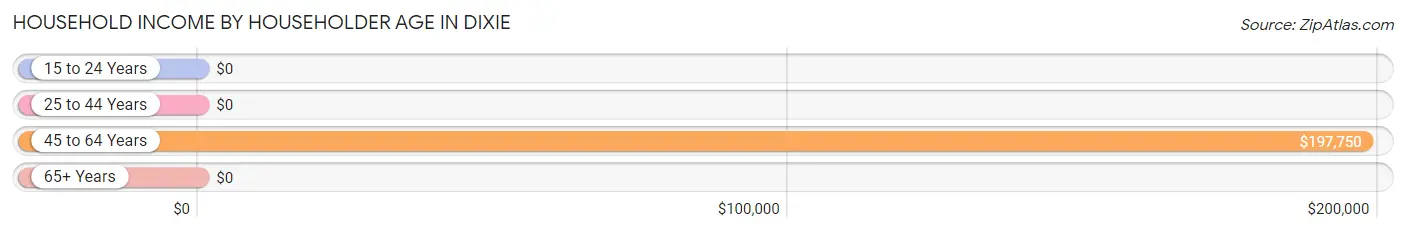
| Income Bracket | # Households | Median Income |
| 15 to 24 Years | 0 (0.0%) | $0 |
| 25 to 44 Years | 18 (27.7%) | $0 |
| 45 to 64 Years | 25 (38.5%) | $197,750 |
| 65+ Years | 22 (33.9%) | $0 |
| Total | 65 (100.0%) | $69,688 |
Poverty in Dixie
Income Below Poverty by Sex and Age in Dixie
With 20.2% poverty level for males and 30.6% for females among the residents of Dixie, 16 and 17 year old males and under 5 year old females are the most vulnerable to poverty, with 6 males (100.0%) and 1 females (100.0%) in their respective age groups living below the poverty level.
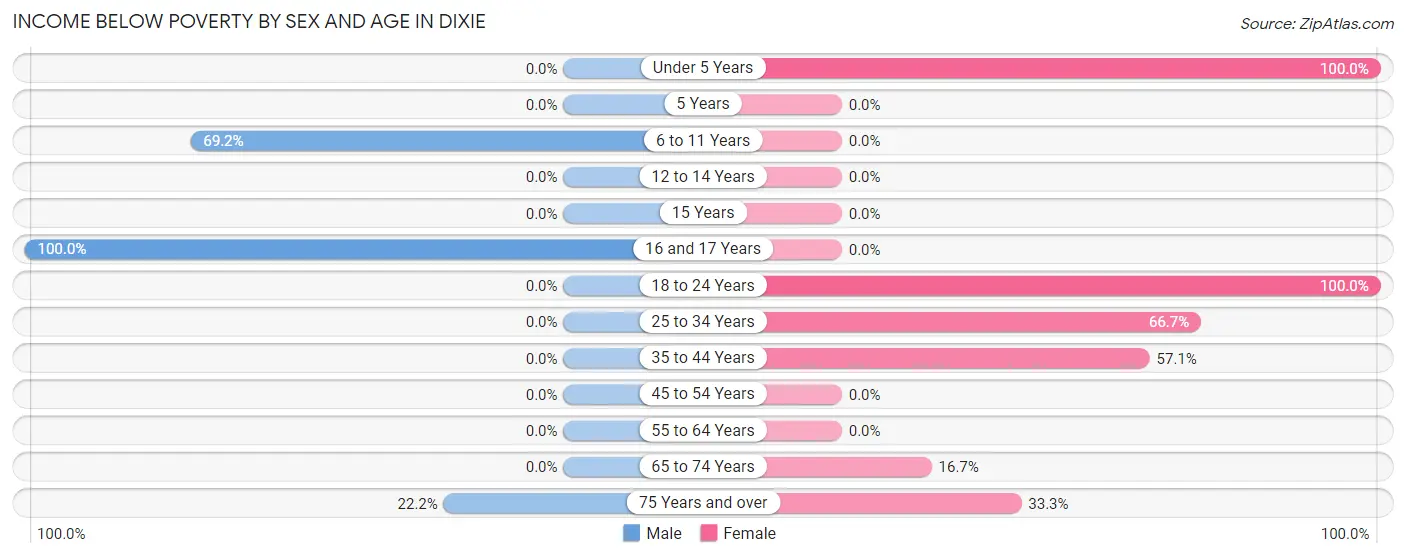
| Age Bracket | Male | Female |
| Under 5 Years | 0 (0.0%) | 1 (100.0%) |
| 5 Years | 0 (0.0%) | 0 (0.0%) |
| 6 to 11 Years | 9 (69.2%) | 0 (0.0%) |
| 12 to 14 Years | 0 (0.0%) | 0 (0.0%) |
| 15 Years | 0 (0.0%) | 0 (0.0%) |
| 16 and 17 Years | 6 (100.0%) | 0 (0.0%) |
| 18 to 24 Years | 0 (0.0%) | 7 (100.0%) |
| 25 to 34 Years | 0 (0.0%) | 2 (66.7%) |
| 35 to 44 Years | 0 (0.0%) | 8 (57.1%) |
| 45 to 54 Years | 0 (0.0%) | 0 (0.0%) |
| 55 to 64 Years | 0 (0.0%) | 0 (0.0%) |
| 65 to 74 Years | 0 (0.0%) | 2 (16.7%) |
| 75 Years and over | 2 (22.2%) | 2 (33.3%) |
| Total | 17 (20.2%) | 22 (30.6%) |
Income Above Poverty by Sex and Age in Dixie
According to the poverty statistics in Dixie, males aged under 5 years and females aged 6 to 11 years are the age groups that are most secure financially, with 100.0% of males and 100.0% of females in these age groups living above the poverty line.
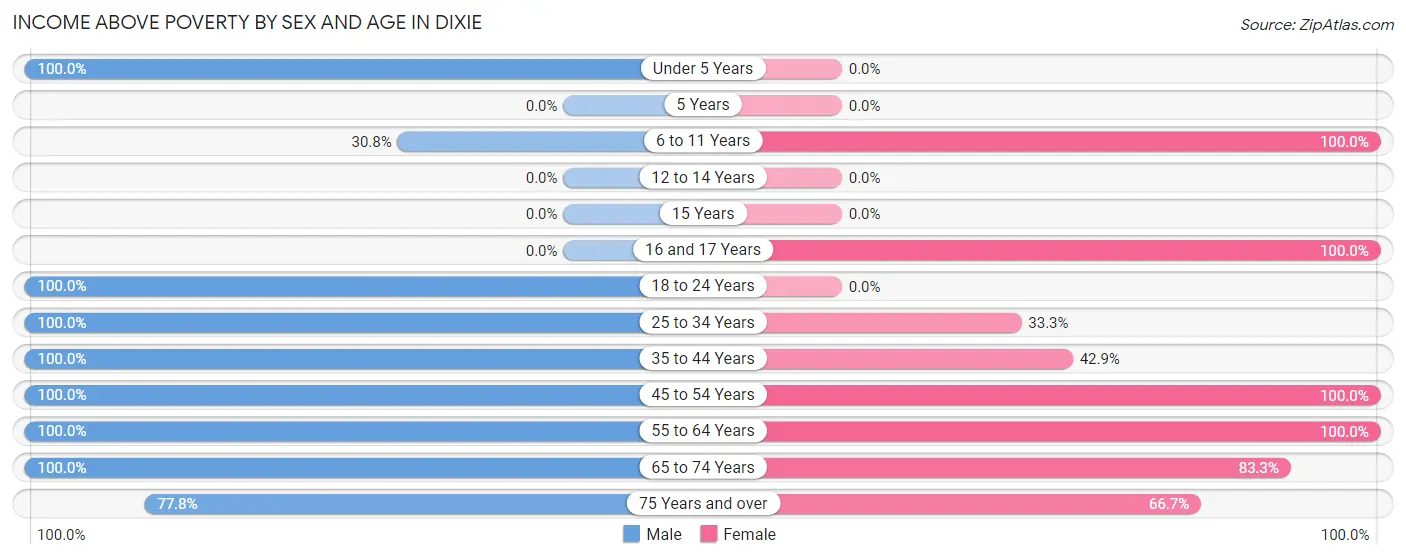
| Age Bracket | Male | Female |
| Under 5 Years | 1 (100.0%) | 0 (0.0%) |
| 5 Years | 0 (0.0%) | 0 (0.0%) |
| 6 to 11 Years | 4 (30.8%) | 4 (100.0%) |
| 12 to 14 Years | 0 (0.0%) | 0 (0.0%) |
| 15 Years | 0 (0.0%) | 0 (0.0%) |
| 16 and 17 Years | 0 (0.0%) | 6 (100.0%) |
| 18 to 24 Years | 14 (100.0%) | 0 (0.0%) |
| 25 to 34 Years | 2 (100.0%) | 1 (33.3%) |
| 35 to 44 Years | 5 (100.0%) | 6 (42.9%) |
| 45 to 54 Years | 19 (100.0%) | 15 (100.0%) |
| 55 to 64 Years | 9 (100.0%) | 4 (100.0%) |
| 65 to 74 Years | 6 (100.0%) | 10 (83.3%) |
| 75 Years and over | 7 (77.8%) | 4 (66.7%) |
| Total | 67 (79.8%) | 50 (69.4%) |
Income Below Poverty Among Married-Couple Families in Dixie
The poverty statistics for married-couple families in Dixie show that 5.6% or 2 of the total 36 families live below the poverty line. Families with no children have the highest poverty rate of 8.7%, comprising of 2 families. On the other hand, families with 1 or 2 children have the lowest poverty rate of 0.0%, which includes 0 families.
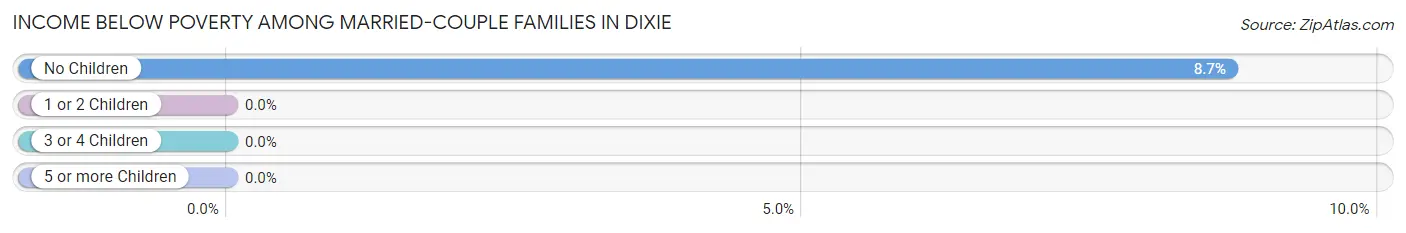
| Children | Above Poverty | Below Poverty |
| No Children | 21 (91.3%) | 2 (8.7%) |
| 1 or 2 Children | 10 (100.0%) | 0 (0.0%) |
| 3 or 4 Children | 3 (100.0%) | 0 (0.0%) |
| 5 or more Children | 0 (0.0%) | 0 (0.0%) |
| Total | 34 (94.4%) | 2 (5.6%) |
Income Below Poverty Among Single-Parent Households in Dixie
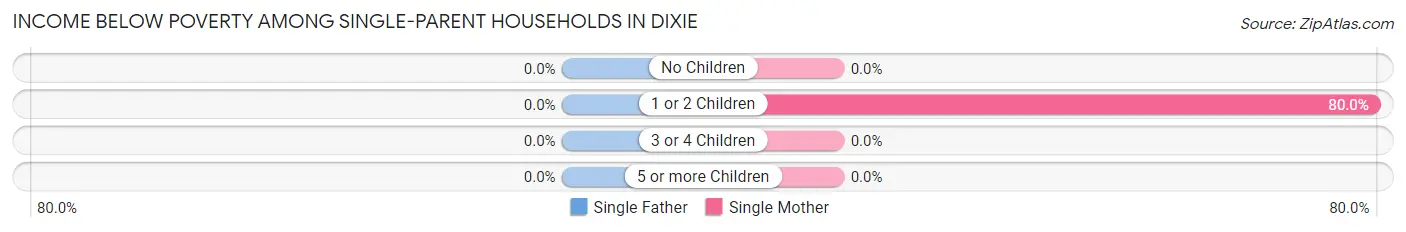
| Children | Single Father | Single Mother |
| No Children | 0 (0.0%) | 0 (0.0%) |
| 1 or 2 Children | 0 (0.0%) | 8 (80.0%) |
| 3 or 4 Children | 0 (0.0%) | 0 (0.0%) |
| 5 or more Children | 0 (0.0%) | 0 (0.0%) |
| Total | 0 (0.0%) | 8 (80.0%) |
Income Below Poverty Among Married-Couple vs Single-Parent Households in Dixie
The poverty data for Dixie shows that 2 of the married-couple family households (5.6%) and 8 of the single-parent households (72.7%) are living below the poverty level. Within the married-couple family households, those with no children have the highest poverty rate, with 2 households (8.7%) falling below the poverty line. Among the single-parent households, those with 1 or 2 children have the highest poverty rate, with 8 household (80.0%) living below poverty.
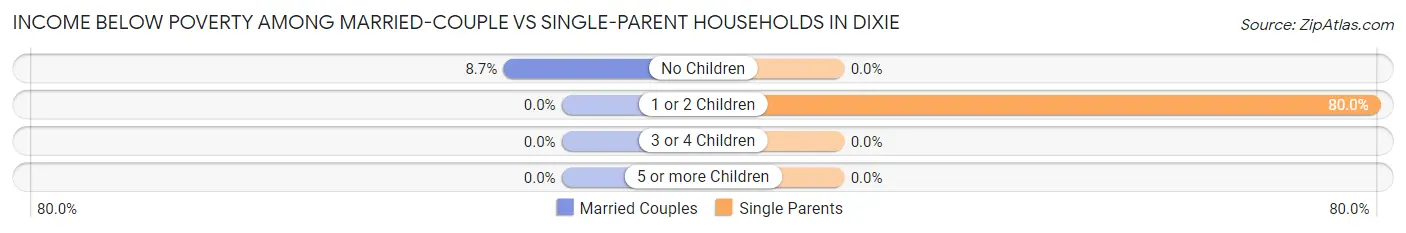
| Children | Married-Couple Families | Single-Parent Households |
| No Children | 2 (8.7%) | 0 (0.0%) |
| 1 or 2 Children | 0 (0.0%) | 8 (80.0%) |
| 3 or 4 Children | 0 (0.0%) | 0 (0.0%) |
| 5 or more Children | 0 (0.0%) | 0 (0.0%) |
| Total | 2 (5.6%) | 8 (72.7%) |
Race in Dixie
The most populous races in Dixie are White / Caucasian (149 | 95.5%), Two or more Races (5 | 3.2%), and Hispanic or Latino (4 | 2.6%).
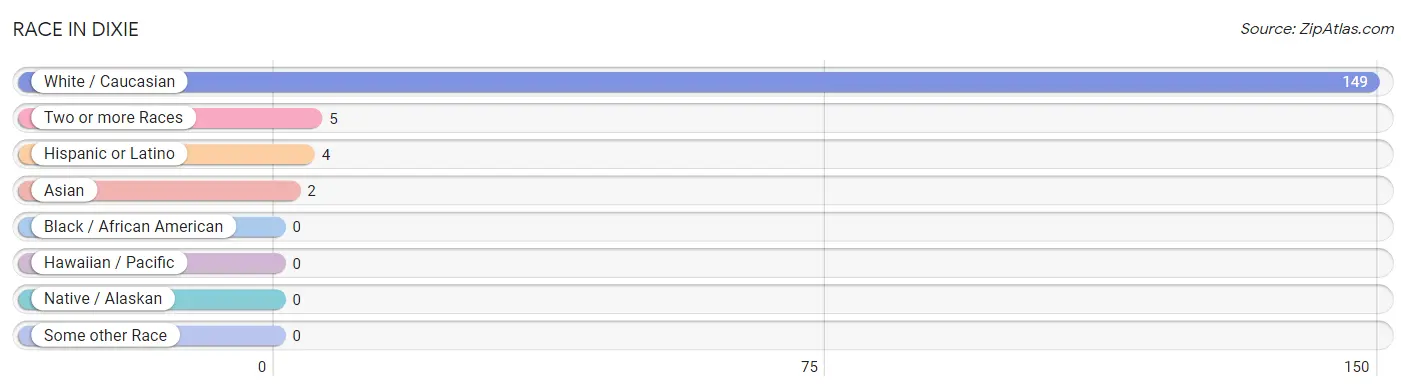
| Race | # Population | % Population |
| Asian | 2 | 1.3% |
| Black / African American | 0 | 0.0% |
| Hawaiian / Pacific | 0 | 0.0% |
| Hispanic or Latino | 4 | 2.6% |
| Native / Alaskan | 0 | 0.0% |
| White / Caucasian | 149 | 95.5% |
| Two or more Races | 5 | 3.2% |
| Some other Race | 0 | 0.0% |
| Total | 156 | 100.0% |
Ancestry in Dixie
The most populous ancestries reported in Dixie are Irish (23 | 14.7%), English (7 | 4.5%), American (6 | 3.8%), French (5 | 3.2%), and German (5 | 3.2%), together accounting for 29.5% of all Dixie residents.
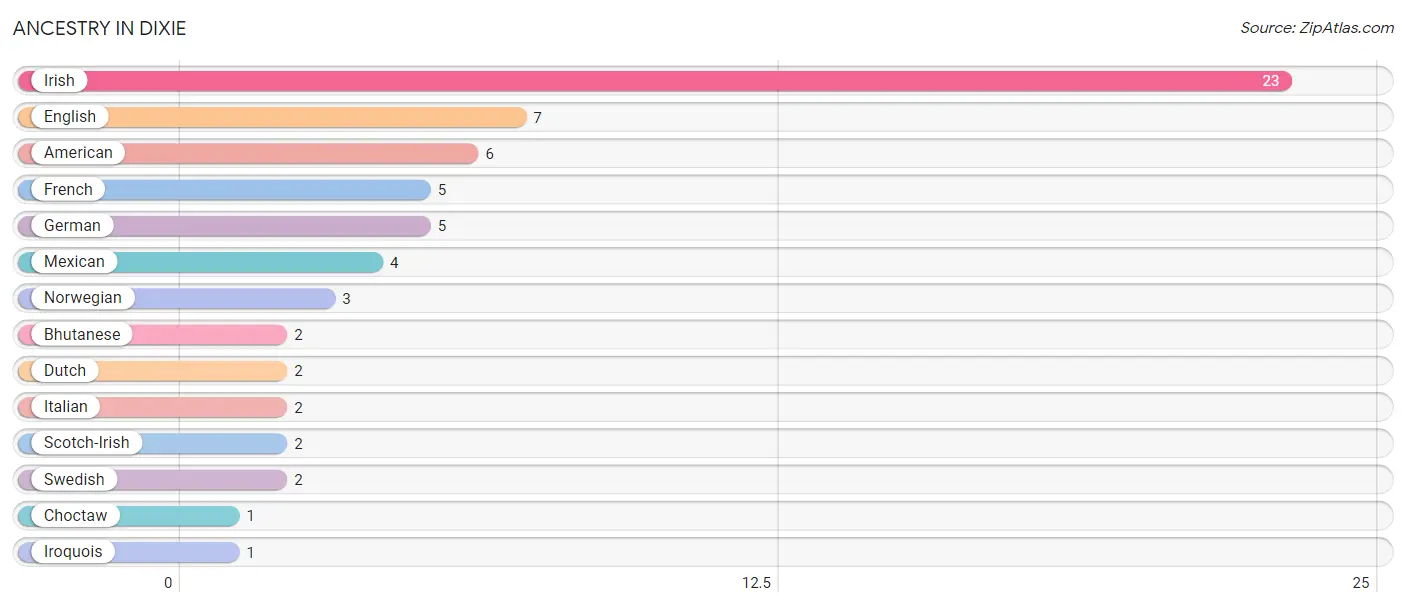
| Ancestry | # Population | % Population |
| American | 6 | 3.8% |
| Bhutanese | 2 | 1.3% |
| Choctaw | 1 | 0.6% |
| Dutch | 2 | 1.3% |
| English | 7 | 4.5% |
| French | 5 | 3.2% |
| German | 5 | 3.2% |
| Irish | 23 | 14.7% |
| Iroquois | 1 | 0.6% |
| Italian | 2 | 1.3% |
| Mexican | 4 | 2.6% |
| Norwegian | 3 | 1.9% |
| Scotch-Irish | 2 | 1.3% |
| Swedish | 2 | 1.3% | View All 14 Rows |
Immigrants in Dixie

| Immigration Origin | # Population | % Population | View All 0 Rows |
Sex and Age in Dixie
Sex and Age in Dixie
The most populous age groups in Dixie are 50 to 54 Years (15 | 17.9%) for men and 45 to 49 Years (15 | 20.8%) for women.
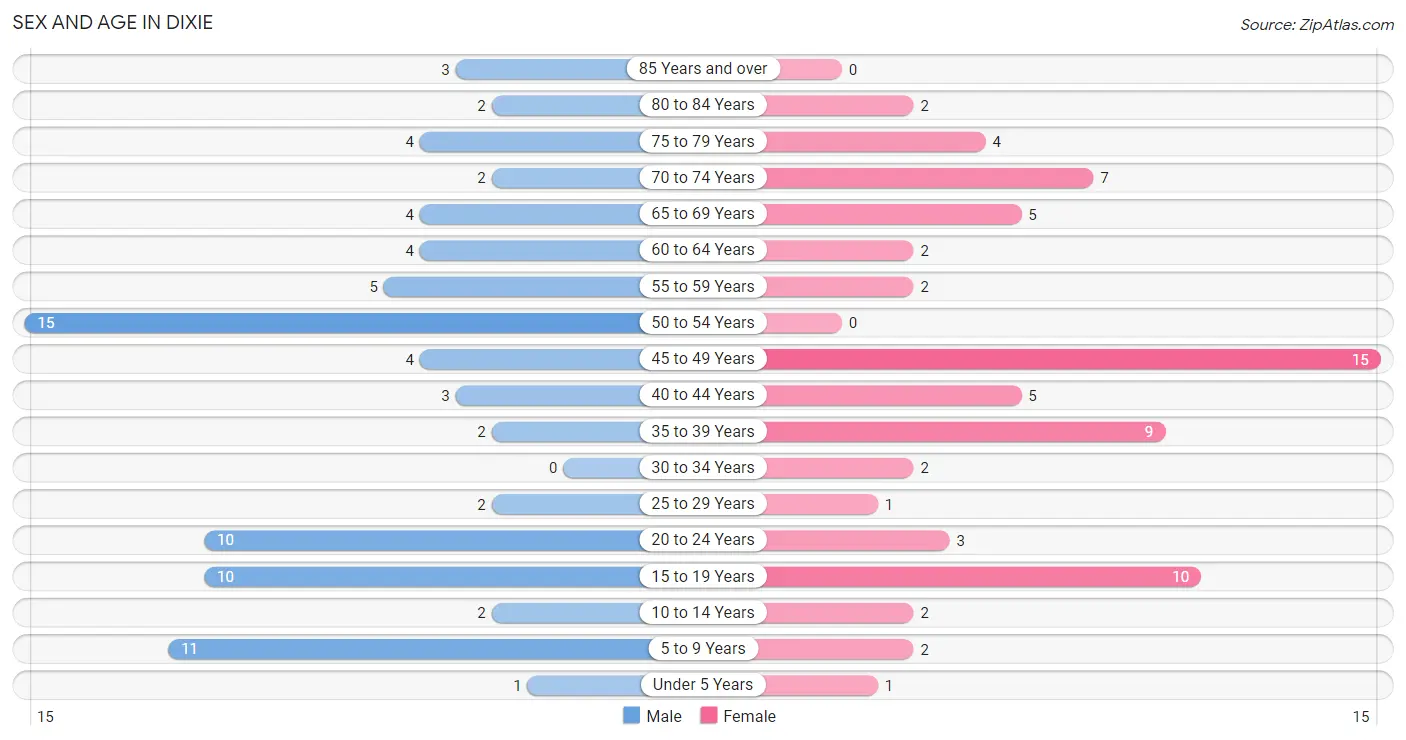
| Age Bracket | Male | Female |
| Under 5 Years | 1 (1.2%) | 1 (1.4%) |
| 5 to 9 Years | 11 (13.1%) | 2 (2.8%) |
| 10 to 14 Years | 2 (2.4%) | 2 (2.8%) |
| 15 to 19 Years | 10 (11.9%) | 10 (13.9%) |
| 20 to 24 Years | 10 (11.9%) | 3 (4.2%) |
| 25 to 29 Years | 2 (2.4%) | 1 (1.4%) |
| 30 to 34 Years | 0 (0.0%) | 2 (2.8%) |
| 35 to 39 Years | 2 (2.4%) | 9 (12.5%) |
| 40 to 44 Years | 3 (3.6%) | 5 (6.9%) |
| 45 to 49 Years | 4 (4.8%) | 15 (20.8%) |
| 50 to 54 Years | 15 (17.9%) | 0 (0.0%) |
| 55 to 59 Years | 5 (5.9%) | 2 (2.8%) |
| 60 to 64 Years | 4 (4.8%) | 2 (2.8%) |
| 65 to 69 Years | 4 (4.8%) | 5 (6.9%) |
| 70 to 74 Years | 2 (2.4%) | 7 (9.7%) |
| 75 to 79 Years | 4 (4.8%) | 4 (5.6%) |
| 80 to 84 Years | 2 (2.4%) | 2 (2.8%) |
| 85 Years and over | 3 (3.6%) | 0 (0.0%) |
| Total | 84 (100.0%) | 72 (100.0%) |
Families and Households in Dixie
Median Family Size in Dixie
The median family size in Dixie is 2.89 persons per family, with single female/mother families (10 | 21.3%) accounting for the largest median family size of 3.7 persons per family. On the other hand, single male/father families (1 | 2.1%) represent the smallest median family size with 2.00 persons per family.
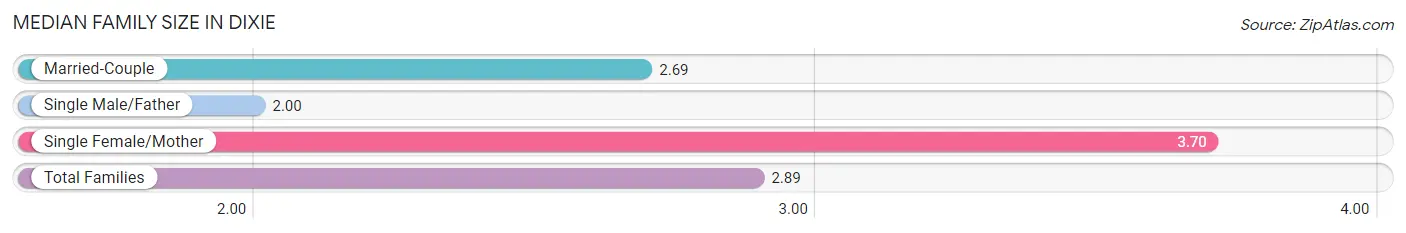
| Family Type | # Families | Family Size |
| Married-Couple | 36 (76.6%) | 2.69 |
| Single Male/Father | 1 (2.1%) | 2.00 |
| Single Female/Mother | 10 (21.3%) | 3.70 |
| Total Families | 47 (100.0%) | 2.89 |
Median Household Size in Dixie
The median household size in Dixie is 2.40 persons per household, with single female/mother households (10 | 15.4%) accounting for the largest median household size of 3.7 persons per household. non-family households (18 | 27.7%) represent the smallest median household size with 1.11 persons per household.
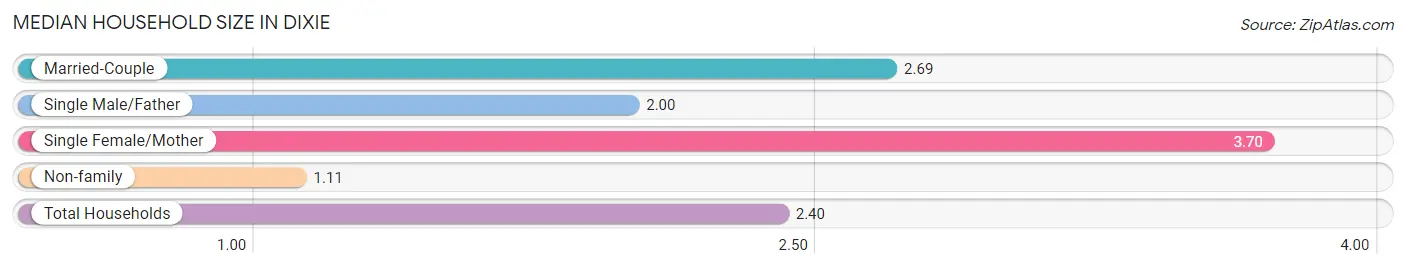
| Household Type | # Households | Household Size |
| Married-Couple | 36 (55.4%) | 2.69 |
| Single Male/Father | 1 (1.5%) | 2.00 |
| Single Female/Mother | 10 (15.4%) | 3.70 |
| Non-family | 18 (27.7%) | 1.11 |
| Total Households | 65 (100.0%) | 2.40 |
Household Size by Marriage Status in Dixie
Out of a total of 65 households in Dixie, 47 (72.3%) are family households, while 18 (27.7%) are nonfamily households. The most numerous type of family households are 2-person households, comprising 22, and the most common type of nonfamily households are 1-person households, comprising 16.
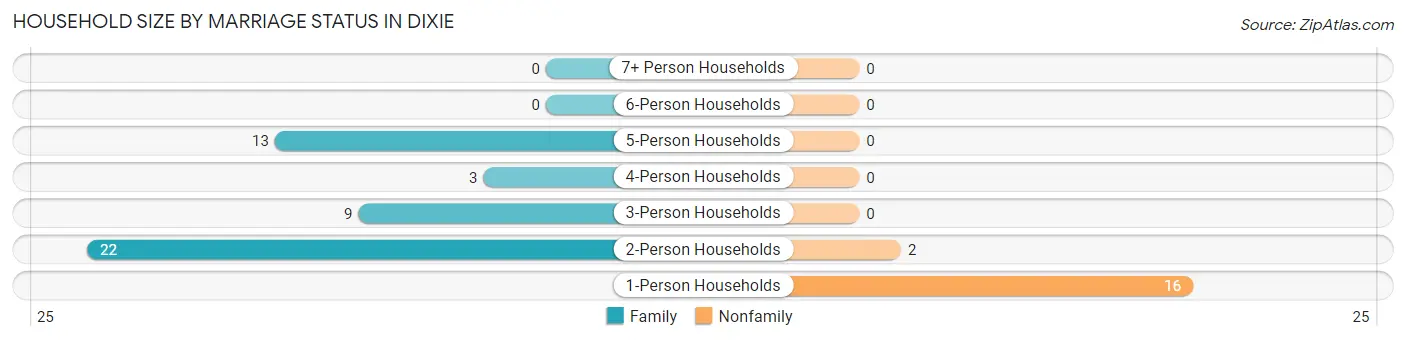
| Household Size | Family Households | Nonfamily Households |
| 1-Person Households | - | 16 (24.6%) |
| 2-Person Households | 22 (33.9%) | 2 (3.1%) |
| 3-Person Households | 9 (13.9%) | 0 (0.0%) |
| 4-Person Households | 3 (4.6%) | 0 (0.0%) |
| 5-Person Households | 13 (20.0%) | 0 (0.0%) |
| 6-Person Households | 0 (0.0%) | 0 (0.0%) |
| 7+ Person Households | 0 (0.0%) | 0 (0.0%) |
| Total | 47 (72.3%) | 18 (27.7%) |
Female Fertility in Dixie
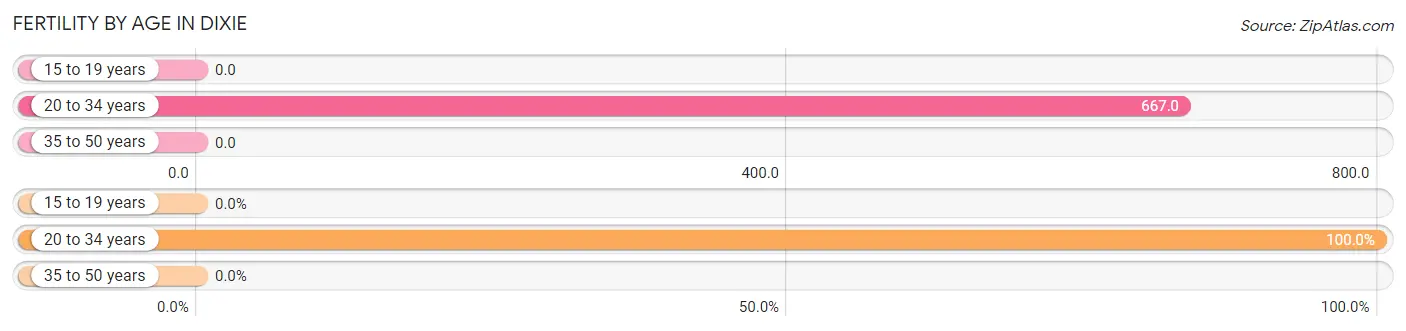
Fertility by Age in Dixie
Average fertility rate in Dixie is 89.0 births per 1,000 women. Women in the age bracket of 20 to 34 years have the highest fertility rate with 667.0 births per 1,000 women. Women in the age bracket of 20 to 34 years acount for 100.0% of all women with births.
| Age Bracket | Women with Births | Births / 1,000 Women |
| 15 to 19 years | 0 (0.0%) | 0.0 |
| 20 to 34 years | 4 (100.0%) | 667.0 |
| 35 to 50 years | 0 (0.0%) | 0.0 |
| Total | 4 (100.0%) | 89.0 |
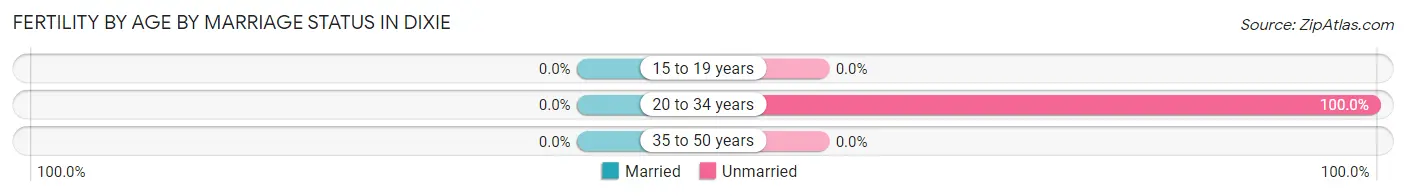
Fertility by Age by Marriage Status in Dixie
| Age Bracket | Married | Unmarried |
| 15 to 19 years | 0 (0.0%) | 0 (0.0%) |
| 20 to 34 years | 0 (0.0%) | 4 (100.0%) |
| 35 to 50 years | 0 (0.0%) | 0 (0.0%) |
| Total | 0 (0.0%) | 4 (100.0%) |
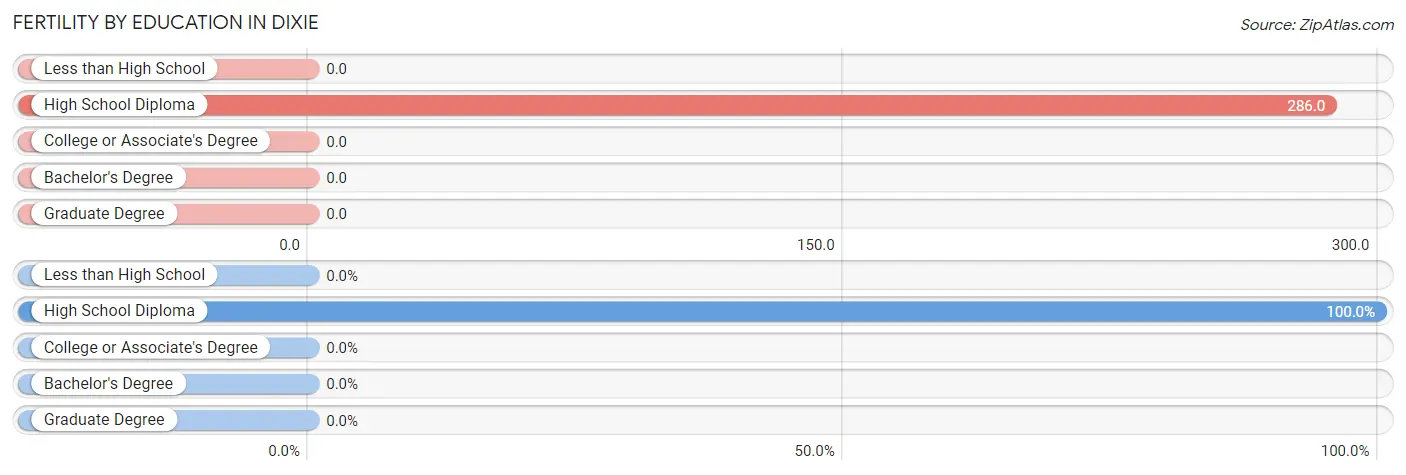
Fertility by Education in Dixie
| Educational Attainment | Women with Births | Births / 1,000 Women |
| Less than High School | 0 (0.0%) | 0.0 |
| High School Diploma | 4 (100.0%) | 286.0 |
| College or Associate's Degree | 0 (0.0%) | 0.0 |
| Bachelor's Degree | 0 (0.0%) | 0.0 |
| Graduate Degree | 0 (0.0%) | 0.0 |
| Total | 4 (100.0%) | 89.0 |
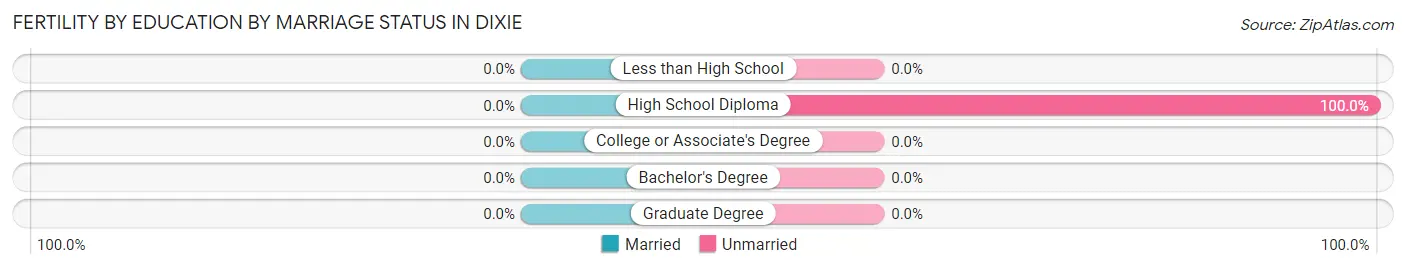
Fertility by Education by Marriage Status in Dixie
| Educational Attainment | Married | Unmarried |
| Less than High School | 0 (0.0%) | 0 (0.0%) |
| High School Diploma | 0 (0.0%) | 4 (100.0%) |
| College or Associate's Degree | 0 (0.0%) | 0 (0.0%) |
| Bachelor's Degree | 0 (0.0%) | 0 (0.0%) |
| Graduate Degree | 0 (0.0%) | 0 (0.0%) |
| Total | 0 (0.0%) | 4 (100.0%) |
Employment Characteristics in Dixie
Employment by Class of Employer in Dixie
Among the 67 employed individuals in Dixie, private company employees (41 | 61.2%), local government employees (11 | 16.4%), and self-employed (incorporated) (8 | 11.9%) make up the most common classes of employment.
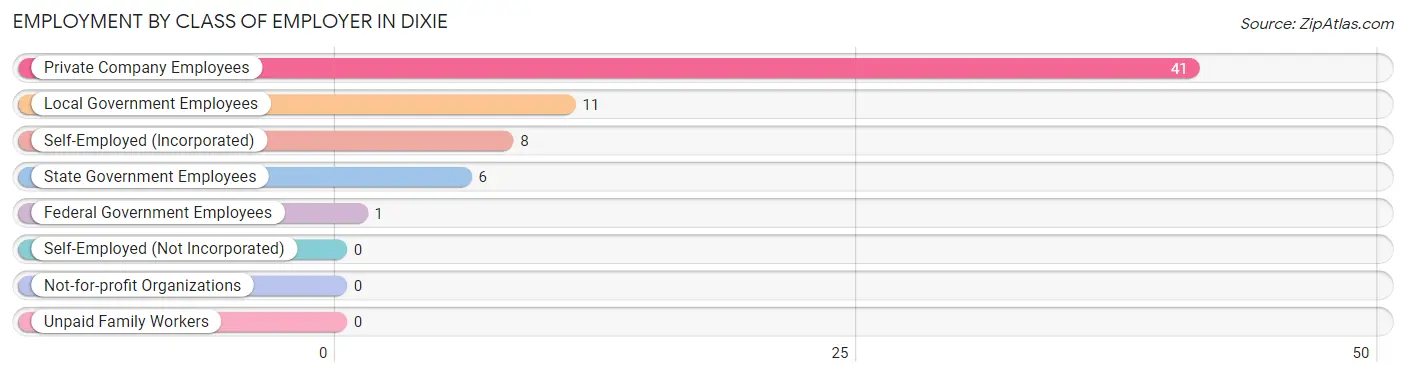
| Employer Class | # Employees | % Employees |
| Private Company Employees | 41 | 61.2% |
| Self-Employed (Incorporated) | 8 | 11.9% |
| Self-Employed (Not Incorporated) | 0 | 0.0% |
| Not-for-profit Organizations | 0 | 0.0% |
| Local Government Employees | 11 | 16.4% |
| State Government Employees | 6 | 9.0% |
| Federal Government Employees | 1 | 1.5% |
| Unpaid Family Workers | 0 | 0.0% |
| Total | 67 | 100.0% |
Employment Status by Age in Dixie
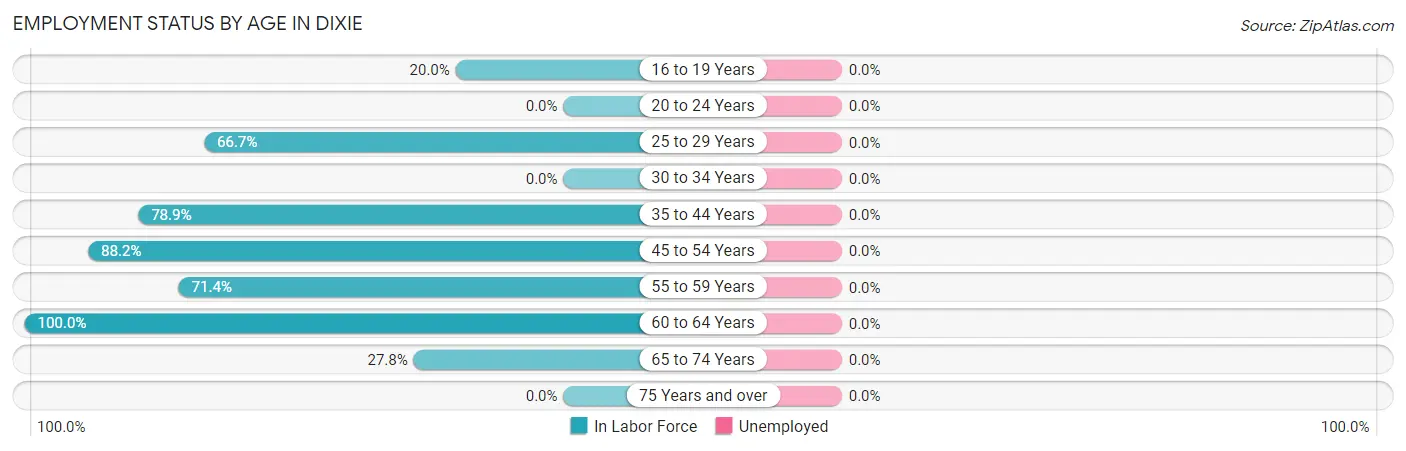
| Age Bracket | In Labor Force | Unemployed |
| 16 to 19 Years | 4 (20.0%) | 0 (0.0%) |
| 20 to 24 Years | 0 (0.0%) | 0 (0.0%) |
| 25 to 29 Years | 2 (66.7%) | 0 (0.0%) |
| 30 to 34 Years | 0 (0.0%) | 0 (0.0%) |
| 35 to 44 Years | 15 (78.9%) | 0 (0.0%) |
| 45 to 54 Years | 30 (88.2%) | 0 (0.0%) |
| 55 to 59 Years | 5 (71.4%) | 0 (0.0%) |
| 60 to 64 Years | 6 (100.0%) | 0 (0.0%) |
| 65 to 74 Years | 5 (27.8%) | 0 (0.0%) |
| 75 Years and over | 0 (0.0%) | 0 (0.0%) |
| Total | 67 (48.9%) | 0 (0.0%) |
Employment Status by Educational Attainment in Dixie
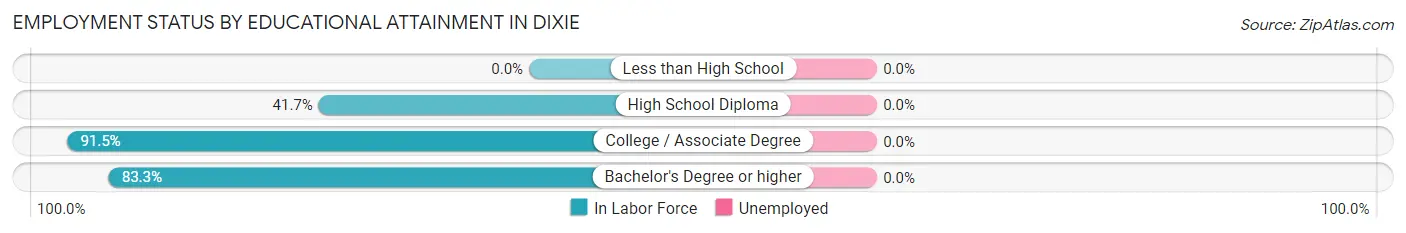
| Educational Attainment | In Labor Force | Unemployed |
| Less than High School | 0 (0.0%) | 0 (0.0%) |
| High School Diploma | 5 (41.7%) | 0 (0.0%) |
| College / Associate Degree | 43 (91.5%) | 0 (0.0%) |
| Bachelor's Degree or higher | 10 (83.3%) | 0 (0.0%) |
| Total | 58 (81.7%) | 0 (0.0%) |
Employment Occupations by Sex in Dixie
Management, Business, Science and Arts Occupations
The most common Management, Business, Science and Arts occupations in Dixie are Business & Financial (8 | 11.9%), Computers, Engineering & Science (6 | 9.0%), and Computers & Mathematics (6 | 9.0%).
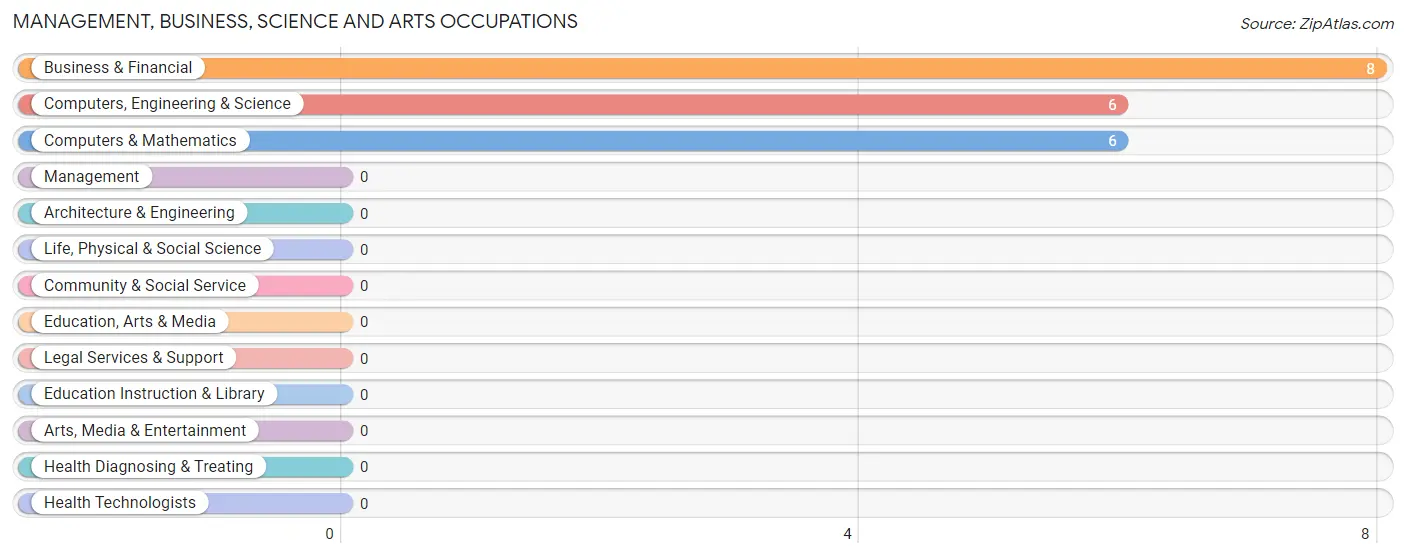
Management, Business, Science and Arts Occupations by Sex
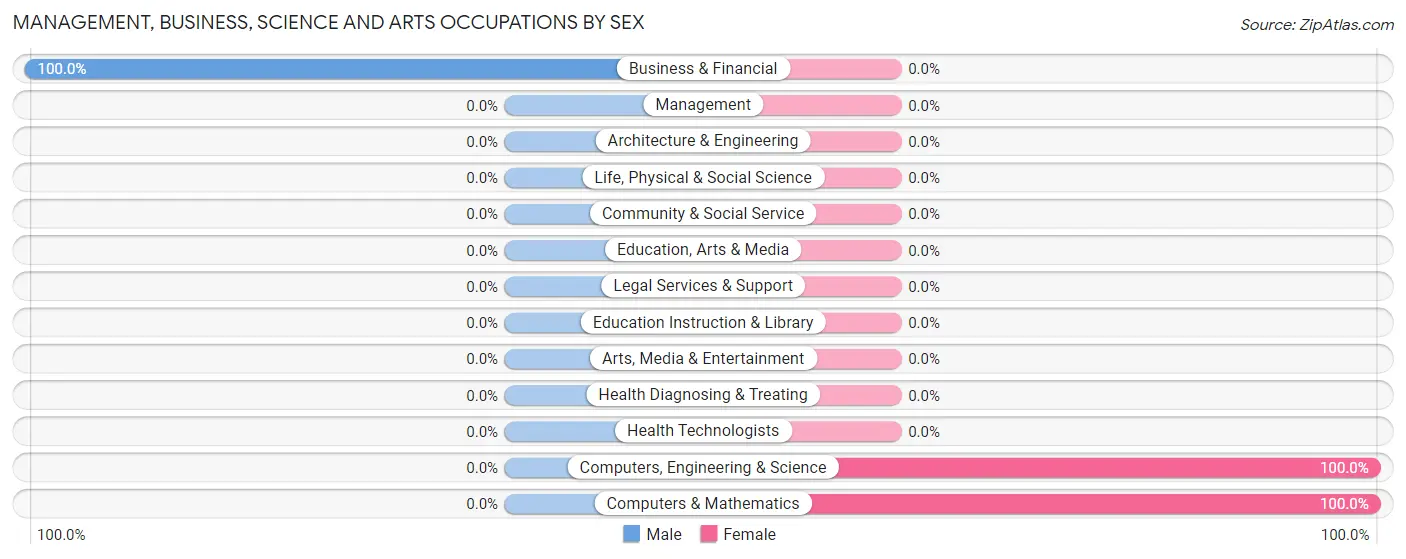
| Occupation | Male | Female |
| Management | 0 (0.0%) | 0 (0.0%) |
| Business & Financial | 8 (100.0%) | 0 (0.0%) |
| Computers, Engineering & Science | 0 (0.0%) | 6 (100.0%) |
| Computers & Mathematics | 0 (0.0%) | 6 (100.0%) |
| Architecture & Engineering | 0 (0.0%) | 0 (0.0%) |
| Life, Physical & Social Science | 0 (0.0%) | 0 (0.0%) |
| Community & Social Service | 0 (0.0%) | 0 (0.0%) |
| Education, Arts & Media | 0 (0.0%) | 0 (0.0%) |
| Legal Services & Support | 0 (0.0%) | 0 (0.0%) |
| Education Instruction & Library | 0 (0.0%) | 0 (0.0%) |
| Arts, Media & Entertainment | 0 (0.0%) | 0 (0.0%) |
| Health Diagnosing & Treating | 0 (0.0%) | 0 (0.0%) |
| Health Technologists | 0 (0.0%) | 0 (0.0%) |
| Total (Category) | 8 (57.1%) | 6 (42.9%) |
| Total (Overall) | 33 (49.2%) | 34 (50.7%) |
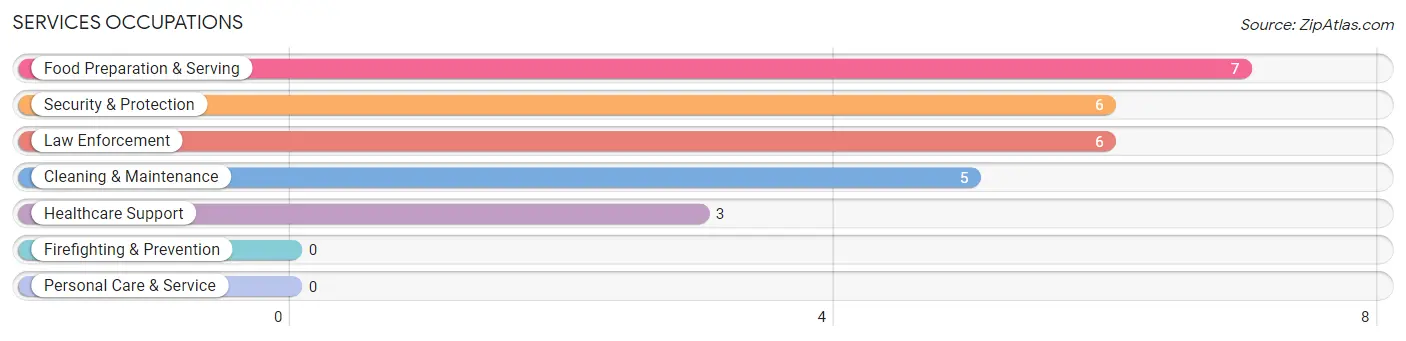
Services Occupations
The most common Services occupations in Dixie are Food Preparation & Serving (7 | 10.4%), Security & Protection (6 | 9.0%), Law Enforcement (6 | 9.0%), Cleaning & Maintenance (5 | 7.5%), and Healthcare Support (3 | 4.5%).
Services Occupations by Sex
Within the Services occupations in Dixie, the most male-oriented occupations are Security & Protection (100.0%), Law Enforcement (100.0%), and Cleaning & Maintenance (60.0%), while the most female-oriented occupations are Healthcare Support (100.0%), Food Preparation & Serving (100.0%), and Cleaning & Maintenance (40.0%).
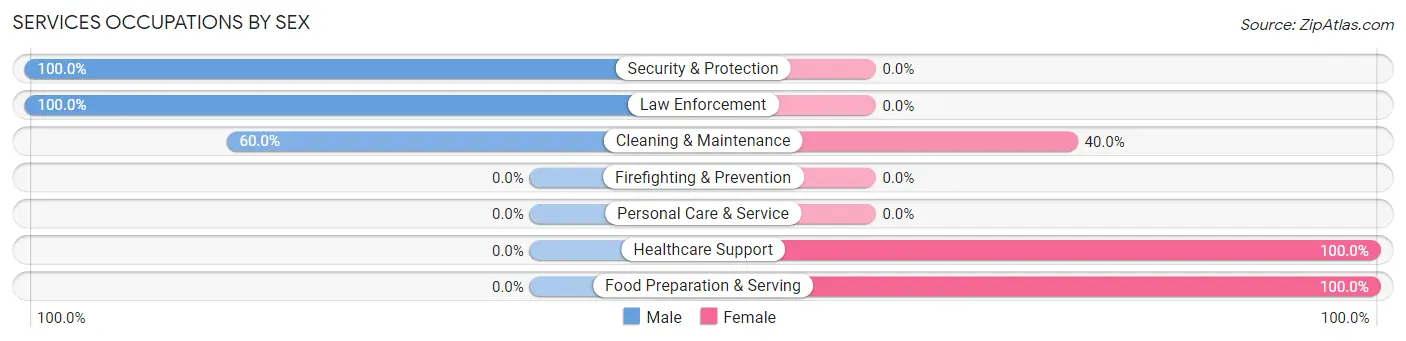
| Occupation | Male | Female |
| Healthcare Support | 0 (0.0%) | 3 (100.0%) |
| Security & Protection | 6 (100.0%) | 0 (0.0%) |
| Firefighting & Prevention | 0 (0.0%) | 0 (0.0%) |
| Law Enforcement | 6 (100.0%) | 0 (0.0%) |
| Food Preparation & Serving | 0 (0.0%) | 7 (100.0%) |
| Cleaning & Maintenance | 3 (60.0%) | 2 (40.0%) |
| Personal Care & Service | 0 (0.0%) | 0 (0.0%) |
| Total (Category) | 9 (42.9%) | 12 (57.1%) |
| Total (Overall) | 33 (49.2%) | 34 (50.7%) |
Sales and Office Occupations
The most common Sales and Office occupations in Dixie are Office & Administration (5 | 7.5%), and Sales & Related (4 | 6.0%).
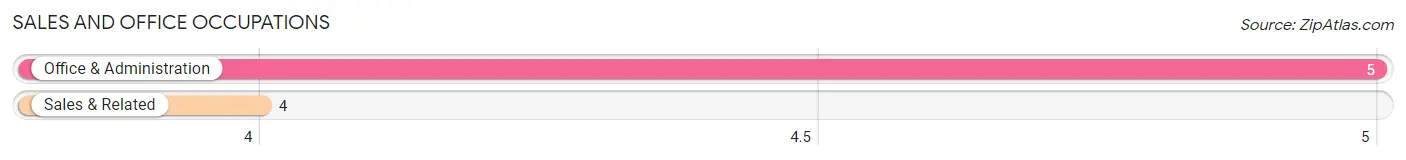
Sales and Office Occupations by Sex
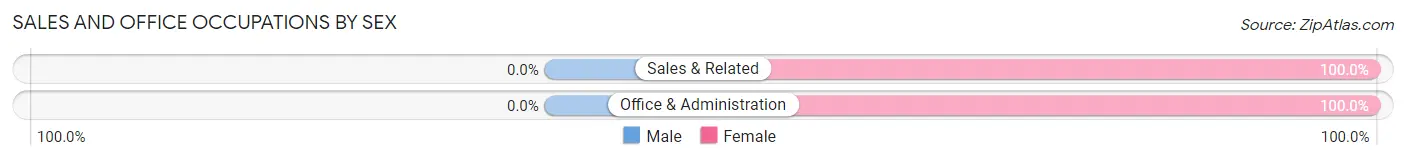
| Occupation | Male | Female |
| Sales & Related | 0 (0.0%) | 4 (100.0%) |
| Office & Administration | 0 (0.0%) | 5 (100.0%) |
| Total (Category) | 0 (0.0%) | 9 (100.0%) |
| Total (Overall) | 33 (49.2%) | 34 (50.7%) |
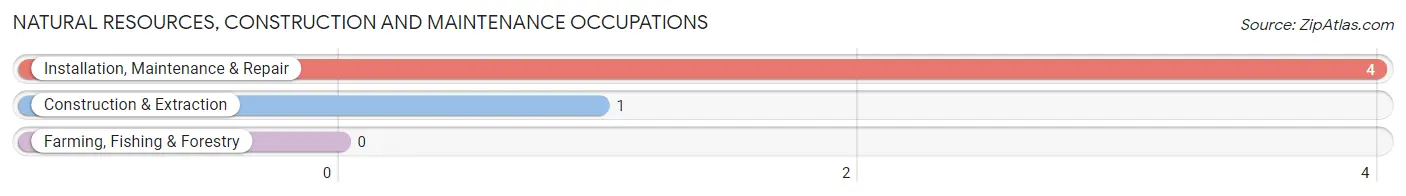
Natural Resources, Construction and Maintenance Occupations
The most common Natural Resources, Construction and Maintenance occupations in Dixie are Installation, Maintenance & Repair (4 | 6.0%), and Construction & Extraction (1 | 1.5%).
Natural Resources, Construction and Maintenance Occupations by Sex
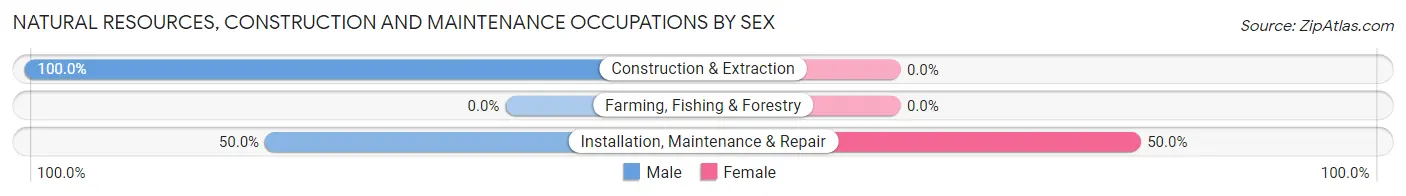
| Occupation | Male | Female |
| Farming, Fishing & Forestry | 0 (0.0%) | 0 (0.0%) |
| Construction & Extraction | 1 (100.0%) | 0 (0.0%) |
| Installation, Maintenance & Repair | 2 (50.0%) | 2 (50.0%) |
| Total (Category) | 3 (60.0%) | 2 (40.0%) |
| Total (Overall) | 33 (49.2%) | 34 (50.7%) |
Production, Transportation and Moving Occupations
The most common Production, Transportation and Moving occupations in Dixie are Production (11 | 16.4%), Material Moving (4 | 6.0%), and Transportation (3 | 4.5%).
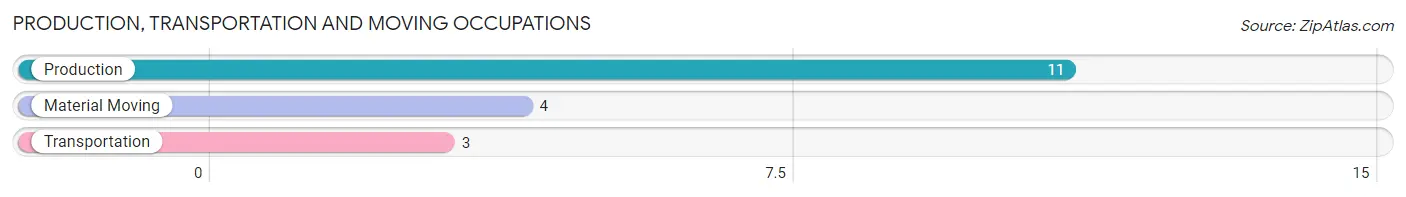
Production, Transportation and Moving Occupations by Sex
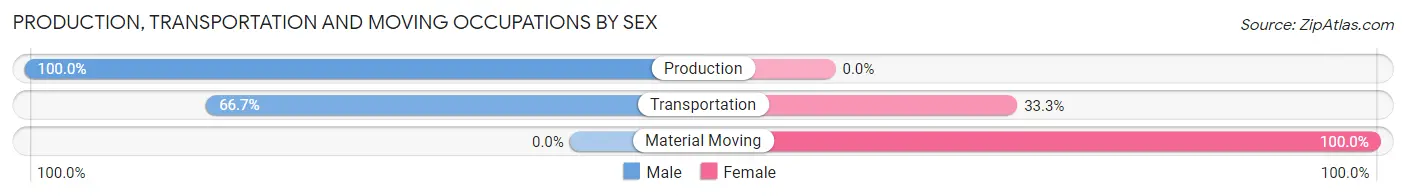
| Occupation | Male | Female |
| Production | 11 (100.0%) | 0 (0.0%) |
| Transportation | 2 (66.7%) | 1 (33.3%) |
| Material Moving | 0 (0.0%) | 4 (100.0%) |
| Total (Category) | 13 (72.2%) | 5 (27.8%) |
| Total (Overall) | 33 (49.2%) | 34 (50.7%) |
Employment Industries by Sex in Dixie
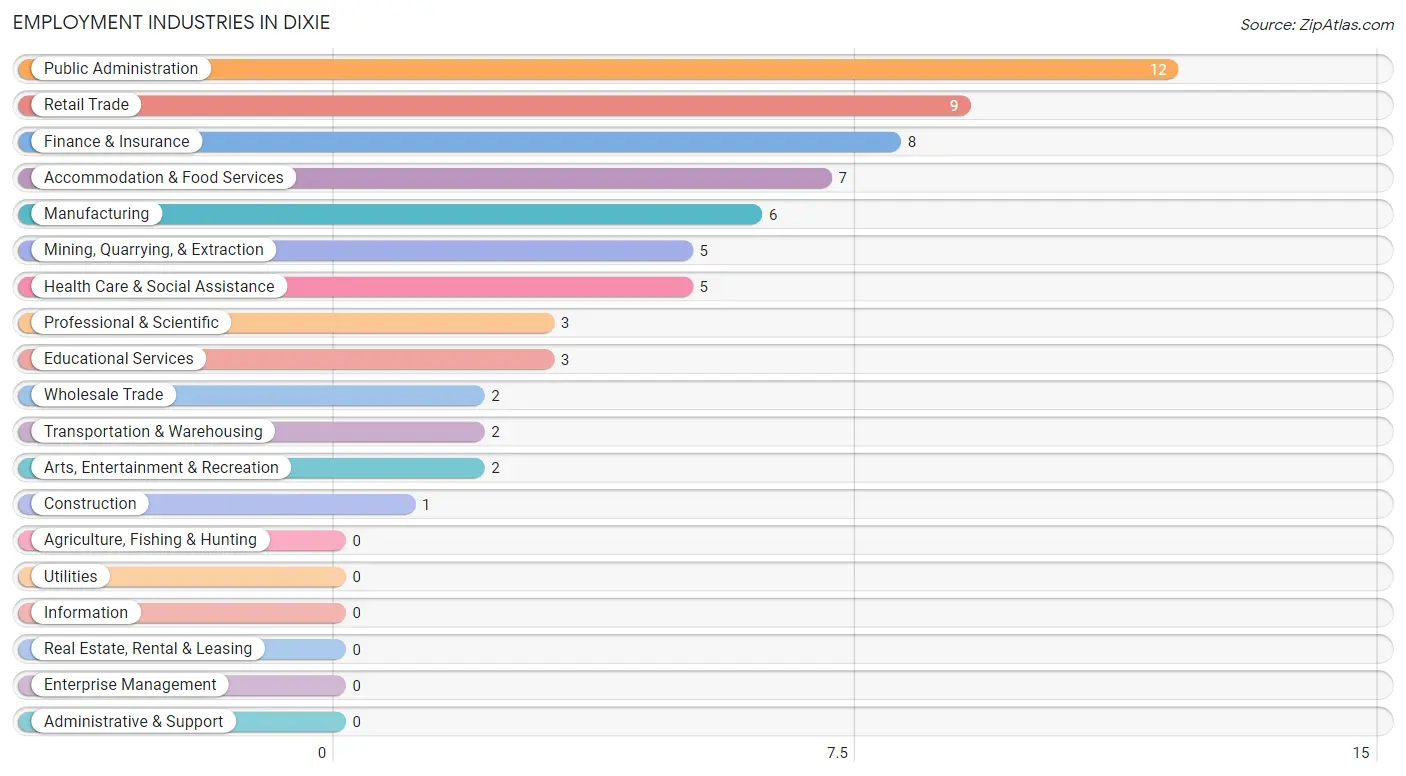
Employment Industries in Dixie
The major employment industries in Dixie include Public Administration (12 | 17.9%), Retail Trade (9 | 13.4%), Finance & Insurance (8 | 11.9%), Accommodation & Food Services (7 | 10.4%), and Manufacturing (6 | 9.0%).
Employment Industries by Sex in Dixie
The Dixie industries that see more men than women are Mining, Quarrying, & Extraction (100.0%), Construction (100.0%), and Finance & Insurance (100.0%), whereas the industries that tend to have a higher number of women are Wholesale Trade (100.0%), Professional & Scientific (100.0%), and Health Care & Social Assistance (100.0%).
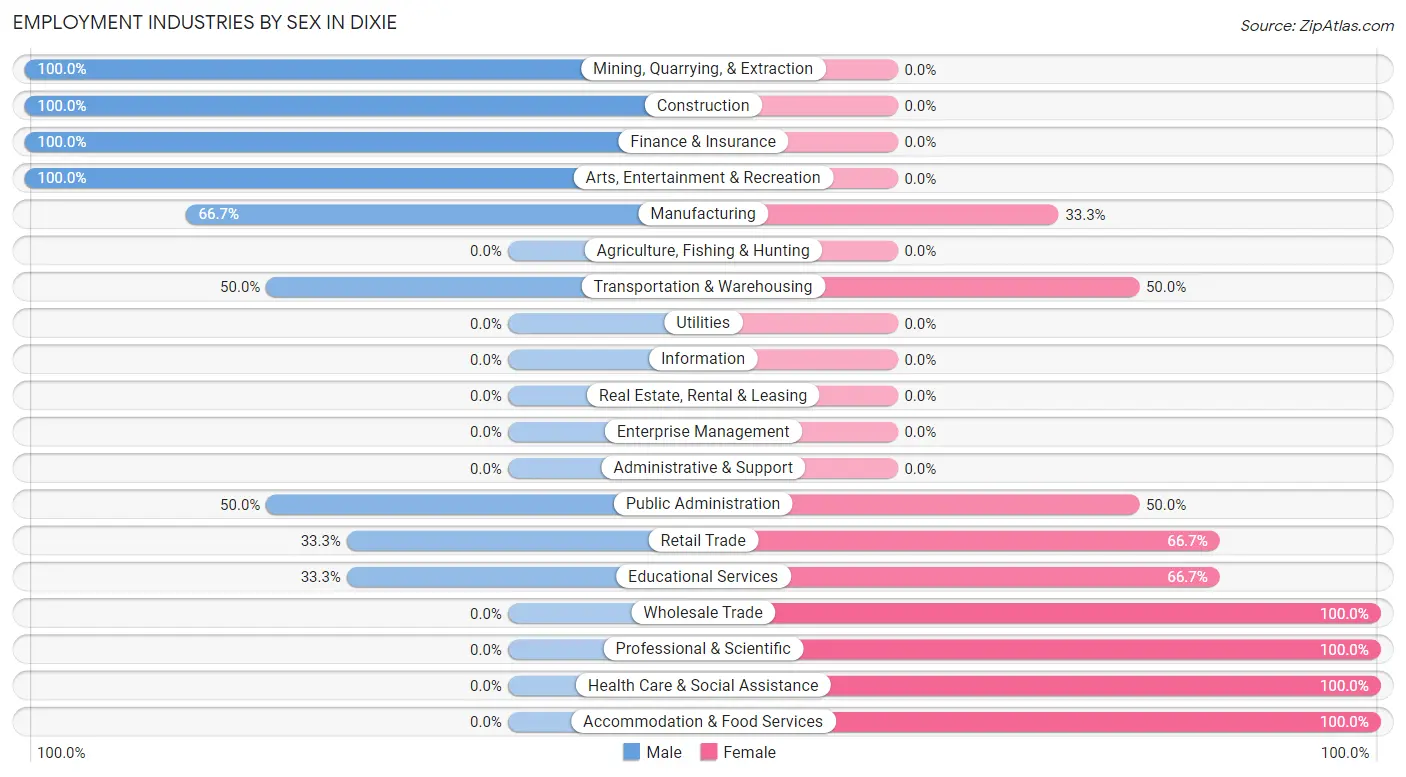
| Industry | Male | Female |
| Agriculture, Fishing & Hunting | 0 (0.0%) | 0 (0.0%) |
| Mining, Quarrying, & Extraction | 5 (100.0%) | 0 (0.0%) |
| Construction | 1 (100.0%) | 0 (0.0%) |
| Manufacturing | 4 (66.7%) | 2 (33.3%) |
| Wholesale Trade | 0 (0.0%) | 2 (100.0%) |
| Retail Trade | 3 (33.3%) | 6 (66.7%) |
| Transportation & Warehousing | 1 (50.0%) | 1 (50.0%) |
| Utilities | 0 (0.0%) | 0 (0.0%) |
| Information | 0 (0.0%) | 0 (0.0%) |
| Finance & Insurance | 8 (100.0%) | 0 (0.0%) |
| Real Estate, Rental & Leasing | 0 (0.0%) | 0 (0.0%) |
| Professional & Scientific | 0 (0.0%) | 3 (100.0%) |
| Enterprise Management | 0 (0.0%) | 0 (0.0%) |
| Administrative & Support | 0 (0.0%) | 0 (0.0%) |
| Educational Services | 1 (33.3%) | 2 (66.7%) |
| Health Care & Social Assistance | 0 (0.0%) | 5 (100.0%) |
| Arts, Entertainment & Recreation | 2 (100.0%) | 0 (0.0%) |
| Accommodation & Food Services | 0 (0.0%) | 7 (100.0%) |
| Public Administration | 6 (50.0%) | 6 (50.0%) |
| Total | 33 (49.2%) | 34 (50.7%) |
Education in Dixie
School Enrollment in Dixie
The most common levels of schooling among the 35 students in Dixie are high school (16 | 45.7%), elementary school (11 | 31.4%), and middle school (4 | 11.4%).
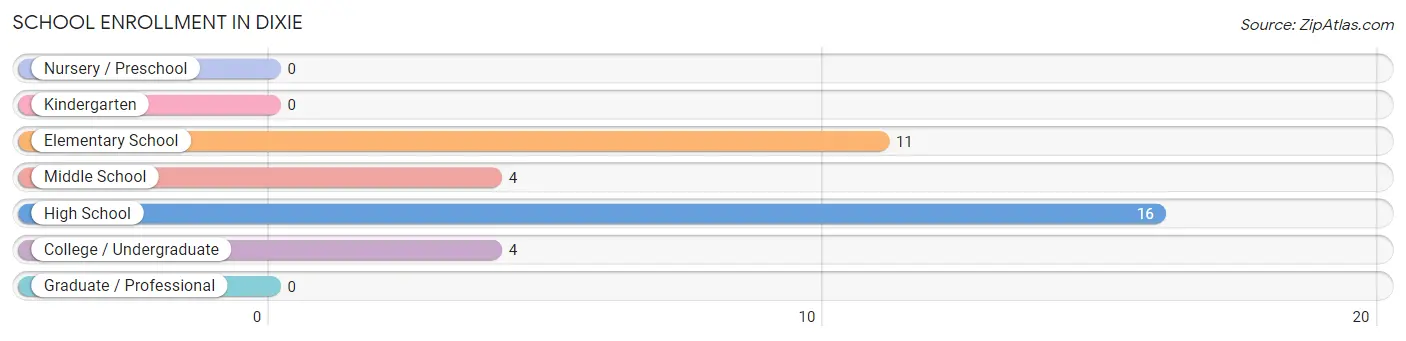
| School Level | # Students | % Students |
| Nursery / Preschool | 0 | 0.0% |
| Kindergarten | 0 | 0.0% |
| Elementary School | 11 | 31.4% |
| Middle School | 4 | 11.4% |
| High School | 16 | 45.7% |
| College / Undergraduate | 4 | 11.4% |
| Graduate / Professional | 0 | 0.0% |
| Total | 35 | 100.0% |
School Enrollment by Age by Funding Source in Dixie
Out of a total of 35 students who are enrolled in schools in Dixie, 3 (8.6%) attend a private institution, while the remaining 32 (91.4%) are enrolled in public schools. The age group of 15 to 17 year olds has the highest likelihood of being enrolled in private schools, with 3 (25.0% in the age bracket) enrolled. Conversely, the age group of 5 to 9 year old has the lowest likelihood of being enrolled in a private school, with 11 (100.0% in the age bracket) attending a public institution.
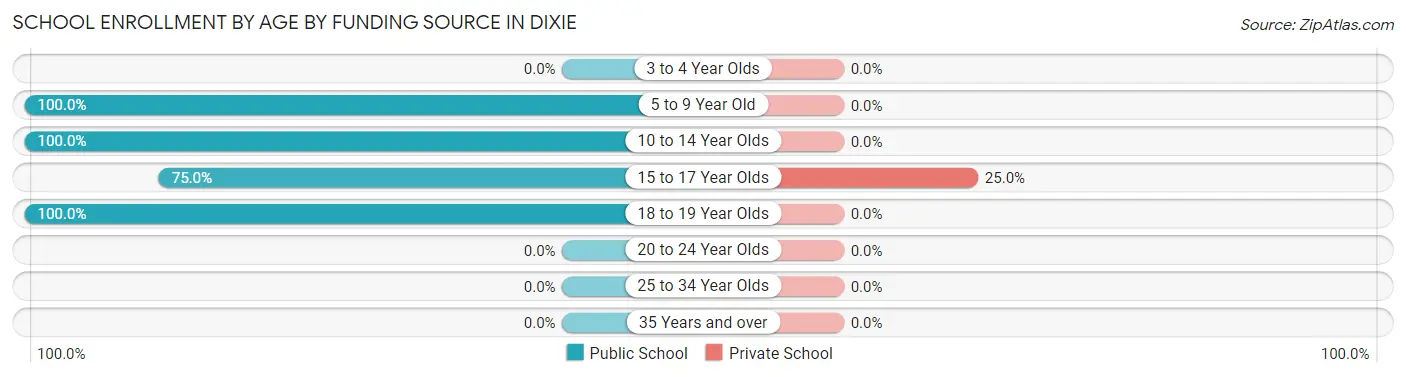
| Age Bracket | Public School | Private School |
| 3 to 4 Year Olds | 0 (0.0%) | 0 (0.0%) |
| 5 to 9 Year Old | 11 (100.0%) | 0 (0.0%) |
| 10 to 14 Year Olds | 4 (100.0%) | 0 (0.0%) |
| 15 to 17 Year Olds | 9 (75.0%) | 3 (25.0%) |
| 18 to 19 Year Olds | 8 (100.0%) | 0 (0.0%) |
| 20 to 24 Year Olds | 0 (0.0%) | 0 (0.0%) |
| 25 to 34 Year Olds | 0 (0.0%) | 0 (0.0%) |
| 35 Years and over | 0 (0.0%) | 0 (0.0%) |
| Total | 32 (91.4%) | 3 (8.6%) |
Educational Attainment by Field of Study in Dixie
Liberal arts & history (8 | 61.5%), bio, nature & agricultural (2 | 15.4%), education (2 | 15.4%), and visual & performing arts (1 | 7.7%) are the most common fields of study among 13 individuals in Dixie who have obtained a bachelor's degree or higher.
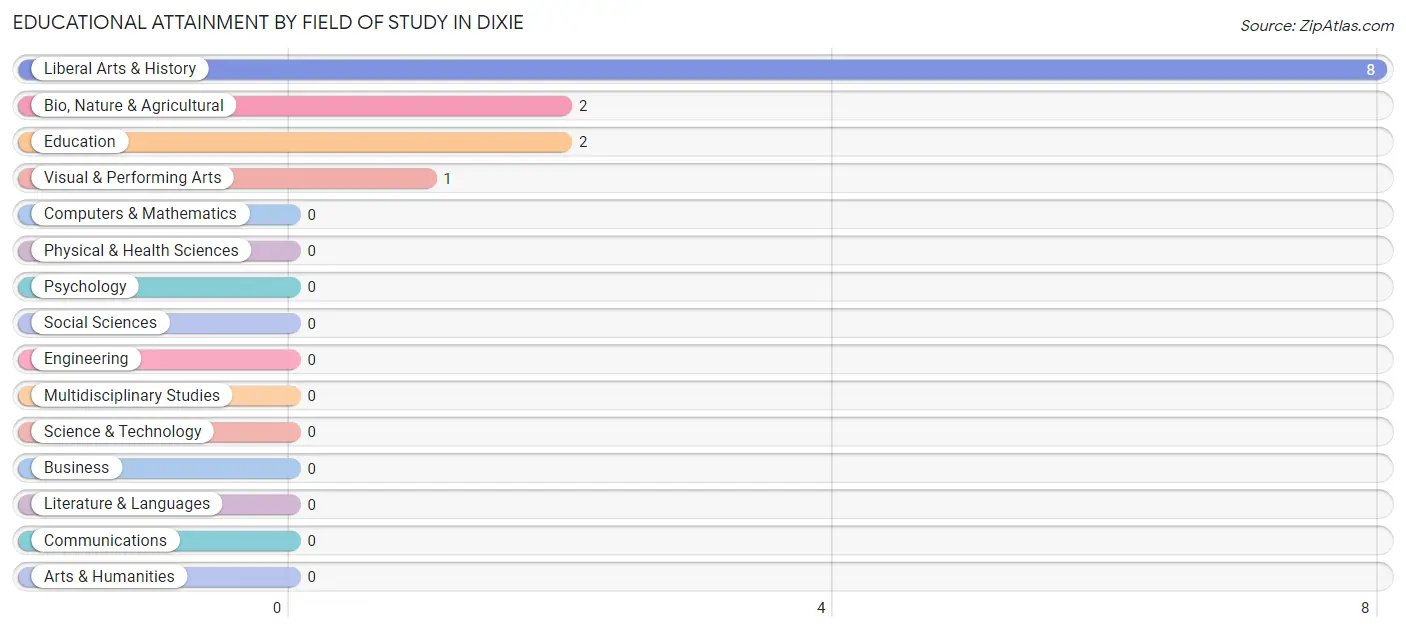
| Field of Study | # Graduates | % Graduates |
| Computers & Mathematics | 0 | 0.0% |
| Bio, Nature & Agricultural | 2 | 15.4% |
| Physical & Health Sciences | 0 | 0.0% |
| Psychology | 0 | 0.0% |
| Social Sciences | 0 | 0.0% |
| Engineering | 0 | 0.0% |
| Multidisciplinary Studies | 0 | 0.0% |
| Science & Technology | 0 | 0.0% |
| Business | 0 | 0.0% |
| Education | 2 | 15.4% |
| Literature & Languages | 0 | 0.0% |
| Liberal Arts & History | 8 | 61.5% |
| Visual & Performing Arts | 1 | 7.7% |
| Communications | 0 | 0.0% |
| Arts & Humanities | 0 | 0.0% |
| Total | 13 | 100.0% |
Transportation & Commute in Dixie
Vehicle Availability by Sex in Dixie
The most prevalent vehicle ownership categories in Dixie are males with 3 vehicles (10, accounting for 30.3%) and females with 3 vehicles (14, making up 29.4%).
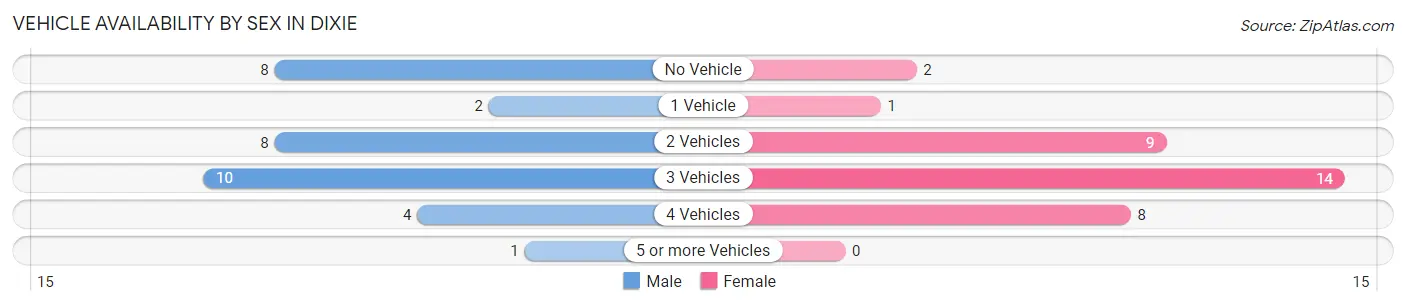
| Vehicles Available | Male | Female |
| No Vehicle | 8 (24.2%) | 2 (5.9%) |
| 1 Vehicle | 2 (6.1%) | 1 (2.9%) |
| 2 Vehicles | 8 (24.2%) | 9 (26.5%) |
| 3 Vehicles | 10 (30.3%) | 14 (41.2%) |
| 4 Vehicles | 4 (12.1%) | 8 (23.5%) |
| 5 or more Vehicles | 1 (3.0%) | 0 (0.0%) |
| Total | 33 (100.0%) | 34 (100.0%) |
Commute Time in Dixie
The most frequently occuring commute durations in Dixie are 20 to 24 minutes (22 commuters, 33.9%), 30 to 34 minutes (14 commuters, 21.5%), and 10 to 14 minutes (7 commuters, 10.8%).
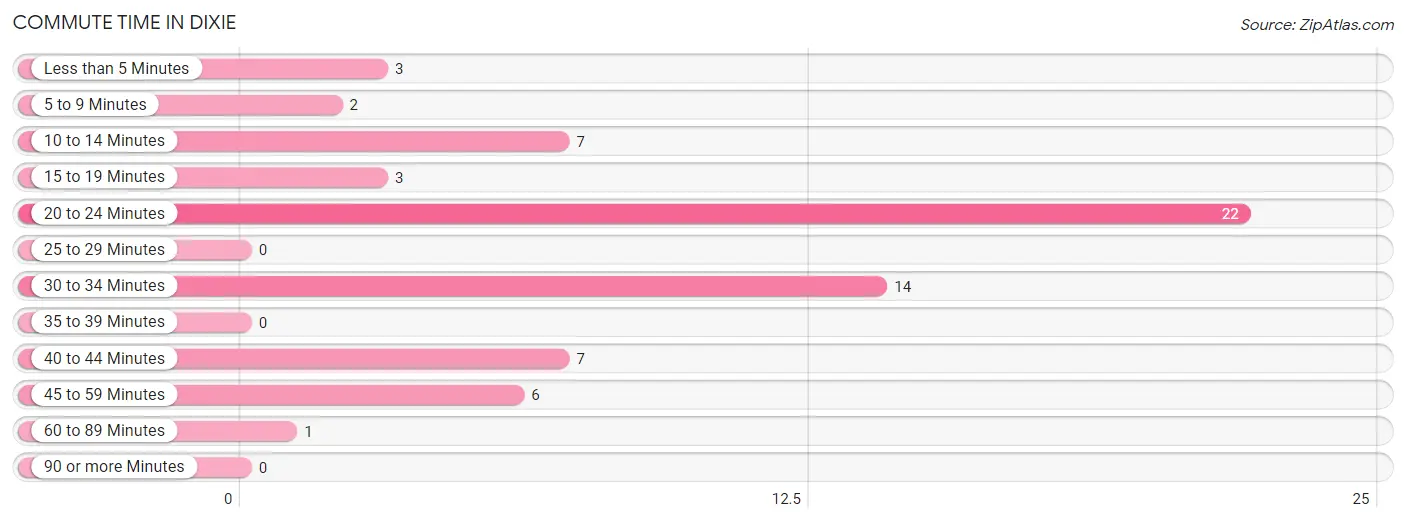
| Commute Time | # Commuters | % Commuters |
| Less than 5 Minutes | 3 | 4.6% |
| 5 to 9 Minutes | 2 | 3.1% |
| 10 to 14 Minutes | 7 | 10.8% |
| 15 to 19 Minutes | 3 | 4.6% |
| 20 to 24 Minutes | 22 | 33.9% |
| 25 to 29 Minutes | 0 | 0.0% |
| 30 to 34 Minutes | 14 | 21.5% |
| 35 to 39 Minutes | 0 | 0.0% |
| 40 to 44 Minutes | 7 | 10.8% |
| 45 to 59 Minutes | 6 | 9.2% |
| 60 to 89 Minutes | 1 | 1.5% |
| 90 or more Minutes | 0 | 0.0% |
Commute Time by Sex in Dixie
The most common commute times in Dixie are 30 to 34 minutes (14 commuters, 42.4%) for males and 20 to 24 minutes (13 commuters, 40.6%) for females.
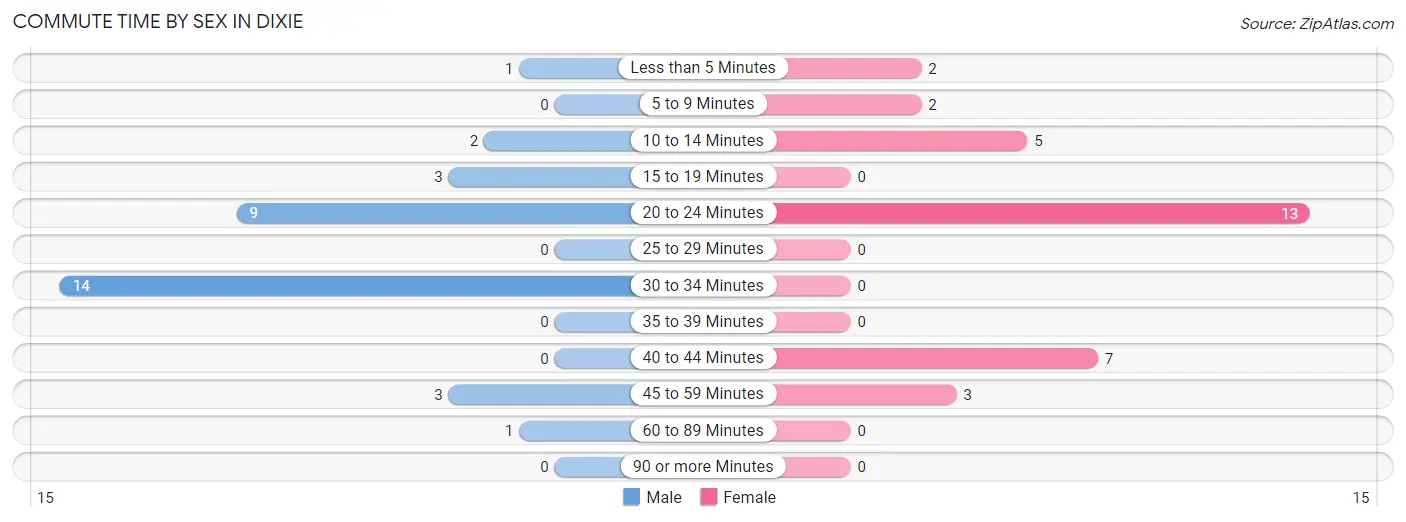
| Commute Time | Male | Female |
| Less than 5 Minutes | 1 (3.0%) | 2 (6.2%) |
| 5 to 9 Minutes | 0 (0.0%) | 2 (6.2%) |
| 10 to 14 Minutes | 2 (6.1%) | 5 (15.6%) |
| 15 to 19 Minutes | 3 (9.1%) | 0 (0.0%) |
| 20 to 24 Minutes | 9 (27.3%) | 13 (40.6%) |
| 25 to 29 Minutes | 0 (0.0%) | 0 (0.0%) |
| 30 to 34 Minutes | 14 (42.4%) | 0 (0.0%) |
| 35 to 39 Minutes | 0 (0.0%) | 0 (0.0%) |
| 40 to 44 Minutes | 0 (0.0%) | 7 (21.9%) |
| 45 to 59 Minutes | 3 (9.1%) | 3 (9.4%) |
| 60 to 89 Minutes | 1 (3.0%) | 0 (0.0%) |
| 90 or more Minutes | 0 (0.0%) | 0 (0.0%) |
Time of Departure to Work by Sex in Dixie
The most frequent times of departure to work in Dixie are 6:00 AM to 6:29 AM (11, 33.3%) for males and 6:00 AM to 6:29 AM (13, 40.6%) for females.
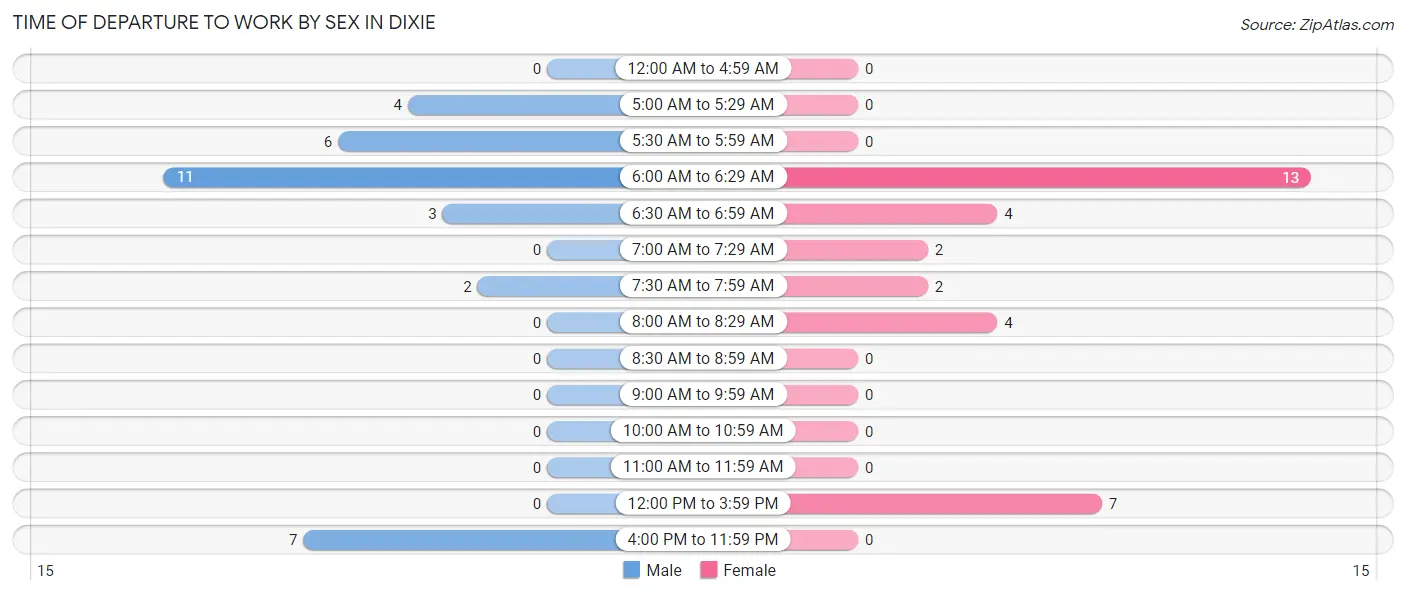
| Time of Departure | Male | Female |
| 12:00 AM to 4:59 AM | 0 (0.0%) | 0 (0.0%) |
| 5:00 AM to 5:29 AM | 4 (12.1%) | 0 (0.0%) |
| 5:30 AM to 5:59 AM | 6 (18.2%) | 0 (0.0%) |
| 6:00 AM to 6:29 AM | 11 (33.3%) | 13 (40.6%) |
| 6:30 AM to 6:59 AM | 3 (9.1%) | 4 (12.5%) |
| 7:00 AM to 7:29 AM | 0 (0.0%) | 2 (6.2%) |
| 7:30 AM to 7:59 AM | 2 (6.1%) | 2 (6.2%) |
| 8:00 AM to 8:29 AM | 0 (0.0%) | 4 (12.5%) |
| 8:30 AM to 8:59 AM | 0 (0.0%) | 0 (0.0%) |
| 9:00 AM to 9:59 AM | 0 (0.0%) | 0 (0.0%) |
| 10:00 AM to 10:59 AM | 0 (0.0%) | 0 (0.0%) |
| 11:00 AM to 11:59 AM | 0 (0.0%) | 0 (0.0%) |
| 12:00 PM to 3:59 PM | 0 (0.0%) | 7 (21.9%) |
| 4:00 PM to 11:59 PM | 7 (21.2%) | 0 (0.0%) |
| Total | 33 (100.0%) | 32 (100.0%) |
Housing Occupancy in Dixie
Occupancy by Ownership in Dixie
Of the total 65 dwellings in Dixie, owner-occupied units account for 53 (81.5%), while renter-occupied units make up 12 (18.5%).
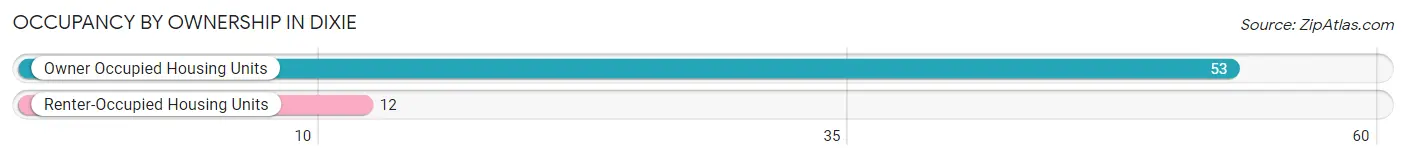
| Occupancy | # Housing Units | % Housing Units |
| Owner Occupied Housing Units | 53 | 81.5% |
| Renter-Occupied Housing Units | 12 | 18.5% |
| Total Occupied Housing Units | 65 | 100.0% |
Occupancy by Household Size in Dixie
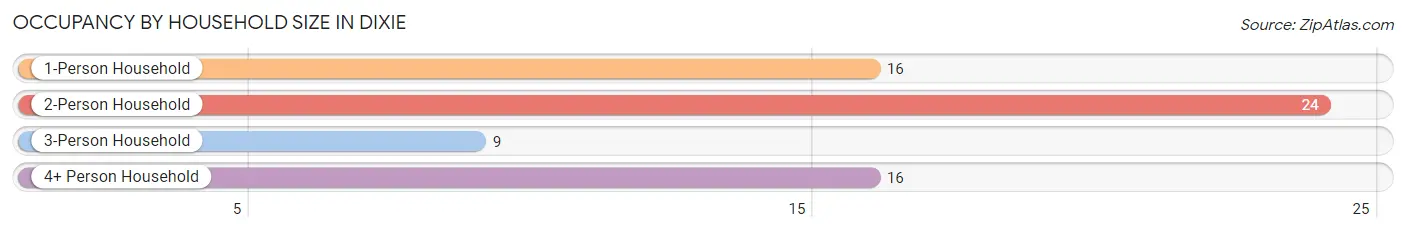
| Household Size | # Housing Units | % Housing Units |
| 1-Person Household | 16 | 24.6% |
| 2-Person Household | 24 | 36.9% |
| 3-Person Household | 9 | 13.9% |
| 4+ Person Household | 16 | 24.6% |
| Total Housing Units | 65 | 100.0% |
Occupancy by Ownership by Household Size in Dixie
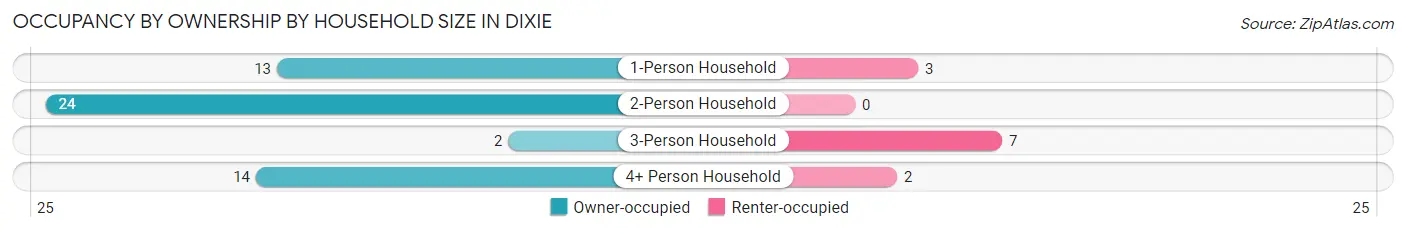
| Household Size | Owner-occupied | Renter-occupied |
| 1-Person Household | 13 (81.2%) | 3 (18.8%) |
| 2-Person Household | 24 (100.0%) | 0 (0.0%) |
| 3-Person Household | 2 (22.2%) | 7 (77.8%) |
| 4+ Person Household | 14 (87.5%) | 2 (12.5%) |
| Total Housing Units | 53 (81.5%) | 12 (18.5%) |
Occupancy by Educational Attainment in Dixie
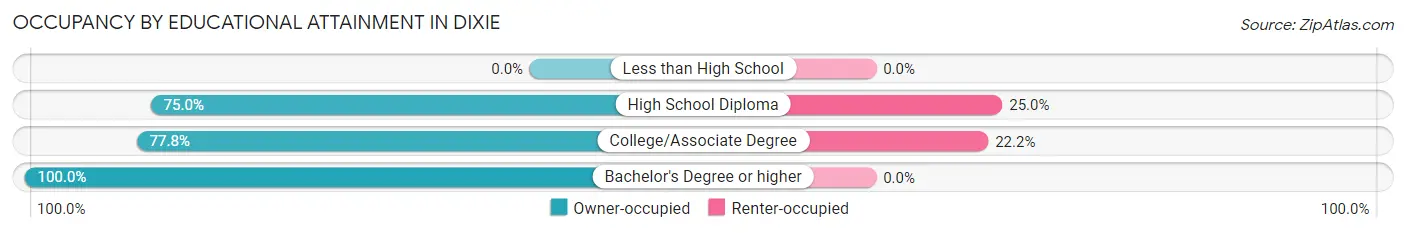
| Household Size | Owner-occupied | Renter-occupied |
| Less than High School | 0 (0.0%) | 0 (0.0%) |
| High School Diploma | 12 (75.0%) | 4 (25.0%) |
| College/Associate Degree | 28 (77.8%) | 8 (22.2%) |
| Bachelor's Degree or higher | 13 (100.0%) | 0 (0.0%) |
Occupancy by Age of Householder in Dixie
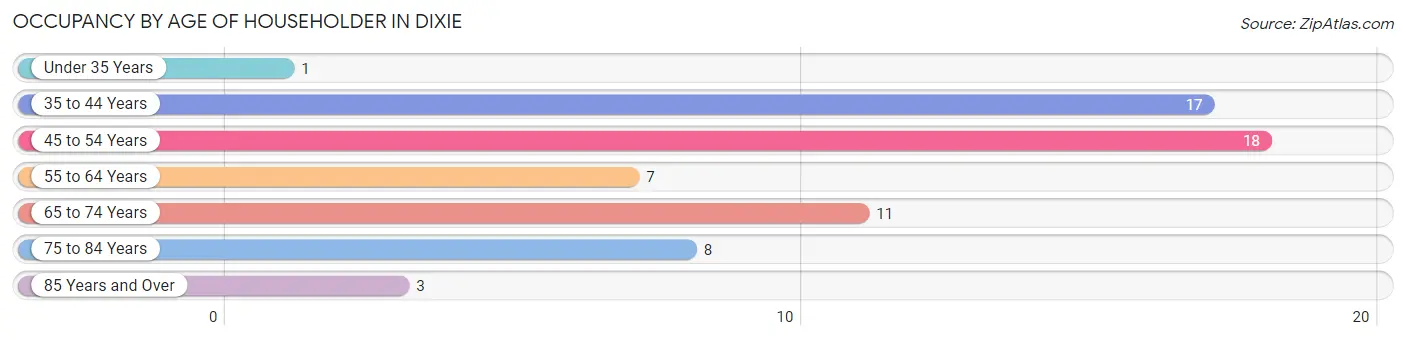
| Age Bracket | # Households | % Households |
| Under 35 Years | 1 | 1.5% |
| 35 to 44 Years | 17 | 26.2% |
| 45 to 54 Years | 18 | 27.7% |
| 55 to 64 Years | 7 | 10.8% |
| 65 to 74 Years | 11 | 16.9% |
| 75 to 84 Years | 8 | 12.3% |
| 85 Years and Over | 3 | 4.6% |
| Total | 65 | 100.0% |
Housing Finances in Dixie
Median Income by Occupancy in Dixie
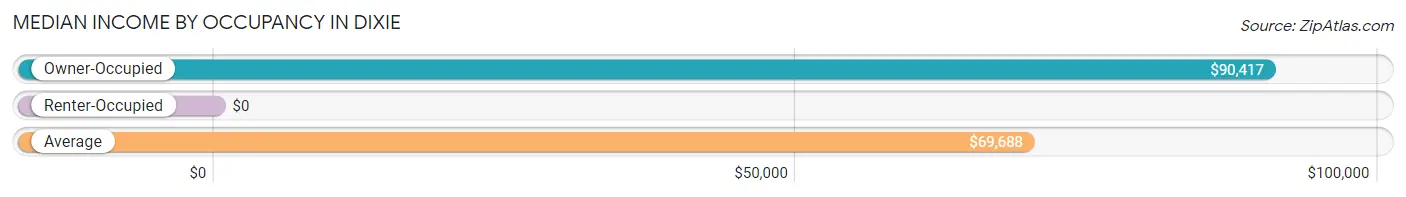
| Occupancy Type | # Households | Median Income |
| Owner-Occupied | 53 (81.5%) | $90,417 |
| Renter-Occupied | 12 (18.5%) | $0 |
| Average | 65 (100.0%) | $69,688 |
Occupancy by Householder Income Bracket in Dixie
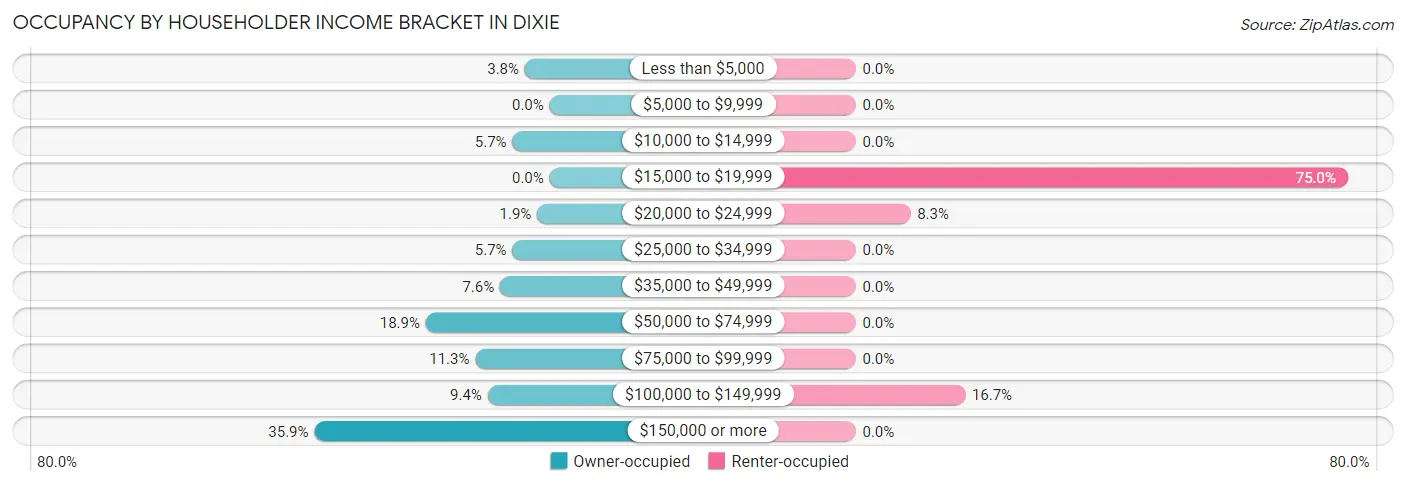
| Income Bracket | Owner-occupied | Renter-occupied |
| Less than $5,000 | 2 (3.8%) | 0 (0.0%) |
| $5,000 to $9,999 | 0 (0.0%) | 0 (0.0%) |
| $10,000 to $14,999 | 3 (5.7%) | 0 (0.0%) |
| $15,000 to $19,999 | 0 (0.0%) | 9 (75.0%) |
| $20,000 to $24,999 | 1 (1.9%) | 1 (8.3%) |
| $25,000 to $34,999 | 3 (5.7%) | 0 (0.0%) |
| $35,000 to $49,999 | 4 (7.5%) | 0 (0.0%) |
| $50,000 to $74,999 | 10 (18.9%) | 0 (0.0%) |
| $75,000 to $99,999 | 6 (11.3%) | 0 (0.0%) |
| $100,000 to $149,999 | 5 (9.4%) | 2 (16.7%) |
| $150,000 or more | 19 (35.8%) | 0 (0.0%) |
| Total | 53 (100.0%) | 12 (100.0%) |
Monthly Housing Cost Tiers in Dixie
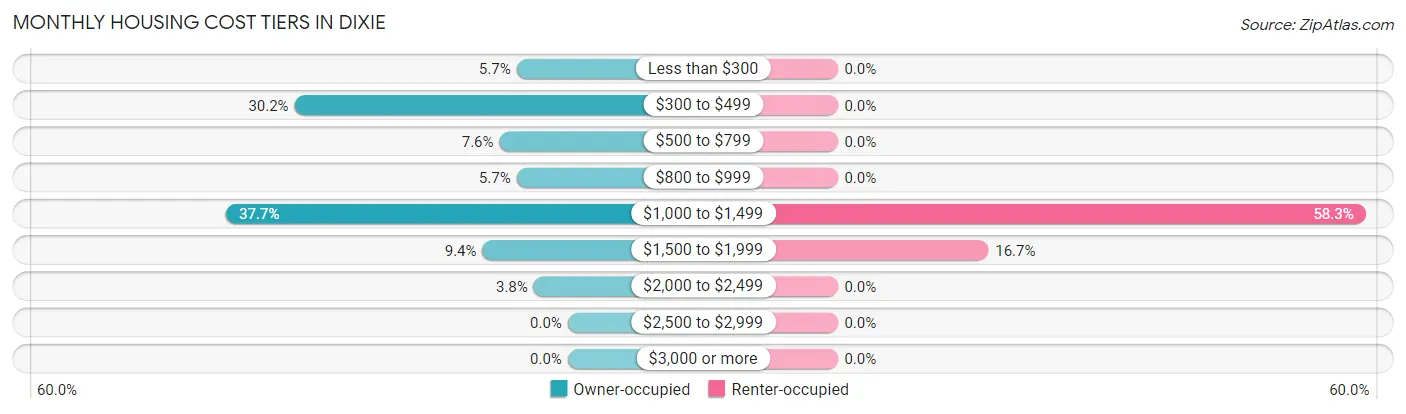
| Monthly Cost | Owner-occupied | Renter-occupied |
| Less than $300 | 3 (5.7%) | 0 (0.0%) |
| $300 to $499 | 16 (30.2%) | 0 (0.0%) |
| $500 to $799 | 4 (7.5%) | 0 (0.0%) |
| $800 to $999 | 3 (5.7%) | 0 (0.0%) |
| $1,000 to $1,499 | 20 (37.7%) | 7 (58.3%) |
| $1,500 to $1,999 | 5 (9.4%) | 2 (16.7%) |
| $2,000 to $2,499 | 2 (3.8%) | 0 (0.0%) |
| $2,500 to $2,999 | 0 (0.0%) | 0 (0.0%) |
| $3,000 or more | 0 (0.0%) | 0 (0.0%) |
| Total | 53 (100.0%) | 12 (100.0%) |
Physical Housing Characteristics in Dixie
Housing Structures in Dixie
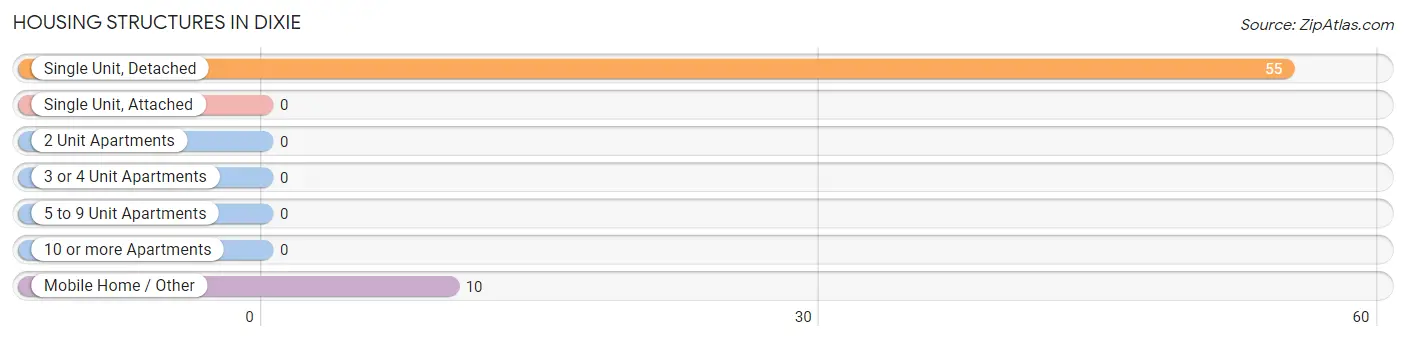
| Structure Type | # Housing Units | % Housing Units |
| Single Unit, Detached | 55 | 84.6% |
| Single Unit, Attached | 0 | 0.0% |
| 2 Unit Apartments | 0 | 0.0% |
| 3 or 4 Unit Apartments | 0 | 0.0% |
| 5 to 9 Unit Apartments | 0 | 0.0% |
| 10 or more Apartments | 0 | 0.0% |
| Mobile Home / Other | 10 | 15.4% |
| Total | 65 | 100.0% |
Housing Structures by Occupancy in Dixie
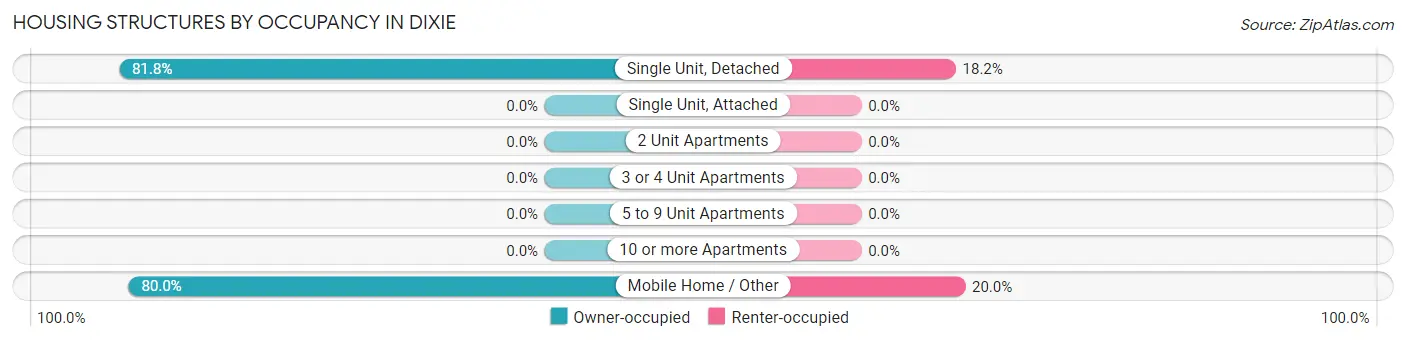
| Structure Type | Owner-occupied | Renter-occupied |
| Single Unit, Detached | 45 (81.8%) | 10 (18.2%) |
| Single Unit, Attached | 0 (0.0%) | 0 (0.0%) |
| 2 Unit Apartments | 0 (0.0%) | 0 (0.0%) |
| 3 or 4 Unit Apartments | 0 (0.0%) | 0 (0.0%) |
| 5 to 9 Unit Apartments | 0 (0.0%) | 0 (0.0%) |
| 10 or more Apartments | 0 (0.0%) | 0 (0.0%) |
| Mobile Home / Other | 8 (80.0%) | 2 (20.0%) |
| Total | 53 (81.5%) | 12 (18.5%) |
Housing Structures by Number of Rooms in Dixie
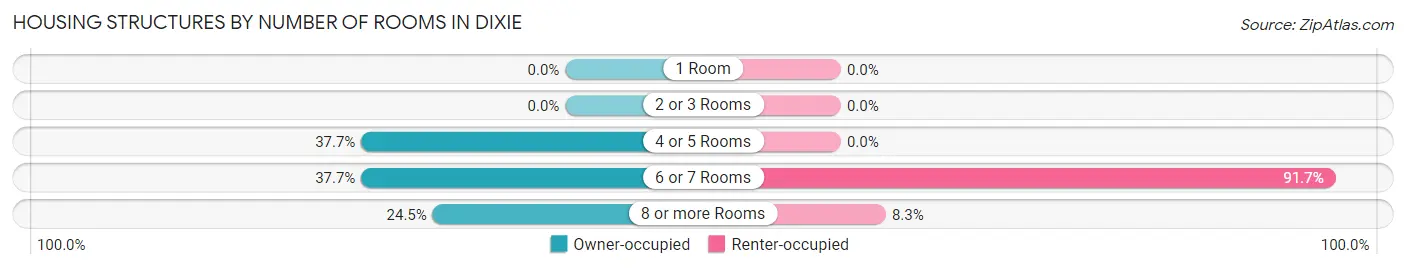
| Number of Rooms | Owner-occupied | Renter-occupied |
| 1 Room | 0 (0.0%) | 0 (0.0%) |
| 2 or 3 Rooms | 0 (0.0%) | 0 (0.0%) |
| 4 or 5 Rooms | 20 (37.7%) | 0 (0.0%) |
| 6 or 7 Rooms | 20 (37.7%) | 11 (91.7%) |
| 8 or more Rooms | 13 (24.5%) | 1 (8.3%) |
| Total | 53 (100.0%) | 12 (100.0%) |
Housing Structure by Heating Type in Dixie
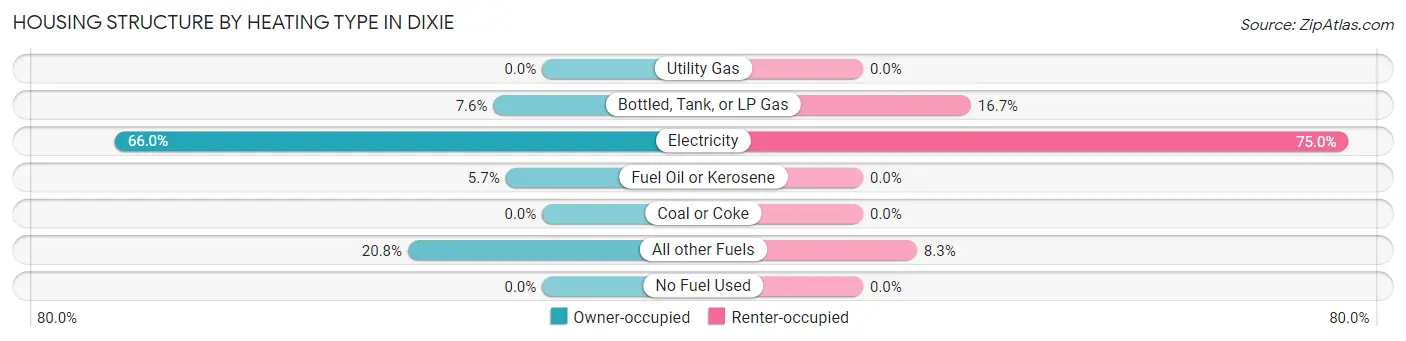
| Heating Type | Owner-occupied | Renter-occupied |
| Utility Gas | 0 (0.0%) | 0 (0.0%) |
| Bottled, Tank, or LP Gas | 4 (7.5%) | 2 (16.7%) |
| Electricity | 35 (66.0%) | 9 (75.0%) |
| Fuel Oil or Kerosene | 3 (5.7%) | 0 (0.0%) |
| Coal or Coke | 0 (0.0%) | 0 (0.0%) |
| All other Fuels | 11 (20.7%) | 1 (8.3%) |
| No Fuel Used | 0 (0.0%) | 0 (0.0%) |
| Total | 53 (100.0%) | 12 (100.0%) |
Household Vehicle Usage in Dixie
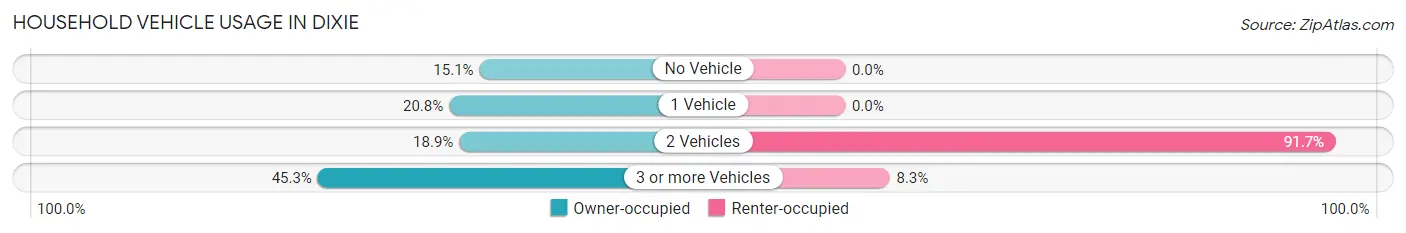
| Vehicles per Household | Owner-occupied | Renter-occupied |
| No Vehicle | 8 (15.1%) | 0 (0.0%) |
| 1 Vehicle | 11 (20.7%) | 0 (0.0%) |
| 2 Vehicles | 10 (18.9%) | 11 (91.7%) |
| 3 or more Vehicles | 24 (45.3%) | 1 (8.3%) |
| Total | 53 (100.0%) | 12 (100.0%) |
Real Estate & Mortgages in Dixie
Real Estate and Mortgage Overview in Dixie
| Characteristic | Without Mortgage | With Mortgage |
| Housing Units | 23 | 30 |
| Median Property Value | $235,000 | $335,300 |
| Median Household Income | - | - |
| Monthly Housing Costs | $446 | $0 |
| Real Estate Taxes | $2,286 | $3 |
Property Value by Mortgage Status in Dixie
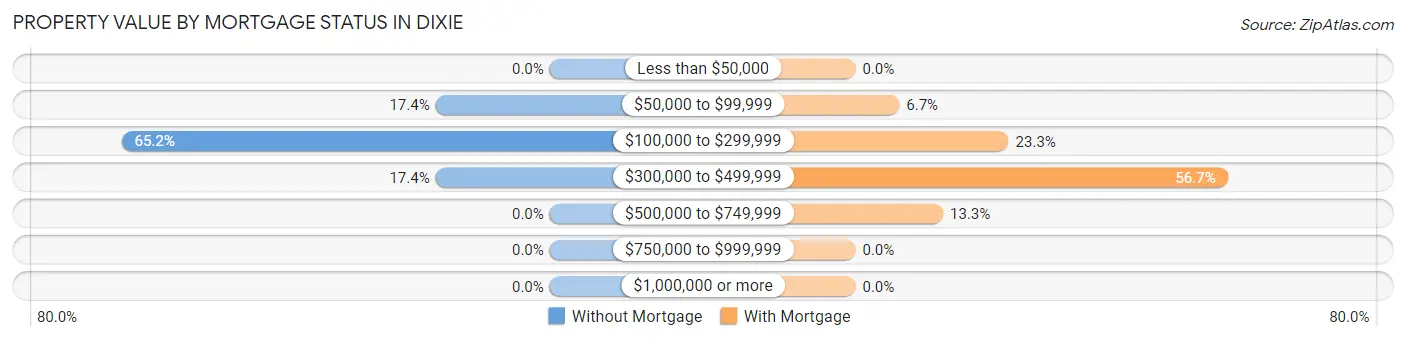
| Property Value | Without Mortgage | With Mortgage |
| Less than $50,000 | 0 (0.0%) | 0 (0.0%) |
| $50,000 to $99,999 | 4 (17.4%) | 2 (6.7%) |
| $100,000 to $299,999 | 15 (65.2%) | 7 (23.3%) |
| $300,000 to $499,999 | 4 (17.4%) | 17 (56.7%) |
| $500,000 to $749,999 | 0 (0.0%) | 4 (13.3%) |
| $750,000 to $999,999 | 0 (0.0%) | 0 (0.0%) |
| $1,000,000 or more | 0 (0.0%) | 0 (0.0%) |
| Total | 23 (100.0%) | 30 (100.0%) |
Household Income by Mortgage Status in Dixie
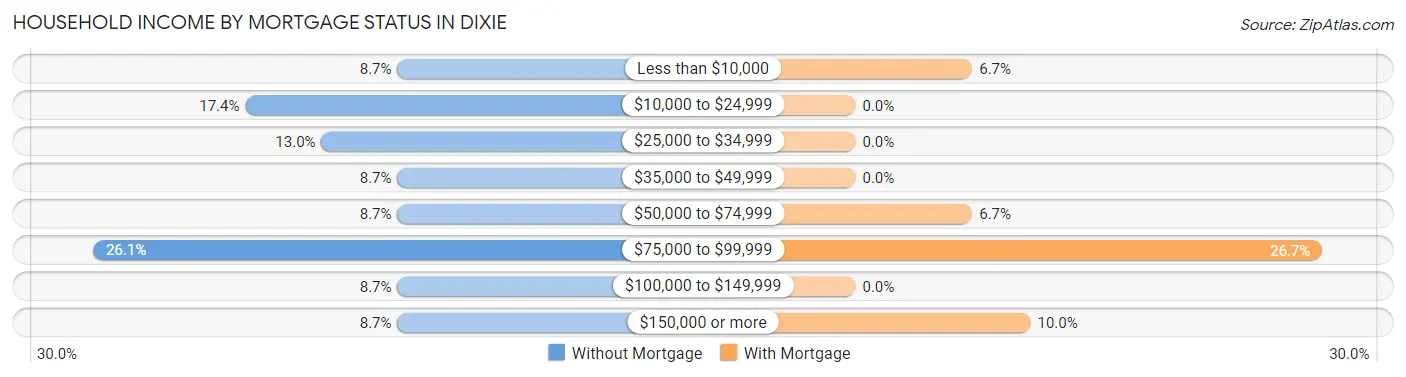
| Household Income | Without Mortgage | With Mortgage |
| Less than $10,000 | 2 (8.7%) | 2 (6.7%) |
| $10,000 to $24,999 | 4 (17.4%) | 0 (0.0%) |
| $25,000 to $34,999 | 3 (13.0%) | 0 (0.0%) |
| $35,000 to $49,999 | 2 (8.7%) | 0 (0.0%) |
| $50,000 to $74,999 | 2 (8.7%) | 2 (6.7%) |
| $75,000 to $99,999 | 6 (26.1%) | 8 (26.7%) |
| $100,000 to $149,999 | 2 (8.7%) | 0 (0.0%) |
| $150,000 or more | 2 (8.7%) | 3 (10.0%) |
| Total | 23 (100.0%) | 30 (100.0%) |
Property Value to Household Income Ratio in Dixie
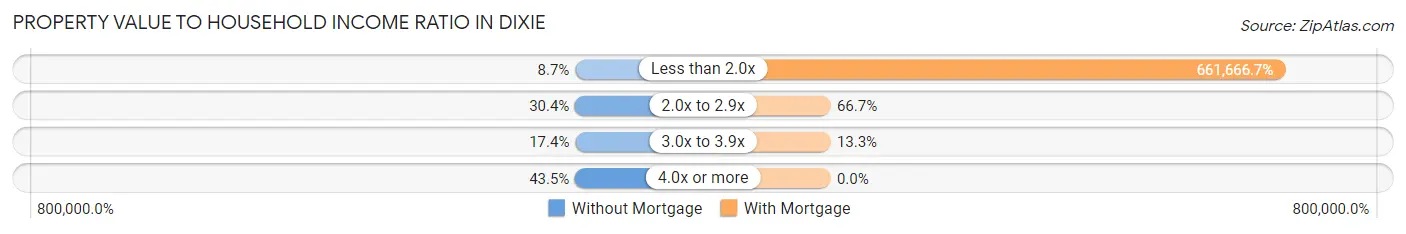
| Value-to-Income Ratio | Without Mortgage | With Mortgage |
| Less than 2.0x | 2 (8.7%) | 198,500 (661,666.7%) |
| 2.0x to 2.9x | 7 (30.4%) | 20 (66.7%) |
| 3.0x to 3.9x | 4 (17.4%) | 4 (13.3%) |
| 4.0x or more | 10 (43.5%) | 0 (0.0%) |
| Total | 23 (100.0%) | 30 (100.0%) |
Real Estate Taxes by Mortgage Status in Dixie
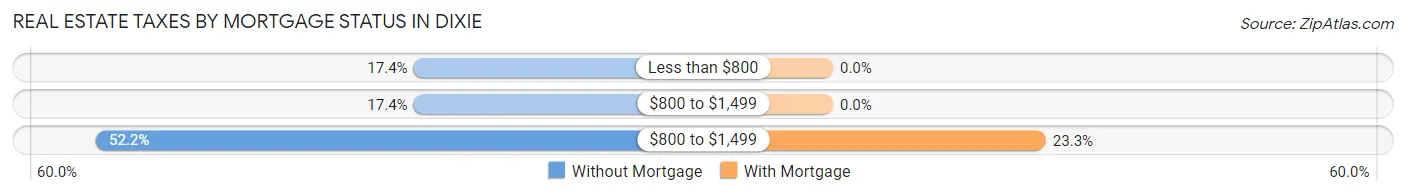
| Property Taxes | Without Mortgage | With Mortgage |
| Less than $800 | 4 (17.4%) | 0 (0.0%) |
| $800 to $1,499 | 4 (17.4%) | 0 (0.0%) |
| $800 to $1,499 | 12 (52.2%) | 7 (23.3%) |
| Total | 23 (100.0%) | 30 (100.0%) |
Health & Disability in Dixie
Health Insurance Coverage by Age in Dixie
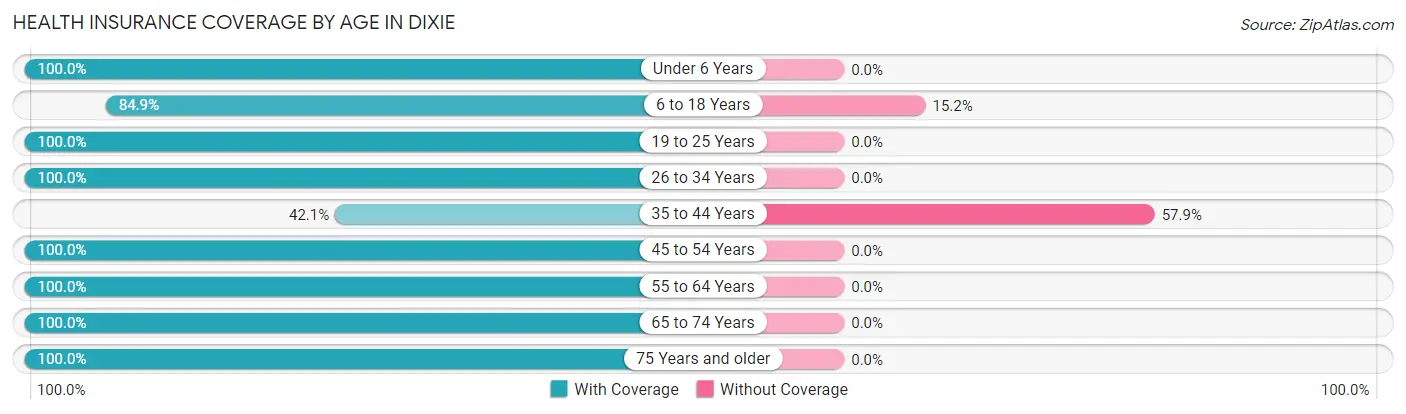
| Age Bracket | With Coverage | Without Coverage |
| Under 6 Years | 2 (100.0%) | 0 (0.0%) |
| 6 to 18 Years | 28 (84.9%) | 5 (15.1%) |
| 19 to 25 Years | 17 (100.0%) | 0 (0.0%) |
| 26 to 34 Years | 5 (100.0%) | 0 (0.0%) |
| 35 to 44 Years | 8 (42.1%) | 11 (57.9%) |
| 45 to 54 Years | 34 (100.0%) | 0 (0.0%) |
| 55 to 64 Years | 13 (100.0%) | 0 (0.0%) |
| 65 to 74 Years | 18 (100.0%) | 0 (0.0%) |
| 75 Years and older | 15 (100.0%) | 0 (0.0%) |
| Total | 140 (89.7%) | 16 (10.3%) |
Health Insurance Coverage by Citizenship Status in Dixie
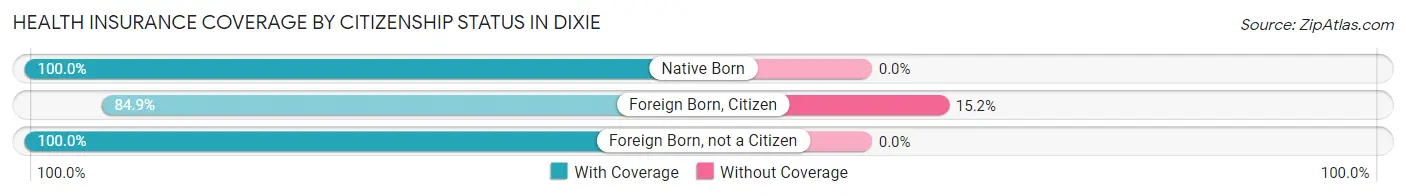
| Citizenship Status | With Coverage | Without Coverage |
| Native Born | 2 (100.0%) | 0 (0.0%) |
| Foreign Born, Citizen | 28 (84.9%) | 5 (15.1%) |
| Foreign Born, not a Citizen | 17 (100.0%) | 0 (0.0%) |
Health Insurance Coverage by Household Income in Dixie
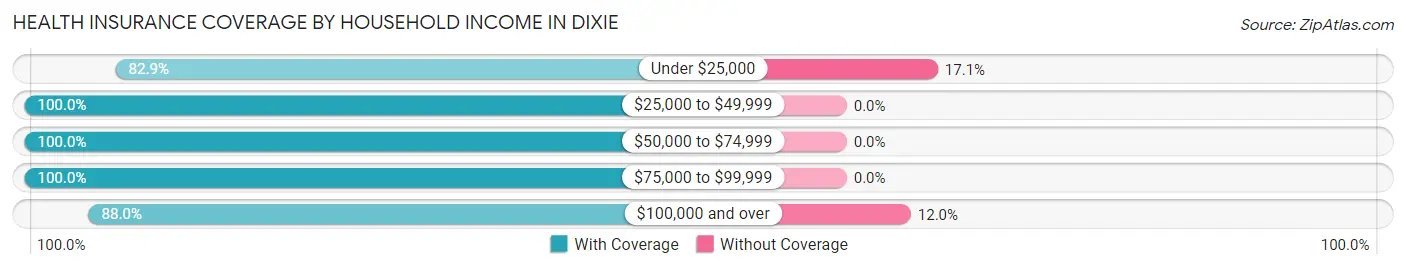
| Household Income | With Coverage | Without Coverage |
| Under $25,000 | 34 (82.9%) | 7 (17.1%) |
| $25,000 to $49,999 | 13 (100.0%) | 0 (0.0%) |
| $50,000 to $74,999 | 12 (100.0%) | 0 (0.0%) |
| $75,000 to $99,999 | 15 (100.0%) | 0 (0.0%) |
| $100,000 and over | 66 (88.0%) | 9 (12.0%) |
Public vs Private Health Insurance Coverage by Age in Dixie
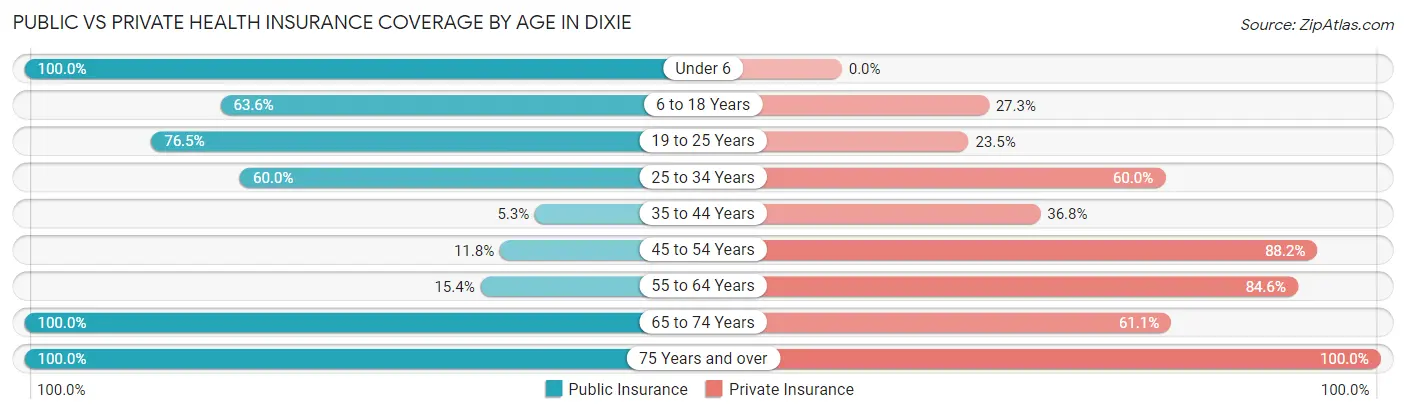
| Age Bracket | Public Insurance | Private Insurance |
| Under 6 | 2 (100.0%) | 0 (0.0%) |
| 6 to 18 Years | 21 (63.6%) | 9 (27.3%) |
| 19 to 25 Years | 13 (76.5%) | 4 (23.5%) |
| 25 to 34 Years | 3 (60.0%) | 3 (60.0%) |
| 35 to 44 Years | 1 (5.3%) | 7 (36.8%) |
| 45 to 54 Years | 4 (11.8%) | 30 (88.2%) |
| 55 to 64 Years | 2 (15.4%) | 11 (84.6%) |
| 65 to 74 Years | 18 (100.0%) | 11 (61.1%) |
| 75 Years and over | 15 (100.0%) | 15 (100.0%) |
| Total | 79 (50.6%) | 90 (57.7%) |
Disability Status by Sex by Age in Dixie
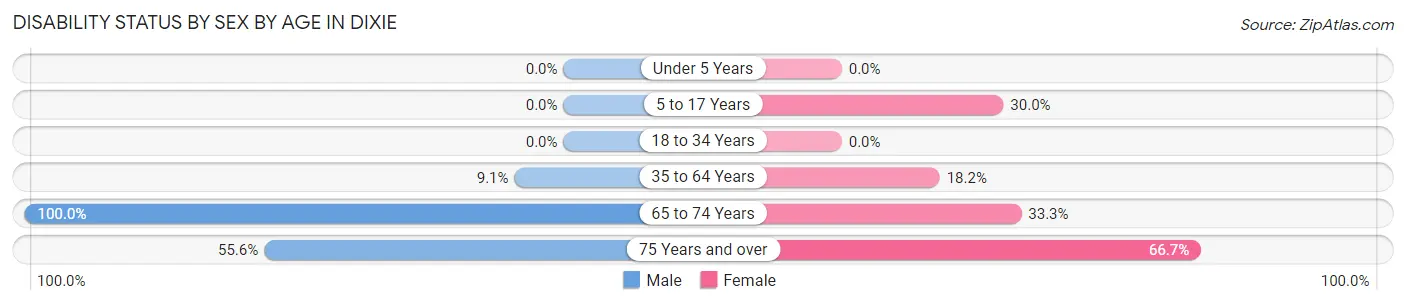
| Age Bracket | Male | Female |
| Under 5 Years | 0 (0.0%) | 0 (0.0%) |
| 5 to 17 Years | 0 (0.0%) | 3 (30.0%) |
| 18 to 34 Years | 0 (0.0%) | 0 (0.0%) |
| 35 to 64 Years | 3 (9.1%) | 6 (18.2%) |
| 65 to 74 Years | 6 (100.0%) | 4 (33.3%) |
| 75 Years and over | 5 (55.6%) | 4 (66.7%) |
Disability Class by Sex by Age in Dixie
Disability Class: Hearing Difficulty
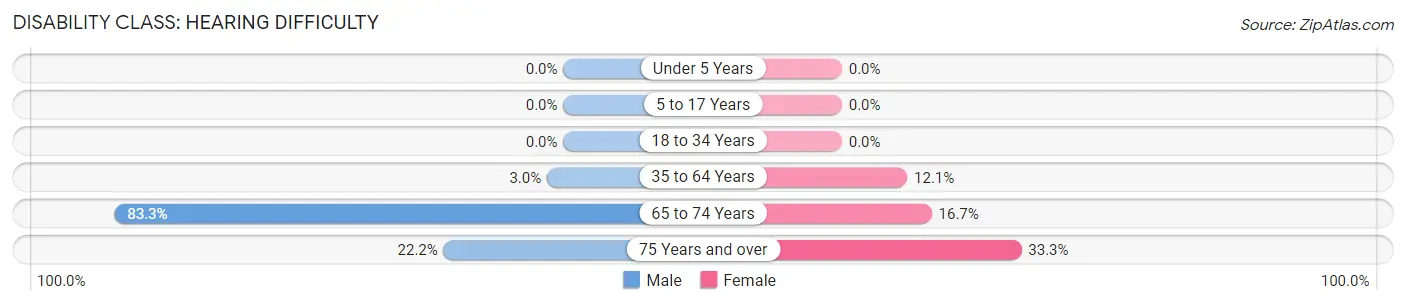
| Age Bracket | Male | Female |
| Under 5 Years | 0 (0.0%) | 0 (0.0%) |
| 5 to 17 Years | 0 (0.0%) | 0 (0.0%) |
| 18 to 34 Years | 0 (0.0%) | 0 (0.0%) |
| 35 to 64 Years | 1 (3.0%) | 4 (12.1%) |
| 65 to 74 Years | 5 (83.3%) | 2 (16.7%) |
| 75 Years and over | 2 (22.2%) | 2 (33.3%) |
Disability Class: Vision Difficulty
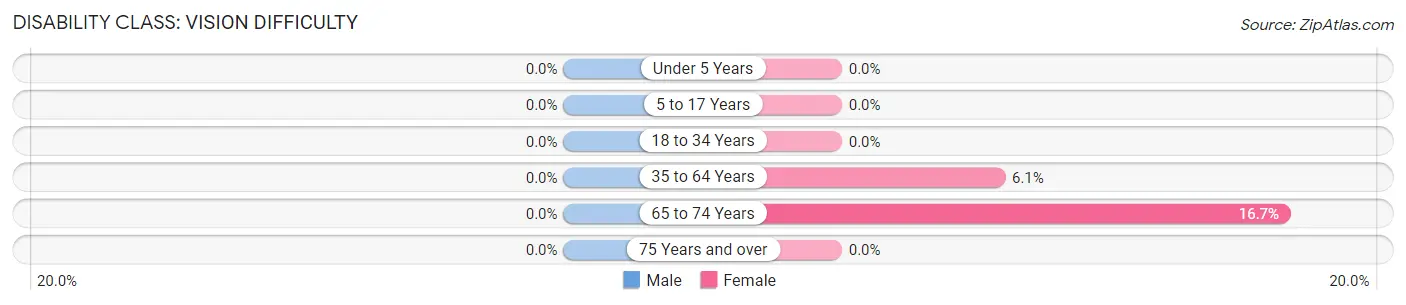
| Age Bracket | Male | Female |
| Under 5 Years | 0 (0.0%) | 0 (0.0%) |
| 5 to 17 Years | 0 (0.0%) | 0 (0.0%) |
| 18 to 34 Years | 0 (0.0%) | 0 (0.0%) |
| 35 to 64 Years | 0 (0.0%) | 2 (6.1%) |
| 65 to 74 Years | 0 (0.0%) | 2 (16.7%) |
| 75 Years and over | 0 (0.0%) | 0 (0.0%) |
Disability Class: Cognitive Difficulty
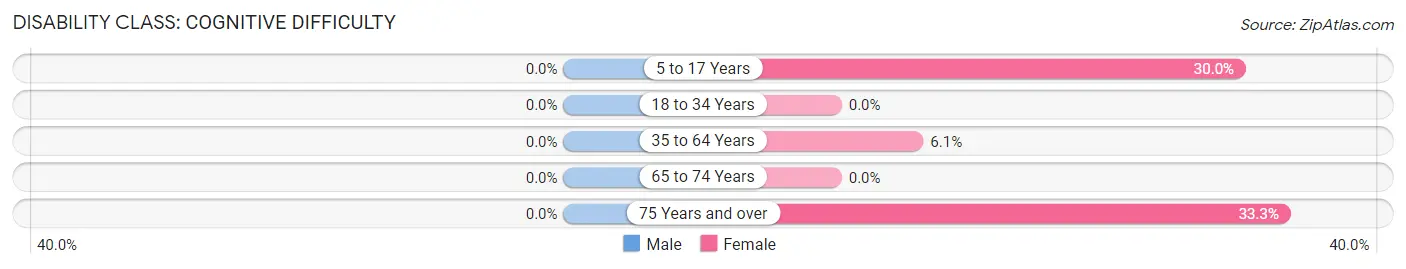
| Age Bracket | Male | Female |
| 5 to 17 Years | 0 (0.0%) | 3 (30.0%) |
| 18 to 34 Years | 0 (0.0%) | 0 (0.0%) |
| 35 to 64 Years | 0 (0.0%) | 2 (6.1%) |
| 65 to 74 Years | 0 (0.0%) | 0 (0.0%) |
| 75 Years and over | 0 (0.0%) | 2 (33.3%) |
Disability Class: Ambulatory Difficulty
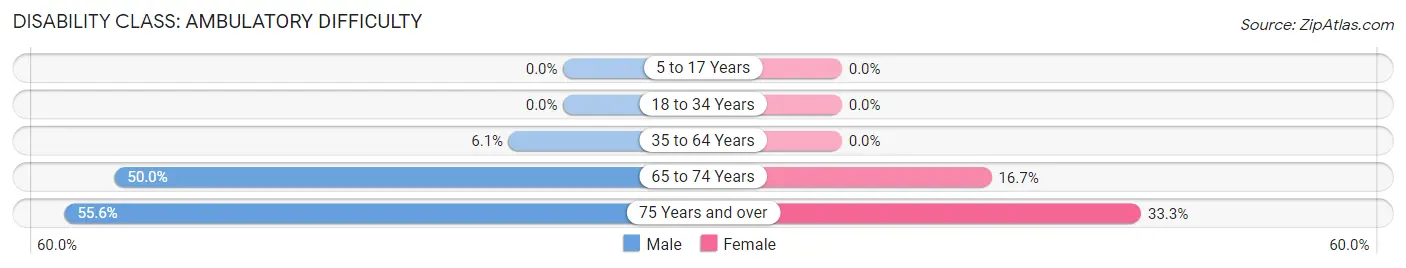
| Age Bracket | Male | Female |
| 5 to 17 Years | 0 (0.0%) | 0 (0.0%) |
| 18 to 34 Years | 0 (0.0%) | 0 (0.0%) |
| 35 to 64 Years | 2 (6.1%) | 0 (0.0%) |
| 65 to 74 Years | 3 (50.0%) | 2 (16.7%) |
| 75 Years and over | 5 (55.6%) | 2 (33.3%) |
Disability Class: Self-Care Difficulty
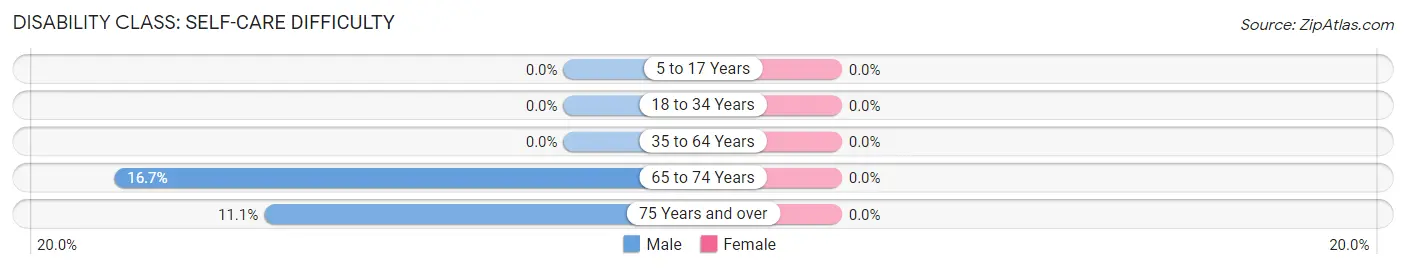
| Age Bracket | Male | Female |
| 5 to 17 Years | 0 (0.0%) | 0 (0.0%) |
| 18 to 34 Years | 0 (0.0%) | 0 (0.0%) |
| 35 to 64 Years | 0 (0.0%) | 0 (0.0%) |
| 65 to 74 Years | 1 (16.7%) | 0 (0.0%) |
| 75 Years and over | 1 (11.1%) | 0 (0.0%) |
Technology Access in Dixie
Computing Device Access in Dixie
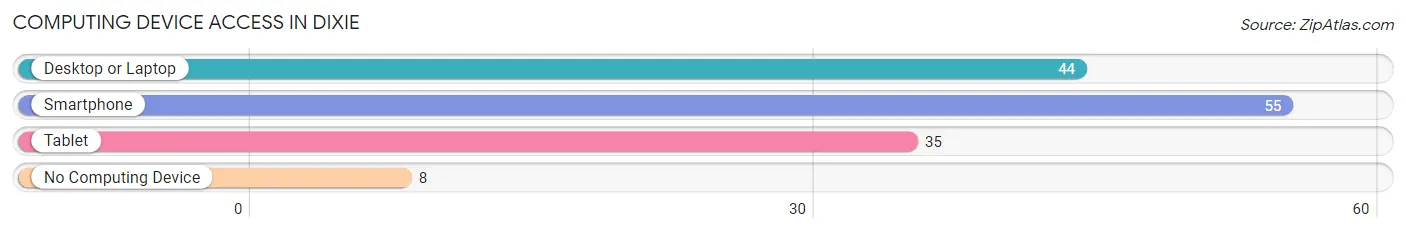
| Device Type | # Households | % Households |
| Desktop or Laptop | 44 | 67.7% |
| Smartphone | 55 | 84.6% |
| Tablet | 35 | 53.8% |
| No Computing Device | 8 | 12.3% |
| Total | 65 | 100.0% |
Internet Access in Dixie
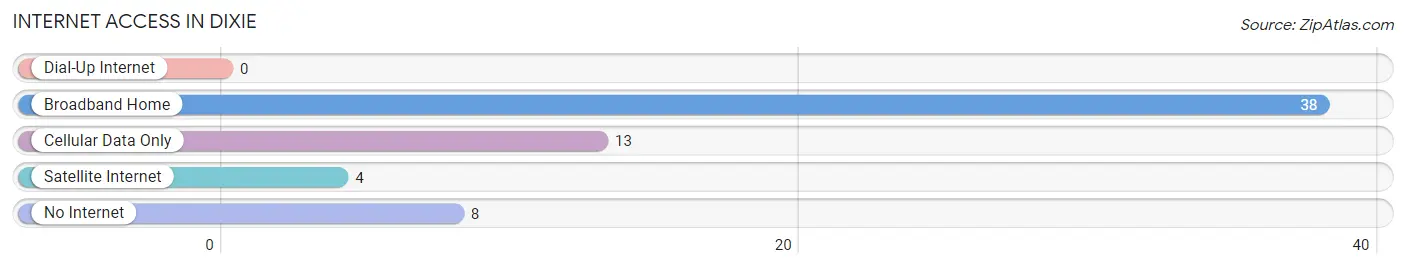
| Internet Type | # Households | % Households |
| Dial-Up Internet | 0 | 0.0% |
| Broadband Home | 38 | 58.5% |
| Cellular Data Only | 13 | 20.0% |
| Satellite Internet | 4 | 6.1% |
| No Internet | 8 | 12.3% |
| Total | 65 | 100.0% |
Dixie Summary
Dixie, Washington is a small unincorporated community located in the northeastern corner of Stevens County, Washington. It is situated on the banks of the Columbia River, just south of the Canada-US border. The town was founded in the late 1800s and has a population of approximately 200 people.
History
Dixie was founded in the late 1800s by a group of settlers from the Midwest. The town was named after the Dixie family, who were among the first settlers in the area. The town was originally a farming community, but in the early 1900s, the area began to develop into a logging and mining town. The town was home to several sawmills and a large coal mine. The coal mine was the largest employer in the area and provided jobs for many of the town's residents.
In the 1950s, the town began to decline as the coal mine closed and the sawmills moved away. The town was left with few economic opportunities and the population began to decline. In the late 1970s, the town was revitalized when the Grand Coulee Dam was built nearby. The dam provided jobs and economic opportunities for the town and the population began to grow again.
Geography
Dixie is located in the northeastern corner of Stevens County, Washington. It is situated on the banks of the Columbia River, just south of the Canada-US border. The town is surrounded by rolling hills and is located in a semi-arid climate. The average annual temperature is around 50 degrees Fahrenheit and the average annual precipitation is around 15 inches.
Economy
The economy of Dixie is largely based on agriculture and tourism. The town is home to several farms and ranches that produce a variety of crops, including wheat, barley, and hay. The town is also home to several tourist attractions, including the Grand Coulee Dam, which is a popular destination for visitors from around the world.
Demographics
As of the 2010 census, the population of Dixie was approximately 200 people. The town is predominantly white, with a small Hispanic population. The median household income is around $35,000 and the median home value is around $100,000. The town is served by a single school district and has a small library.
Common Questions
What is Per Capita Income in Dixie?
Per Capita income in Dixie is $48,309.
What is the Median Family Income in Dixie?
Median Family Income in Dixie is $118,125.
What is the Median Household income in Dixie?
Median Household Income in Dixie is $69,688.
What is Inequality or Gini Index in Dixie?
Inequality or Gini Index in Dixie is 0.52.
What is the Total Population of Dixie?
Total Population of Dixie is 156.
What is the Total Male Population of Dixie?
Total Male Population of Dixie is 84.
What is the Total Female Population of Dixie?
Total Female Population of Dixie is 72.
What is the Ratio of Males per 100 Females in Dixie?
There are 116.67 Males per 100 Females in Dixie.
What is the Ratio of Females per 100 Males in Dixie?
There are 85.71 Females per 100 Males in Dixie.
What is the Median Population Age in Dixie?
Median Population Age in Dixie is 47.0 Years.
What is the Average Family Size in Dixie
Average Family Size in Dixie is 2.9 People.
What is the Average Household Size in Dixie
Average Household Size in Dixie is 2.4 People.
How Large is the Labor Force in Dixie?
There are 67 People in the Labor Forcein in Dixie.
What is the Percentage of People in the Labor Force in Dixie?
48.9% of People are in the Labor Force in Dixie.