Zip Codes with the Highest Percentage of Population Employed in Accommodation & Food Services in Snohomish, WA
RELATED REPORTS & OPTIONS
Accommodation & Food Services
Snohomish
Compare Zip Codes
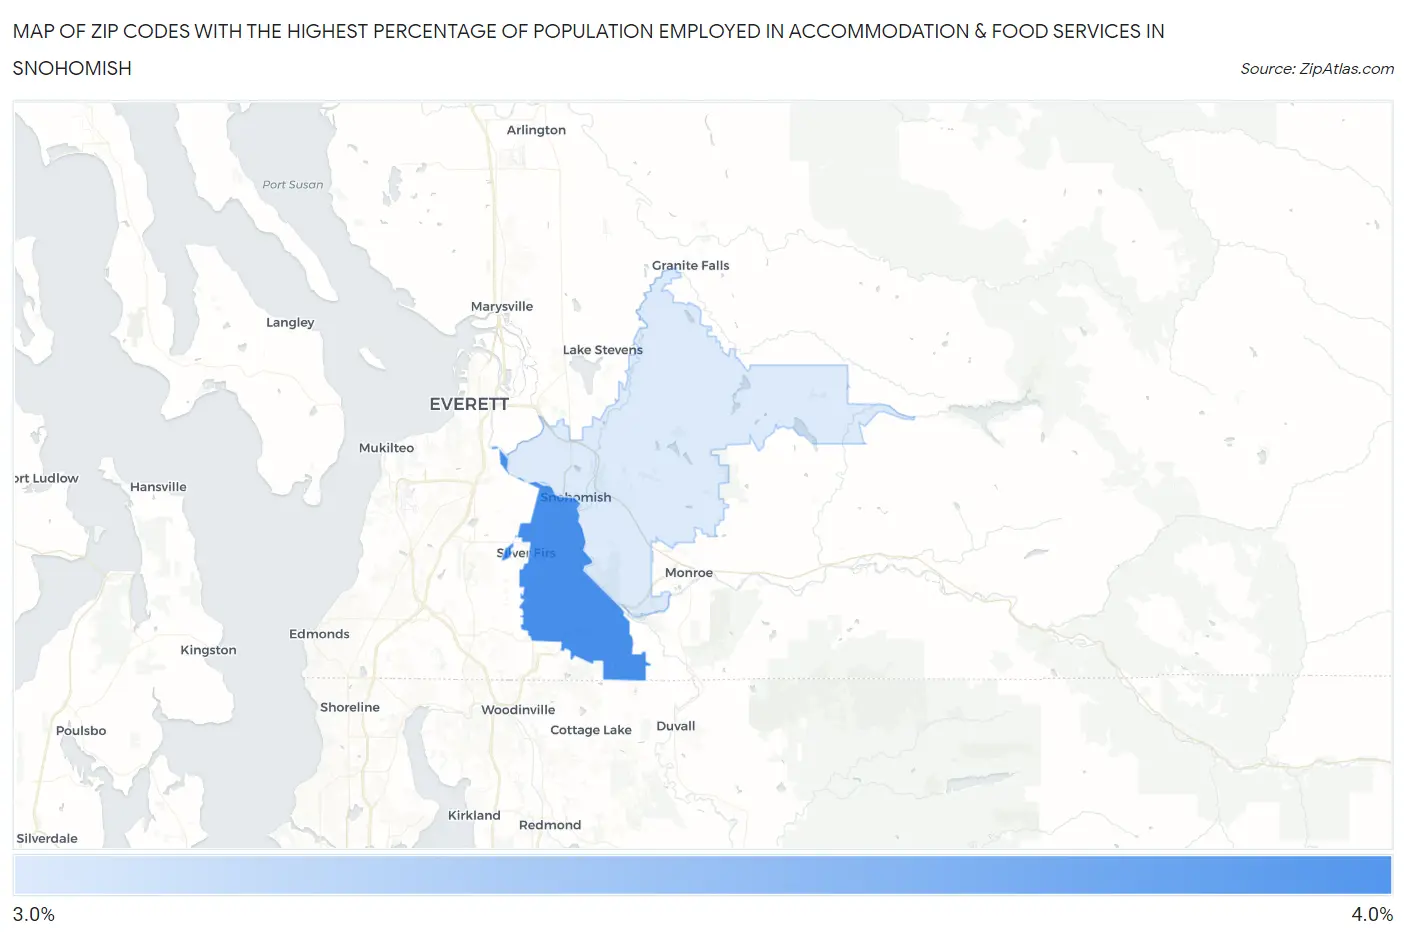
Map of Zip Codes with the Highest Percentage of Population Employed in Accommodation & Food Services in Snohomish
3.4%
3.6%
Zip Codes with the Highest Percentage of Population Employed in Accommodation & Food Services in Snohomish, WA
| Zip Code | % Employed | vs State | vs National | |
| 1. | 98296 | 3.6% | 6.5%(-2.87)#419 | 6.9%(-3.29)#21,489 |
| 2. | 98290 | 3.4% | 6.5%(-3.08)#428 | 6.9%(-3.50)#22,138 |
1
Common Questions
What are the Top Zip Codes with the Highest Percentage of Population Employed in Accommodation & Food Services in Snohomish, WA?
Top Zip Codes with the Highest Percentage of Population Employed in Accommodation & Food Services in Snohomish, WA are:
What zip code has the Highest Percentage of Population Employed in Accommodation & Food Services in Snohomish, WA?
98296 has the Highest Percentage of Population Employed in Accommodation & Food Services in Snohomish, WA with 3.6%.
What is the Percentage of Population Employed in Accommodation & Food Services in Snohomish, WA?
Percentage of Population Employed in Accommodation & Food Services in Snohomish is 7.6%.
What is the Percentage of Population Employed in Accommodation & Food Services in Washington?
Percentage of Population Employed in Accommodation & Food Services in Washington is 6.5%.
What is the Percentage of Population Employed in Accommodation & Food Services in the United States?
Percentage of Population Employed in Accommodation & Food Services in the United States is 6.9%.