Carnation, WA Map & Demographics
Carnation Map
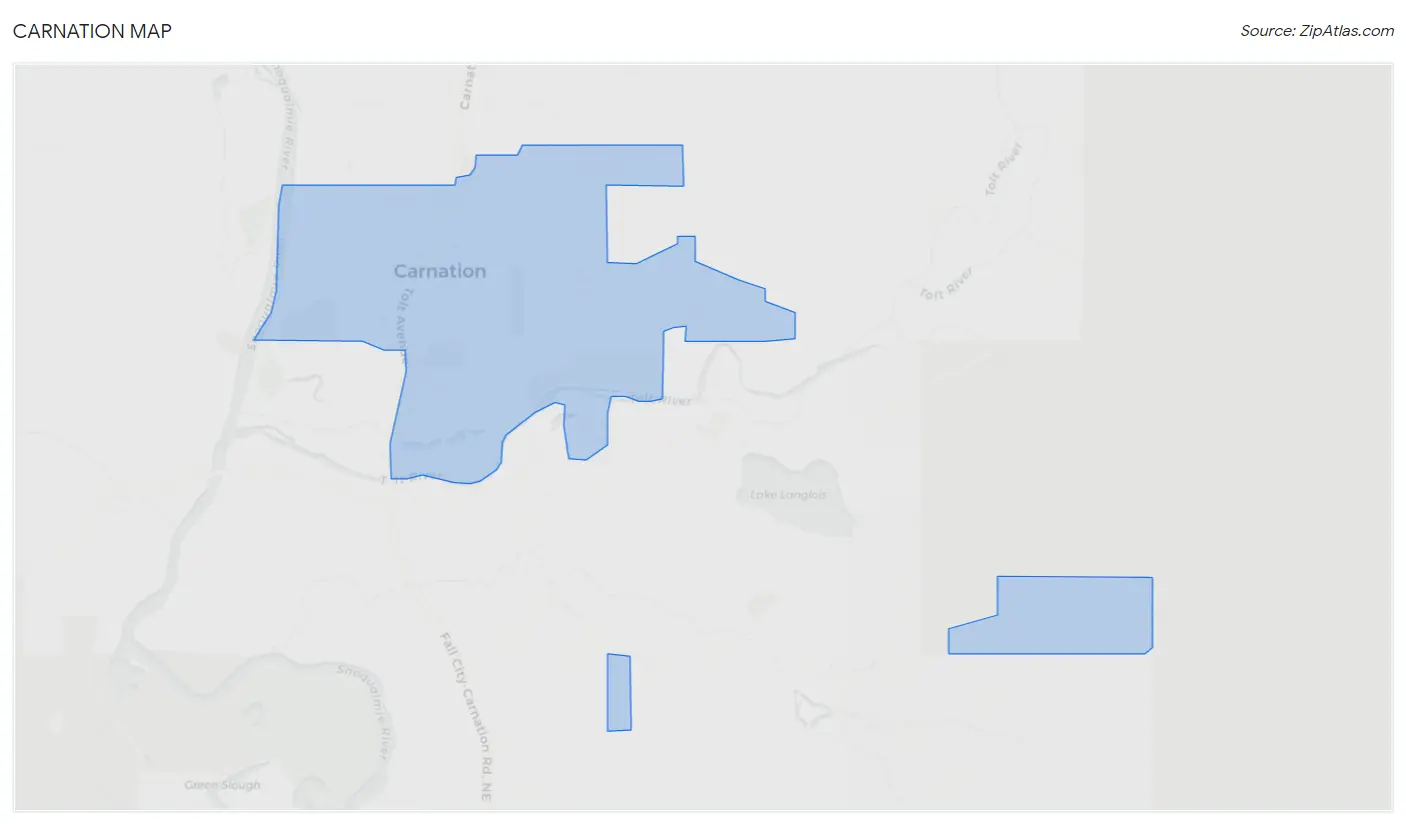
Carnation Overview
$56,412
PER CAPITA INCOME
$149,861
AVG FAMILY INCOME
$134,850
AVG HOUSEHOLD INCOME
55.3%
WAGE / INCOME GAP [ % ]
44.7¢/ $1
WAGE / INCOME GAP [ $ ]
0.38
INEQUALITY / GINI INDEX
2,515
TOTAL POPULATION
1,180
MALE POPULATION
1,335
FEMALE POPULATION
88.39
MALES / 100 FEMALES
113.14
FEMALES / 100 MALES
38.4
MEDIAN AGE
3.2
AVG FAMILY SIZE
3.0
AVG HOUSEHOLD SIZE
1,454
LABOR FORCE [ PEOPLE ]
75.4%
PERCENT IN LABOR FORCE
3.4%
UNEMPLOYMENT RATE
Carnation Zip Codes
Carnation Area Codes
Income in Carnation
Income Overview in Carnation
Per Capita Income in Carnation is $56,412, while median incomes of families and households are $149,861 and $134,850 respectively.
| Characteristic | Number | Measure |
| Per Capita Income | 2,515 | $56,412 |
| Median Family Income | 717 | $149,861 |
| Mean Family Income | 717 | $176,366 |
| Median Household Income | 845 | $134,850 |
| Mean Household Income | 845 | $165,369 |
| Income Deficit | 717 | $0 |
| Wage / Income Gap (%) | 2,515 | 55.32% |
| Wage / Income Gap ($) | 2,515 | 44.68¢ per $1 |
| Gini / Inequality Index | 2,515 | 0.38 |
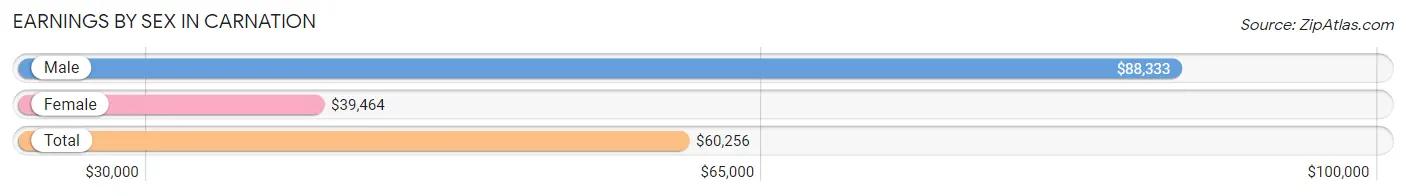
Earnings by Sex in Carnation
Average Earnings in Carnation are $60,256, $88,333 for men and $39,464 for women, a difference of 55.3%.
| Sex | Number | Average Earnings |
| Male | 802 (53.6%) | $88,333 |
| Female | 693 (46.4%) | $39,464 |
| Total | 1,495 (100.0%) | $60,256 |
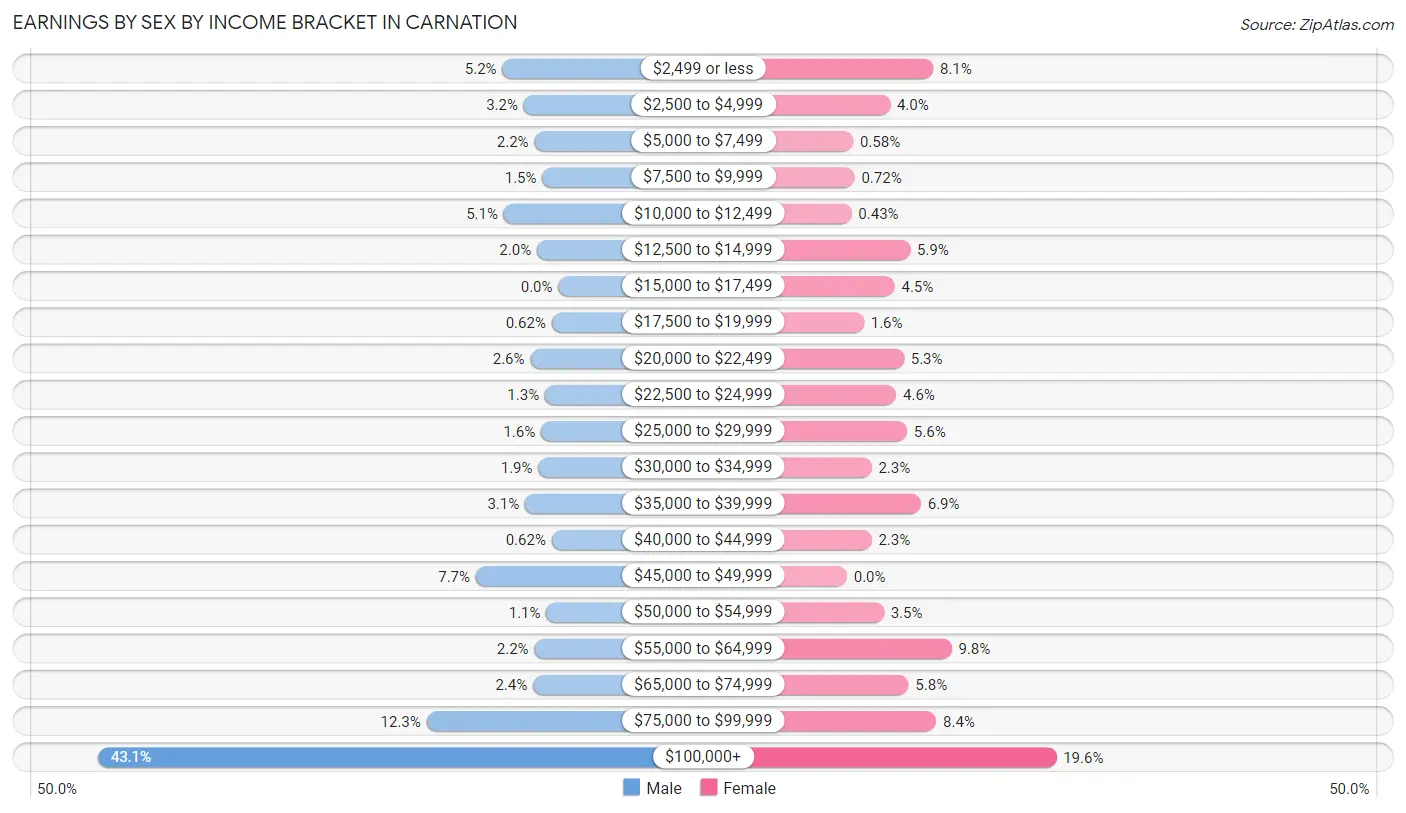
Earnings by Sex by Income Bracket in Carnation
The most common earnings brackets in Carnation are $100,000+ for men (346 | 43.1%) and $100,000+ for women (136 | 19.6%).
| Income | Male | Female |
| $2,499 or less | 42 (5.2%) | 56 (8.1%) |
| $2,500 to $4,999 | 26 (3.2%) | 28 (4.0%) |
| $5,000 to $7,499 | 18 (2.2%) | 4 (0.6%) |
| $7,500 to $9,999 | 12 (1.5%) | 5 (0.7%) |
| $10,000 to $12,499 | 41 (5.1%) | 3 (0.4%) |
| $12,500 to $14,999 | 16 (2.0%) | 41 (5.9%) |
| $15,000 to $17,499 | 0 (0.0%) | 31 (4.5%) |
| $17,500 to $19,999 | 5 (0.6%) | 11 (1.6%) |
| $20,000 to $22,499 | 21 (2.6%) | 37 (5.3%) |
| $22,500 to $24,999 | 10 (1.3%) | 32 (4.6%) |
| $25,000 to $29,999 | 13 (1.6%) | 39 (5.6%) |
| $30,000 to $34,999 | 15 (1.9%) | 16 (2.3%) |
| $35,000 to $39,999 | 25 (3.1%) | 48 (6.9%) |
| $40,000 to $44,999 | 5 (0.6%) | 16 (2.3%) |
| $45,000 to $49,999 | 62 (7.7%) | 0 (0.0%) |
| $50,000 to $54,999 | 9 (1.1%) | 24 (3.5%) |
| $55,000 to $64,999 | 18 (2.2%) | 68 (9.8%) |
| $65,000 to $74,999 | 19 (2.4%) | 40 (5.8%) |
| $75,000 to $99,999 | 99 (12.3%) | 58 (8.4%) |
| $100,000+ | 346 (43.1%) | 136 (19.6%) |
| Total | 802 (100.0%) | 693 (100.0%) |
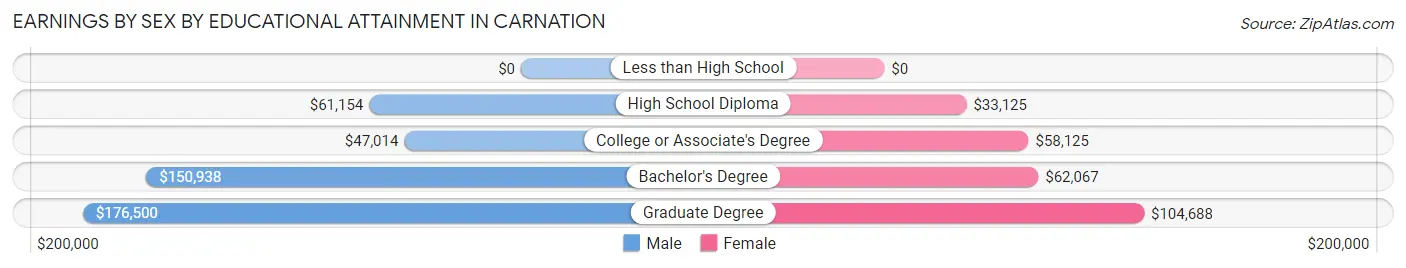
Earnings by Sex by Educational Attainment in Carnation
Average earnings in Carnation are $100,800 for men and $56,818 for women, a difference of 43.6%. Men with an educational attainment of graduate degree enjoy the highest average annual earnings of $176,500, while those with college or associate's degree education earn the least with $47,014. Women with an educational attainment of graduate degree earn the most with the average annual earnings of $104,688, while those with high school diploma education have the smallest earnings of $33,125.
| Educational Attainment | Male Income | Female Income |
| Less than High School | - | - |
| High School Diploma | $61,154 | $33,125 |
| College or Associate's Degree | $47,014 | $58,125 |
| Bachelor's Degree | $150,938 | $62,067 |
| Graduate Degree | $176,500 | $104,688 |
| Total | $100,800 | $56,818 |
Family Income in Carnation
Family Income Brackets in Carnation
According to the Carnation family income data, there are 219 families falling into the $200,000+ income range, which is the most common income bracket and makes up 30.5% of all families.
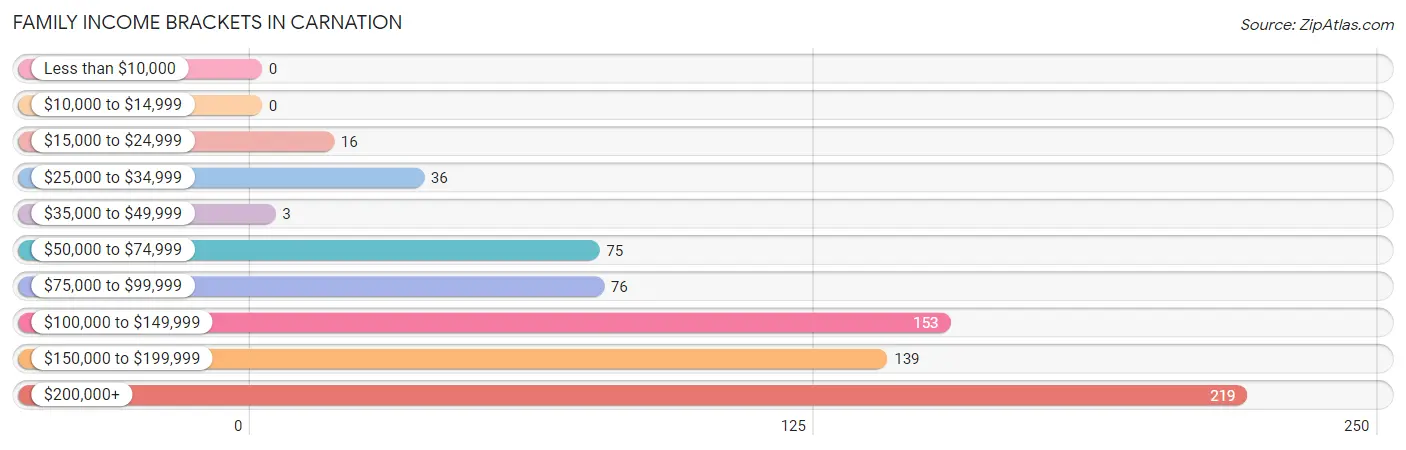
| Income Bracket | # Families | % Families |
| Less than $10,000 | 0 | 0.0% |
| $10,000 to $14,999 | 0 | 0.0% |
| $15,000 to $24,999 | 16 | 2.2% |
| $25,000 to $34,999 | 36 | 5.0% |
| $35,000 to $49,999 | 3 | 0.4% |
| $50,000 to $74,999 | 75 | 10.5% |
| $75,000 to $99,999 | 76 | 10.6% |
| $100,000 to $149,999 | 153 | 21.3% |
| $150,000 to $199,999 | 139 | 19.4% |
| $200,000+ | 219 | 30.5% |
Family Income by Famaliy Size in Carnation
6-person families (26 | 3.6%) account for the highest median family income in Carnation with $250,001 per family, while 2-person families (278 | 38.8%) have the highest median income of $67,960 per family member.
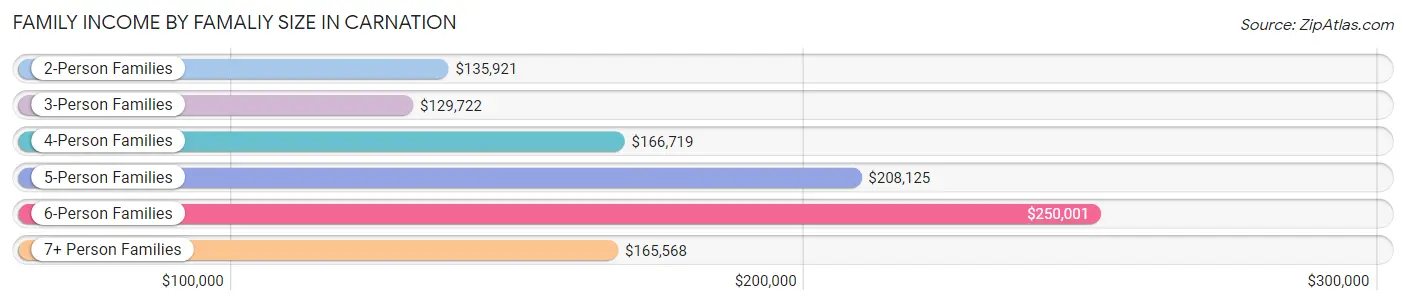
| Income Bracket | # Families | Median Income |
| 2-Person Families | 278 (38.8%) | $135,921 |
| 3-Person Families | 208 (29.0%) | $129,722 |
| 4-Person Families | 140 (19.5%) | $166,719 |
| 5-Person Families | 42 (5.9%) | $208,125 |
| 6-Person Families | 26 (3.6%) | $250,001 |
| 7+ Person Families | 23 (3.2%) | $165,568 |
| Total | 717 (100.0%) | $149,861 |
Family Income by Number of Earners in Carnation
The median family income in Carnation is $149,861, with families comprising 2 earners (295) having the highest median family income of $187,813, while families with no earners (39) have the lowest median family income of $31,458, accounting for 41.1% and 5.4% of families, respectively.
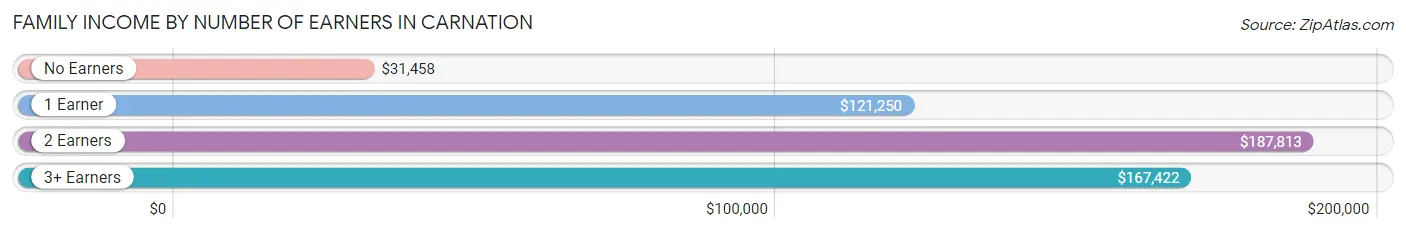
| Number of Earners | # Families | Median Income |
| No Earners | 39 (5.4%) | $31,458 |
| 1 Earner | 226 (31.5%) | $121,250 |
| 2 Earners | 295 (41.1%) | $187,813 |
| 3+ Earners | 157 (21.9%) | $167,422 |
| Total | 717 (100.0%) | $149,861 |
Household Income in Carnation
Household Income Brackets in Carnation
With 231 households falling in the category, the $200,000+ income range is the most frequent in Carnation, accounting for 27.3% of all households.
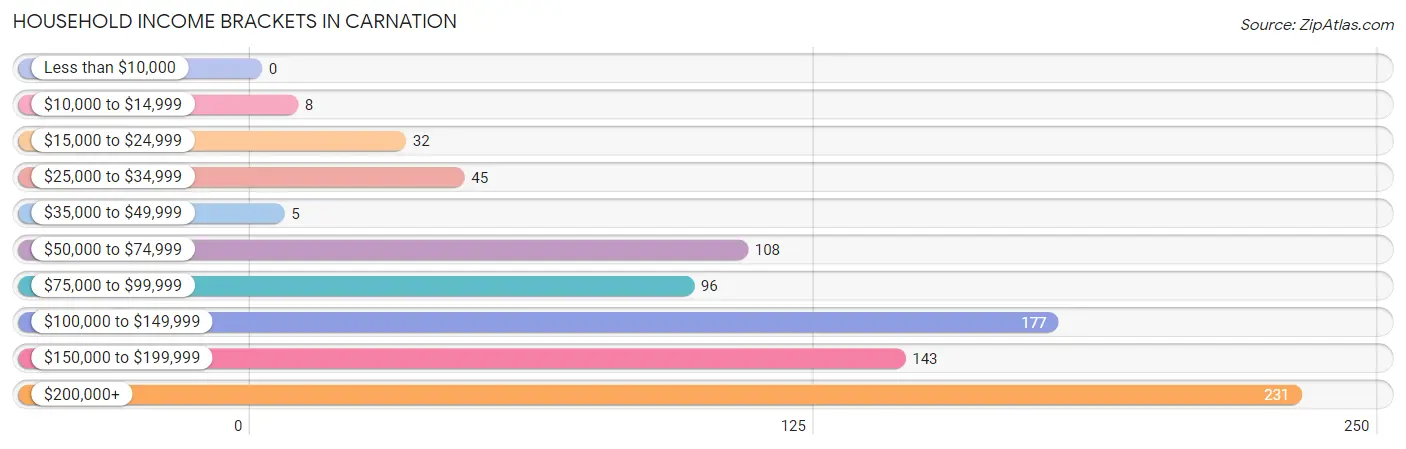
| Income Bracket | # Households | % Households |
| Less than $10,000 | 0 | 0.0% |
| $10,000 to $14,999 | 8 | 0.9% |
| $15,000 to $24,999 | 32 | 3.8% |
| $25,000 to $34,999 | 45 | 5.3% |
| $35,000 to $49,999 | 5 | 0.6% |
| $50,000 to $74,999 | 108 | 12.8% |
| $75,000 to $99,999 | 96 | 11.4% |
| $100,000 to $149,999 | 177 | 20.9% |
| $150,000 to $199,999 | 143 | 16.9% |
| $200,000+ | 231 | 27.3% |
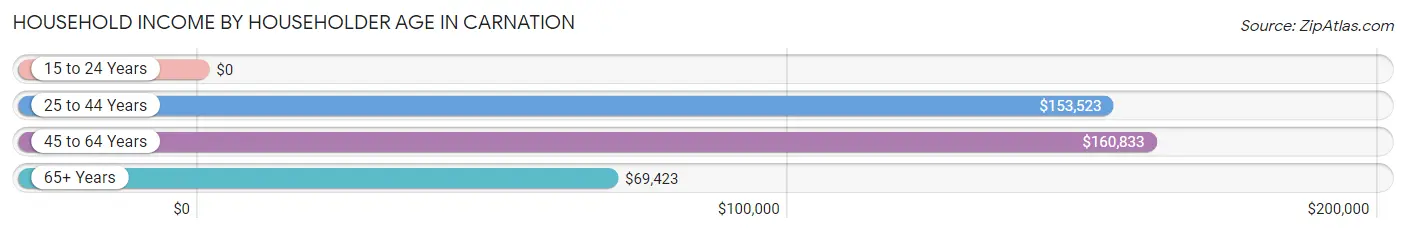
Household Income by Householder Age in Carnation
The median household income in Carnation is $134,850, with the highest median household income of $160,833 found in the 45 to 64 years age bracket for the primary householder. A total of 366 households (43.3%) fall into this category.
| Income Bracket | # Households | Median Income |
| 15 to 24 Years | 0 (0.0%) | $0 |
| 25 to 44 Years | 315 (37.3%) | $153,523 |
| 45 to 64 Years | 366 (43.3%) | $160,833 |
| 65+ Years | 164 (19.4%) | $69,423 |
| Total | 845 (100.0%) | $134,850 |
Poverty in Carnation
Income Below Poverty by Sex and Age in Carnation
With 1.2% poverty level for males and 1.6% for females among the residents of Carnation, 65 to 74 year old males and 45 to 54 year old females are the most vulnerable to poverty, with 14 males (12.2%) and 13 females (6.8%) in their respective age groups living below the poverty level.
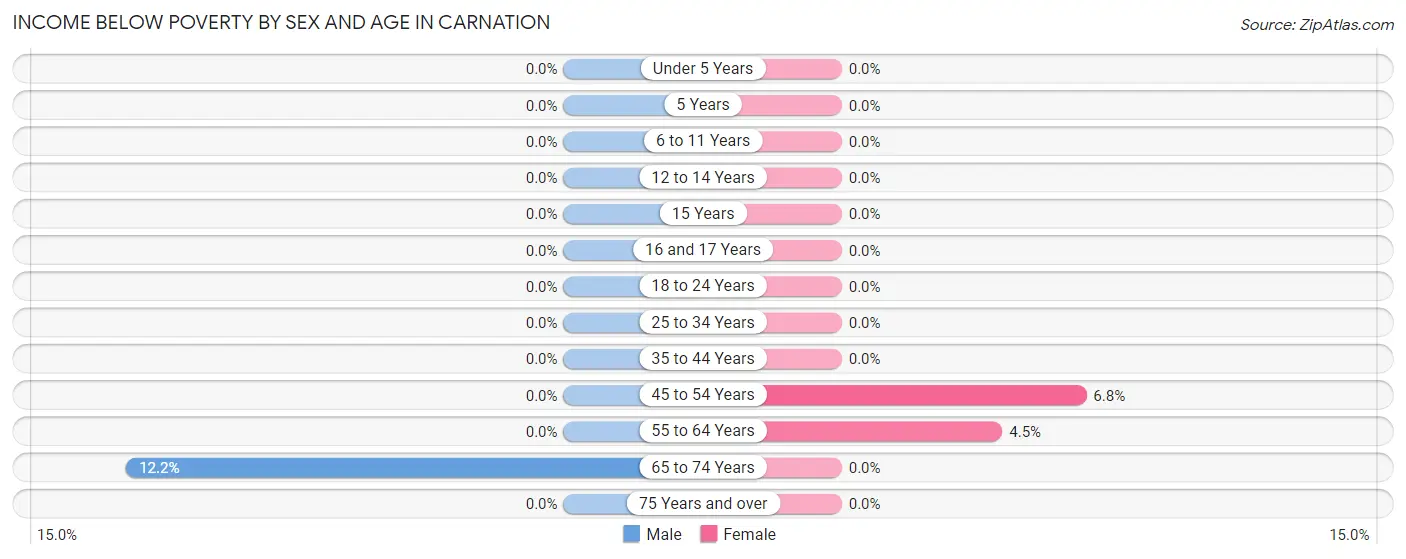
| Age Bracket | Male | Female |
| Under 5 Years | 0 (0.0%) | 0 (0.0%) |
| 5 Years | 0 (0.0%) | 0 (0.0%) |
| 6 to 11 Years | 0 (0.0%) | 0 (0.0%) |
| 12 to 14 Years | 0 (0.0%) | 0 (0.0%) |
| 15 Years | 0 (0.0%) | 0 (0.0%) |
| 16 and 17 Years | 0 (0.0%) | 0 (0.0%) |
| 18 to 24 Years | 0 (0.0%) | 0 (0.0%) |
| 25 to 34 Years | 0 (0.0%) | 0 (0.0%) |
| 35 to 44 Years | 0 (0.0%) | 0 (0.0%) |
| 45 to 54 Years | 0 (0.0%) | 13 (6.8%) |
| 55 to 64 Years | 0 (0.0%) | 8 (4.5%) |
| 65 to 74 Years | 14 (12.2%) | 0 (0.0%) |
| 75 Years and over | 0 (0.0%) | 0 (0.0%) |
| Total | 14 (1.2%) | 21 (1.6%) |
Income Above Poverty by Sex and Age in Carnation
According to the poverty statistics in Carnation, males aged under 5 years and females aged under 5 years are the age groups that are most secure financially, with 100.0% of males and 100.0% of females in these age groups living above the poverty line.
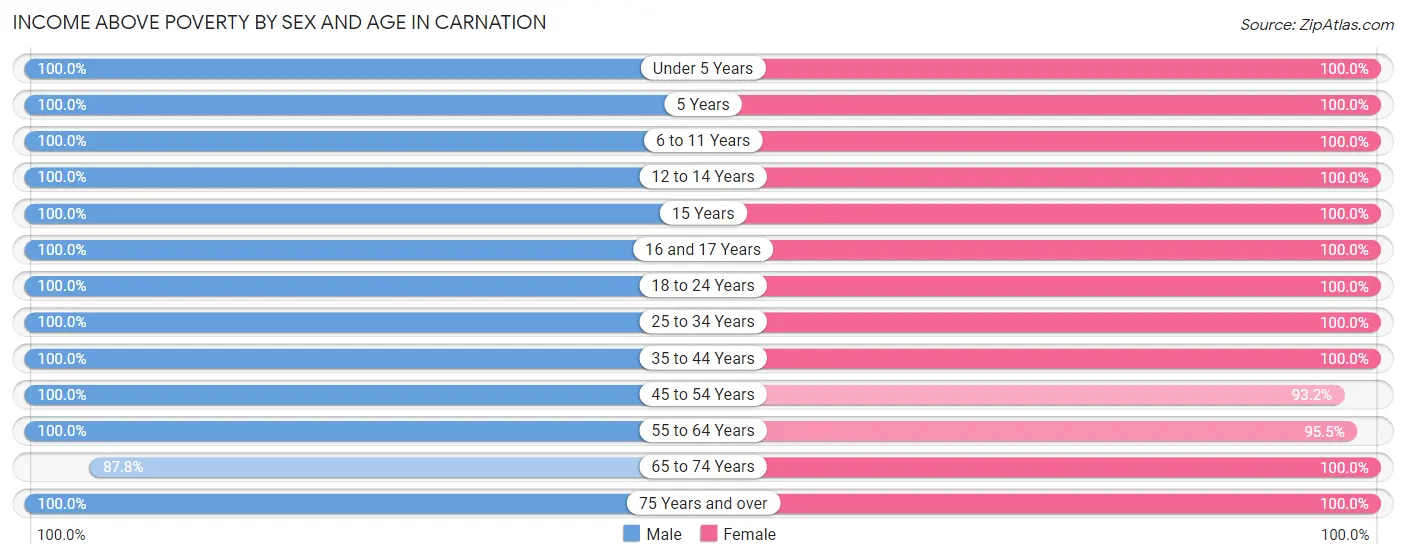
| Age Bracket | Male | Female |
| Under 5 Years | 72 (100.0%) | 102 (100.0%) |
| 5 Years | 6 (100.0%) | 15 (100.0%) |
| 6 to 11 Years | 91 (100.0%) | 150 (100.0%) |
| 12 to 14 Years | 30 (100.0%) | 42 (100.0%) |
| 15 Years | 49 (100.0%) | 30 (100.0%) |
| 16 and 17 Years | 14 (100.0%) | 44 (100.0%) |
| 18 to 24 Years | 112 (100.0%) | 115 (100.0%) |
| 25 to 34 Years | 119 (100.0%) | 133 (100.0%) |
| 35 to 44 Years | 250 (100.0%) | 197 (100.0%) |
| 45 to 54 Years | 164 (100.0%) | 178 (93.2%) |
| 55 to 64 Years | 155 (100.0%) | 171 (95.5%) |
| 65 to 74 Years | 101 (87.8%) | 100 (100.0%) |
| 75 Years and over | 3 (100.0%) | 37 (100.0%) |
| Total | 1,166 (98.8%) | 1,314 (98.4%) |
Income Below Poverty Among Married-Couple Families in Carnation
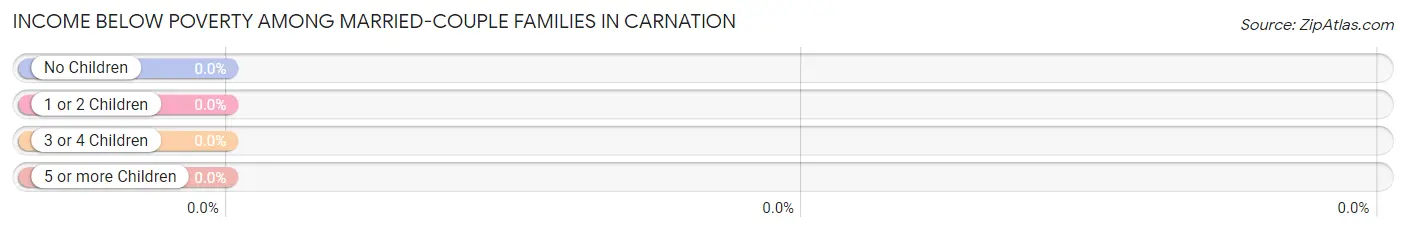
| Children | Above Poverty | Below Poverty |
| No Children | 287 (100.0%) | 0 (0.0%) |
| 1 or 2 Children | 254 (100.0%) | 0 (0.0%) |
| 3 or 4 Children | 51 (100.0%) | 0 (0.0%) |
| 5 or more Children | 14 (100.0%) | 0 (0.0%) |
| Total | 606 (100.0%) | 0 (0.0%) |
Income Below Poverty Among Single-Parent Households in Carnation
| Children | Single Father | Single Mother |
| No Children | 0 (0.0%) | 0 (0.0%) |
| 1 or 2 Children | 0 (0.0%) | 0 (0.0%) |
| 3 or 4 Children | 0 (0.0%) | 0 (0.0%) |
| 5 or more Children | 0 (0.0%) | 0 (0.0%) |
| Total | 0 (0.0%) | 0 (0.0%) |
Income Below Poverty Among Married-Couple vs Single-Parent Households in Carnation
| Children | Married-Couple Families | Single-Parent Households |
| No Children | 0 (0.0%) | 0 (0.0%) |
| 1 or 2 Children | 0 (0.0%) | 0 (0.0%) |
| 3 or 4 Children | 0 (0.0%) | 0 (0.0%) |
| 5 or more Children | 0 (0.0%) | 0 (0.0%) |
| Total | 0 (0.0%) | 0 (0.0%) |
Race in Carnation
The most populous races in Carnation are White / Caucasian (2,053 | 81.6%), Hispanic or Latino (342 | 13.6%), and Two or more Races (273 | 10.8%).
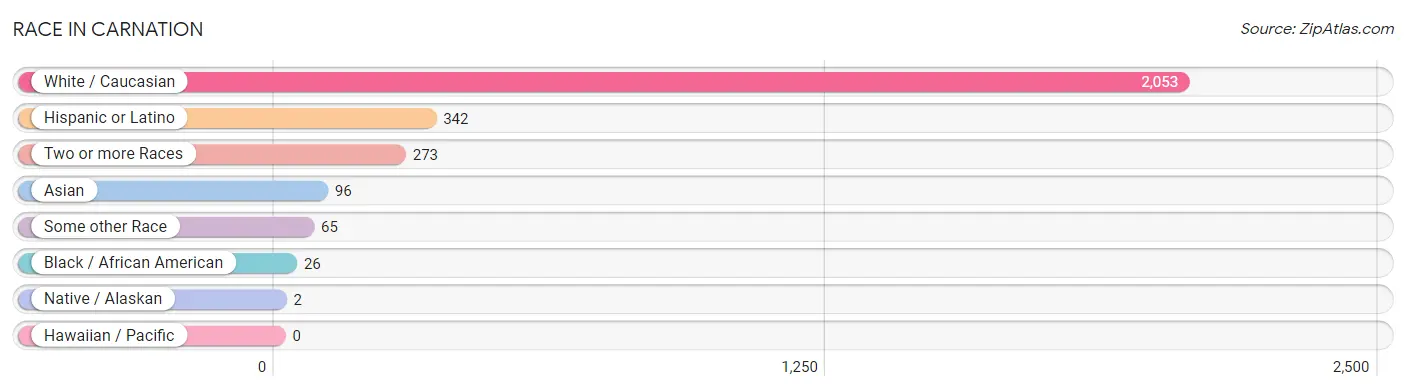
| Race | # Population | % Population |
| Asian | 96 | 3.8% |
| Black / African American | 26 | 1.0% |
| Hawaiian / Pacific | 0 | 0.0% |
| Hispanic or Latino | 342 | 13.6% |
| Native / Alaskan | 2 | 0.1% |
| White / Caucasian | 2,053 | 81.6% |
| Two or more Races | 273 | 10.8% |
| Some other Race | 65 | 2.6% |
| Total | 2,515 | 100.0% |
Ancestry in Carnation
The most populous ancestries reported in Carnation are German (412 | 16.4%), Mexican (310 | 12.3%), English (301 | 12.0%), Irish (251 | 10.0%), and Norwegian (201 | 8.0%), together accounting for 58.7% of all Carnation residents.
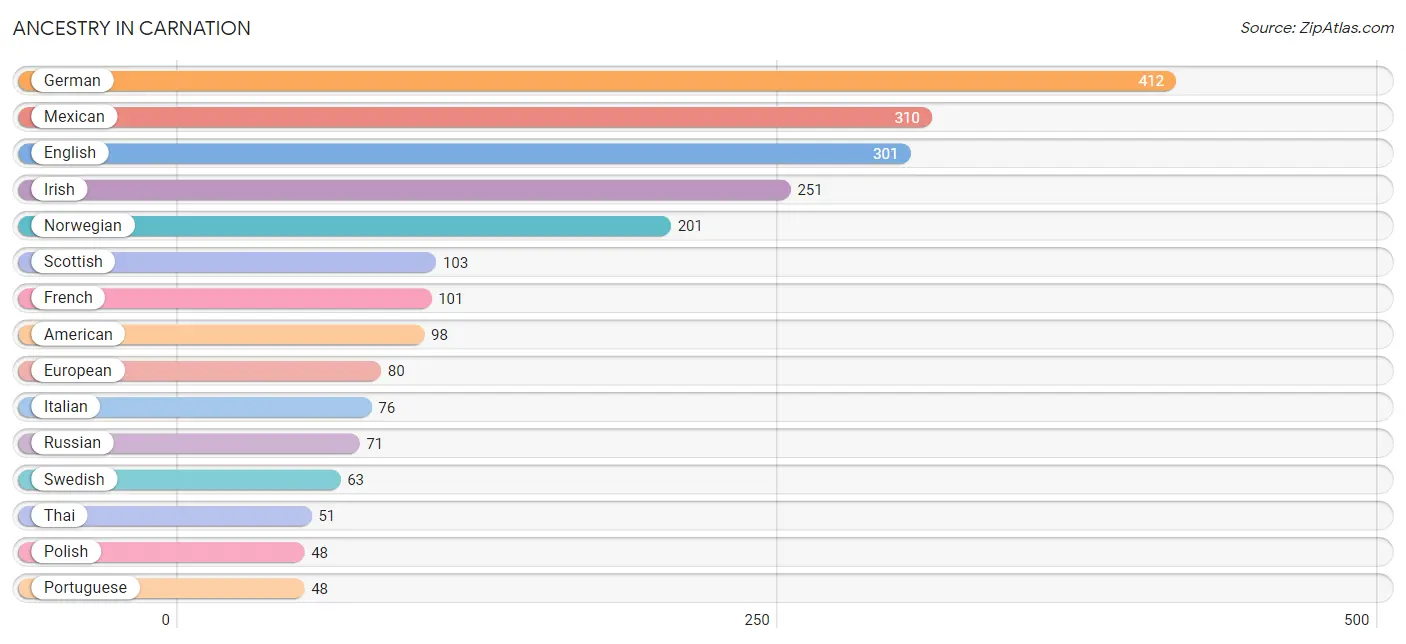
| Ancestry | # Population | % Population |
| American | 98 | 3.9% |
| Austrian | 3 | 0.1% |
| Belgian | 4 | 0.2% |
| Bhutanese | 4 | 0.2% |
| British | 16 | 0.6% |
| Canadian | 14 | 0.6% |
| Central American | 8 | 0.3% |
| Central American Indian | 11 | 0.4% |
| Cherokee | 13 | 0.5% |
| Croatian | 1 | 0.0% |
| Czech | 37 | 1.5% |
| Danish | 22 | 0.9% |
| Eastern European | 7 | 0.3% |
| English | 301 | 12.0% |
| Estonian | 12 | 0.5% |
| European | 80 | 3.2% |
| Finnish | 8 | 0.3% |
| French | 101 | 4.0% |
| French American Indian | 2 | 0.1% |
| French Canadian | 16 | 0.6% |
| German | 412 | 16.4% |
| Greek | 10 | 0.4% |
| Haitian | 18 | 0.7% |
| Indian (Asian) | 12 | 0.5% |
| Iranian | 3 | 0.1% |
| Irish | 251 | 10.0% |
| Italian | 76 | 3.0% |
| Korean | 34 | 1.3% |
| Latvian | 10 | 0.4% |
| Lithuanian | 2 | 0.1% |
| Mexican | 310 | 12.3% |
| Native Hawaiian | 3 | 0.1% |
| Nigerian | 8 | 0.3% |
| Norwegian | 201 | 8.0% |
| Pakistani | 9 | 0.4% |
| Polish | 48 | 1.9% |
| Portuguese | 48 | 1.9% |
| Puerto Rican | 6 | 0.2% |
| Russian | 71 | 2.8% |
| Salvadoran | 8 | 0.3% |
| Scandinavian | 17 | 0.7% |
| Scotch-Irish | 19 | 0.8% |
| Scottish | 103 | 4.1% |
| Sioux | 3 | 0.1% |
| South American | 5 | 0.2% |
| Spaniard | 2 | 0.1% |
| Spanish | 11 | 0.4% |
| Sri Lankan | 16 | 0.6% |
| Subsaharan African | 8 | 0.3% |
| Swedish | 63 | 2.5% |
| Taiwanese | 30 | 1.2% |
| Thai | 51 | 2.0% |
| Turkish | 4 | 0.2% |
| Ukrainian | 31 | 1.2% |
| Uruguayan | 5 | 0.2% |
| Welsh | 34 | 1.3% | View All 56 Rows |
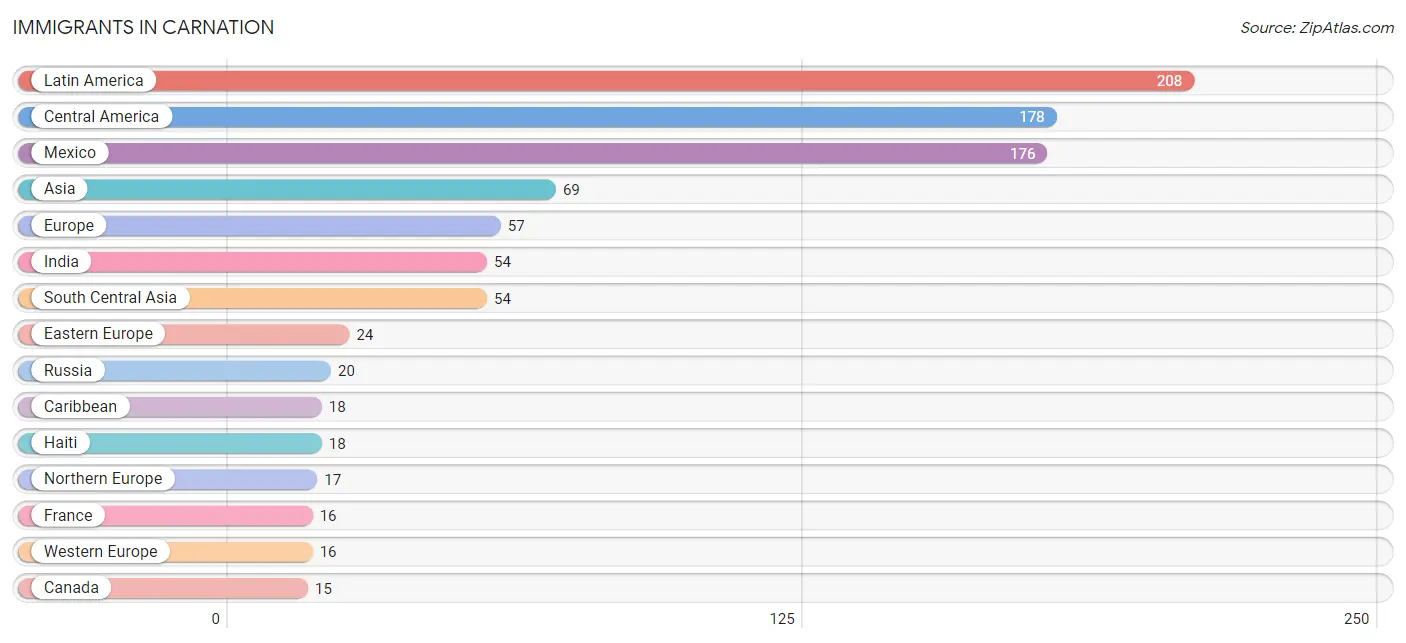
Immigrants in Carnation
The most numerous immigrant groups reported in Carnation came from Latin America (208 | 8.3%), Central America (178 | 7.1%), Mexico (176 | 7.0%), Asia (69 | 2.7%), and Europe (57 | 2.3%), together accounting for 27.4% of all Carnation residents.
| Immigration Origin | # Population | % Population |
| Africa | 7 | 0.3% |
| Asia | 69 | 2.7% |
| Brazil | 12 | 0.5% |
| Canada | 15 | 0.6% |
| Caribbean | 18 | 0.7% |
| Central America | 178 | 7.1% |
| China | 12 | 0.5% |
| Eastern Asia | 12 | 0.5% |
| Eastern Europe | 24 | 0.9% |
| El Salvador | 2 | 0.1% |
| England | 6 | 0.2% |
| Europe | 57 | 2.3% |
| France | 16 | 0.6% |
| Haiti | 18 | 0.7% |
| India | 54 | 2.1% |
| Latin America | 208 | 8.3% |
| Mexico | 176 | 7.0% |
| Nigeria | 7 | 0.3% |
| Northern Europe | 17 | 0.7% |
| Philippines | 3 | 0.1% |
| Poland | 4 | 0.2% |
| Russia | 20 | 0.8% |
| South America | 12 | 0.5% |
| South Central Asia | 54 | 2.1% |
| South Eastern Asia | 3 | 0.1% |
| Western Africa | 7 | 0.3% |
| Western Europe | 16 | 0.6% | View All 27 Rows |
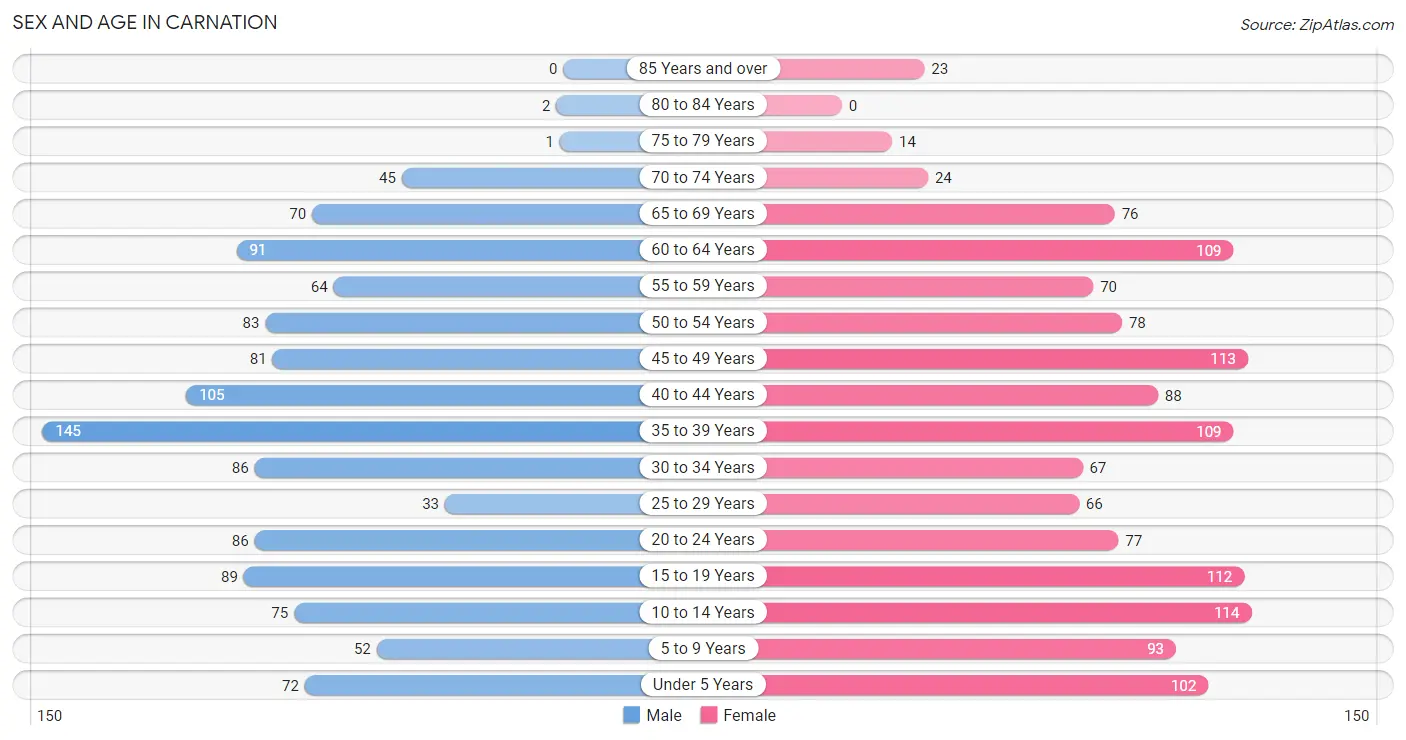
Sex and Age in Carnation
Sex and Age in Carnation
The most populous age groups in Carnation are 35 to 39 Years (145 | 12.3%) for men and 10 to 14 Years (114 | 8.5%) for women.
| Age Bracket | Male | Female |
| Under 5 Years | 72 (6.1%) | 102 (7.6%) |
| 5 to 9 Years | 52 (4.4%) | 93 (7.0%) |
| 10 to 14 Years | 75 (6.4%) | 114 (8.5%) |
| 15 to 19 Years | 89 (7.5%) | 112 (8.4%) |
| 20 to 24 Years | 86 (7.3%) | 77 (5.8%) |
| 25 to 29 Years | 33 (2.8%) | 66 (4.9%) |
| 30 to 34 Years | 86 (7.3%) | 67 (5.0%) |
| 35 to 39 Years | 145 (12.3%) | 109 (8.2%) |
| 40 to 44 Years | 105 (8.9%) | 88 (6.6%) |
| 45 to 49 Years | 81 (6.9%) | 113 (8.5%) |
| 50 to 54 Years | 83 (7.0%) | 78 (5.8%) |
| 55 to 59 Years | 64 (5.4%) | 70 (5.2%) |
| 60 to 64 Years | 91 (7.7%) | 109 (8.2%) |
| 65 to 69 Years | 70 (5.9%) | 76 (5.7%) |
| 70 to 74 Years | 45 (3.8%) | 24 (1.8%) |
| 75 to 79 Years | 1 (0.1%) | 14 (1.1%) |
| 80 to 84 Years | 2 (0.2%) | 0 (0.0%) |
| 85 Years and over | 0 (0.0%) | 23 (1.7%) |
| Total | 1,180 (100.0%) | 1,335 (100.0%) |
Families and Households in Carnation
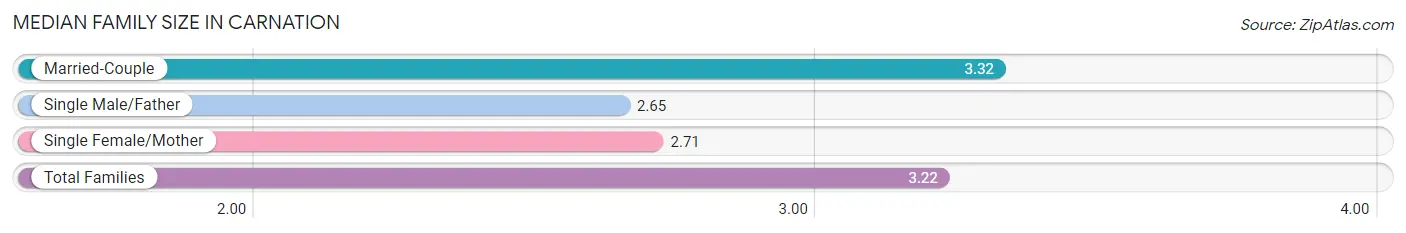
Median Family Size in Carnation
The median family size in Carnation is 3.22 persons per family, with married-couple families (606 | 84.5%) accounting for the largest median family size of 3.32 persons per family. On the other hand, single male/father families (43 | 6.0%) represent the smallest median family size with 2.65 persons per family.
| Family Type | # Families | Family Size |
| Married-Couple | 606 (84.5%) | 3.32 |
| Single Male/Father | 43 (6.0%) | 2.65 |
| Single Female/Mother | 68 (9.5%) | 2.71 |
| Total Families | 717 (100.0%) | 3.22 |
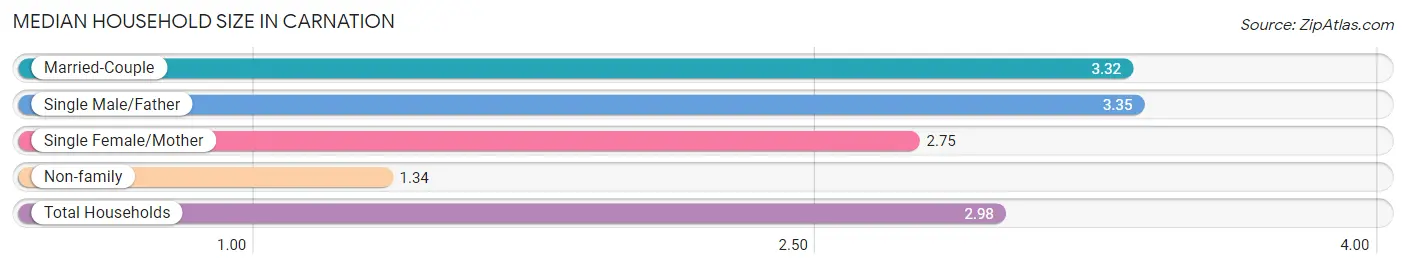
Median Household Size in Carnation
The median household size in Carnation is 2.98 persons per household, with single male/father households (43 | 5.1%) accounting for the largest median household size of 3.35 persons per household. non-family households (128 | 15.1%) represent the smallest median household size with 1.34 persons per household.
| Household Type | # Households | Household Size |
| Married-Couple | 606 (71.7%) | 3.32 |
| Single Male/Father | 43 (5.1%) | 3.35 |
| Single Female/Mother | 68 (8.1%) | 2.75 |
| Non-family | 128 (15.1%) | 1.34 |
| Total Households | 845 (100.0%) | 2.98 |
Household Size by Marriage Status in Carnation
Out of a total of 845 households in Carnation, 717 (84.9%) are family households, while 128 (15.1%) are nonfamily households. The most numerous type of family households are 2-person households, comprising 274, and the most common type of nonfamily households are 1-person households, comprising 89.
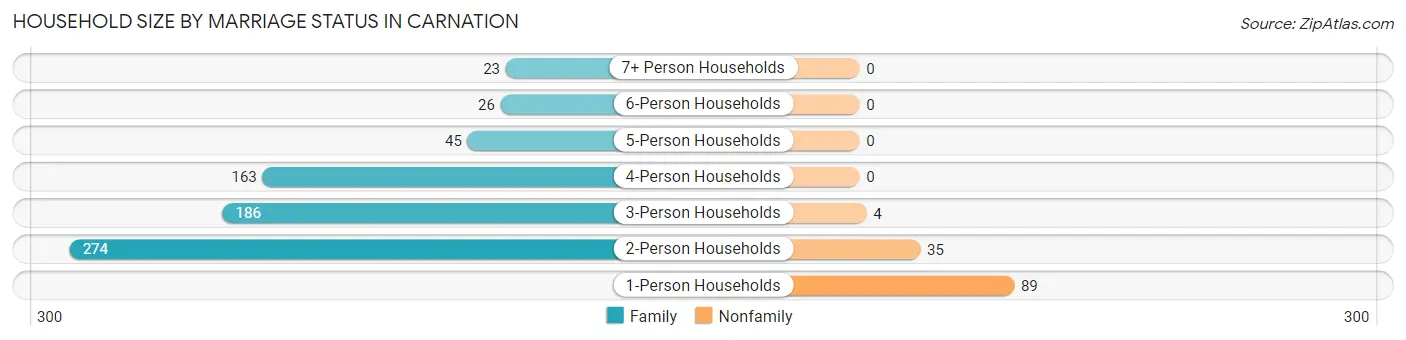
| Household Size | Family Households | Nonfamily Households |
| 1-Person Households | - | 89 (10.5%) |
| 2-Person Households | 274 (32.4%) | 35 (4.1%) |
| 3-Person Households | 186 (22.0%) | 4 (0.5%) |
| 4-Person Households | 163 (19.3%) | 0 (0.0%) |
| 5-Person Households | 45 (5.3%) | 0 (0.0%) |
| 6-Person Households | 26 (3.1%) | 0 (0.0%) |
| 7+ Person Households | 23 (2.7%) | 0 (0.0%) |
| Total | 717 (84.9%) | 128 (15.1%) |
Female Fertility in Carnation
Fertility by Age in Carnation
Average fertility rate in Carnation is 62.0 births per 1,000 women. Women in the age bracket of 35 to 50 years have the highest fertility rate with 91.0 births per 1,000 women. Women in the age bracket of 35 to 50 years acount for 72.5% of all women with births.
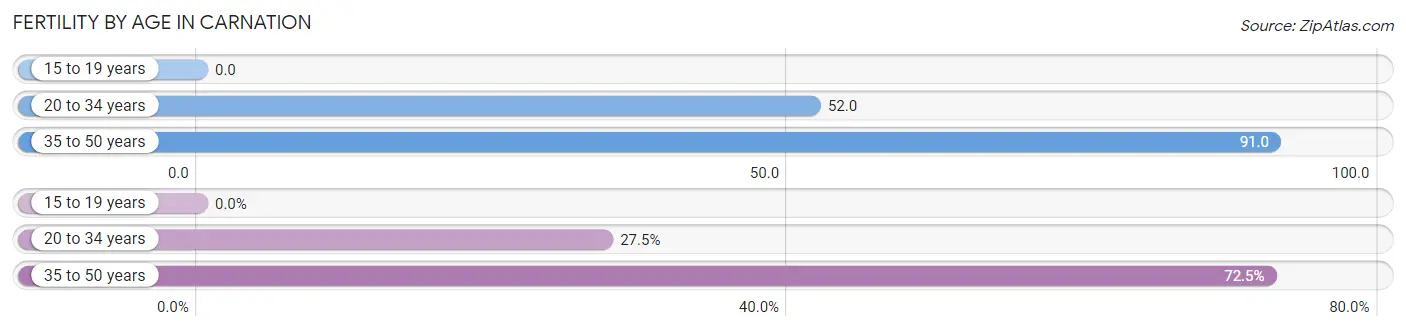
| Age Bracket | Women with Births | Births / 1,000 Women |
| 15 to 19 years | 0 (0.0%) | 0.0 |
| 20 to 34 years | 11 (27.5%) | 52.0 |
| 35 to 50 years | 29 (72.5%) | 91.0 |
| Total | 40 (100.0%) | 62.0 |
Fertility by Age by Marriage Status in Carnation
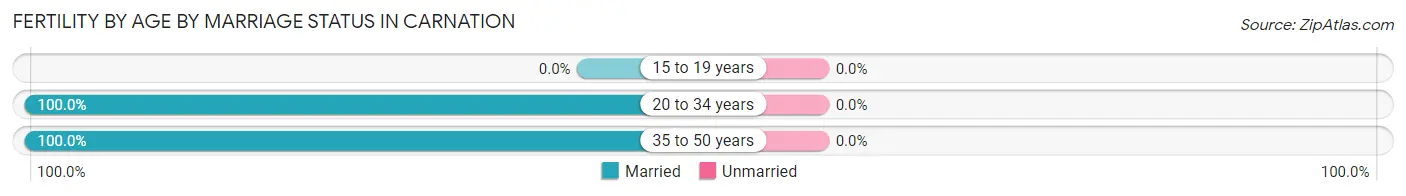
| Age Bracket | Married | Unmarried |
| 15 to 19 years | 0 (0.0%) | 0 (0.0%) |
| 20 to 34 years | 11 (100.0%) | 0 (0.0%) |
| 35 to 50 years | 29 (100.0%) | 0 (0.0%) |
| Total | 40 (100.0%) | 0 (0.0%) |
Fertility by Education in Carnation
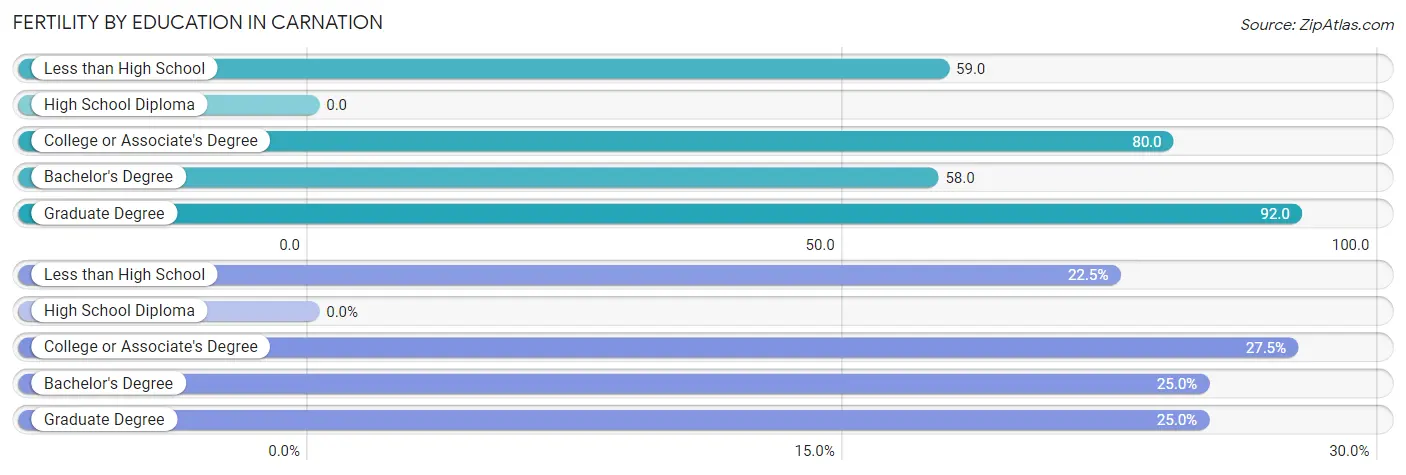
| Educational Attainment | Women with Births | Births / 1,000 Women |
| Less than High School | 9 (22.5%) | 59.0 |
| High School Diploma | 0 (0.0%) | 0.0 |
| College or Associate's Degree | 11 (27.5%) | 80.0 |
| Bachelor's Degree | 10 (25.0%) | 58.0 |
| Graduate Degree | 10 (25.0%) | 92.0 |
| Total | 40 (100.0%) | 62.0 |
Fertility by Education by Marriage Status in Carnation
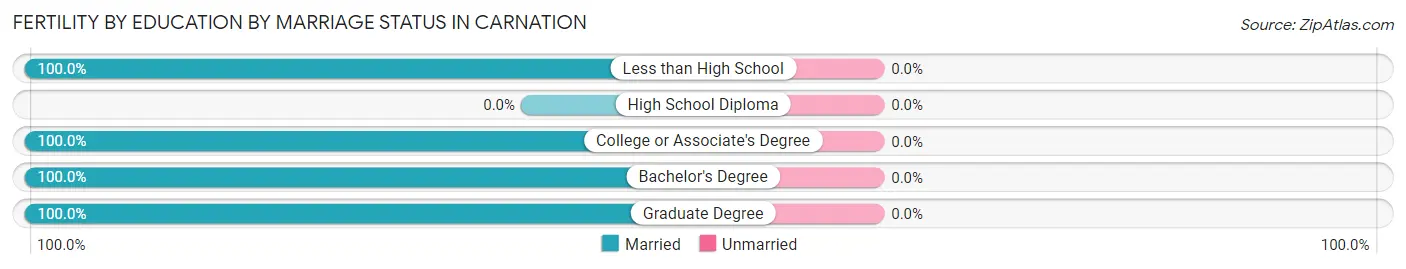
| Educational Attainment | Married | Unmarried |
| Less than High School | 9 (100.0%) | 0 (0.0%) |
| High School Diploma | 0 (0.0%) | 0 (0.0%) |
| College or Associate's Degree | 11 (100.0%) | 0 (0.0%) |
| Bachelor's Degree | 10 (100.0%) | 0 (0.0%) |
| Graduate Degree | 10 (100.0%) | 0 (0.0%) |
| Total | 40 (100.0%) | 0 (0.0%) |
Employment Characteristics in Carnation
Employment by Class of Employer in Carnation
Among the 1,360 employed individuals in Carnation, private company employees (1,030 | 75.7%), local government employees (101 | 7.4%), and not-for-profit organizations (97 | 7.1%) make up the most common classes of employment.
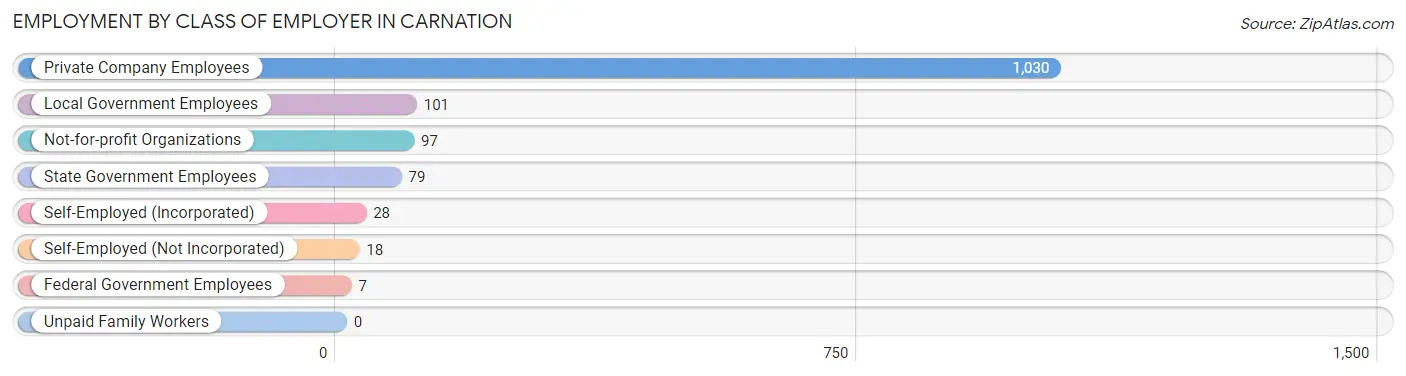
| Employer Class | # Employees | % Employees |
| Private Company Employees | 1,030 | 75.7% |
| Self-Employed (Incorporated) | 28 | 2.1% |
| Self-Employed (Not Incorporated) | 18 | 1.3% |
| Not-for-profit Organizations | 97 | 7.1% |
| Local Government Employees | 101 | 7.4% |
| State Government Employees | 79 | 5.8% |
| Federal Government Employees | 7 | 0.5% |
| Unpaid Family Workers | 0 | 0.0% |
| Total | 1,360 | 100.0% |
Employment Status by Age in Carnation
According to the labor force statistics for Carnation, out of the total population over 16 years of age (1,928), 75.4% or 1,454 individuals are in the labor force, with 3.4% or 49 of them unemployed. The age group with the highest labor force participation rate is 20 to 24 years, with 93.9% or 153 individuals in the labor force. Within the labor force, the 35 to 44 years age range has the highest percentage of unemployed individuals, with 8.7% or 34 of them being unemployed.
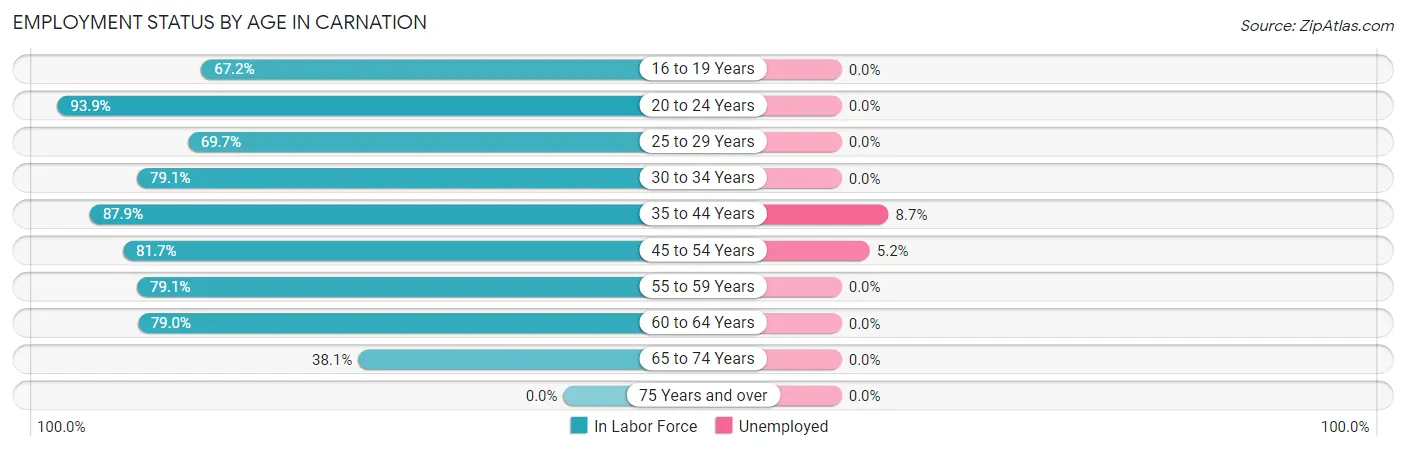
| Age Bracket | In Labor Force | Unemployed |
| 16 to 19 Years | 82 (67.2%) | 0 (0.0%) |
| 20 to 24 Years | 153 (93.9%) | 0 (0.0%) |
| 25 to 29 Years | 69 (69.7%) | 0 (0.0%) |
| 30 to 34 Years | 121 (79.1%) | 0 (0.0%) |
| 35 to 44 Years | 393 (87.9%) | 34 (8.7%) |
| 45 to 54 Years | 290 (81.7%) | 15 (5.2%) |
| 55 to 59 Years | 106 (79.1%) | 0 (0.0%) |
| 60 to 64 Years | 158 (79.0%) | 0 (0.0%) |
| 65 to 74 Years | 82 (38.1%) | 0 (0.0%) |
| 75 Years and over | 0 (0.0%) | 0 (0.0%) |
| Total | 1,454 (75.4%) | 49 (3.4%) |
Employment Status by Educational Attainment in Carnation
According to labor force statistics for Carnation, 81.9% of individuals (1,137) out of the total population between 25 and 64 years of age (1,388) are in the labor force, with 4.3% or 49 of them being unemployed. The group with the highest labor force participation rate are those with the educational attainment of high school diploma, with 87.9% or 189 individuals in the labor force. Within the labor force, individuals with less than high school education have the highest percentage of unemployment, with 30.4% or 28 of them being unemployed.
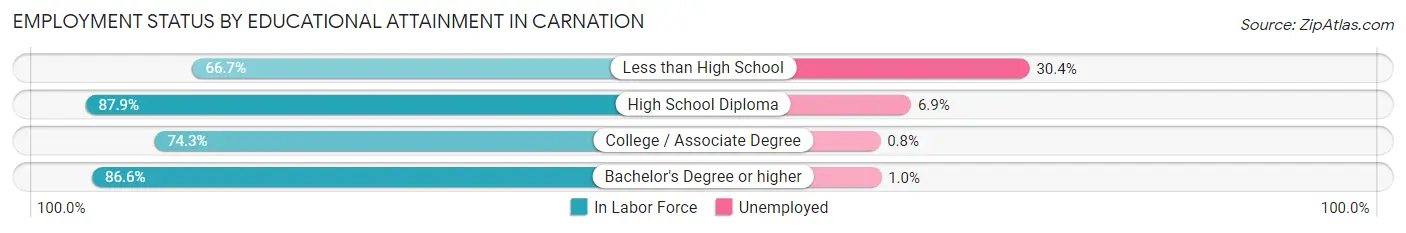
| Educational Attainment | In Labor Force | Unemployed |
| Less than High School | 92 (66.7%) | 42 (30.4%) |
| High School Diploma | 189 (87.9%) | 15 (6.9%) |
| College / Associate Degree | 243 (74.3%) | 3 (0.8%) |
| Bachelor's Degree or higher | 613 (86.6%) | 7 (1.0%) |
| Total | 1,137 (81.9%) | 60 (4.3%) |
Employment Occupations by Sex in Carnation
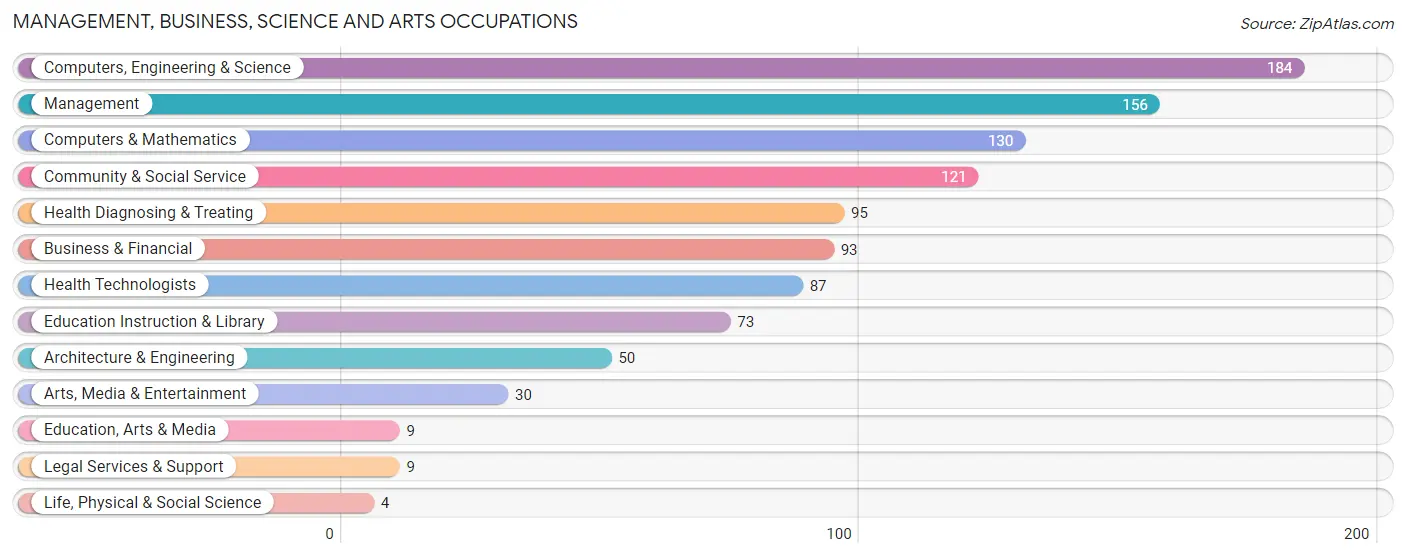
Management, Business, Science and Arts Occupations
The most common Management, Business, Science and Arts occupations in Carnation are Computers, Engineering & Science (184 | 13.1%), Management (156 | 11.1%), Computers & Mathematics (130 | 9.2%), Community & Social Service (121 | 8.6%), and Health Diagnosing & Treating (95 | 6.8%).
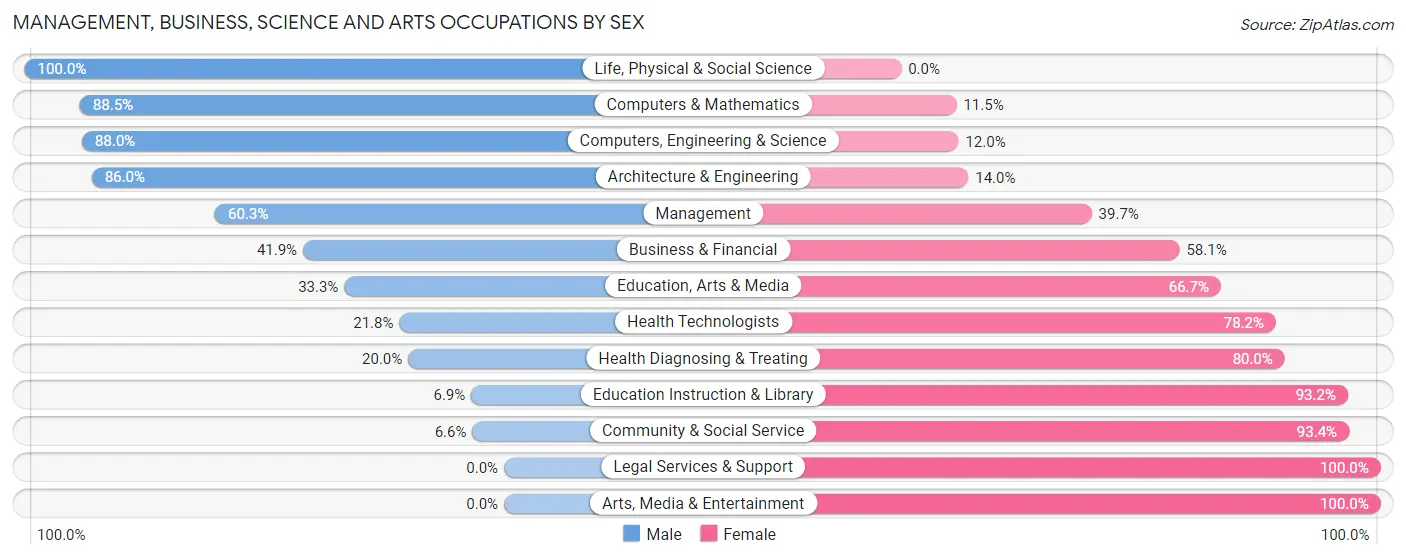
Management, Business, Science and Arts Occupations by Sex
Within the Management, Business, Science and Arts occupations in Carnation, the most male-oriented occupations are Life, Physical & Social Science (100.0%), Computers & Mathematics (88.5%), and Computers, Engineering & Science (88.0%), while the most female-oriented occupations are Legal Services & Support (100.0%), Arts, Media & Entertainment (100.0%), and Community & Social Service (93.4%).
| Occupation | Male | Female |
| Management | 94 (60.3%) | 62 (39.7%) |
| Business & Financial | 39 (41.9%) | 54 (58.1%) |
| Computers, Engineering & Science | 162 (88.0%) | 22 (12.0%) |
| Computers & Mathematics | 115 (88.5%) | 15 (11.5%) |
| Architecture & Engineering | 43 (86.0%) | 7 (14.0%) |
| Life, Physical & Social Science | 4 (100.0%) | 0 (0.0%) |
| Community & Social Service | 8 (6.6%) | 113 (93.4%) |
| Education, Arts & Media | 3 (33.3%) | 6 (66.7%) |
| Legal Services & Support | 0 (0.0%) | 9 (100.0%) |
| Education Instruction & Library | 5 (6.9%) | 68 (93.1%) |
| Arts, Media & Entertainment | 0 (0.0%) | 30 (100.0%) |
| Health Diagnosing & Treating | 19 (20.0%) | 76 (80.0%) |
| Health Technologists | 19 (21.8%) | 68 (78.2%) |
| Total (Category) | 322 (49.6%) | 327 (50.4%) |
| Total (Overall) | 735 (52.3%) | 670 (47.7%) |
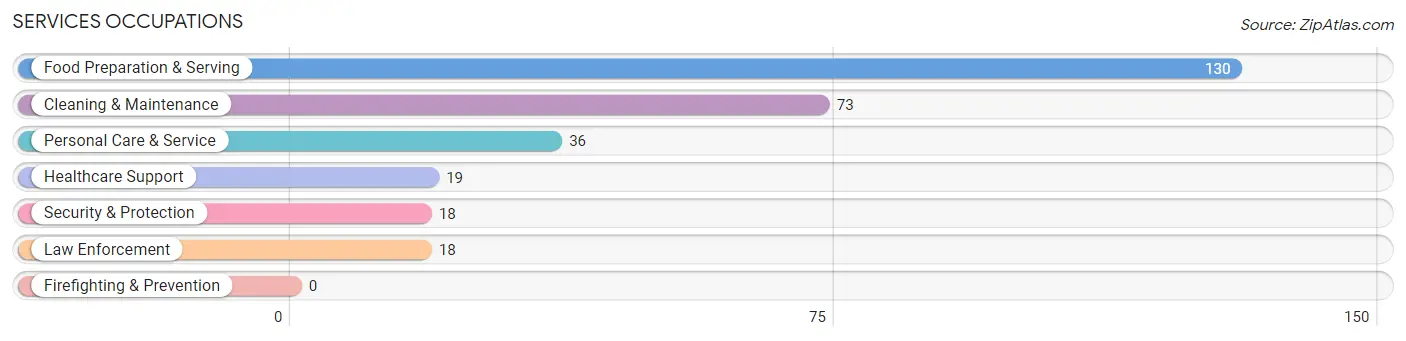
Services Occupations
The most common Services occupations in Carnation are Food Preparation & Serving (130 | 9.2%), Cleaning & Maintenance (73 | 5.2%), Personal Care & Service (36 | 2.6%), Healthcare Support (19 | 1.3%), and Security & Protection (18 | 1.3%).
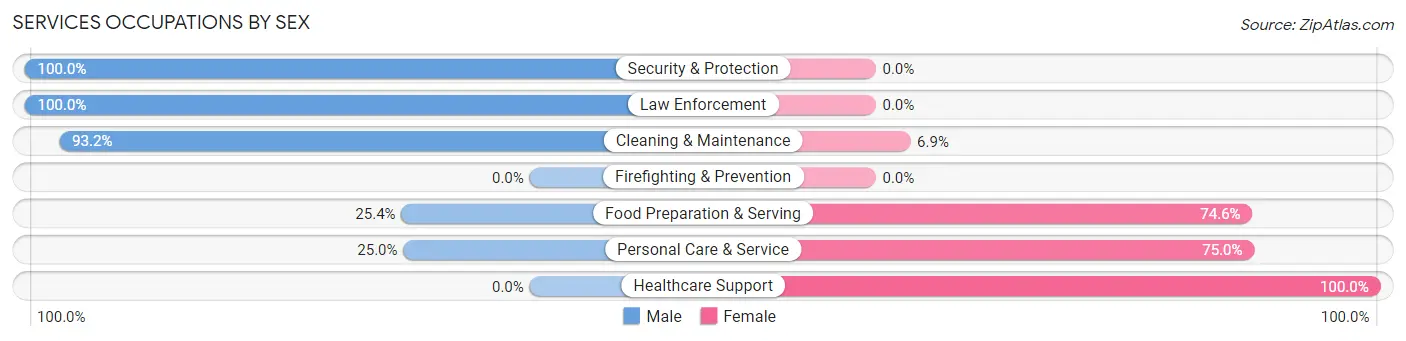
Services Occupations by Sex
Within the Services occupations in Carnation, the most male-oriented occupations are Security & Protection (100.0%), Law Enforcement (100.0%), and Cleaning & Maintenance (93.1%), while the most female-oriented occupations are Healthcare Support (100.0%), Personal Care & Service (75.0%), and Food Preparation & Serving (74.6%).
| Occupation | Male | Female |
| Healthcare Support | 0 (0.0%) | 19 (100.0%) |
| Security & Protection | 18 (100.0%) | 0 (0.0%) |
| Firefighting & Prevention | 0 (0.0%) | 0 (0.0%) |
| Law Enforcement | 18 (100.0%) | 0 (0.0%) |
| Food Preparation & Serving | 33 (25.4%) | 97 (74.6%) |
| Cleaning & Maintenance | 68 (93.1%) | 5 (6.9%) |
| Personal Care & Service | 9 (25.0%) | 27 (75.0%) |
| Total (Category) | 128 (46.4%) | 148 (53.6%) |
| Total (Overall) | 735 (52.3%) | 670 (47.7%) |
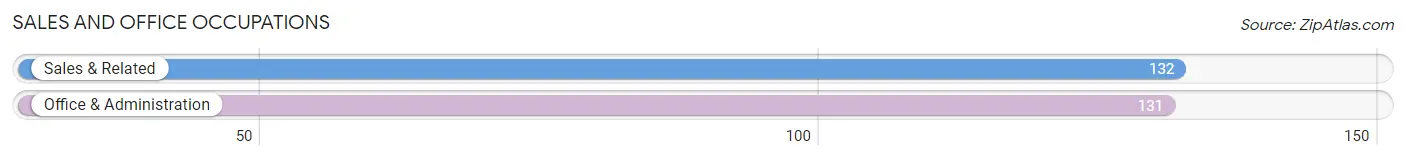
Sales and Office Occupations
The most common Sales and Office occupations in Carnation are Sales & Related (132 | 9.4%), and Office & Administration (131 | 9.3%).
Sales and Office Occupations by Sex
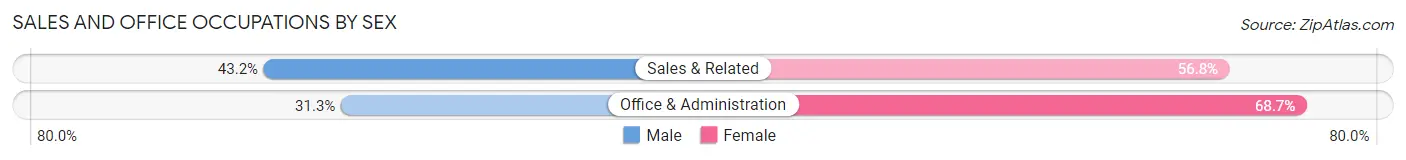
| Occupation | Male | Female |
| Sales & Related | 57 (43.2%) | 75 (56.8%) |
| Office & Administration | 41 (31.3%) | 90 (68.7%) |
| Total (Category) | 98 (37.3%) | 165 (62.7%) |
| Total (Overall) | 735 (52.3%) | 670 (47.7%) |
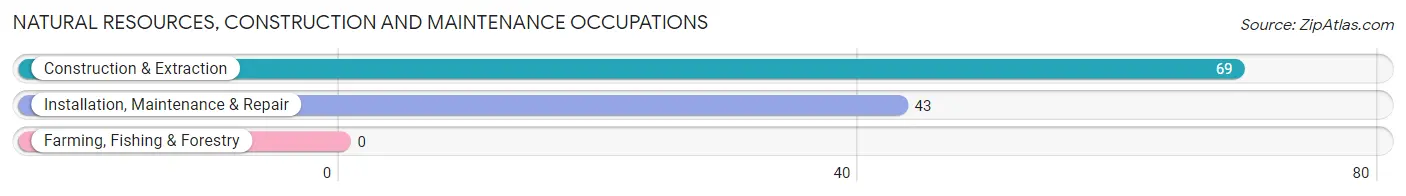
Natural Resources, Construction and Maintenance Occupations
The most common Natural Resources, Construction and Maintenance occupations in Carnation are Construction & Extraction (69 | 4.9%), and Installation, Maintenance & Repair (43 | 3.1%).
Natural Resources, Construction and Maintenance Occupations by Sex
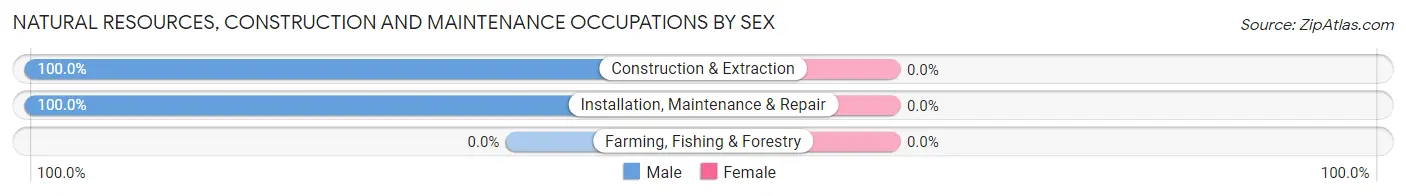
| Occupation | Male | Female |
| Farming, Fishing & Forestry | 0 (0.0%) | 0 (0.0%) |
| Construction & Extraction | 69 (100.0%) | 0 (0.0%) |
| Installation, Maintenance & Repair | 43 (100.0%) | 0 (0.0%) |
| Total (Category) | 112 (100.0%) | 0 (0.0%) |
| Total (Overall) | 735 (52.3%) | 670 (47.7%) |
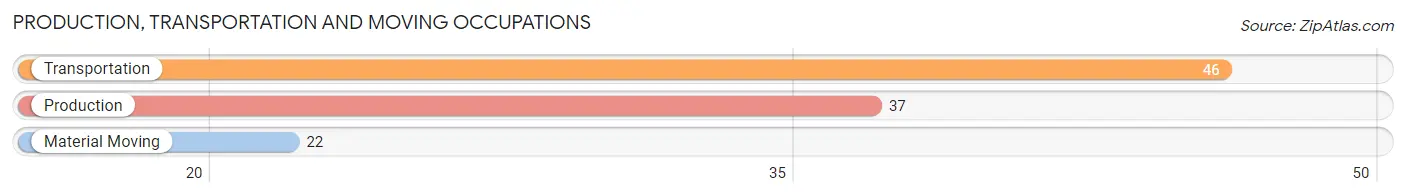
Production, Transportation and Moving Occupations
The most common Production, Transportation and Moving occupations in Carnation are Transportation (46 | 3.3%), Production (37 | 2.6%), and Material Moving (22 | 1.6%).
Production, Transportation and Moving Occupations by Sex
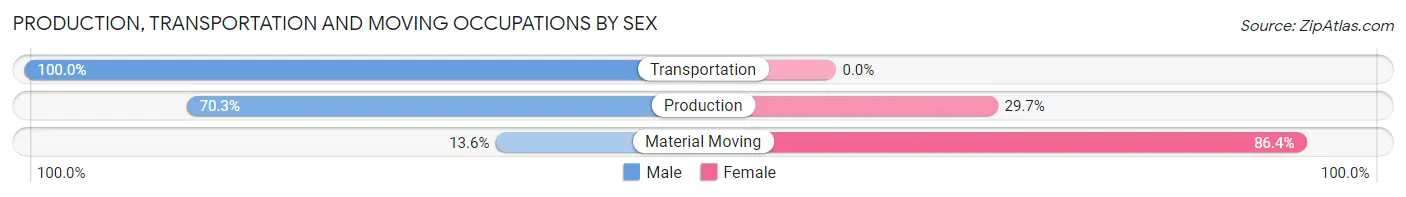
| Occupation | Male | Female |
| Production | 26 (70.3%) | 11 (29.7%) |
| Transportation | 46 (100.0%) | 0 (0.0%) |
| Material Moving | 3 (13.6%) | 19 (86.4%) |
| Total (Category) | 75 (71.4%) | 30 (28.6%) |
| Total (Overall) | 735 (52.3%) | 670 (47.7%) |
Employment Industries by Sex in Carnation
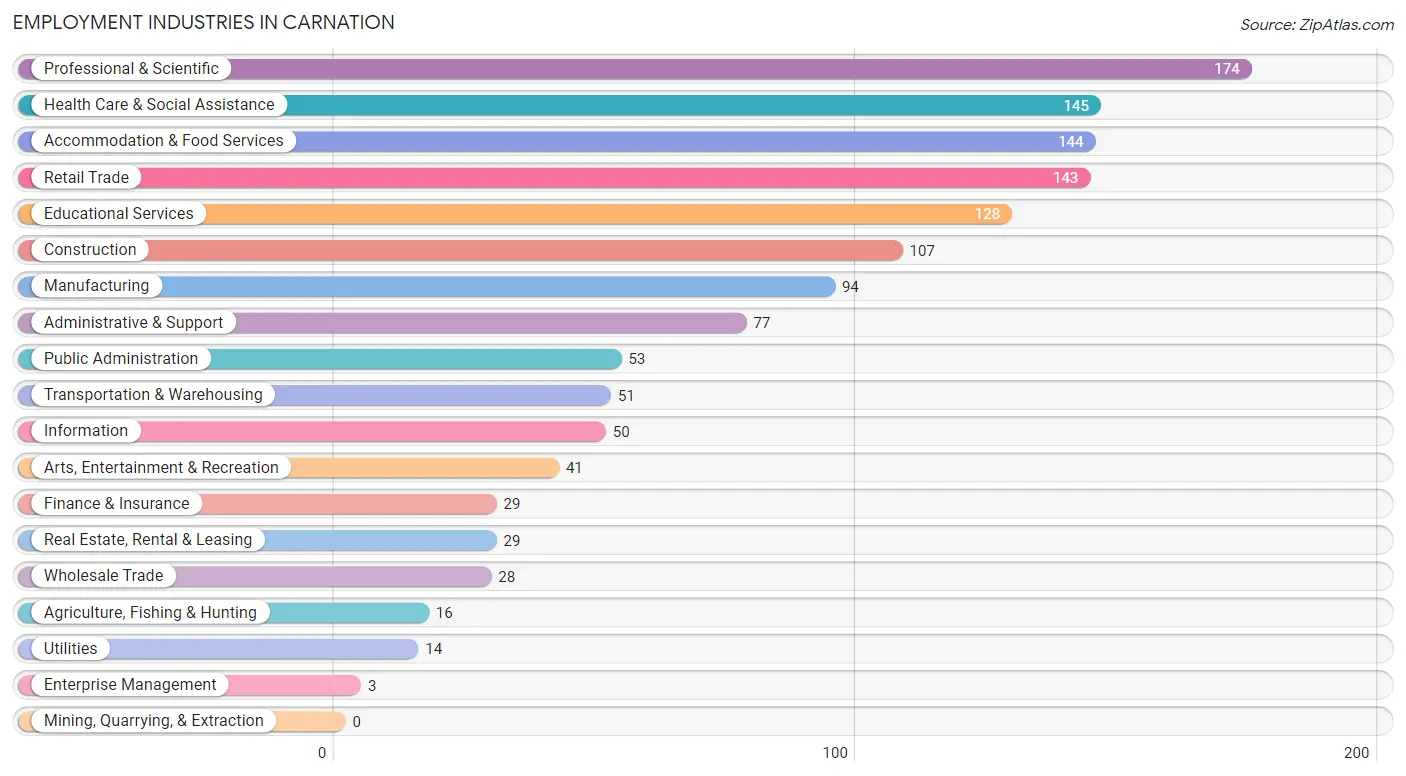
Employment Industries in Carnation
The major employment industries in Carnation include Professional & Scientific (174 | 12.4%), Health Care & Social Assistance (145 | 10.3%), Accommodation & Food Services (144 | 10.2%), Retail Trade (143 | 10.2%), and Educational Services (128 | 9.1%).
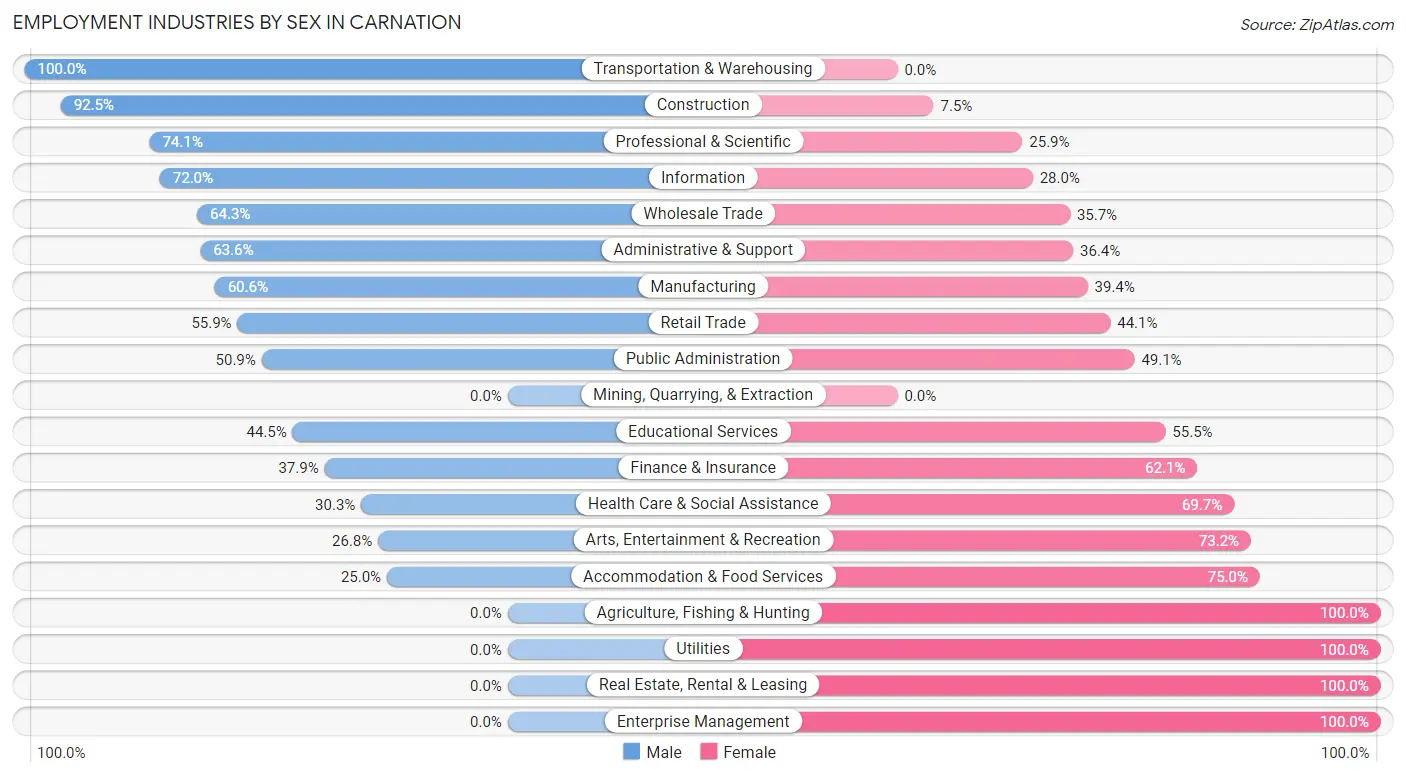
Employment Industries by Sex in Carnation
The Carnation industries that see more men than women are Transportation & Warehousing (100.0%), Construction (92.5%), and Professional & Scientific (74.1%), whereas the industries that tend to have a higher number of women are Agriculture, Fishing & Hunting (100.0%), Utilities (100.0%), and Real Estate, Rental & Leasing (100.0%).
| Industry | Male | Female |
| Agriculture, Fishing & Hunting | 0 (0.0%) | 16 (100.0%) |
| Mining, Quarrying, & Extraction | 0 (0.0%) | 0 (0.0%) |
| Construction | 99 (92.5%) | 8 (7.5%) |
| Manufacturing | 57 (60.6%) | 37 (39.4%) |
| Wholesale Trade | 18 (64.3%) | 10 (35.7%) |
| Retail Trade | 80 (55.9%) | 63 (44.1%) |
| Transportation & Warehousing | 51 (100.0%) | 0 (0.0%) |
| Utilities | 0 (0.0%) | 14 (100.0%) |
| Information | 36 (72.0%) | 14 (28.0%) |
| Finance & Insurance | 11 (37.9%) | 18 (62.1%) |
| Real Estate, Rental & Leasing | 0 (0.0%) | 29 (100.0%) |
| Professional & Scientific | 129 (74.1%) | 45 (25.9%) |
| Enterprise Management | 0 (0.0%) | 3 (100.0%) |
| Administrative & Support | 49 (63.6%) | 28 (36.4%) |
| Educational Services | 57 (44.5%) | 71 (55.5%) |
| Health Care & Social Assistance | 44 (30.3%) | 101 (69.7%) |
| Arts, Entertainment & Recreation | 11 (26.8%) | 30 (73.2%) |
| Accommodation & Food Services | 36 (25.0%) | 108 (75.0%) |
| Public Administration | 27 (50.9%) | 26 (49.1%) |
| Total | 735 (52.3%) | 670 (47.7%) |
Education in Carnation
School Enrollment in Carnation
The most common levels of schooling among the 659 students in Carnation are high school (165 | 25.0%), middle school (158 | 24.0%), and elementary school (120 | 18.2%).
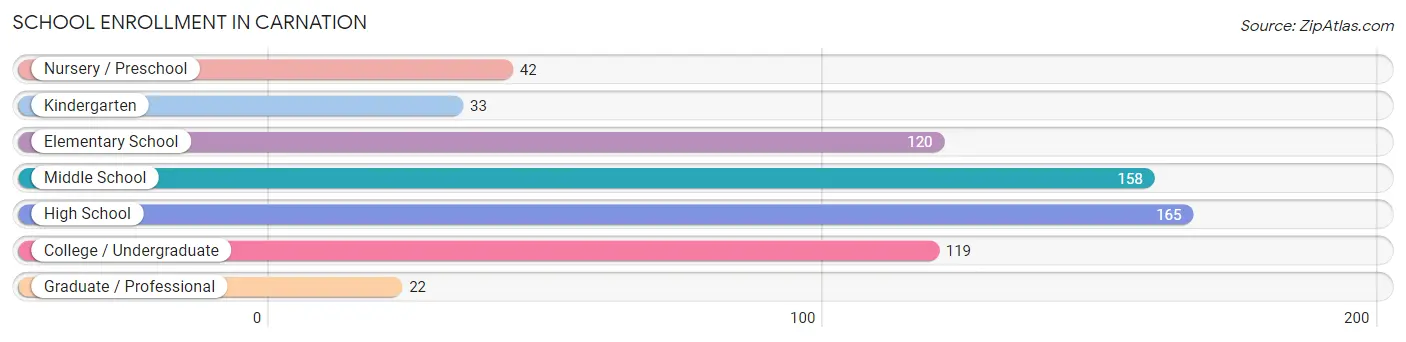
| School Level | # Students | % Students |
| Nursery / Preschool | 42 | 6.4% |
| Kindergarten | 33 | 5.0% |
| Elementary School | 120 | 18.2% |
| Middle School | 158 | 24.0% |
| High School | 165 | 25.0% |
| College / Undergraduate | 119 | 18.1% |
| Graduate / Professional | 22 | 3.3% |
| Total | 659 | 100.0% |
School Enrollment by Age by Funding Source in Carnation
Out of a total of 659 students who are enrolled in schools in Carnation, 134 (20.3%) attend a private institution, while the remaining 525 (79.7%) are enrolled in public schools. The age group of 3 to 4 year olds has the highest likelihood of being enrolled in private schools, with 35 (100.0% in the age bracket) enrolled. Conversely, the age group of 20 to 24 year olds has the lowest likelihood of being enrolled in a private school, with 86 (100.0% in the age bracket) attending a public institution.
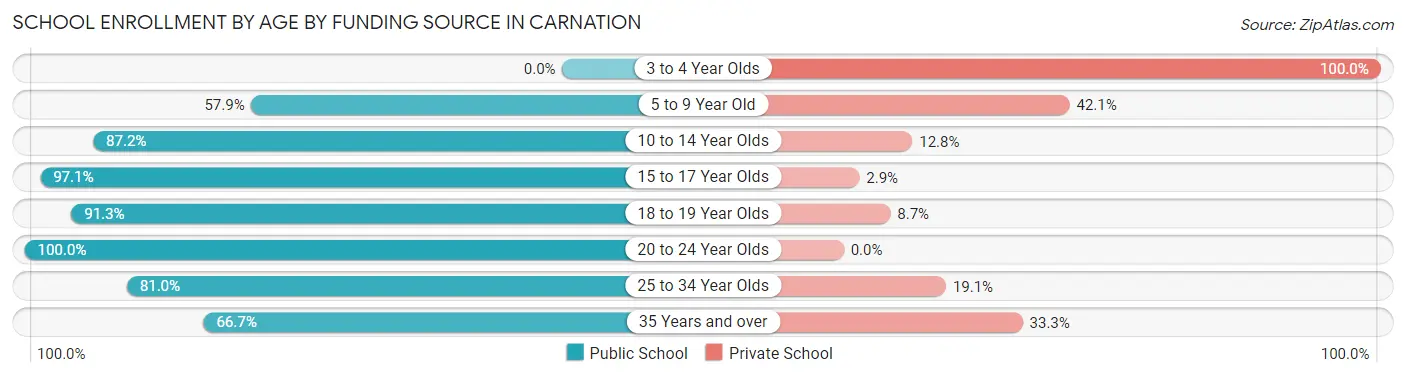
| Age Bracket | Public School | Private School |
| 3 to 4 Year Olds | 0 (0.0%) | 35 (100.0%) |
| 5 to 9 Year Old | 84 (57.9%) | 61 (42.1%) |
| 10 to 14 Year Olds | 157 (87.2%) | 23 (12.8%) |
| 15 to 17 Year Olds | 133 (97.1%) | 4 (2.9%) |
| 18 to 19 Year Olds | 42 (91.3%) | 4 (8.7%) |
| 20 to 24 Year Olds | 86 (100.0%) | 0 (0.0%) |
| 25 to 34 Year Olds | 17 (80.9%) | 4 (19.1%) |
| 35 Years and over | 6 (66.7%) | 3 (33.3%) |
| Total | 525 (79.7%) | 134 (20.3%) |
Educational Attainment by Field of Study in Carnation
Engineering (126 | 15.2%), computers & mathematics (122 | 14.7%), business (106 | 12.8%), education (80 | 9.7%), and arts & humanities (68 | 8.2%) are the most common fields of study among 829 individuals in Carnation who have obtained a bachelor's degree or higher.
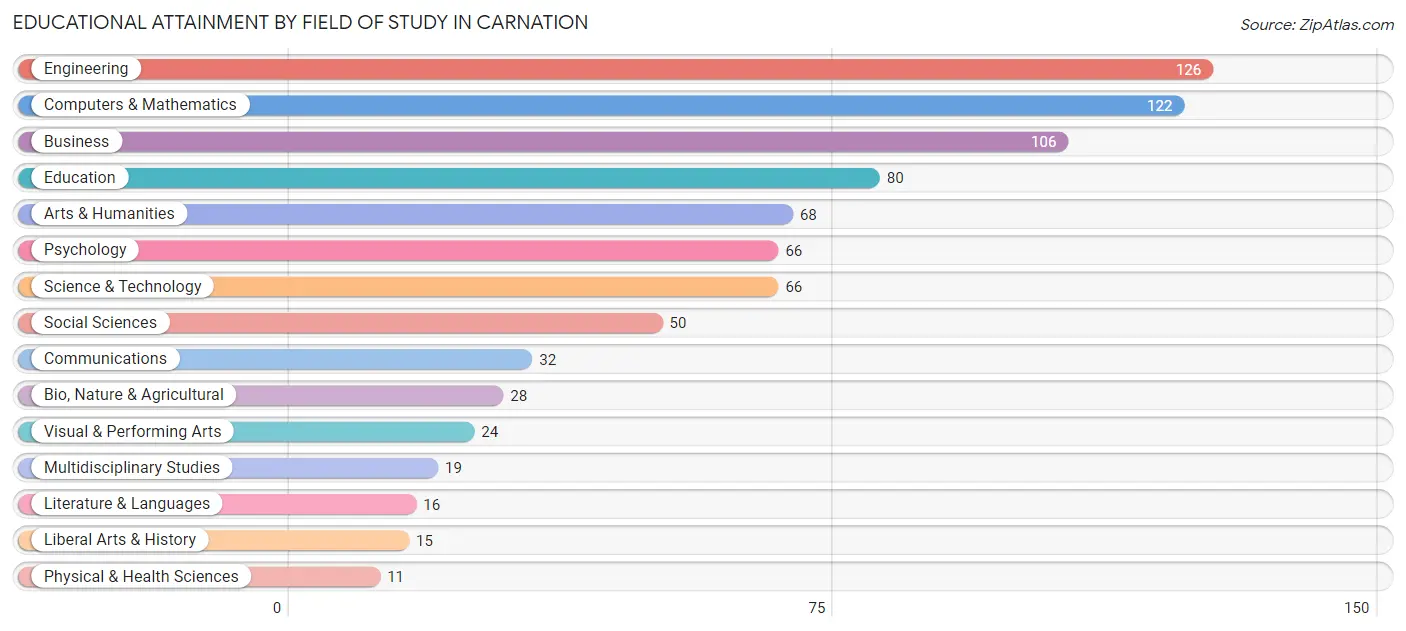
| Field of Study | # Graduates | % Graduates |
| Computers & Mathematics | 122 | 14.7% |
| Bio, Nature & Agricultural | 28 | 3.4% |
| Physical & Health Sciences | 11 | 1.3% |
| Psychology | 66 | 8.0% |
| Social Sciences | 50 | 6.0% |
| Engineering | 126 | 15.2% |
| Multidisciplinary Studies | 19 | 2.3% |
| Science & Technology | 66 | 8.0% |
| Business | 106 | 12.8% |
| Education | 80 | 9.7% |
| Literature & Languages | 16 | 1.9% |
| Liberal Arts & History | 15 | 1.8% |
| Visual & Performing Arts | 24 | 2.9% |
| Communications | 32 | 3.9% |
| Arts & Humanities | 68 | 8.2% |
| Total | 829 | 100.0% |
Transportation & Commute in Carnation
Vehicle Availability by Sex in Carnation
The most prevalent vehicle ownership categories in Carnation are males with 2 vehicles (282, accounting for 38.4%) and females with 2 vehicles (241, making up 45.1%).
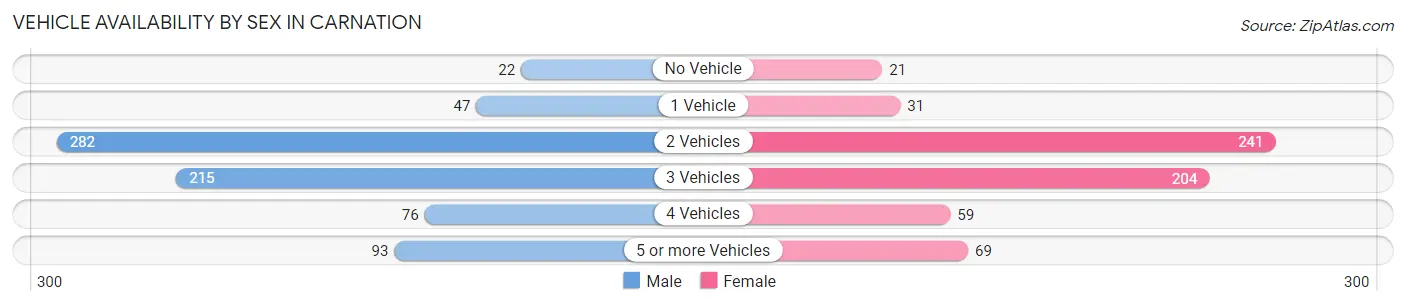
| Vehicles Available | Male | Female |
| No Vehicle | 22 (3.0%) | 21 (3.4%) |
| 1 Vehicle | 47 (6.4%) | 31 (5.0%) |
| 2 Vehicles | 282 (38.4%) | 241 (38.6%) |
| 3 Vehicles | 215 (29.2%) | 204 (32.6%) |
| 4 Vehicles | 76 (10.3%) | 59 (9.4%) |
| 5 or more Vehicles | 93 (12.7%) | 69 (11.0%) |
| Total | 735 (100.0%) | 625 (100.0%) |
Commute Time in Carnation
The most frequently occuring commute durations in Carnation are 45 to 59 minutes (212 commuters, 19.4%), 30 to 34 minutes (159 commuters, 14.5%), and 20 to 24 minutes (127 commuters, 11.6%).
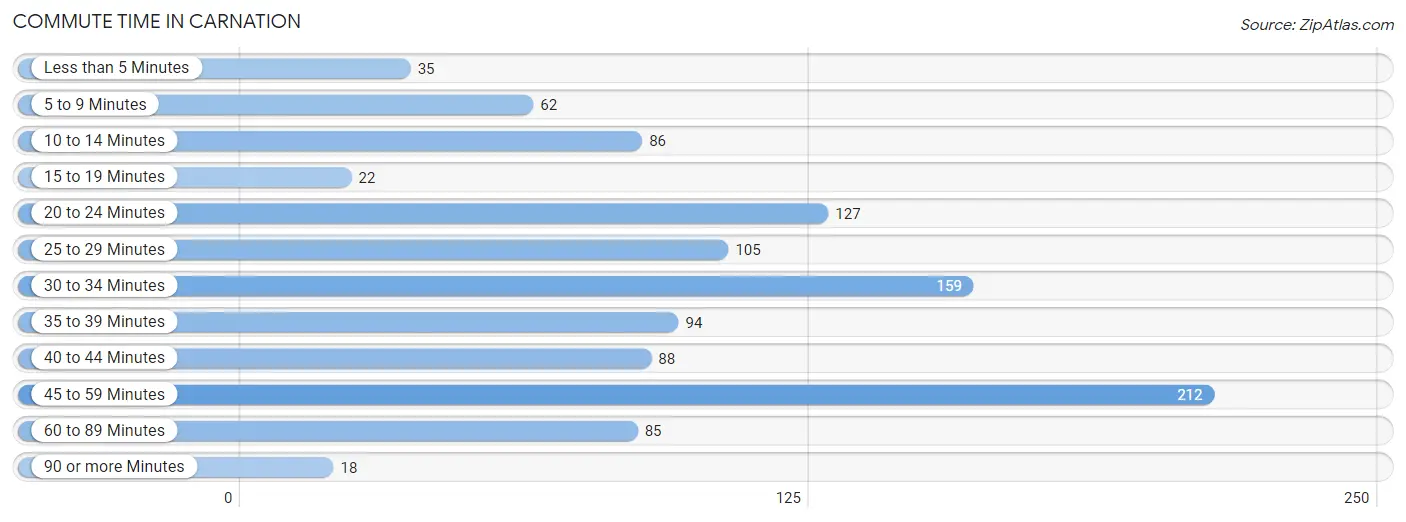
| Commute Time | # Commuters | % Commuters |
| Less than 5 Minutes | 35 | 3.2% |
| 5 to 9 Minutes | 62 | 5.7% |
| 10 to 14 Minutes | 86 | 7.9% |
| 15 to 19 Minutes | 22 | 2.0% |
| 20 to 24 Minutes | 127 | 11.6% |
| 25 to 29 Minutes | 105 | 9.6% |
| 30 to 34 Minutes | 159 | 14.5% |
| 35 to 39 Minutes | 94 | 8.6% |
| 40 to 44 Minutes | 88 | 8.1% |
| 45 to 59 Minutes | 212 | 19.4% |
| 60 to 89 Minutes | 85 | 7.8% |
| 90 or more Minutes | 18 | 1.7% |
Commute Time by Sex in Carnation
The most common commute times in Carnation are 45 to 59 minutes (122 commuters, 21.2%) for males and 45 to 59 minutes (90 commuters, 17.4%) for females.
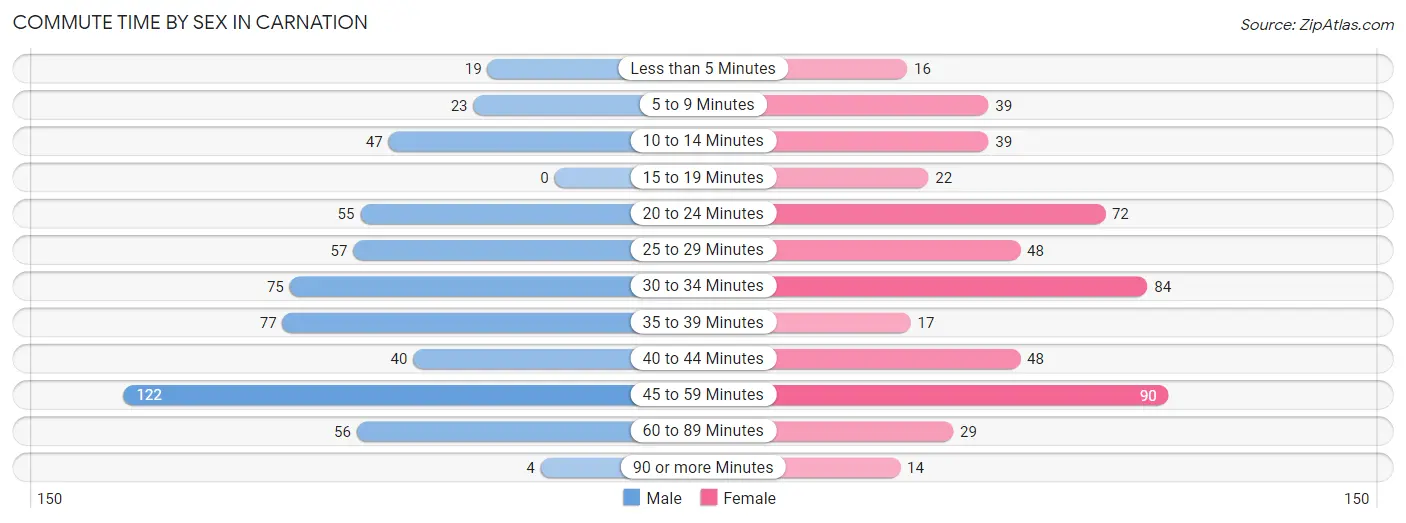
| Commute Time | Male | Female |
| Less than 5 Minutes | 19 (3.3%) | 16 (3.1%) |
| 5 to 9 Minutes | 23 (4.0%) | 39 (7.5%) |
| 10 to 14 Minutes | 47 (8.2%) | 39 (7.5%) |
| 15 to 19 Minutes | 0 (0.0%) | 22 (4.3%) |
| 20 to 24 Minutes | 55 (9.6%) | 72 (13.9%) |
| 25 to 29 Minutes | 57 (9.9%) | 48 (9.3%) |
| 30 to 34 Minutes | 75 (13.0%) | 84 (16.2%) |
| 35 to 39 Minutes | 77 (13.4%) | 17 (3.3%) |
| 40 to 44 Minutes | 40 (7.0%) | 48 (9.3%) |
| 45 to 59 Minutes | 122 (21.2%) | 90 (17.4%) |
| 60 to 89 Minutes | 56 (9.7%) | 29 (5.6%) |
| 90 or more Minutes | 4 (0.7%) | 14 (2.7%) |
Time of Departure to Work by Sex in Carnation
The most frequent times of departure to work in Carnation are 9:00 AM to 9:59 AM (88, 15.3%) for males and 8:00 AM to 8:29 AM (100, 19.3%) for females.
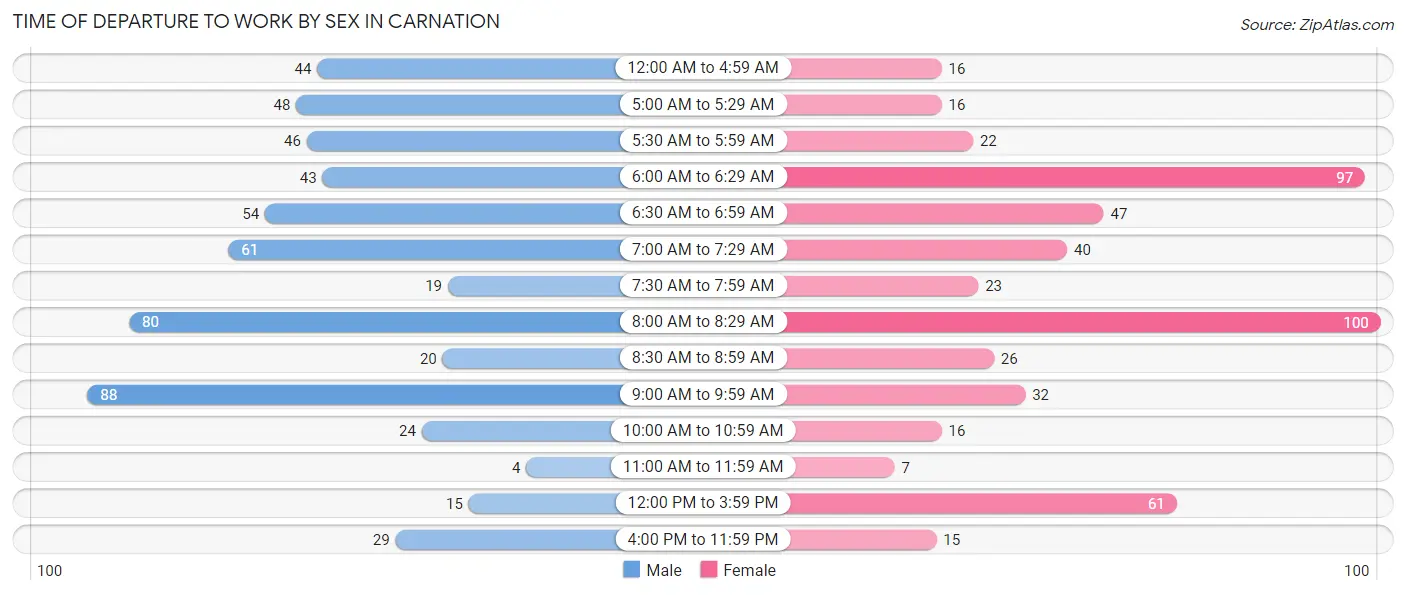
| Time of Departure | Male | Female |
| 12:00 AM to 4:59 AM | 44 (7.6%) | 16 (3.1%) |
| 5:00 AM to 5:29 AM | 48 (8.4%) | 16 (3.1%) |
| 5:30 AM to 5:59 AM | 46 (8.0%) | 22 (4.3%) |
| 6:00 AM to 6:29 AM | 43 (7.5%) | 97 (18.7%) |
| 6:30 AM to 6:59 AM | 54 (9.4%) | 47 (9.1%) |
| 7:00 AM to 7:29 AM | 61 (10.6%) | 40 (7.7%) |
| 7:30 AM to 7:59 AM | 19 (3.3%) | 23 (4.4%) |
| 8:00 AM to 8:29 AM | 80 (13.9%) | 100 (19.3%) |
| 8:30 AM to 8:59 AM | 20 (3.5%) | 26 (5.0%) |
| 9:00 AM to 9:59 AM | 88 (15.3%) | 32 (6.2%) |
| 10:00 AM to 10:59 AM | 24 (4.2%) | 16 (3.1%) |
| 11:00 AM to 11:59 AM | 4 (0.7%) | 7 (1.3%) |
| 12:00 PM to 3:59 PM | 15 (2.6%) | 61 (11.8%) |
| 4:00 PM to 11:59 PM | 29 (5.0%) | 15 (2.9%) |
| Total | 575 (100.0%) | 518 (100.0%) |
Housing Occupancy in Carnation
Occupancy by Ownership in Carnation
Of the total 845 dwellings in Carnation, owner-occupied units account for 726 (85.9%), while renter-occupied units make up 119 (14.1%).
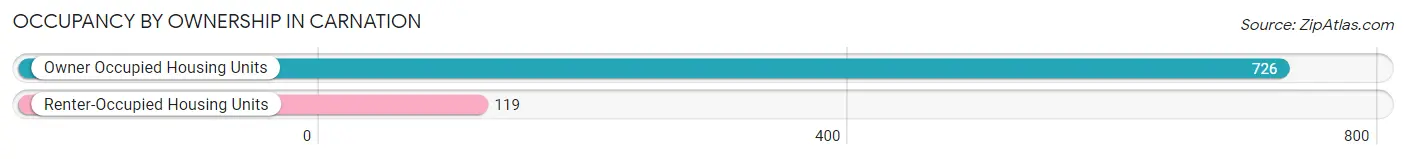
| Occupancy | # Housing Units | % Housing Units |
| Owner Occupied Housing Units | 726 | 85.9% |
| Renter-Occupied Housing Units | 119 | 14.1% |
| Total Occupied Housing Units | 845 | 100.0% |
Occupancy by Household Size in Carnation
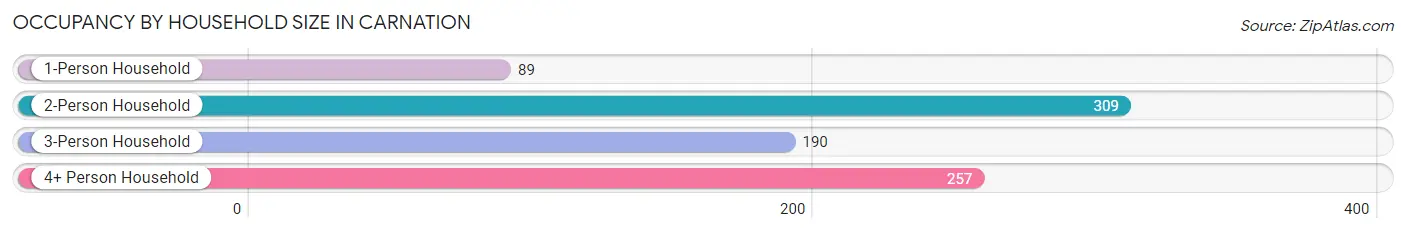
| Household Size | # Housing Units | % Housing Units |
| 1-Person Household | 89 | 10.5% |
| 2-Person Household | 309 | 36.6% |
| 3-Person Household | 190 | 22.5% |
| 4+ Person Household | 257 | 30.4% |
| Total Housing Units | 845 | 100.0% |
Occupancy by Ownership by Household Size in Carnation
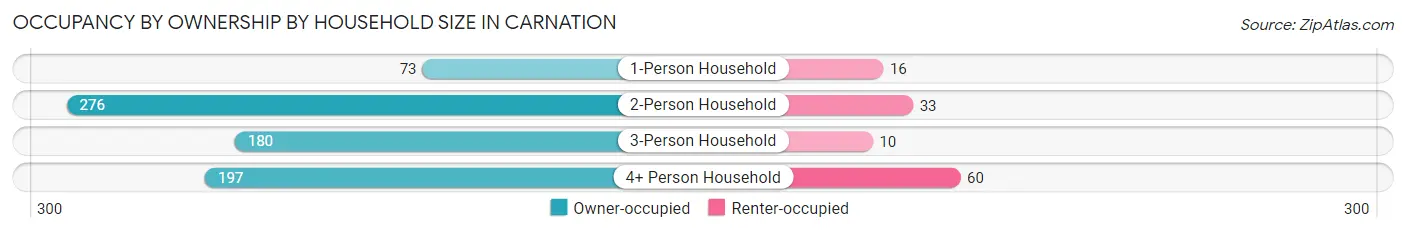
| Household Size | Owner-occupied | Renter-occupied |
| 1-Person Household | 73 (82.0%) | 16 (18.0%) |
| 2-Person Household | 276 (89.3%) | 33 (10.7%) |
| 3-Person Household | 180 (94.7%) | 10 (5.3%) |
| 4+ Person Household | 197 (76.6%) | 60 (23.4%) |
| Total Housing Units | 726 (85.9%) | 119 (14.1%) |
Occupancy by Educational Attainment in Carnation
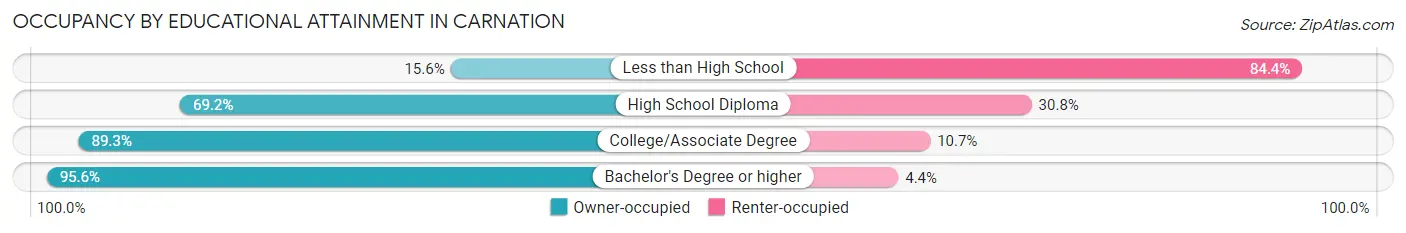
| Household Size | Owner-occupied | Renter-occupied |
| Less than High School | 7 (15.6%) | 38 (84.4%) |
| High School Diploma | 83 (69.2%) | 37 (30.8%) |
| College/Associate Degree | 200 (89.3%) | 24 (10.7%) |
| Bachelor's Degree or higher | 436 (95.6%) | 20 (4.4%) |
Occupancy by Age of Householder in Carnation

| Age Bracket | # Households | % Households |
| Under 35 Years | 106 | 12.5% |
| 35 to 44 Years | 209 | 24.7% |
| 45 to 54 Years | 170 | 20.1% |
| 55 to 64 Years | 196 | 23.2% |
| 65 to 74 Years | 136 | 16.1% |
| 75 to 84 Years | 9 | 1.1% |
| 85 Years and Over | 19 | 2.2% |
| Total | 845 | 100.0% |
Housing Finances in Carnation
Median Income by Occupancy in Carnation
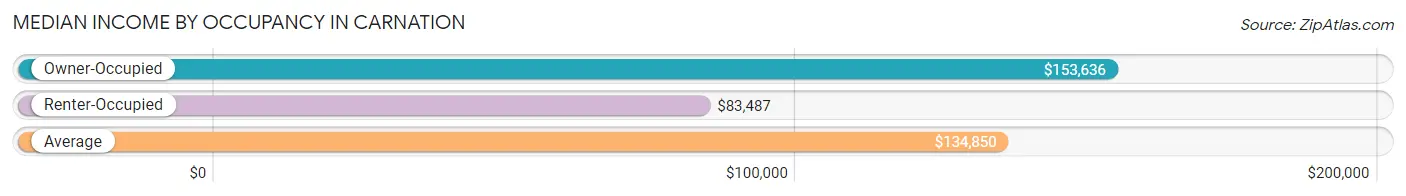
| Occupancy Type | # Households | Median Income |
| Owner-Occupied | 726 (85.9%) | $153,636 |
| Renter-Occupied | 119 (14.1%) | $83,487 |
| Average | 845 (100.0%) | $134,850 |
Occupancy by Householder Income Bracket in Carnation
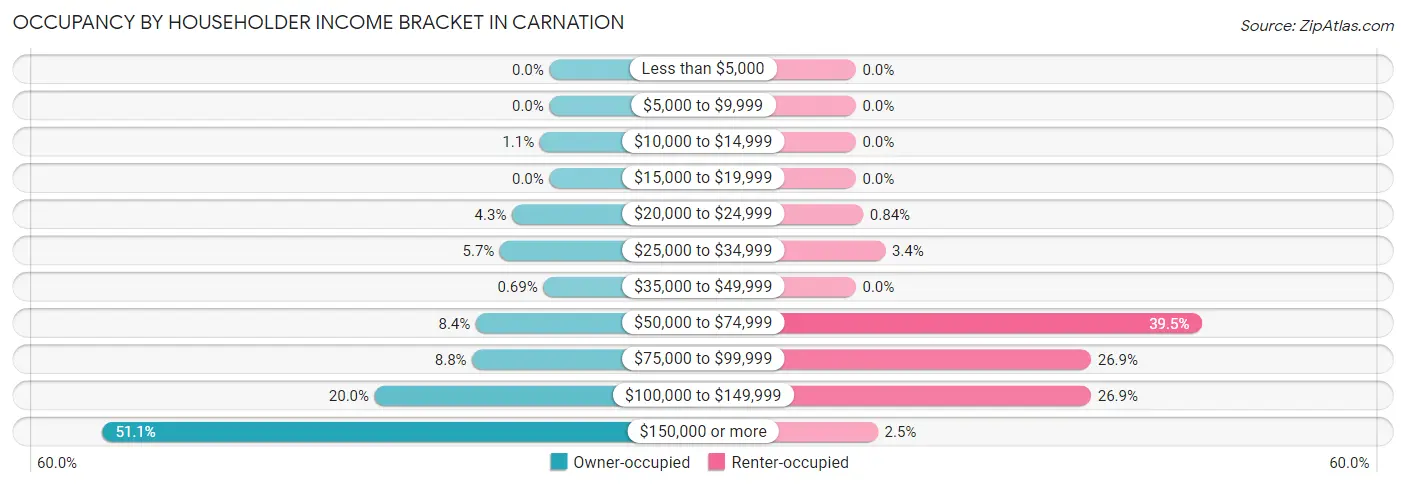
| Income Bracket | Owner-occupied | Renter-occupied |
| Less than $5,000 | 0 (0.0%) | 0 (0.0%) |
| $5,000 to $9,999 | 0 (0.0%) | 0 (0.0%) |
| $10,000 to $14,999 | 8 (1.1%) | 0 (0.0%) |
| $15,000 to $19,999 | 0 (0.0%) | 0 (0.0%) |
| $20,000 to $24,999 | 31 (4.3%) | 1 (0.8%) |
| $25,000 to $34,999 | 41 (5.7%) | 4 (3.4%) |
| $35,000 to $49,999 | 5 (0.7%) | 0 (0.0%) |
| $50,000 to $74,999 | 61 (8.4%) | 47 (39.5%) |
| $75,000 to $99,999 | 64 (8.8%) | 32 (26.9%) |
| $100,000 to $149,999 | 145 (20.0%) | 32 (26.9%) |
| $150,000 or more | 371 (51.1%) | 3 (2.5%) |
| Total | 726 (100.0%) | 119 (100.0%) |
Monthly Housing Cost Tiers in Carnation
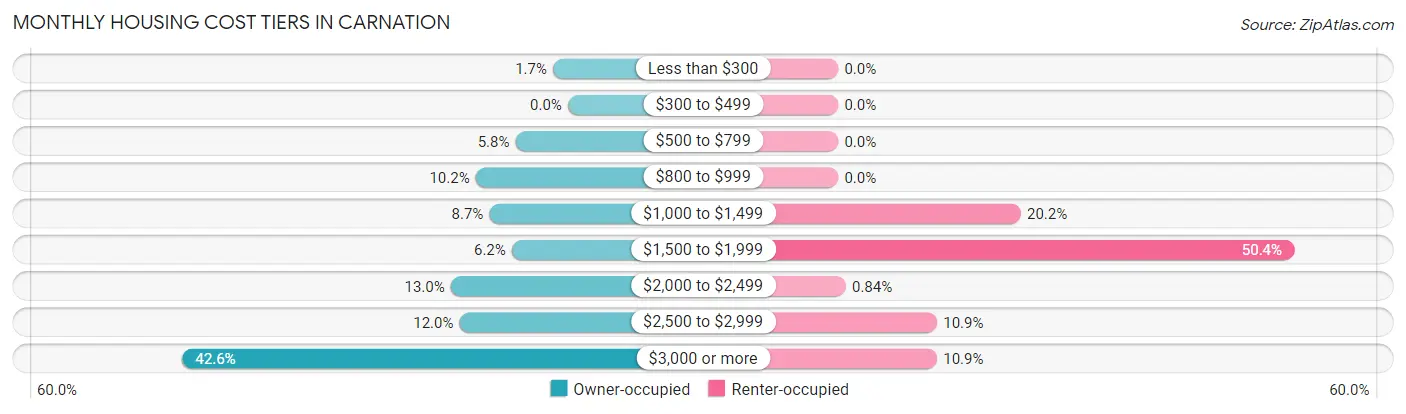
| Monthly Cost | Owner-occupied | Renter-occupied |
| Less than $300 | 12 (1.7%) | 0 (0.0%) |
| $300 to $499 | 0 (0.0%) | 0 (0.0%) |
| $500 to $799 | 42 (5.8%) | 0 (0.0%) |
| $800 to $999 | 74 (10.2%) | 0 (0.0%) |
| $1,000 to $1,499 | 63 (8.7%) | 24 (20.2%) |
| $1,500 to $1,999 | 45 (6.2%) | 60 (50.4%) |
| $2,000 to $2,499 | 94 (13.0%) | 1 (0.8%) |
| $2,500 to $2,999 | 87 (12.0%) | 13 (10.9%) |
| $3,000 or more | 309 (42.6%) | 13 (10.9%) |
| Total | 726 (100.0%) | 119 (100.0%) |
Physical Housing Characteristics in Carnation
Housing Structures in Carnation
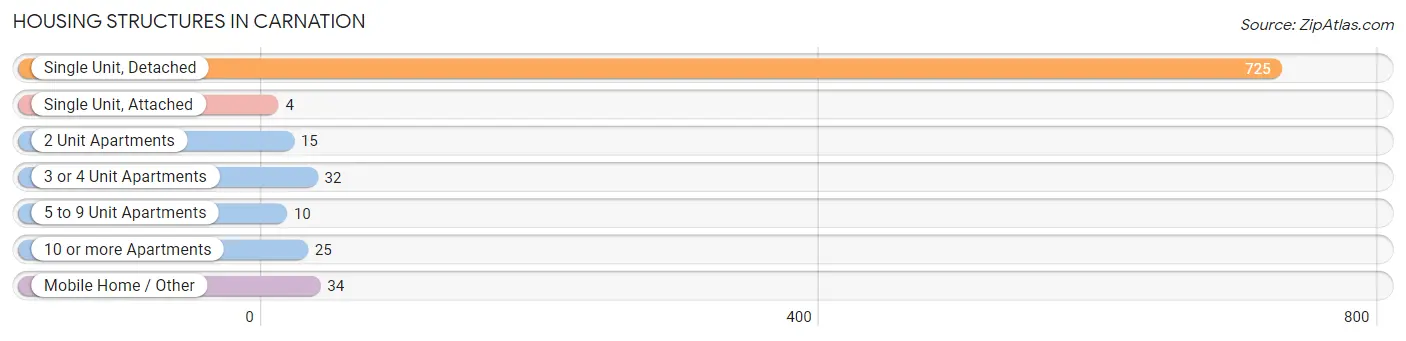
| Structure Type | # Housing Units | % Housing Units |
| Single Unit, Detached | 725 | 85.8% |
| Single Unit, Attached | 4 | 0.5% |
| 2 Unit Apartments | 15 | 1.8% |
| 3 or 4 Unit Apartments | 32 | 3.8% |
| 5 to 9 Unit Apartments | 10 | 1.2% |
| 10 or more Apartments | 25 | 3.0% |
| Mobile Home / Other | 34 | 4.0% |
| Total | 845 | 100.0% |
Housing Structures by Occupancy in Carnation
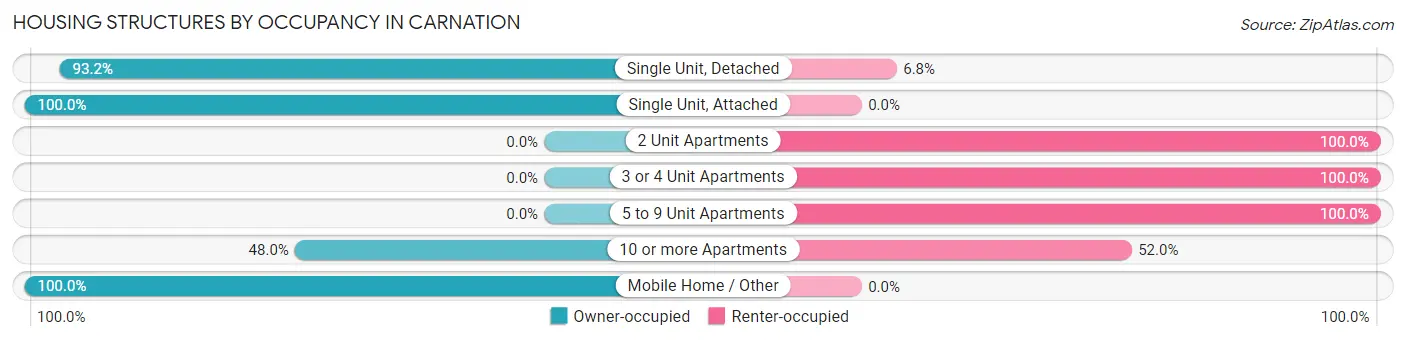
| Structure Type | Owner-occupied | Renter-occupied |
| Single Unit, Detached | 676 (93.2%) | 49 (6.8%) |
| Single Unit, Attached | 4 (100.0%) | 0 (0.0%) |
| 2 Unit Apartments | 0 (0.0%) | 15 (100.0%) |
| 3 or 4 Unit Apartments | 0 (0.0%) | 32 (100.0%) |
| 5 to 9 Unit Apartments | 0 (0.0%) | 10 (100.0%) |
| 10 or more Apartments | 12 (48.0%) | 13 (52.0%) |
| Mobile Home / Other | 34 (100.0%) | 0 (0.0%) |
| Total | 726 (85.9%) | 119 (14.1%) |
Housing Structures by Number of Rooms in Carnation
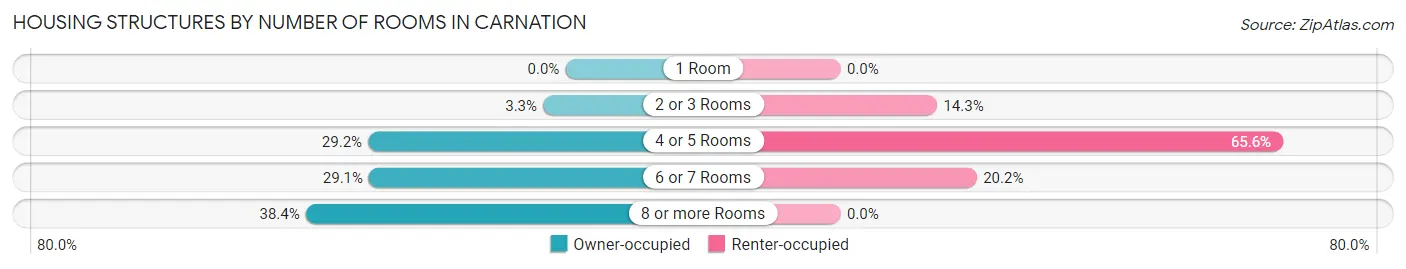
| Number of Rooms | Owner-occupied | Renter-occupied |
| 1 Room | 0 (0.0%) | 0 (0.0%) |
| 2 or 3 Rooms | 24 (3.3%) | 17 (14.3%) |
| 4 or 5 Rooms | 212 (29.2%) | 78 (65.5%) |
| 6 or 7 Rooms | 211 (29.1%) | 24 (20.2%) |
| 8 or more Rooms | 279 (38.4%) | 0 (0.0%) |
| Total | 726 (100.0%) | 119 (100.0%) |
Housing Structure by Heating Type in Carnation
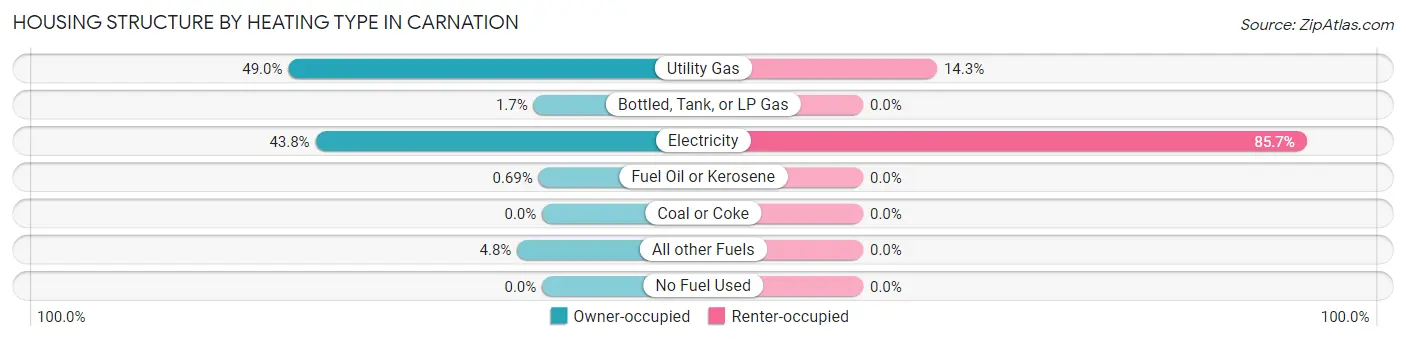
| Heating Type | Owner-occupied | Renter-occupied |
| Utility Gas | 356 (49.0%) | 17 (14.3%) |
| Bottled, Tank, or LP Gas | 12 (1.7%) | 0 (0.0%) |
| Electricity | 318 (43.8%) | 102 (85.7%) |
| Fuel Oil or Kerosene | 5 (0.7%) | 0 (0.0%) |
| Coal or Coke | 0 (0.0%) | 0 (0.0%) |
| All other Fuels | 35 (4.8%) | 0 (0.0%) |
| No Fuel Used | 0 (0.0%) | 0 (0.0%) |
| Total | 726 (100.0%) | 119 (100.0%) |
Household Vehicle Usage in Carnation
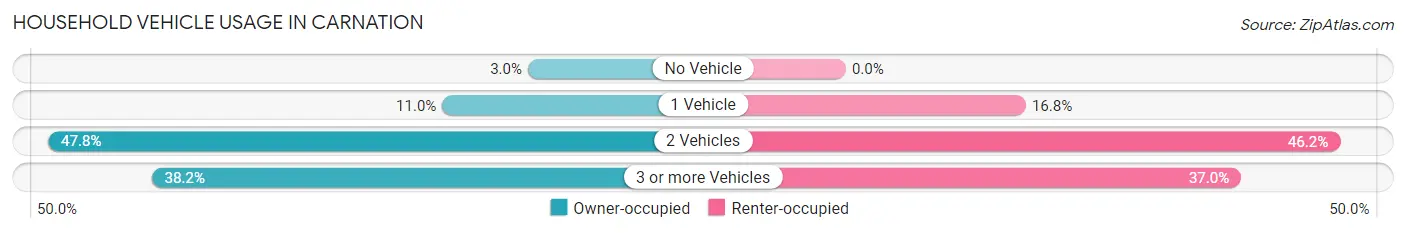
| Vehicles per Household | Owner-occupied | Renter-occupied |
| No Vehicle | 22 (3.0%) | 0 (0.0%) |
| 1 Vehicle | 80 (11.0%) | 20 (16.8%) |
| 2 Vehicles | 347 (47.8%) | 55 (46.2%) |
| 3 or more Vehicles | 277 (38.2%) | 44 (37.0%) |
| Total | 726 (100.0%) | 119 (100.0%) |
Real Estate & Mortgages in Carnation
Real Estate and Mortgage Overview in Carnation
| Characteristic | Without Mortgage | With Mortgage |
| Housing Units | 168 | 558 |
| Median Property Value | $553,600 | $782,300 |
| Median Household Income | $91,071 | $331 |
| Monthly Housing Costs | $942 | $309 |
| Real Estate Taxes | $6,204 | $0 |
Property Value by Mortgage Status in Carnation
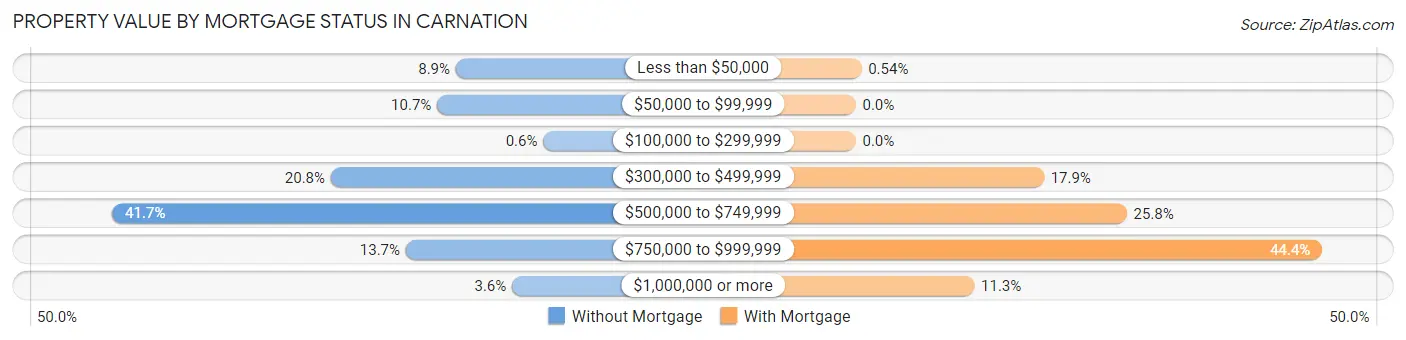
| Property Value | Without Mortgage | With Mortgage |
| Less than $50,000 | 15 (8.9%) | 3 (0.5%) |
| $50,000 to $99,999 | 18 (10.7%) | 0 (0.0%) |
| $100,000 to $299,999 | 1 (0.6%) | 0 (0.0%) |
| $300,000 to $499,999 | 35 (20.8%) | 100 (17.9%) |
| $500,000 to $749,999 | 70 (41.7%) | 144 (25.8%) |
| $750,000 to $999,999 | 23 (13.7%) | 248 (44.4%) |
| $1,000,000 or more | 6 (3.6%) | 63 (11.3%) |
| Total | 168 (100.0%) | 558 (100.0%) |
Household Income by Mortgage Status in Carnation
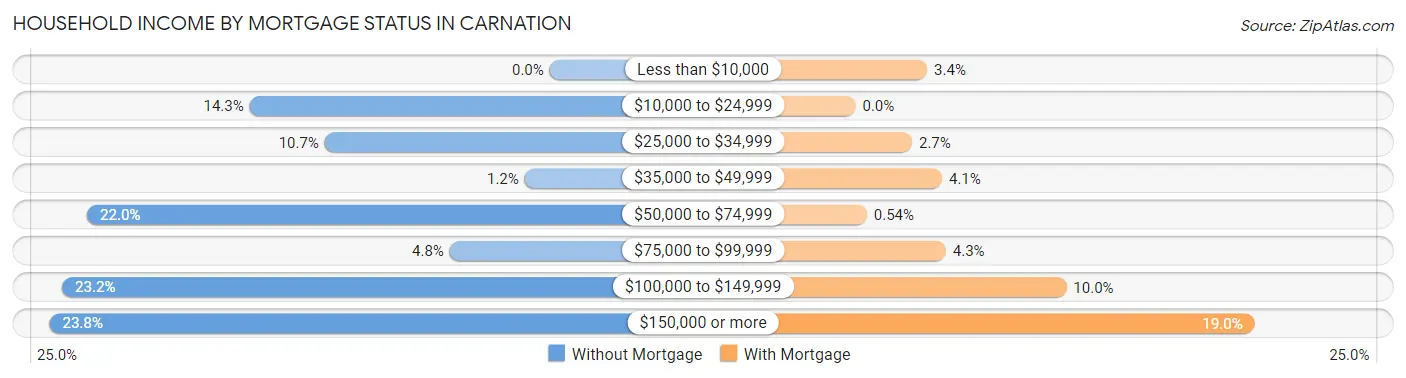
| Household Income | Without Mortgage | With Mortgage |
| Less than $10,000 | 0 (0.0%) | 19 (3.4%) |
| $10,000 to $24,999 | 24 (14.3%) | 0 (0.0%) |
| $25,000 to $34,999 | 18 (10.7%) | 15 (2.7%) |
| $35,000 to $49,999 | 2 (1.2%) | 23 (4.1%) |
| $50,000 to $74,999 | 37 (22.0%) | 3 (0.5%) |
| $75,000 to $99,999 | 8 (4.8%) | 24 (4.3%) |
| $100,000 to $149,999 | 39 (23.2%) | 56 (10.0%) |
| $150,000 or more | 40 (23.8%) | 106 (19.0%) |
| Total | 168 (100.0%) | 558 (100.0%) |
Property Value to Household Income Ratio in Carnation
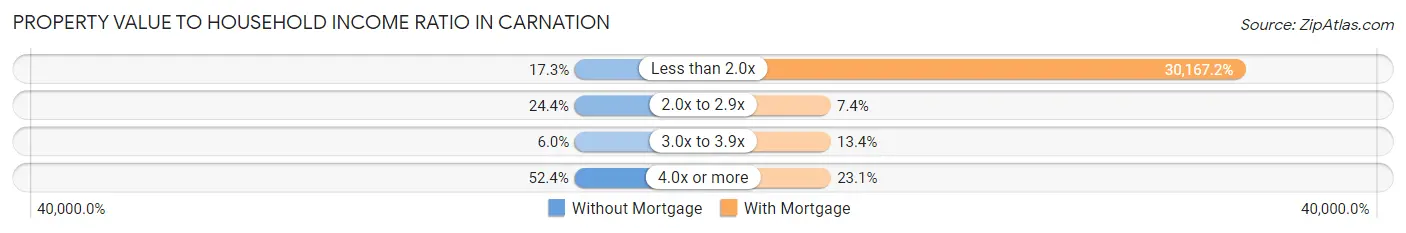
| Value-to-Income Ratio | Without Mortgage | With Mortgage |
| Less than 2.0x | 29 (17.3%) | 168,333 (30,167.2%) |
| 2.0x to 2.9x | 41 (24.4%) | 41 (7.3%) |
| 3.0x to 3.9x | 10 (5.9%) | 75 (13.4%) |
| 4.0x or more | 88 (52.4%) | 129 (23.1%) |
| Total | 168 (100.0%) | 558 (100.0%) |
Real Estate Taxes by Mortgage Status in Carnation
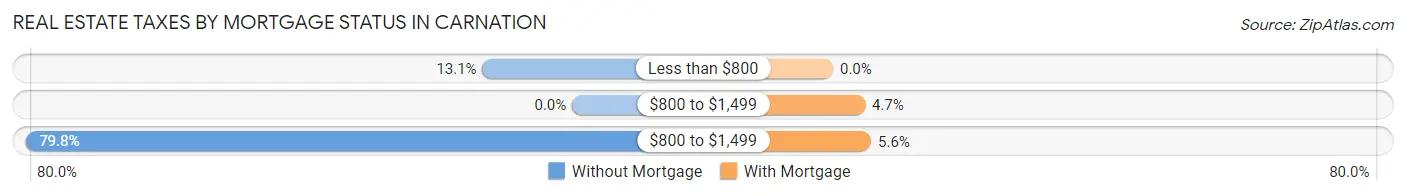
| Property Taxes | Without Mortgage | With Mortgage |
| Less than $800 | 22 (13.1%) | 0 (0.0%) |
| $800 to $1,499 | 0 (0.0%) | 26 (4.7%) |
| $800 to $1,499 | 134 (79.8%) | 31 (5.6%) |
| Total | 168 (100.0%) | 558 (100.0%) |
Health & Disability in Carnation
Health Insurance Coverage by Age in Carnation
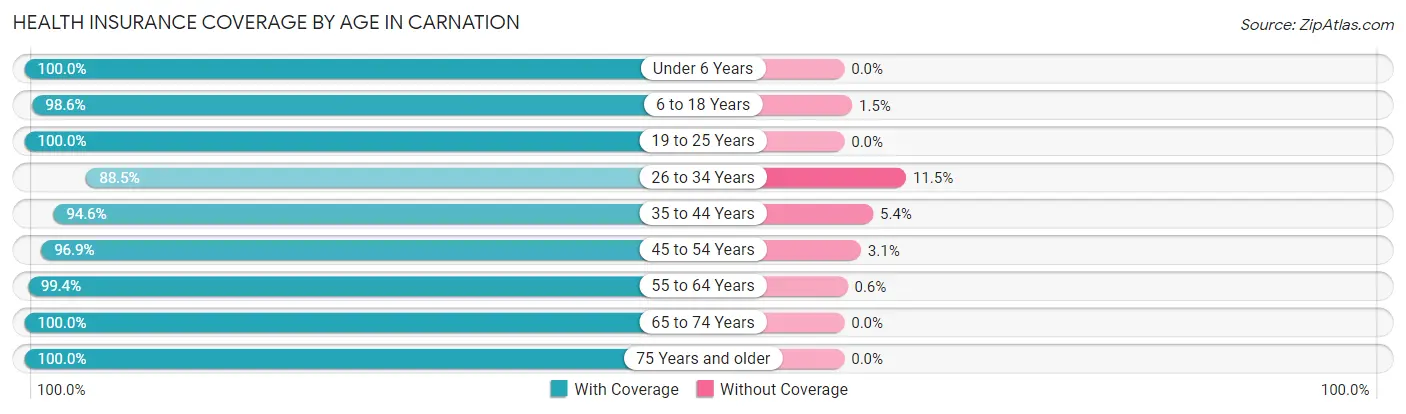
| Age Bracket | With Coverage | Without Coverage |
| Under 6 Years | 195 (100.0%) | 0 (0.0%) |
| 6 to 18 Years | 477 (98.6%) | 7 (1.5%) |
| 19 to 25 Years | 193 (100.0%) | 0 (0.0%) |
| 26 to 34 Years | 223 (88.5%) | 29 (11.5%) |
| 35 to 44 Years | 423 (94.6%) | 24 (5.4%) |
| 45 to 54 Years | 344 (96.9%) | 11 (3.1%) |
| 55 to 64 Years | 332 (99.4%) | 2 (0.6%) |
| 65 to 74 Years | 215 (100.0%) | 0 (0.0%) |
| 75 Years and older | 40 (100.0%) | 0 (0.0%) |
| Total | 2,442 (97.1%) | 73 (2.9%) |
Health Insurance Coverage by Citizenship Status in Carnation
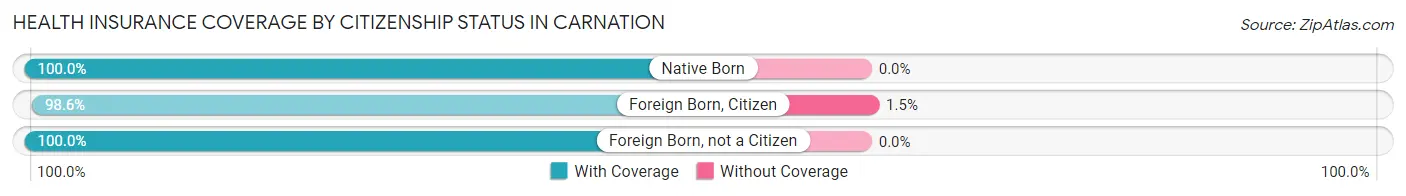
| Citizenship Status | With Coverage | Without Coverage |
| Native Born | 195 (100.0%) | 0 (0.0%) |
| Foreign Born, Citizen | 477 (98.6%) | 7 (1.5%) |
| Foreign Born, not a Citizen | 193 (100.0%) | 0 (0.0%) |
Health Insurance Coverage by Household Income in Carnation
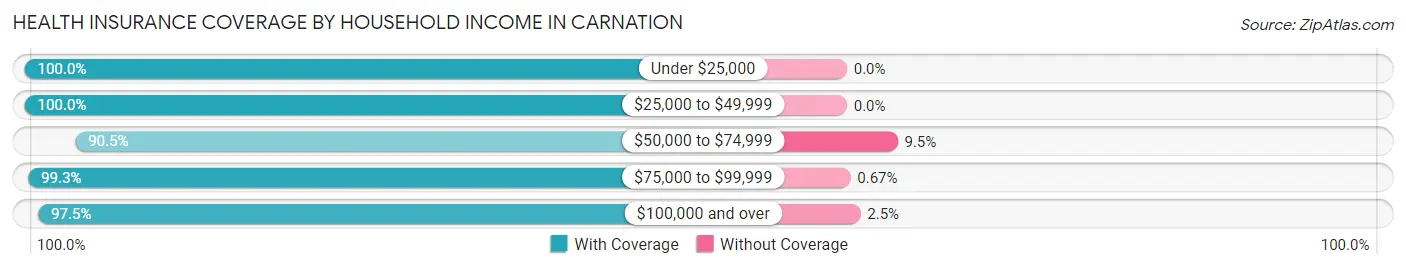
| Household Income | With Coverage | Without Coverage |
| Under $25,000 | 55 (100.0%) | 0 (0.0%) |
| $25,000 to $49,999 | 119 (100.0%) | 0 (0.0%) |
| $50,000 to $74,999 | 248 (90.5%) | 26 (9.5%) |
| $75,000 to $99,999 | 296 (99.3%) | 2 (0.7%) |
| $100,000 and over | 1,724 (97.5%) | 45 (2.5%) |
Public vs Private Health Insurance Coverage by Age in Carnation
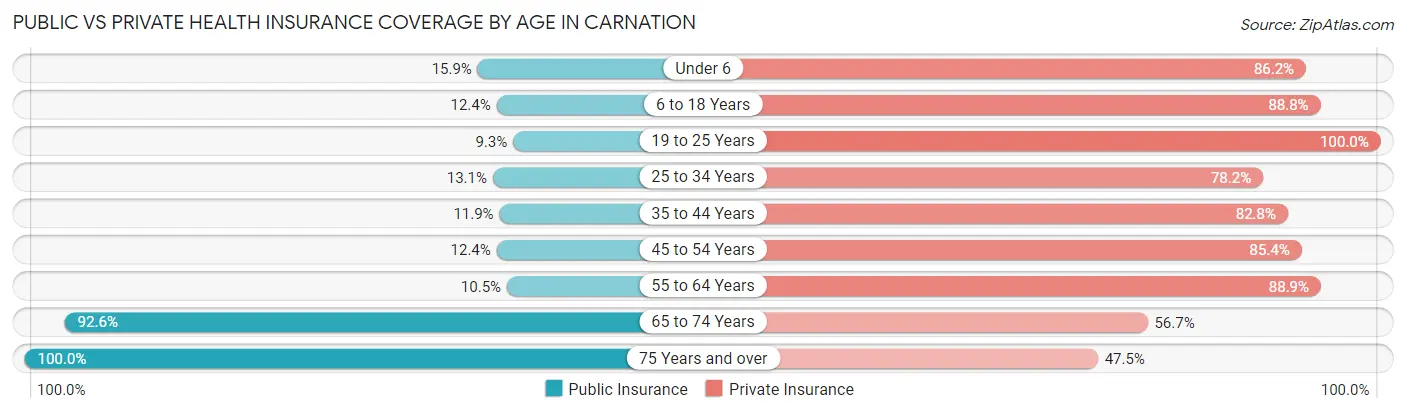
| Age Bracket | Public Insurance | Private Insurance |
| Under 6 | 31 (15.9%) | 168 (86.2%) |
| 6 to 18 Years | 60 (12.4%) | 430 (88.8%) |
| 19 to 25 Years | 18 (9.3%) | 193 (100.0%) |
| 25 to 34 Years | 33 (13.1%) | 197 (78.2%) |
| 35 to 44 Years | 53 (11.9%) | 370 (82.8%) |
| 45 to 54 Years | 44 (12.4%) | 303 (85.4%) |
| 55 to 64 Years | 35 (10.5%) | 297 (88.9%) |
| 65 to 74 Years | 199 (92.6%) | 122 (56.7%) |
| 75 Years and over | 40 (100.0%) | 19 (47.5%) |
| Total | 513 (20.4%) | 2,099 (83.5%) |
Disability Status by Sex by Age in Carnation
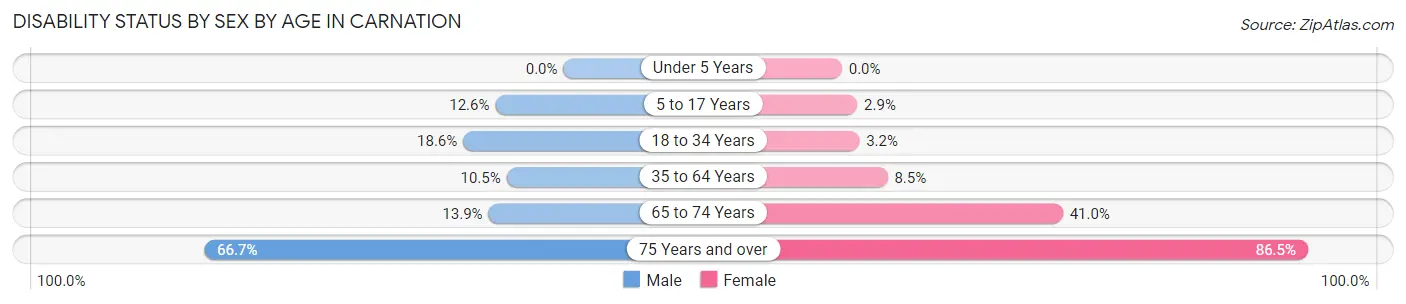
| Age Bracket | Male | Female |
| Under 5 Years | 0 (0.0%) | 0 (0.0%) |
| 5 to 17 Years | 24 (12.6%) | 8 (2.9%) |
| 18 to 34 Years | 43 (18.6%) | 8 (3.2%) |
| 35 to 64 Years | 60 (10.5%) | 48 (8.5%) |
| 65 to 74 Years | 16 (13.9%) | 41 (41.0%) |
| 75 Years and over | 2 (66.7%) | 32 (86.5%) |
Disability Class by Sex by Age in Carnation
Disability Class: Hearing Difficulty
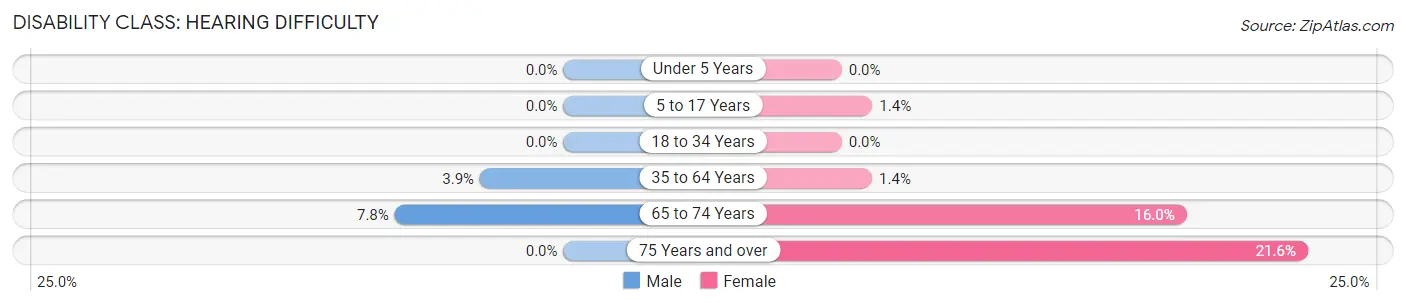
| Age Bracket | Male | Female |
| Under 5 Years | 0 (0.0%) | 0 (0.0%) |
| 5 to 17 Years | 0 (0.0%) | 4 (1.4%) |
| 18 to 34 Years | 0 (0.0%) | 0 (0.0%) |
| 35 to 64 Years | 22 (3.9%) | 8 (1.4%) |
| 65 to 74 Years | 9 (7.8%) | 16 (16.0%) |
| 75 Years and over | 0 (0.0%) | 8 (21.6%) |
Disability Class: Vision Difficulty
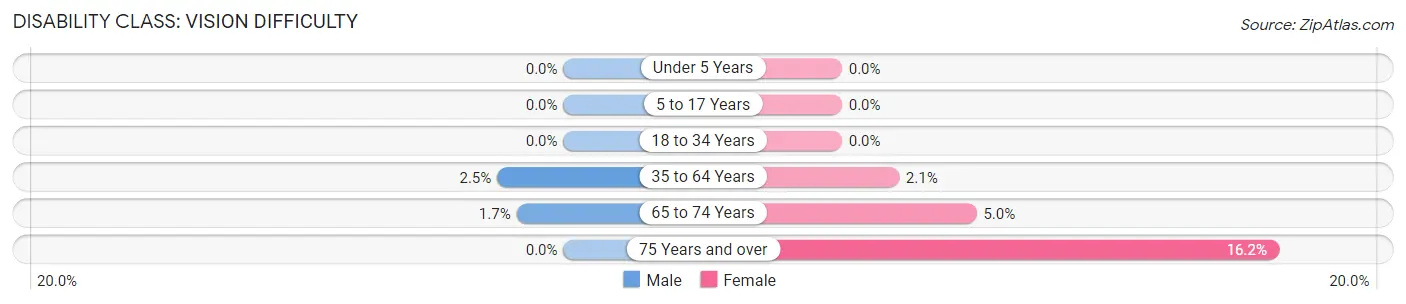
| Age Bracket | Male | Female |
| Under 5 Years | 0 (0.0%) | 0 (0.0%) |
| 5 to 17 Years | 0 (0.0%) | 0 (0.0%) |
| 18 to 34 Years | 0 (0.0%) | 0 (0.0%) |
| 35 to 64 Years | 14 (2.5%) | 12 (2.1%) |
| 65 to 74 Years | 2 (1.7%) | 5 (5.0%) |
| 75 Years and over | 0 (0.0%) | 6 (16.2%) |
Disability Class: Cognitive Difficulty
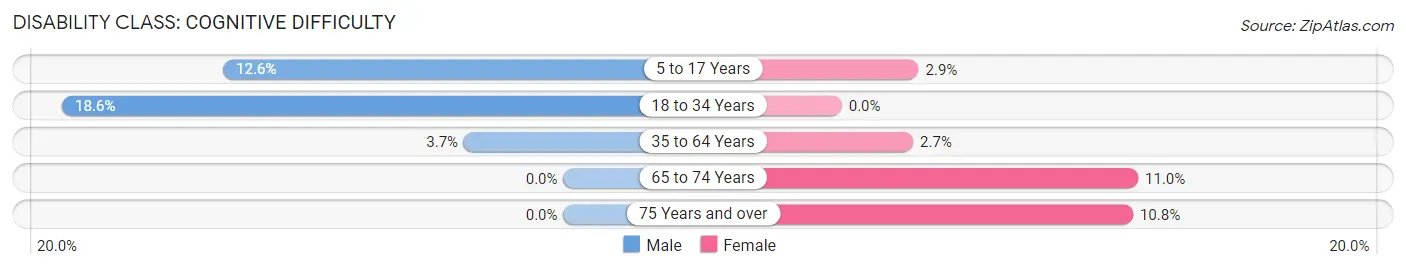
| Age Bracket | Male | Female |
| 5 to 17 Years | 24 (12.6%) | 8 (2.9%) |
| 18 to 34 Years | 43 (18.6%) | 0 (0.0%) |
| 35 to 64 Years | 21 (3.7%) | 15 (2.6%) |
| 65 to 74 Years | 0 (0.0%) | 11 (11.0%) |
| 75 Years and over | 0 (0.0%) | 4 (10.8%) |
Disability Class: Ambulatory Difficulty
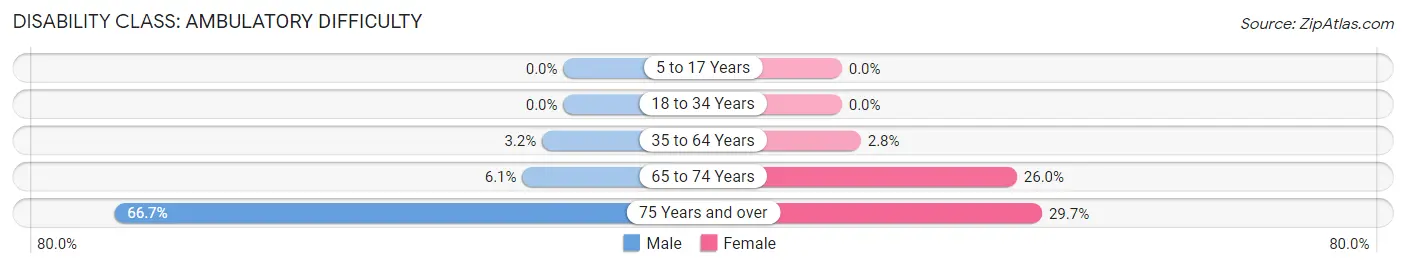
| Age Bracket | Male | Female |
| 5 to 17 Years | 0 (0.0%) | 0 (0.0%) |
| 18 to 34 Years | 0 (0.0%) | 0 (0.0%) |
| 35 to 64 Years | 18 (3.2%) | 16 (2.8%) |
| 65 to 74 Years | 7 (6.1%) | 26 (26.0%) |
| 75 Years and over | 2 (66.7%) | 11 (29.7%) |
Disability Class: Self-Care Difficulty
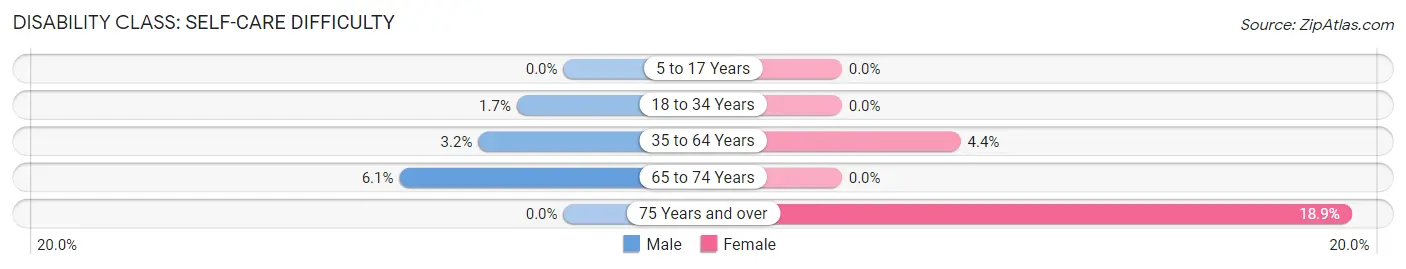
| Age Bracket | Male | Female |
| 5 to 17 Years | 0 (0.0%) | 0 (0.0%) |
| 18 to 34 Years | 4 (1.7%) | 0 (0.0%) |
| 35 to 64 Years | 18 (3.2%) | 25 (4.4%) |
| 65 to 74 Years | 7 (6.1%) | 0 (0.0%) |
| 75 Years and over | 0 (0.0%) | 7 (18.9%) |
Technology Access in Carnation
Computing Device Access in Carnation
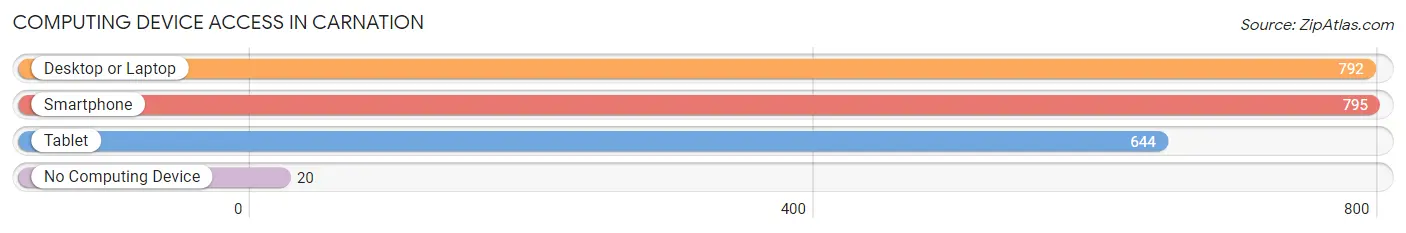
| Device Type | # Households | % Households |
| Desktop or Laptop | 792 | 93.7% |
| Smartphone | 795 | 94.1% |
| Tablet | 644 | 76.2% |
| No Computing Device | 20 | 2.4% |
| Total | 845 | 100.0% |
Internet Access in Carnation
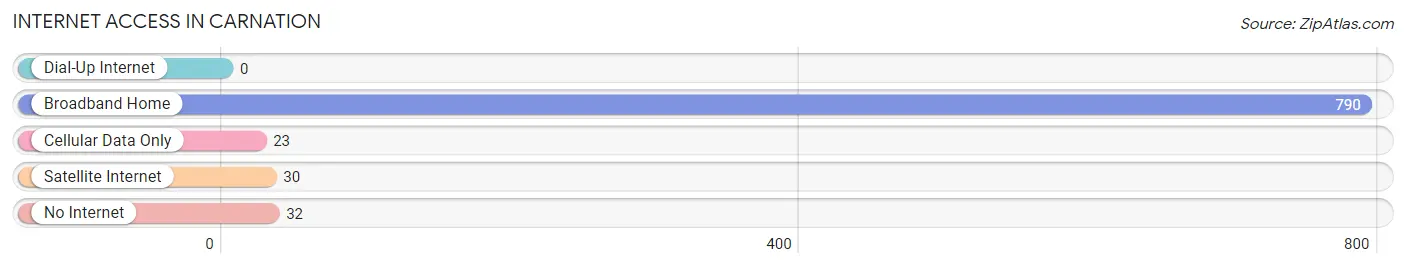
| Internet Type | # Households | % Households |
| Dial-Up Internet | 0 | 0.0% |
| Broadband Home | 790 | 93.5% |
| Cellular Data Only | 23 | 2.7% |
| Satellite Internet | 30 | 3.5% |
| No Internet | 32 | 3.8% |
| Total | 845 | 100.0% |
Carnation Summary
Carnation is a small city located in King County, Washington, United States. It is situated along the Snoqualmie River, approximately 25 miles east of Seattle. The city was founded in 1889 and incorporated in 1912. As of the 2010 census, the population of Carnation was 1,786.
History
The area that is now Carnation was originally inhabited by the Snoqualmie people, a Native American tribe of the Coast Salish people. The Snoqualmie people lived in the area for thousands of years before the arrival of European settlers.
The first European settlers arrived in the area in the late 1800s. The town was originally called Tolt, after the nearby Tolt River. In 1889, the town was renamed Carnation after the Carnation Milk Company, which had recently opened a creamery in the area. The town was officially incorporated in 1912.
In the early 1900s, Carnation was a thriving agricultural community. The town was known for its dairy farms and its production of Carnation Milk. The town also had a thriving lumber industry, with several sawmills located in the area.
In the 1950s, the town began to experience a decline in its agricultural industry. Many of the dairy farms closed and the sawmills shut down. In the 1960s, the town began to experience a resurgence in its economy as it became a popular destination for tourists and outdoor enthusiasts.
Geography
Carnation is located in King County, Washington, approximately 25 miles east of Seattle. The city is situated along the Snoqualmie River, which flows through the city. The city is surrounded by the Cascade Mountains to the east and the Olympic Mountains to the west.
The city has a total area of 1.7 square miles, all of which is land. The city has a humid continental climate, with warm summers and cold winters. The average annual temperature is 48°F.
Economy
Carnation’s economy is largely based on tourism and outdoor recreation. The city is home to several wineries, breweries, and distilleries, as well as several restaurants and shops. The city is also home to several outdoor recreation areas, including the Snoqualmie River Trail and the Tolt-MacDonald Park.
The city is also home to several businesses, including a lumber mill, a metal fabrication shop, and a machine shop. The city is also home to several technology companies, including Microsoft and Amazon.
Demographics
As of the 2010 census, the population of Carnation was 1,786. The racial makeup of the city was 87.3% White, 0.7% African American, 0.7% Native American, 4.2% Asian, 0.2% Pacific Islander, 3.2% from other races, and 3.9% from two or more races. Hispanic or Latino of any race were 8.2% of the population.
The median income for a household in the city was $60,938, and the median income for a family was $68,750. The per capita income for the city was $27,945. About 5.2% of families and 7.2% of the population were below the poverty line, including 8.3% of those under age 18 and 4.2% of those age 65 or over.
Common Questions
What is Per Capita Income in Carnation?
Per Capita income in Carnation is $56,412.
What is the Median Family Income in Carnation?
Median Family Income in Carnation is $149,861.
What is the Median Household income in Carnation?
Median Household Income in Carnation is $134,850.
What is Income or Wage Gap in Carnation?
Income or Wage Gap in Carnation is 55.3%.
Women in Carnation earn 44.7 cents for every dollar earned by a man.
What is Inequality or Gini Index in Carnation?
Inequality or Gini Index in Carnation is 0.38.
What is the Total Population of Carnation?
Total Population of Carnation is 2,515.
What is the Total Male Population of Carnation?
Total Male Population of Carnation is 1,180.
What is the Total Female Population of Carnation?
Total Female Population of Carnation is 1,335.
What is the Ratio of Males per 100 Females in Carnation?
There are 88.39 Males per 100 Females in Carnation.
What is the Ratio of Females per 100 Males in Carnation?
There are 113.14 Females per 100 Males in Carnation.
What is the Median Population Age in Carnation?
Median Population Age in Carnation is 38.4 Years.
What is the Average Family Size in Carnation
Average Family Size in Carnation is 3.2 People.
What is the Average Household Size in Carnation
Average Household Size in Carnation is 3.0 People.
How Large is the Labor Force in Carnation?
There are 1,454 People in the Labor Forcein in Carnation.
What is the Percentage of People in the Labor Force in Carnation?
75.4% of People are in the Labor Force in Carnation.
What is the Unemployment Rate in Carnation?
Unemployment Rate in Carnation is 3.4%.