North Bonneville, WA Map & Demographics
North Bonneville Map
North Bonneville Overview
$35,268
PER CAPITA INCOME
$100,000
AVG FAMILY INCOME
$79,375
AVG HOUSEHOLD INCOME
4.3%
WAGE / INCOME GAP [ % ]
95.7¢/ $1
WAGE / INCOME GAP [ $ ]
0.33
INEQUALITY / GINI INDEX
1,146
TOTAL POPULATION
587
MALE POPULATION
559
FEMALE POPULATION
105.01
MALES / 100 FEMALES
95.23
FEMALES / 100 MALES
42.1
MEDIAN AGE
3.3
AVG FAMILY SIZE
2.5
AVG HOUSEHOLD SIZE
645
LABOR FORCE [ PEOPLE ]
69.9%
PERCENT IN LABOR FORCE
7.3%
UNEMPLOYMENT RATE
North Bonneville Zip Codes
North Bonneville Area Codes
Income in North Bonneville
Income Overview in North Bonneville
Per Capita Income in North Bonneville is $35,268, while median incomes of families and households are $100,000 and $79,375 respectively.
| Characteristic | Number | Measure |
| Per Capita Income | 1,146 | $35,268 |
| Median Family Income | 260 | $100,000 |
| Mean Family Income | 260 | $98,807 |
| Median Household Income | 457 | $79,375 |
| Mean Household Income | 457 | $83,713 |
| Income Deficit | 260 | $0 |
| Wage / Income Gap (%) | 1,146 | 4.31% |
| Wage / Income Gap ($) | 1,146 | 95.69¢ per $1 |
| Gini / Inequality Index | 1,146 | 0.33 |
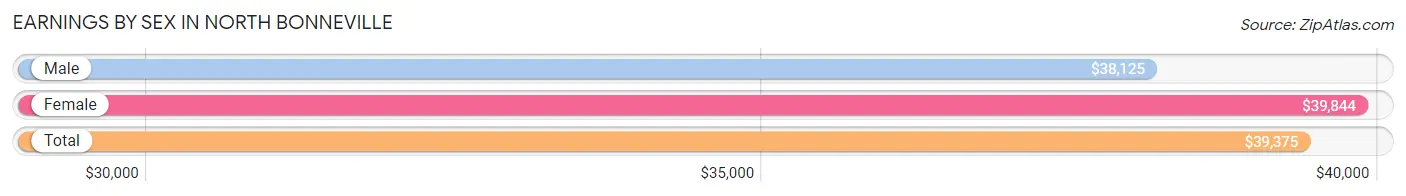
Earnings by Sex in North Bonneville
Average Earnings in North Bonneville are $39,375, $38,125 for men and $39,844 for women, a difference of 4.3%.
| Sex | Number | Average Earnings |
| Male | 322 (49.2%) | $38,125 |
| Female | 332 (50.8%) | $39,844 |
| Total | 654 (100.0%) | $39,375 |
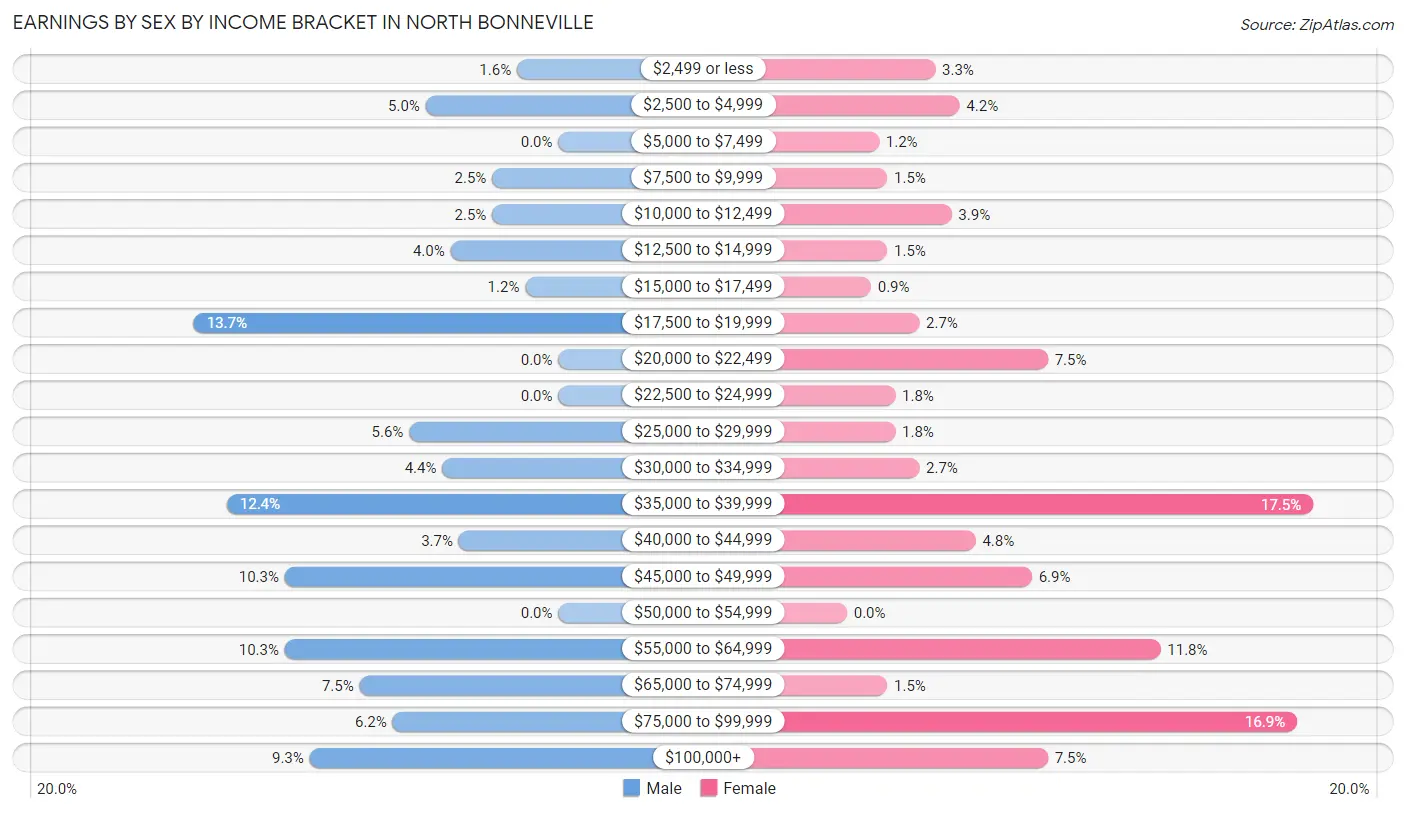
Earnings by Sex by Income Bracket in North Bonneville
The most common earnings brackets in North Bonneville are $17,500 to $19,999 for men (44 | 13.7%) and $35,000 to $39,999 for women (58 | 17.5%).
| Income | Male | Female |
| $2,499 or less | 5 (1.5%) | 11 (3.3%) |
| $2,500 to $4,999 | 16 (5.0%) | 14 (4.2%) |
| $5,000 to $7,499 | 0 (0.0%) | 4 (1.2%) |
| $7,500 to $9,999 | 8 (2.5%) | 5 (1.5%) |
| $10,000 to $12,499 | 8 (2.5%) | 13 (3.9%) |
| $12,500 to $14,999 | 13 (4.0%) | 5 (1.5%) |
| $15,000 to $17,499 | 4 (1.2%) | 3 (0.9%) |
| $17,500 to $19,999 | 44 (13.7%) | 9 (2.7%) |
| $20,000 to $22,499 | 0 (0.0%) | 25 (7.5%) |
| $22,500 to $24,999 | 0 (0.0%) | 6 (1.8%) |
| $25,000 to $29,999 | 18 (5.6%) | 6 (1.8%) |
| $30,000 to $34,999 | 14 (4.3%) | 9 (2.7%) |
| $35,000 to $39,999 | 40 (12.4%) | 58 (17.5%) |
| $40,000 to $44,999 | 12 (3.7%) | 16 (4.8%) |
| $45,000 to $49,999 | 33 (10.2%) | 23 (6.9%) |
| $50,000 to $54,999 | 0 (0.0%) | 0 (0.0%) |
| $55,000 to $64,999 | 33 (10.2%) | 39 (11.7%) |
| $65,000 to $74,999 | 24 (7.4%) | 5 (1.5%) |
| $75,000 to $99,999 | 20 (6.2%) | 56 (16.9%) |
| $100,000+ | 30 (9.3%) | 25 (7.5%) |
| Total | 322 (100.0%) | 332 (100.0%) |
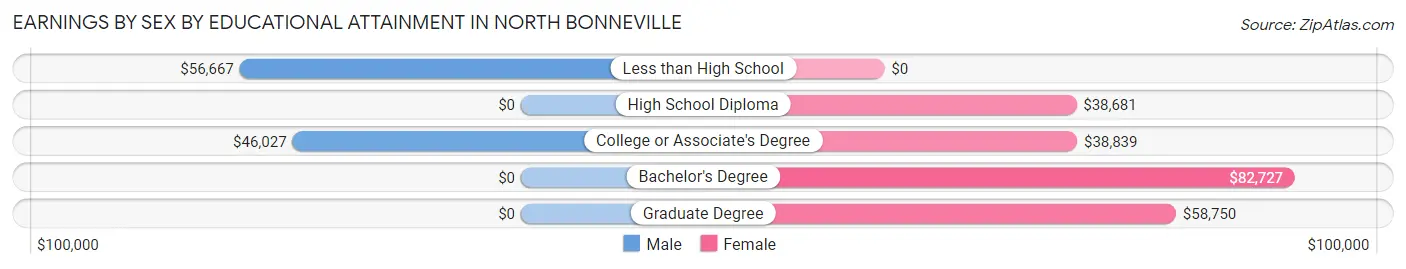
Earnings by Sex by Educational Attainment in North Bonneville
Average earnings in North Bonneville are $45,265 for men and $41,953 for women, a difference of 7.3%. Men with an educational attainment of less than high school enjoy the highest average annual earnings of $56,667, while those with college or associate's degree education earn the least with $46,027. Women with an educational attainment of bachelor's degree earn the most with the average annual earnings of $82,727, while those with high school diploma education have the smallest earnings of $38,681.
| Educational Attainment | Male Income | Female Income |
| Less than High School | $56,667 | $0 |
| High School Diploma | - | - |
| College or Associate's Degree | $46,027 | $38,839 |
| Bachelor's Degree | - | - |
| Graduate Degree | - | - |
| Total | $45,265 | $41,953 |
Family Income in North Bonneville
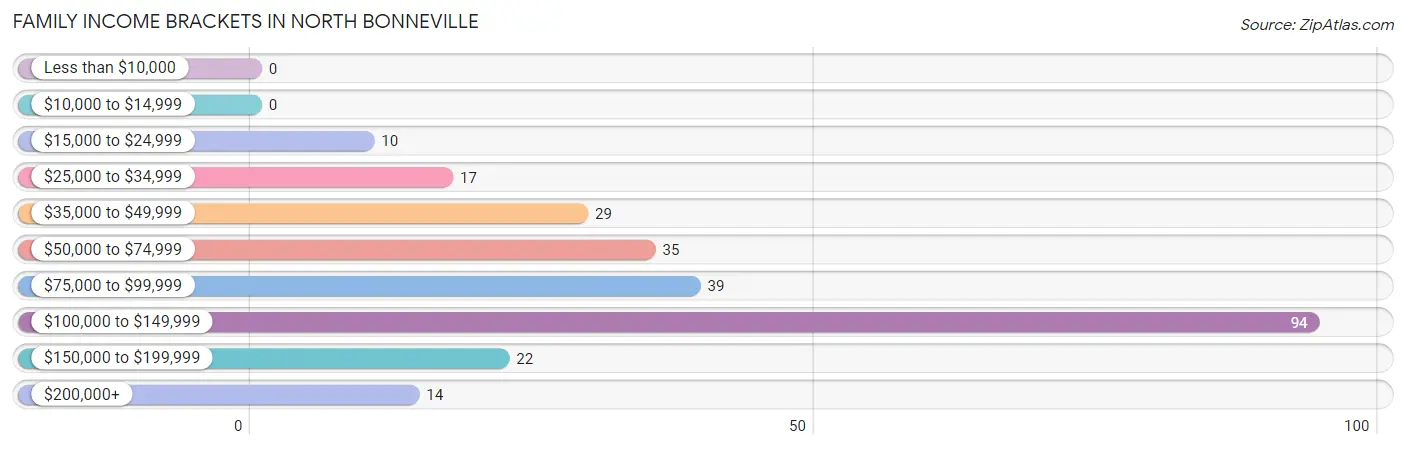
Family Income Brackets in North Bonneville
According to the North Bonneville family income data, there are 94 families falling into the $100,000 to $149,999 income range, which is the most common income bracket and makes up 36.1% of all families.
| Income Bracket | # Families | % Families |
| Less than $10,000 | 0 | 0.0% |
| $10,000 to $14,999 | 0 | 0.0% |
| $15,000 to $24,999 | 10 | 3.8% |
| $25,000 to $34,999 | 17 | 6.5% |
| $35,000 to $49,999 | 29 | 11.2% |
| $50,000 to $74,999 | 35 | 13.5% |
| $75,000 to $99,999 | 39 | 15.0% |
| $100,000 to $149,999 | 94 | 36.2% |
| $150,000 to $199,999 | 22 | 8.5% |
| $200,000+ | 14 | 5.4% |
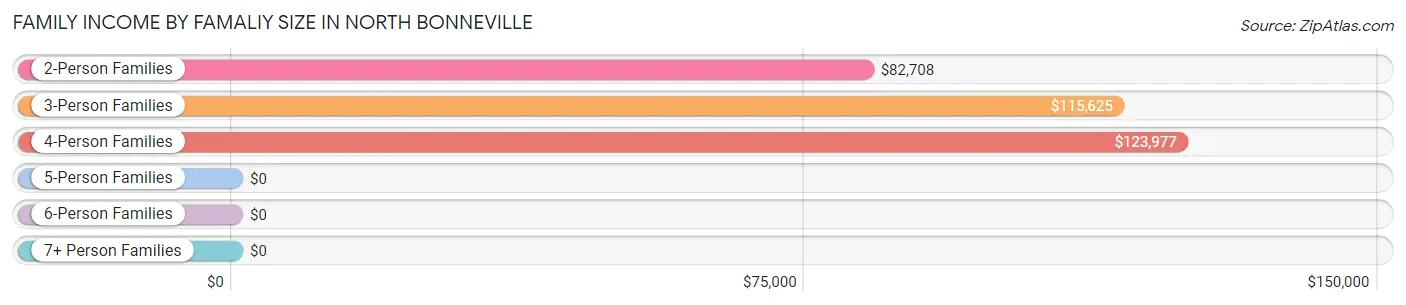
Family Income by Famaliy Size in North Bonneville
4-person families (43 | 16.5%) account for the highest median family income in North Bonneville with $123,977 per family, while 2-person families (121 | 46.5%) have the highest median income of $41,354 per family member.
| Income Bracket | # Families | Median Income |
| 2-Person Families | 121 (46.5%) | $82,708 |
| 3-Person Families | 76 (29.2%) | $115,625 |
| 4-Person Families | 43 (16.5%) | $123,977 |
| 5-Person Families | 11 (4.2%) | $0 |
| 6-Person Families | 0 (0.0%) | $0 |
| 7+ Person Families | 9 (3.5%) | $0 |
| Total | 260 (100.0%) | $100,000 |
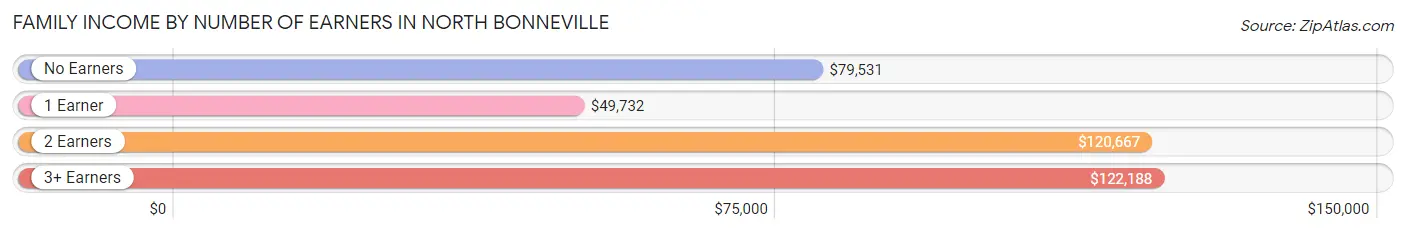
Family Income by Number of Earners in North Bonneville
The median family income in North Bonneville is $100,000, with families comprising 3+ earners (38) having the highest median family income of $122,188, while families with 1 earner (83) have the lowest median family income of $49,732, accounting for 14.6% and 31.9% of families, respectively.
| Number of Earners | # Families | Median Income |
| No Earners | 39 (15.0%) | $79,531 |
| 1 Earner | 83 (31.9%) | $49,732 |
| 2 Earners | 100 (38.5%) | $120,667 |
| 3+ Earners | 38 (14.6%) | $122,188 |
| Total | 260 (100.0%) | $100,000 |
Household Income in North Bonneville
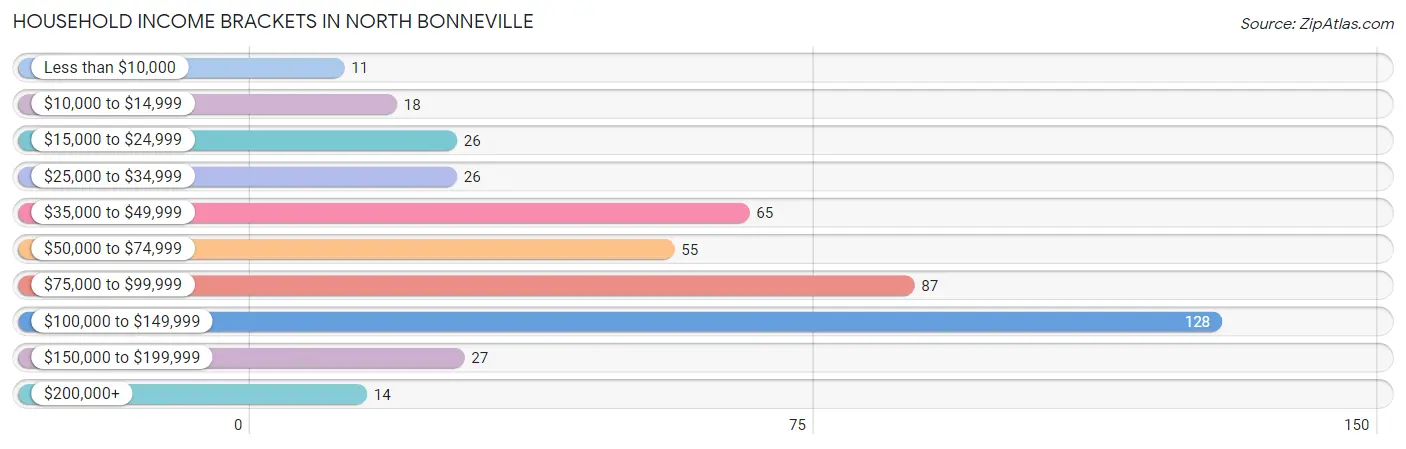
Household Income Brackets in North Bonneville
With 128 households falling in the category, the $100,000 to $149,999 income range is the most frequent in North Bonneville, accounting for 28.0% of all households. In contrast, only 11 households (2.4%) fall into the less than $10,000 income bracket, making it the least populous group.
| Income Bracket | # Households | % Households |
| Less than $10,000 | 11 | 2.4% |
| $10,000 to $14,999 | 18 | 3.9% |
| $15,000 to $24,999 | 26 | 5.7% |
| $25,000 to $34,999 | 26 | 5.7% |
| $35,000 to $49,999 | 65 | 14.2% |
| $50,000 to $74,999 | 55 | 12.0% |
| $75,000 to $99,999 | 87 | 19.0% |
| $100,000 to $149,999 | 128 | 28.0% |
| $150,000 to $199,999 | 27 | 5.9% |
| $200,000+ | 14 | 3.1% |
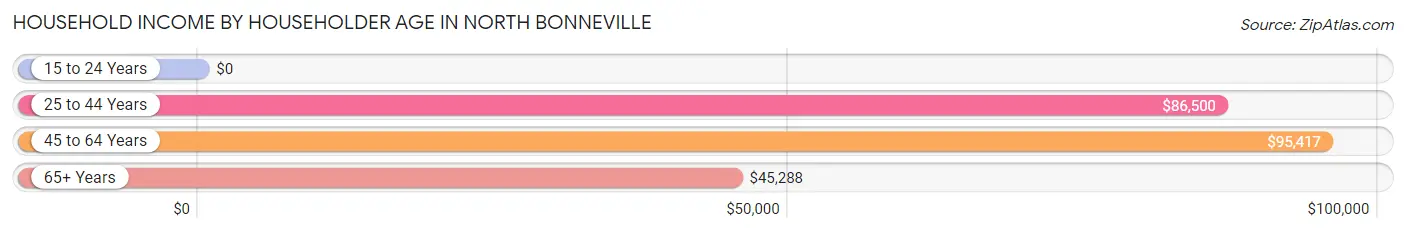
Household Income by Householder Age in North Bonneville
The median household income in North Bonneville is $79,375, with the highest median household income of $95,417 found in the 45 to 64 years age bracket for the primary householder. A total of 174 households (38.1%) fall into this category.
| Income Bracket | # Households | Median Income |
| 15 to 24 Years | 0 (0.0%) | $0 |
| 25 to 44 Years | 146 (32.0%) | $86,500 |
| 45 to 64 Years | 174 (38.1%) | $95,417 |
| 65+ Years | 137 (30.0%) | $45,288 |
| Total | 457 (100.0%) | $79,375 |
Poverty in North Bonneville
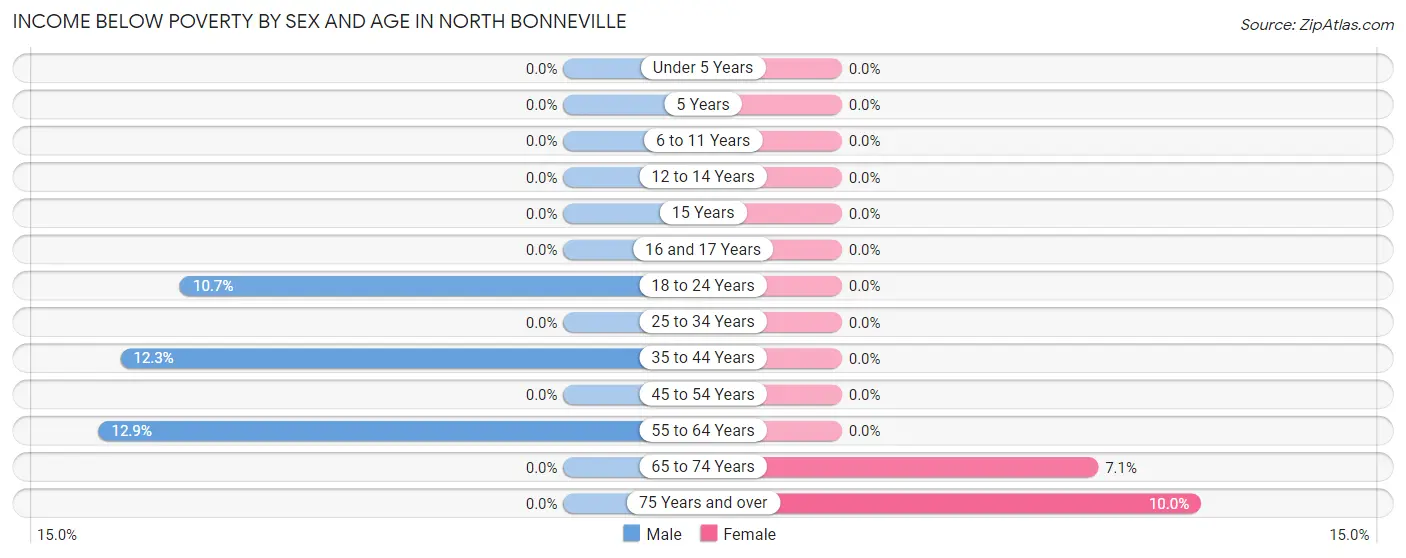
Income Below Poverty by Sex and Age in North Bonneville
With 4.8% poverty level for males and 1.6% for females among the residents of North Bonneville, 55 to 64 year old males and 75 year old and over females are the most vulnerable to poverty, with 11 males (12.9%) and 5 females (10.0%) in their respective age groups living below the poverty level.
| Age Bracket | Male | Female |
| Under 5 Years | 0 (0.0%) | 0 (0.0%) |
| 5 Years | 0 (0.0%) | 0 (0.0%) |
| 6 to 11 Years | 0 (0.0%) | 0 (0.0%) |
| 12 to 14 Years | 0 (0.0%) | 0 (0.0%) |
| 15 Years | 0 (0.0%) | 0 (0.0%) |
| 16 and 17 Years | 0 (0.0%) | 0 (0.0%) |
| 18 to 24 Years | 8 (10.7%) | 0 (0.0%) |
| 25 to 34 Years | 0 (0.0%) | 0 (0.0%) |
| 35 to 44 Years | 9 (12.3%) | 0 (0.0%) |
| 45 to 54 Years | 0 (0.0%) | 0 (0.0%) |
| 55 to 64 Years | 11 (12.9%) | 0 (0.0%) |
| 65 to 74 Years | 0 (0.0%) | 4 (7.1%) |
| 75 Years and over | 0 (0.0%) | 5 (10.0%) |
| Total | 28 (4.8%) | 9 (1.6%) |
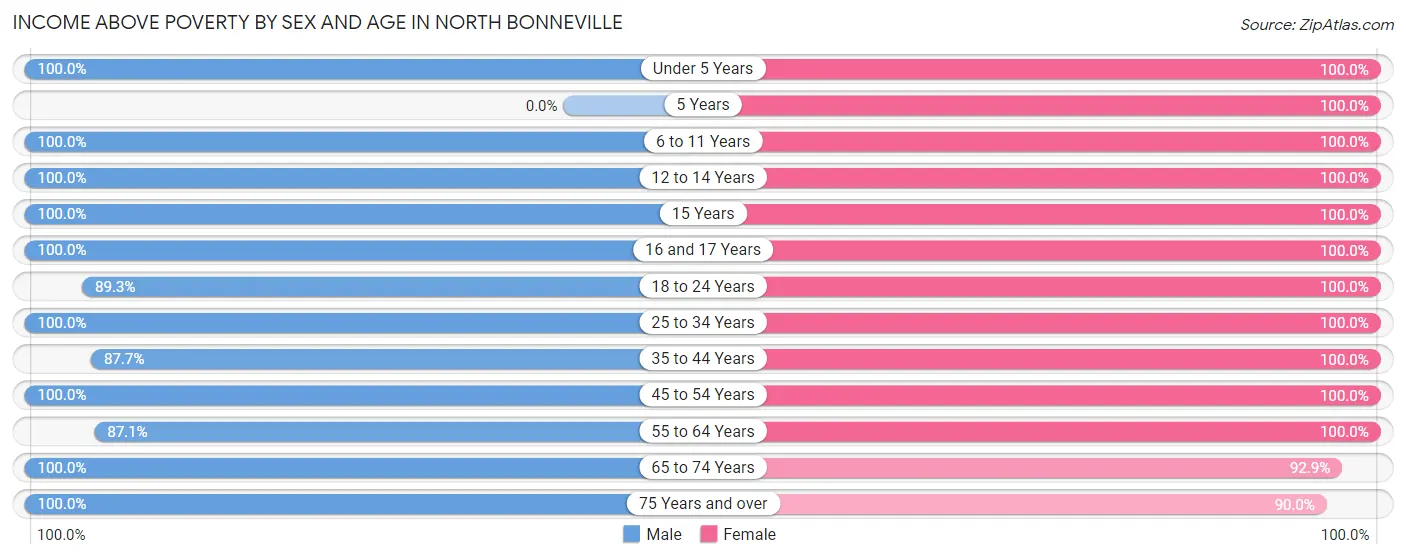
Income Above Poverty by Sex and Age in North Bonneville
According to the poverty statistics in North Bonneville, males aged under 5 years and females aged under 5 years are the age groups that are most secure financially, with 100.0% of males and 100.0% of females in these age groups living above the poverty line.
| Age Bracket | Male | Female |
| Under 5 Years | 4 (100.0%) | 26 (100.0%) |
| 5 Years | 0 (0.0%) | 12 (100.0%) |
| 6 to 11 Years | 64 (100.0%) | 15 (100.0%) |
| 12 to 14 Years | 37 (100.0%) | 22 (100.0%) |
| 15 Years | 33 (100.0%) | 10 (100.0%) |
| 16 and 17 Years | 7 (100.0%) | 10 (100.0%) |
| 18 to 24 Years | 67 (89.3%) | 29 (100.0%) |
| 25 to 34 Years | 44 (100.0%) | 73 (100.0%) |
| 35 to 44 Years | 64 (87.7%) | 90 (100.0%) |
| 45 to 54 Years | 73 (100.0%) | 96 (100.0%) |
| 55 to 64 Years | 74 (87.1%) | 70 (100.0%) |
| 65 to 74 Years | 38 (100.0%) | 52 (92.9%) |
| 75 Years and over | 54 (100.0%) | 45 (90.0%) |
| Total | 559 (95.2%) | 550 (98.4%) |
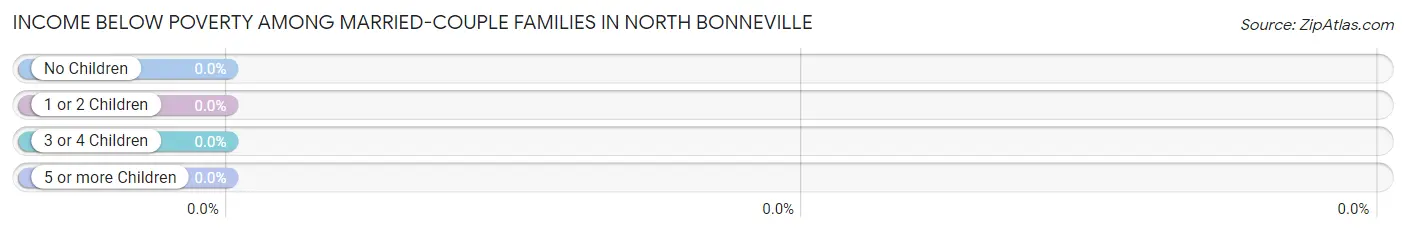
Income Below Poverty Among Married-Couple Families in North Bonneville
| Children | Above Poverty | Below Poverty |
| No Children | 129 (100.0%) | 0 (0.0%) |
| 1 or 2 Children | 60 (100.0%) | 0 (0.0%) |
| 3 or 4 Children | 9 (100.0%) | 0 (0.0%) |
| 5 or more Children | 0 (0.0%) | 0 (0.0%) |
| Total | 198 (100.0%) | 0 (0.0%) |
Income Below Poverty Among Single-Parent Households in North Bonneville
| Children | Single Father | Single Mother |
| No Children | 0 (0.0%) | 0 (0.0%) |
| 1 or 2 Children | 0 (0.0%) | 0 (0.0%) |
| 3 or 4 Children | 0 (0.0%) | 0 (0.0%) |
| 5 or more Children | 0 (0.0%) | 0 (0.0%) |
| Total | 0 (0.0%) | 0 (0.0%) |
Income Below Poverty Among Married-Couple vs Single-Parent Households in North Bonneville
| Children | Married-Couple Families | Single-Parent Households |
| No Children | 0 (0.0%) | 0 (0.0%) |
| 1 or 2 Children | 0 (0.0%) | 0 (0.0%) |
| 3 or 4 Children | 0 (0.0%) | 0 (0.0%) |
| 5 or more Children | 0 (0.0%) | 0 (0.0%) |
| Total | 0 (0.0%) | 0 (0.0%) |
Race in North Bonneville
The most populous races in North Bonneville are White / Caucasian (948 | 82.7%), Hispanic or Latino (151 | 13.2%), and Two or more Races (143 | 12.5%).
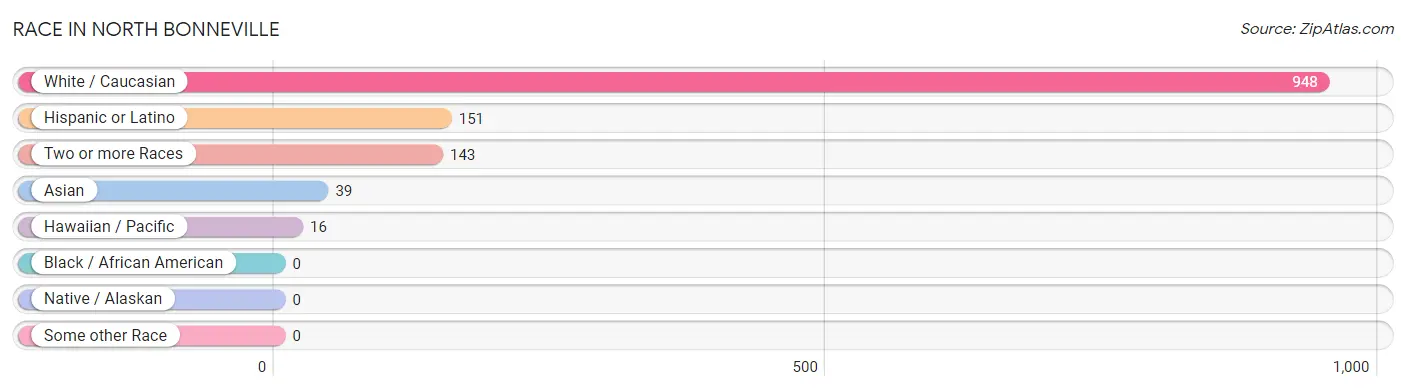
| Race | # Population | % Population |
| Asian | 39 | 3.4% |
| Black / African American | 0 | 0.0% |
| Hawaiian / Pacific | 16 | 1.4% |
| Hispanic or Latino | 151 | 13.2% |
| Native / Alaskan | 0 | 0.0% |
| White / Caucasian | 948 | 82.7% |
| Two or more Races | 143 | 12.5% |
| Some other Race | 0 | 0.0% |
| Total | 1,146 | 100.0% |
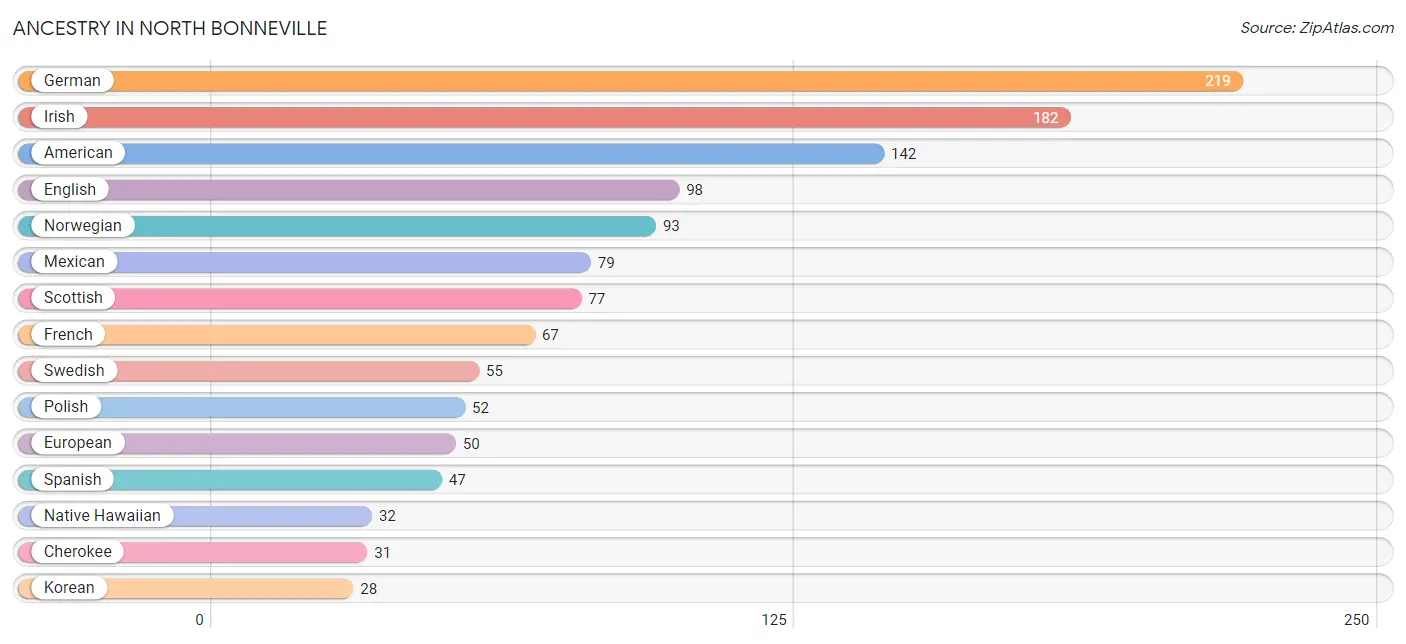
Ancestry in North Bonneville
The most populous ancestries reported in North Bonneville are German (219 | 19.1%), Irish (182 | 15.9%), American (142 | 12.4%), English (98 | 8.6%), and Norwegian (93 | 8.1%), together accounting for 64.1% of all North Bonneville residents.
| Ancestry | # Population | % Population |
| American | 142 | 12.4% |
| Bhutanese | 10 | 0.9% |
| British | 10 | 0.9% |
| Burmese | 12 | 1.1% |
| Canadian | 5 | 0.4% |
| Cherokee | 31 | 2.7% |
| Choctaw | 11 | 1.0% |
| Czechoslovakian | 11 | 1.0% |
| Dutch | 7 | 0.6% |
| English | 98 | 8.6% |
| European | 50 | 4.4% |
| French | 67 | 5.9% |
| German | 219 | 19.1% |
| Indian (Asian) | 11 | 1.0% |
| Irish | 182 | 15.9% |
| Italian | 26 | 2.3% |
| Korean | 28 | 2.4% |
| Mexican | 79 | 6.9% |
| Native Hawaiian | 32 | 2.8% |
| Norwegian | 93 | 8.1% |
| Polish | 52 | 4.5% |
| Puerto Rican | 25 | 2.2% |
| Russian | 28 | 2.4% |
| Scotch-Irish | 24 | 2.1% |
| Scottish | 77 | 6.7% |
| Spanish | 47 | 4.1% |
| Swedish | 55 | 4.8% |
| Welsh | 23 | 2.0% | View All 28 Rows |
Immigrants in North Bonneville
The most numerous immigrant groups reported in North Bonneville came from Central America (30 | 2.6%), Latin America (30 | 2.6%), Mexico (24 | 2.1%), Canada (10 | 0.9%), and El Salvador (6 | 0.5%), together accounting for 8.7% of all North Bonneville residents.
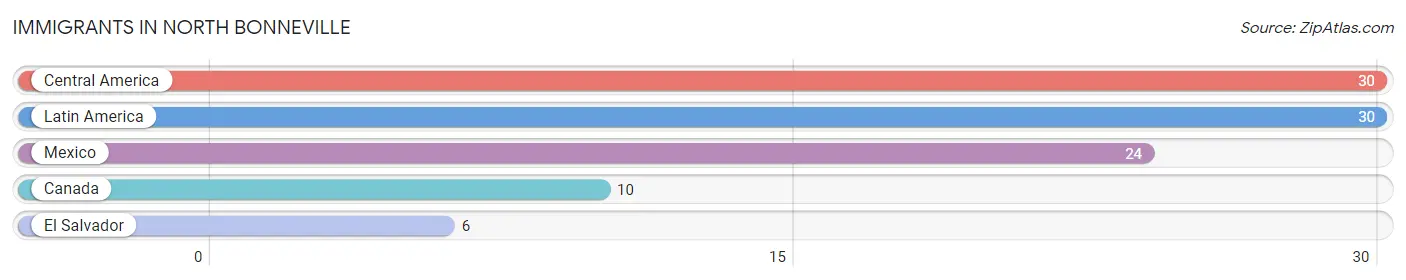
| Immigration Origin | # Population | % Population |
| Canada | 10 | 0.9% |
| Central America | 30 | 2.6% |
| El Salvador | 6 | 0.5% |
| Latin America | 30 | 2.6% |
| Mexico | 24 | 2.1% | View All 5 Rows |
Sex and Age in North Bonneville
Sex and Age in North Bonneville
The most populous age groups in North Bonneville are 20 to 24 Years (60 | 10.2%) for men and 45 to 49 Years (75 | 13.4%) for women.
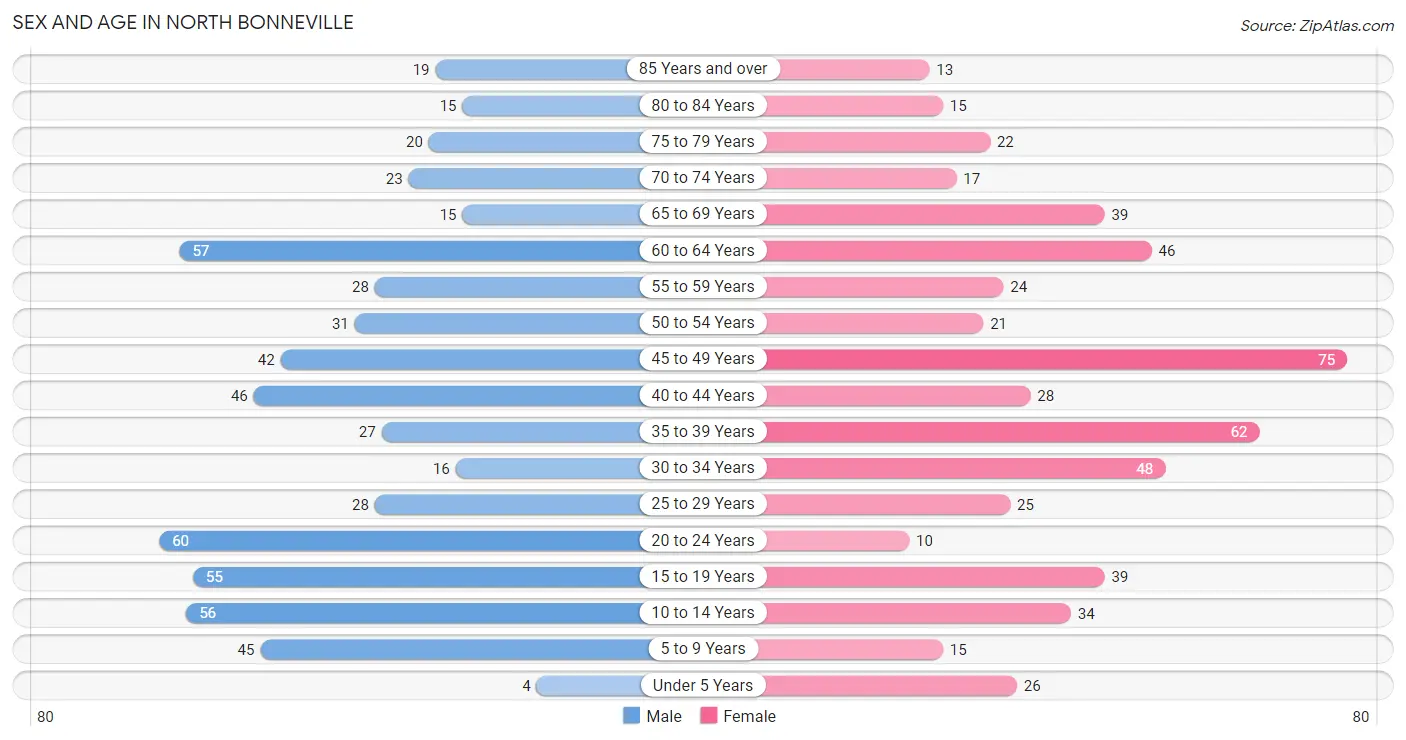
| Age Bracket | Male | Female |
| Under 5 Years | 4 (0.7%) | 26 (4.6%) |
| 5 to 9 Years | 45 (7.7%) | 15 (2.7%) |
| 10 to 14 Years | 56 (9.5%) | 34 (6.1%) |
| 15 to 19 Years | 55 (9.4%) | 39 (7.0%) |
| 20 to 24 Years | 60 (10.2%) | 10 (1.8%) |
| 25 to 29 Years | 28 (4.8%) | 25 (4.5%) |
| 30 to 34 Years | 16 (2.7%) | 48 (8.6%) |
| 35 to 39 Years | 27 (4.6%) | 62 (11.1%) |
| 40 to 44 Years | 46 (7.8%) | 28 (5.0%) |
| 45 to 49 Years | 42 (7.2%) | 75 (13.4%) |
| 50 to 54 Years | 31 (5.3%) | 21 (3.8%) |
| 55 to 59 Years | 28 (4.8%) | 24 (4.3%) |
| 60 to 64 Years | 57 (9.7%) | 46 (8.2%) |
| 65 to 69 Years | 15 (2.6%) | 39 (7.0%) |
| 70 to 74 Years | 23 (3.9%) | 17 (3.0%) |
| 75 to 79 Years | 20 (3.4%) | 22 (3.9%) |
| 80 to 84 Years | 15 (2.6%) | 15 (2.7%) |
| 85 Years and over | 19 (3.2%) | 13 (2.3%) |
| Total | 587 (100.0%) | 559 (100.0%) |
Families and Households in North Bonneville
Median Family Size in North Bonneville
The median family size in North Bonneville is 3.31 persons per family, with single male/father families (13 | 5.0%) accounting for the largest median family size of 3.69 persons per family. On the other hand, married-couple families (198 | 76.1%) represent the smallest median family size with 3.25 persons per family.
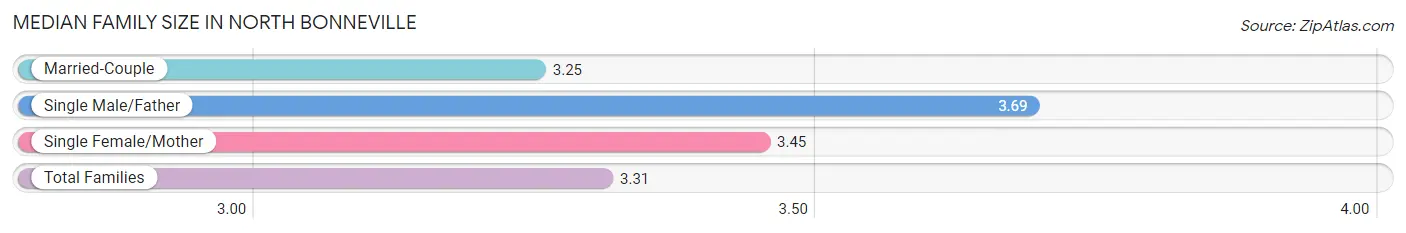
| Family Type | # Families | Family Size |
| Married-Couple | 198 (76.1%) | 3.25 |
| Single Male/Father | 13 (5.0%) | 3.69 |
| Single Female/Mother | 49 (18.9%) | 3.45 |
| Total Families | 260 (100.0%) | 3.31 |
Median Household Size in North Bonneville
The median household size in North Bonneville is 2.51 persons per household, with single male/father households (13 | 2.8%) accounting for the largest median household size of 3.69 persons per household. non-family households (197 | 43.1%) represent the smallest median household size with 1.37 persons per household.
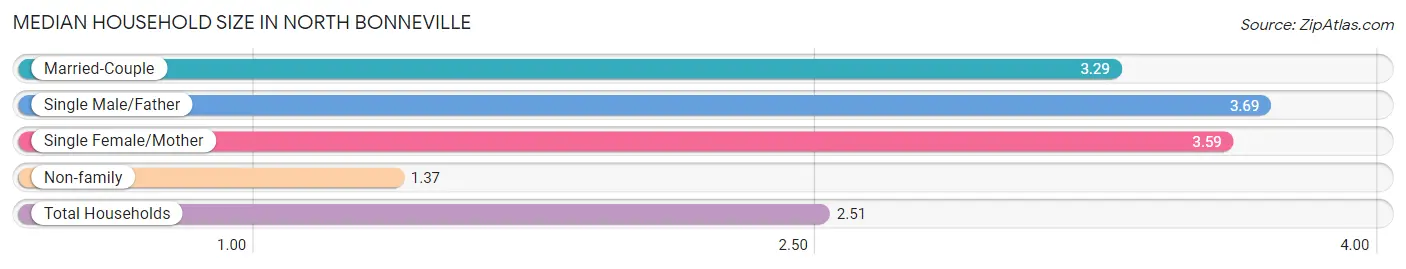
| Household Type | # Households | Household Size |
| Married-Couple | 198 (43.3%) | 3.29 |
| Single Male/Father | 13 (2.8%) | 3.69 |
| Single Female/Mother | 49 (10.7%) | 3.59 |
| Non-family | 197 (43.1%) | 1.37 |
| Total Households | 457 (100.0%) | 2.51 |
Household Size by Marriage Status in North Bonneville
Out of a total of 457 households in North Bonneville, 260 (56.9%) are family households, while 197 (43.1%) are nonfamily households. The most numerous type of family households are 2-person households, comprising 114, and the most common type of nonfamily households are 1-person households, comprising 130.
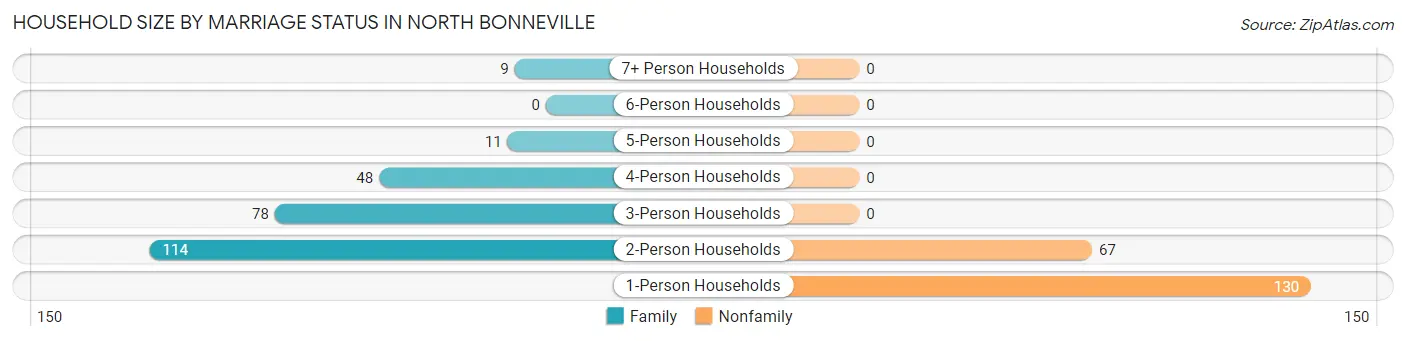
| Household Size | Family Households | Nonfamily Households |
| 1-Person Households | - | 130 (28.4%) |
| 2-Person Households | 114 (24.9%) | 67 (14.7%) |
| 3-Person Households | 78 (17.1%) | 0 (0.0%) |
| 4-Person Households | 48 (10.5%) | 0 (0.0%) |
| 5-Person Households | 11 (2.4%) | 0 (0.0%) |
| 6-Person Households | 0 (0.0%) | 0 (0.0%) |
| 7+ Person Households | 9 (2.0%) | 0 (0.0%) |
| Total | 260 (56.9%) | 197 (43.1%) |
Female Fertility in North Bonneville
Fertility by Age in North Bonneville
| Age Bracket | Women with Births | Births / 1,000 Women |
| 15 to 19 years | 0 (0.0%) | 0.0 |
| 20 to 34 years | 0 (0.0%) | 0.0 |
| 35 to 50 years | 0 (0.0%) | 0.0 |
| Total | 0 (0.0%) | 0.0 |
Fertility by Age by Marriage Status in North Bonneville
| Age Bracket | Married | Unmarried |
| 15 to 19 years | 0 (0.0%) | 0 (0.0%) |
| 20 to 34 years | 0 (0.0%) | 0 (0.0%) |
| 35 to 50 years | 0 (0.0%) | 0 (0.0%) |
| Total | 0 (0.0%) | 0 (0.0%) |
Fertility by Education in North Bonneville
| Educational Attainment | Women with Births | Births / 1,000 Women |
| Less than High School | 0 (0.0%) | 0.0 |
| High School Diploma | 0 (0.0%) | 0.0 |
| College or Associate's Degree | 0 (0.0%) | 0.0 |
| Bachelor's Degree | 0 (0.0%) | 0.0 |
| Graduate Degree | 0 (0.0%) | 0.0 |
| Total | 0 (0.0%) | 0.0 |
Fertility by Education by Marriage Status in North Bonneville
| Educational Attainment | Married | Unmarried |
| Less than High School | 0 (0.0%) | 0 (0.0%) |
| High School Diploma | 0 (0.0%) | 0 (0.0%) |
| College or Associate's Degree | 0 (0.0%) | 0 (0.0%) |
| Bachelor's Degree | 0 (0.0%) | 0 (0.0%) |
| Graduate Degree | 0 (0.0%) | 0 (0.0%) |
| Total | 0 (0.0%) | 0 (0.0%) |
Employment Characteristics in North Bonneville
Employment by Class of Employer in North Bonneville
Among the 576 employed individuals in North Bonneville, private company employees (351 | 60.9%), local government employees (90 | 15.6%), and self-employed (not incorporated) (53 | 9.2%) make up the most common classes of employment.
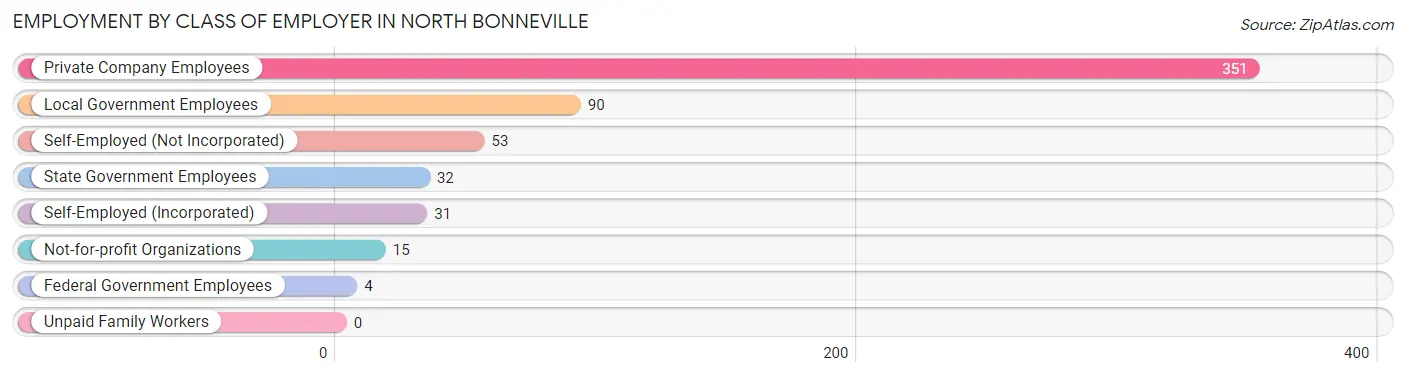
| Employer Class | # Employees | % Employees |
| Private Company Employees | 351 | 60.9% |
| Self-Employed (Incorporated) | 31 | 5.4% |
| Self-Employed (Not Incorporated) | 53 | 9.2% |
| Not-for-profit Organizations | 15 | 2.6% |
| Local Government Employees | 90 | 15.6% |
| State Government Employees | 32 | 5.6% |
| Federal Government Employees | 4 | 0.7% |
| Unpaid Family Workers | 0 | 0.0% |
| Total | 576 | 100.0% |
Employment Status by Age in North Bonneville
According to the labor force statistics for North Bonneville, out of the total population over 16 years of age (923), 69.9% or 645 individuals are in the labor force, with 7.3% or 47 of them unemployed. The age group with the highest labor force participation rate is 20 to 24 years, with 100.0% or 70 individuals in the labor force. Within the labor force, the 20 to 24 years age range has the highest percentage of unemployed individuals, with 31.4% or 22 of them being unemployed.
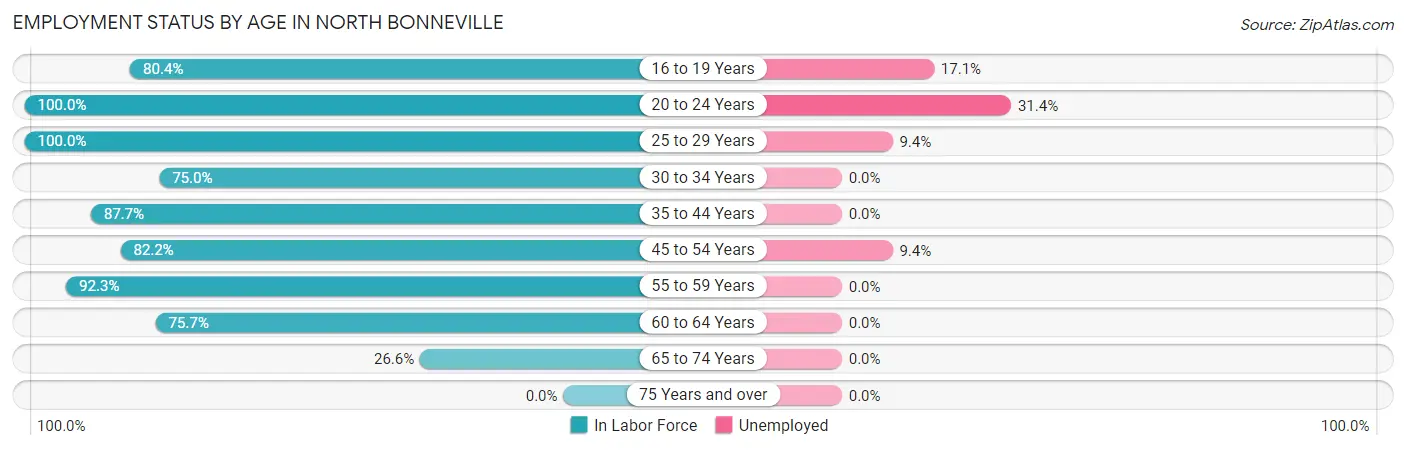
| Age Bracket | In Labor Force | Unemployed |
| 16 to 19 Years | 41 (80.4%) | 7 (17.1%) |
| 20 to 24 Years | 70 (100.0%) | 22 (31.4%) |
| 25 to 29 Years | 53 (100.0%) | 5 (9.4%) |
| 30 to 34 Years | 48 (75.0%) | 0 (0.0%) |
| 35 to 44 Years | 143 (87.7%) | 0 (0.0%) |
| 45 to 54 Years | 139 (82.2%) | 13 (9.4%) |
| 55 to 59 Years | 48 (92.3%) | 0 (0.0%) |
| 60 to 64 Years | 78 (75.7%) | 0 (0.0%) |
| 65 to 74 Years | 25 (26.6%) | 0 (0.0%) |
| 75 Years and over | 0 (0.0%) | 0 (0.0%) |
| Total | 645 (69.9%) | 47 (7.3%) |
Employment Status by Educational Attainment in North Bonneville
According to labor force statistics for North Bonneville, 84.3% of individuals (509) out of the total population between 25 and 64 years of age (604) are in the labor force, with 3.5% or 18 of them being unemployed. The group with the highest labor force participation rate are those with the educational attainment of less than high school, with 100.0% or 16 individuals in the labor force. Within the labor force, individuals with high school diploma education have the highest percentage of unemployment, with 9.2% or 13 of them being unemployed.
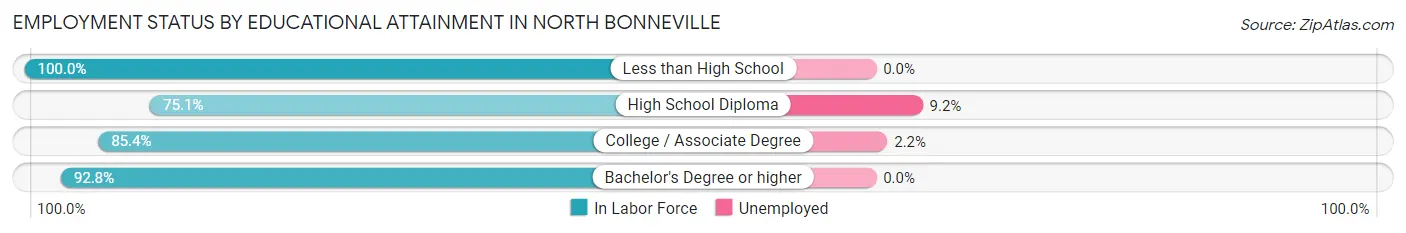
| Educational Attainment | In Labor Force | Unemployed |
| Less than High School | 16 (100.0%) | 0 (0.0%) |
| High School Diploma | 142 (75.1%) | 17 (9.2%) |
| College / Associate Degree | 223 (85.4%) | 6 (2.2%) |
| Bachelor's Degree or higher | 128 (92.8%) | 0 (0.0%) |
| Total | 509 (84.3%) | 21 (3.5%) |
Employment Occupations by Sex in North Bonneville
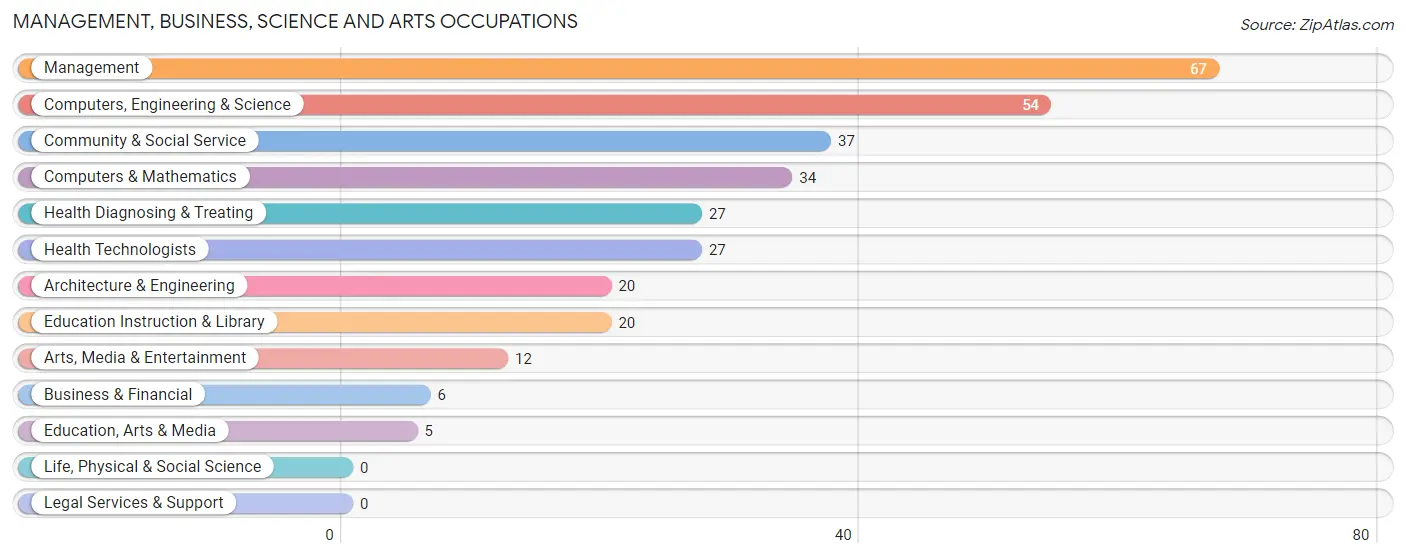
Management, Business, Science and Arts Occupations
The most common Management, Business, Science and Arts occupations in North Bonneville are Management (67 | 11.2%), Computers, Engineering & Science (54 | 9.0%), Community & Social Service (37 | 6.2%), Computers & Mathematics (34 | 5.7%), and Health Diagnosing & Treating (27 | 4.5%).
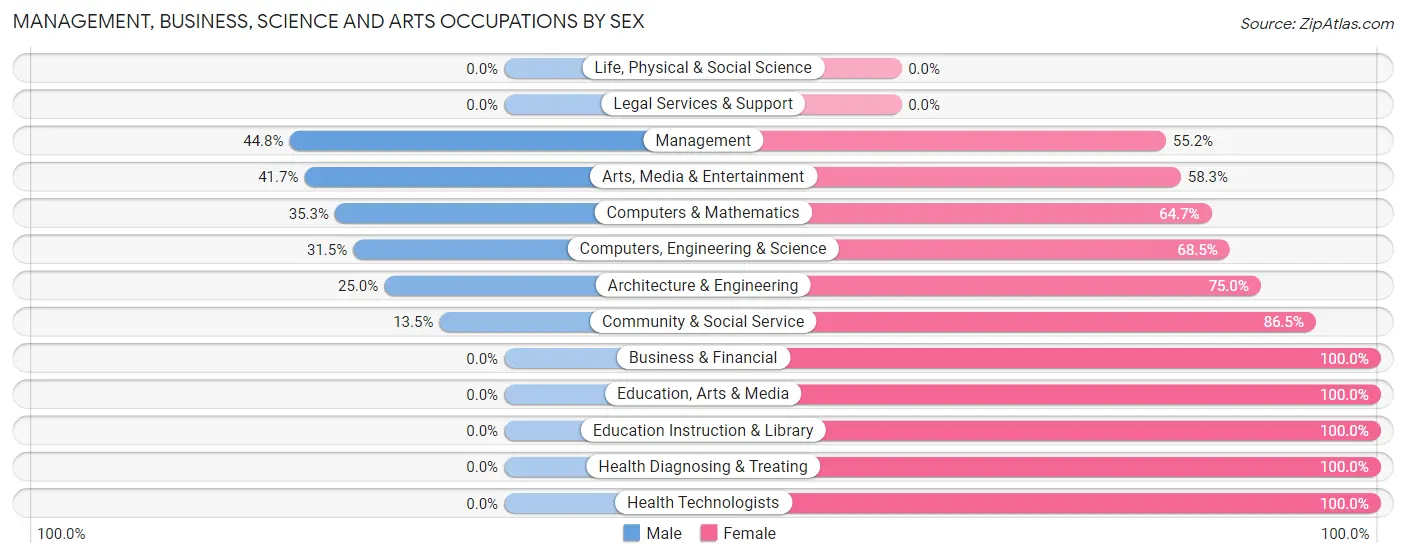
Management, Business, Science and Arts Occupations by Sex
Within the Management, Business, Science and Arts occupations in North Bonneville, the most male-oriented occupations are Management (44.8%), Arts, Media & Entertainment (41.7%), and Computers & Mathematics (35.3%), while the most female-oriented occupations are Business & Financial (100.0%), Education, Arts & Media (100.0%), and Education Instruction & Library (100.0%).
| Occupation | Male | Female |
| Management | 30 (44.8%) | 37 (55.2%) |
| Business & Financial | 0 (0.0%) | 6 (100.0%) |
| Computers, Engineering & Science | 17 (31.5%) | 37 (68.5%) |
| Computers & Mathematics | 12 (35.3%) | 22 (64.7%) |
| Architecture & Engineering | 5 (25.0%) | 15 (75.0%) |
| Life, Physical & Social Science | 0 (0.0%) | 0 (0.0%) |
| Community & Social Service | 5 (13.5%) | 32 (86.5%) |
| Education, Arts & Media | 0 (0.0%) | 5 (100.0%) |
| Legal Services & Support | 0 (0.0%) | 0 (0.0%) |
| Education Instruction & Library | 0 (0.0%) | 20 (100.0%) |
| Arts, Media & Entertainment | 5 (41.7%) | 7 (58.3%) |
| Health Diagnosing & Treating | 0 (0.0%) | 27 (100.0%) |
| Health Technologists | 0 (0.0%) | 27 (100.0%) |
| Total (Category) | 52 (27.2%) | 139 (72.8%) |
| Total (Overall) | 295 (49.3%) | 303 (50.7%) |
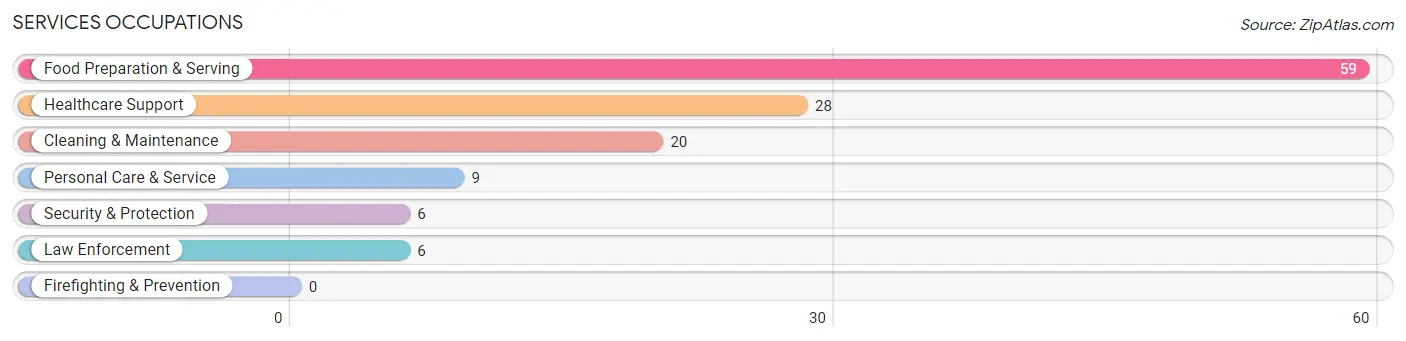
Services Occupations
The most common Services occupations in North Bonneville are Food Preparation & Serving (59 | 9.9%), Healthcare Support (28 | 4.7%), Cleaning & Maintenance (20 | 3.3%), Personal Care & Service (9 | 1.5%), and Security & Protection (6 | 1.0%).
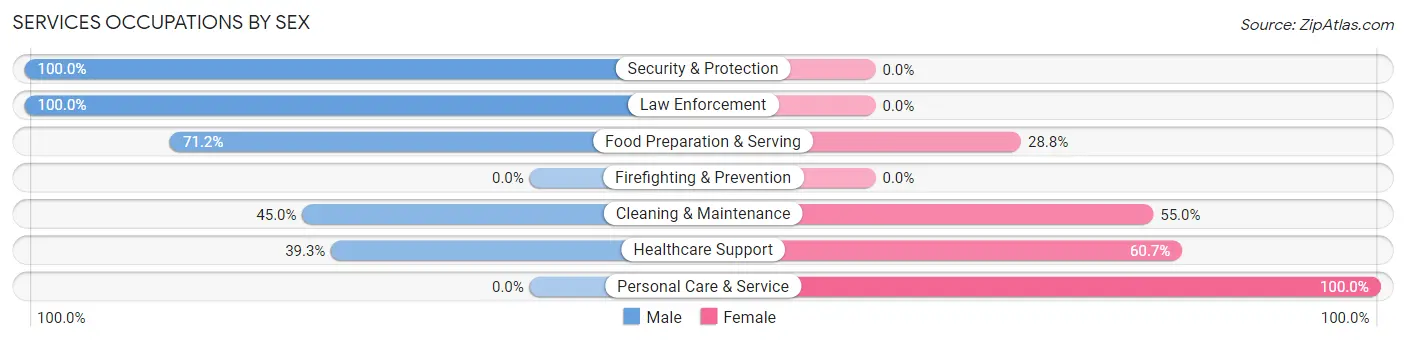
Services Occupations by Sex
Within the Services occupations in North Bonneville, the most male-oriented occupations are Security & Protection (100.0%), Law Enforcement (100.0%), and Food Preparation & Serving (71.2%), while the most female-oriented occupations are Personal Care & Service (100.0%), Healthcare Support (60.7%), and Cleaning & Maintenance (55.0%).
| Occupation | Male | Female |
| Healthcare Support | 11 (39.3%) | 17 (60.7%) |
| Security & Protection | 6 (100.0%) | 0 (0.0%) |
| Firefighting & Prevention | 0 (0.0%) | 0 (0.0%) |
| Law Enforcement | 6 (100.0%) | 0 (0.0%) |
| Food Preparation & Serving | 42 (71.2%) | 17 (28.8%) |
| Cleaning & Maintenance | 9 (45.0%) | 11 (55.0%) |
| Personal Care & Service | 0 (0.0%) | 9 (100.0%) |
| Total (Category) | 68 (55.7%) | 54 (44.3%) |
| Total (Overall) | 295 (49.3%) | 303 (50.7%) |
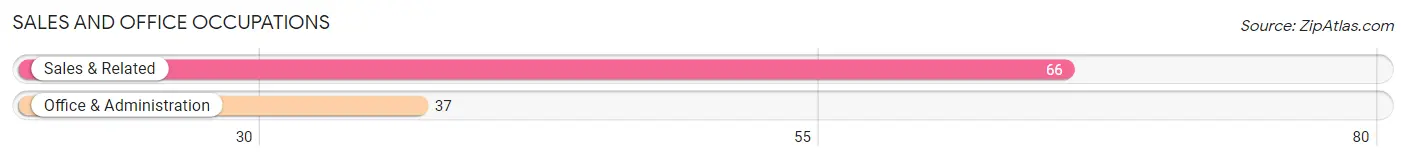
Sales and Office Occupations
The most common Sales and Office occupations in North Bonneville are Sales & Related (66 | 11.0%), and Office & Administration (37 | 6.2%).
Sales and Office Occupations by Sex
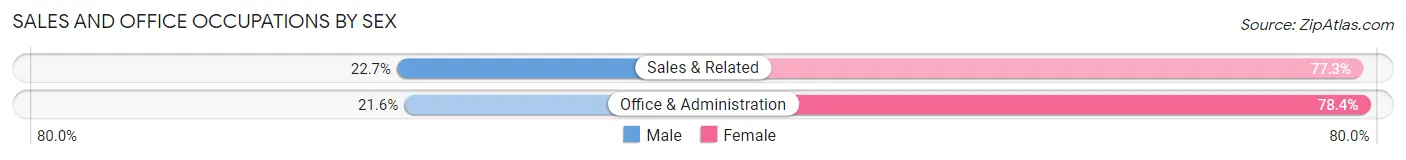
| Occupation | Male | Female |
| Sales & Related | 15 (22.7%) | 51 (77.3%) |
| Office & Administration | 8 (21.6%) | 29 (78.4%) |
| Total (Category) | 23 (22.3%) | 80 (77.7%) |
| Total (Overall) | 295 (49.3%) | 303 (50.7%) |
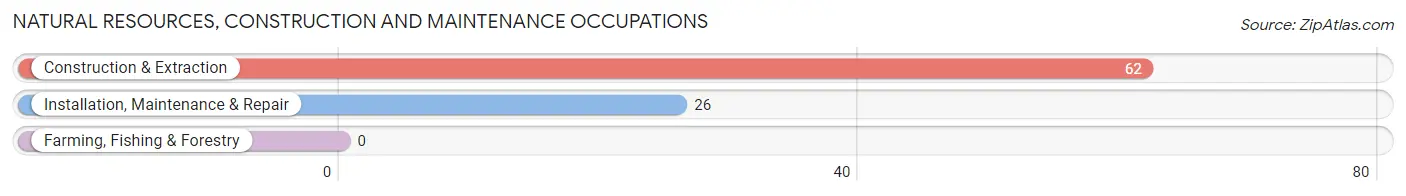
Natural Resources, Construction and Maintenance Occupations
The most common Natural Resources, Construction and Maintenance occupations in North Bonneville are Construction & Extraction (62 | 10.4%), and Installation, Maintenance & Repair (26 | 4.3%).
Natural Resources, Construction and Maintenance Occupations by Sex
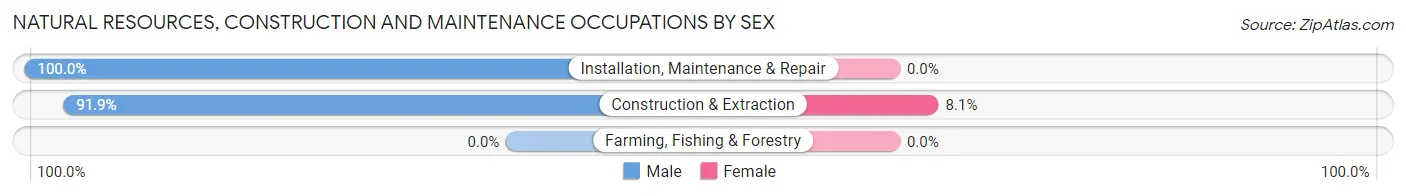
| Occupation | Male | Female |
| Farming, Fishing & Forestry | 0 (0.0%) | 0 (0.0%) |
| Construction & Extraction | 57 (91.9%) | 5 (8.1%) |
| Installation, Maintenance & Repair | 26 (100.0%) | 0 (0.0%) |
| Total (Category) | 83 (94.3%) | 5 (5.7%) |
| Total (Overall) | 295 (49.3%) | 303 (50.7%) |
Production, Transportation and Moving Occupations
The most common Production, Transportation and Moving occupations in North Bonneville are Transportation (40 | 6.7%), Material Moving (32 | 5.3%), and Production (22 | 3.7%).
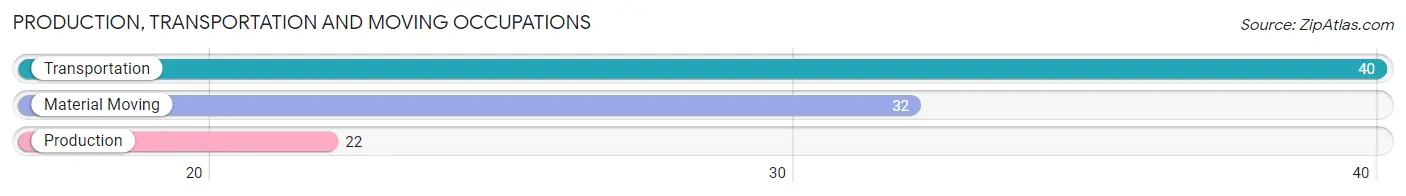
Production, Transportation and Moving Occupations by Sex
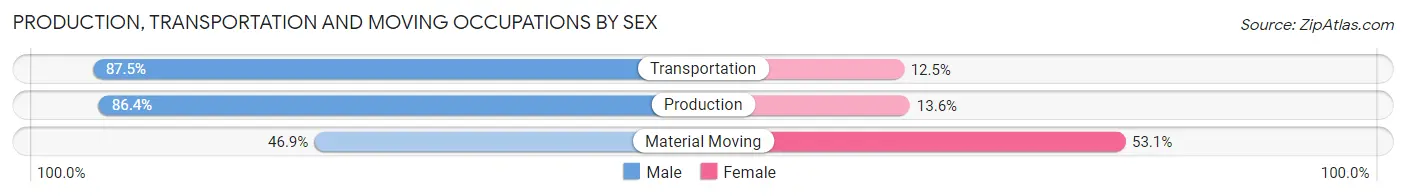
| Occupation | Male | Female |
| Production | 19 (86.4%) | 3 (13.6%) |
| Transportation | 35 (87.5%) | 5 (12.5%) |
| Material Moving | 15 (46.9%) | 17 (53.1%) |
| Total (Category) | 69 (73.4%) | 25 (26.6%) |
| Total (Overall) | 295 (49.3%) | 303 (50.7%) |
Employment Industries by Sex in North Bonneville
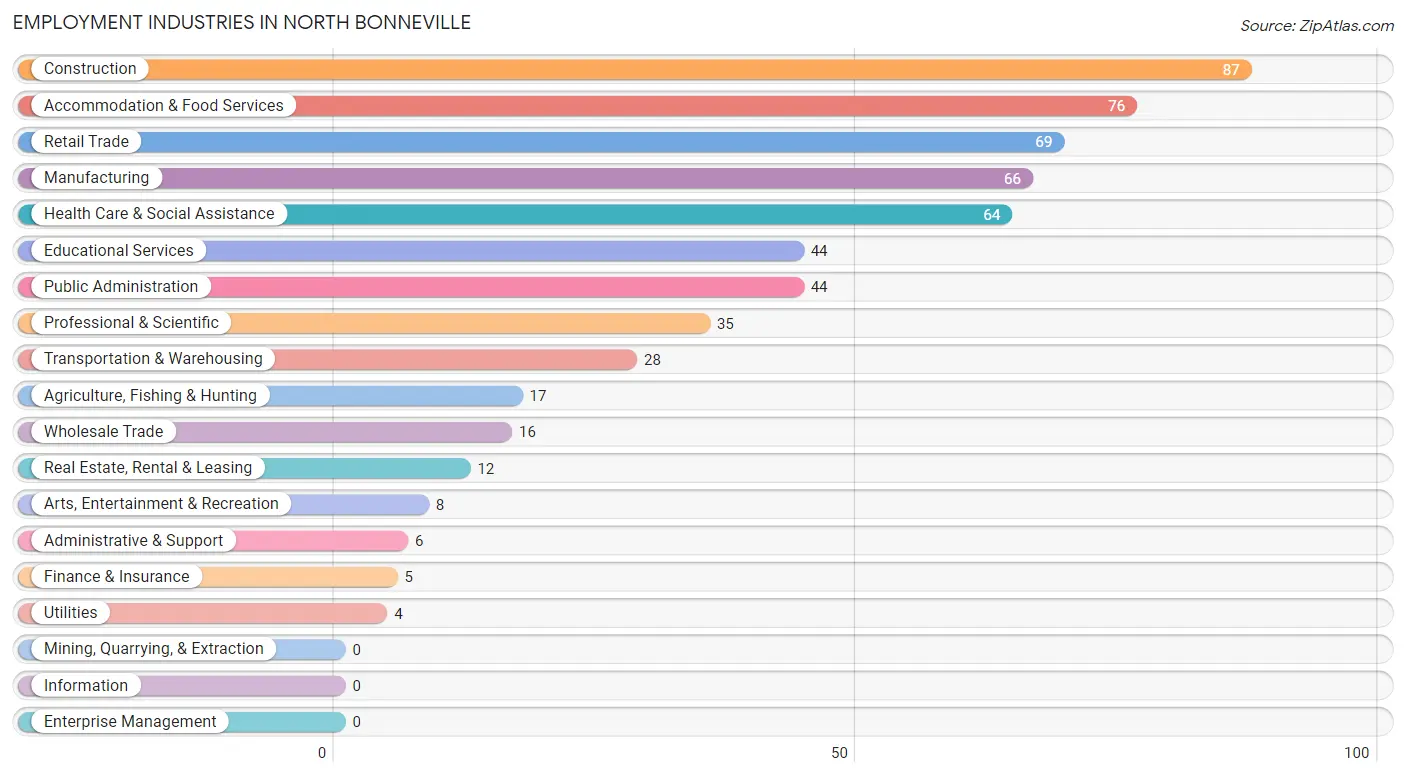
Employment Industries in North Bonneville
The major employment industries in North Bonneville include Construction (87 | 14.5%), Accommodation & Food Services (76 | 12.7%), Retail Trade (69 | 11.5%), Manufacturing (66 | 11.0%), and Health Care & Social Assistance (64 | 10.7%).
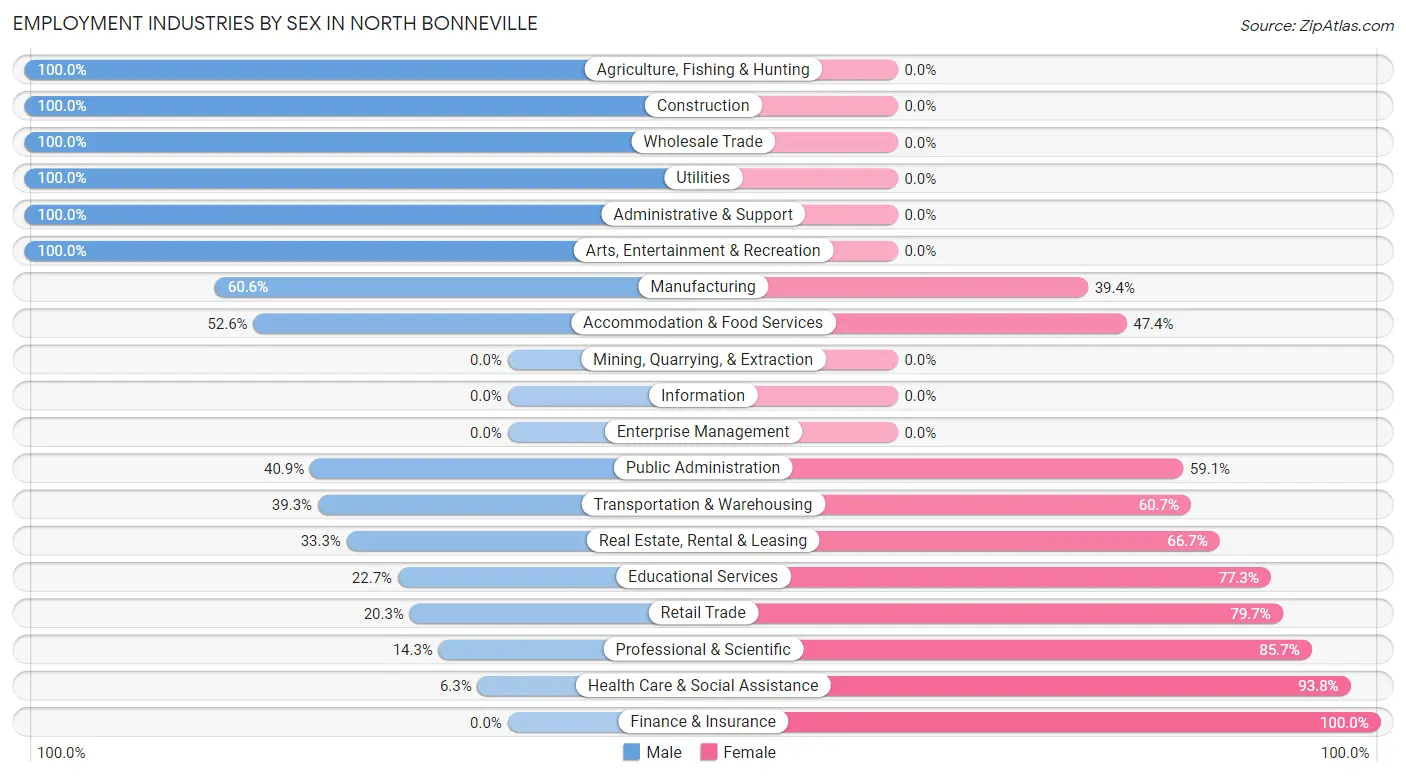
Employment Industries by Sex in North Bonneville
The North Bonneville industries that see more men than women are Agriculture, Fishing & Hunting (100.0%), Construction (100.0%), and Wholesale Trade (100.0%), whereas the industries that tend to have a higher number of women are Finance & Insurance (100.0%), Health Care & Social Assistance (93.8%), and Professional & Scientific (85.7%).
| Industry | Male | Female |
| Agriculture, Fishing & Hunting | 17 (100.0%) | 0 (0.0%) |
| Mining, Quarrying, & Extraction | 0 (0.0%) | 0 (0.0%) |
| Construction | 87 (100.0%) | 0 (0.0%) |
| Manufacturing | 40 (60.6%) | 26 (39.4%) |
| Wholesale Trade | 16 (100.0%) | 0 (0.0%) |
| Retail Trade | 14 (20.3%) | 55 (79.7%) |
| Transportation & Warehousing | 11 (39.3%) | 17 (60.7%) |
| Utilities | 4 (100.0%) | 0 (0.0%) |
| Information | 0 (0.0%) | 0 (0.0%) |
| Finance & Insurance | 0 (0.0%) | 5 (100.0%) |
| Real Estate, Rental & Leasing | 4 (33.3%) | 8 (66.7%) |
| Professional & Scientific | 5 (14.3%) | 30 (85.7%) |
| Enterprise Management | 0 (0.0%) | 0 (0.0%) |
| Administrative & Support | 6 (100.0%) | 0 (0.0%) |
| Educational Services | 10 (22.7%) | 34 (77.3%) |
| Health Care & Social Assistance | 4 (6.2%) | 60 (93.8%) |
| Arts, Entertainment & Recreation | 8 (100.0%) | 0 (0.0%) |
| Accommodation & Food Services | 40 (52.6%) | 36 (47.4%) |
| Public Administration | 18 (40.9%) | 26 (59.1%) |
| Total | 295 (49.3%) | 303 (50.7%) |
Education in North Bonneville
School Enrollment in North Bonneville
The most common levels of schooling among the 242 students in North Bonneville are middle school (83 | 34.3%), high school (64 | 26.5%), and elementary school (51 | 21.1%).
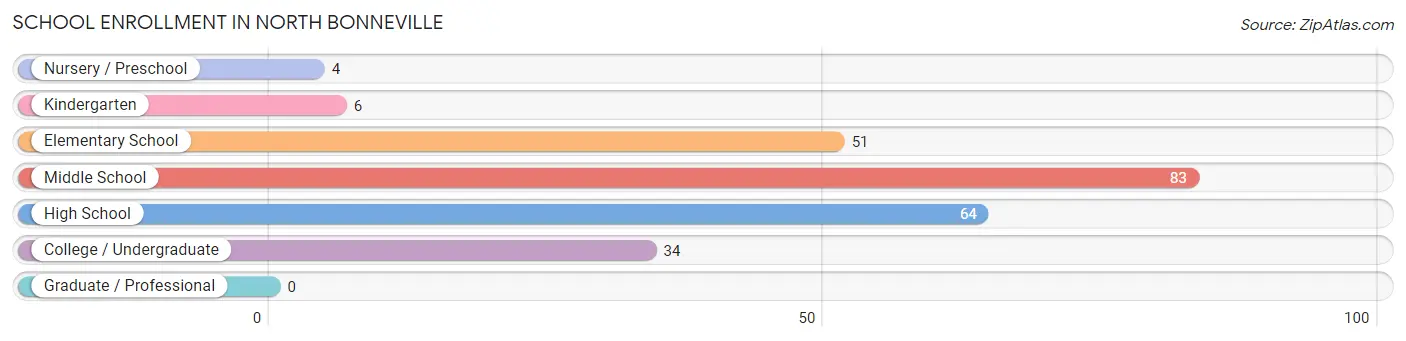
| School Level | # Students | % Students |
| Nursery / Preschool | 4 | 1.7% |
| Kindergarten | 6 | 2.5% |
| Elementary School | 51 | 21.1% |
| Middle School | 83 | 34.3% |
| High School | 64 | 26.5% |
| College / Undergraduate | 34 | 14.1% |
| Graduate / Professional | 0 | 0.0% |
| Total | 242 | 100.0% |
School Enrollment by Age by Funding Source in North Bonneville
Out of a total of 242 students who are enrolled in schools in North Bonneville, 24 (9.9%) attend a private institution, while the remaining 218 (90.1%) are enrolled in public schools. The age group of 25 to 34 year olds has the highest likelihood of being enrolled in private schools, with 4 (44.4% in the age bracket) enrolled. Conversely, the age group of 3 to 4 year olds has the lowest likelihood of being enrolled in a private school, with 4 (100.0% in the age bracket) attending a public institution.
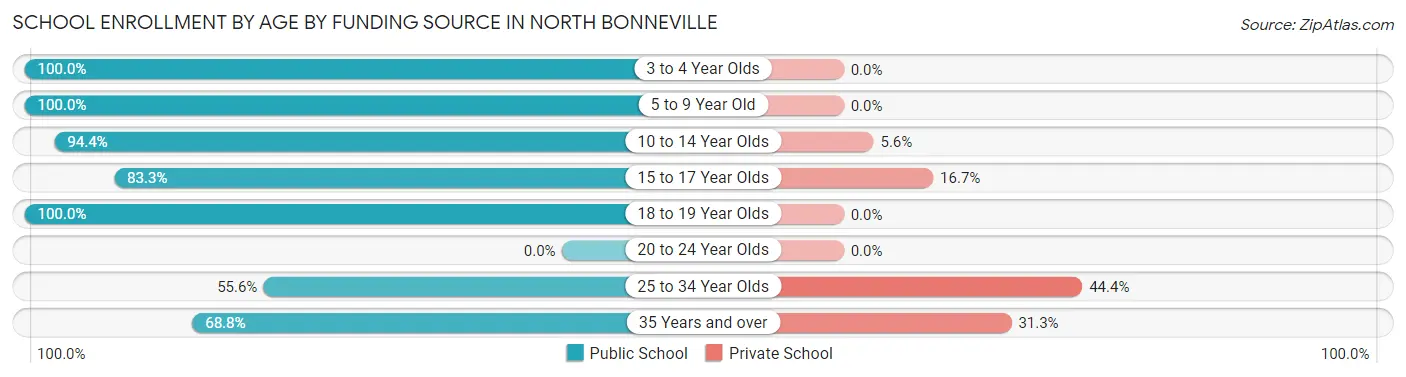
| Age Bracket | Public School | Private School |
| 3 to 4 Year Olds | 4 (100.0%) | 0 (0.0%) |
| 5 to 9 Year Old | 54 (100.0%) | 0 (0.0%) |
| 10 to 14 Year Olds | 85 (94.4%) | 5 (5.6%) |
| 15 to 17 Year Olds | 50 (83.3%) | 10 (16.7%) |
| 18 to 19 Year Olds | 9 (100.0%) | 0 (0.0%) |
| 20 to 24 Year Olds | 0 (0.0%) | 0 (0.0%) |
| 25 to 34 Year Olds | 5 (55.6%) | 4 (44.4%) |
| 35 Years and over | 11 (68.8%) | 5 (31.2%) |
| Total | 218 (90.1%) | 24 (9.9%) |
Educational Attainment by Field of Study in North Bonneville
Business (50 | 26.3%), education (41 | 21.6%), science & technology (38 | 20.0%), bio, nature & agricultural (16 | 8.4%), and psychology (15 | 7.9%) are the most common fields of study among 190 individuals in North Bonneville who have obtained a bachelor's degree or higher.
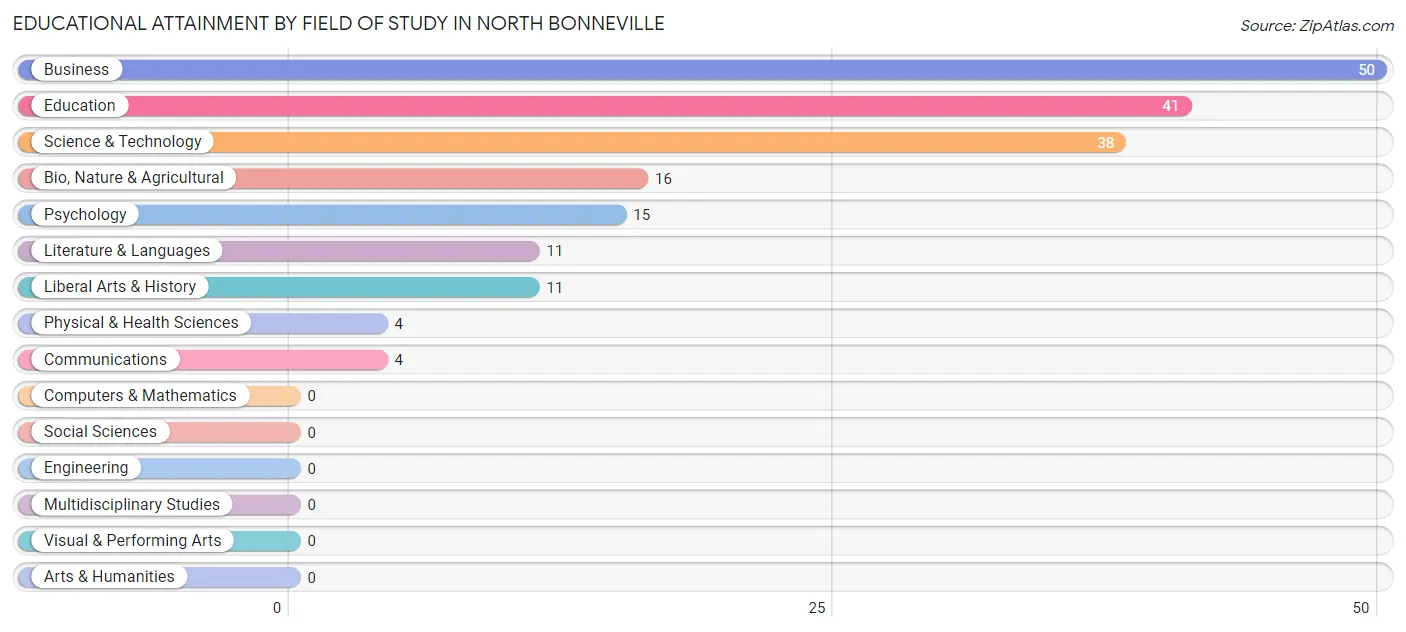
| Field of Study | # Graduates | % Graduates |
| Computers & Mathematics | 0 | 0.0% |
| Bio, Nature & Agricultural | 16 | 8.4% |
| Physical & Health Sciences | 4 | 2.1% |
| Psychology | 15 | 7.9% |
| Social Sciences | 0 | 0.0% |
| Engineering | 0 | 0.0% |
| Multidisciplinary Studies | 0 | 0.0% |
| Science & Technology | 38 | 20.0% |
| Business | 50 | 26.3% |
| Education | 41 | 21.6% |
| Literature & Languages | 11 | 5.8% |
| Liberal Arts & History | 11 | 5.8% |
| Visual & Performing Arts | 0 | 0.0% |
| Communications | 4 | 2.1% |
| Arts & Humanities | 0 | 0.0% |
| Total | 190 | 100.0% |
Transportation & Commute in North Bonneville
Vehicle Availability by Sex in North Bonneville
The most prevalent vehicle ownership categories in North Bonneville are males with 2 vehicles (109, accounting for 39.2%) and females with 2 vehicles (125, making up 36.6%).
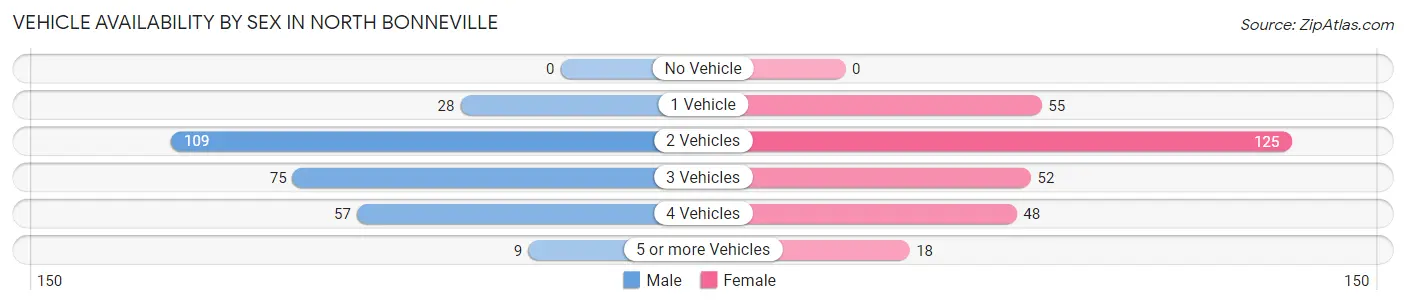
| Vehicles Available | Male | Female |
| No Vehicle | 0 (0.0%) | 0 (0.0%) |
| 1 Vehicle | 28 (10.1%) | 55 (18.5%) |
| 2 Vehicles | 109 (39.2%) | 125 (41.9%) |
| 3 Vehicles | 75 (27.0%) | 52 (17.4%) |
| 4 Vehicles | 57 (20.5%) | 48 (16.1%) |
| 5 or more Vehicles | 9 (3.2%) | 18 (6.0%) |
| Total | 278 (100.0%) | 298 (100.0%) |
Commute Time in North Bonneville
The most frequently occuring commute durations in North Bonneville are 10 to 14 minutes (103 commuters, 20.3%), 30 to 34 minutes (73 commuters, 14.4%), and 60 to 89 minutes (64 commuters, 12.6%).
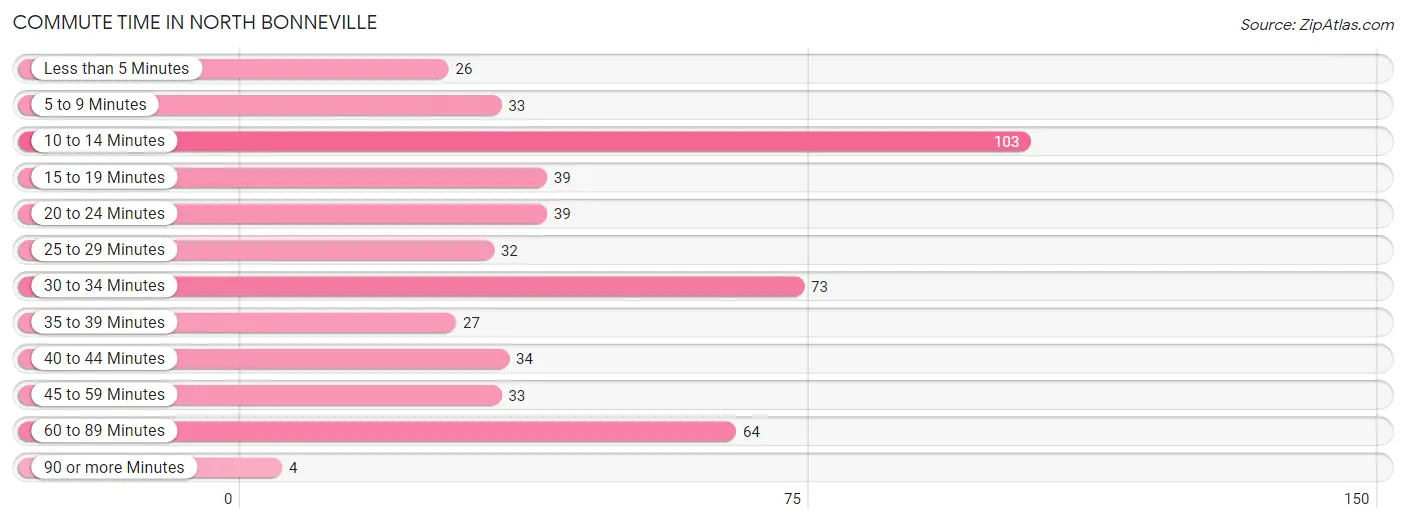
| Commute Time | # Commuters | % Commuters |
| Less than 5 Minutes | 26 | 5.1% |
| 5 to 9 Minutes | 33 | 6.5% |
| 10 to 14 Minutes | 103 | 20.3% |
| 15 to 19 Minutes | 39 | 7.7% |
| 20 to 24 Minutes | 39 | 7.7% |
| 25 to 29 Minutes | 32 | 6.3% |
| 30 to 34 Minutes | 73 | 14.4% |
| 35 to 39 Minutes | 27 | 5.3% |
| 40 to 44 Minutes | 34 | 6.7% |
| 45 to 59 Minutes | 33 | 6.5% |
| 60 to 89 Minutes | 64 | 12.6% |
| 90 or more Minutes | 4 | 0.8% |
Commute Time by Sex in North Bonneville
The most common commute times in North Bonneville are 10 to 14 minutes (67 commuters, 27.2%) for males and 30 to 34 minutes (43 commuters, 16.5%) for females.
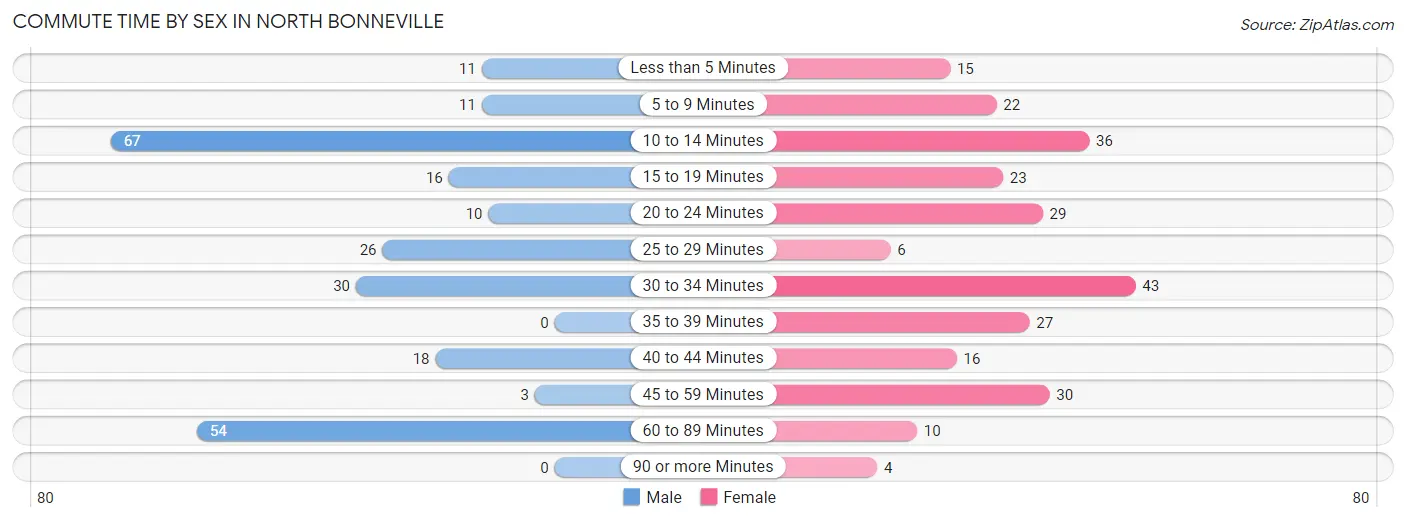
| Commute Time | Male | Female |
| Less than 5 Minutes | 11 (4.5%) | 15 (5.8%) |
| 5 to 9 Minutes | 11 (4.5%) | 22 (8.4%) |
| 10 to 14 Minutes | 67 (27.2%) | 36 (13.8%) |
| 15 to 19 Minutes | 16 (6.5%) | 23 (8.8%) |
| 20 to 24 Minutes | 10 (4.1%) | 29 (11.1%) |
| 25 to 29 Minutes | 26 (10.6%) | 6 (2.3%) |
| 30 to 34 Minutes | 30 (12.2%) | 43 (16.5%) |
| 35 to 39 Minutes | 0 (0.0%) | 27 (10.3%) |
| 40 to 44 Minutes | 18 (7.3%) | 16 (6.1%) |
| 45 to 59 Minutes | 3 (1.2%) | 30 (11.5%) |
| 60 to 89 Minutes | 54 (22.0%) | 10 (3.8%) |
| 90 or more Minutes | 0 (0.0%) | 4 (1.5%) |
Time of Departure to Work by Sex in North Bonneville
The most frequent times of departure to work in North Bonneville are 12:00 AM to 4:59 AM (37, 15.0%) for males and 7:30 AM to 7:59 AM (39, 14.9%) for females.
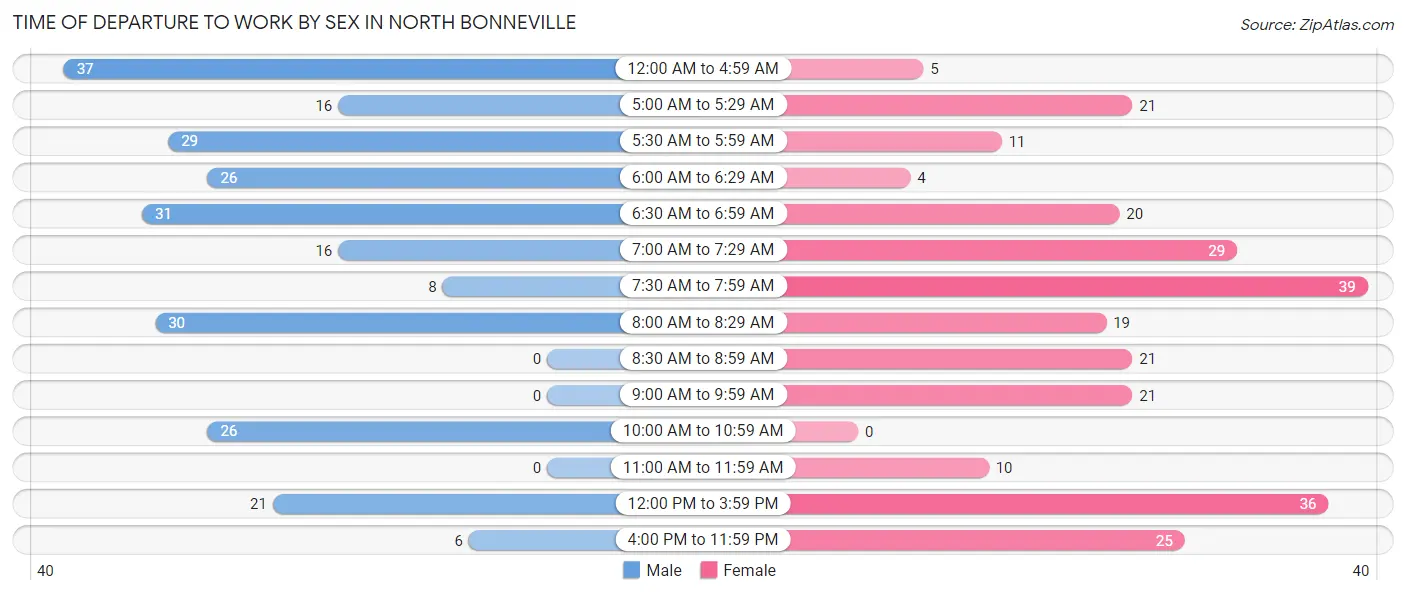
| Time of Departure | Male | Female |
| 12:00 AM to 4:59 AM | 37 (15.0%) | 5 (1.9%) |
| 5:00 AM to 5:29 AM | 16 (6.5%) | 21 (8.1%) |
| 5:30 AM to 5:59 AM | 29 (11.8%) | 11 (4.2%) |
| 6:00 AM to 6:29 AM | 26 (10.6%) | 4 (1.5%) |
| 6:30 AM to 6:59 AM | 31 (12.6%) | 20 (7.7%) |
| 7:00 AM to 7:29 AM | 16 (6.5%) | 29 (11.1%) |
| 7:30 AM to 7:59 AM | 8 (3.3%) | 39 (14.9%) |
| 8:00 AM to 8:29 AM | 30 (12.2%) | 19 (7.3%) |
| 8:30 AM to 8:59 AM | 0 (0.0%) | 21 (8.1%) |
| 9:00 AM to 9:59 AM | 0 (0.0%) | 21 (8.1%) |
| 10:00 AM to 10:59 AM | 26 (10.6%) | 0 (0.0%) |
| 11:00 AM to 11:59 AM | 0 (0.0%) | 10 (3.8%) |
| 12:00 PM to 3:59 PM | 21 (8.5%) | 36 (13.8%) |
| 4:00 PM to 11:59 PM | 6 (2.4%) | 25 (9.6%) |
| Total | 246 (100.0%) | 261 (100.0%) |
Housing Occupancy in North Bonneville
Occupancy by Ownership in North Bonneville
Of the total 457 dwellings in North Bonneville, owner-occupied units account for 308 (67.4%), while renter-occupied units make up 149 (32.6%).
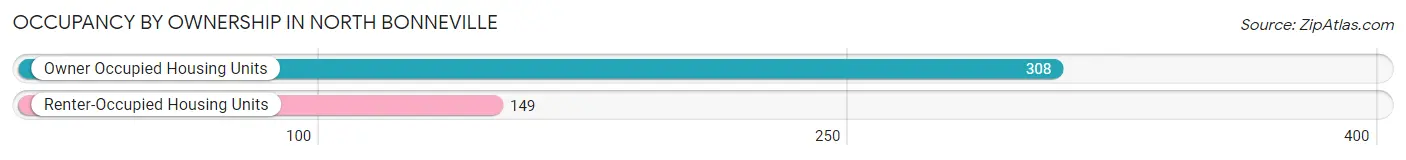
| Occupancy | # Housing Units | % Housing Units |
| Owner Occupied Housing Units | 308 | 67.4% |
| Renter-Occupied Housing Units | 149 | 32.6% |
| Total Occupied Housing Units | 457 | 100.0% |
Occupancy by Household Size in North Bonneville
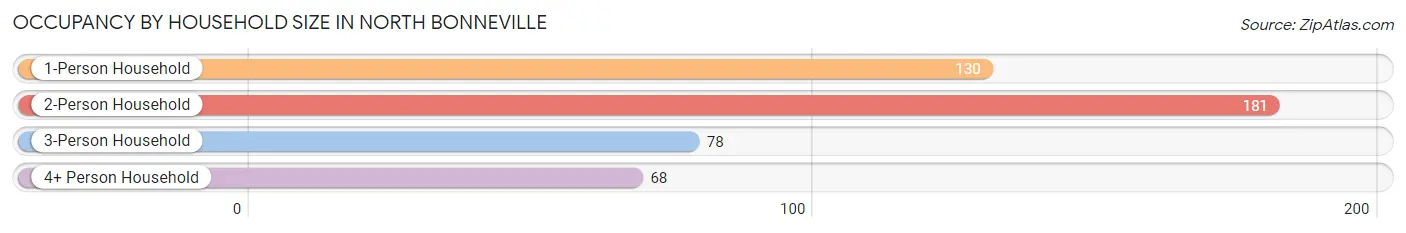
| Household Size | # Housing Units | % Housing Units |
| 1-Person Household | 130 | 28.4% |
| 2-Person Household | 181 | 39.6% |
| 3-Person Household | 78 | 17.1% |
| 4+ Person Household | 68 | 14.9% |
| Total Housing Units | 457 | 100.0% |
Occupancy by Ownership by Household Size in North Bonneville
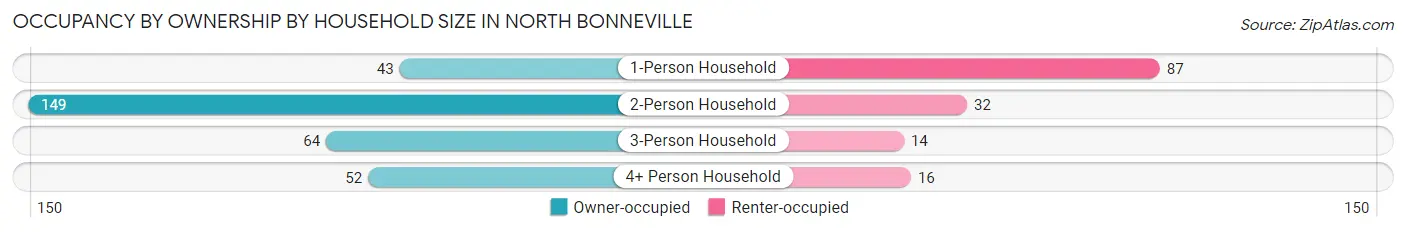
| Household Size | Owner-occupied | Renter-occupied |
| 1-Person Household | 43 (33.1%) | 87 (66.9%) |
| 2-Person Household | 149 (82.3%) | 32 (17.7%) |
| 3-Person Household | 64 (82.1%) | 14 (17.9%) |
| 4+ Person Household | 52 (76.5%) | 16 (23.5%) |
| Total Housing Units | 308 (67.4%) | 149 (32.6%) |
Occupancy by Educational Attainment in North Bonneville
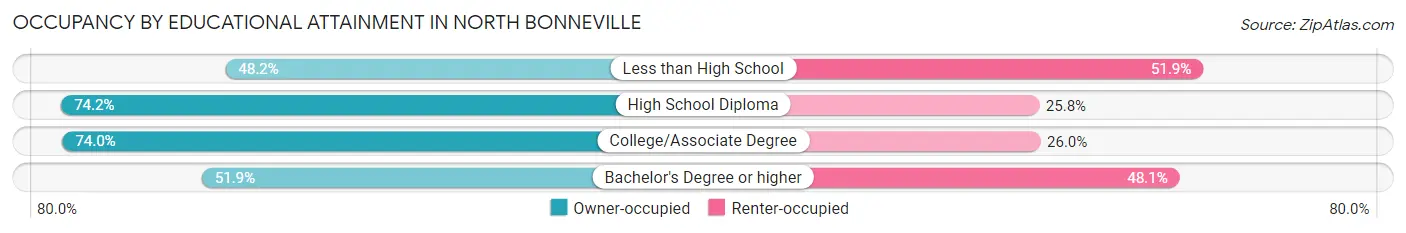
| Household Size | Owner-occupied | Renter-occupied |
| Less than High School | 13 (48.1%) | 14 (51.8%) |
| High School Diploma | 92 (74.2%) | 32 (25.8%) |
| College/Associate Degree | 148 (74.0%) | 52 (26.0%) |
| Bachelor's Degree or higher | 55 (51.9%) | 51 (48.1%) |
Occupancy by Age of Householder in North Bonneville
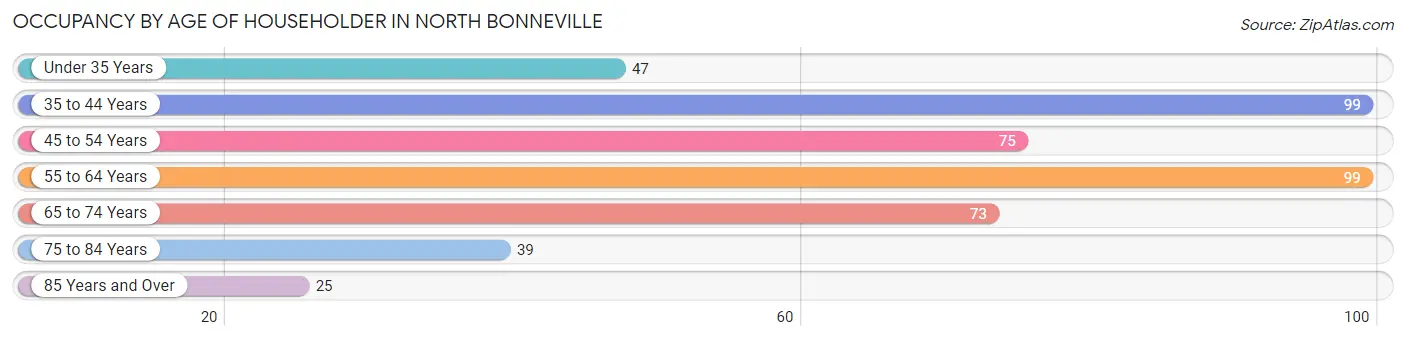
| Age Bracket | # Households | % Households |
| Under 35 Years | 47 | 10.3% |
| 35 to 44 Years | 99 | 21.7% |
| 45 to 54 Years | 75 | 16.4% |
| 55 to 64 Years | 99 | 21.7% |
| 65 to 74 Years | 73 | 16.0% |
| 75 to 84 Years | 39 | 8.5% |
| 85 Years and Over | 25 | 5.5% |
| Total | 457 | 100.0% |
Housing Finances in North Bonneville
Median Income by Occupancy in North Bonneville
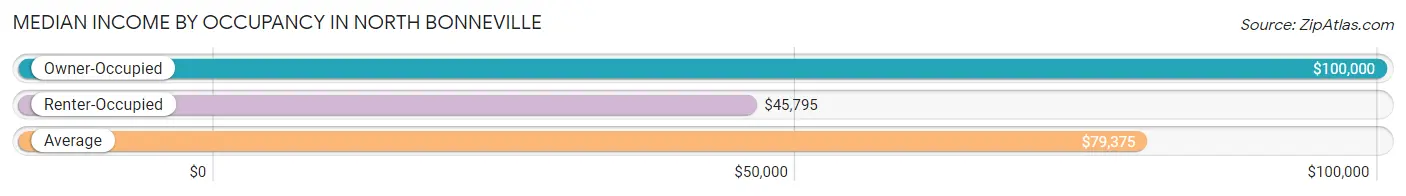
| Occupancy Type | # Households | Median Income |
| Owner-Occupied | 308 (67.4%) | $100,000 |
| Renter-Occupied | 149 (32.6%) | $45,795 |
| Average | 457 (100.0%) | $79,375 |
Occupancy by Householder Income Bracket in North Bonneville
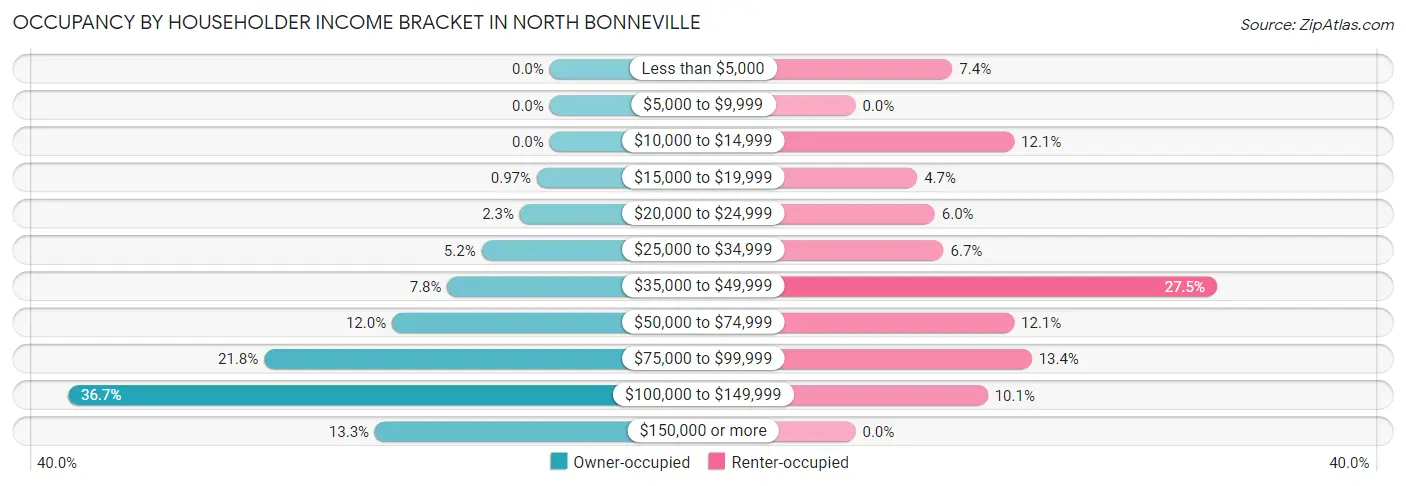
| Income Bracket | Owner-occupied | Renter-occupied |
| Less than $5,000 | 0 (0.0%) | 11 (7.4%) |
| $5,000 to $9,999 | 0 (0.0%) | 0 (0.0%) |
| $10,000 to $14,999 | 0 (0.0%) | 18 (12.1%) |
| $15,000 to $19,999 | 3 (1.0%) | 7 (4.7%) |
| $20,000 to $24,999 | 7 (2.3%) | 9 (6.0%) |
| $25,000 to $34,999 | 16 (5.2%) | 10 (6.7%) |
| $35,000 to $49,999 | 24 (7.8%) | 41 (27.5%) |
| $50,000 to $74,999 | 37 (12.0%) | 18 (12.1%) |
| $75,000 to $99,999 | 67 (21.7%) | 20 (13.4%) |
| $100,000 to $149,999 | 113 (36.7%) | 15 (10.1%) |
| $150,000 or more | 41 (13.3%) | 0 (0.0%) |
| Total | 308 (100.0%) | 149 (100.0%) |
Monthly Housing Cost Tiers in North Bonneville
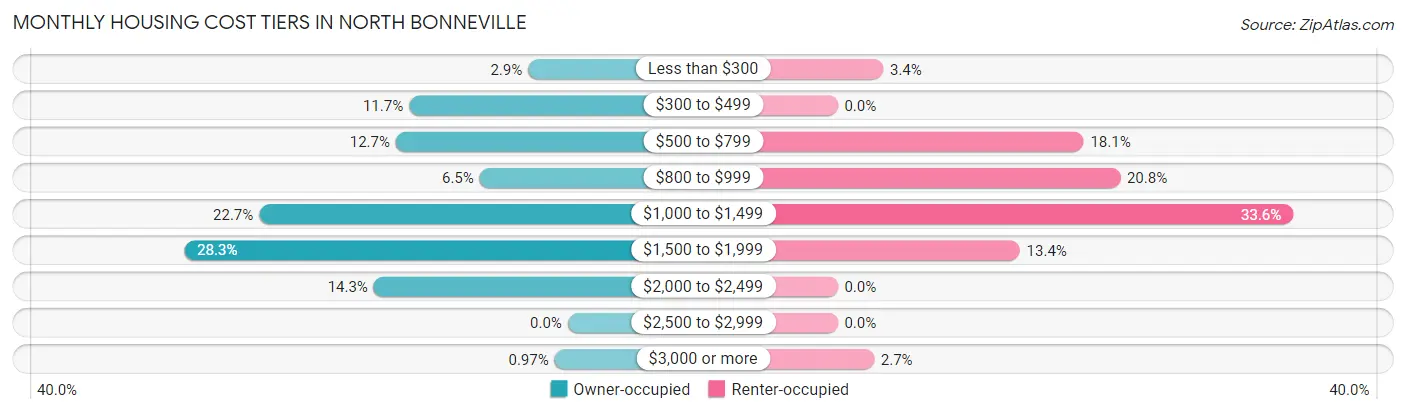
| Monthly Cost | Owner-occupied | Renter-occupied |
| Less than $300 | 9 (2.9%) | 5 (3.4%) |
| $300 to $499 | 36 (11.7%) | 0 (0.0%) |
| $500 to $799 | 39 (12.7%) | 27 (18.1%) |
| $800 to $999 | 20 (6.5%) | 31 (20.8%) |
| $1,000 to $1,499 | 70 (22.7%) | 50 (33.6%) |
| $1,500 to $1,999 | 87 (28.2%) | 20 (13.4%) |
| $2,000 to $2,499 | 44 (14.3%) | 0 (0.0%) |
| $2,500 to $2,999 | 0 (0.0%) | 0 (0.0%) |
| $3,000 or more | 3 (1.0%) | 4 (2.7%) |
| Total | 308 (100.0%) | 149 (100.0%) |
Physical Housing Characteristics in North Bonneville
Housing Structures in North Bonneville
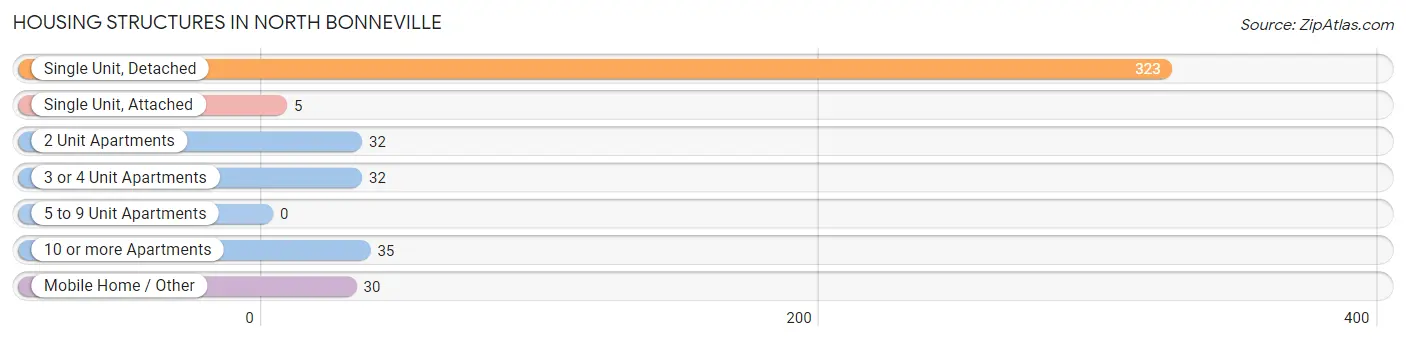
| Structure Type | # Housing Units | % Housing Units |
| Single Unit, Detached | 323 | 70.7% |
| Single Unit, Attached | 5 | 1.1% |
| 2 Unit Apartments | 32 | 7.0% |
| 3 or 4 Unit Apartments | 32 | 7.0% |
| 5 to 9 Unit Apartments | 0 | 0.0% |
| 10 or more Apartments | 35 | 7.7% |
| Mobile Home / Other | 30 | 6.6% |
| Total | 457 | 100.0% |
Housing Structures by Occupancy in North Bonneville
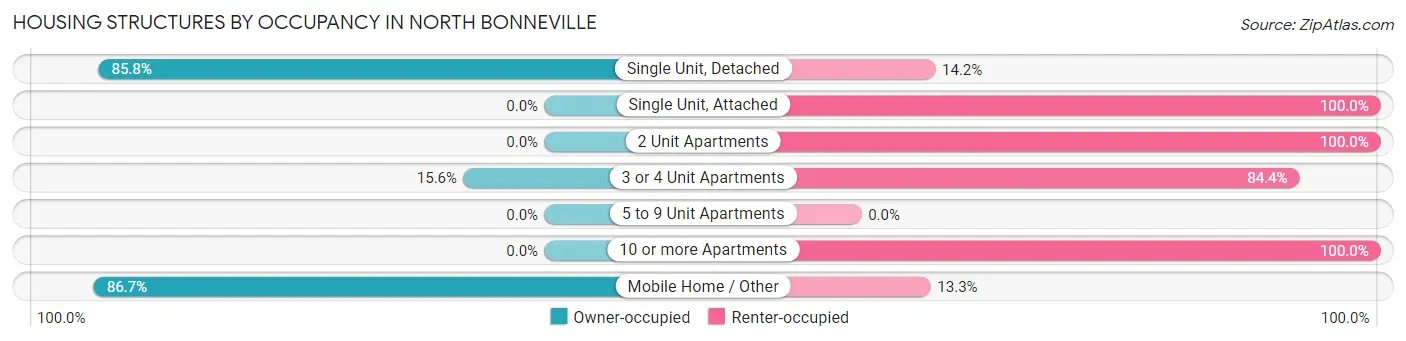
| Structure Type | Owner-occupied | Renter-occupied |
| Single Unit, Detached | 277 (85.8%) | 46 (14.2%) |
| Single Unit, Attached | 0 (0.0%) | 5 (100.0%) |
| 2 Unit Apartments | 0 (0.0%) | 32 (100.0%) |
| 3 or 4 Unit Apartments | 5 (15.6%) | 27 (84.4%) |
| 5 to 9 Unit Apartments | 0 (0.0%) | 0 (0.0%) |
| 10 or more Apartments | 0 (0.0%) | 35 (100.0%) |
| Mobile Home / Other | 26 (86.7%) | 4 (13.3%) |
| Total | 308 (67.4%) | 149 (32.6%) |
Housing Structures by Number of Rooms in North Bonneville
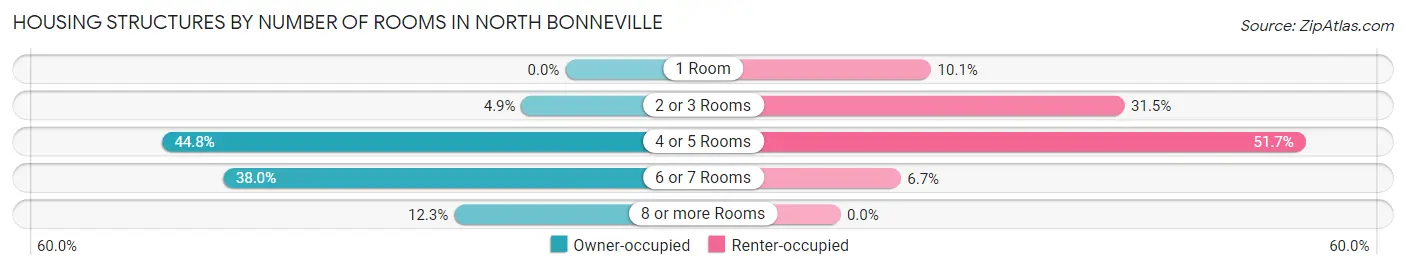
| Number of Rooms | Owner-occupied | Renter-occupied |
| 1 Room | 0 (0.0%) | 15 (10.1%) |
| 2 or 3 Rooms | 15 (4.9%) | 47 (31.5%) |
| 4 or 5 Rooms | 138 (44.8%) | 77 (51.7%) |
| 6 or 7 Rooms | 117 (38.0%) | 10 (6.7%) |
| 8 or more Rooms | 38 (12.3%) | 0 (0.0%) |
| Total | 308 (100.0%) | 149 (100.0%) |
Housing Structure by Heating Type in North Bonneville
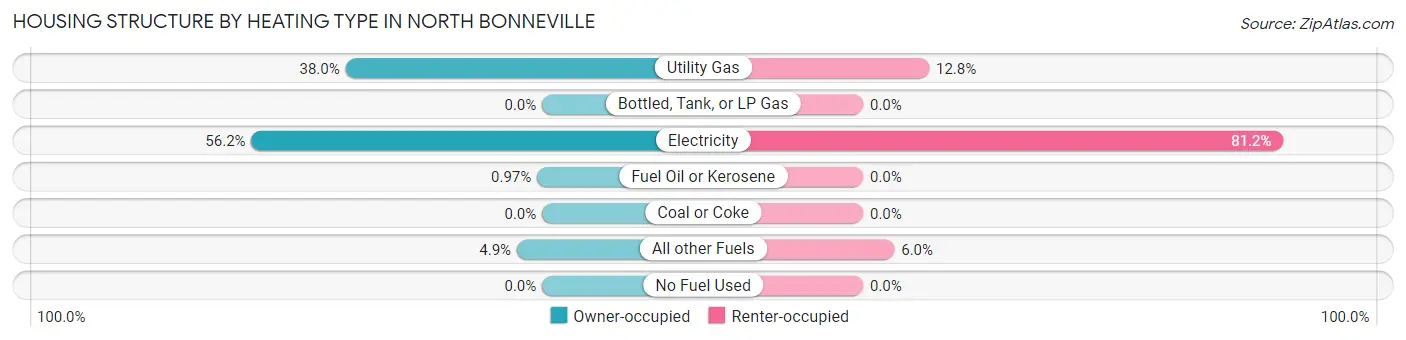
| Heating Type | Owner-occupied | Renter-occupied |
| Utility Gas | 117 (38.0%) | 19 (12.8%) |
| Bottled, Tank, or LP Gas | 0 (0.0%) | 0 (0.0%) |
| Electricity | 173 (56.2%) | 121 (81.2%) |
| Fuel Oil or Kerosene | 3 (1.0%) | 0 (0.0%) |
| Coal or Coke | 0 (0.0%) | 0 (0.0%) |
| All other Fuels | 15 (4.9%) | 9 (6.0%) |
| No Fuel Used | 0 (0.0%) | 0 (0.0%) |
| Total | 308 (100.0%) | 149 (100.0%) |
Household Vehicle Usage in North Bonneville
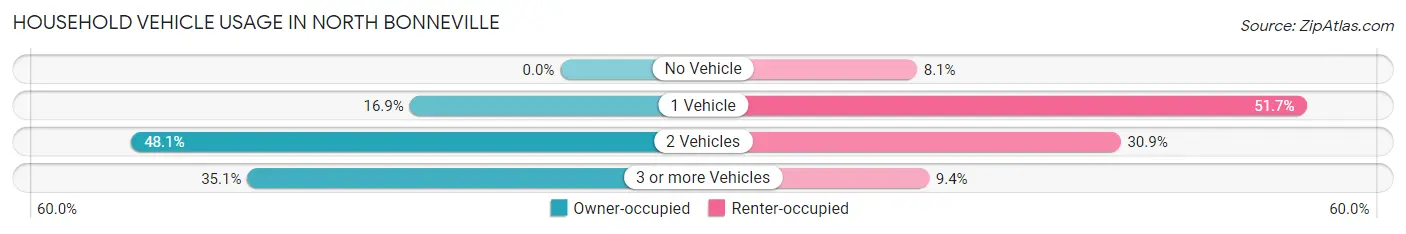
| Vehicles per Household | Owner-occupied | Renter-occupied |
| No Vehicle | 0 (0.0%) | 12 (8.1%) |
| 1 Vehicle | 52 (16.9%) | 77 (51.7%) |
| 2 Vehicles | 148 (48.0%) | 46 (30.9%) |
| 3 or more Vehicles | 108 (35.1%) | 14 (9.4%) |
| Total | 308 (100.0%) | 149 (100.0%) |
Real Estate & Mortgages in North Bonneville
Real Estate and Mortgage Overview in North Bonneville
| Characteristic | Without Mortgage | With Mortgage |
| Housing Units | 77 | 231 |
| Median Property Value | $329,500 | $374,600 |
| Median Household Income | - | - |
| Monthly Housing Costs | $470 | $3 |
| Real Estate Taxes | $1,875 | $0 |
Property Value by Mortgage Status in North Bonneville
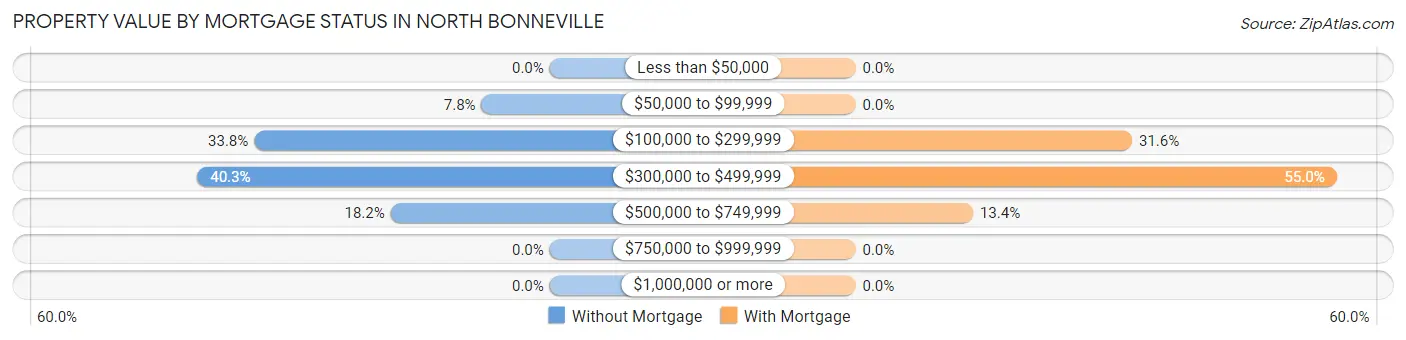
| Property Value | Without Mortgage | With Mortgage |
| Less than $50,000 | 0 (0.0%) | 0 (0.0%) |
| $50,000 to $99,999 | 6 (7.8%) | 0 (0.0%) |
| $100,000 to $299,999 | 26 (33.8%) | 73 (31.6%) |
| $300,000 to $499,999 | 31 (40.3%) | 127 (55.0%) |
| $500,000 to $749,999 | 14 (18.2%) | 31 (13.4%) |
| $750,000 to $999,999 | 0 (0.0%) | 0 (0.0%) |
| $1,000,000 or more | 0 (0.0%) | 0 (0.0%) |
| Total | 77 (100.0%) | 231 (100.0%) |
Household Income by Mortgage Status in North Bonneville
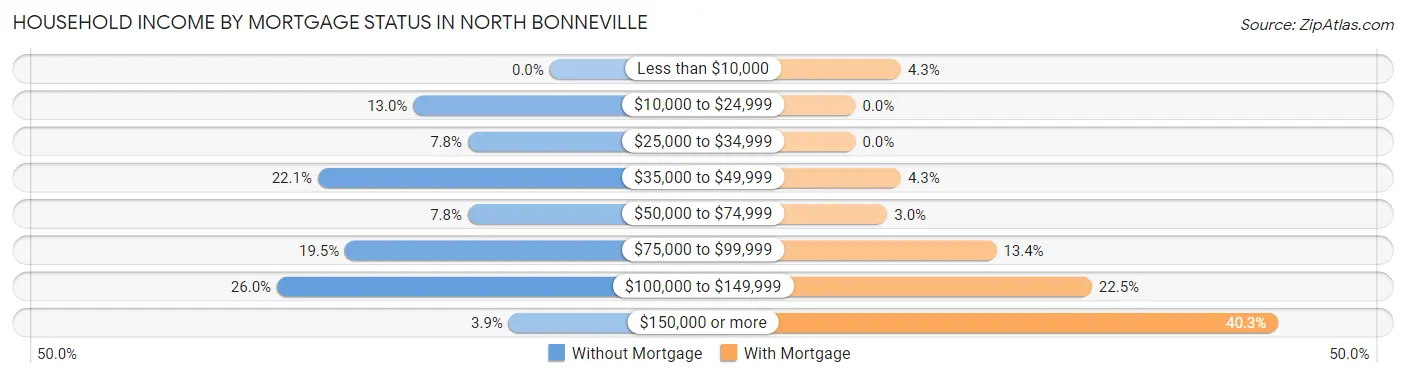
| Household Income | Without Mortgage | With Mortgage |
| Less than $10,000 | 0 (0.0%) | 10 (4.3%) |
| $10,000 to $24,999 | 10 (13.0%) | 0 (0.0%) |
| $25,000 to $34,999 | 6 (7.8%) | 0 (0.0%) |
| $35,000 to $49,999 | 17 (22.1%) | 10 (4.3%) |
| $50,000 to $74,999 | 6 (7.8%) | 7 (3.0%) |
| $75,000 to $99,999 | 15 (19.5%) | 31 (13.4%) |
| $100,000 to $149,999 | 20 (26.0%) | 52 (22.5%) |
| $150,000 or more | 3 (3.9%) | 93 (40.3%) |
| Total | 77 (100.0%) | 231 (100.0%) |
Property Value to Household Income Ratio in North Bonneville
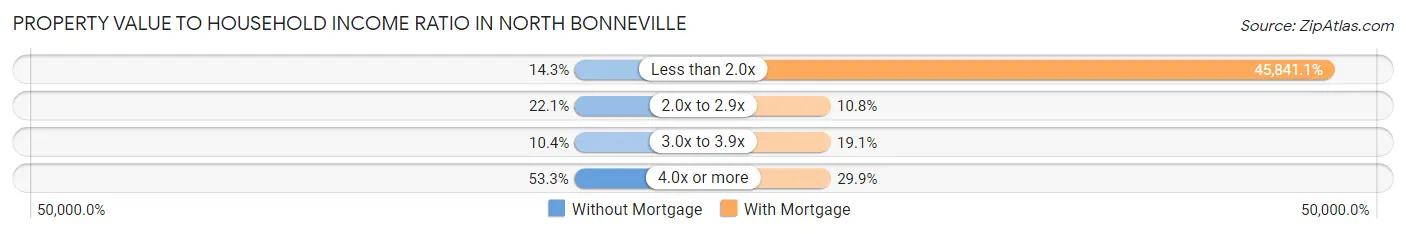
| Value-to-Income Ratio | Without Mortgage | With Mortgage |
| Less than 2.0x | 11 (14.3%) | 105,893 (45,841.1%) |
| 2.0x to 2.9x | 17 (22.1%) | 25 (10.8%) |
| 3.0x to 3.9x | 8 (10.4%) | 44 (19.1%) |
| 4.0x or more | 41 (53.2%) | 69 (29.9%) |
| Total | 77 (100.0%) | 231 (100.0%) |
Real Estate Taxes by Mortgage Status in North Bonneville
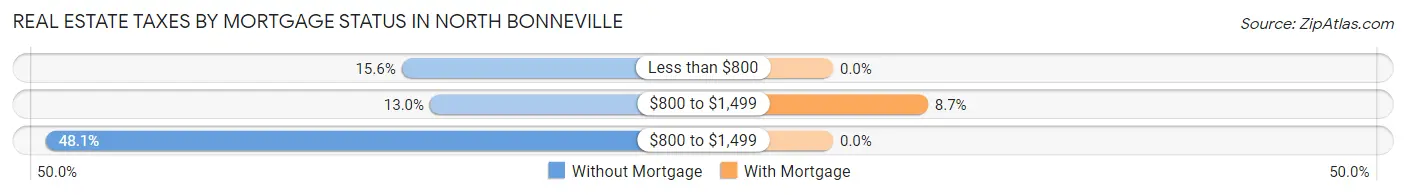
| Property Taxes | Without Mortgage | With Mortgage |
| Less than $800 | 12 (15.6%) | 0 (0.0%) |
| $800 to $1,499 | 10 (13.0%) | 20 (8.7%) |
| $800 to $1,499 | 37 (48.0%) | 0 (0.0%) |
| Total | 77 (100.0%) | 231 (100.0%) |
Health & Disability in North Bonneville
Health Insurance Coverage by Age in North Bonneville
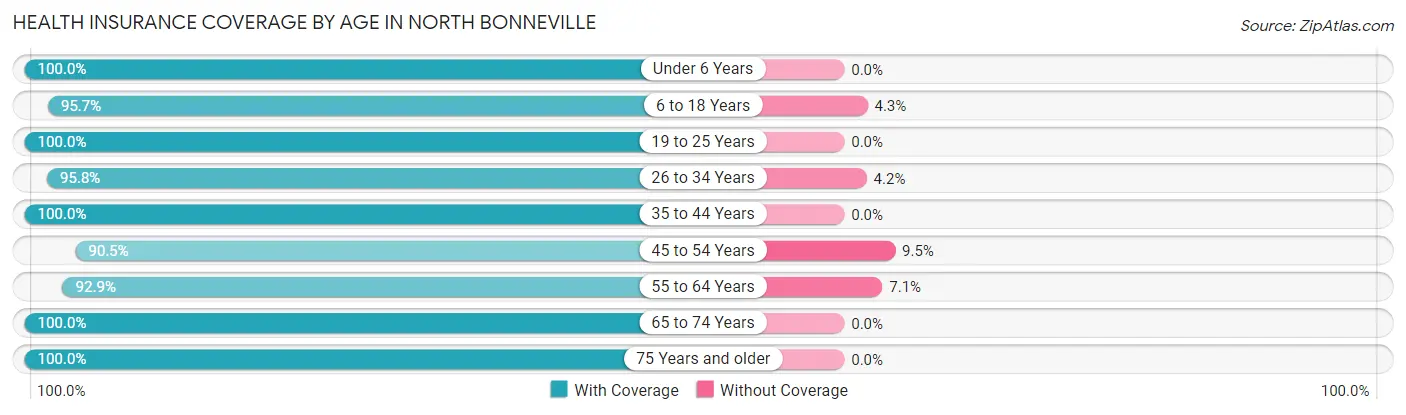
| Age Bracket | With Coverage | Without Coverage |
| Under 6 Years | 42 (100.0%) | 0 (0.0%) |
| 6 to 18 Years | 199 (95.7%) | 9 (4.3%) |
| 19 to 25 Years | 115 (100.0%) | 0 (0.0%) |
| 26 to 34 Years | 92 (95.8%) | 4 (4.2%) |
| 35 to 44 Years | 163 (100.0%) | 0 (0.0%) |
| 45 to 54 Years | 153 (90.5%) | 16 (9.5%) |
| 55 to 64 Years | 144 (92.9%) | 11 (7.1%) |
| 65 to 74 Years | 94 (100.0%) | 0 (0.0%) |
| 75 Years and older | 104 (100.0%) | 0 (0.0%) |
| Total | 1,106 (96.5%) | 40 (3.5%) |
Health Insurance Coverage by Citizenship Status in North Bonneville
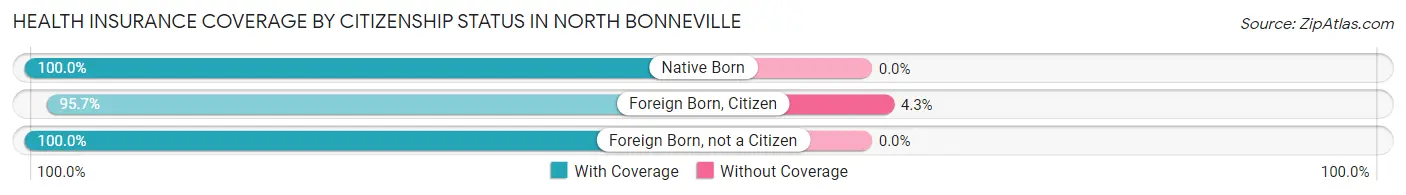
| Citizenship Status | With Coverage | Without Coverage |
| Native Born | 42 (100.0%) | 0 (0.0%) |
| Foreign Born, Citizen | 199 (95.7%) | 9 (4.3%) |
| Foreign Born, not a Citizen | 115 (100.0%) | 0 (0.0%) |
Health Insurance Coverage by Household Income in North Bonneville
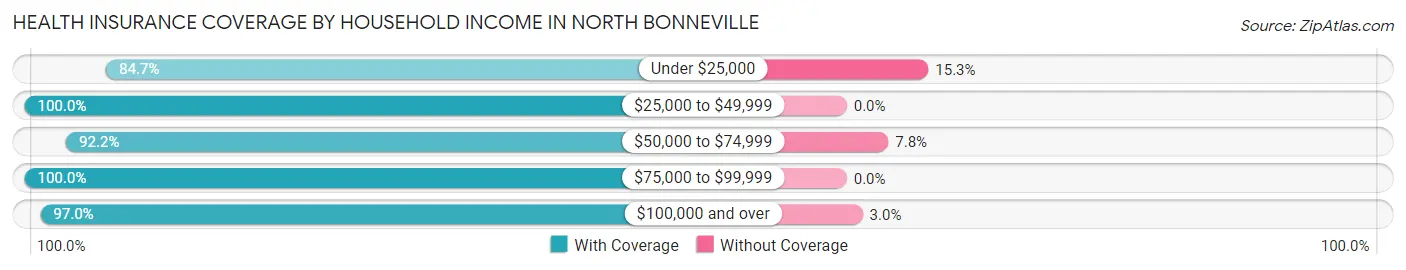
| Household Income | With Coverage | Without Coverage |
| Under $25,000 | 61 (84.7%) | 11 (15.3%) |
| $25,000 to $49,999 | 150 (100.0%) | 0 (0.0%) |
| $50,000 to $74,999 | 154 (92.2%) | 13 (7.8%) |
| $75,000 to $99,999 | 218 (100.0%) | 0 (0.0%) |
| $100,000 and over | 523 (97.0%) | 16 (3.0%) |
Public vs Private Health Insurance Coverage by Age in North Bonneville
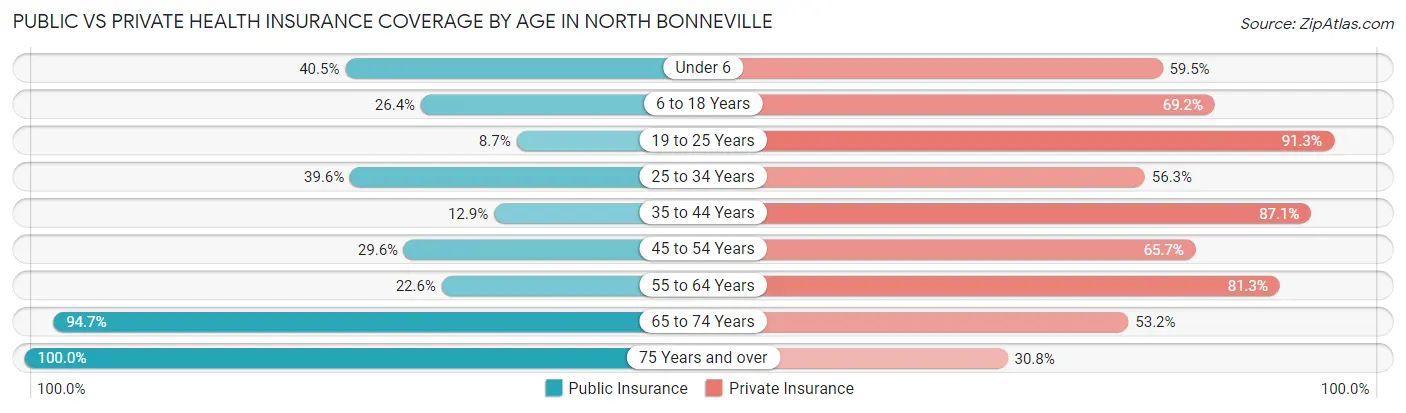
| Age Bracket | Public Insurance | Private Insurance |
| Under 6 | 17 (40.5%) | 25 (59.5%) |
| 6 to 18 Years | 55 (26.4%) | 144 (69.2%) |
| 19 to 25 Years | 10 (8.7%) | 105 (91.3%) |
| 25 to 34 Years | 38 (39.6%) | 54 (56.2%) |
| 35 to 44 Years | 21 (12.9%) | 142 (87.1%) |
| 45 to 54 Years | 50 (29.6%) | 111 (65.7%) |
| 55 to 64 Years | 35 (22.6%) | 126 (81.3%) |
| 65 to 74 Years | 89 (94.7%) | 50 (53.2%) |
| 75 Years and over | 104 (100.0%) | 32 (30.8%) |
| Total | 419 (36.6%) | 789 (68.9%) |
Disability Status by Sex by Age in North Bonneville
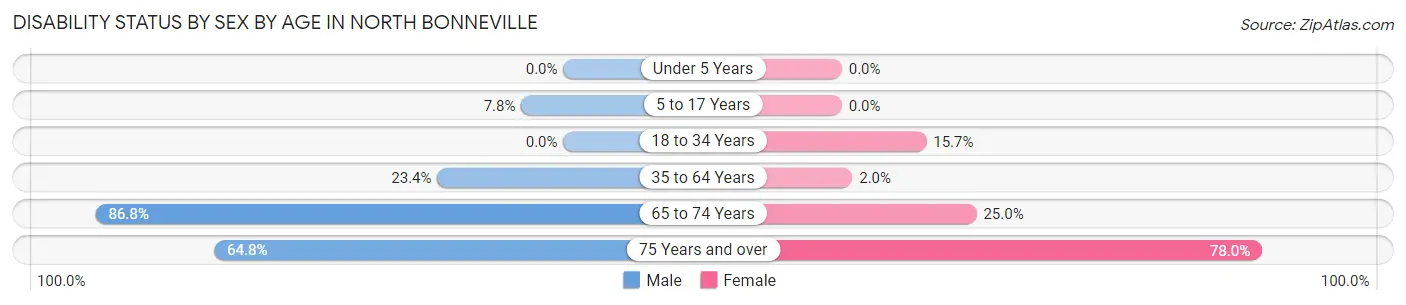
| Age Bracket | Male | Female |
| Under 5 Years | 0 (0.0%) | 0 (0.0%) |
| 5 to 17 Years | 11 (7.8%) | 0 (0.0%) |
| 18 to 34 Years | 0 (0.0%) | 16 (15.7%) |
| 35 to 64 Years | 54 (23.4%) | 5 (1.9%) |
| 65 to 74 Years | 33 (86.8%) | 14 (25.0%) |
| 75 Years and over | 35 (64.8%) | 39 (78.0%) |
Disability Class by Sex by Age in North Bonneville
Disability Class: Hearing Difficulty
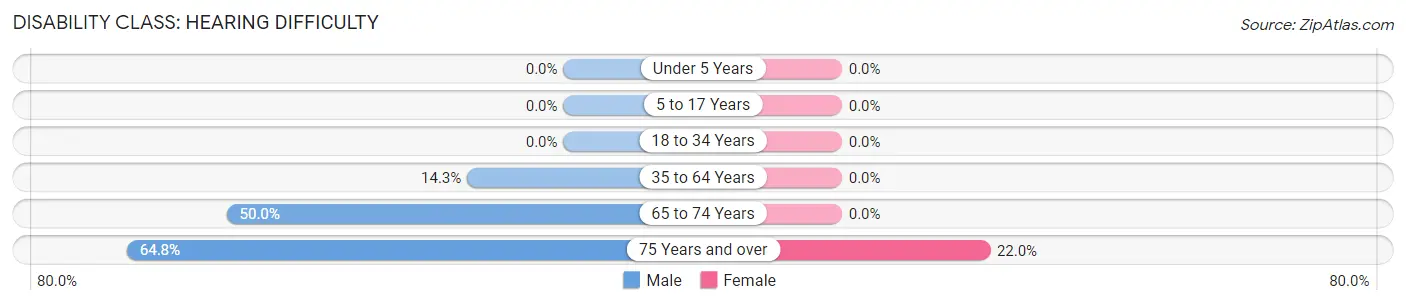
| Age Bracket | Male | Female |
| Under 5 Years | 0 (0.0%) | 0 (0.0%) |
| 5 to 17 Years | 0 (0.0%) | 0 (0.0%) |
| 18 to 34 Years | 0 (0.0%) | 0 (0.0%) |
| 35 to 64 Years | 33 (14.3%) | 0 (0.0%) |
| 65 to 74 Years | 19 (50.0%) | 0 (0.0%) |
| 75 Years and over | 35 (64.8%) | 11 (22.0%) |
Disability Class: Vision Difficulty
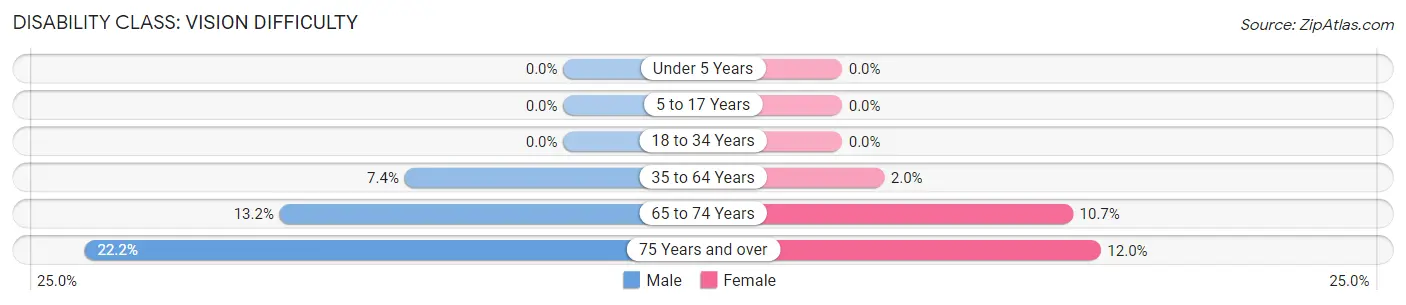
| Age Bracket | Male | Female |
| Under 5 Years | 0 (0.0%) | 0 (0.0%) |
| 5 to 17 Years | 0 (0.0%) | 0 (0.0%) |
| 18 to 34 Years | 0 (0.0%) | 0 (0.0%) |
| 35 to 64 Years | 17 (7.4%) | 5 (1.9%) |
| 65 to 74 Years | 5 (13.2%) | 6 (10.7%) |
| 75 Years and over | 12 (22.2%) | 6 (12.0%) |
Disability Class: Cognitive Difficulty
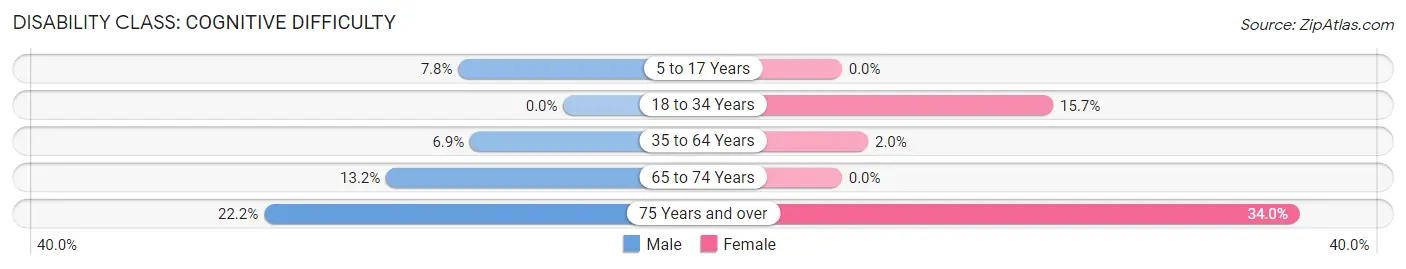
| Age Bracket | Male | Female |
| 5 to 17 Years | 11 (7.8%) | 0 (0.0%) |
| 18 to 34 Years | 0 (0.0%) | 16 (15.7%) |
| 35 to 64 Years | 16 (6.9%) | 5 (1.9%) |
| 65 to 74 Years | 5 (13.2%) | 0 (0.0%) |
| 75 Years and over | 12 (22.2%) | 17 (34.0%) |
Disability Class: Ambulatory Difficulty
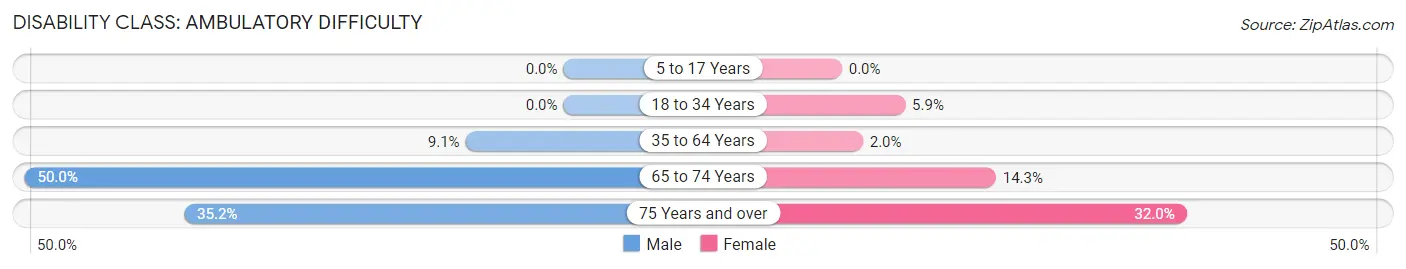
| Age Bracket | Male | Female |
| 5 to 17 Years | 0 (0.0%) | 0 (0.0%) |
| 18 to 34 Years | 0 (0.0%) | 6 (5.9%) |
| 35 to 64 Years | 21 (9.1%) | 5 (1.9%) |
| 65 to 74 Years | 19 (50.0%) | 8 (14.3%) |
| 75 Years and over | 19 (35.2%) | 16 (32.0%) |
Disability Class: Self-Care Difficulty
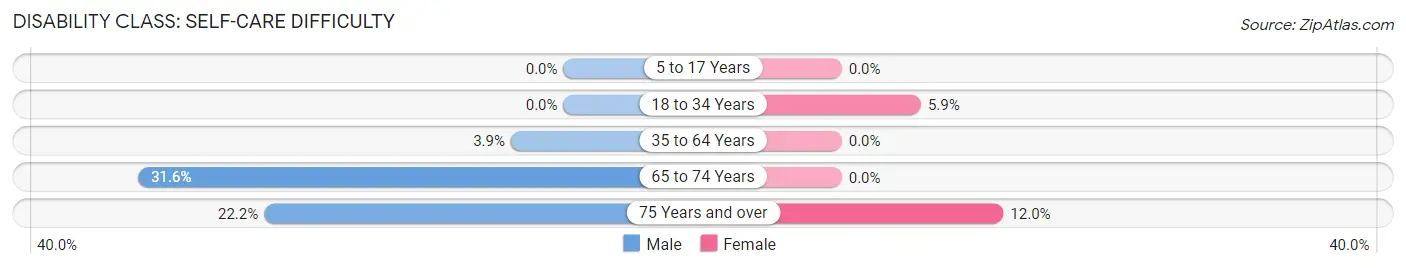
| Age Bracket | Male | Female |
| 5 to 17 Years | 0 (0.0%) | 0 (0.0%) |
| 18 to 34 Years | 0 (0.0%) | 6 (5.9%) |
| 35 to 64 Years | 9 (3.9%) | 0 (0.0%) |
| 65 to 74 Years | 12 (31.6%) | 0 (0.0%) |
| 75 Years and over | 12 (22.2%) | 6 (12.0%) |
Technology Access in North Bonneville
Computing Device Access in North Bonneville
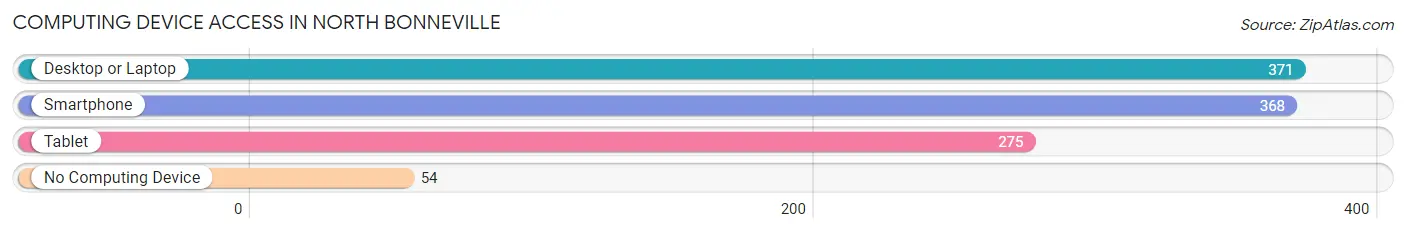
| Device Type | # Households | % Households |
| Desktop or Laptop | 371 | 81.2% |
| Smartphone | 368 | 80.5% |
| Tablet | 275 | 60.2% |
| No Computing Device | 54 | 11.8% |
| Total | 457 | 100.0% |
Internet Access in North Bonneville
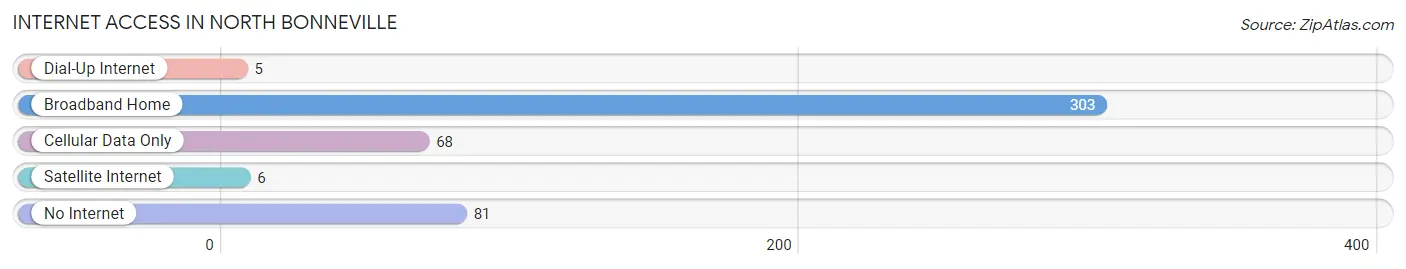
| Internet Type | # Households | % Households |
| Dial-Up Internet | 5 | 1.1% |
| Broadband Home | 303 | 66.3% |
| Cellular Data Only | 68 | 14.9% |
| Satellite Internet | 6 | 1.3% |
| No Internet | 81 | 17.7% |
| Total | 457 | 100.0% |
North Bonneville Summary
Bonneville, Washington is a small town located in the Columbia River Gorge, just east of the Cascade Mountains. It is situated on the Washington side of the Columbia River, directly across from the Oregon town of Cascade Locks. The town was founded in 1883 by the Northern Pacific Railroad and was named after the Bonneville Dam, which was built nearby in 1938.
History
The area around Bonneville was first inhabited by the Chinook and Klickitat tribes, who used the area for fishing and hunting. The first European settlers arrived in the area in the early 1800s, and the town of Bonneville was officially founded in 1883 by the Northern Pacific Railroad. The railroad was built to connect the Pacific Northwest to the rest of the country, and the town of Bonneville was established as a stop along the route.
The town grew quickly, and by the early 1900s, it had become a popular tourist destination. The town was known for its scenic beauty, and it was a popular spot for fishing, hunting, and camping. The town also had a thriving lumber industry, and it was home to several sawmills.
In 1938, the Bonneville Dam was built nearby, and the town was flooded. The town was relocated to higher ground, and the original town site is now underwater. The dam was built to provide hydroelectric power to the region, and it is still in operation today.
Geography
Bonneville is located in the Columbia River Gorge, just east of the Cascade Mountains. The town is situated on the Washington side of the Columbia River, directly across from the Oregon town of Cascade Locks. The town is surrounded by lush forests and rolling hills, and it is a popular spot for outdoor activities such as hiking, camping, and fishing.
The town is located at an elevation of 1,000 feet, and the average temperature in the summer is around 75 degrees Fahrenheit. The town receives an average of 30 inches of rain per year, and the average snowfall is around 10 inches.
Economy
The economy of Bonneville is largely based on tourism and outdoor recreation. The town is a popular spot for fishing, hunting, and camping, and it is home to several resorts and lodges. The town is also home to several wineries, and it is a popular spot for wine tasting.
The town is also home to several small businesses, including restaurants, shops, and galleries. The town is also home to several manufacturing companies, and it is a popular spot for outdoor recreation.
Demographics
As of the 2010 census, the population of Bonneville was 1,845. The town is predominantly white, with a small Hispanic population. The median household income is $45,000, and the median home value is $200,000. The town has a low unemployment rate, and the majority of the population is employed in the tourism and outdoor recreation industries.
Common Questions
What is Per Capita Income in North Bonneville?
Per Capita income in North Bonneville is $35,268.
What is the Median Family Income in North Bonneville?
Median Family Income in North Bonneville is $100,000.
What is the Median Household income in North Bonneville?
Median Household Income in North Bonneville is $79,375.
What is Income or Wage Gap in North Bonneville?
Income or Wage Gap in North Bonneville is 4.3%.
Women in North Bonneville earn 95.7 cents for every dollar earned by a man.
What is Inequality or Gini Index in North Bonneville?
Inequality or Gini Index in North Bonneville is 0.33.
What is the Total Population of North Bonneville?
Total Population of North Bonneville is 1,146.
What is the Total Male Population of North Bonneville?
Total Male Population of North Bonneville is 587.
What is the Total Female Population of North Bonneville?
Total Female Population of North Bonneville is 559.
What is the Ratio of Males per 100 Females in North Bonneville?
There are 105.01 Males per 100 Females in North Bonneville.
What is the Ratio of Females per 100 Males in North Bonneville?
There are 95.23 Females per 100 Males in North Bonneville.
What is the Median Population Age in North Bonneville?
Median Population Age in North Bonneville is 42.1 Years.
What is the Average Family Size in North Bonneville
Average Family Size in North Bonneville is 3.3 People.
What is the Average Household Size in North Bonneville
Average Household Size in North Bonneville is 2.5 People.
How Large is the Labor Force in North Bonneville?
There are 645 People in the Labor Forcein in North Bonneville.
What is the Percentage of People in the Labor Force in North Bonneville?
69.9% of People are in the Labor Force in North Bonneville.
What is the Unemployment Rate in North Bonneville?
Unemployment Rate in North Bonneville is 7.3%.