Zip Codes with the Highest Percentage of Population Employed in Accommodation & Food Services in Seattle, WA

RELATED REPORTS & OPTIONS

Accommodation & Food Services
Population
Families and Households
Female Fertility
Female Fertility (Unmarried)
Race (Community Size)
Race (Percentage)
Ancestry (Community Size)
AfghanAfricanAlaska NativeAlaskan AthabascanAlbanianAleutAmericanApacheArabArgentineanArmenianAssyrian / Chaldean / SyriacAustralianAustrianBahamianBangladeshiBarbadianBasqueBelgianBelizeanBhutaneseBlackfeetBolivianBrazilianBritishBritish West IndianBulgarianBurmeseCajunCambodianCanadianCape VerdeanCarpatho RusynCelticCentral AmericanCentral American IndianCherokeeCheyenneChickasawChileanChineseChippewaChoctawColombianColvilleComancheCosta RicanCreeCreekCroatianCrowCubanCypriotCzechCzechoslovakianDanishDelawareDominicanDutchEastern EuropeanEcuadorianEgyptianEnglishEstonianEthiopianEuropeanFijianFilipinoFinnishFrenchFrench American IndianFrench CanadianGermanGerman RussianGhanaianGreekGuamanian / ChamorroGuatemalanGuyaneseHaitianHonduranHopiHungarianIcelanderIndian (Asian)IndonesianInupiatIranianIraqiIrishIroquoisIsraeliItalianJamaicanJapaneseJordanianKenyanKoreanLaotianLatvianLebaneseLithuanianLuxembourgerMacedonianMalaysianMalteseMarshalleseMexicanMexican American IndianMongolianMoroccanNative HawaiianNavajoNepaleseNew ZealanderNicaraguanNigerianNorthern EuropeanNorwegianOkinawanOsagePakistaniPalestinianPanamanianParaguayanPennsylvania GermanPeruvianPolishPortuguesePotawatomiPuebloPuerto RicanPuget Sound SalishRomanianRussianSalvadoranSamoanScandinavianScotch-IrishScottishSeminoleSenegaleseSerbianShoshoneSiouxSlavicSlovakSloveneSomaliSouth AfricanSouth AmericanSouth American IndianSpaniardSpanishSpanish AmericanSri LankanSubsaharan AfricanSudaneseSwedishSwissSyrianThaiTlingit-HaidaTonganTrinidadian and TobagonianTsimshianTurkishUgandanUkrainianUruguayanUteVenezuelanVietnameseWelshWest IndianYakamaYaquiYugoslavianYup'ik
Ancestry (Percentage)
AfghanAfricanAlaska NativeAlaskan AthabascanAlbanianAleutAmericanApacheArabArgentineanArmenianAssyrian / Chaldean / SyriacAustralianAustrianBahamianBangladeshiBarbadianBasqueBelgianBelizeanBhutaneseBlackfeetBolivianBrazilianBritishBritish West IndianBulgarianBurmeseCajunCambodianCanadianCape VerdeanCarpatho RusynCelticCentral AmericanCentral American IndianCherokeeCheyenneChickasawChileanChineseChippewaChoctawColombianColvilleComancheCosta RicanCreeCreekCroatianCrowCubanCypriotCzechCzechoslovakianDanishDelawareDominicanDutchEastern EuropeanEcuadorianEgyptianEnglishEstonianEthiopianEuropeanFijianFilipinoFinnishFrenchFrench American IndianFrench CanadianGermanGerman RussianGhanaianGreekGuamanian / ChamorroGuatemalanGuyaneseHaitianHonduranHopiHungarianIcelanderIndian (Asian)IndonesianInupiatIranianIraqiIrishIroquoisIsraeliItalianJamaicanJapaneseJordanianKenyanKoreanLaotianLatvianLebaneseLithuanianLuxembourgerMacedonianMalaysianMalteseMarshalleseMexicanMexican American IndianMongolianMoroccanNative HawaiianNavajoNepaleseNew ZealanderNicaraguanNigerianNorthern EuropeanNorwegianOkinawanOsagePakistaniPalestinianPanamanianParaguayanPennsylvania GermanPeruvianPolishPortuguesePotawatomiPuebloPuerto RicanPuget Sound SalishRomanianRussianSalvadoranSamoanScandinavianScotch-IrishScottishSeminoleSenegaleseSerbianShoshoneSiouxSlavicSlovakSloveneSomaliSouth AfricanSouth AmericanSouth American IndianSpaniardSpanishSpanish AmericanSri LankanSubsaharan AfricanSudaneseSwedishSwissSyrianThaiTlingit-HaidaTonganTrinidadian and TobagonianTsimshianTurkishUgandanUkrainianUruguayanUteVenezuelanVietnameseWelshWest IndianYakamaYaquiYugoslavianYup'ik
Immigrant Origin (Total)
AfghanistanAfricaAlbaniaArgentinaArmeniaAsiaAustraliaAustriaBangladeshBelarusBelgiumBelizeBoliviaBosnia and HerzegovinaBrazilBulgariaBurma / MyanmarCambodiaCameroonCanadaCaribbeanCentral AmericaChileChinaColombiaCongoCosta RicaCroatiaCubaCzechoslovakiaDenmarkDominican RepublicEastern AfricaEastern AsiaEastern EuropeEcuadorEgyptEl SalvadorEnglandEritreaEthiopiaEuropeFijiFranceGermanyGhanaGreeceGuatemalaHaitiHondurasHong KongHungaryIndiaIndonesiaIranIraqIrelandIsraelItalyJamaicaJapanJordanKazakhstanKenyaKoreaKuwaitLaosLatin AmericaLatviaLebanonLiberiaLithuaniaMalaysiaMexicoMicronesiaMiddle AfricaMoldovaMoroccoNepalNetherlandsNicaraguaNigeriaNorth MacedoniaNorthern AfricaNorthern EuropeNorwayOceaniaPakistanPanamaPeruPhilippinesPolandPortugalRomaniaRussiaSaudi ArabiaScotlandSenegalSerbiaSierra LeoneSingaporeSomaliaSouth AfricaSouth AmericaSouth Central AsiaSouth Eastern AsiaSouthern EuropeSpainSri LankaSudanSwedenSwitzerlandSyriaTaiwanThailandTrinidad and TobagoTurkeyUgandaUkraineUzbekistanVenezuelaVietnamWestern AfricaWestern AsiaWestern EuropeYemenZaireZimbabwe
Immigrant Origin (Percentage)
AfghanistanAfricaAlbaniaArgentinaArmeniaAsiaAustraliaAustriaBangladeshBelarusBelgiumBelizeBoliviaBosnia and HerzegovinaBrazilBulgariaBurma / MyanmarCambodiaCameroonCanadaCaribbeanCentral AmericaChileChinaColombiaCongoCosta RicaCroatiaCubaCzechoslovakiaDenmarkDominican RepublicEastern AfricaEastern AsiaEastern EuropeEcuadorEgyptEl SalvadorEnglandEritreaEthiopiaEuropeFijiFranceGermanyGhanaGreeceGuatemalaHaitiHondurasHong KongHungaryIndiaIndonesiaIranIraqIrelandIsraelItalyJamaicaJapanJordanKazakhstanKenyaKoreaKuwaitLaosLatin AmericaLatviaLebanonLiberiaLithuaniaMalaysiaMexicoMicronesiaMiddle AfricaMoldovaMoroccoNepalNetherlandsNicaraguaNigeriaNorth MacedoniaNorthern AfricaNorthern EuropeNorwayOceaniaPakistanPanamaPeruPhilippinesPolandPortugalRomaniaRussiaSaudi ArabiaScotlandSenegalSerbiaSierra LeoneSingaporeSomaliaSouth AfricaSouth AmericaSouth Central AsiaSouth Eastern AsiaSouthern EuropeSpainSri LankaSudanSwedenSwitzerlandSyriaTaiwanThailandTrinidad and TobagoTurkeyUgandaUkraineUzbekistanVenezuelaVietnamWestern AfricaWestern AsiaWestern EuropeYemenZaireZimbabwe
Income
Income (Families)
Income (Households)
Poverty
Poverty (Families)
Unemployment
Employment Occupations
Employment Industries
Employer Class
Commute Time
Commute Means
School Enrollment
Education by Degree Field
Occupancy
Finances
Physical Characteristics
Seattle
Compare Zip Codes
Comparison Subject

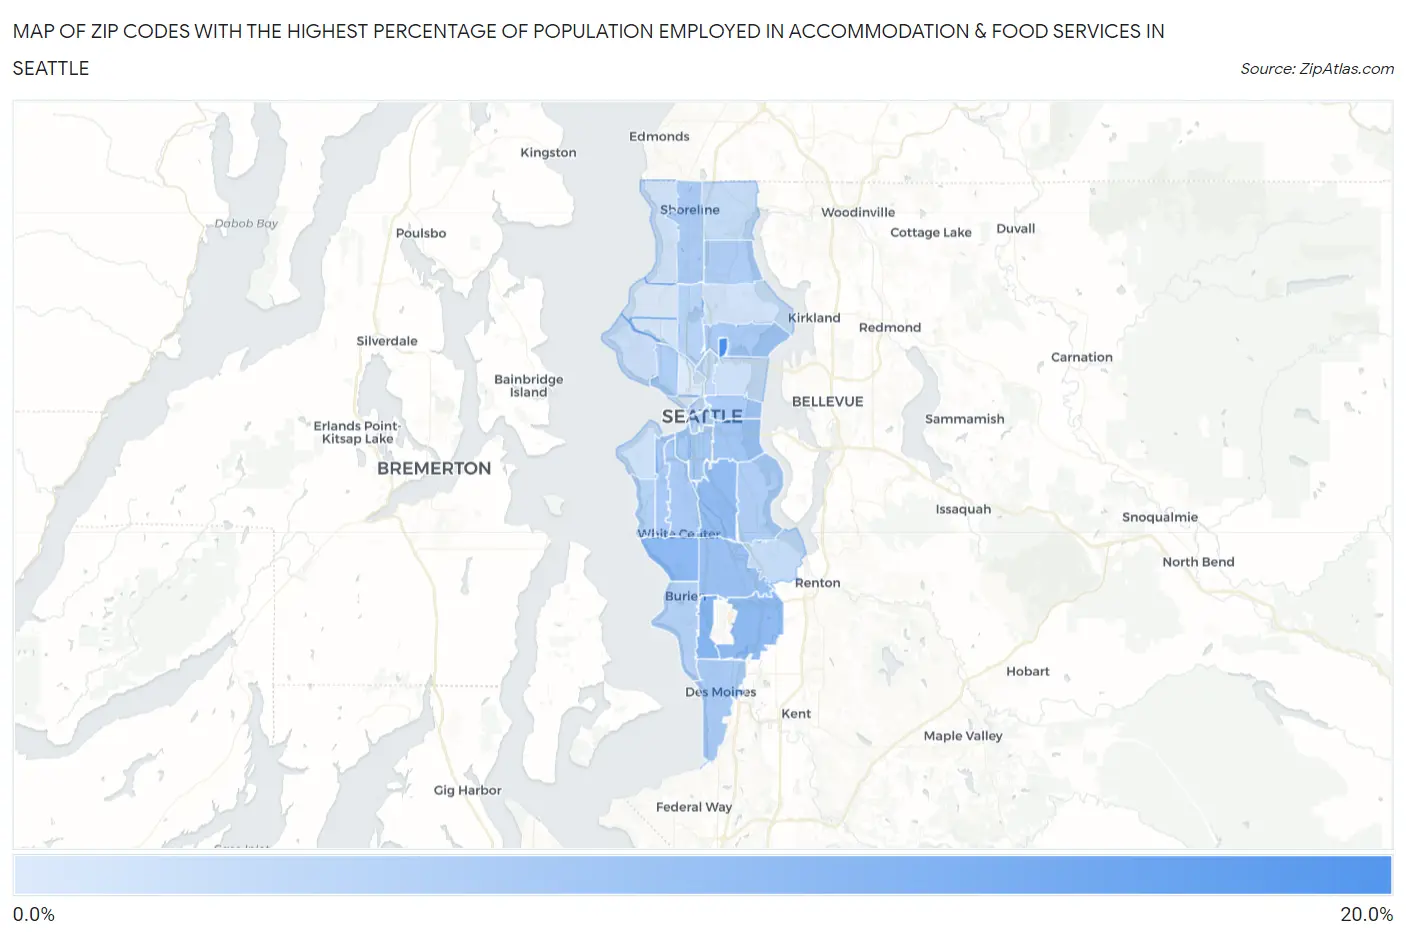
Map of Zip Codes with the Highest Percentage of Population Employed in Accommodation & Food Services in Seattle

0.0%
20.0%
Zip Codes with the Highest Percentage of Population Employed in Accommodation & Food Services in Seattle Map

Zip Codes with the Highest Percentage of Population Employed in Accommodation & Food Services in Seattle, WA

Zip Code % Employed vs State vs National
1.9819519.3%6.5%(+12.8)#176.9%(+12.4)#907
2.9814812.1%6.5%(+5.68)#496.9%(+5.27)#2,753
3.9814611.3%6.5%(+4.88)#586.9%(+4.46)#3,291
4.9816411.2%6.5%(+4.70)#646.9%(+4.29)#3,421
5.9818811.0%6.5%(+4.58)#666.9%(+4.16)#3,515
6.9810810.9%6.5%(+4.45)#686.9%(+4.03)#3,626
7.981689.8%6.5%(+3.39)#856.9%(+2.97)#4,725
8.981449.2%6.5%(+2.75)#956.9%(+2.33)#5,633
9.981348.6%6.5%(+2.15)#1156.9%(+1.73)#6,626
10.981268.5%6.5%(+2.02)#1216.9%(+1.61)#6,841
11.981068.4%6.5%(+1.98)#1236.9%(+1.56)#6,924
12.981988.3%6.5%(+1.85)#1296.9%(+1.43)#7,195
13.981058.3%6.5%(+1.83)#1316.9%(+1.42)#7,229
14.981338.1%6.5%(+1.61)#1386.9%(+1.19)#7,673
15.981228.1%6.5%(+1.60)#1396.9%(+1.18)#7,702
16.981257.9%6.5%(+1.39)#1516.9%(+0.973)#8,141
17.981187.8%6.5%(+1.32)#1546.9%(+0.902)#8,307
18.981197.7%6.5%(+1.25)#1616.9%(+0.830)#8,467
19.981047.3%6.5%(+0.824)#1796.9%(+0.405)#9,575
20.981367.3%6.5%(+0.792)#1816.9%(+0.374)#9,661
21.981667.1%6.5%(+0.684)#1886.9%(+0.266)#9,929
22.981036.7%6.5%(+0.247)#2206.9%(-0.172)#11,183
23.981016.5%6.5%(+0.019)#2326.9%(-0.399)#11,902
24.981025.9%6.5%(-0.580)#2696.9%(-0.998)#13,821
25.981785.6%6.5%(-0.909)#2896.9%(-1.33)#14,886
26.981555.5%6.5%(-0.960)#2936.9%(-1.38)#15,046
27.981995.0%6.5%(-1.50)#3336.9%(-1.92)#16,963
28.981124.6%6.5%(-1.84)#3566.9%(-2.25)#18,079
29.981164.6%6.5%(-1.84)#3576.9%(-2.26)#18,101
30.981154.5%6.5%(-1.97)#3706.9%(-2.39)#18,545
31.981774.5%6.5%(-1.99)#3726.9%(-2.41)#18,613
32.981074.0%6.5%(-2.49)#4016.9%(-2.91)#20,253
33.981213.6%6.5%(-2.84)#4166.9%(-3.25)#21,373
34.981173.4%6.5%(-3.04)#4246.9%(-3.46)#22,029
35.981093.2%6.5%(-3.24)#4376.9%(-3.66)#22,651

Common Questions

What are the Top 10 Zip Codes with the Highest Percentage of Population Employed in Accommodation & Food Services in Seattle, WA?
Top 10 Zip Codes with the Highest Percentage of Population Employed in Accommodation & Food Services in Seattle, WA are:
#1
19.3%
#2
12.1%
#3
11.3%
#4
11.2%
#5
11.0%
#6
10.9%
#7
9.8%
#8
9.2%
#9
8.6%
#10
8.5%
What zip code has the Highest Percentage of Population Employed in Accommodation & Food Services in Seattle, WA?
98195 has the Highest Percentage of Population Employed in Accommodation & Food Services in Seattle, WA with 19.3%.
What is the Percentage of Population Employed in Accommodation & Food Services in Seattle, WA?
Percentage of Population Employed in Accommodation & Food Services in Seattle is 6.5%.
What is the Percentage of Population Employed in Accommodation & Food Services in Washington?
Percentage of Population Employed in Accommodation & Food Services in Washington is 6.5%.
What is the Percentage of Population Employed in Accommodation & Food Services in the United States?
Percentage of Population Employed in Accommodation & Food Services in the United States is 6.9%.