Zip Codes with the Highest Percentage of Population Employed in Accommodation & Food Services in Bellevue, WA
RELATED REPORTS & OPTIONS
Accommodation & Food Services
Bellevue
Compare Zip Codes
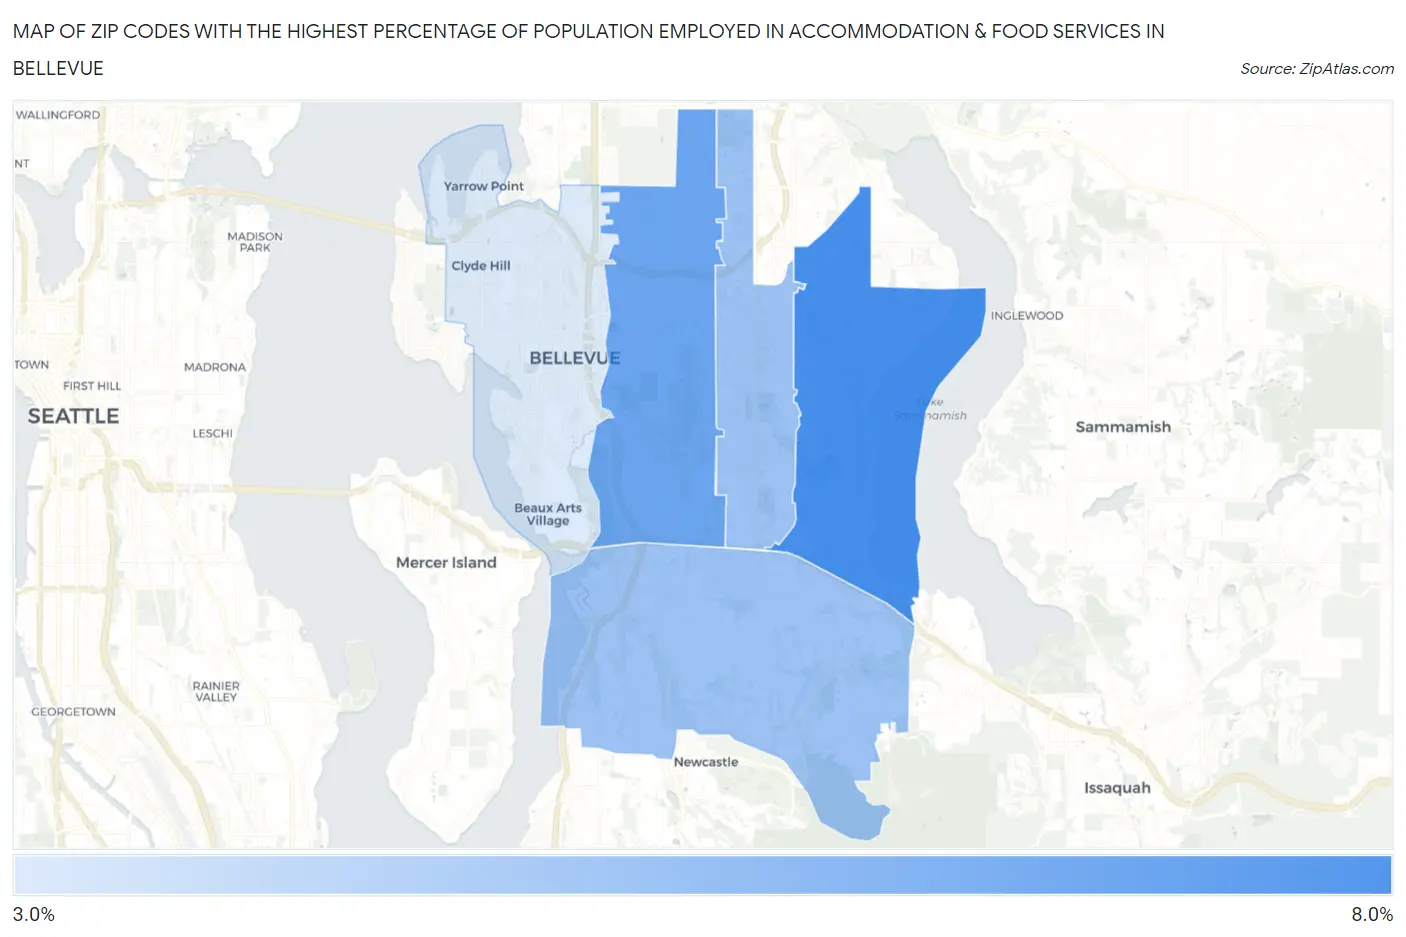
Map of Zip Codes with the Highest Percentage of Population Employed in Accommodation & Food Services in Bellevue
3.1%
6.7%
Zip Codes with the Highest Percentage of Population Employed in Accommodation & Food Services in Bellevue, WA
| Zip Code | % Employed | vs State | vs National | |
| 1. | 98008 | 6.7% | 6.5%(+0.210)#221 | 6.9%(-0.208)#11,277 |
| 2. | 98005 | 5.8% | 6.5%(-0.691)#278 | 6.9%(-1.11)#14,155 |
| 3. | 98006 | 4.7% | 6.5%(-1.78)#352 | 6.9%(-2.20)#17,868 |
| 4. | 98007 | 4.6% | 6.5%(-1.87)#359 | 6.9%(-2.29)#18,187 |
| 5. | 98004 | 3.1% | 6.5%(-3.38)#439 | 6.9%(-3.80)#22,991 |
1
Common Questions
What are the Top 3 Zip Codes with the Highest Percentage of Population Employed in Accommodation & Food Services in Bellevue, WA?
Top 3 Zip Codes with the Highest Percentage of Population Employed in Accommodation & Food Services in Bellevue, WA are:
What zip code has the Highest Percentage of Population Employed in Accommodation & Food Services in Bellevue, WA?
98008 has the Highest Percentage of Population Employed in Accommodation & Food Services in Bellevue, WA with 6.7%.
What is the Percentage of Population Employed in Accommodation & Food Services in Bellevue, WA?
Percentage of Population Employed in Accommodation & Food Services in Bellevue is 4.8%.
What is the Percentage of Population Employed in Accommodation & Food Services in Washington?
Percentage of Population Employed in Accommodation & Food Services in Washington is 6.5%.
What is the Percentage of Population Employed in Accommodation & Food Services in the United States?
Percentage of Population Employed in Accommodation & Food Services in the United States is 6.9%.