Langley, WA Map & Demographics
Langley Map
Langley Overview
$56,083
PER CAPITA INCOME
$110,050
AVG FAMILY INCOME
$72,379
AVG HOUSEHOLD INCOME
24.9%
WAGE / INCOME GAP [ % ]
75.1¢/ $1
WAGE / INCOME GAP [ $ ]
0.43
INEQUALITY / GINI INDEX
1,076
TOTAL POPULATION
465
MALE POPULATION
611
FEMALE POPULATION
76.10
MALES / 100 FEMALES
131.40
FEMALES / 100 MALES
66.4
MEDIAN AGE
2.3
AVG FAMILY SIZE
1.8
AVG HOUSEHOLD SIZE
432
LABOR FORCE [ PEOPLE ]
42.6%
PERCENT IN LABOR FORCE
2.8%
UNEMPLOYMENT RATE
Langley Zip Codes
Langley Area Codes
Income in Langley
Income Overview in Langley
Per Capita Income in Langley is $56,083, while median incomes of families and households are $110,050 and $72,379 respectively.
| Characteristic | Number | Measure |
| Per Capita Income | 1,076 | $56,083 |
| Median Family Income | 283 | $110,050 |
| Mean Family Income | 283 | $125,331 |
| Median Household Income | 597 | $72,379 |
| Mean Household Income | 597 | $98,374 |
| Income Deficit | 283 | $0 |
| Wage / Income Gap (%) | 1,076 | 24.91% |
| Wage / Income Gap ($) | 1,076 | 75.09¢ per $1 |
| Gini / Inequality Index | 1,076 | 0.43 |
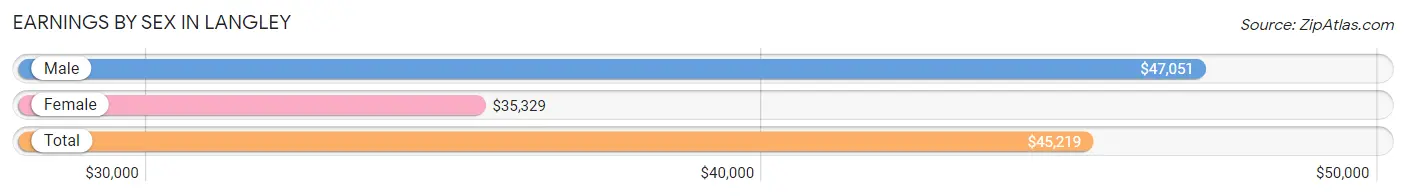
Earnings by Sex in Langley
Average Earnings in Langley are $45,219, $47,051 for men and $35,329 for women, a difference of 24.9%.
| Sex | Number | Average Earnings |
| Male | 276 (56.2%) | $47,051 |
| Female | 215 (43.8%) | $35,329 |
| Total | 491 (100.0%) | $45,219 |
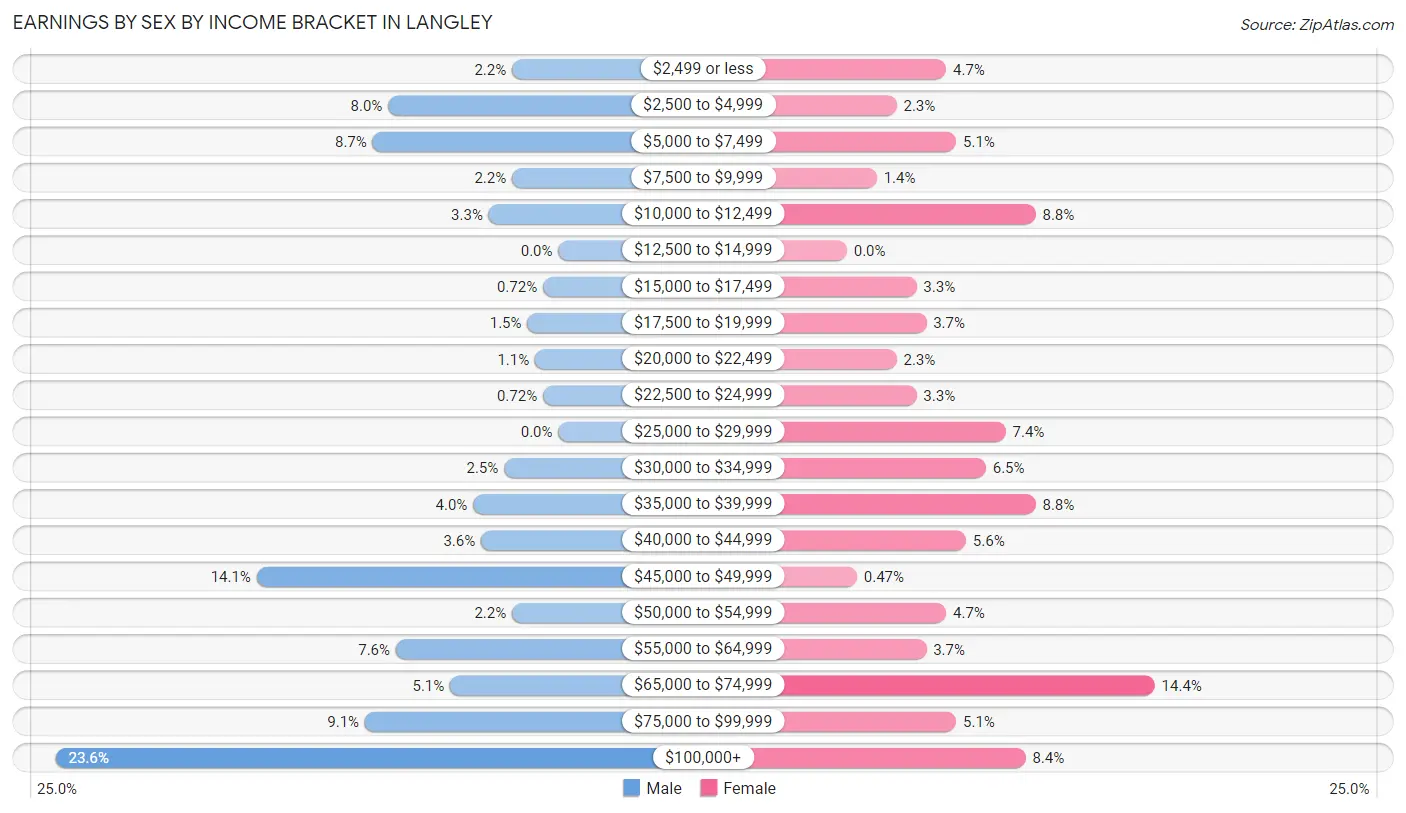
Earnings by Sex by Income Bracket in Langley
The most common earnings brackets in Langley are $100,000+ for men (65 | 23.5%) and $65,000 to $74,999 for women (31 | 14.4%).
| Income | Male | Female |
| $2,499 or less | 6 (2.2%) | 10 (4.6%) |
| $2,500 to $4,999 | 22 (8.0%) | 5 (2.3%) |
| $5,000 to $7,499 | 24 (8.7%) | 11 (5.1%) |
| $7,500 to $9,999 | 6 (2.2%) | 3 (1.4%) |
| $10,000 to $12,499 | 9 (3.3%) | 19 (8.8%) |
| $12,500 to $14,999 | 0 (0.0%) | 0 (0.0%) |
| $15,000 to $17,499 | 2 (0.7%) | 7 (3.3%) |
| $17,500 to $19,999 | 4 (1.5%) | 8 (3.7%) |
| $20,000 to $22,499 | 3 (1.1%) | 5 (2.3%) |
| $22,500 to $24,999 | 2 (0.7%) | 7 (3.3%) |
| $25,000 to $29,999 | 0 (0.0%) | 16 (7.4%) |
| $30,000 to $34,999 | 7 (2.5%) | 14 (6.5%) |
| $35,000 to $39,999 | 11 (4.0%) | 19 (8.8%) |
| $40,000 to $44,999 | 10 (3.6%) | 12 (5.6%) |
| $45,000 to $49,999 | 39 (14.1%) | 1 (0.5%) |
| $50,000 to $54,999 | 6 (2.2%) | 10 (4.6%) |
| $55,000 to $64,999 | 21 (7.6%) | 8 (3.7%) |
| $65,000 to $74,999 | 14 (5.1%) | 31 (14.4%) |
| $75,000 to $99,999 | 25 (9.1%) | 11 (5.1%) |
| $100,000+ | 65 (23.5%) | 18 (8.4%) |
| Total | 276 (100.0%) | 215 (100.0%) |
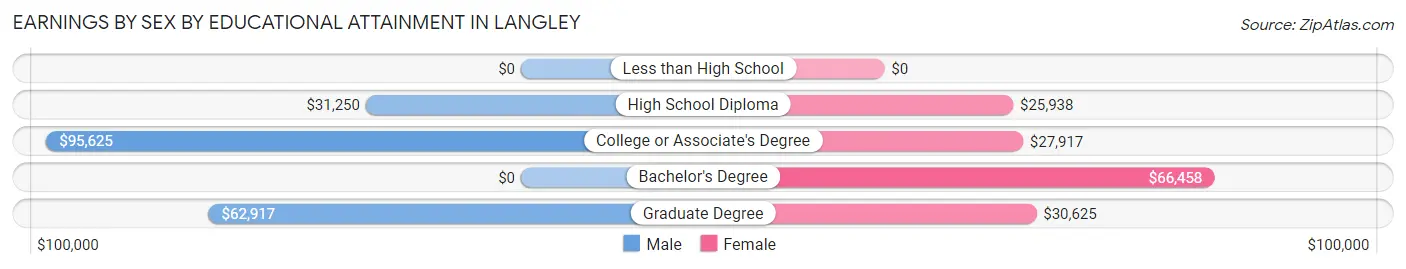
Earnings by Sex by Educational Attainment in Langley
Average earnings in Langley are $55,341 for men and $32,000 for women, a difference of 42.2%. Men with an educational attainment of college or associate's degree enjoy the highest average annual earnings of $95,625, while those with high school diploma education earn the least with $31,250. Women with an educational attainment of bachelor's degree earn the most with the average annual earnings of $66,458, while those with high school diploma education have the smallest earnings of $25,938.
| Educational Attainment | Male Income | Female Income |
| Less than High School | - | - |
| High School Diploma | $31,250 | $25,938 |
| College or Associate's Degree | $95,625 | $27,917 |
| Bachelor's Degree | - | - |
| Graduate Degree | $62,917 | $30,625 |
| Total | $55,341 | $32,000 |
Family Income in Langley
Family Income Brackets in Langley
According to the Langley family income data, there are 90 families falling into the $100,000 to $149,999 income range, which is the most common income bracket and makes up 31.8% of all families.
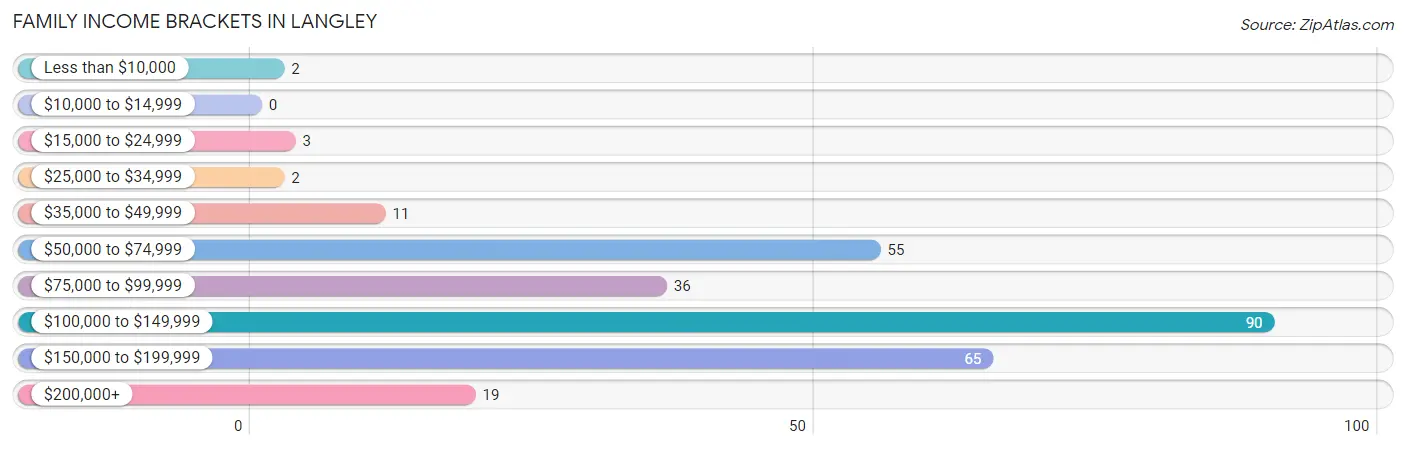
| Income Bracket | # Families | % Families |
| Less than $10,000 | 2 | 0.7% |
| $10,000 to $14,999 | 0 | 0.0% |
| $15,000 to $24,999 | 3 | 1.1% |
| $25,000 to $34,999 | 2 | 0.7% |
| $35,000 to $49,999 | 11 | 3.9% |
| $50,000 to $74,999 | 55 | 19.4% |
| $75,000 to $99,999 | 36 | 12.7% |
| $100,000 to $149,999 | 90 | 31.8% |
| $150,000 to $199,999 | 65 | 23.0% |
| $200,000+ | 19 | 6.7% |
Family Income by Famaliy Size in Langley
3-person families (16 | 5.7%) account for the highest median family income in Langley with $172,000 per family, while 3-person families (16 | 5.7%) have the highest median income of $57,333 per family member.
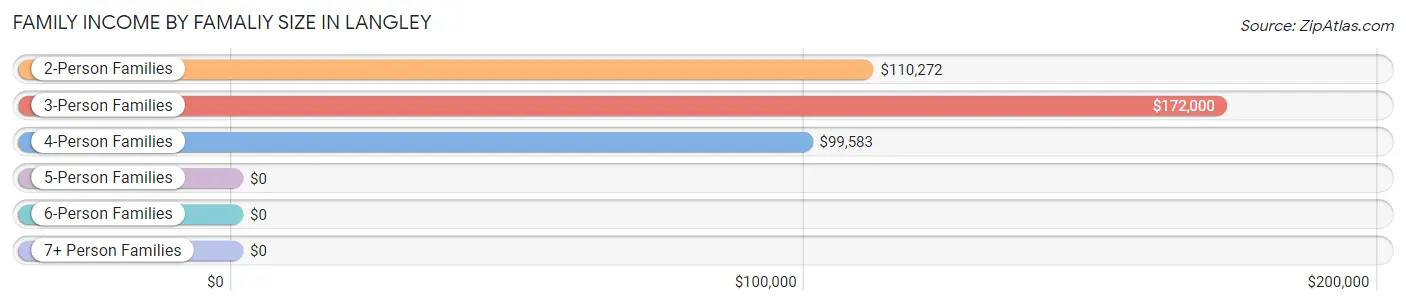
| Income Bracket | # Families | Median Income |
| 2-Person Families | 229 (80.9%) | $110,272 |
| 3-Person Families | 16 (5.7%) | $172,000 |
| 4-Person Families | 34 (12.0%) | $99,583 |
| 5-Person Families | 4 (1.4%) | $0 |
| 6-Person Families | 0 (0.0%) | $0 |
| 7+ Person Families | 0 (0.0%) | $0 |
| Total | 283 (100.0%) | $110,050 |
Family Income by Number of Earners in Langley
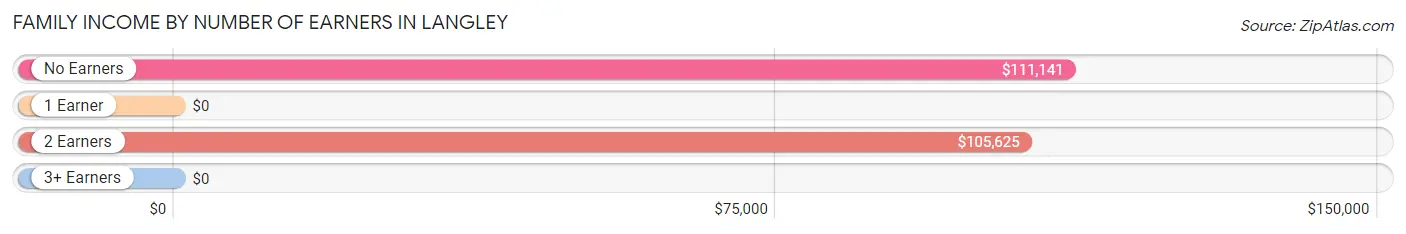
| Number of Earners | # Families | Median Income |
| No Earners | 87 (30.7%) | $111,141 |
| 1 Earner | 94 (33.2%) | $0 |
| 2 Earners | 99 (35.0%) | $105,625 |
| 3+ Earners | 3 (1.1%) | $0 |
| Total | 283 (100.0%) | $110,050 |
Household Income in Langley
Household Income Brackets in Langley
With 119 households falling in the category, the $100,000 to $149,999 income range is the most frequent in Langley, accounting for 19.9% of all households. In contrast, only 8 households (1.3%) fall into the less than $10,000 income bracket, making it the least populous group.
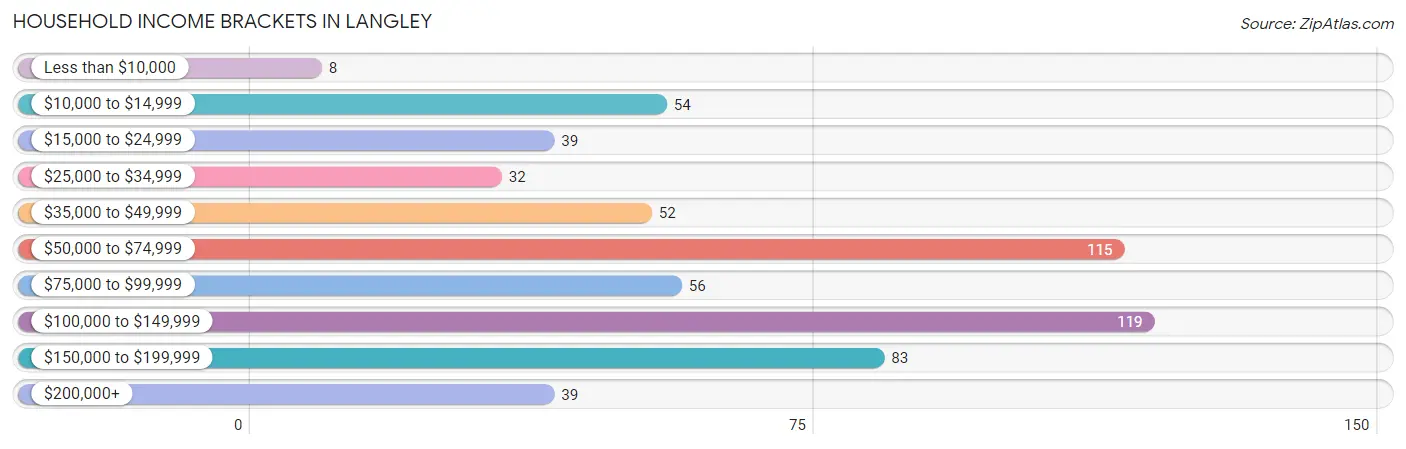
| Income Bracket | # Households | % Households |
| Less than $10,000 | 8 | 1.3% |
| $10,000 to $14,999 | 54 | 9.0% |
| $15,000 to $24,999 | 39 | 6.5% |
| $25,000 to $34,999 | 32 | 5.4% |
| $35,000 to $49,999 | 52 | 8.7% |
| $50,000 to $74,999 | 115 | 19.3% |
| $75,000 to $99,999 | 56 | 9.4% |
| $100,000 to $149,999 | 119 | 19.9% |
| $150,000 to $199,999 | 83 | 13.9% |
| $200,000+ | 39 | 6.5% |
Household Income by Householder Age in Langley
The median household income in Langley is $72,379, with the highest median household income of $136,250 found in the 25 to 44 years age bracket for the primary householder. A total of 30 households (5.0%) fall into this category. Meanwhile, the 15 to 24 years age bracket for the primary householder has the lowest median household income of $0, with 13 households (2.2%) in this group.
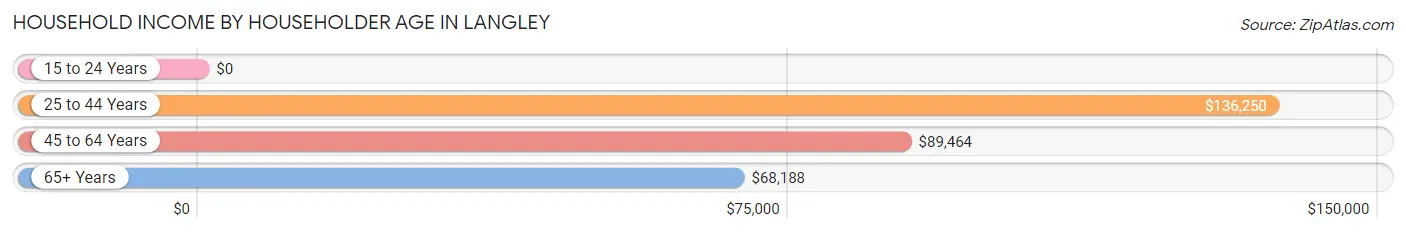
| Income Bracket | # Households | Median Income |
| 15 to 24 Years | 13 (2.2%) | $0 |
| 25 to 44 Years | 30 (5.0%) | $136,250 |
| 45 to 64 Years | 171 (28.6%) | $89,464 |
| 65+ Years | 383 (64.1%) | $68,188 |
| Total | 597 (100.0%) | $72,379 |
Poverty in Langley
Income Below Poverty by Sex and Age in Langley
With 3.4% poverty level for males and 14.4% for females among the residents of Langley, 45 to 54 year old males and 45 to 54 year old females are the most vulnerable to poverty, with 4 males (10.0%) and 17 females (30.9%) in their respective age groups living below the poverty level.
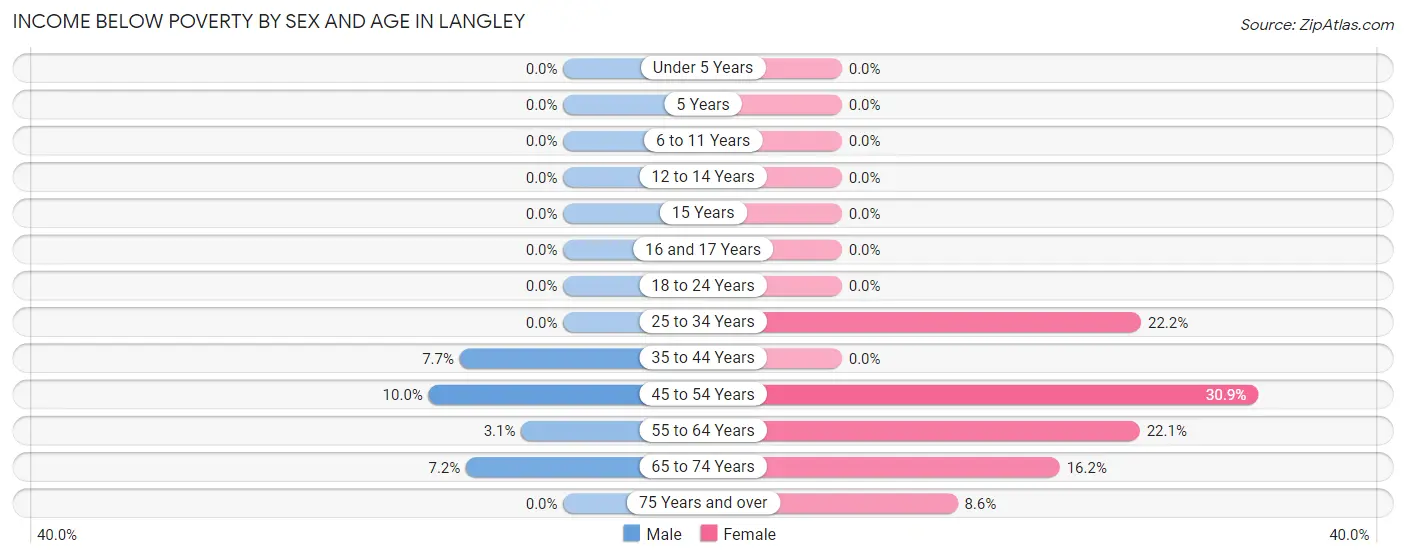
| Age Bracket | Male | Female |
| Under 5 Years | 0 (0.0%) | 0 (0.0%) |
| 5 Years | 0 (0.0%) | 0 (0.0%) |
| 6 to 11 Years | 0 (0.0%) | 0 (0.0%) |
| 12 to 14 Years | 0 (0.0%) | 0 (0.0%) |
| 15 Years | 0 (0.0%) | 0 (0.0%) |
| 16 and 17 Years | 0 (0.0%) | 0 (0.0%) |
| 18 to 24 Years | 0 (0.0%) | 0 (0.0%) |
| 25 to 34 Years | 0 (0.0%) | 6 (22.2%) |
| 35 to 44 Years | 2 (7.7%) | 0 (0.0%) |
| 45 to 54 Years | 4 (10.0%) | 17 (30.9%) |
| 55 to 64 Years | 3 (3.1%) | 23 (22.1%) |
| 65 to 74 Years | 7 (7.2%) | 28 (16.2%) |
| 75 Years and over | 0 (0.0%) | 14 (8.6%) |
| Total | 16 (3.4%) | 88 (14.4%) |
Income Above Poverty by Sex and Age in Langley
According to the poverty statistics in Langley, males aged under 5 years and females aged under 5 years are the age groups that are most secure financially, with 100.0% of males and 100.0% of females in these age groups living above the poverty line.
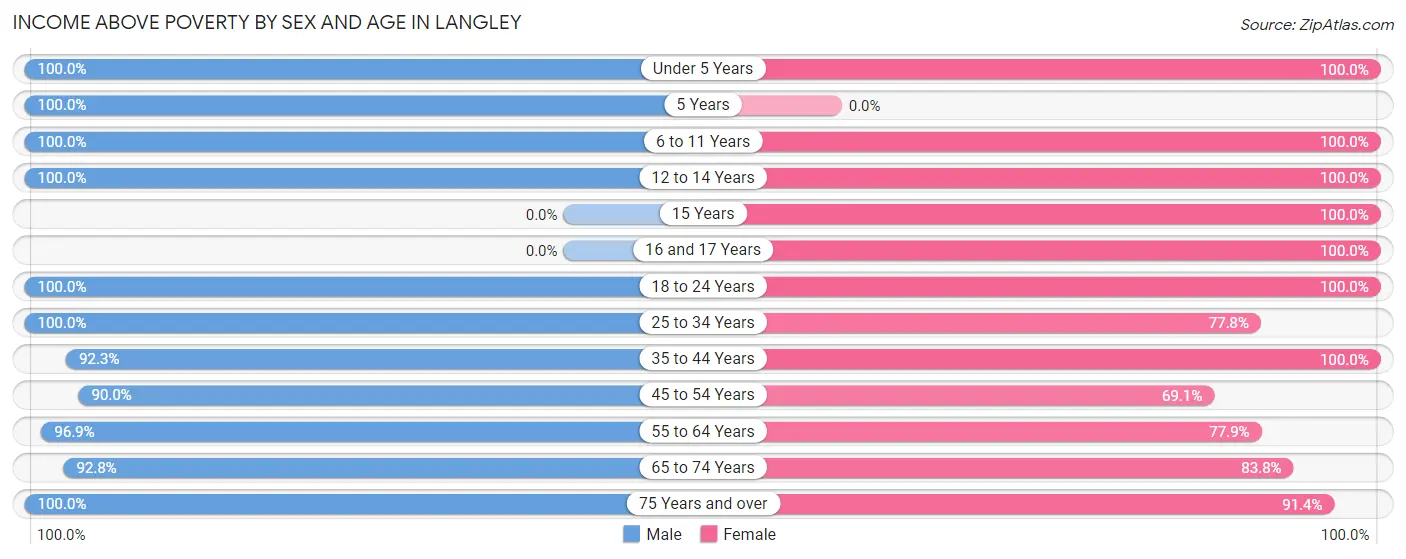
| Age Bracket | Male | Female |
| Under 5 Years | 7 (100.0%) | 10 (100.0%) |
| 5 Years | 6 (100.0%) | 0 (0.0%) |
| 6 to 11 Years | 9 (100.0%) | 10 (100.0%) |
| 12 to 14 Years | 4 (100.0%) | 5 (100.0%) |
| 15 Years | 0 (0.0%) | 10 (100.0%) |
| 16 and 17 Years | 0 (0.0%) | 8 (100.0%) |
| 18 to 24 Years | 34 (100.0%) | 21 (100.0%) |
| 25 to 34 Years | 10 (100.0%) | 21 (77.8%) |
| 35 to 44 Years | 24 (92.3%) | 25 (100.0%) |
| 45 to 54 Years | 36 (90.0%) | 38 (69.1%) |
| 55 to 64 Years | 93 (96.9%) | 81 (77.9%) |
| 65 to 74 Years | 90 (92.8%) | 145 (83.8%) |
| 75 Years and over | 136 (100.0%) | 149 (91.4%) |
| Total | 449 (96.6%) | 523 (85.6%) |
Income Below Poverty Among Married-Couple Families in Langley
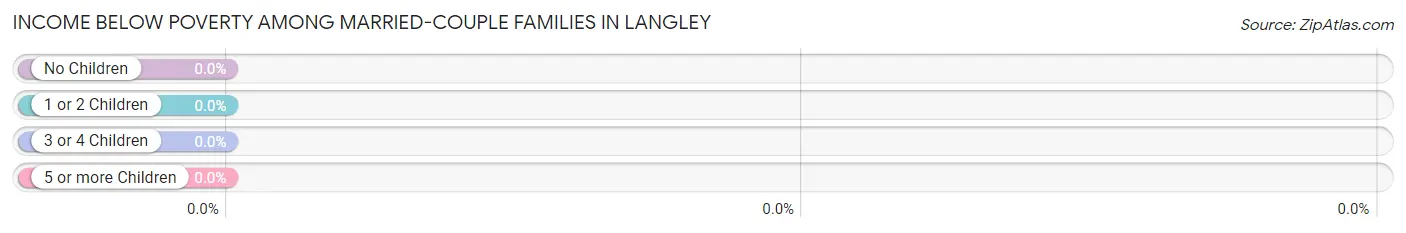
| Children | Above Poverty | Below Poverty |
| No Children | 231 (100.0%) | 0 (0.0%) |
| 1 or 2 Children | 33 (100.0%) | 0 (0.0%) |
| 3 or 4 Children | 4 (100.0%) | 0 (0.0%) |
| 5 or more Children | 0 (0.0%) | 0 (0.0%) |
| Total | 268 (100.0%) | 0 (0.0%) |
Income Below Poverty Among Single-Parent Households in Langley
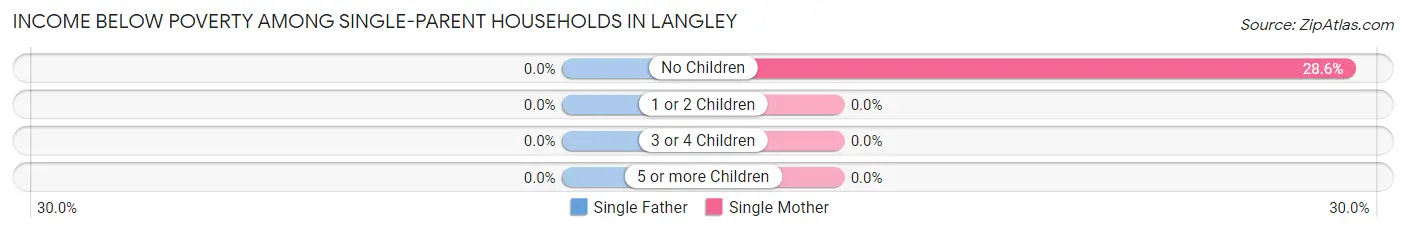
| Children | Single Father | Single Mother |
| No Children | 0 (0.0%) | 2 (28.6%) |
| 1 or 2 Children | 0 (0.0%) | 0 (0.0%) |
| 3 or 4 Children | 0 (0.0%) | 0 (0.0%) |
| 5 or more Children | 0 (0.0%) | 0 (0.0%) |
| Total | 0 (0.0%) | 2 (28.6%) |
Income Below Poverty Among Married-Couple vs Single-Parent Households in Langley
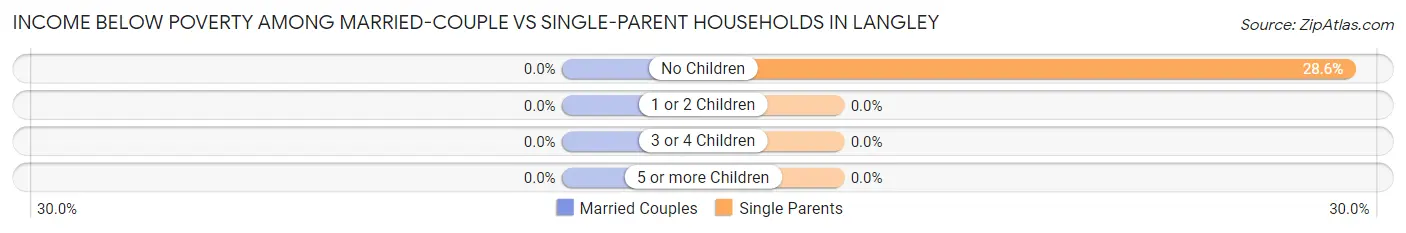
| Children | Married-Couple Families | Single-Parent Households |
| No Children | 0 (0.0%) | 2 (28.6%) |
| 1 or 2 Children | 0 (0.0%) | 0 (0.0%) |
| 3 or 4 Children | 0 (0.0%) | 0 (0.0%) |
| 5 or more Children | 0 (0.0%) | 0 (0.0%) |
| Total | 0 (0.0%) | 2 (13.3%) |
Race in Langley
The most populous races in Langley are White / Caucasian (990 | 92.0%), Two or more Races (43 | 4.0%), and Hispanic or Latino (32 | 3.0%).
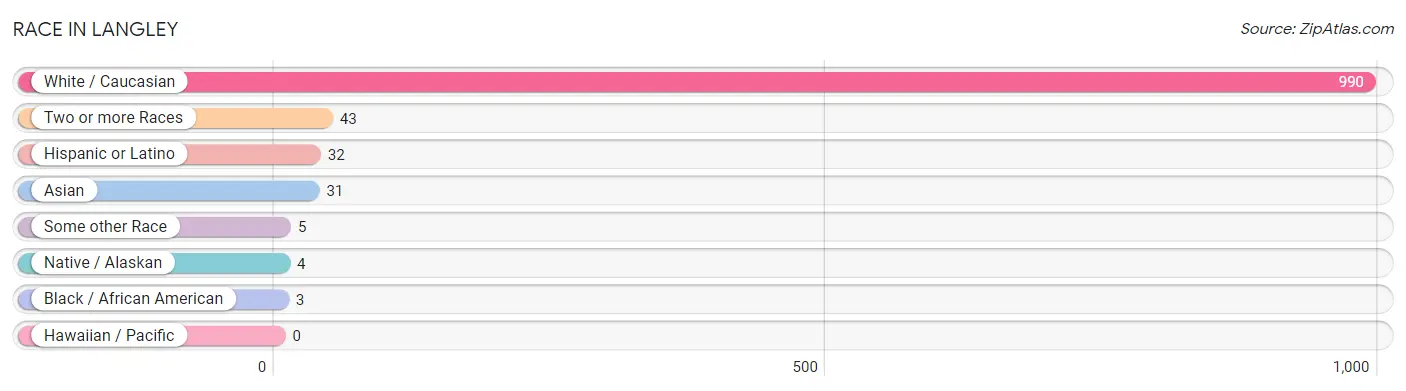
| Race | # Population | % Population |
| Asian | 31 | 2.9% |
| Black / African American | 3 | 0.3% |
| Hawaiian / Pacific | 0 | 0.0% |
| Hispanic or Latino | 32 | 3.0% |
| Native / Alaskan | 4 | 0.4% |
| White / Caucasian | 990 | 92.0% |
| Two or more Races | 43 | 4.0% |
| Some other Race | 5 | 0.5% |
| Total | 1,076 | 100.0% |
Ancestry in Langley
The most populous ancestries reported in Langley are German (246 | 22.9%), English (234 | 21.7%), Irish (166 | 15.4%), Norwegian (102 | 9.5%), and Scottish (94 | 8.7%), together accounting for 78.3% of all Langley residents.
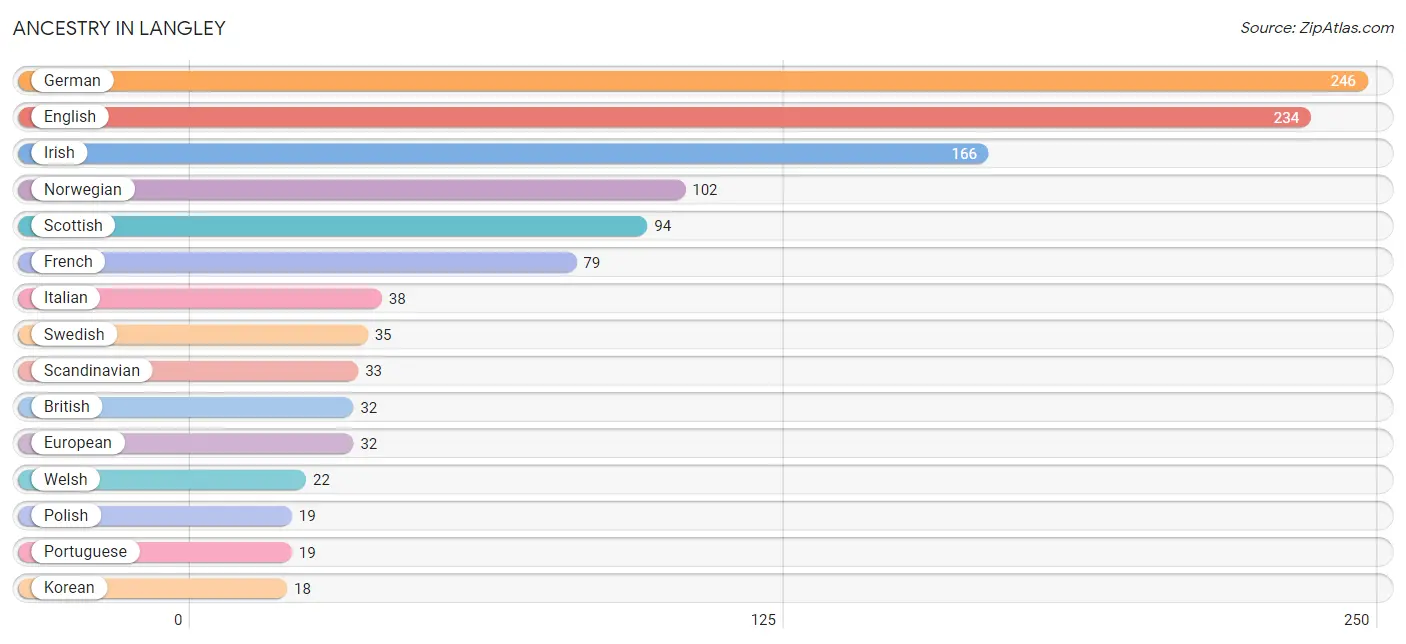
| Ancestry | # Population | % Population |
| American | 12 | 1.1% |
| Arab | 3 | 0.3% |
| Austrian | 2 | 0.2% |
| British | 32 | 3.0% |
| Burmese | 7 | 0.6% |
| Canadian | 3 | 0.3% |
| Central American | 2 | 0.2% |
| Cherokee | 4 | 0.4% |
| Cuban | 9 | 0.8% |
| Czech | 12 | 1.1% |
| Danish | 16 | 1.5% |
| Dutch | 14 | 1.3% |
| English | 234 | 21.7% |
| European | 32 | 3.0% |
| French | 79 | 7.3% |
| German | 246 | 22.9% |
| Greek | 7 | 0.6% |
| Guatemalan | 2 | 0.2% |
| Indian (Asian) | 4 | 0.4% |
| Irish | 166 | 15.4% |
| Israeli | 8 | 0.7% |
| Italian | 38 | 3.5% |
| Korean | 18 | 1.7% |
| Lithuanian | 8 | 0.7% |
| Mexican | 18 | 1.7% |
| Northern European | 1 | 0.1% |
| Norwegian | 102 | 9.5% |
| Polish | 19 | 1.8% |
| Portuguese | 19 | 1.8% |
| Russian | 16 | 1.5% |
| Scandinavian | 33 | 3.1% |
| Scotch-Irish | 10 | 0.9% |
| Scottish | 94 | 8.7% |
| Slovak | 7 | 0.6% |
| Sri Lankan | 16 | 1.5% |
| Swedish | 35 | 3.3% |
| Swiss | 13 | 1.2% |
| Ukrainian | 5 | 0.5% |
| Welsh | 22 | 2.0% | View All 39 Rows |
Immigrants in Langley
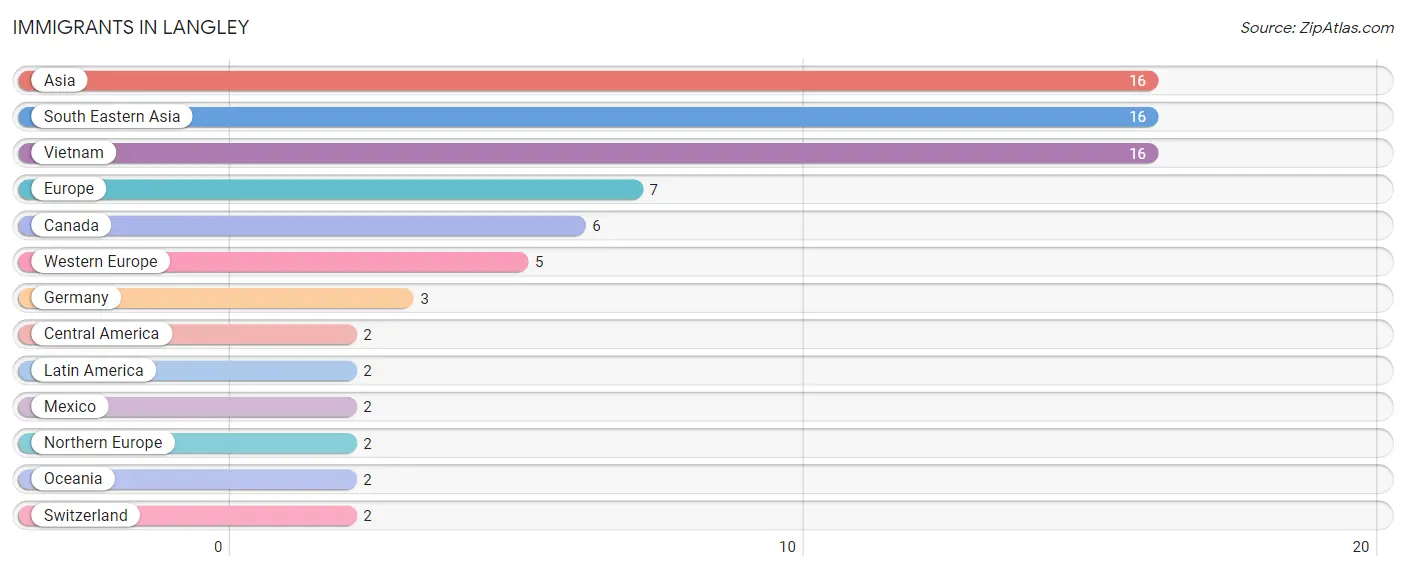
The most numerous immigrant groups reported in Langley came from Asia (16 | 1.5%), South Eastern Asia (16 | 1.5%), Vietnam (16 | 1.5%), Europe (7 | 0.6%), and Canada (6 | 0.6%), together accounting for 5.7% of all Langley residents.
| Immigration Origin | # Population | % Population |
| Asia | 16 | 1.5% |
| Canada | 6 | 0.6% |
| Central America | 2 | 0.2% |
| Europe | 7 | 0.6% |
| Germany | 3 | 0.3% |
| Latin America | 2 | 0.2% |
| Mexico | 2 | 0.2% |
| Northern Europe | 2 | 0.2% |
| Oceania | 2 | 0.2% |
| South Eastern Asia | 16 | 1.5% |
| Switzerland | 2 | 0.2% |
| Vietnam | 16 | 1.5% |
| Western Europe | 5 | 0.5% | View All 13 Rows |
Sex and Age in Langley
Sex and Age in Langley
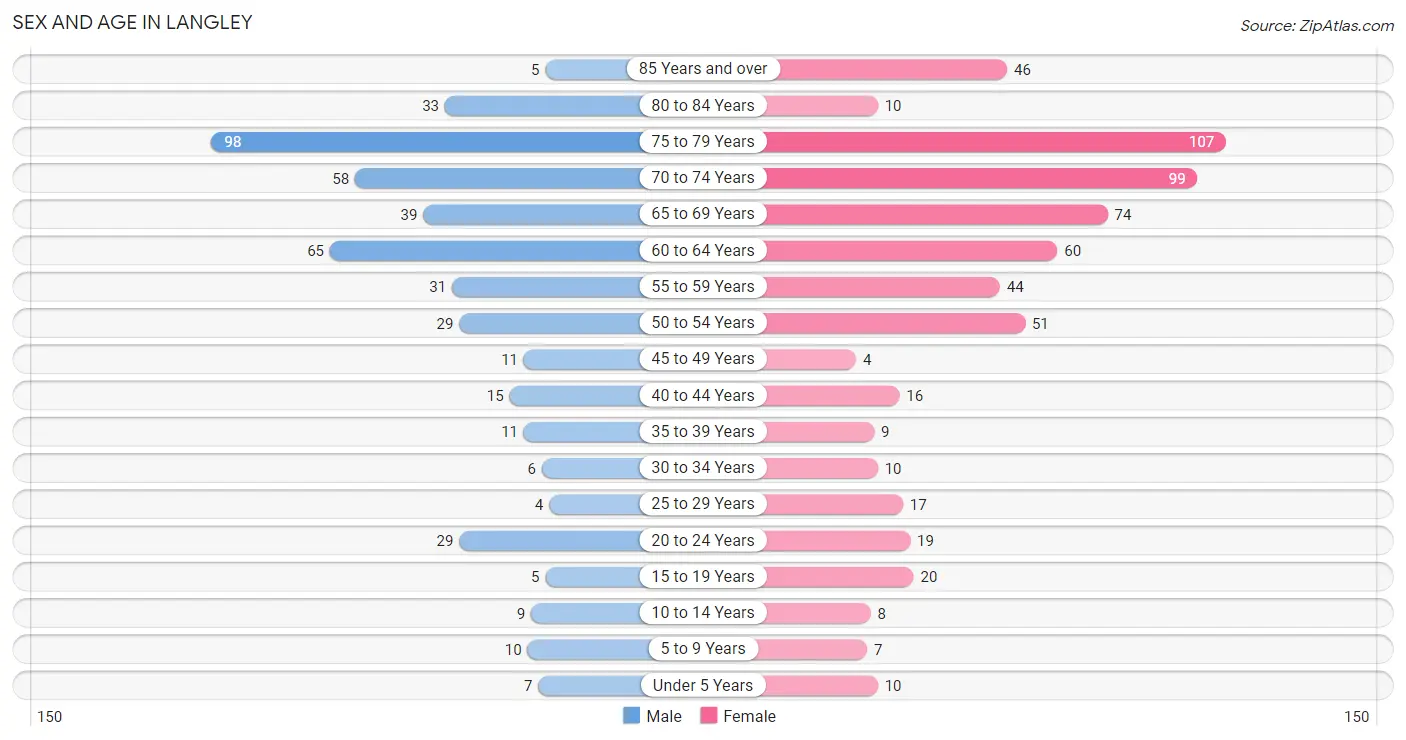
The most populous age groups in Langley are 75 to 79 Years (98 | 21.1%) for men and 75 to 79 Years (107 | 17.5%) for women.
| Age Bracket | Male | Female |
| Under 5 Years | 7 (1.5%) | 10 (1.6%) |
| 5 to 9 Years | 10 (2.1%) | 7 (1.1%) |
| 10 to 14 Years | 9 (1.9%) | 8 (1.3%) |
| 15 to 19 Years | 5 (1.1%) | 20 (3.3%) |
| 20 to 24 Years | 29 (6.2%) | 19 (3.1%) |
| 25 to 29 Years | 4 (0.9%) | 17 (2.8%) |
| 30 to 34 Years | 6 (1.3%) | 10 (1.6%) |
| 35 to 39 Years | 11 (2.4%) | 9 (1.5%) |
| 40 to 44 Years | 15 (3.2%) | 16 (2.6%) |
| 45 to 49 Years | 11 (2.4%) | 4 (0.6%) |
| 50 to 54 Years | 29 (6.2%) | 51 (8.4%) |
| 55 to 59 Years | 31 (6.7%) | 44 (7.2%) |
| 60 to 64 Years | 65 (14.0%) | 60 (9.8%) |
| 65 to 69 Years | 39 (8.4%) | 74 (12.1%) |
| 70 to 74 Years | 58 (12.5%) | 99 (16.2%) |
| 75 to 79 Years | 98 (21.1%) | 107 (17.5%) |
| 80 to 84 Years | 33 (7.1%) | 10 (1.6%) |
| 85 Years and over | 5 (1.1%) | 46 (7.5%) |
| Total | 465 (100.0%) | 611 (100.0%) |
Families and Households in Langley
Median Family Size in Langley
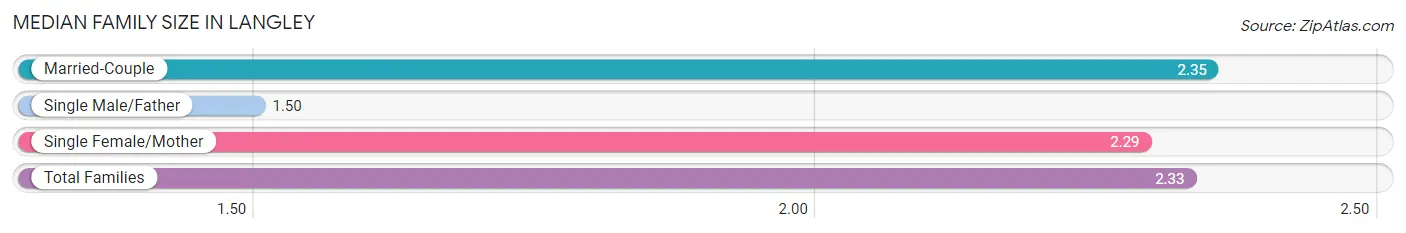
The median family size in Langley is 2.33 persons per family, with married-couple families (268 | 94.7%) accounting for the largest median family size of 2.35 persons per family. On the other hand, single male/father families (8 | 2.8%) represent the smallest median family size with 1.50 persons per family.
| Family Type | # Families | Family Size |
| Married-Couple | 268 (94.7%) | 2.35 |
| Single Male/Father | 8 (2.8%) | 1.50 |
| Single Female/Mother | 7 (2.5%) | 2.29 |
| Total Families | 283 (100.0%) | 2.33 |
Median Household Size in Langley
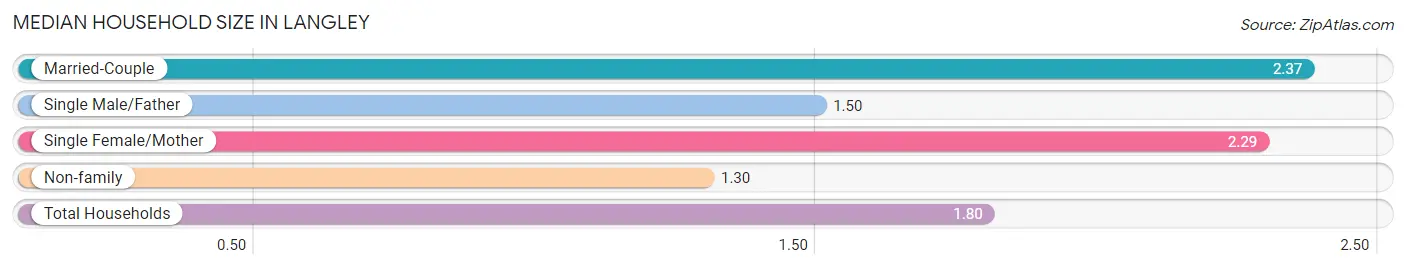
The median household size in Langley is 1.80 persons per household, with married-couple households (268 | 44.9%) accounting for the largest median household size of 2.37 persons per household. non-family households (314 | 52.6%) represent the smallest median household size with 1.30 persons per household.
| Household Type | # Households | Household Size |
| Married-Couple | 268 (44.9%) | 2.37 |
| Single Male/Father | 8 (1.3%) | 1.50 |
| Single Female/Mother | 7 (1.2%) | 2.29 |
| Non-family | 314 (52.6%) | 1.30 |
| Total Households | 597 (100.0%) | 1.80 |
Household Size by Marriage Status in Langley
Out of a total of 597 households in Langley, 283 (47.4%) are family households, while 314 (52.6%) are nonfamily households. The most numerous type of family households are 2-person households, comprising 227, and the most common type of nonfamily households are 1-person households, comprising 248.
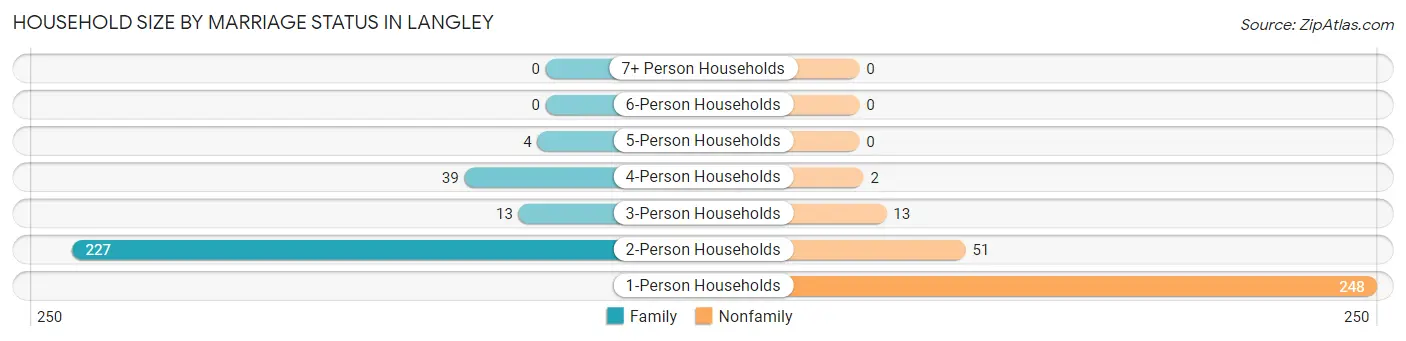
| Household Size | Family Households | Nonfamily Households |
| 1-Person Households | - | 248 (41.5%) |
| 2-Person Households | 227 (38.0%) | 51 (8.5%) |
| 3-Person Households | 13 (2.2%) | 13 (2.2%) |
| 4-Person Households | 39 (6.5%) | 2 (0.3%) |
| 5-Person Households | 4 (0.7%) | 0 (0.0%) |
| 6-Person Households | 0 (0.0%) | 0 (0.0%) |
| 7+ Person Households | 0 (0.0%) | 0 (0.0%) |
| Total | 283 (47.4%) | 314 (52.6%) |
Female Fertility in Langley
Fertility by Age in Langley
Average fertility rate in Langley is 33.0 births per 1,000 women. Women in the age bracket of 35 to 50 years have the highest fertility rate with 74.0 births per 1,000 women. Women in the age bracket of 35 to 50 years acount for 100.0% of all women with births.
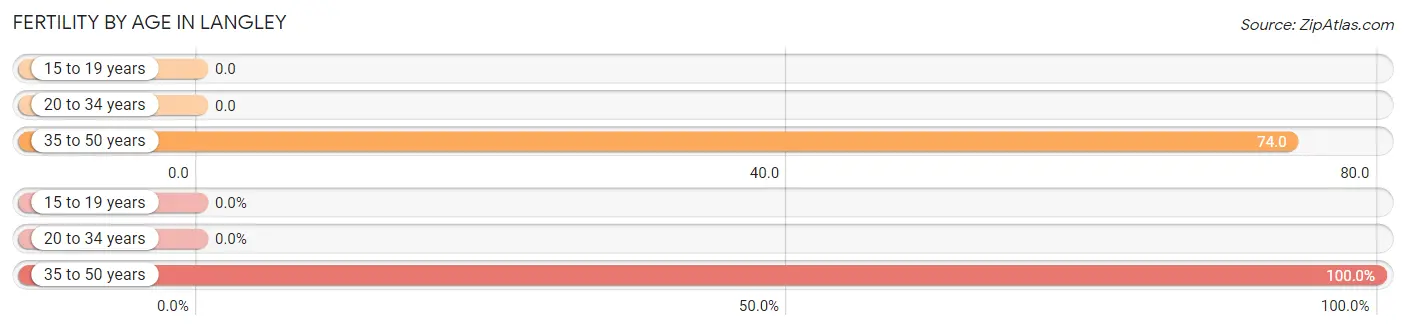
| Age Bracket | Women with Births | Births / 1,000 Women |
| 15 to 19 years | 0 (0.0%) | 0.0 |
| 20 to 34 years | 0 (0.0%) | 0.0 |
| 35 to 50 years | 4 (100.0%) | 74.0 |
| Total | 4 (100.0%) | 33.0 |
Fertility by Age by Marriage Status in Langley
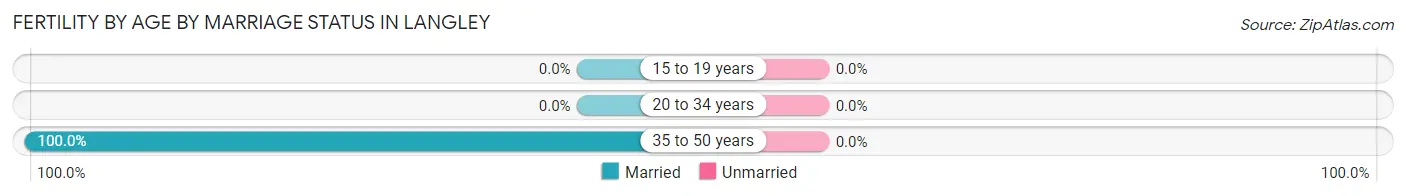
| Age Bracket | Married | Unmarried |
| 15 to 19 years | 0 (0.0%) | 0 (0.0%) |
| 20 to 34 years | 0 (0.0%) | 0 (0.0%) |
| 35 to 50 years | 4 (100.0%) | 0 (0.0%) |
| Total | 4 (100.0%) | 0 (0.0%) |
Fertility by Education in Langley
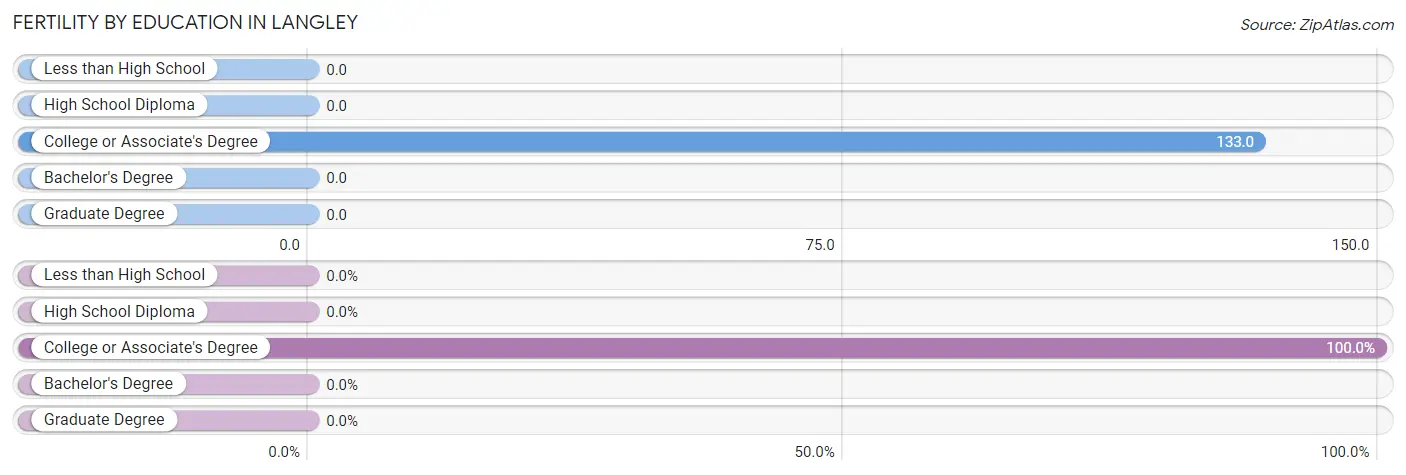
| Educational Attainment | Women with Births | Births / 1,000 Women |
| Less than High School | 0 (0.0%) | 0.0 |
| High School Diploma | 0 (0.0%) | 0.0 |
| College or Associate's Degree | 4 (100.0%) | 133.0 |
| Bachelor's Degree | 0 (0.0%) | 0.0 |
| Graduate Degree | 0 (0.0%) | 0.0 |
| Total | 4 (100.0%) | 33.0 |
Fertility by Education by Marriage Status in Langley
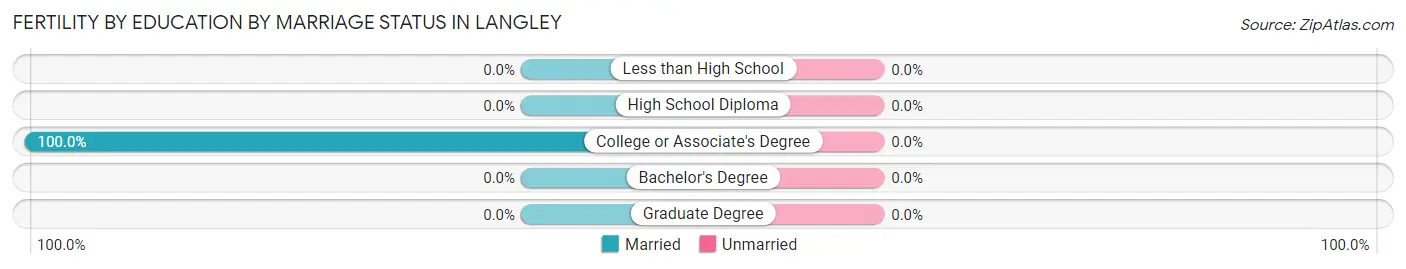
| Educational Attainment | Married | Unmarried |
| Less than High School | 0 (0.0%) | 0 (0.0%) |
| High School Diploma | 0 (0.0%) | 0 (0.0%) |
| College or Associate's Degree | 4 (100.0%) | 0 (0.0%) |
| Bachelor's Degree | 0 (0.0%) | 0 (0.0%) |
| Graduate Degree | 0 (0.0%) | 0 (0.0%) |
| Total | 4 (100.0%) | 0 (0.0%) |
Employment Characteristics in Langley
Employment by Class of Employer in Langley
Among the 420 employed individuals in Langley, private company employees (201 | 47.9%), not-for-profit organizations (82 | 19.5%), and self-employed (not incorporated) (57 | 13.6%) make up the most common classes of employment.
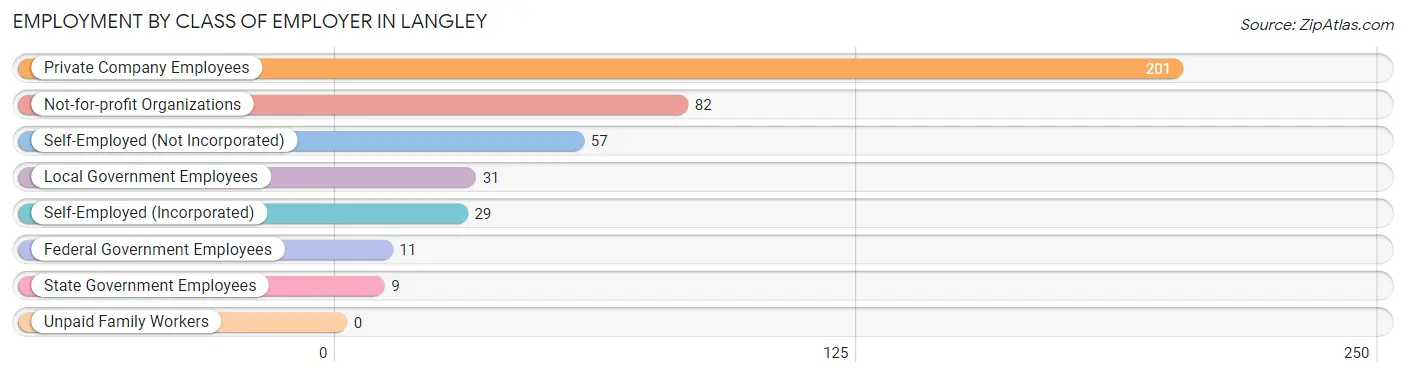
| Employer Class | # Employees | % Employees |
| Private Company Employees | 201 | 47.9% |
| Self-Employed (Incorporated) | 29 | 6.9% |
| Self-Employed (Not Incorporated) | 57 | 13.6% |
| Not-for-profit Organizations | 82 | 19.5% |
| Local Government Employees | 31 | 7.4% |
| State Government Employees | 9 | 2.1% |
| Federal Government Employees | 11 | 2.6% |
| Unpaid Family Workers | 0 | 0.0% |
| Total | 420 | 100.0% |
Employment Status by Age in Langley
According to the labor force statistics for Langley, out of the total population over 16 years of age (1,015), 42.6% or 432 individuals are in the labor force, with 2.8% or 12 of them unemployed. The age group with the highest labor force participation rate is 20 to 24 years, with 100.0% or 48 individuals in the labor force. Within the labor force, the 25 to 29 years age range has the highest percentage of unemployed individuals, with 41.7% or 5 of them being unemployed.
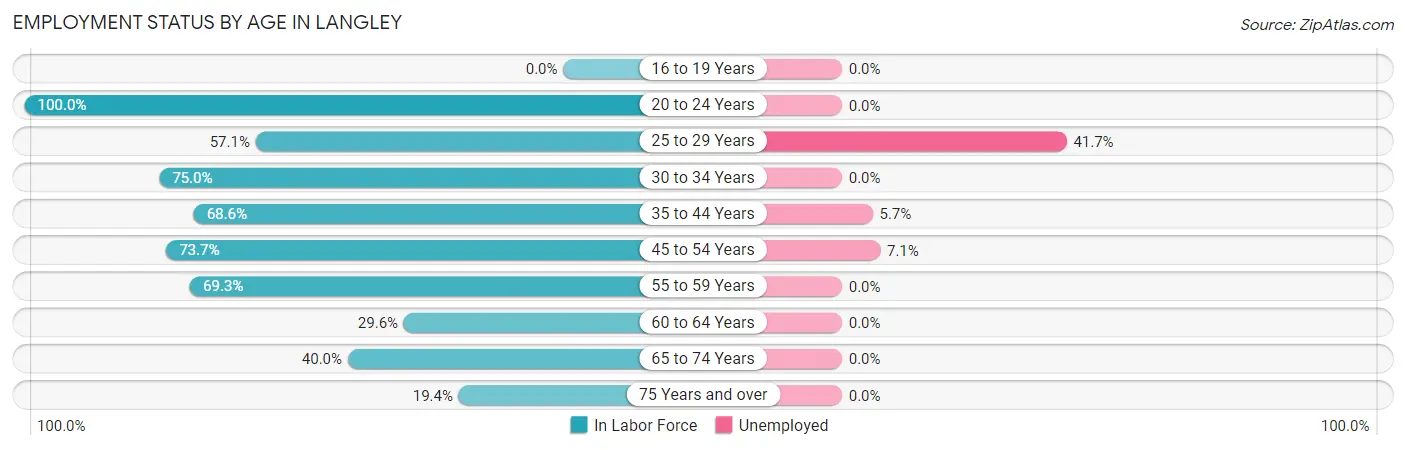
| Age Bracket | In Labor Force | Unemployed |
| 16 to 19 Years | 0 (0.0%) | 0 (0.0%) |
| 20 to 24 Years | 48 (100.0%) | 0 (0.0%) |
| 25 to 29 Years | 12 (57.1%) | 5 (41.7%) |
| 30 to 34 Years | 12 (75.0%) | 0 (0.0%) |
| 35 to 44 Years | 35 (68.6%) | 2 (5.7%) |
| 45 to 54 Years | 70 (73.7%) | 5 (7.1%) |
| 55 to 59 Years | 52 (69.3%) | 0 (0.0%) |
| 60 to 64 Years | 37 (29.6%) | 0 (0.0%) |
| 65 to 74 Years | 108 (40.0%) | 0 (0.0%) |
| 75 Years and over | 58 (19.4%) | 0 (0.0%) |
| Total | 432 (42.6%) | 12 (2.8%) |
Employment Status by Educational Attainment in Langley
According to labor force statistics for Langley, 56.9% of individuals (218) out of the total population between 25 and 64 years of age (383) are in the labor force, with 5.5% or 12 of them being unemployed. The group with the highest labor force participation rate are those with the educational attainment of bachelor's degree or higher, with 60.4% or 136 individuals in the labor force. Within the labor force, individuals with bachelor's degree or higher education have the highest percentage of unemployment, with 6.6% or 9 of them being unemployed.
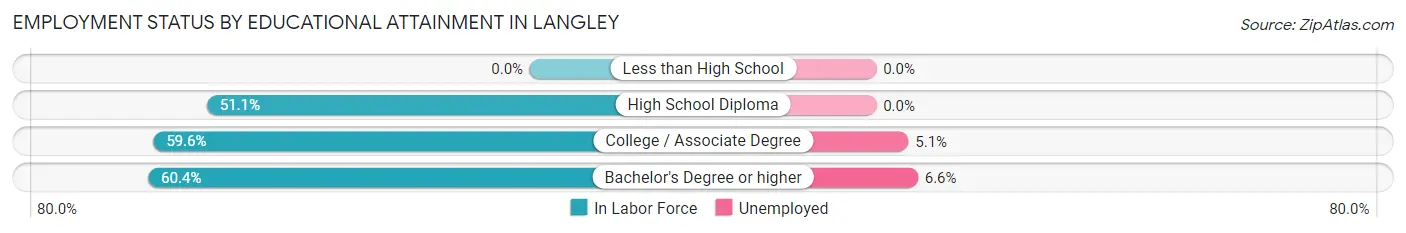
| Educational Attainment | In Labor Force | Unemployed |
| Less than High School | 0 (0.0%) | 0 (0.0%) |
| High School Diploma | 23 (51.1%) | 0 (0.0%) |
| College / Associate Degree | 59 (59.6%) | 5 (5.1%) |
| Bachelor's Degree or higher | 136 (60.4%) | 15 (6.6%) |
| Total | 218 (56.9%) | 21 (5.5%) |
Employment Occupations by Sex in Langley
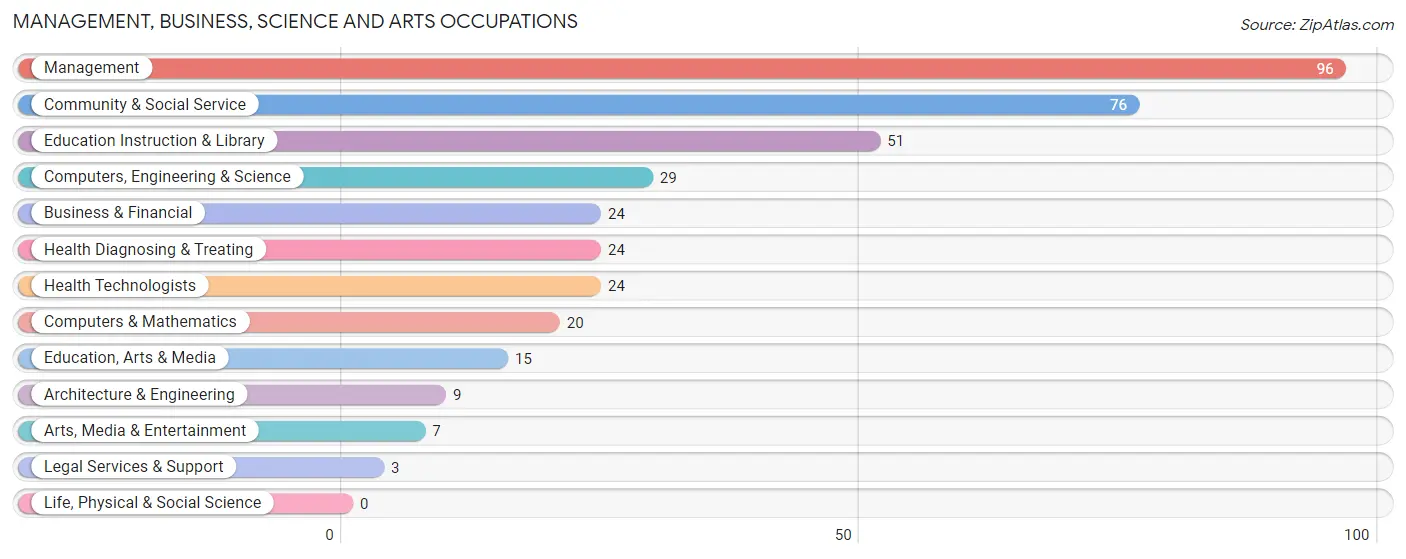
Management, Business, Science and Arts Occupations
The most common Management, Business, Science and Arts occupations in Langley are Management (96 | 22.9%), Community & Social Service (76 | 18.1%), Education Instruction & Library (51 | 12.1%), Computers, Engineering & Science (29 | 6.9%), and Business & Financial (24 | 5.7%).
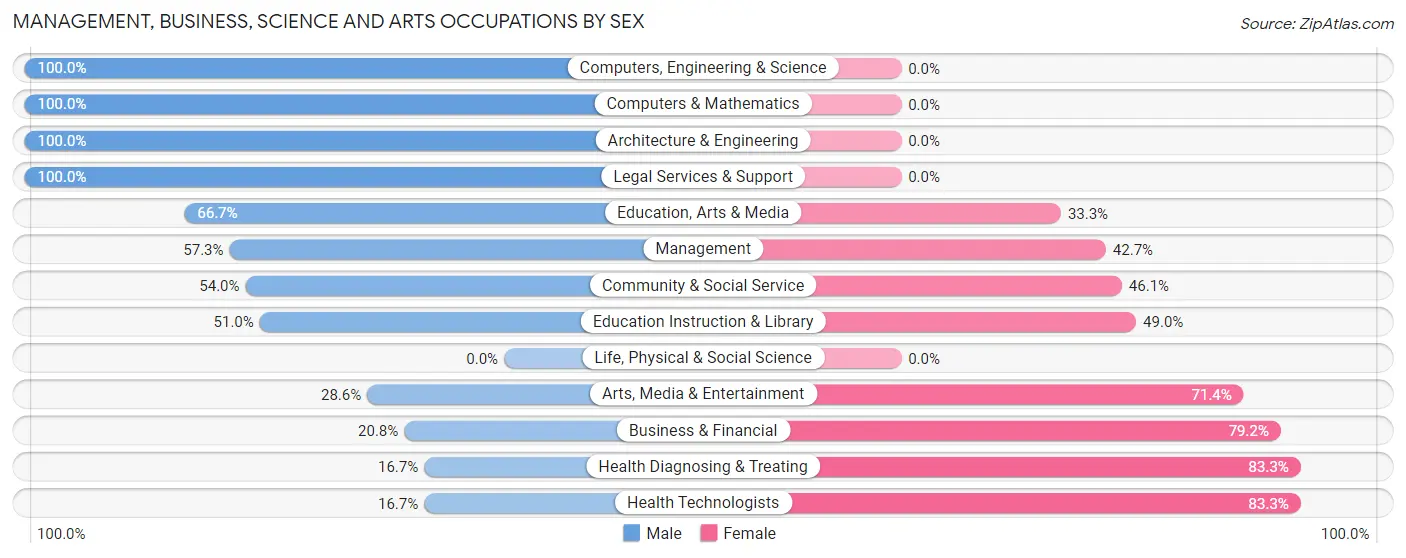
Management, Business, Science and Arts Occupations by Sex
Within the Management, Business, Science and Arts occupations in Langley, the most male-oriented occupations are Computers, Engineering & Science (100.0%), Computers & Mathematics (100.0%), and Architecture & Engineering (100.0%), while the most female-oriented occupations are Health Diagnosing & Treating (83.3%), Health Technologists (83.3%), and Business & Financial (79.2%).
| Occupation | Male | Female |
| Management | 55 (57.3%) | 41 (42.7%) |
| Business & Financial | 5 (20.8%) | 19 (79.2%) |
| Computers, Engineering & Science | 29 (100.0%) | 0 (0.0%) |
| Computers & Mathematics | 20 (100.0%) | 0 (0.0%) |
| Architecture & Engineering | 9 (100.0%) | 0 (0.0%) |
| Life, Physical & Social Science | 0 (0.0%) | 0 (0.0%) |
| Community & Social Service | 41 (53.9%) | 35 (46.1%) |
| Education, Arts & Media | 10 (66.7%) | 5 (33.3%) |
| Legal Services & Support | 3 (100.0%) | 0 (0.0%) |
| Education Instruction & Library | 26 (51.0%) | 25 (49.0%) |
| Arts, Media & Entertainment | 2 (28.6%) | 5 (71.4%) |
| Health Diagnosing & Treating | 4 (16.7%) | 20 (83.3%) |
| Health Technologists | 4 (16.7%) | 20 (83.3%) |
| Total (Category) | 134 (53.8%) | 115 (46.2%) |
| Total (Overall) | 222 (52.9%) | 198 (47.1%) |
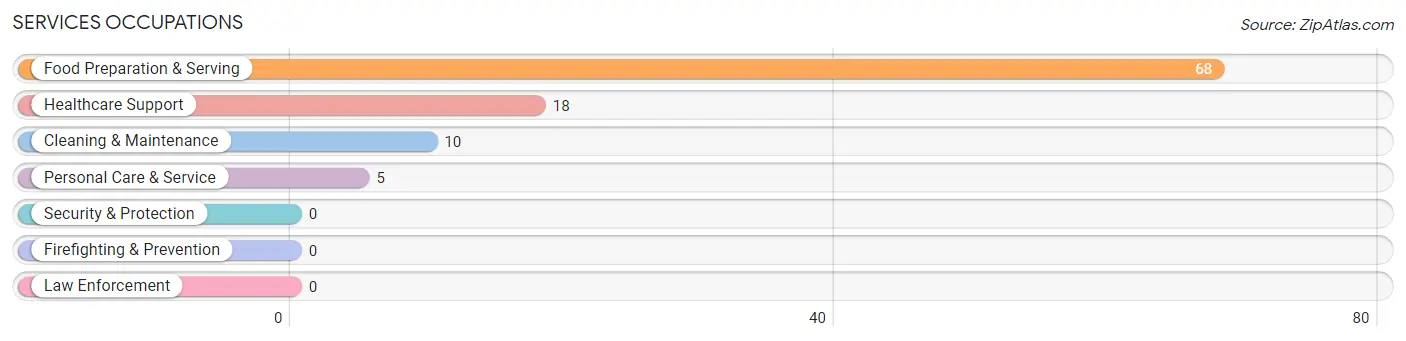
Services Occupations
The most common Services occupations in Langley are Food Preparation & Serving (68 | 16.2%), Healthcare Support (18 | 4.3%), Cleaning & Maintenance (10 | 2.4%), and Personal Care & Service (5 | 1.2%).
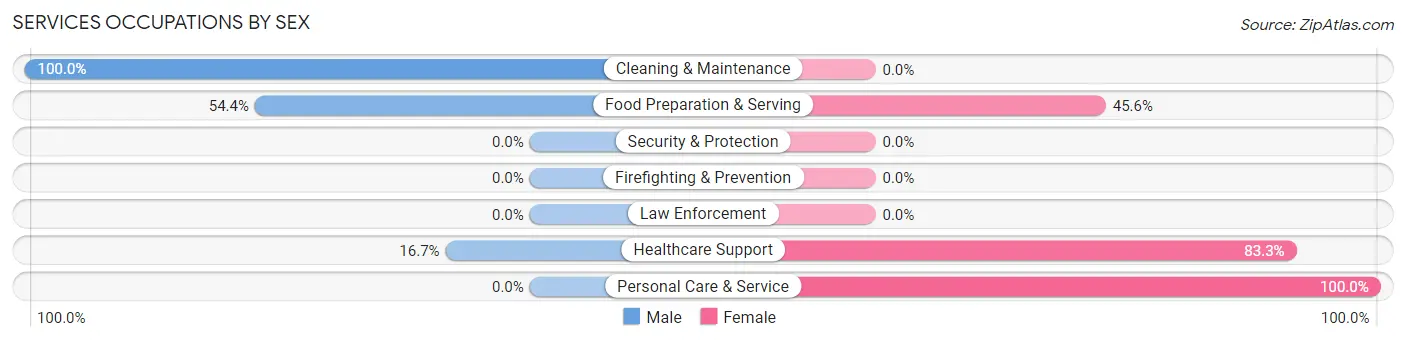
Services Occupations by Sex
Within the Services occupations in Langley, the most male-oriented occupations are Cleaning & Maintenance (100.0%), Food Preparation & Serving (54.4%), and Healthcare Support (16.7%), while the most female-oriented occupations are Personal Care & Service (100.0%), Healthcare Support (83.3%), and Food Preparation & Serving (45.6%).
| Occupation | Male | Female |
| Healthcare Support | 3 (16.7%) | 15 (83.3%) |
| Security & Protection | 0 (0.0%) | 0 (0.0%) |
| Firefighting & Prevention | 0 (0.0%) | 0 (0.0%) |
| Law Enforcement | 0 (0.0%) | 0 (0.0%) |
| Food Preparation & Serving | 37 (54.4%) | 31 (45.6%) |
| Cleaning & Maintenance | 10 (100.0%) | 0 (0.0%) |
| Personal Care & Service | 0 (0.0%) | 5 (100.0%) |
| Total (Category) | 50 (49.5%) | 51 (50.5%) |
| Total (Overall) | 222 (52.9%) | 198 (47.1%) |
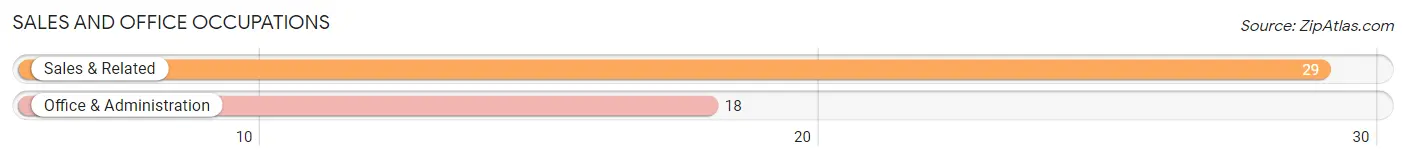
Sales and Office Occupations
The most common Sales and Office occupations in Langley are Sales & Related (29 | 6.9%), and Office & Administration (18 | 4.3%).
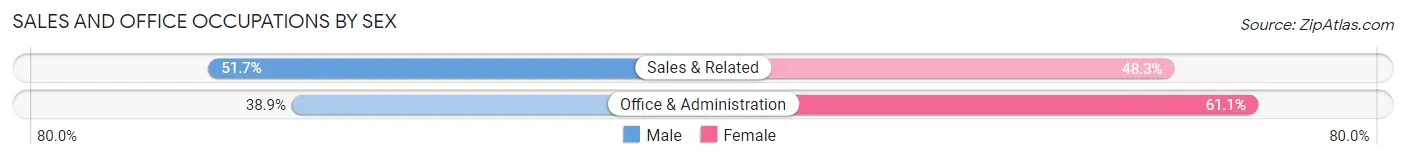
Sales and Office Occupations by Sex
| Occupation | Male | Female |
| Sales & Related | 15 (51.7%) | 14 (48.3%) |
| Office & Administration | 7 (38.9%) | 11 (61.1%) |
| Total (Category) | 22 (46.8%) | 25 (53.2%) |
| Total (Overall) | 222 (52.9%) | 198 (47.1%) |
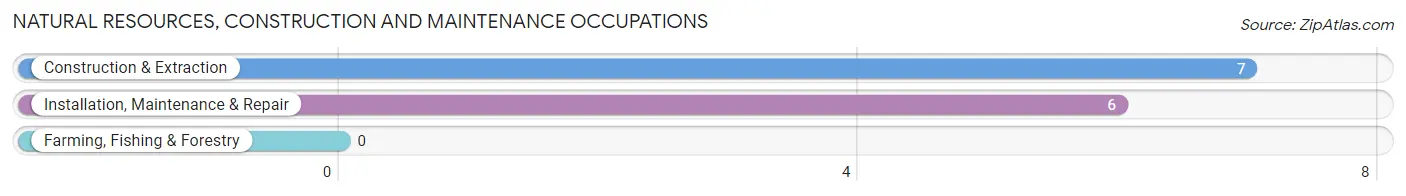
Natural Resources, Construction and Maintenance Occupations
The most common Natural Resources, Construction and Maintenance occupations in Langley are Construction & Extraction (7 | 1.7%), and Installation, Maintenance & Repair (6 | 1.4%).
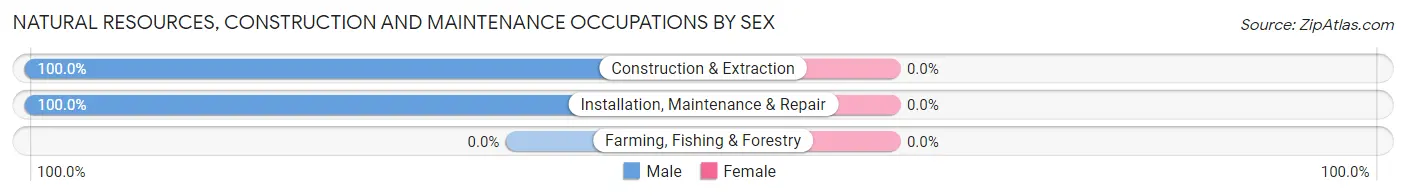
Natural Resources, Construction and Maintenance Occupations by Sex
| Occupation | Male | Female |
| Farming, Fishing & Forestry | 0 (0.0%) | 0 (0.0%) |
| Construction & Extraction | 7 (100.0%) | 0 (0.0%) |
| Installation, Maintenance & Repair | 6 (100.0%) | 0 (0.0%) |
| Total (Category) | 13 (100.0%) | 0 (0.0%) |
| Total (Overall) | 222 (52.9%) | 198 (47.1%) |
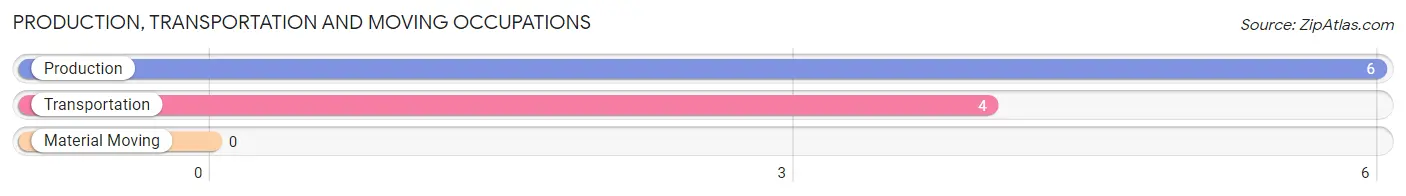
Production, Transportation and Moving Occupations
The most common Production, Transportation and Moving occupations in Langley are Production (6 | 1.4%), and Transportation (4 | 0.9%).
Production, Transportation and Moving Occupations by Sex
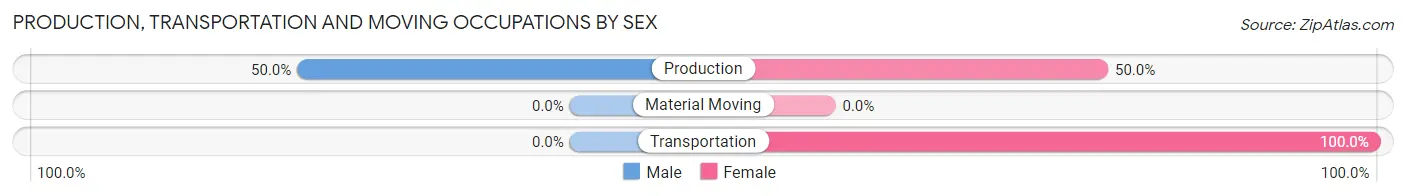
| Occupation | Male | Female |
| Production | 3 (50.0%) | 3 (50.0%) |
| Transportation | 0 (0.0%) | 4 (100.0%) |
| Material Moving | 0 (0.0%) | 0 (0.0%) |
| Total (Category) | 3 (30.0%) | 7 (70.0%) |
| Total (Overall) | 222 (52.9%) | 198 (47.1%) |
Employment Industries by Sex in Langley
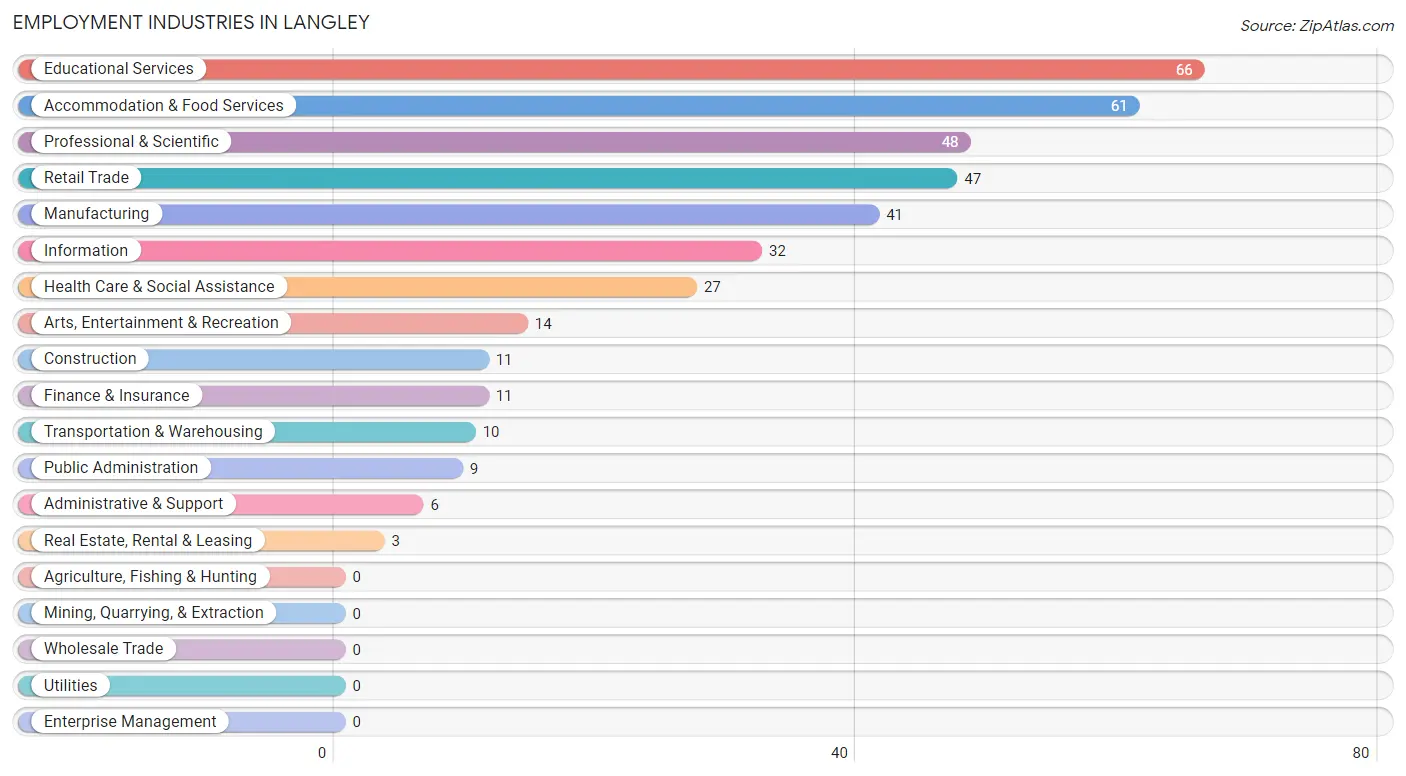
Employment Industries in Langley
The major employment industries in Langley include Educational Services (66 | 15.7%), Accommodation & Food Services (61 | 14.5%), Professional & Scientific (48 | 11.4%), Retail Trade (47 | 11.2%), and Manufacturing (41 | 9.8%).
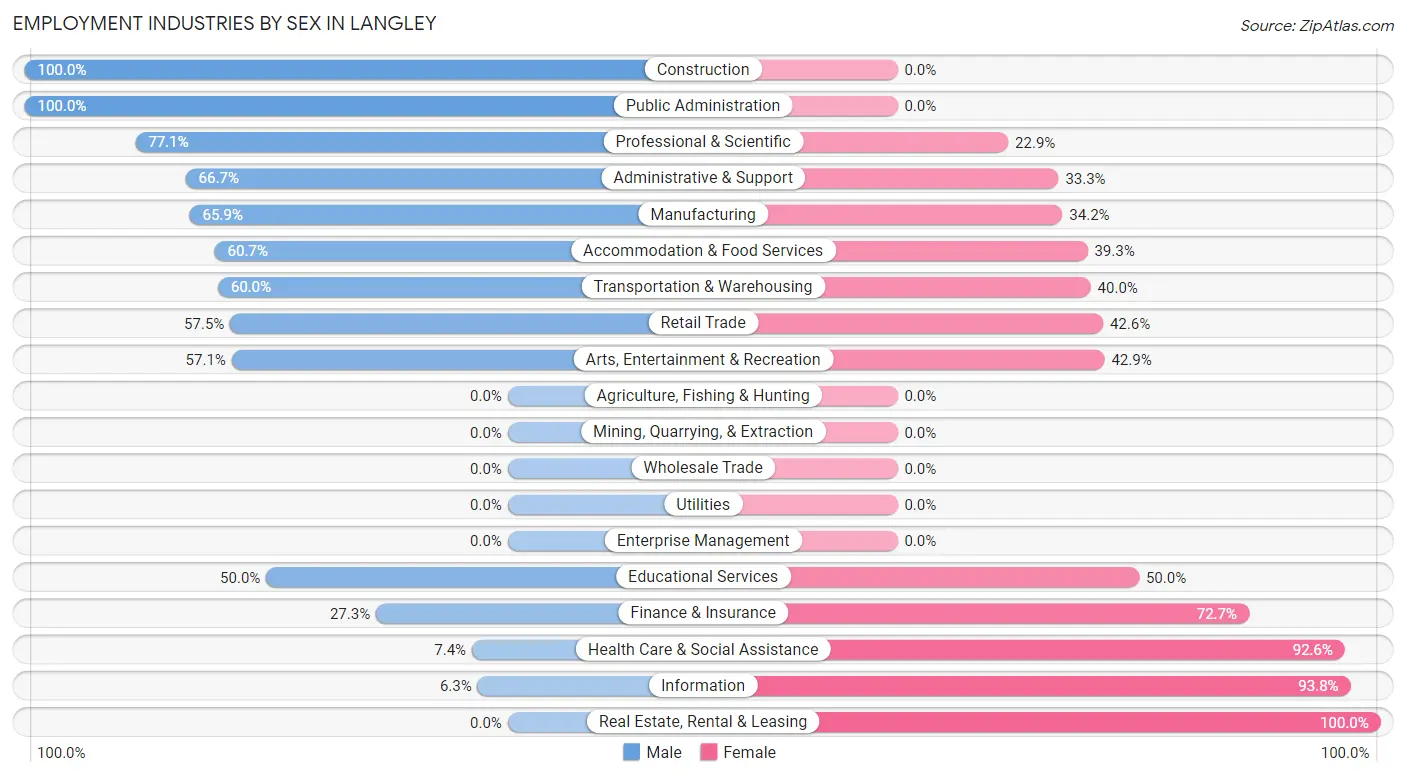
Employment Industries by Sex in Langley
The Langley industries that see more men than women are Construction (100.0%), Public Administration (100.0%), and Professional & Scientific (77.1%), whereas the industries that tend to have a higher number of women are Real Estate, Rental & Leasing (100.0%), Information (93.8%), and Health Care & Social Assistance (92.6%).
| Industry | Male | Female |
| Agriculture, Fishing & Hunting | 0 (0.0%) | 0 (0.0%) |
| Mining, Quarrying, & Extraction | 0 (0.0%) | 0 (0.0%) |
| Construction | 11 (100.0%) | 0 (0.0%) |
| Manufacturing | 27 (65.8%) | 14 (34.2%) |
| Wholesale Trade | 0 (0.0%) | 0 (0.0%) |
| Retail Trade | 27 (57.5%) | 20 (42.5%) |
| Transportation & Warehousing | 6 (60.0%) | 4 (40.0%) |
| Utilities | 0 (0.0%) | 0 (0.0%) |
| Information | 2 (6.2%) | 30 (93.8%) |
| Finance & Insurance | 3 (27.3%) | 8 (72.7%) |
| Real Estate, Rental & Leasing | 0 (0.0%) | 3 (100.0%) |
| Professional & Scientific | 37 (77.1%) | 11 (22.9%) |
| Enterprise Management | 0 (0.0%) | 0 (0.0%) |
| Administrative & Support | 4 (66.7%) | 2 (33.3%) |
| Educational Services | 33 (50.0%) | 33 (50.0%) |
| Health Care & Social Assistance | 2 (7.4%) | 25 (92.6%) |
| Arts, Entertainment & Recreation | 8 (57.1%) | 6 (42.9%) |
| Accommodation & Food Services | 37 (60.7%) | 24 (39.3%) |
| Public Administration | 9 (100.0%) | 0 (0.0%) |
| Total | 222 (52.9%) | 198 (47.1%) |
Education in Langley
School Enrollment in Langley
The most common levels of schooling among the 75 students in Langley are high school (23 | 30.7%), elementary school (14 | 18.7%), and middle school (14 | 18.7%).
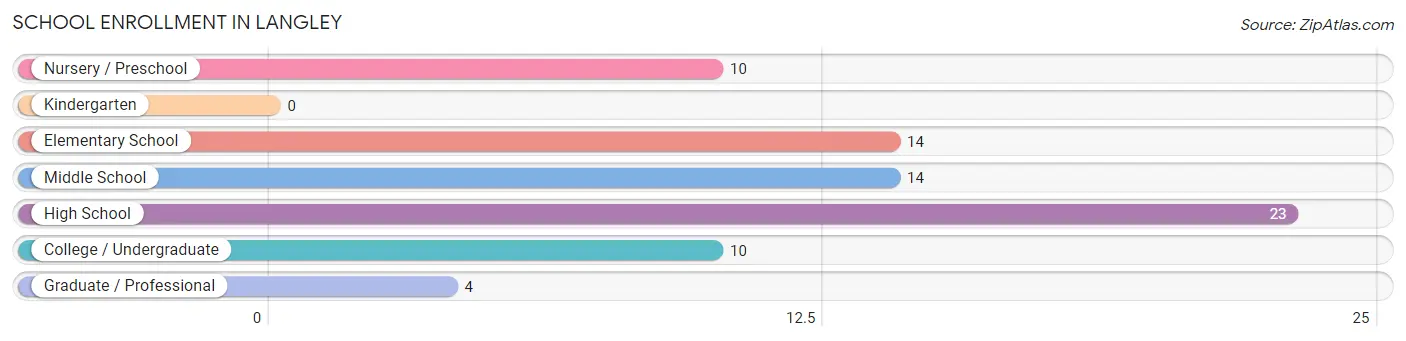
| School Level | # Students | % Students |
| Nursery / Preschool | 10 | 13.3% |
| Kindergarten | 0 | 0.0% |
| Elementary School | 14 | 18.7% |
| Middle School | 14 | 18.7% |
| High School | 23 | 30.7% |
| College / Undergraduate | 10 | 13.3% |
| Graduate / Professional | 4 | 5.3% |
| Total | 75 | 100.0% |
School Enrollment by Age by Funding Source in Langley
Out of a total of 75 students who are enrolled in schools in Langley, 23 (30.7%) attend a private institution, while the remaining 52 (69.3%) are enrolled in public schools. The age group of 5 to 9 year old has the highest likelihood of being enrolled in private schools, with 9 (52.9% in the age bracket) enrolled. Conversely, the age group of 18 to 19 year olds has the lowest likelihood of being enrolled in a private school, with 7 (100.0% in the age bracket) attending a public institution.
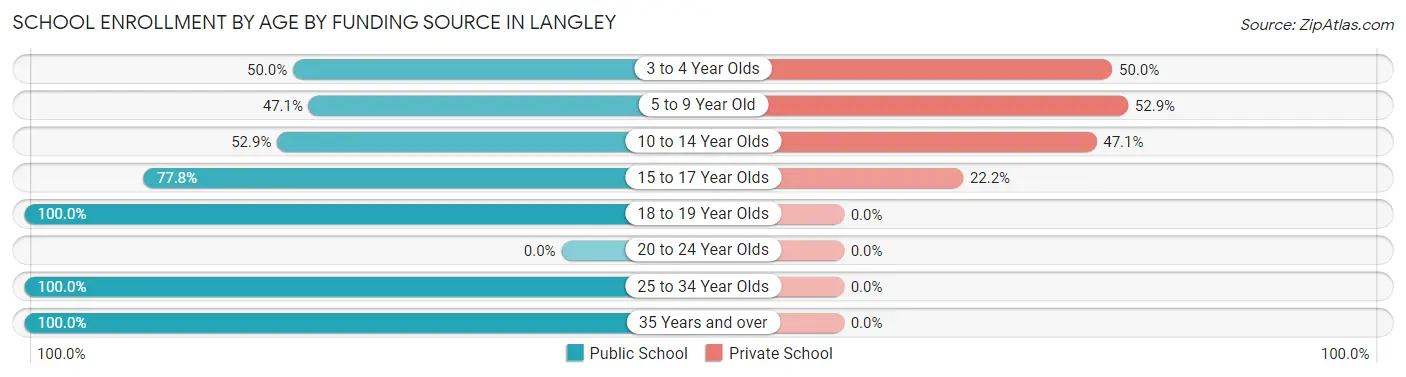
| Age Bracket | Public School | Private School |
| 3 to 4 Year Olds | 2 (50.0%) | 2 (50.0%) |
| 5 to 9 Year Old | 8 (47.1%) | 9 (52.9%) |
| 10 to 14 Year Olds | 9 (52.9%) | 8 (47.1%) |
| 15 to 17 Year Olds | 14 (77.8%) | 4 (22.2%) |
| 18 to 19 Year Olds | 7 (100.0%) | 0 (0.0%) |
| 20 to 24 Year Olds | 0 (0.0%) | 0 (0.0%) |
| 25 to 34 Year Olds | 10 (100.0%) | 0 (0.0%) |
| 35 Years and over | 2 (100.0%) | 0 (0.0%) |
| Total | 52 (69.3%) | 23 (30.7%) |
Educational Attainment by Field of Study in Langley
Social sciences (81 | 14.6%), literature & languages (73 | 13.2%), science & technology (70 | 12.6%), visual & performing arts (62 | 11.2%), and education (61 | 11.0%) are the most common fields of study among 555 individuals in Langley who have obtained a bachelor's degree or higher.
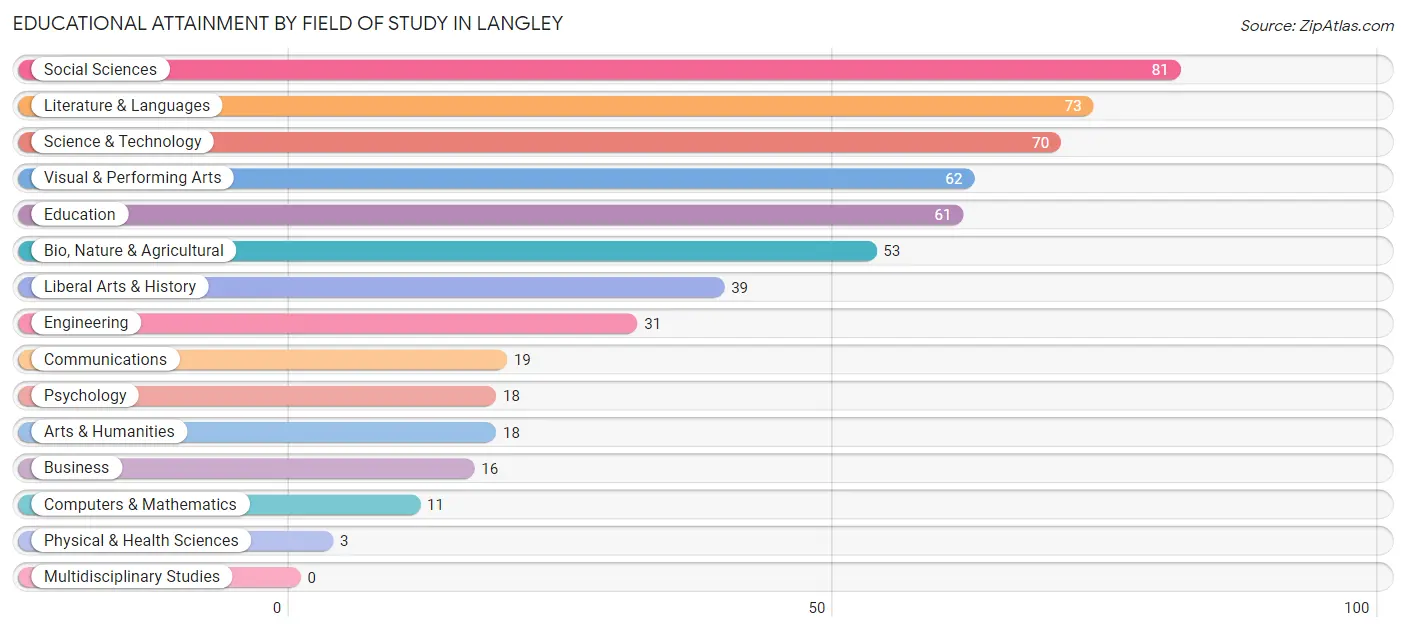
| Field of Study | # Graduates | % Graduates |
| Computers & Mathematics | 11 | 2.0% |
| Bio, Nature & Agricultural | 53 | 9.6% |
| Physical & Health Sciences | 3 | 0.5% |
| Psychology | 18 | 3.2% |
| Social Sciences | 81 | 14.6% |
| Engineering | 31 | 5.6% |
| Multidisciplinary Studies | 0 | 0.0% |
| Science & Technology | 70 | 12.6% |
| Business | 16 | 2.9% |
| Education | 61 | 11.0% |
| Literature & Languages | 73 | 13.2% |
| Liberal Arts & History | 39 | 7.0% |
| Visual & Performing Arts | 62 | 11.2% |
| Communications | 19 | 3.4% |
| Arts & Humanities | 18 | 3.2% |
| Total | 555 | 100.0% |
Transportation & Commute in Langley
Vehicle Availability by Sex in Langley
The most prevalent vehicle ownership categories in Langley are males with 3 vehicles (75, accounting for 34.1%) and females with 3 vehicles (35, making up 37.9%).
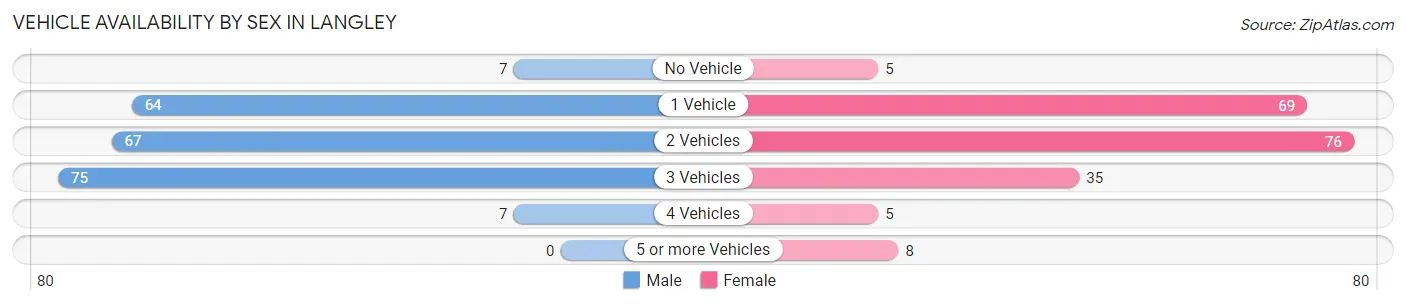
| Vehicles Available | Male | Female |
| No Vehicle | 7 (3.2%) | 5 (2.5%) |
| 1 Vehicle | 64 (29.1%) | 69 (34.8%) |
| 2 Vehicles | 67 (30.4%) | 76 (38.4%) |
| 3 Vehicles | 75 (34.1%) | 35 (17.7%) |
| 4 Vehicles | 7 (3.2%) | 5 (2.5%) |
| 5 or more Vehicles | 0 (0.0%) | 8 (4.0%) |
| Total | 220 (100.0%) | 198 (100.0%) |
Commute Time in Langley
The most frequently occuring commute durations in Langley are 5 to 9 minutes (76 commuters, 23.5%), less than 5 minutes (60 commuters, 18.5%), and 10 to 14 minutes (55 commuters, 17.0%).
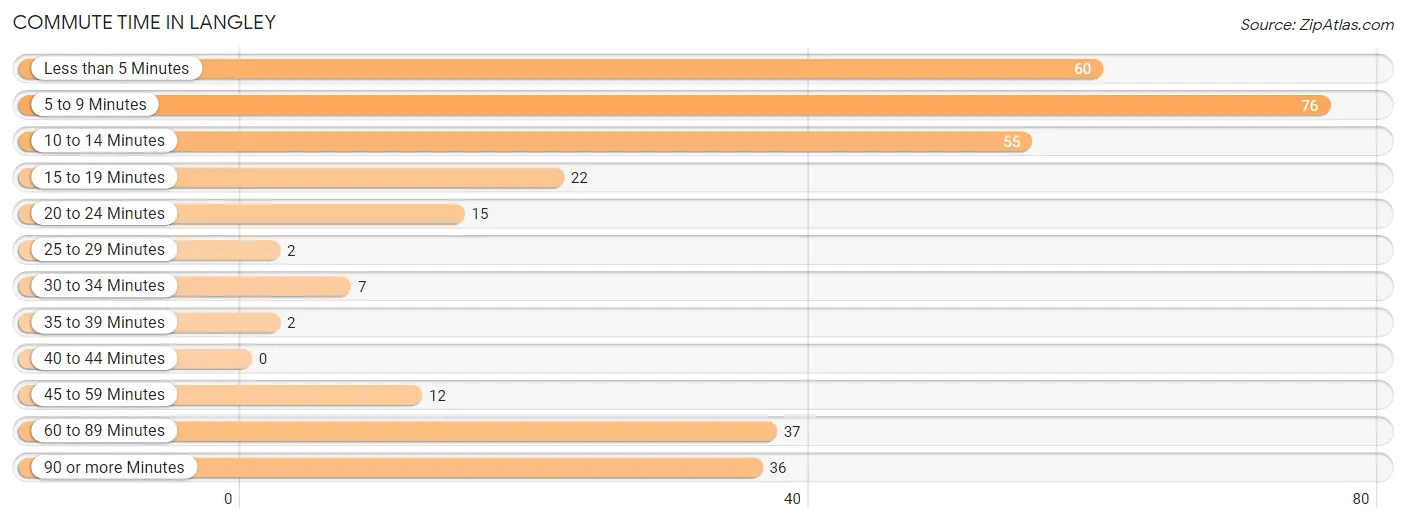
| Commute Time | # Commuters | % Commuters |
| Less than 5 Minutes | 60 | 18.5% |
| 5 to 9 Minutes | 76 | 23.5% |
| 10 to 14 Minutes | 55 | 17.0% |
| 15 to 19 Minutes | 22 | 6.8% |
| 20 to 24 Minutes | 15 | 4.6% |
| 25 to 29 Minutes | 2 | 0.6% |
| 30 to 34 Minutes | 7 | 2.2% |
| 35 to 39 Minutes | 2 | 0.6% |
| 40 to 44 Minutes | 0 | 0.0% |
| 45 to 59 Minutes | 12 | 3.7% |
| 60 to 89 Minutes | 37 | 11.4% |
| 90 or more Minutes | 36 | 11.1% |
Commute Time by Sex in Langley
The most common commute times in Langley are 5 to 9 minutes (50 commuters, 25.4%) for males and 10 to 14 minutes (32 commuters, 25.2%) for females.
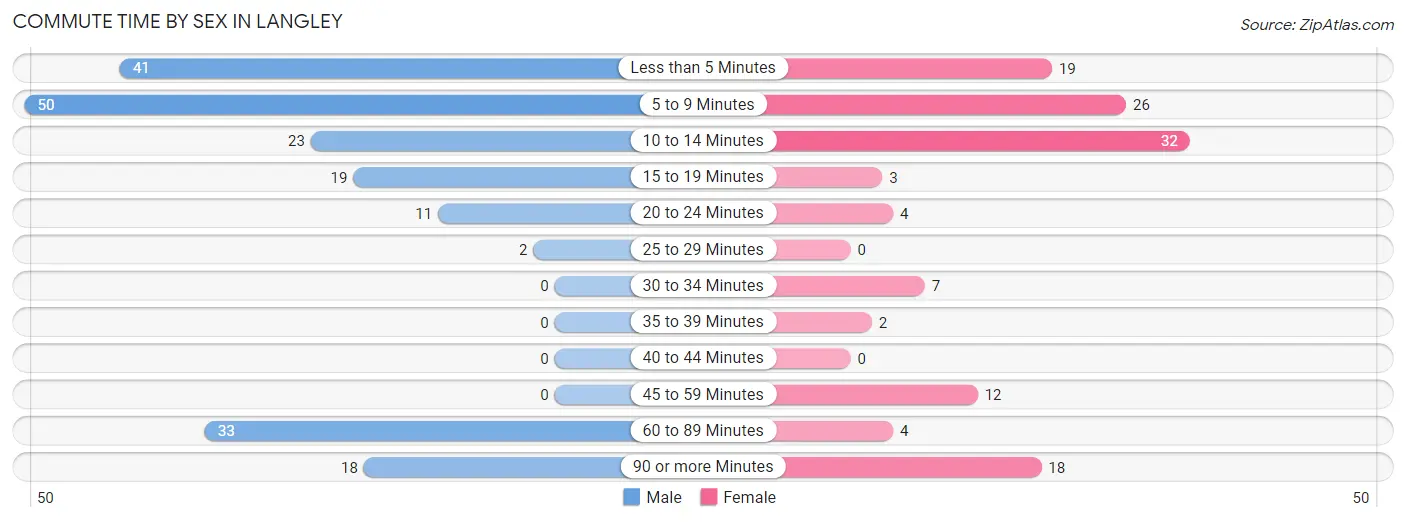
| Commute Time | Male | Female |
| Less than 5 Minutes | 41 (20.8%) | 19 (15.0%) |
| 5 to 9 Minutes | 50 (25.4%) | 26 (20.5%) |
| 10 to 14 Minutes | 23 (11.7%) | 32 (25.2%) |
| 15 to 19 Minutes | 19 (9.6%) | 3 (2.4%) |
| 20 to 24 Minutes | 11 (5.6%) | 4 (3.2%) |
| 25 to 29 Minutes | 2 (1.0%) | 0 (0.0%) |
| 30 to 34 Minutes | 0 (0.0%) | 7 (5.5%) |
| 35 to 39 Minutes | 0 (0.0%) | 2 (1.6%) |
| 40 to 44 Minutes | 0 (0.0%) | 0 (0.0%) |
| 45 to 59 Minutes | 0 (0.0%) | 12 (9.5%) |
| 60 to 89 Minutes | 33 (16.8%) | 4 (3.2%) |
| 90 or more Minutes | 18 (9.1%) | 18 (14.2%) |
Time of Departure to Work by Sex in Langley
The most frequent times of departure to work in Langley are 10:00 AM to 10:59 AM (29, 14.7%) for males and 12:00 PM to 3:59 PM (31, 24.4%) for females.
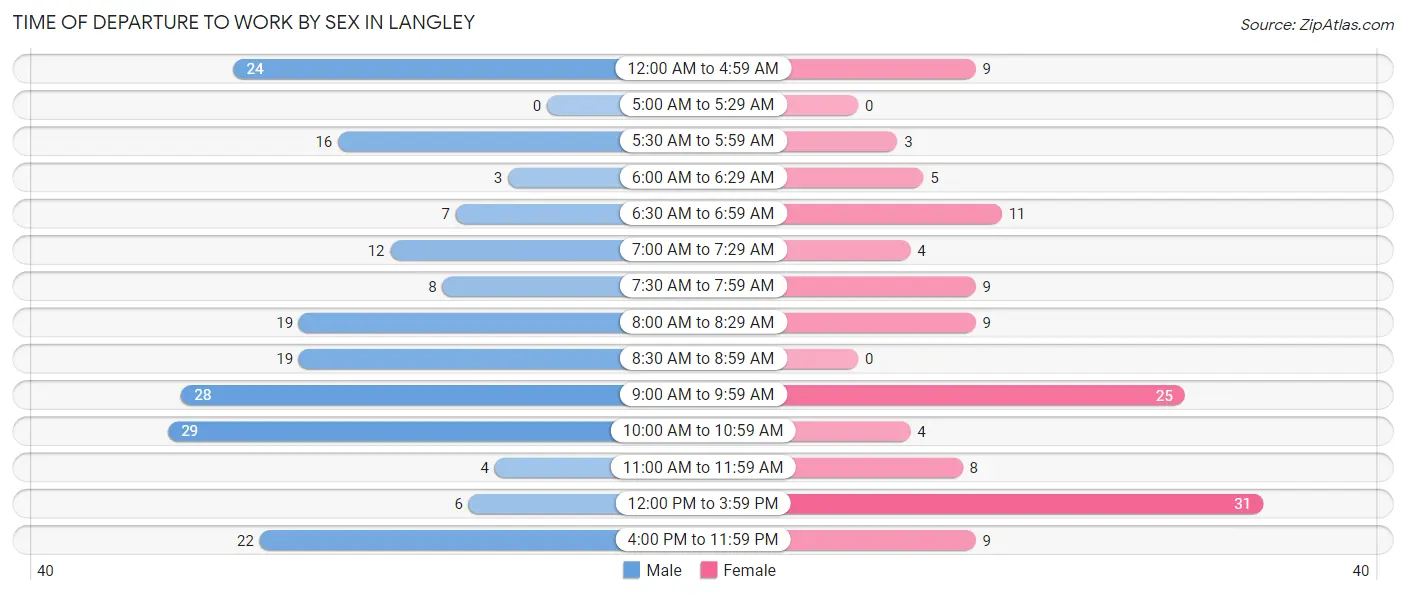
| Time of Departure | Male | Female |
| 12:00 AM to 4:59 AM | 24 (12.2%) | 9 (7.1%) |
| 5:00 AM to 5:29 AM | 0 (0.0%) | 0 (0.0%) |
| 5:30 AM to 5:59 AM | 16 (8.1%) | 3 (2.4%) |
| 6:00 AM to 6:29 AM | 3 (1.5%) | 5 (3.9%) |
| 6:30 AM to 6:59 AM | 7 (3.5%) | 11 (8.7%) |
| 7:00 AM to 7:29 AM | 12 (6.1%) | 4 (3.2%) |
| 7:30 AM to 7:59 AM | 8 (4.1%) | 9 (7.1%) |
| 8:00 AM to 8:29 AM | 19 (9.6%) | 9 (7.1%) |
| 8:30 AM to 8:59 AM | 19 (9.6%) | 0 (0.0%) |
| 9:00 AM to 9:59 AM | 28 (14.2%) | 25 (19.7%) |
| 10:00 AM to 10:59 AM | 29 (14.7%) | 4 (3.2%) |
| 11:00 AM to 11:59 AM | 4 (2.0%) | 8 (6.3%) |
| 12:00 PM to 3:59 PM | 6 (3.0%) | 31 (24.4%) |
| 4:00 PM to 11:59 PM | 22 (11.2%) | 9 (7.1%) |
| Total | 197 (100.0%) | 127 (100.0%) |
Housing Occupancy in Langley
Occupancy by Ownership in Langley
Of the total 597 dwellings in Langley, owner-occupied units account for 399 (66.8%), while renter-occupied units make up 198 (33.2%).
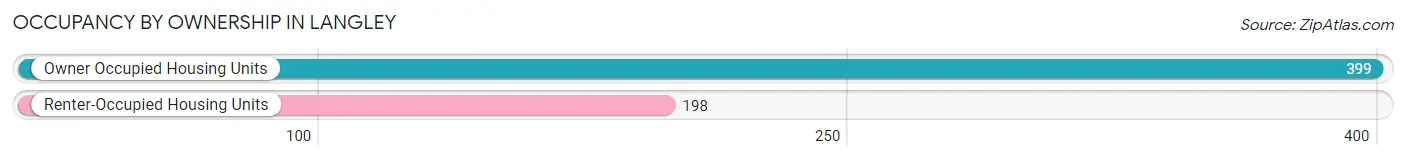
| Occupancy | # Housing Units | % Housing Units |
| Owner Occupied Housing Units | 399 | 66.8% |
| Renter-Occupied Housing Units | 198 | 33.2% |
| Total Occupied Housing Units | 597 | 100.0% |
Occupancy by Household Size in Langley
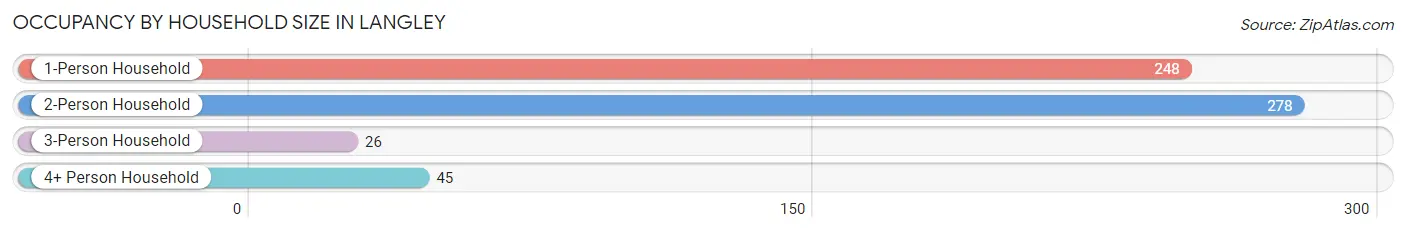
| Household Size | # Housing Units | % Housing Units |
| 1-Person Household | 248 | 41.5% |
| 2-Person Household | 278 | 46.6% |
| 3-Person Household | 26 | 4.4% |
| 4+ Person Household | 45 | 7.5% |
| Total Housing Units | 597 | 100.0% |
Occupancy by Ownership by Household Size in Langley
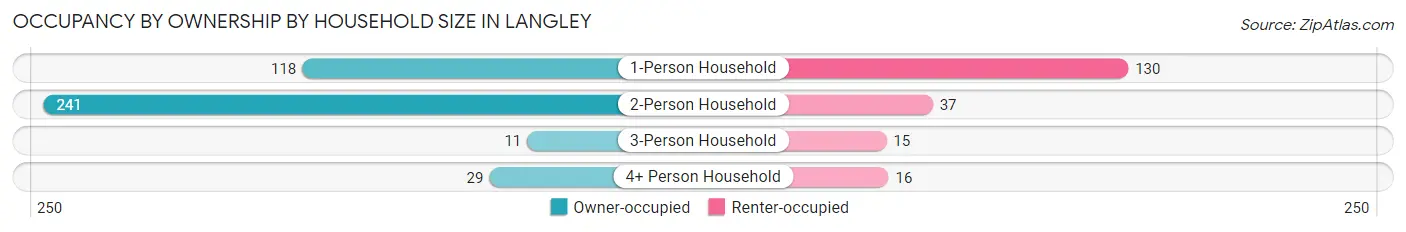
| Household Size | Owner-occupied | Renter-occupied |
| 1-Person Household | 118 (47.6%) | 130 (52.4%) |
| 2-Person Household | 241 (86.7%) | 37 (13.3%) |
| 3-Person Household | 11 (42.3%) | 15 (57.7%) |
| 4+ Person Household | 29 (64.4%) | 16 (35.6%) |
| Total Housing Units | 399 (66.8%) | 198 (33.2%) |
Occupancy by Educational Attainment in Langley
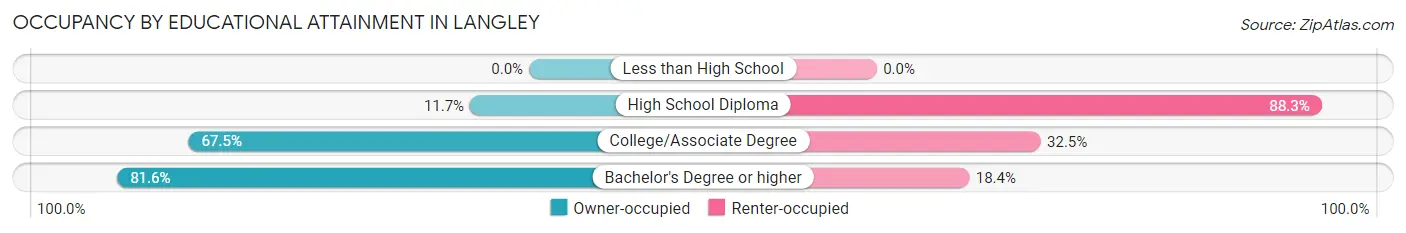
| Household Size | Owner-occupied | Renter-occupied |
| Less than High School | 0 (0.0%) | 0 (0.0%) |
| High School Diploma | 11 (11.7%) | 83 (88.3%) |
| College/Associate Degree | 108 (67.5%) | 52 (32.5%) |
| Bachelor's Degree or higher | 280 (81.6%) | 63 (18.4%) |
Occupancy by Age of Householder in Langley
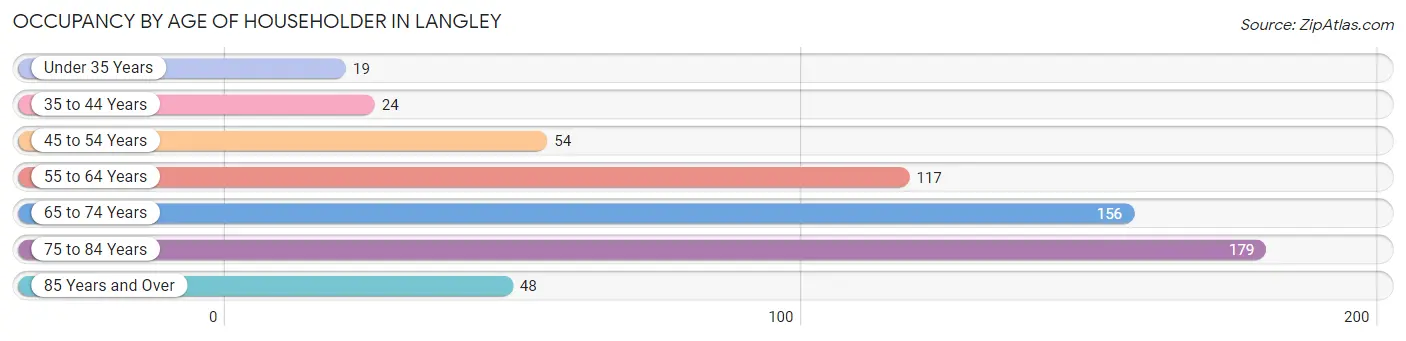
| Age Bracket | # Households | % Households |
| Under 35 Years | 19 | 3.2% |
| 35 to 44 Years | 24 | 4.0% |
| 45 to 54 Years | 54 | 9.0% |
| 55 to 64 Years | 117 | 19.6% |
| 65 to 74 Years | 156 | 26.1% |
| 75 to 84 Years | 179 | 30.0% |
| 85 Years and Over | 48 | 8.0% |
| Total | 597 | 100.0% |
Housing Finances in Langley
Median Income by Occupancy in Langley
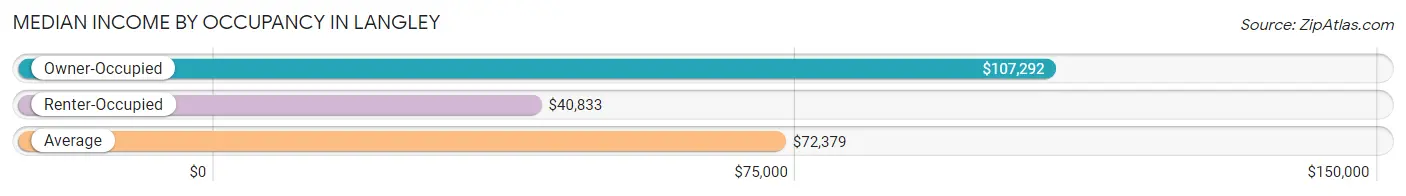
| Occupancy Type | # Households | Median Income |
| Owner-Occupied | 399 (66.8%) | $107,292 |
| Renter-Occupied | 198 (33.2%) | $40,833 |
| Average | 597 (100.0%) | $72,379 |
Occupancy by Householder Income Bracket in Langley
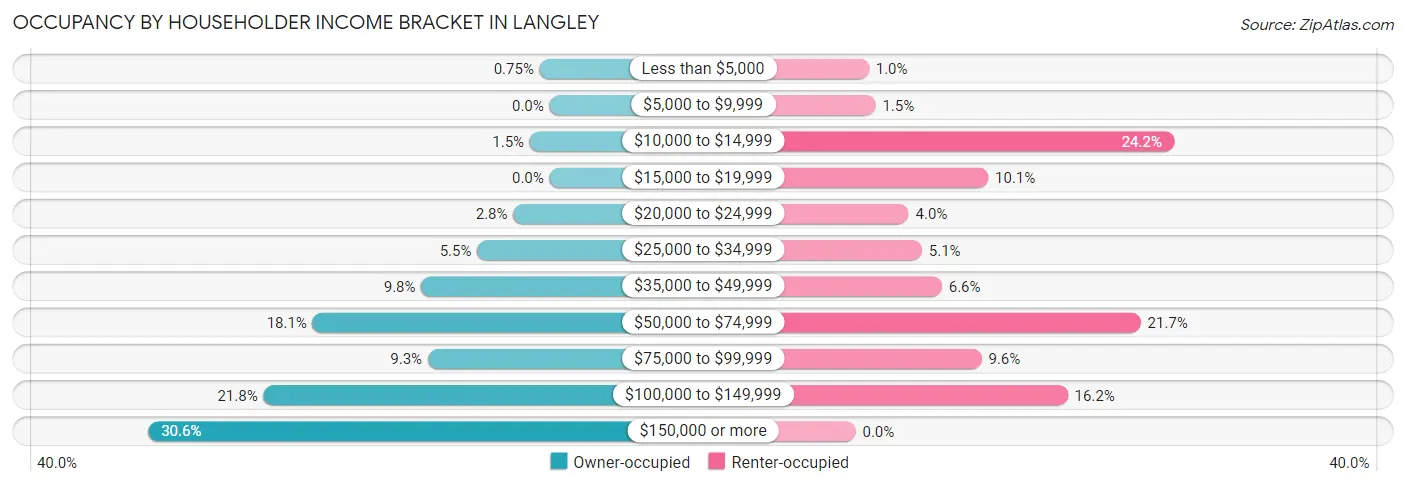
| Income Bracket | Owner-occupied | Renter-occupied |
| Less than $5,000 | 3 (0.7%) | 2 (1.0%) |
| $5,000 to $9,999 | 0 (0.0%) | 3 (1.5%) |
| $10,000 to $14,999 | 6 (1.5%) | 48 (24.2%) |
| $15,000 to $19,999 | 0 (0.0%) | 20 (10.1%) |
| $20,000 to $24,999 | 11 (2.8%) | 8 (4.0%) |
| $25,000 to $34,999 | 22 (5.5%) | 10 (5.1%) |
| $35,000 to $49,999 | 39 (9.8%) | 13 (6.6%) |
| $50,000 to $74,999 | 72 (18.0%) | 43 (21.7%) |
| $75,000 to $99,999 | 37 (9.3%) | 19 (9.6%) |
| $100,000 to $149,999 | 87 (21.8%) | 32 (16.2%) |
| $150,000 or more | 122 (30.6%) | 0 (0.0%) |
| Total | 399 (100.0%) | 198 (100.0%) |
Monthly Housing Cost Tiers in Langley
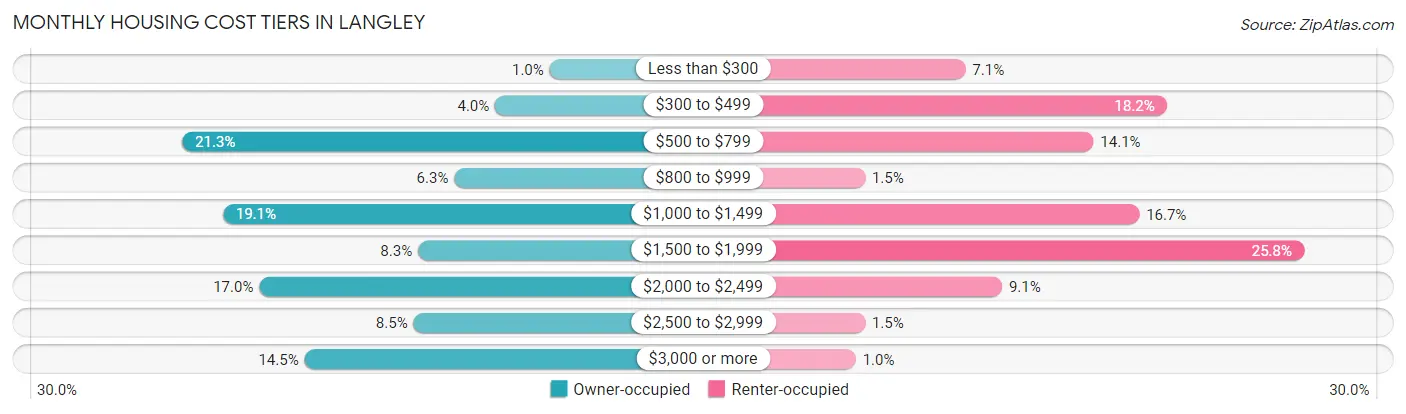
| Monthly Cost | Owner-occupied | Renter-occupied |
| Less than $300 | 4 (1.0%) | 14 (7.1%) |
| $300 to $499 | 16 (4.0%) | 36 (18.2%) |
| $500 to $799 | 85 (21.3%) | 28 (14.1%) |
| $800 to $999 | 25 (6.3%) | 3 (1.5%) |
| $1,000 to $1,499 | 76 (19.1%) | 33 (16.7%) |
| $1,500 to $1,999 | 33 (8.3%) | 51 (25.8%) |
| $2,000 to $2,499 | 68 (17.0%) | 18 (9.1%) |
| $2,500 to $2,999 | 34 (8.5%) | 3 (1.5%) |
| $3,000 or more | 58 (14.5%) | 2 (1.0%) |
| Total | 399 (100.0%) | 198 (100.0%) |
Physical Housing Characteristics in Langley
Housing Structures in Langley
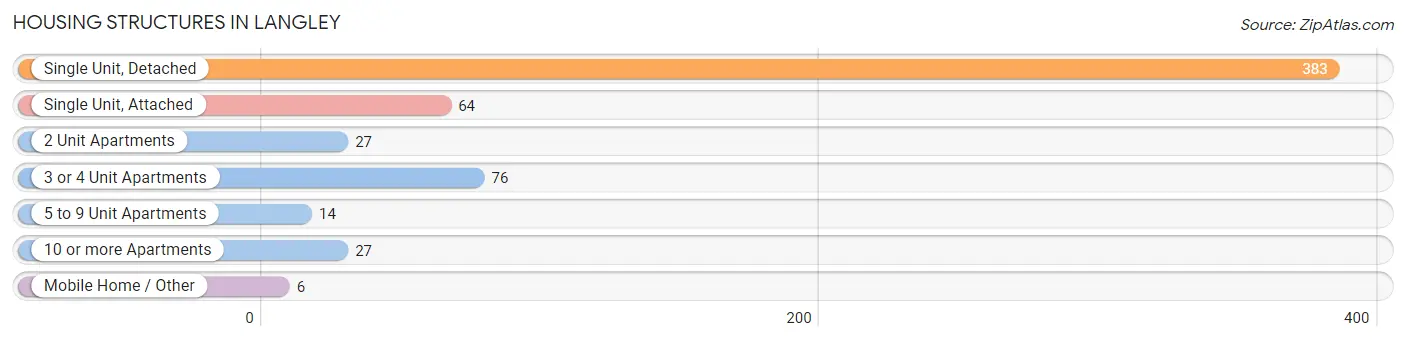
| Structure Type | # Housing Units | % Housing Units |
| Single Unit, Detached | 383 | 64.1% |
| Single Unit, Attached | 64 | 10.7% |
| 2 Unit Apartments | 27 | 4.5% |
| 3 or 4 Unit Apartments | 76 | 12.7% |
| 5 to 9 Unit Apartments | 14 | 2.4% |
| 10 or more Apartments | 27 | 4.5% |
| Mobile Home / Other | 6 | 1.0% |
| Total | 597 | 100.0% |
Housing Structures by Occupancy in Langley
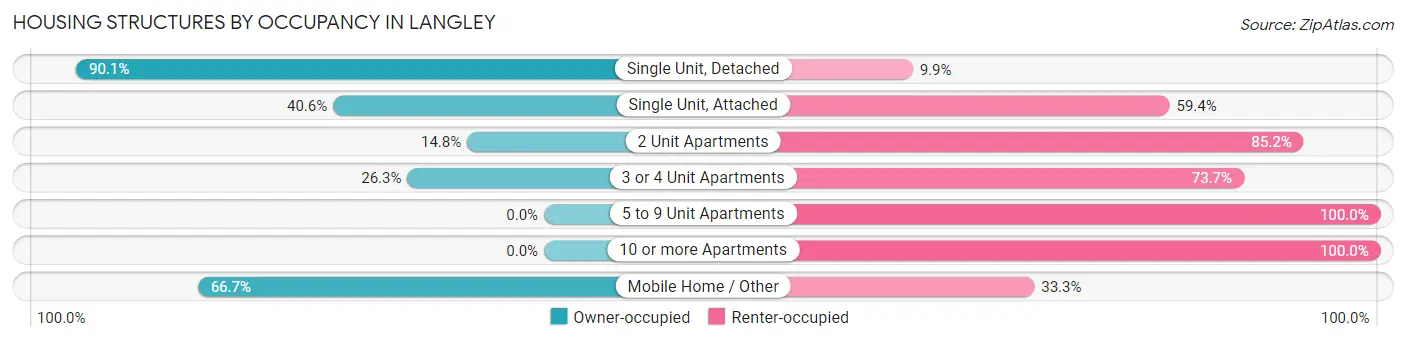
| Structure Type | Owner-occupied | Renter-occupied |
| Single Unit, Detached | 345 (90.1%) | 38 (9.9%) |
| Single Unit, Attached | 26 (40.6%) | 38 (59.4%) |
| 2 Unit Apartments | 4 (14.8%) | 23 (85.2%) |
| 3 or 4 Unit Apartments | 20 (26.3%) | 56 (73.7%) |
| 5 to 9 Unit Apartments | 0 (0.0%) | 14 (100.0%) |
| 10 or more Apartments | 0 (0.0%) | 27 (100.0%) |
| Mobile Home / Other | 4 (66.7%) | 2 (33.3%) |
| Total | 399 (66.8%) | 198 (33.2%) |
Housing Structures by Number of Rooms in Langley
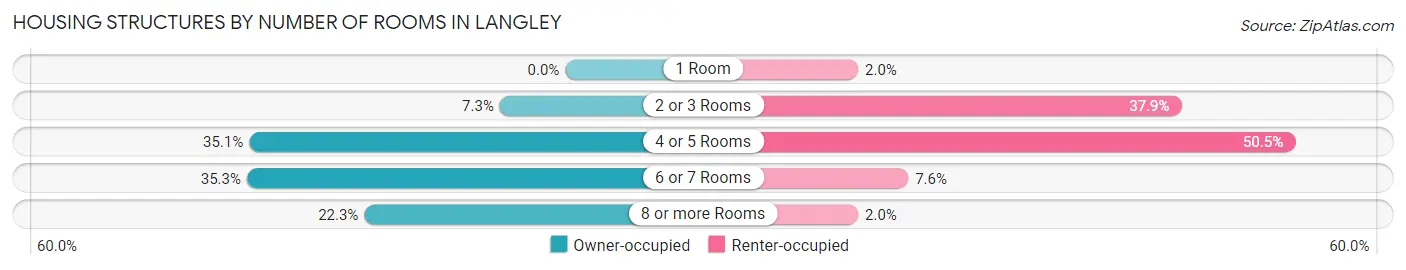
| Number of Rooms | Owner-occupied | Renter-occupied |
| 1 Room | 0 (0.0%) | 4 (2.0%) |
| 2 or 3 Rooms | 29 (7.3%) | 75 (37.9%) |
| 4 or 5 Rooms | 140 (35.1%) | 100 (50.5%) |
| 6 or 7 Rooms | 141 (35.3%) | 15 (7.6%) |
| 8 or more Rooms | 89 (22.3%) | 4 (2.0%) |
| Total | 399 (100.0%) | 198 (100.0%) |
Housing Structure by Heating Type in Langley
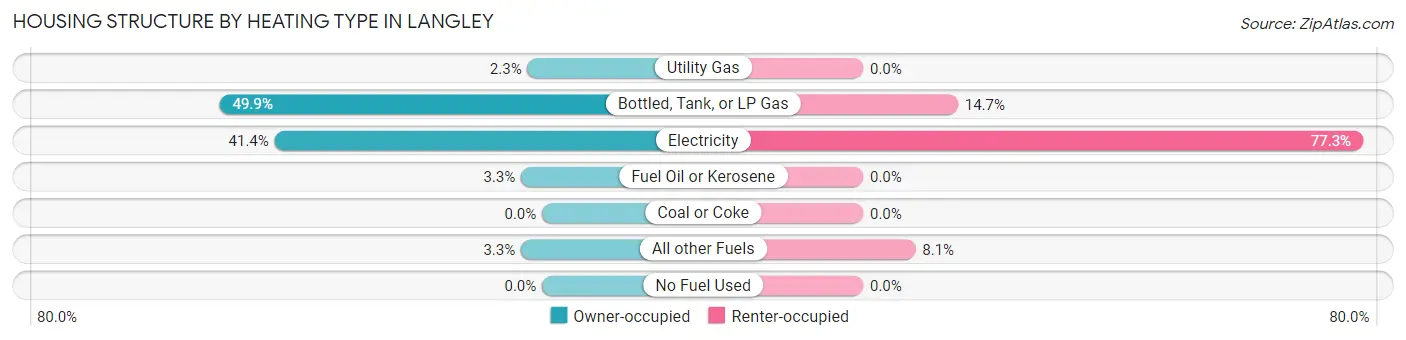
| Heating Type | Owner-occupied | Renter-occupied |
| Utility Gas | 9 (2.3%) | 0 (0.0%) |
| Bottled, Tank, or LP Gas | 199 (49.9%) | 29 (14.6%) |
| Electricity | 165 (41.3%) | 153 (77.3%) |
| Fuel Oil or Kerosene | 13 (3.3%) | 0 (0.0%) |
| Coal or Coke | 0 (0.0%) | 0 (0.0%) |
| All other Fuels | 13 (3.3%) | 16 (8.1%) |
| No Fuel Used | 0 (0.0%) | 0 (0.0%) |
| Total | 399 (100.0%) | 198 (100.0%) |
Household Vehicle Usage in Langley
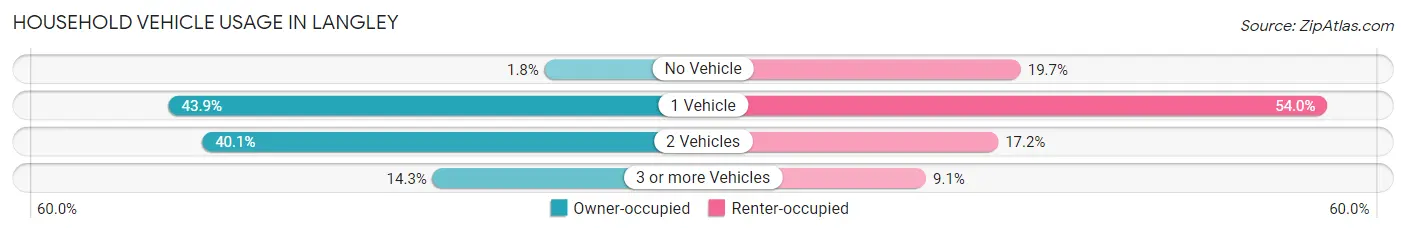
| Vehicles per Household | Owner-occupied | Renter-occupied |
| No Vehicle | 7 (1.8%) | 39 (19.7%) |
| 1 Vehicle | 175 (43.9%) | 107 (54.0%) |
| 2 Vehicles | 160 (40.1%) | 34 (17.2%) |
| 3 or more Vehicles | 57 (14.3%) | 18 (9.1%) |
| Total | 399 (100.0%) | 198 (100.0%) |
Real Estate & Mortgages in Langley
Real Estate and Mortgage Overview in Langley
| Characteristic | Without Mortgage | With Mortgage |
| Housing Units | 179 | 220 |
| Median Property Value | $610,900 | $693,200 |
| Median Household Income | $107,614 | $74 |
| Monthly Housing Costs | $741 | $58 |
| Real Estate Taxes | $3,600 | $2 |
Property Value by Mortgage Status in Langley
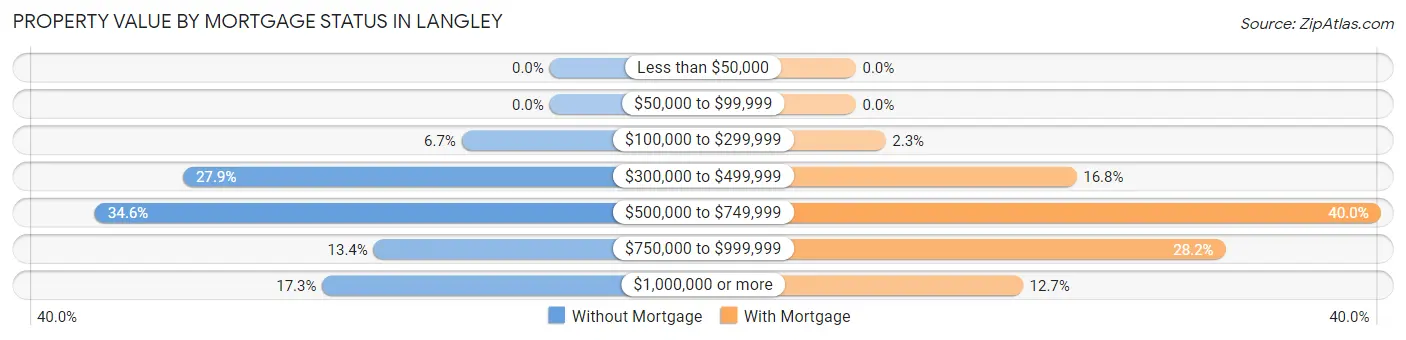
| Property Value | Without Mortgage | With Mortgage |
| Less than $50,000 | 0 (0.0%) | 0 (0.0%) |
| $50,000 to $99,999 | 0 (0.0%) | 0 (0.0%) |
| $100,000 to $299,999 | 12 (6.7%) | 5 (2.3%) |
| $300,000 to $499,999 | 50 (27.9%) | 37 (16.8%) |
| $500,000 to $749,999 | 62 (34.6%) | 88 (40.0%) |
| $750,000 to $999,999 | 24 (13.4%) | 62 (28.2%) |
| $1,000,000 or more | 31 (17.3%) | 28 (12.7%) |
| Total | 179 (100.0%) | 220 (100.0%) |
Household Income by Mortgage Status in Langley
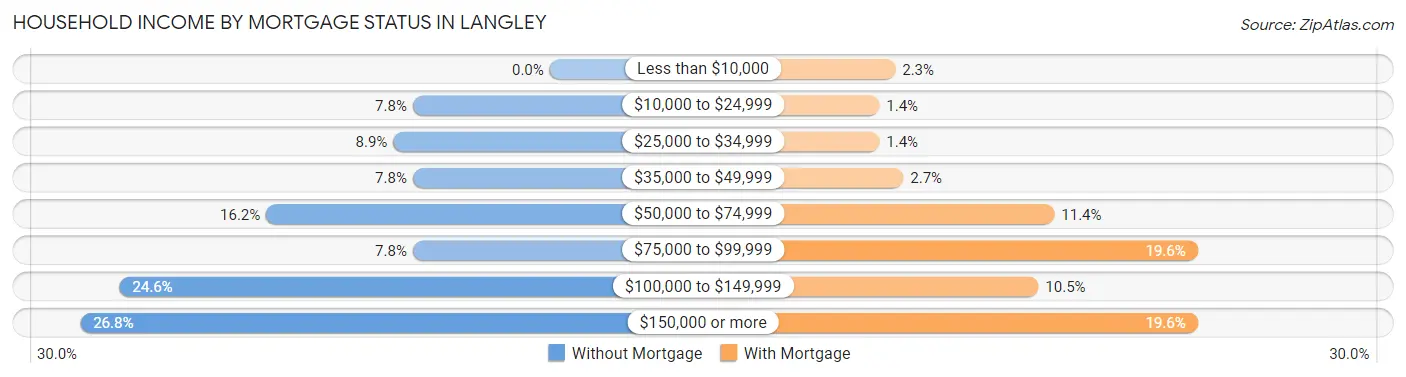
| Household Income | Without Mortgage | With Mortgage |
| Less than $10,000 | 0 (0.0%) | 5 (2.3%) |
| $10,000 to $24,999 | 14 (7.8%) | 3 (1.4%) |
| $25,000 to $34,999 | 16 (8.9%) | 3 (1.4%) |
| $35,000 to $49,999 | 14 (7.8%) | 6 (2.7%) |
| $50,000 to $74,999 | 29 (16.2%) | 25 (11.4%) |
| $75,000 to $99,999 | 14 (7.8%) | 43 (19.6%) |
| $100,000 to $149,999 | 44 (24.6%) | 23 (10.4%) |
| $150,000 or more | 48 (26.8%) | 43 (19.6%) |
| Total | 179 (100.0%) | 220 (100.0%) |
Property Value to Household Income Ratio in Langley
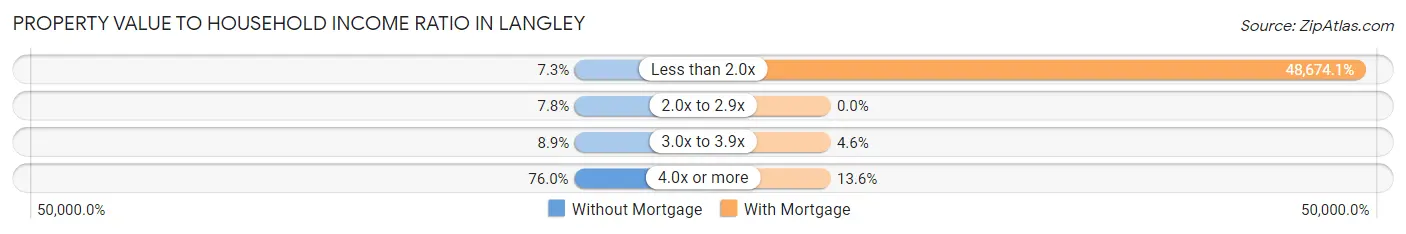
| Value-to-Income Ratio | Without Mortgage | With Mortgage |
| Less than 2.0x | 13 (7.3%) | 107,083 (48,674.1%) |
| 2.0x to 2.9x | 14 (7.8%) | 0 (0.0%) |
| 3.0x to 3.9x | 16 (8.9%) | 10 (4.5%) |
| 4.0x or more | 136 (76.0%) | 30 (13.6%) |
| Total | 179 (100.0%) | 220 (100.0%) |
Real Estate Taxes by Mortgage Status in Langley
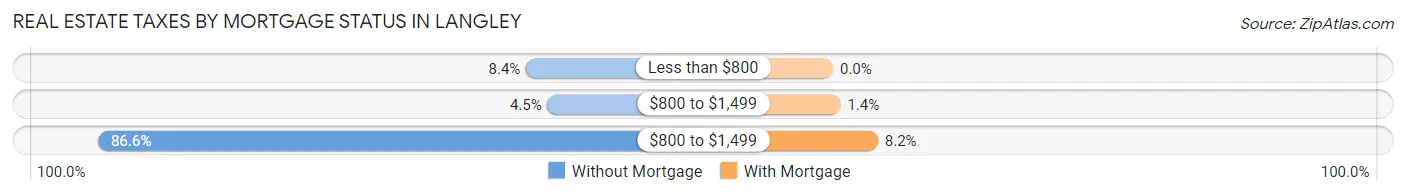
| Property Taxes | Without Mortgage | With Mortgage |
| Less than $800 | 15 (8.4%) | 0 (0.0%) |
| $800 to $1,499 | 8 (4.5%) | 3 (1.4%) |
| $800 to $1,499 | 155 (86.6%) | 18 (8.2%) |
| Total | 179 (100.0%) | 220 (100.0%) |
Health & Disability in Langley
Health Insurance Coverage by Age in Langley
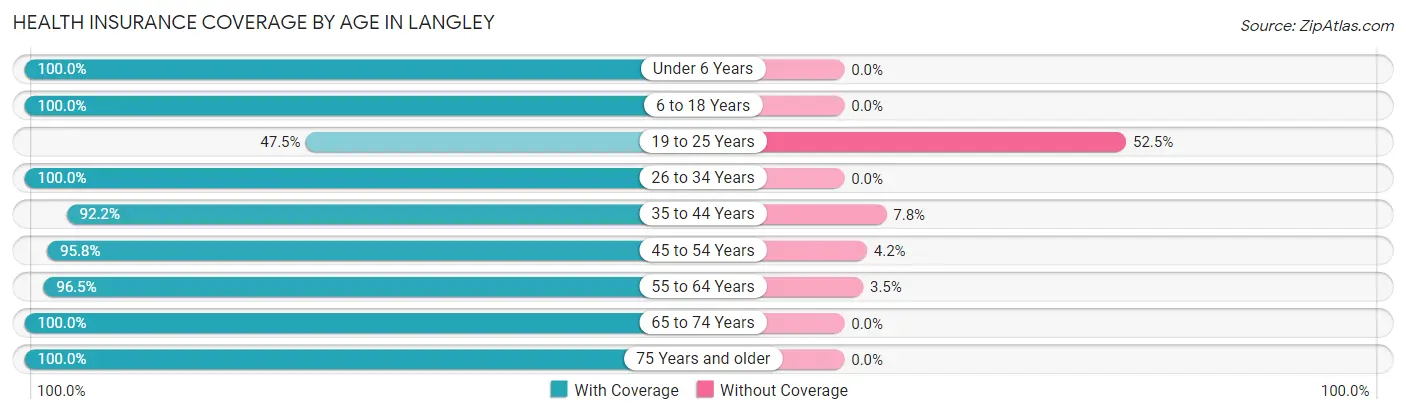
| Age Bracket | With Coverage | Without Coverage |
| Under 6 Years | 23 (100.0%) | 0 (0.0%) |
| 6 to 18 Years | 51 (100.0%) | 0 (0.0%) |
| 19 to 25 Years | 28 (47.5%) | 31 (52.5%) |
| 26 to 34 Years | 28 (100.0%) | 0 (0.0%) |
| 35 to 44 Years | 47 (92.2%) | 4 (7.8%) |
| 45 to 54 Years | 91 (95.8%) | 4 (4.2%) |
| 55 to 64 Years | 193 (96.5%) | 7 (3.5%) |
| 65 to 74 Years | 270 (100.0%) | 0 (0.0%) |
| 75 Years and older | 299 (100.0%) | 0 (0.0%) |
| Total | 1,030 (95.7%) | 46 (4.3%) |
Health Insurance Coverage by Citizenship Status in Langley
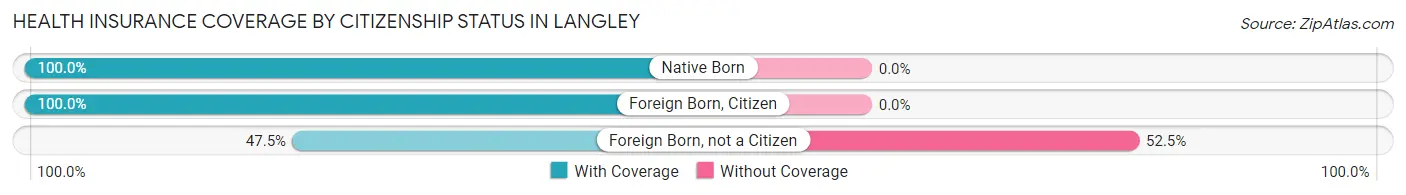
| Citizenship Status | With Coverage | Without Coverage |
| Native Born | 23 (100.0%) | 0 (0.0%) |
| Foreign Born, Citizen | 51 (100.0%) | 0 (0.0%) |
| Foreign Born, not a Citizen | 28 (47.5%) | 31 (52.5%) |
Health Insurance Coverage by Household Income in Langley
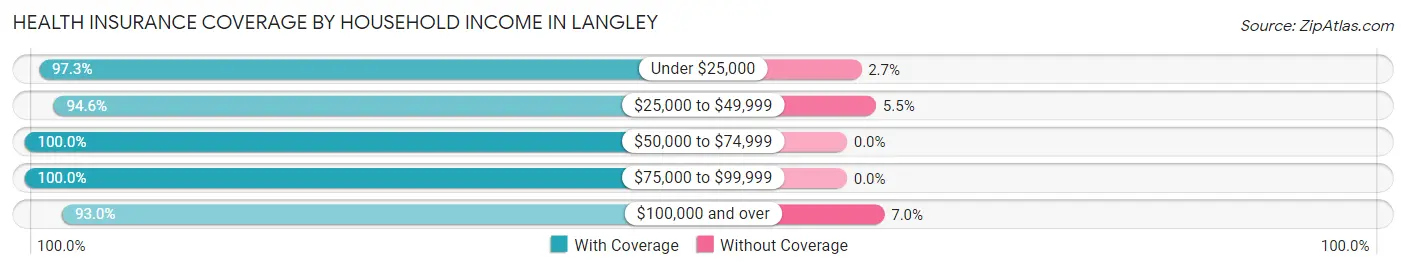
| Household Income | With Coverage | Without Coverage |
| Under $25,000 | 108 (97.3%) | 3 (2.7%) |
| $25,000 to $49,999 | 104 (94.6%) | 6 (5.4%) |
| $50,000 to $74,999 | 185 (100.0%) | 0 (0.0%) |
| $75,000 to $99,999 | 140 (100.0%) | 0 (0.0%) |
| $100,000 and over | 490 (93.0%) | 37 (7.0%) |
Public vs Private Health Insurance Coverage by Age in Langley
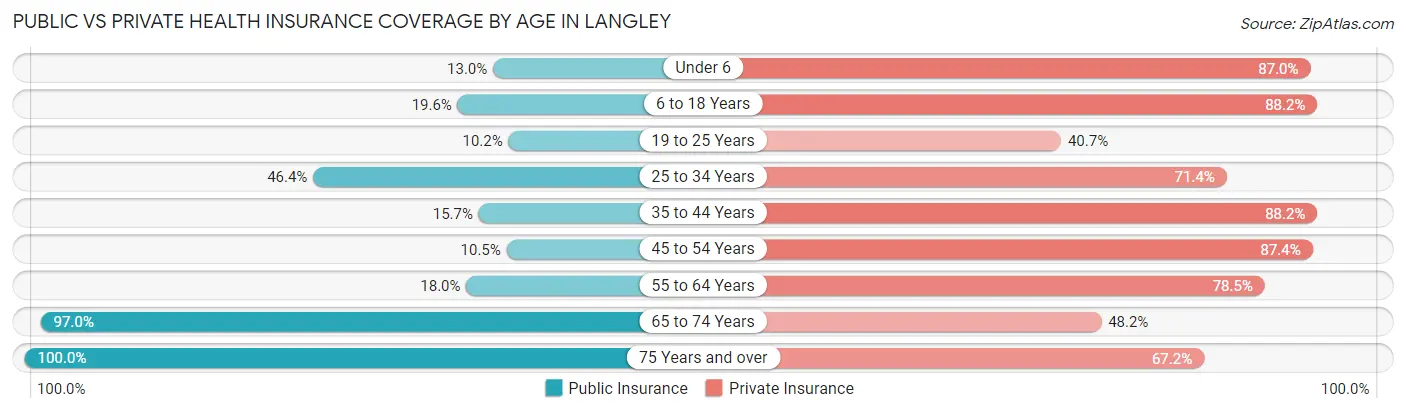
| Age Bracket | Public Insurance | Private Insurance |
| Under 6 | 3 (13.0%) | 20 (87.0%) |
| 6 to 18 Years | 10 (19.6%) | 45 (88.2%) |
| 19 to 25 Years | 6 (10.2%) | 24 (40.7%) |
| 25 to 34 Years | 13 (46.4%) | 20 (71.4%) |
| 35 to 44 Years | 8 (15.7%) | 45 (88.2%) |
| 45 to 54 Years | 10 (10.5%) | 83 (87.4%) |
| 55 to 64 Years | 36 (18.0%) | 157 (78.5%) |
| 65 to 74 Years | 262 (97.0%) | 130 (48.1%) |
| 75 Years and over | 299 (100.0%) | 201 (67.2%) |
| Total | 647 (60.1%) | 725 (67.4%) |
Disability Status by Sex by Age in Langley
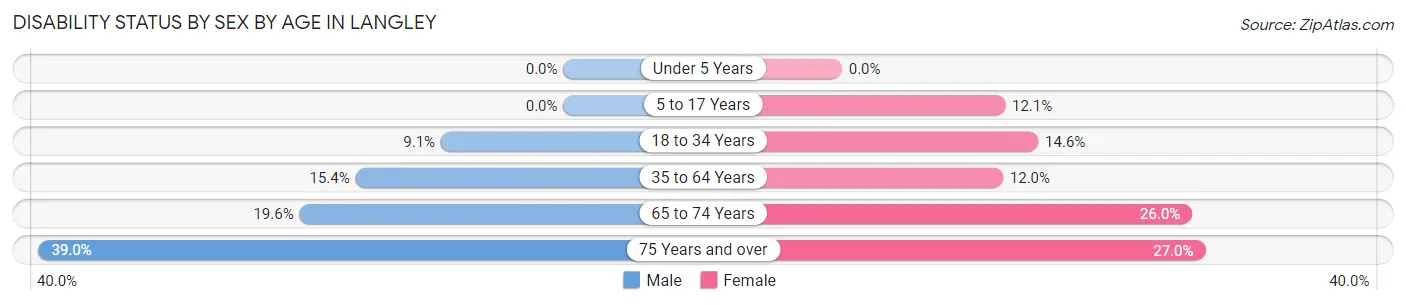
| Age Bracket | Male | Female |
| Under 5 Years | 0 (0.0%) | 0 (0.0%) |
| 5 to 17 Years | 0 (0.0%) | 4 (12.1%) |
| 18 to 34 Years | 4 (9.1%) | 7 (14.6%) |
| 35 to 64 Years | 25 (15.4%) | 22 (12.0%) |
| 65 to 74 Years | 19 (19.6%) | 45 (26.0%) |
| 75 Years and over | 53 (39.0%) | 44 (27.0%) |
Disability Class by Sex by Age in Langley
Disability Class: Hearing Difficulty
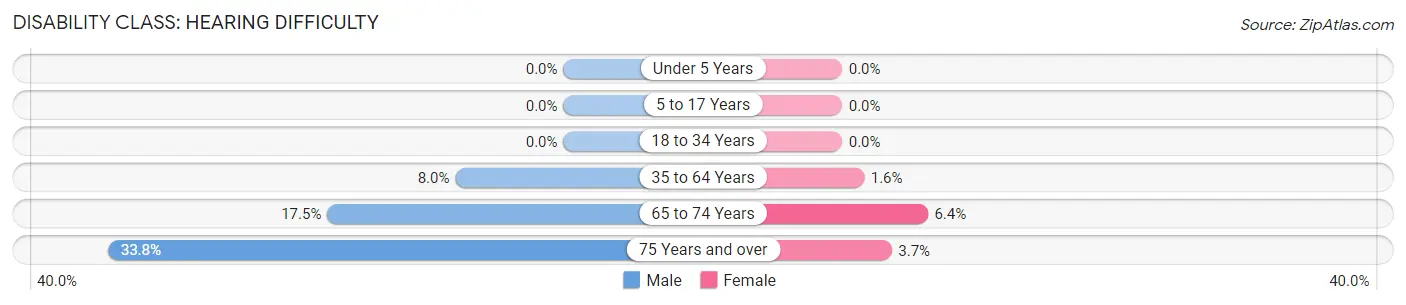
| Age Bracket | Male | Female |
| Under 5 Years | 0 (0.0%) | 0 (0.0%) |
| 5 to 17 Years | 0 (0.0%) | 0 (0.0%) |
| 18 to 34 Years | 0 (0.0%) | 0 (0.0%) |
| 35 to 64 Years | 13 (8.0%) | 3 (1.6%) |
| 65 to 74 Years | 17 (17.5%) | 11 (6.4%) |
| 75 Years and over | 46 (33.8%) | 6 (3.7%) |
Disability Class: Vision Difficulty
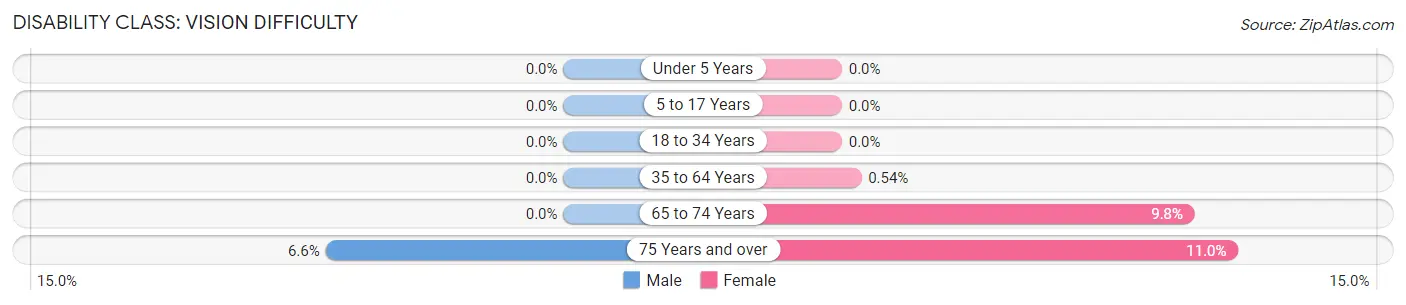
| Age Bracket | Male | Female |
| Under 5 Years | 0 (0.0%) | 0 (0.0%) |
| 5 to 17 Years | 0 (0.0%) | 0 (0.0%) |
| 18 to 34 Years | 0 (0.0%) | 0 (0.0%) |
| 35 to 64 Years | 0 (0.0%) | 1 (0.5%) |
| 65 to 74 Years | 0 (0.0%) | 17 (9.8%) |
| 75 Years and over | 9 (6.6%) | 18 (11.0%) |
Disability Class: Cognitive Difficulty
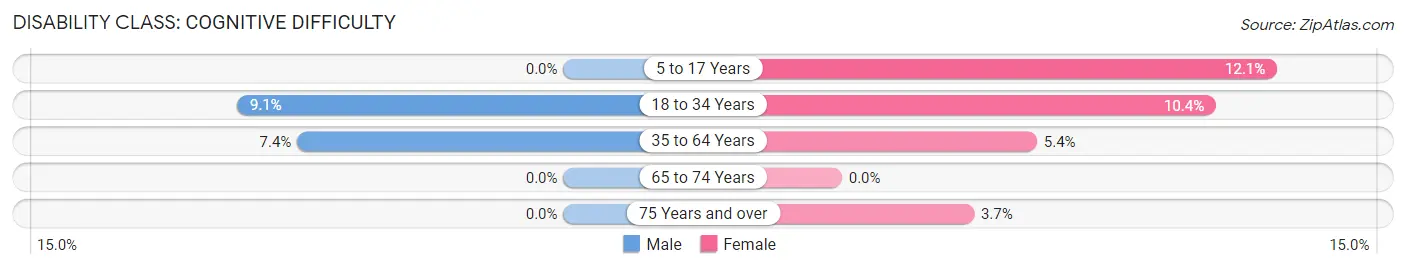
| Age Bracket | Male | Female |
| 5 to 17 Years | 0 (0.0%) | 4 (12.1%) |
| 18 to 34 Years | 4 (9.1%) | 5 (10.4%) |
| 35 to 64 Years | 12 (7.4%) | 10 (5.4%) |
| 65 to 74 Years | 0 (0.0%) | 0 (0.0%) |
| 75 Years and over | 0 (0.0%) | 6 (3.7%) |
Disability Class: Ambulatory Difficulty
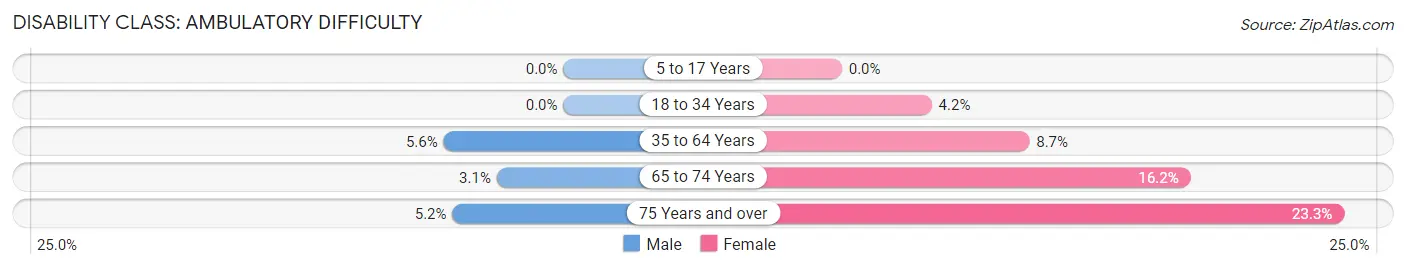
| Age Bracket | Male | Female |
| 5 to 17 Years | 0 (0.0%) | 0 (0.0%) |
| 18 to 34 Years | 0 (0.0%) | 2 (4.2%) |
| 35 to 64 Years | 9 (5.6%) | 16 (8.7%) |
| 65 to 74 Years | 3 (3.1%) | 28 (16.2%) |
| 75 Years and over | 7 (5.1%) | 38 (23.3%) |
Disability Class: Self-Care Difficulty
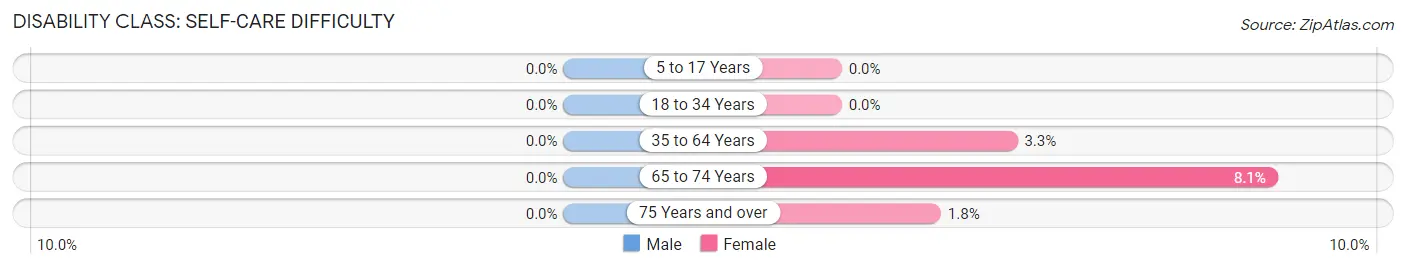
| Age Bracket | Male | Female |
| 5 to 17 Years | 0 (0.0%) | 0 (0.0%) |
| 18 to 34 Years | 0 (0.0%) | 0 (0.0%) |
| 35 to 64 Years | 0 (0.0%) | 6 (3.3%) |
| 65 to 74 Years | 0 (0.0%) | 14 (8.1%) |
| 75 Years and over | 0 (0.0%) | 3 (1.8%) |
Technology Access in Langley
Computing Device Access in Langley
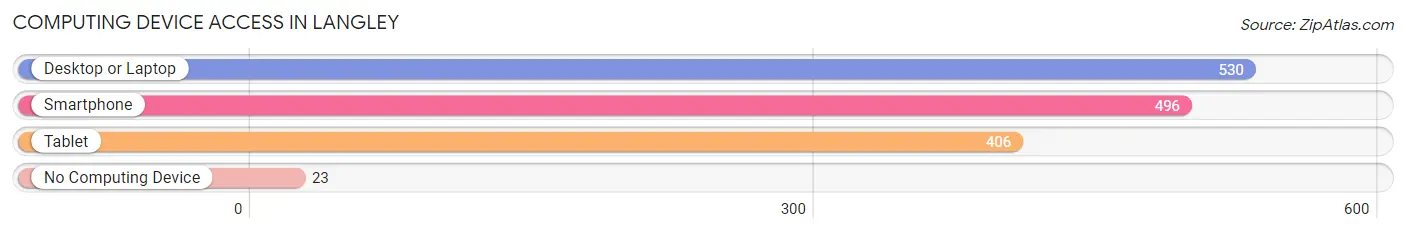
| Device Type | # Households | % Households |
| Desktop or Laptop | 530 | 88.8% |
| Smartphone | 496 | 83.1% |
| Tablet | 406 | 68.0% |
| No Computing Device | 23 | 3.8% |
| Total | 597 | 100.0% |
Internet Access in Langley
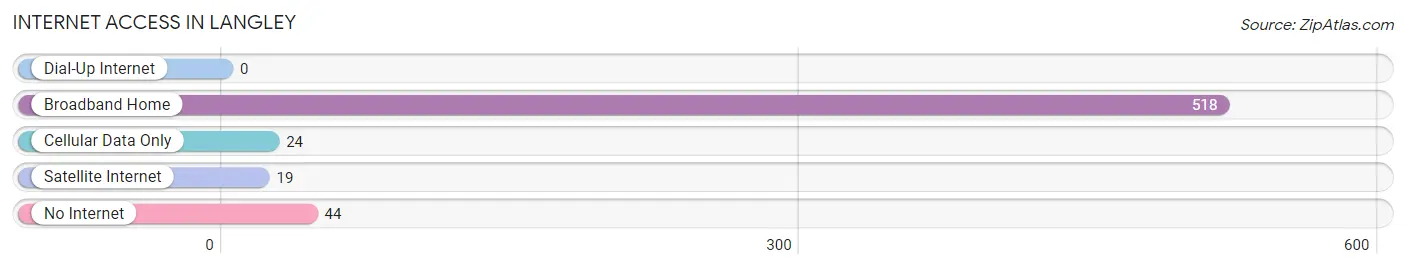
| Internet Type | # Households | % Households |
| Dial-Up Internet | 0 | 0.0% |
| Broadband Home | 518 | 86.8% |
| Cellular Data Only | 24 | 4.0% |
| Satellite Internet | 19 | 3.2% |
| No Internet | 44 | 7.4% |
| Total | 597 | 100.0% |
Langley Summary
Langley is a small city located on the south end of Whidbey Island in Island County, Washington. It is situated on the east side of Saratoga Passage, a narrow strait that separates Whidbey Island from the mainland. Langley is the only incorporated city on the island and is the county seat of Island County. The city has a population of 1,938 as of the 2010 census.
History
The area that is now Langley was first inhabited by the Snohomish and Skagit tribes. The first European settlers arrived in the area in the late 1800s, and the town was officially incorporated in 1913. The city was named after the Langley family, who were among the first settlers in the area.
The city was originally a logging and fishing community, and the economy was largely based on these industries. In the early 1900s, the city began to develop a tourism industry, and it became a popular destination for visitors from Seattle and other nearby cities.
Geography
Langley is located on the south end of Whidbey Island, which is located in Island County, Washington. The city is situated on the east side of Saratoga Passage, a narrow strait that separates Whidbey Island from the mainland. The city is bordered by the cities of Clinton to the north and Freeland to the south.
The city has a total area of 1.3 square miles, all of which is land. The city is located at an elevation of approximately 20 feet above sea level.
Economy
The economy of Langley is largely based on tourism and retail. The city is home to a variety of shops, restaurants, and other businesses that cater to visitors. The city also has a vibrant arts and culture scene, with several galleries, theaters, and other venues.
The city is also home to a number of small businesses, including a winery, a brewery, and a distillery. The city is also home to a number of marinas, which provide access to the waters of Saratoga Passage.
Demographics
As of the 2010 census, the population of Langley was 1,938. The racial makeup of the city was 91.2% White, 0.7% African American, 0.7% Native American, 2.2% Asian, 0.2% Pacific Islander, 1.3% from other races, and 3.7% from two or more races. Hispanic or Latino of any race were 4.2% of the population.
The median income for a household in the city was $50,938, and the median income for a family was $60,000. The per capita income for the city was $27,945. About 8.2% of families and 11.2% of the population were below the poverty line, including 16.2% of those under age 18 and 5.2% of those age 65 or over.
Common Questions
What is Per Capita Income in Langley?
Per Capita income in Langley is $56,083.
What is the Median Family Income in Langley?
Median Family Income in Langley is $110,050.
What is the Median Household income in Langley?
Median Household Income in Langley is $72,379.
What is Income or Wage Gap in Langley?
Income or Wage Gap in Langley is 24.9%.
Women in Langley earn 75.1 cents for every dollar earned by a man.
What is Inequality or Gini Index in Langley?
Inequality or Gini Index in Langley is 0.43.
What is the Total Population of Langley?
Total Population of Langley is 1,076.
What is the Total Male Population of Langley?
Total Male Population of Langley is 465.
What is the Total Female Population of Langley?
Total Female Population of Langley is 611.
What is the Ratio of Males per 100 Females in Langley?
There are 76.10 Males per 100 Females in Langley.
What is the Ratio of Females per 100 Males in Langley?
There are 131.40 Females per 100 Males in Langley.
What is the Median Population Age in Langley?
Median Population Age in Langley is 66.4 Years.
What is the Average Family Size in Langley
Average Family Size in Langley is 2.3 People.
What is the Average Household Size in Langley
Average Household Size in Langley is 1.8 People.
How Large is the Labor Force in Langley?
There are 432 People in the Labor Forcein in Langley.
What is the Percentage of People in the Labor Force in Langley?
42.6% of People are in the Labor Force in Langley.
What is the Unemployment Rate in Langley?
Unemployment Rate in Langley is 2.8%.