Burlington, WA Map & Demographics
Burlington Map
Burlington Overview
$34,942
PER CAPITA INCOME
$90,900
AVG FAMILY INCOME
$68,737
AVG HOUSEHOLD INCOME
14.9%
WAGE / INCOME GAP [ % ]
85.1¢/ $1
WAGE / INCOME GAP [ $ ]
0.40
INEQUALITY / GINI INDEX
9,361
TOTAL POPULATION
4,222
MALE POPULATION
5,139
FEMALE POPULATION
82.16
MALES / 100 FEMALES
121.72
FEMALES / 100 MALES
37.0
MEDIAN AGE
3.0
AVG FAMILY SIZE
2.4
AVG HOUSEHOLD SIZE
4,973
LABOR FORCE [ PEOPLE ]
65.5%
PERCENT IN LABOR FORCE
5.4%
UNEMPLOYMENT RATE
Burlington Zip Codes
Burlington Area Codes
Income in Burlington
Income Overview in Burlington
Per Capita Income in Burlington is $34,942, while median incomes of families and households are $90,900 and $68,737 respectively.
| Characteristic | Number | Measure |
| Per Capita Income | 9,361 | $34,942 |
| Median Family Income | 2,422 | $90,900 |
| Mean Family Income | 2,422 | $98,872 |
| Median Household Income | 3,850 | $68,737 |
| Mean Household Income | 3,850 | $80,684 |
| Income Deficit | 2,422 | $0 |
| Wage / Income Gap (%) | 9,361 | 14.88% |
| Wage / Income Gap ($) | 9,361 | 85.12¢ per $1 |
| Gini / Inequality Index | 9,361 | 0.40 |
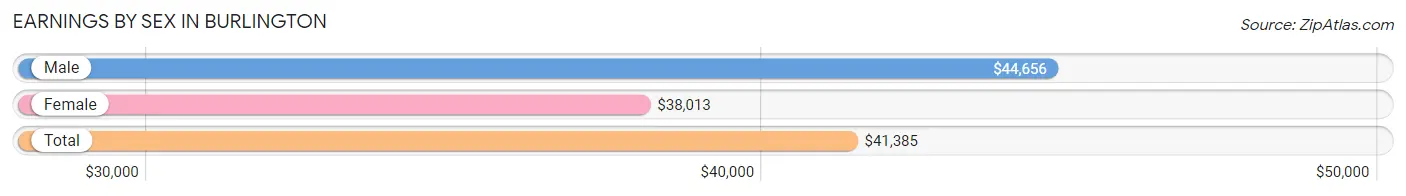
Earnings by Sex in Burlington
Average Earnings in Burlington are $41,385, $44,656 for men and $38,013 for women, a difference of 14.9%.
| Sex | Number | Average Earnings |
| Male | 2,652 (52.8%) | $44,656 |
| Female | 2,374 (47.2%) | $38,013 |
| Total | 5,026 (100.0%) | $41,385 |
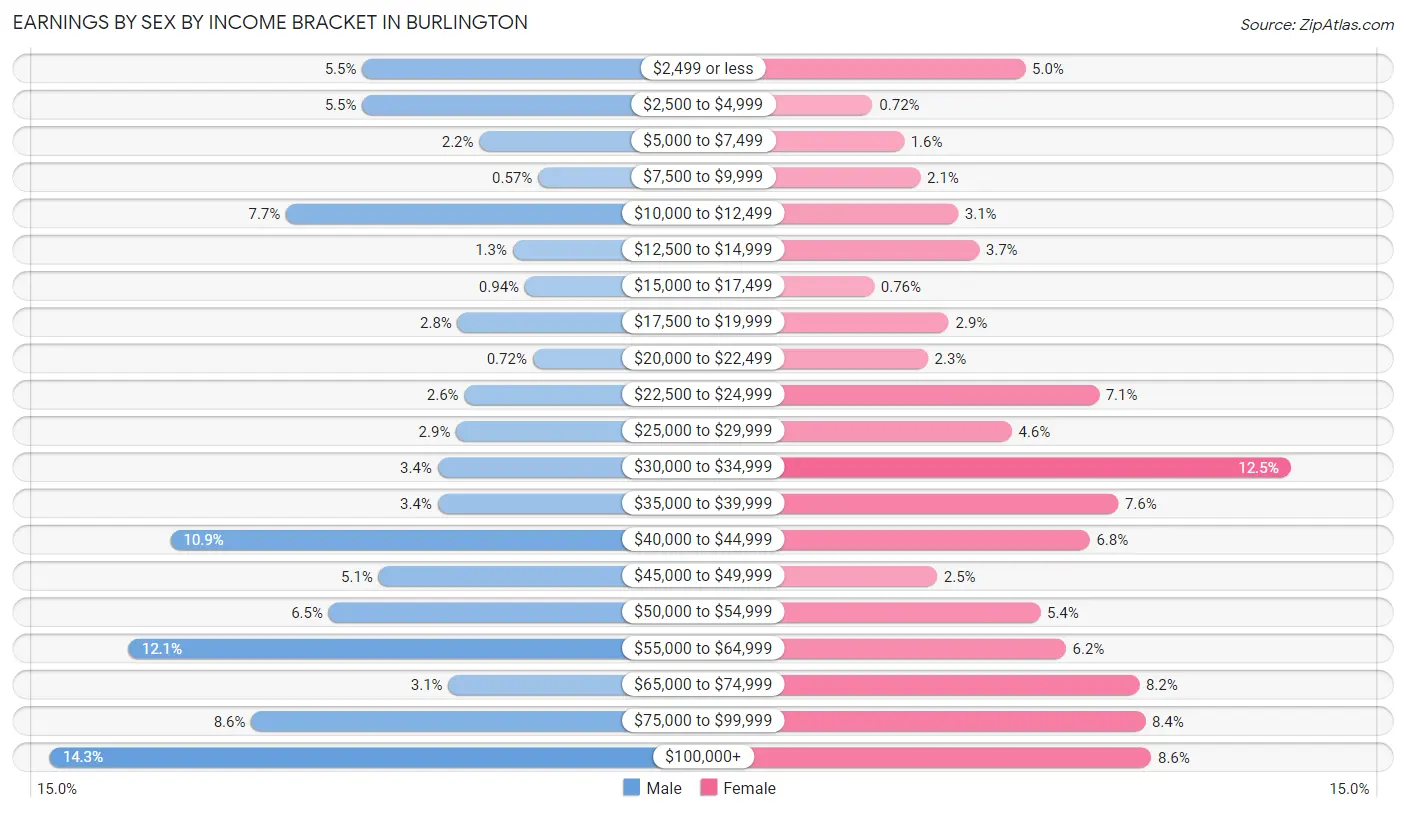
Earnings by Sex by Income Bracket in Burlington
The most common earnings brackets in Burlington are $100,000+ for men (379 | 14.3%) and $30,000 to $34,999 for women (296 | 12.5%).
| Income | Male | Female |
| $2,499 or less | 146 (5.5%) | 119 (5.0%) |
| $2,500 to $4,999 | 146 (5.5%) | 17 (0.7%) |
| $5,000 to $7,499 | 59 (2.2%) | 38 (1.6%) |
| $7,500 to $9,999 | 15 (0.6%) | 49 (2.1%) |
| $10,000 to $12,499 | 203 (7.6%) | 74 (3.1%) |
| $12,500 to $14,999 | 34 (1.3%) | 88 (3.7%) |
| $15,000 to $17,499 | 25 (0.9%) | 18 (0.8%) |
| $17,500 to $19,999 | 75 (2.8%) | 68 (2.9%) |
| $20,000 to $22,499 | 19 (0.7%) | 54 (2.3%) |
| $22,500 to $24,999 | 70 (2.6%) | 168 (7.1%) |
| $25,000 to $29,999 | 76 (2.9%) | 110 (4.6%) |
| $30,000 to $34,999 | 90 (3.4%) | 296 (12.5%) |
| $35,000 to $39,999 | 90 (3.4%) | 181 (7.6%) |
| $40,000 to $44,999 | 289 (10.9%) | 162 (6.8%) |
| $45,000 to $49,999 | 134 (5.1%) | 60 (2.5%) |
| $50,000 to $54,999 | 171 (6.5%) | 129 (5.4%) |
| $55,000 to $64,999 | 320 (12.1%) | 146 (6.1%) |
| $65,000 to $74,999 | 82 (3.1%) | 195 (8.2%) |
| $75,000 to $99,999 | 229 (8.6%) | 199 (8.4%) |
| $100,000+ | 379 (14.3%) | 203 (8.6%) |
| Total | 2,652 (100.0%) | 2,374 (100.0%) |
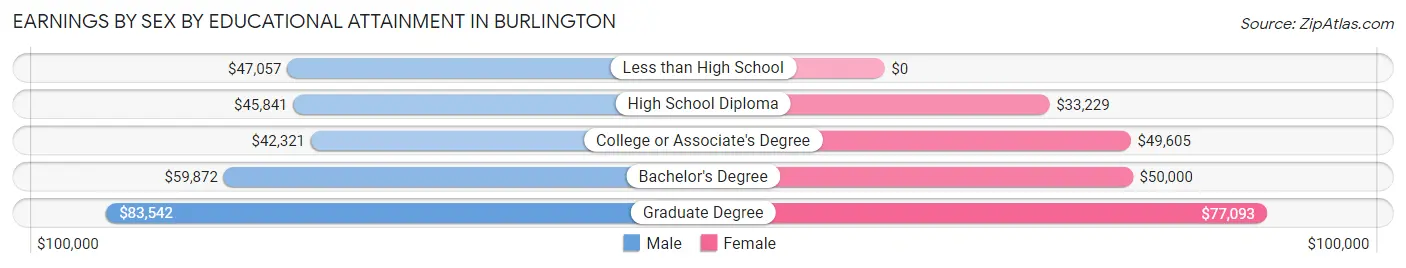
Earnings by Sex by Educational Attainment in Burlington
Average earnings in Burlington are $50,052 for men and $41,859 for women, a difference of 16.4%. Men with an educational attainment of graduate degree enjoy the highest average annual earnings of $83,542, while those with college or associate's degree education earn the least with $42,321. Women with an educational attainment of graduate degree earn the most with the average annual earnings of $77,093, while those with high school diploma education have the smallest earnings of $33,229.
| Educational Attainment | Male Income | Female Income |
| Less than High School | $47,057 | $0 |
| High School Diploma | $45,841 | $33,229 |
| College or Associate's Degree | $42,321 | $49,605 |
| Bachelor's Degree | $59,872 | $50,000 |
| Graduate Degree | $83,542 | $77,093 |
| Total | $50,052 | $41,859 |
Family Income in Burlington
Family Income Brackets in Burlington
According to the Burlington family income data, there are 518 families falling into the $100,000 to $149,999 income range, which is the most common income bracket and makes up 21.4% of all families.
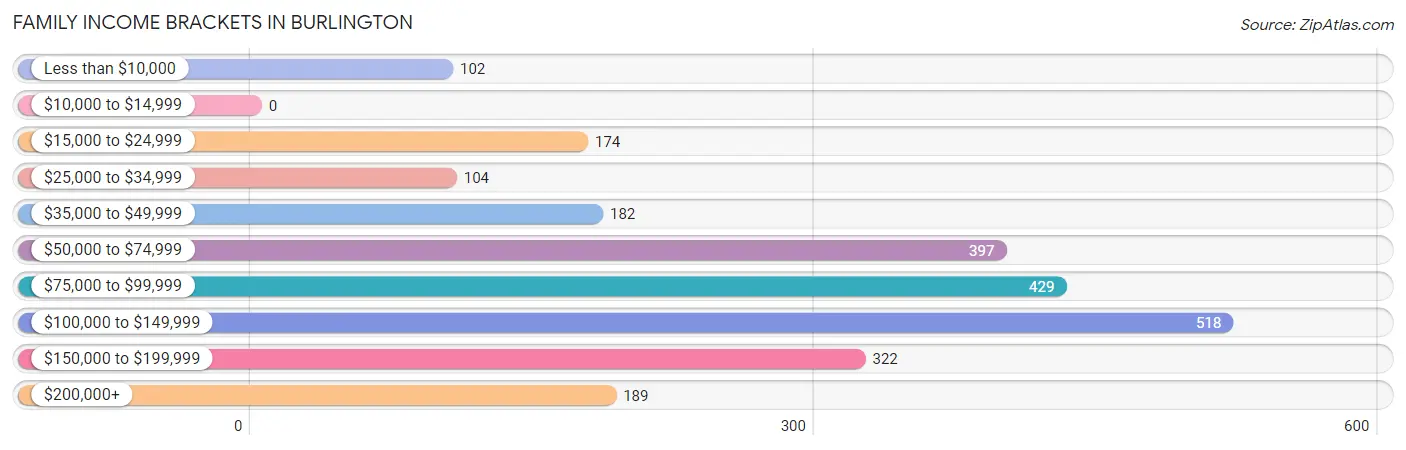
| Income Bracket | # Families | % Families |
| Less than $10,000 | 102 | 4.2% |
| $10,000 to $14,999 | 0 | 0.0% |
| $15,000 to $24,999 | 174 | 7.2% |
| $25,000 to $34,999 | 104 | 4.3% |
| $35,000 to $49,999 | 182 | 7.5% |
| $50,000 to $74,999 | 397 | 16.4% |
| $75,000 to $99,999 | 429 | 17.7% |
| $100,000 to $149,999 | 518 | 21.4% |
| $150,000 to $199,999 | 322 | 13.3% |
| $200,000+ | 189 | 7.8% |
Family Income by Famaliy Size in Burlington
7+ person families (82 | 3.4%) account for the highest median family income in Burlington with $177,616 per family, while 2-person families (1,081 | 44.6%) have the highest median income of $35,188 per family member.
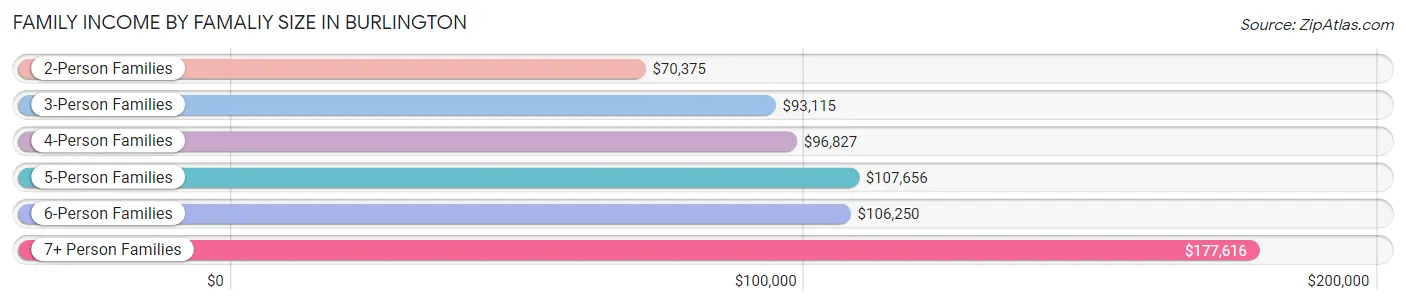
| Income Bracket | # Families | Median Income |
| 2-Person Families | 1,081 (44.6%) | $70,375 |
| 3-Person Families | 633 (26.1%) | $93,115 |
| 4-Person Families | 321 (13.3%) | $96,827 |
| 5-Person Families | 177 (7.3%) | $107,656 |
| 6-Person Families | 128 (5.3%) | $106,250 |
| 7+ Person Families | 82 (3.4%) | $177,616 |
| Total | 2,422 (100.0%) | $90,900 |
Family Income by Number of Earners in Burlington
The median family income in Burlington is $90,900, with families comprising 2 earners (881) having the highest median family income of $111,699, while families with no earners (377) have the lowest median family income of $45,378, accounting for 36.4% and 15.6% of families, respectively.
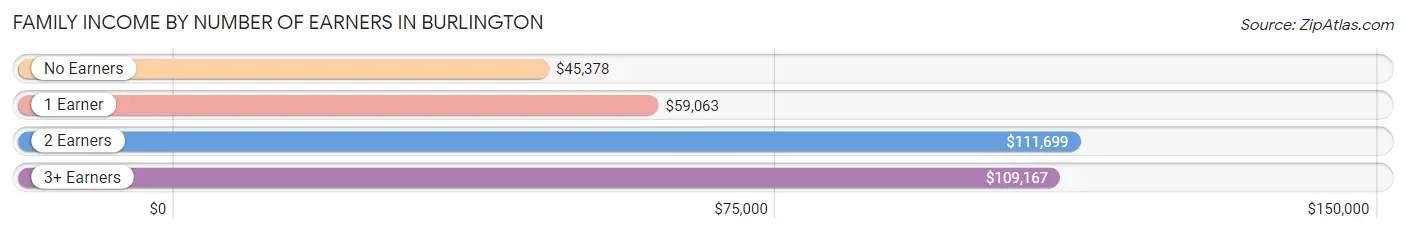
| Number of Earners | # Families | Median Income |
| No Earners | 377 (15.6%) | $45,378 |
| 1 Earner | 776 (32.0%) | $59,063 |
| 2 Earners | 881 (36.4%) | $111,699 |
| 3+ Earners | 388 (16.0%) | $109,167 |
| Total | 2,422 (100.0%) | $90,900 |
Household Income in Burlington
Household Income Brackets in Burlington
With 674 households falling in the category, the $50,000 to $74,999 income range is the most frequent in Burlington, accounting for 17.5% of all households. In contrast, only 100 households (2.6%) fall into the $10,000 to $14,999 income bracket, making it the least populous group.
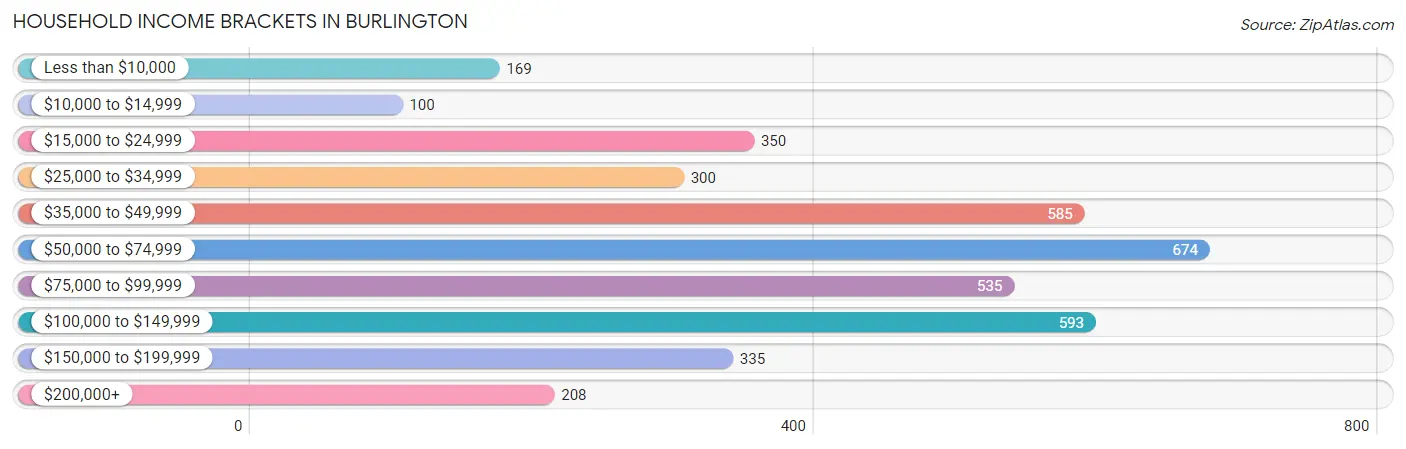
| Income Bracket | # Households | % Households |
| Less than $10,000 | 169 | 4.4% |
| $10,000 to $14,999 | 100 | 2.6% |
| $15,000 to $24,999 | 350 | 9.1% |
| $25,000 to $34,999 | 300 | 7.8% |
| $35,000 to $49,999 | 585 | 15.2% |
| $50,000 to $74,999 | 674 | 17.5% |
| $75,000 to $99,999 | 535 | 13.9% |
| $100,000 to $149,999 | 593 | 15.4% |
| $150,000 to $199,999 | 335 | 8.7% |
| $200,000+ | 208 | 5.4% |
Household Income by Householder Age in Burlington
The median household income in Burlington is $68,737, with the highest median household income of $84,375 found in the 45 to 64 years age bracket for the primary householder. A total of 1,271 households (33.0%) fall into this category. Meanwhile, the 15 to 24 years age bracket for the primary householder has the lowest median household income of $0, with 163 households (4.2%) in this group.
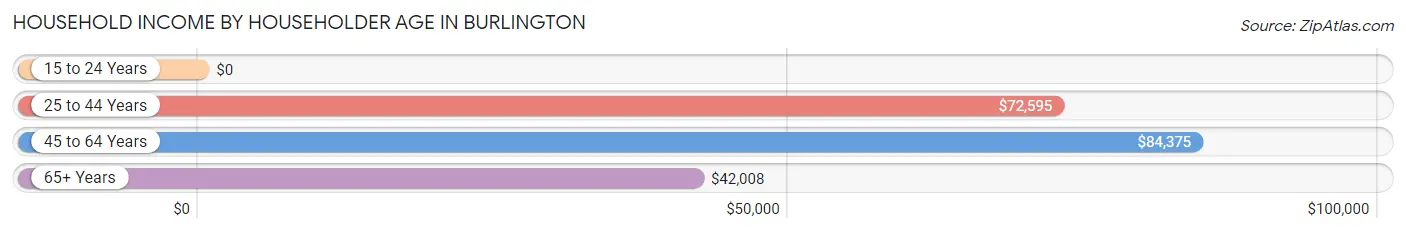
| Income Bracket | # Households | Median Income |
| 15 to 24 Years | 163 (4.2%) | $0 |
| 25 to 44 Years | 1,534 (39.8%) | $72,595 |
| 45 to 64 Years | 1,271 (33.0%) | $84,375 |
| 65+ Years | 882 (22.9%) | $42,008 |
| Total | 3,850 (100.0%) | $68,737 |
Poverty in Burlington
Income Below Poverty by Sex and Age in Burlington
With 11.9% poverty level for males and 9.2% for females among the residents of Burlington, 5 year old males and under 5 year old females are the most vulnerable to poverty, with 9 males (45.0%) and 39 females (19.5%) in their respective age groups living below the poverty level.
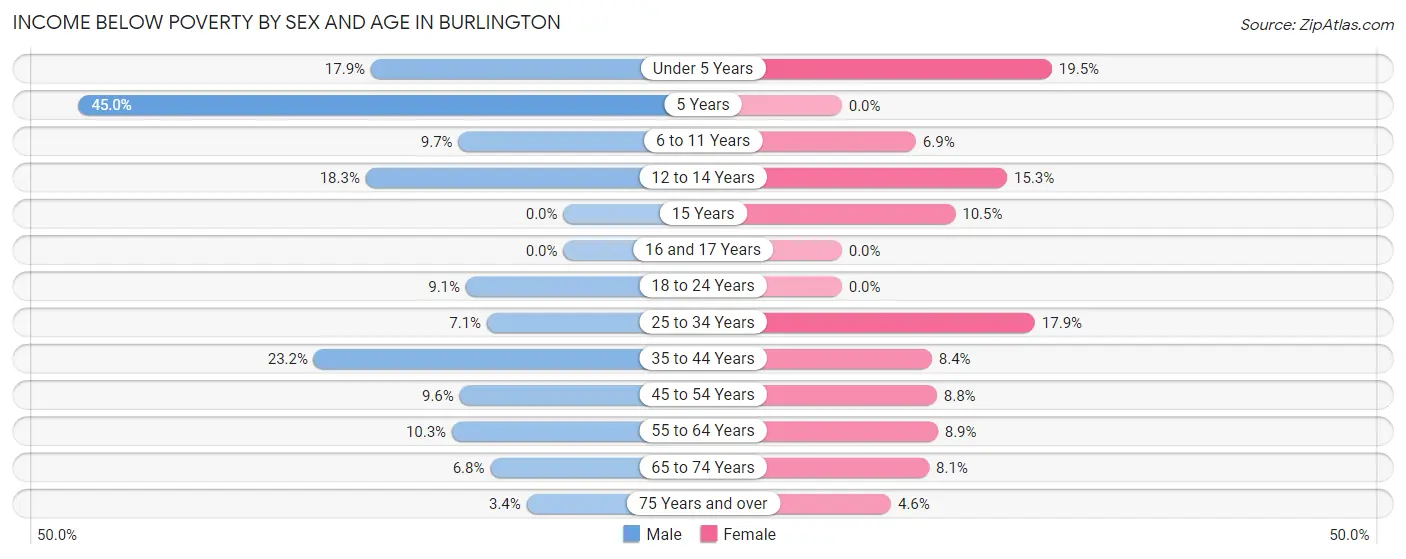
| Age Bracket | Male | Female |
| Under 5 Years | 25 (17.9%) | 39 (19.5%) |
| 5 Years | 9 (45.0%) | 0 (0.0%) |
| 6 to 11 Years | 19 (9.7%) | 24 (6.9%) |
| 12 to 14 Years | 42 (18.3%) | 56 (15.3%) |
| 15 Years | 0 (0.0%) | 10 (10.5%) |
| 16 and 17 Years | 0 (0.0%) | 0 (0.0%) |
| 18 to 24 Years | 36 (9.0%) | 0 (0.0%) |
| 25 to 34 Years | 40 (7.1%) | 131 (17.9%) |
| 35 to 44 Years | 205 (23.2%) | 61 (8.4%) |
| 45 to 54 Years | 52 (9.6%) | 44 (8.8%) |
| 55 to 64 Years | 42 (10.3%) | 44 (8.9%) |
| 65 to 74 Years | 20 (6.8%) | 29 (8.1%) |
| 75 Years and over | 7 (3.4%) | 25 (4.6%) |
| Total | 497 (11.9%) | 463 (9.2%) |
Income Above Poverty by Sex and Age in Burlington
According to the poverty statistics in Burlington, males aged 15 years and females aged 5 years are the age groups that are most secure financially, with 100.0% of males and 100.0% of females in these age groups living above the poverty line.
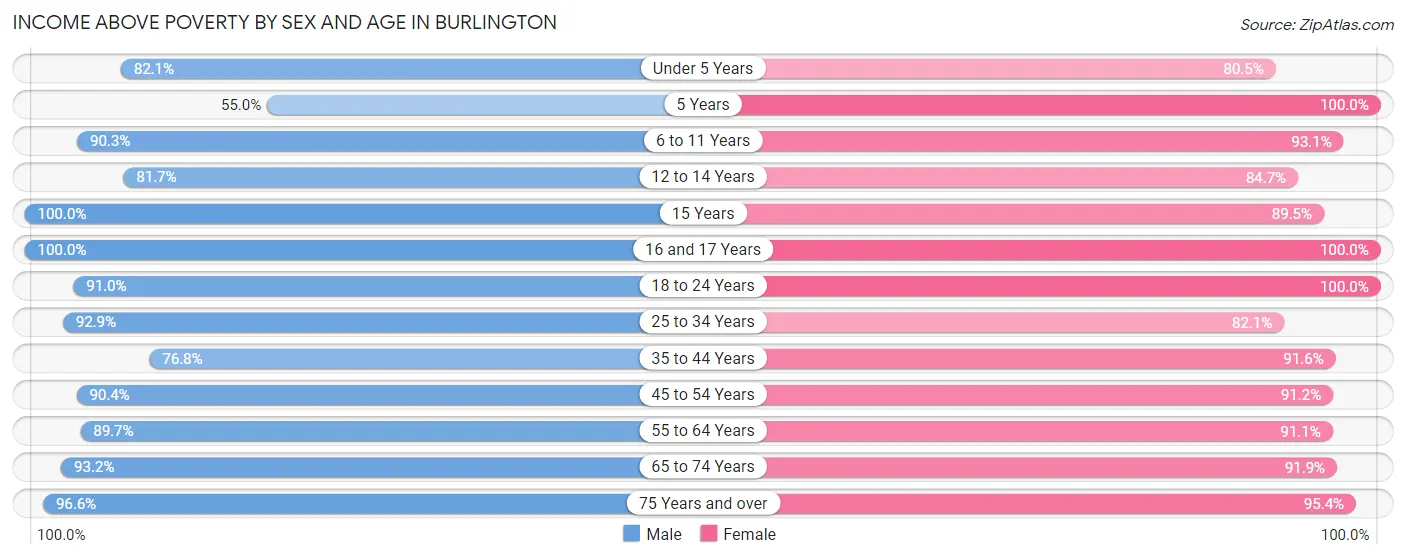
| Age Bracket | Male | Female |
| Under 5 Years | 115 (82.1%) | 161 (80.5%) |
| 5 Years | 11 (55.0%) | 71 (100.0%) |
| 6 to 11 Years | 176 (90.3%) | 325 (93.1%) |
| 12 to 14 Years | 187 (81.7%) | 309 (84.7%) |
| 15 Years | 49 (100.0%) | 85 (89.5%) |
| 16 and 17 Years | 245 (100.0%) | 51 (100.0%) |
| 18 to 24 Years | 362 (90.9%) | 544 (100.0%) |
| 25 to 34 Years | 524 (92.9%) | 600 (82.1%) |
| 35 to 44 Years | 680 (76.8%) | 669 (91.6%) |
| 45 to 54 Years | 488 (90.4%) | 455 (91.2%) |
| 55 to 64 Years | 364 (89.7%) | 450 (91.1%) |
| 65 to 74 Years | 275 (93.2%) | 329 (91.9%) |
| 75 Years and over | 198 (96.6%) | 522 (95.4%) |
| Total | 3,674 (88.1%) | 4,571 (90.8%) |
Income Below Poverty Among Married-Couple Families in Burlington
The poverty statistics for married-couple families in Burlington show that 3.8% or 59 of the total 1,546 families live below the poverty line. Families with 3 or 4 children have the highest poverty rate of 11.9%, comprising of 22 families. On the other hand, families with no children have the lowest poverty rate of 1.4%, which includes 11 families.
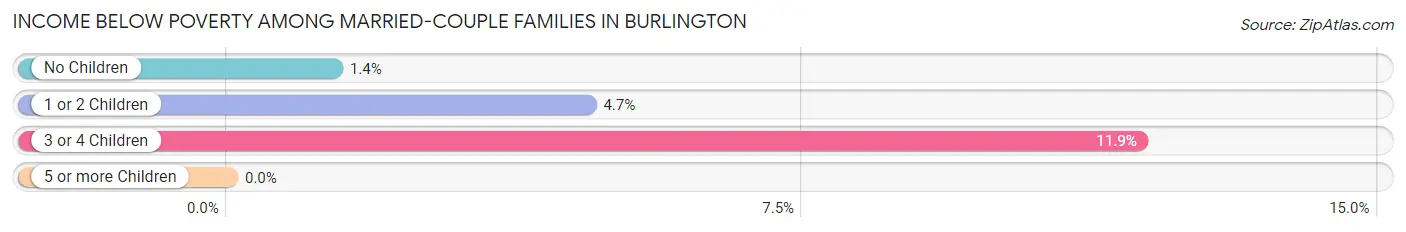
| Children | Above Poverty | Below Poverty |
| No Children | 794 (98.6%) | 11 (1.4%) |
| 1 or 2 Children | 530 (95.3%) | 26 (4.7%) |
| 3 or 4 Children | 163 (88.1%) | 22 (11.9%) |
| 5 or more Children | 0 (0.0%) | 0 (0.0%) |
| Total | 1,487 (96.2%) | 59 (3.8%) |
Income Below Poverty Among Single-Parent Households in Burlington
According to the poverty data in Burlington, 7.3% or 19 single-father households and 10.7% or 66 single-mother households are living below the poverty line. Among single-father households, those with 1 or 2 children have the highest poverty rate, with 19 households (10.9%) experiencing poverty. Likewise, among single-mother households, those with 1 or 2 children have the highest poverty rate, with 66 households (15.5%) falling below the poverty line.
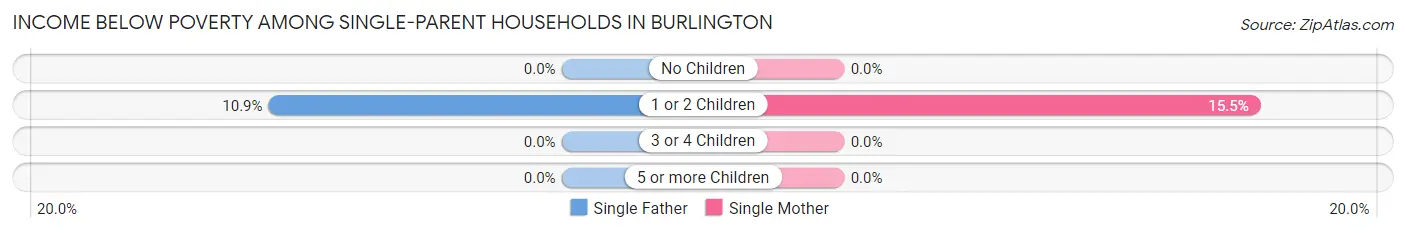
| Children | Single Father | Single Mother |
| No Children | 0 (0.0%) | 0 (0.0%) |
| 1 or 2 Children | 19 (10.9%) | 66 (15.5%) |
| 3 or 4 Children | 0 (0.0%) | 0 (0.0%) |
| 5 or more Children | 0 (0.0%) | 0 (0.0%) |
| Total | 19 (7.3%) | 66 (10.7%) |
Income Below Poverty Among Married-Couple vs Single-Parent Households in Burlington
The poverty data for Burlington shows that 59 of the married-couple family households (3.8%) and 85 of the single-parent households (9.7%) are living below the poverty level. Within the married-couple family households, those with 3 or 4 children have the highest poverty rate, with 22 households (11.9%) falling below the poverty line. Among the single-parent households, those with 1 or 2 children have the highest poverty rate, with 85 household (14.2%) living below poverty.
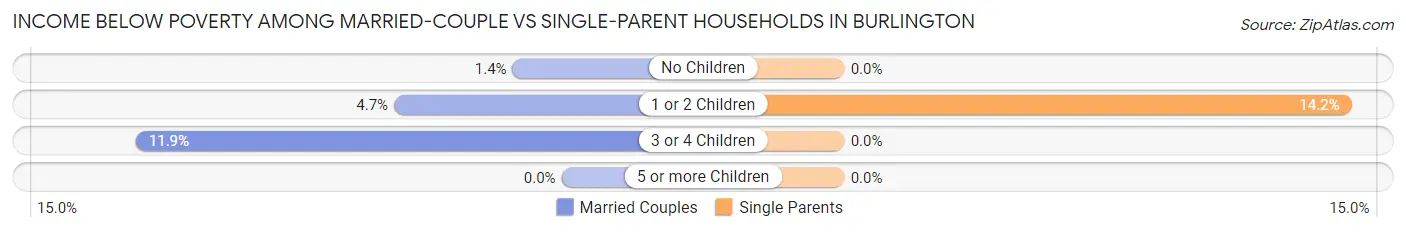
| Children | Married-Couple Families | Single-Parent Households |
| No Children | 11 (1.4%) | 0 (0.0%) |
| 1 or 2 Children | 26 (4.7%) | 85 (14.2%) |
| 3 or 4 Children | 22 (11.9%) | 0 (0.0%) |
| 5 or more Children | 0 (0.0%) | 0 (0.0%) |
| Total | 59 (3.8%) | 85 (9.7%) |
Race in Burlington
The most populous races in Burlington are White / Caucasian (6,675 | 71.3%), Hispanic or Latino (2,422 | 25.9%), and Some other Race (1,336 | 14.3%).
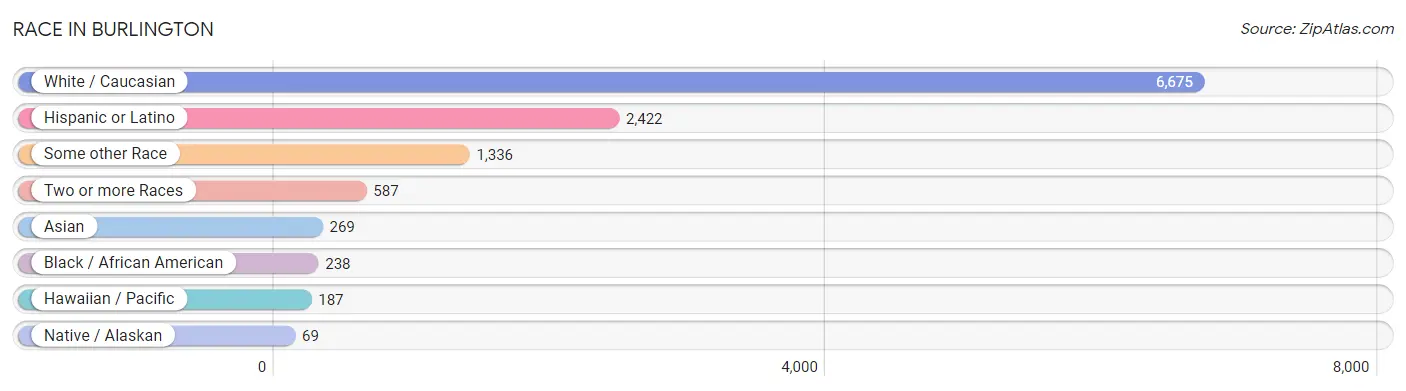
| Race | # Population | % Population |
| Asian | 269 | 2.9% |
| Black / African American | 238 | 2.5% |
| Hawaiian / Pacific | 187 | 2.0% |
| Hispanic or Latino | 2,422 | 25.9% |
| Native / Alaskan | 69 | 0.7% |
| White / Caucasian | 6,675 | 71.3% |
| Two or more Races | 587 | 6.3% |
| Some other Race | 1,336 | 14.3% |
| Total | 9,361 | 100.0% |
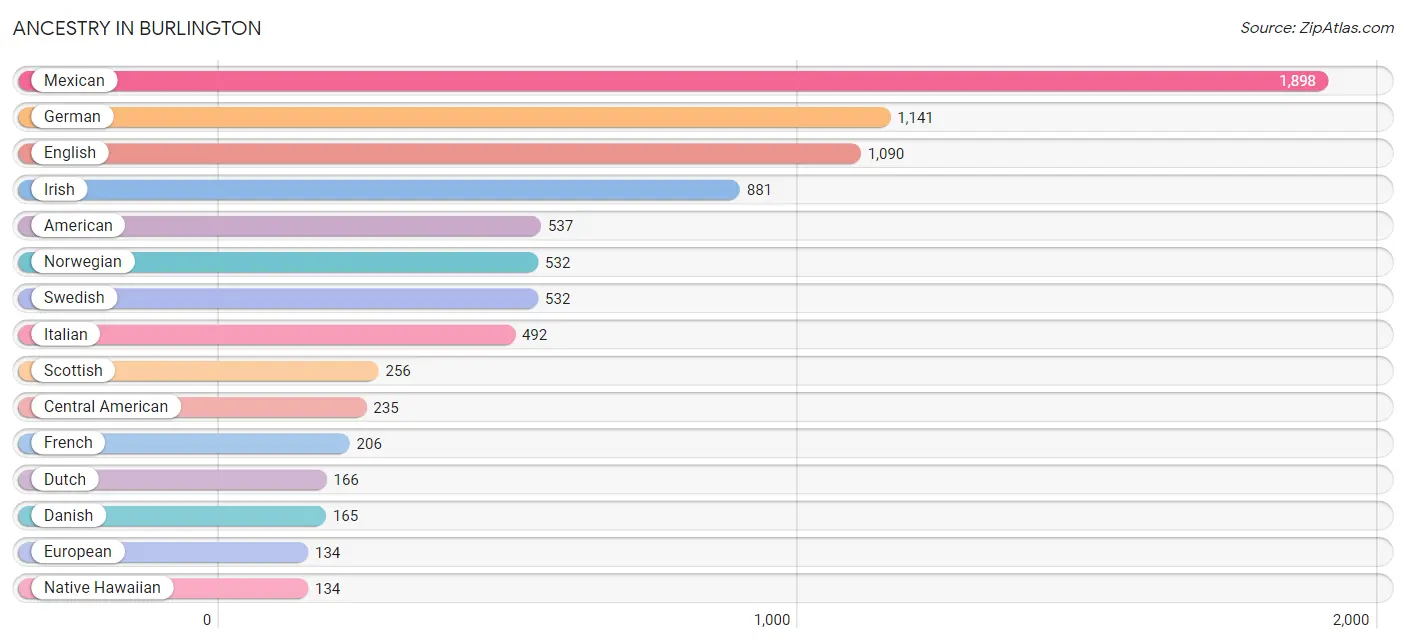
Ancestry in Burlington
The most populous ancestries reported in Burlington are Mexican (1,898 | 20.3%), German (1,141 | 12.2%), English (1,090 | 11.6%), Irish (881 | 9.4%), and American (537 | 5.7%), together accounting for 59.3% of all Burlington residents.
| Ancestry | # Population | % Population |
| African | 22 | 0.2% |
| American | 537 | 5.7% |
| Arab | 12 | 0.1% |
| Argentinean | 21 | 0.2% |
| Australian | 29 | 0.3% |
| Bangladeshi | 34 | 0.4% |
| Belgian | 53 | 0.6% |
| Bhutanese | 38 | 0.4% |
| British | 34 | 0.4% |
| Burmese | 41 | 0.4% |
| Canadian | 8 | 0.1% |
| Central American | 235 | 2.5% |
| Chippewa | 8 | 0.1% |
| Choctaw | 95 | 1.0% |
| Costa Rican | 123 | 1.3% |
| Czech | 27 | 0.3% |
| Danish | 165 | 1.8% |
| Dutch | 166 | 1.8% |
| English | 1,090 | 11.6% |
| European | 134 | 1.4% |
| Filipino | 52 | 0.6% |
| Finnish | 33 | 0.4% |
| French | 206 | 2.2% |
| French American Indian | 32 | 0.3% |
| French Canadian | 34 | 0.4% |
| German | 1,141 | 12.2% |
| Greek | 10 | 0.1% |
| Guamanian / Chamorro | 55 | 0.6% |
| Guatemalan | 17 | 0.2% |
| Honduran | 95 | 1.0% |
| Hungarian | 8 | 0.1% |
| Indian (Asian) | 41 | 0.4% |
| Inupiat | 2 | 0.0% |
| Irish | 881 | 9.4% |
| Italian | 492 | 5.3% |
| Korean | 130 | 1.4% |
| Lithuanian | 14 | 0.2% |
| Mexican | 1,898 | 20.3% |
| Moroccan | 12 | 0.1% |
| Native Hawaiian | 134 | 1.4% |
| Northern European | 35 | 0.4% |
| Norwegian | 532 | 5.7% |
| Polish | 15 | 0.2% |
| Portuguese | 18 | 0.2% |
| Puerto Rican | 51 | 0.5% |
| Romanian | 2 | 0.0% |
| Russian | 20 | 0.2% |
| Scandinavian | 97 | 1.0% |
| Scotch-Irish | 123 | 1.3% |
| Scottish | 256 | 2.7% |
| South American | 21 | 0.2% |
| Spanish | 33 | 0.4% |
| Subsaharan African | 22 | 0.2% |
| Swedish | 532 | 5.7% |
| Swiss | 22 | 0.2% |
| Thai | 1 | 0.0% |
| Welsh | 51 | 0.5% | View All 57 Rows |
Immigrants in Burlington
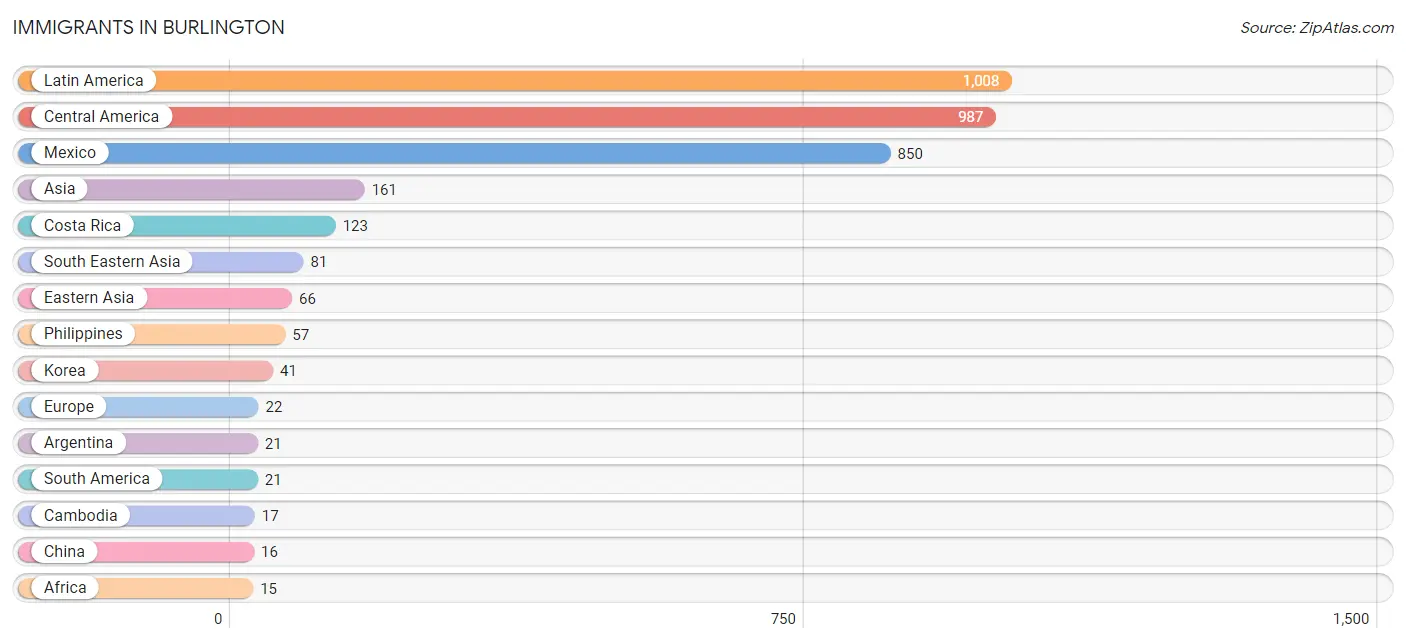
The most numerous immigrant groups reported in Burlington came from Latin America (1,008 | 10.8%), Central America (987 | 10.5%), Mexico (850 | 9.1%), Asia (161 | 1.7%), and Costa Rica (123 | 1.3%), together accounting for 33.4% of all Burlington residents.
| Immigration Origin | # Population | % Population |
| Africa | 15 | 0.2% |
| Argentina | 21 | 0.2% |
| Asia | 161 | 1.7% |
| Cambodia | 17 | 0.2% |
| Canada | 15 | 0.2% |
| Central America | 987 | 10.5% |
| China | 16 | 0.2% |
| Costa Rica | 123 | 1.3% |
| Eastern Asia | 66 | 0.7% |
| Eastern Europe | 2 | 0.0% |
| El Salvador | 14 | 0.2% |
| England | 1 | 0.0% |
| Europe | 22 | 0.2% |
| Greece | 10 | 0.1% |
| India | 1 | 0.0% |
| Japan | 9 | 0.1% |
| Korea | 41 | 0.4% |
| Latin America | 1,008 | 10.8% |
| Mexico | 850 | 9.1% |
| Morocco | 12 | 0.1% |
| Northern Africa | 12 | 0.1% |
| Northern Europe | 10 | 0.1% |
| Norway | 9 | 0.1% |
| Oceania | 5 | 0.1% |
| Philippines | 57 | 0.6% |
| Romania | 2 | 0.0% |
| South America | 21 | 0.2% |
| South Central Asia | 14 | 0.2% |
| South Eastern Asia | 81 | 0.9% |
| Southern Europe | 10 | 0.1% |
| Sri Lanka | 13 | 0.1% |
| Thailand | 7 | 0.1% | View All 32 Rows |
Sex and Age in Burlington
Sex and Age in Burlington
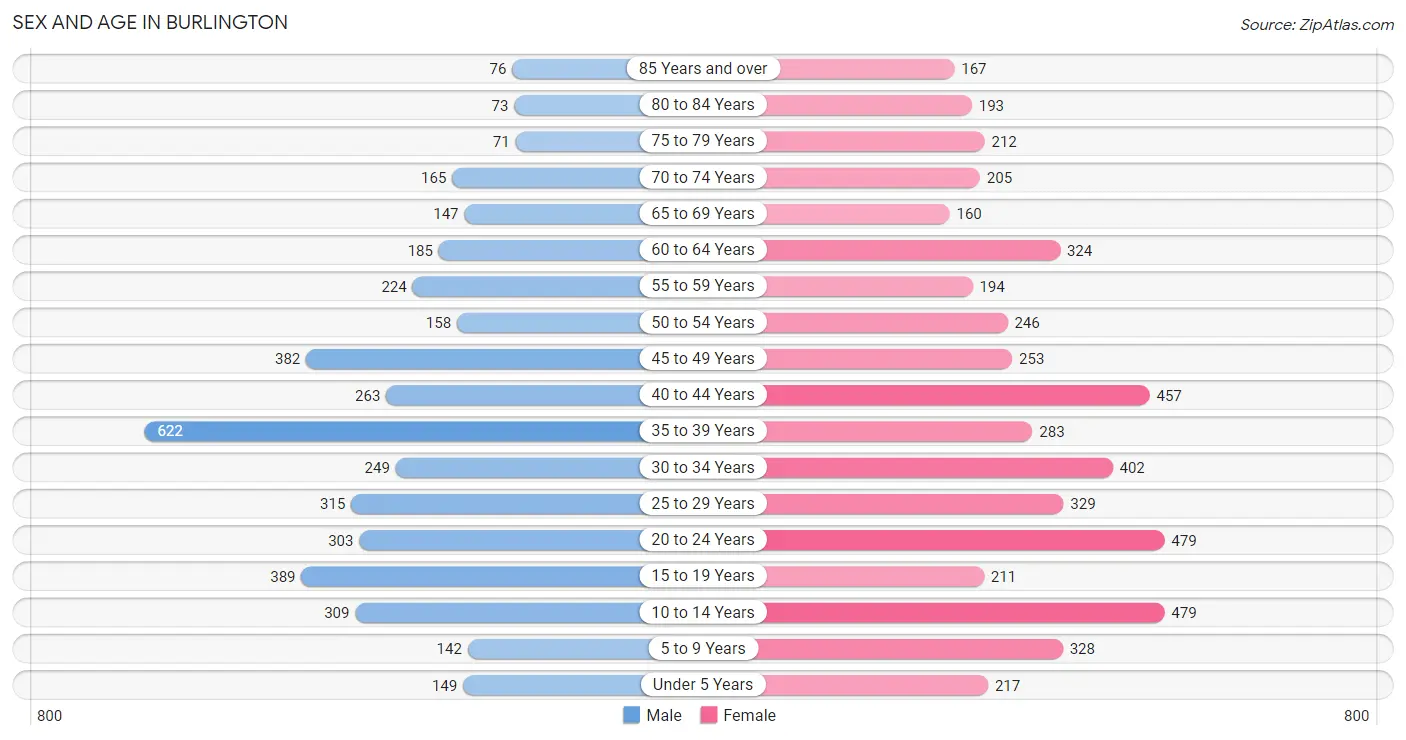
The most populous age groups in Burlington are 35 to 39 Years (622 | 14.7%) for men and 10 to 14 Years (479 | 9.3%) for women.
| Age Bracket | Male | Female |
| Under 5 Years | 149 (3.5%) | 217 (4.2%) |
| 5 to 9 Years | 142 (3.4%) | 328 (6.4%) |
| 10 to 14 Years | 309 (7.3%) | 479 (9.3%) |
| 15 to 19 Years | 389 (9.2%) | 211 (4.1%) |
| 20 to 24 Years | 303 (7.2%) | 479 (9.3%) |
| 25 to 29 Years | 315 (7.5%) | 329 (6.4%) |
| 30 to 34 Years | 249 (5.9%) | 402 (7.8%) |
| 35 to 39 Years | 622 (14.7%) | 283 (5.5%) |
| 40 to 44 Years | 263 (6.2%) | 457 (8.9%) |
| 45 to 49 Years | 382 (9.0%) | 253 (4.9%) |
| 50 to 54 Years | 158 (3.7%) | 246 (4.8%) |
| 55 to 59 Years | 224 (5.3%) | 194 (3.8%) |
| 60 to 64 Years | 185 (4.4%) | 324 (6.3%) |
| 65 to 69 Years | 147 (3.5%) | 160 (3.1%) |
| 70 to 74 Years | 165 (3.9%) | 205 (4.0%) |
| 75 to 79 Years | 71 (1.7%) | 212 (4.1%) |
| 80 to 84 Years | 73 (1.7%) | 193 (3.8%) |
| 85 Years and over | 76 (1.8%) | 167 (3.3%) |
| Total | 4,222 (100.0%) | 5,139 (100.0%) |
Families and Households in Burlington
Median Family Size in Burlington
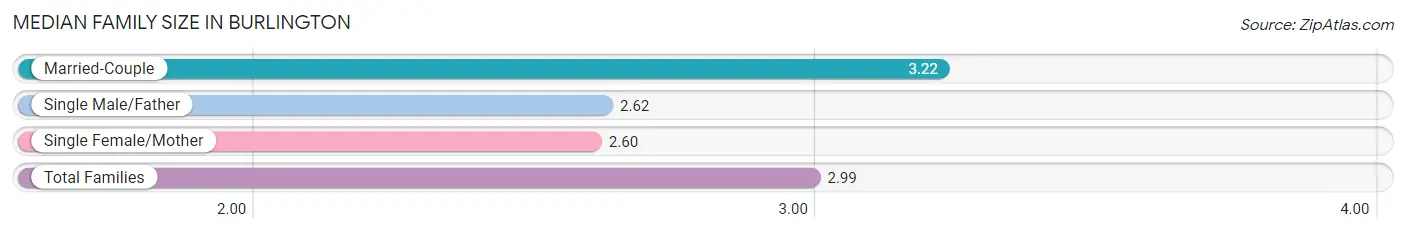
The median family size in Burlington is 2.99 persons per family, with married-couple families (1,546 | 63.8%) accounting for the largest median family size of 3.22 persons per family. On the other hand, single female/mother families (617 | 25.5%) represent the smallest median family size with 2.60 persons per family.
| Family Type | # Families | Family Size |
| Married-Couple | 1,546 (63.8%) | 3.22 |
| Single Male/Father | 259 (10.7%) | 2.62 |
| Single Female/Mother | 617 (25.5%) | 2.60 |
| Total Families | 2,422 (100.0%) | 2.99 |
Median Household Size in Burlington
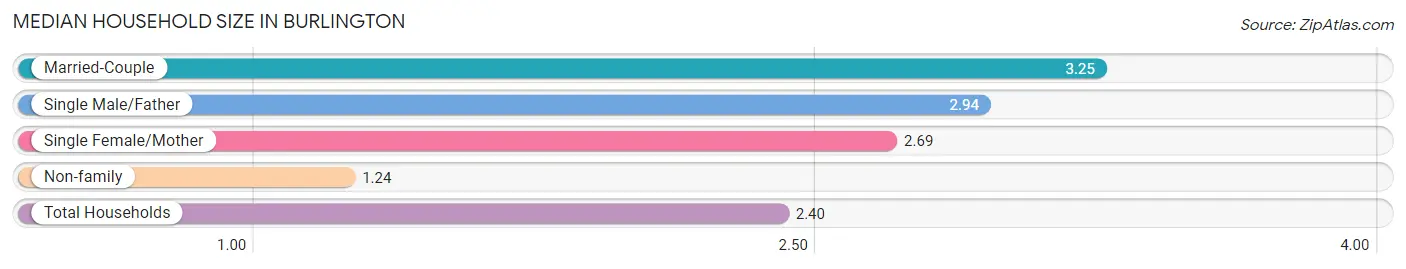
The median household size in Burlington is 2.40 persons per household, with married-couple households (1,546 | 40.2%) accounting for the largest median household size of 3.25 persons per household. non-family households (1,428 | 37.1%) represent the smallest median household size with 1.24 persons per household.
| Household Type | # Households | Household Size |
| Married-Couple | 1,546 (40.2%) | 3.25 |
| Single Male/Father | 259 (6.7%) | 2.94 |
| Single Female/Mother | 617 (16.0%) | 2.69 |
| Non-family | 1,428 (37.1%) | 1.24 |
| Total Households | 3,850 (100.0%) | 2.40 |
Household Size by Marriage Status in Burlington
Out of a total of 3,850 households in Burlington, 2,422 (62.9%) are family households, while 1,428 (37.1%) are nonfamily households. The most numerous type of family households are 2-person households, comprising 988, and the most common type of nonfamily households are 1-person households, comprising 1,158.
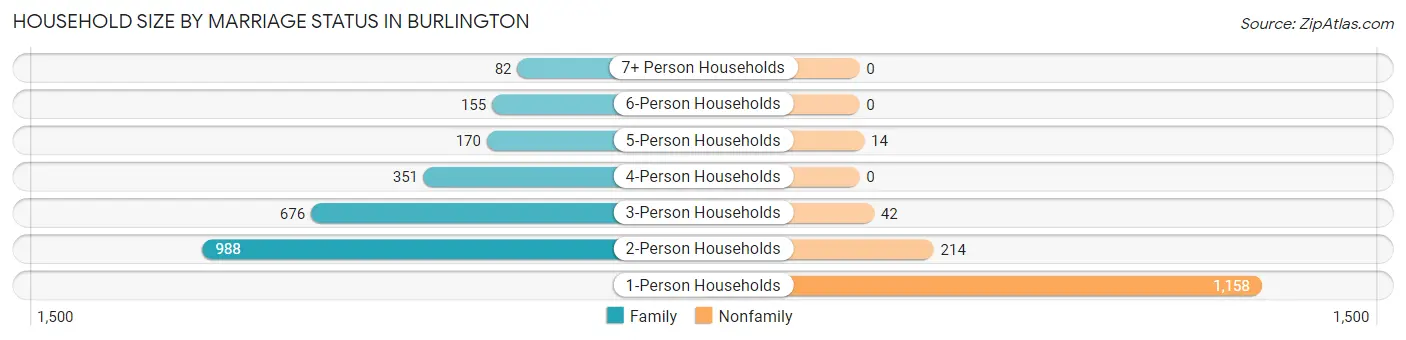
| Household Size | Family Households | Nonfamily Households |
| 1-Person Households | - | 1,158 (30.1%) |
| 2-Person Households | 988 (25.7%) | 214 (5.6%) |
| 3-Person Households | 676 (17.6%) | 42 (1.1%) |
| 4-Person Households | 351 (9.1%) | 0 (0.0%) |
| 5-Person Households | 170 (4.4%) | 14 (0.4%) |
| 6-Person Households | 155 (4.0%) | 0 (0.0%) |
| 7+ Person Households | 82 (2.1%) | 0 (0.0%) |
| Total | 2,422 (62.9%) | 1,428 (37.1%) |
Female Fertility in Burlington
Fertility by Age in Burlington
Average fertility rate in Burlington is 29.0 births per 1,000 women. Women in the age bracket of 20 to 34 years have the highest fertility rate with 60.0 births per 1,000 women. Women in the age bracket of 20 to 34 years acount for 100.0% of all women with births.
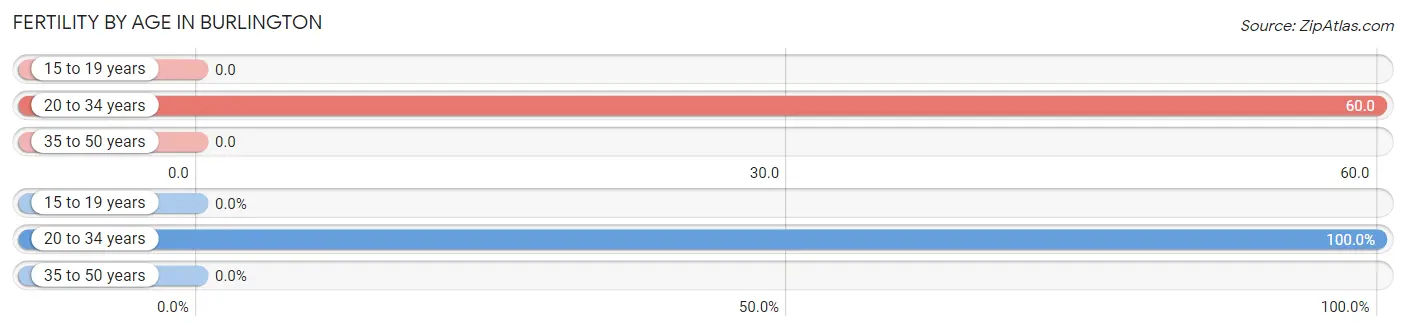
| Age Bracket | Women with Births | Births / 1,000 Women |
| 15 to 19 years | 0 (0.0%) | 0.0 |
| 20 to 34 years | 73 (100.0%) | 60.0 |
| 35 to 50 years | 0 (0.0%) | 0.0 |
| Total | 73 (100.0%) | 29.0 |
Fertility by Age by Marriage Status in Burlington
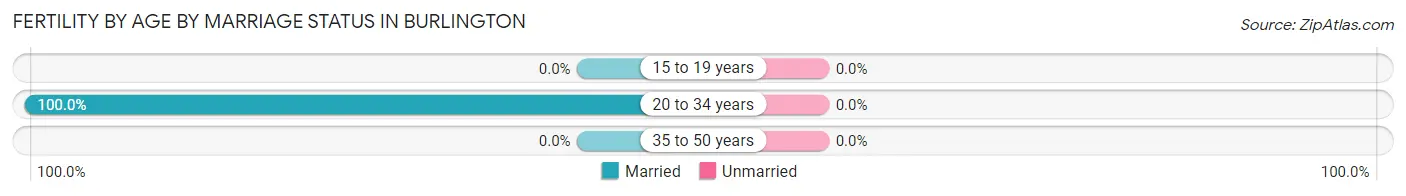
| Age Bracket | Married | Unmarried |
| 15 to 19 years | 0 (0.0%) | 0 (0.0%) |
| 20 to 34 years | 73 (100.0%) | 0 (0.0%) |
| 35 to 50 years | 0 (0.0%) | 0 (0.0%) |
| Total | 73 (100.0%) | 0 (0.0%) |
Fertility by Education in Burlington
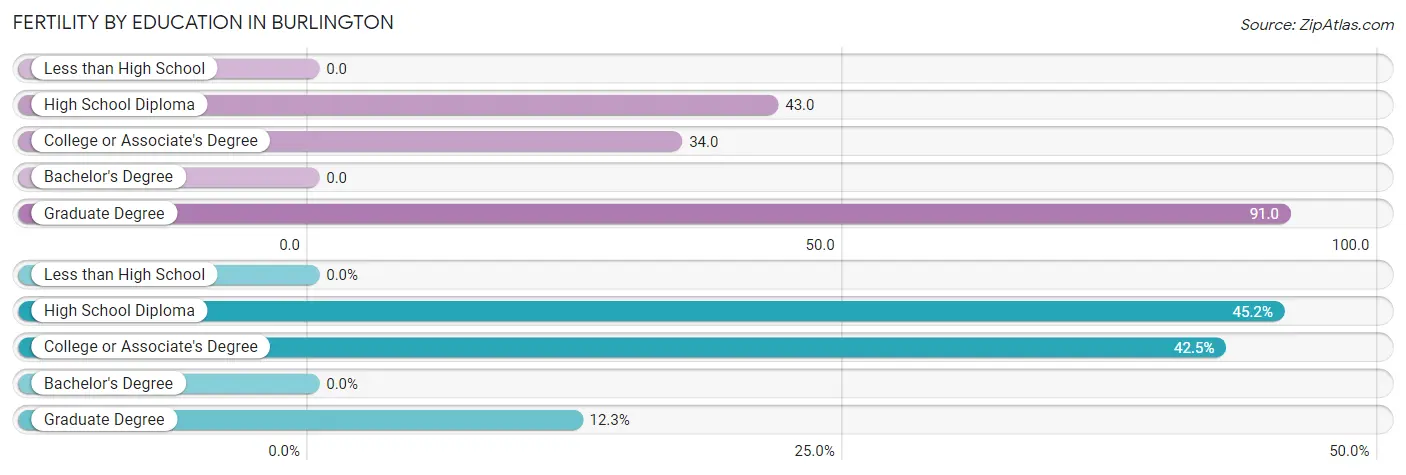
| Educational Attainment | Women with Births | Births / 1,000 Women |
| Less than High School | 0 (0.0%) | 0.0 |
| High School Diploma | 33 (45.2%) | 43.0 |
| College or Associate's Degree | 31 (42.5%) | 34.0 |
| Bachelor's Degree | 0 (0.0%) | 0.0 |
| Graduate Degree | 9 (12.3%) | 91.0 |
| Total | 73 (100.0%) | 29.0 |
Fertility by Education by Marriage Status in Burlington
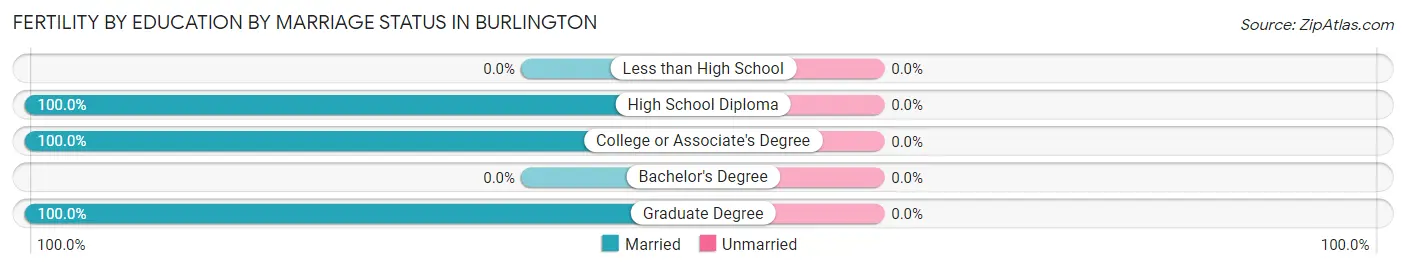
| Educational Attainment | Married | Unmarried |
| Less than High School | 0 (0.0%) | 0 (0.0%) |
| High School Diploma | 33 (100.0%) | 0 (0.0%) |
| College or Associate's Degree | 31 (100.0%) | 0 (0.0%) |
| Bachelor's Degree | 0 (0.0%) | 0 (0.0%) |
| Graduate Degree | 9 (100.0%) | 0 (0.0%) |
| Total | 73 (100.0%) | 0 (0.0%) |
Employment Characteristics in Burlington
Employment by Class of Employer in Burlington
Among the 4,461 employed individuals in Burlington, private company employees (3,377 | 75.7%), not-for-profit organizations (244 | 5.5%), and local government employees (237 | 5.3%) make up the most common classes of employment.
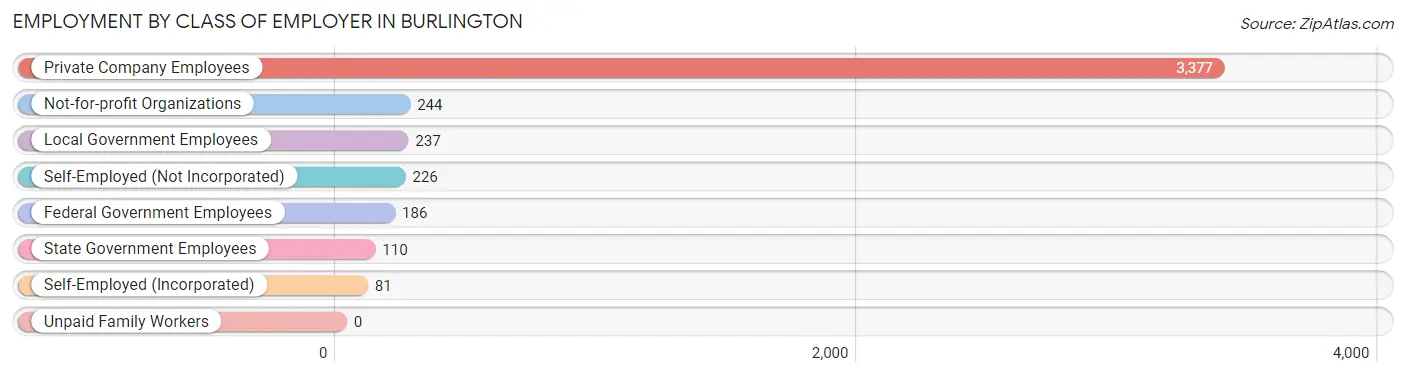
| Employer Class | # Employees | % Employees |
| Private Company Employees | 3,377 | 75.7% |
| Self-Employed (Incorporated) | 81 | 1.8% |
| Self-Employed (Not Incorporated) | 226 | 5.1% |
| Not-for-profit Organizations | 244 | 5.5% |
| Local Government Employees | 237 | 5.3% |
| State Government Employees | 110 | 2.5% |
| Federal Government Employees | 186 | 4.2% |
| Unpaid Family Workers | 0 | 0.0% |
| Total | 4,461 | 100.0% |
Employment Status by Age in Burlington
According to the labor force statistics for Burlington, out of the total population over 16 years of age (7,593), 65.5% or 4,973 individuals are in the labor force, with 5.4% or 269 of them unemployed. The age group with the highest labor force participation rate is 35 to 44 years, with 89.6% or 1,456 individuals in the labor force. Within the labor force, the 20 to 24 years age range has the highest percentage of unemployed individuals, with 14.0% or 80 of them being unemployed.
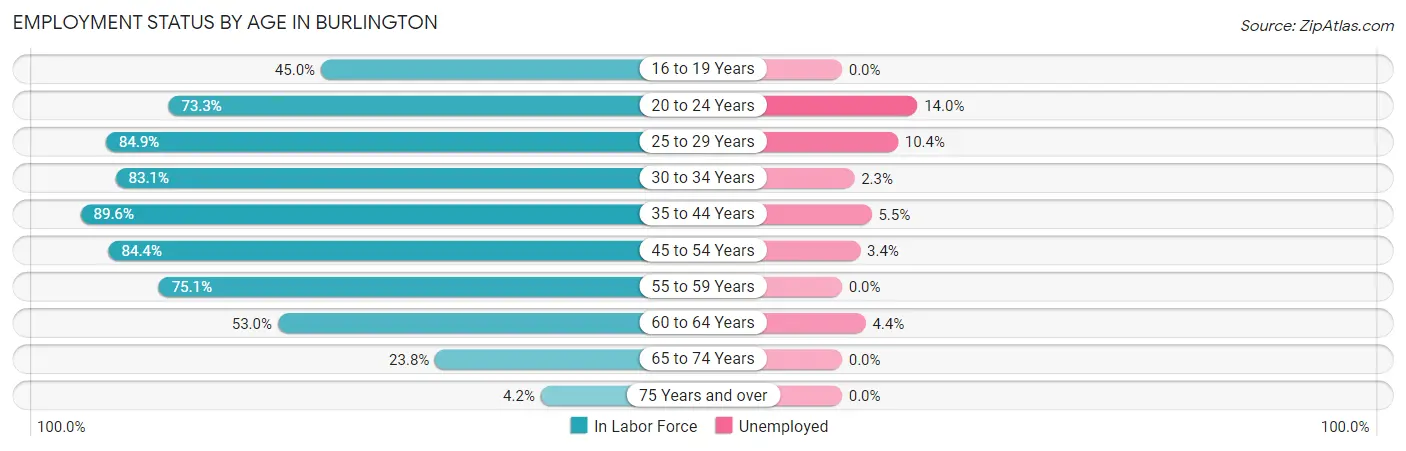
| Age Bracket | In Labor Force | Unemployed |
| 16 to 19 Years | 205 (45.0%) | 0 (0.0%) |
| 20 to 24 Years | 573 (73.3%) | 80 (14.0%) |
| 25 to 29 Years | 547 (84.9%) | 57 (10.4%) |
| 30 to 34 Years | 541 (83.1%) | 12 (2.3%) |
| 35 to 44 Years | 1,456 (89.6%) | 80 (5.5%) |
| 45 to 54 Years | 877 (84.4%) | 30 (3.4%) |
| 55 to 59 Years | 314 (75.1%) | 0 (0.0%) |
| 60 to 64 Years | 270 (53.0%) | 12 (4.4%) |
| 65 to 74 Years | 161 (23.8%) | 0 (0.0%) |
| 75 Years and over | 33 (4.2%) | 0 (0.0%) |
| Total | 4,973 (65.5%) | 269 (5.4%) |
Employment Status by Educational Attainment in Burlington
According to labor force statistics for Burlington, 82.0% of individuals (4,007) out of the total population between 25 and 64 years of age (4,886) are in the labor force, with 4.7% or 188 of them being unemployed. The group with the highest labor force participation rate are those with the educational attainment of bachelor's degree or higher, with 94.5% or 1,004 individuals in the labor force. Within the labor force, individuals with high school diploma education have the highest percentage of unemployment, with 9.0% or 123 of them being unemployed.
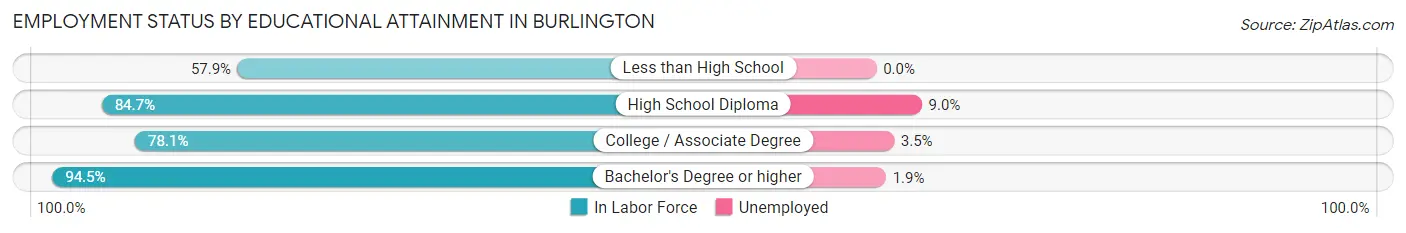
| Educational Attainment | In Labor Force | Unemployed |
| Less than High School | 263 (57.9%) | 0 (0.0%) |
| High School Diploma | 1,368 (84.7%) | 145 (9.0%) |
| College / Associate Degree | 1,371 (78.1%) | 61 (3.5%) |
| Bachelor's Degree or higher | 1,004 (94.5%) | 20 (1.9%) |
| Total | 4,007 (82.0%) | 230 (4.7%) |
Employment Occupations by Sex in Burlington
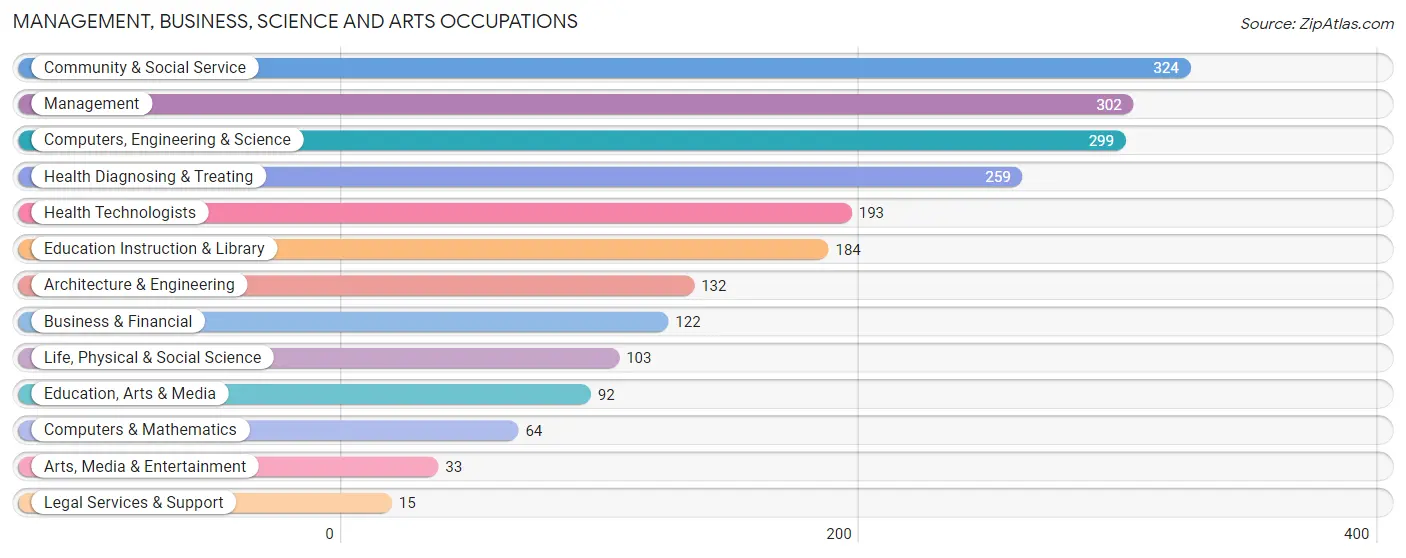
Management, Business, Science and Arts Occupations
The most common Management, Business, Science and Arts occupations in Burlington are Community & Social Service (324 | 7.0%), Management (302 | 6.6%), Computers, Engineering & Science (299 | 6.5%), Health Diagnosing & Treating (259 | 5.6%), and Health Technologists (193 | 4.2%).
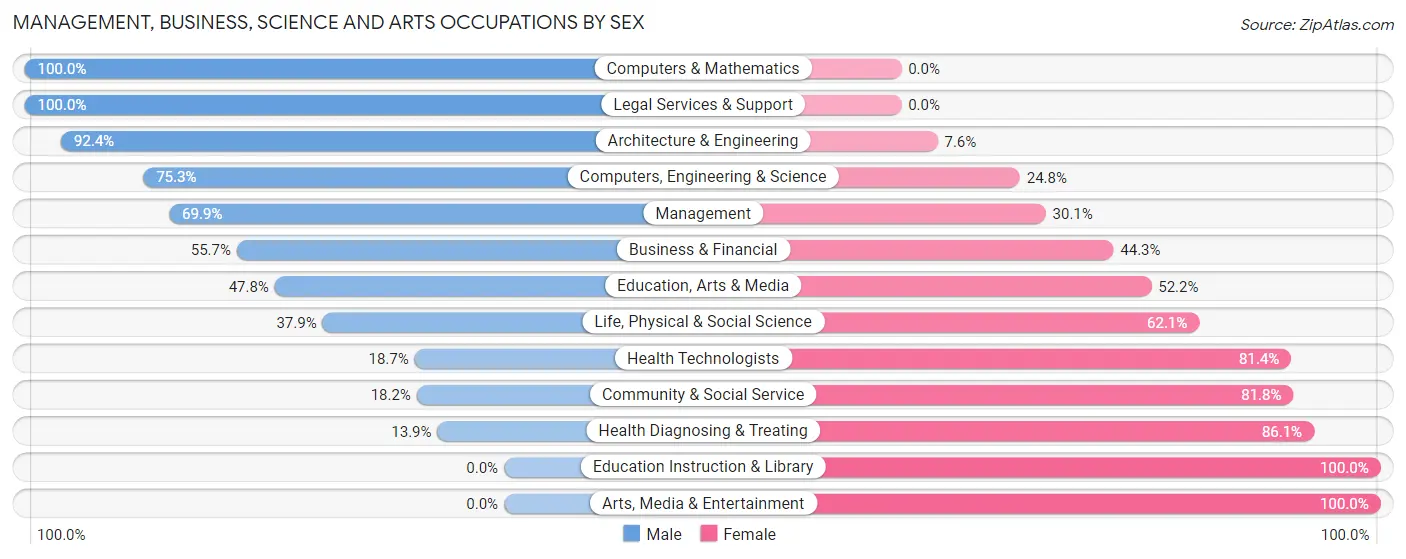
Management, Business, Science and Arts Occupations by Sex
Within the Management, Business, Science and Arts occupations in Burlington, the most male-oriented occupations are Computers & Mathematics (100.0%), Legal Services & Support (100.0%), and Architecture & Engineering (92.4%), while the most female-oriented occupations are Education Instruction & Library (100.0%), Arts, Media & Entertainment (100.0%), and Health Diagnosing & Treating (86.1%).
| Occupation | Male | Female |
| Management | 211 (69.9%) | 91 (30.1%) |
| Business & Financial | 68 (55.7%) | 54 (44.3%) |
| Computers, Engineering & Science | 225 (75.2%) | 74 (24.7%) |
| Computers & Mathematics | 64 (100.0%) | 0 (0.0%) |
| Architecture & Engineering | 122 (92.4%) | 10 (7.6%) |
| Life, Physical & Social Science | 39 (37.9%) | 64 (62.1%) |
| Community & Social Service | 59 (18.2%) | 265 (81.8%) |
| Education, Arts & Media | 44 (47.8%) | 48 (52.2%) |
| Legal Services & Support | 15 (100.0%) | 0 (0.0%) |
| Education Instruction & Library | 0 (0.0%) | 184 (100.0%) |
| Arts, Media & Entertainment | 0 (0.0%) | 33 (100.0%) |
| Health Diagnosing & Treating | 36 (13.9%) | 223 (86.1%) |
| Health Technologists | 36 (18.6%) | 157 (81.4%) |
| Total (Category) | 599 (45.9%) | 707 (54.1%) |
| Total (Overall) | 2,447 (53.1%) | 2,165 (46.9%) |
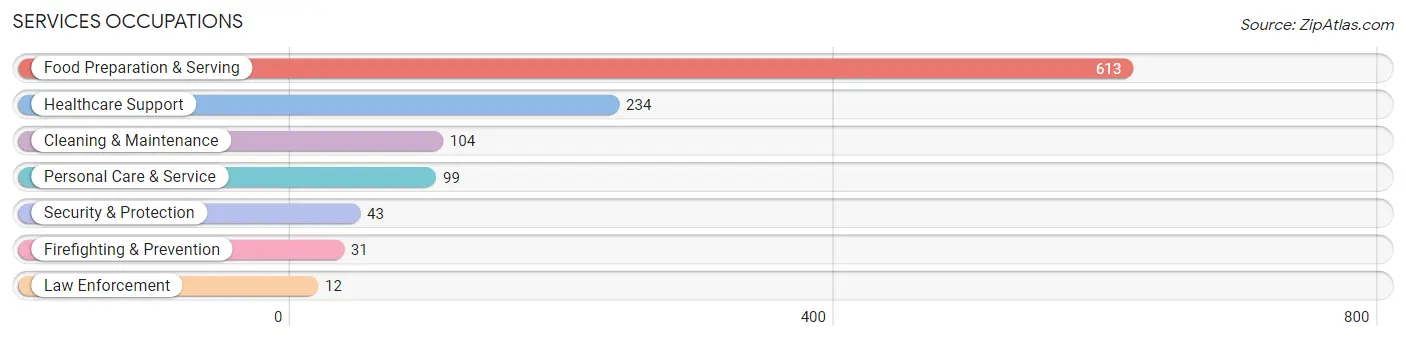
Services Occupations
The most common Services occupations in Burlington are Food Preparation & Serving (613 | 13.3%), Healthcare Support (234 | 5.1%), Cleaning & Maintenance (104 | 2.2%), Personal Care & Service (99 | 2.1%), and Security & Protection (43 | 0.9%).
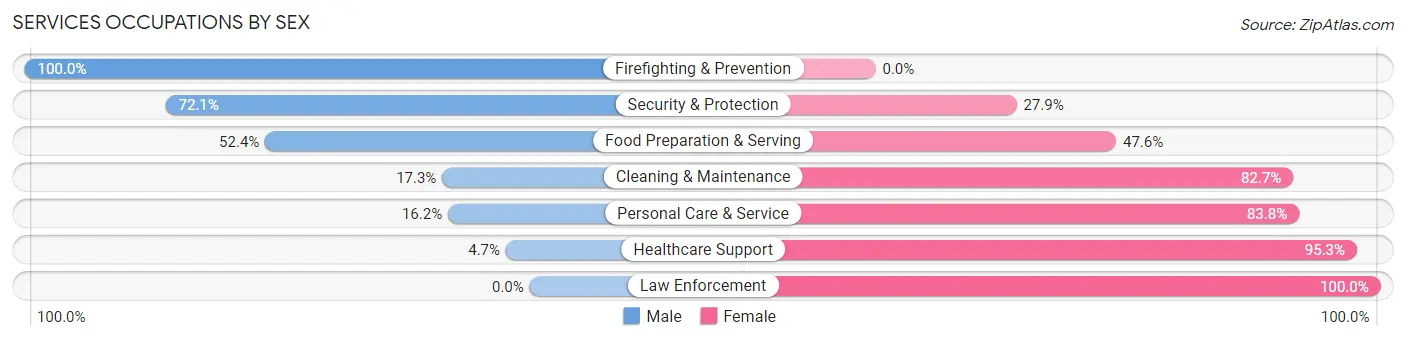
Services Occupations by Sex
Within the Services occupations in Burlington, the most male-oriented occupations are Firefighting & Prevention (100.0%), Security & Protection (72.1%), and Food Preparation & Serving (52.4%), while the most female-oriented occupations are Law Enforcement (100.0%), Healthcare Support (95.3%), and Personal Care & Service (83.8%).
| Occupation | Male | Female |
| Healthcare Support | 11 (4.7%) | 223 (95.3%) |
| Security & Protection | 31 (72.1%) | 12 (27.9%) |
| Firefighting & Prevention | 31 (100.0%) | 0 (0.0%) |
| Law Enforcement | 0 (0.0%) | 12 (100.0%) |
| Food Preparation & Serving | 321 (52.4%) | 292 (47.6%) |
| Cleaning & Maintenance | 18 (17.3%) | 86 (82.7%) |
| Personal Care & Service | 16 (16.2%) | 83 (83.8%) |
| Total (Category) | 397 (36.3%) | 696 (63.7%) |
| Total (Overall) | 2,447 (53.1%) | 2,165 (46.9%) |
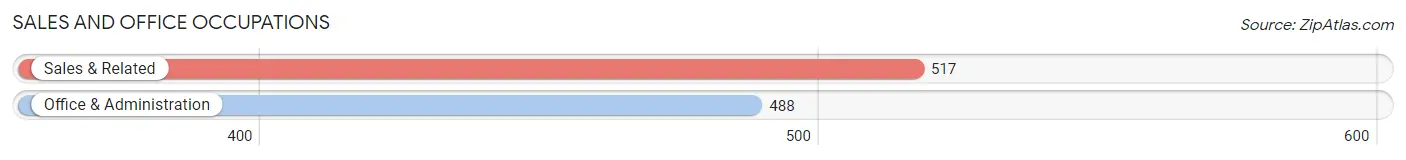
Sales and Office Occupations
The most common Sales and Office occupations in Burlington are Sales & Related (517 | 11.2%), and Office & Administration (488 | 10.6%).
Sales and Office Occupations by Sex
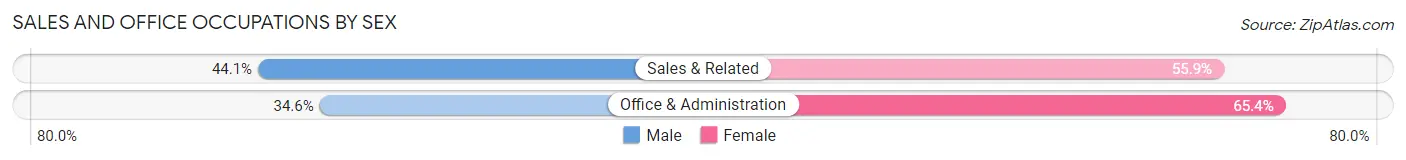
| Occupation | Male | Female |
| Sales & Related | 228 (44.1%) | 289 (55.9%) |
| Office & Administration | 169 (34.6%) | 319 (65.4%) |
| Total (Category) | 397 (39.5%) | 608 (60.5%) |
| Total (Overall) | 2,447 (53.1%) | 2,165 (46.9%) |
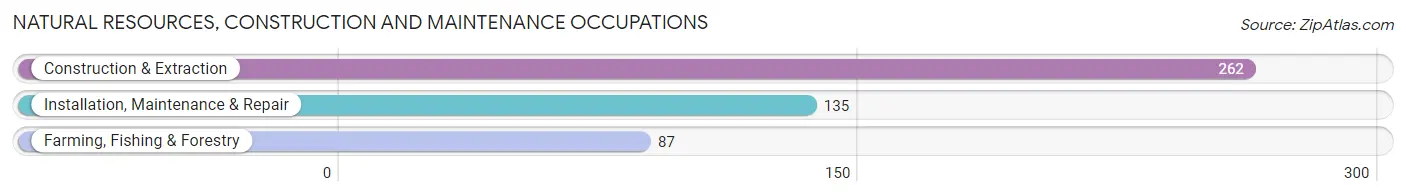
Natural Resources, Construction and Maintenance Occupations
The most common Natural Resources, Construction and Maintenance occupations in Burlington are Construction & Extraction (262 | 5.7%), Installation, Maintenance & Repair (135 | 2.9%), and Farming, Fishing & Forestry (87 | 1.9%).
Natural Resources, Construction and Maintenance Occupations by Sex
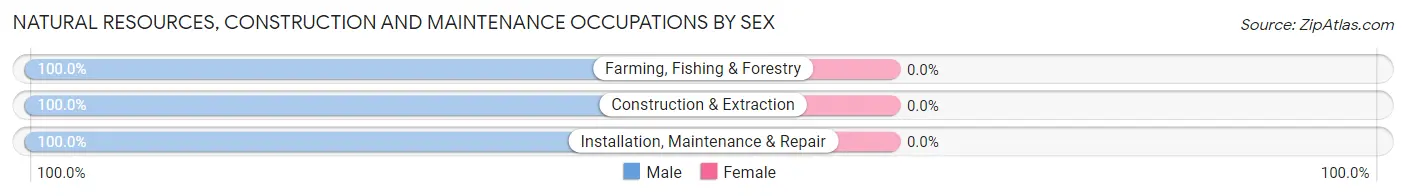
| Occupation | Male | Female |
| Farming, Fishing & Forestry | 87 (100.0%) | 0 (0.0%) |
| Construction & Extraction | 262 (100.0%) | 0 (0.0%) |
| Installation, Maintenance & Repair | 135 (100.0%) | 0 (0.0%) |
| Total (Category) | 484 (100.0%) | 0 (0.0%) |
| Total (Overall) | 2,447 (53.1%) | 2,165 (46.9%) |
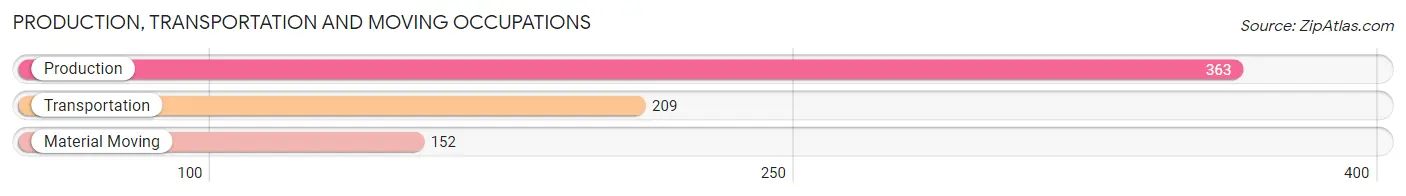
Production, Transportation and Moving Occupations
The most common Production, Transportation and Moving occupations in Burlington are Production (363 | 7.9%), Transportation (209 | 4.5%), and Material Moving (152 | 3.3%).
Production, Transportation and Moving Occupations by Sex
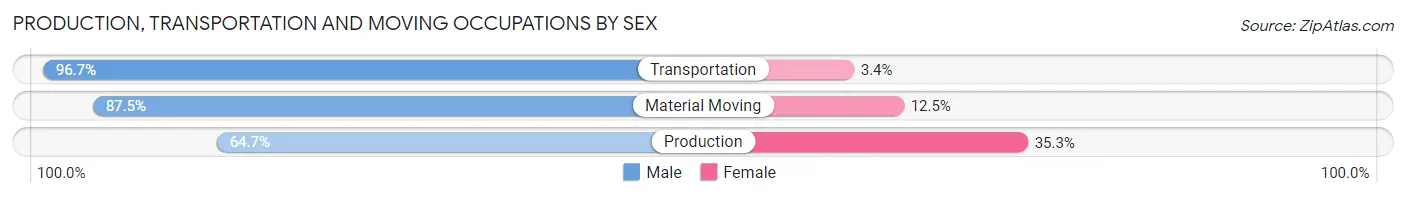
| Occupation | Male | Female |
| Production | 235 (64.7%) | 128 (35.3%) |
| Transportation | 202 (96.7%) | 7 (3.4%) |
| Material Moving | 133 (87.5%) | 19 (12.5%) |
| Total (Category) | 570 (78.7%) | 154 (21.3%) |
| Total (Overall) | 2,447 (53.1%) | 2,165 (46.9%) |
Employment Industries by Sex in Burlington
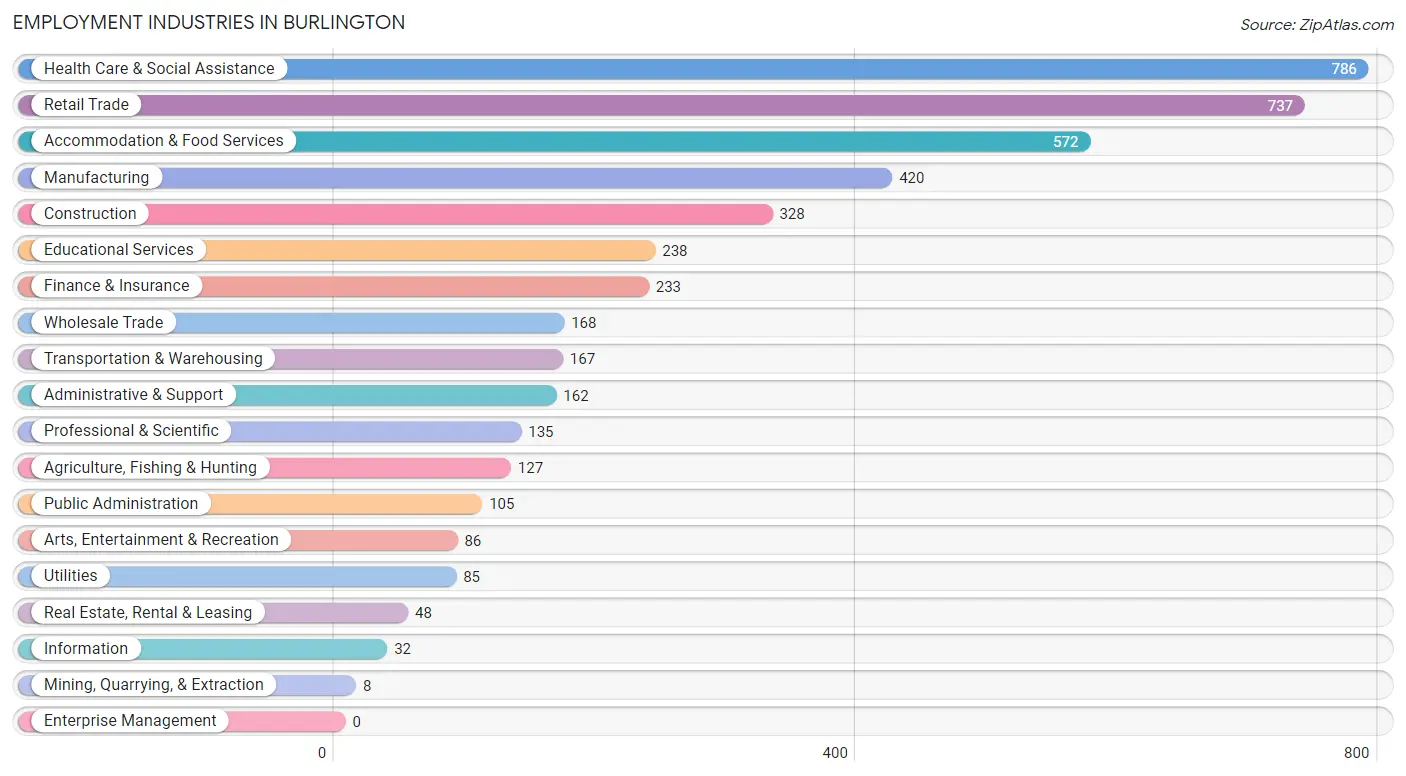
Employment Industries in Burlington
The major employment industries in Burlington include Health Care & Social Assistance (786 | 17.0%), Retail Trade (737 | 16.0%), Accommodation & Food Services (572 | 12.4%), Manufacturing (420 | 9.1%), and Construction (328 | 7.1%).
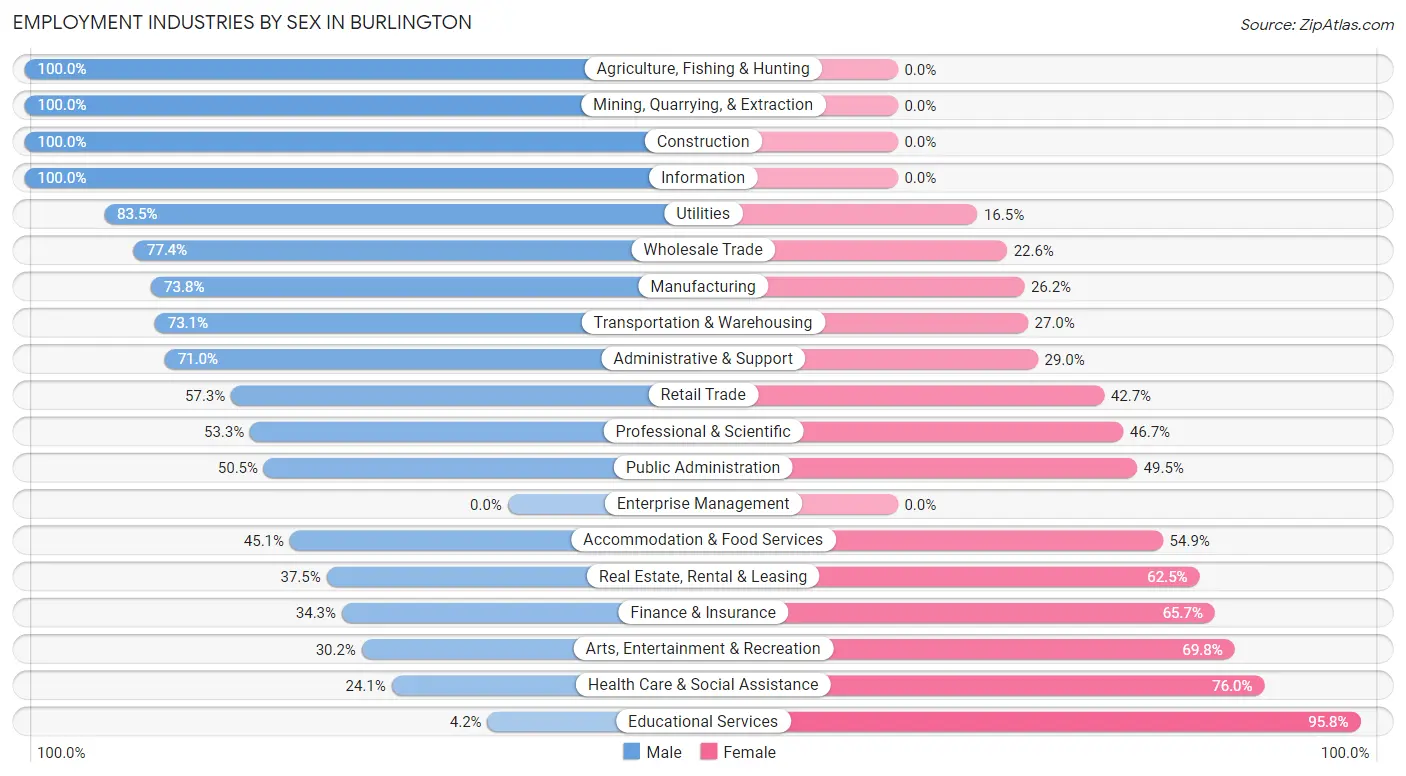
Employment Industries by Sex in Burlington
The Burlington industries that see more men than women are Agriculture, Fishing & Hunting (100.0%), Mining, Quarrying, & Extraction (100.0%), and Construction (100.0%), whereas the industries that tend to have a higher number of women are Educational Services (95.8%), Health Care & Social Assistance (75.9%), and Arts, Entertainment & Recreation (69.8%).
| Industry | Male | Female |
| Agriculture, Fishing & Hunting | 127 (100.0%) | 0 (0.0%) |
| Mining, Quarrying, & Extraction | 8 (100.0%) | 0 (0.0%) |
| Construction | 328 (100.0%) | 0 (0.0%) |
| Manufacturing | 310 (73.8%) | 110 (26.2%) |
| Wholesale Trade | 130 (77.4%) | 38 (22.6%) |
| Retail Trade | 422 (57.3%) | 315 (42.7%) |
| Transportation & Warehousing | 122 (73.1%) | 45 (27.0%) |
| Utilities | 71 (83.5%) | 14 (16.5%) |
| Information | 32 (100.0%) | 0 (0.0%) |
| Finance & Insurance | 80 (34.3%) | 153 (65.7%) |
| Real Estate, Rental & Leasing | 18 (37.5%) | 30 (62.5%) |
| Professional & Scientific | 72 (53.3%) | 63 (46.7%) |
| Enterprise Management | 0 (0.0%) | 0 (0.0%) |
| Administrative & Support | 115 (71.0%) | 47 (29.0%) |
| Educational Services | 10 (4.2%) | 228 (95.8%) |
| Health Care & Social Assistance | 189 (24.0%) | 597 (75.9%) |
| Arts, Entertainment & Recreation | 26 (30.2%) | 60 (69.8%) |
| Accommodation & Food Services | 258 (45.1%) | 314 (54.9%) |
| Public Administration | 53 (50.5%) | 52 (49.5%) |
| Total | 2,447 (53.1%) | 2,165 (46.9%) |
Education in Burlington
School Enrollment in Burlington
The most common levels of schooling among the 2,149 students in Burlington are middle school (658 | 30.6%), high school (608 | 28.3%), and elementary school (398 | 18.5%).
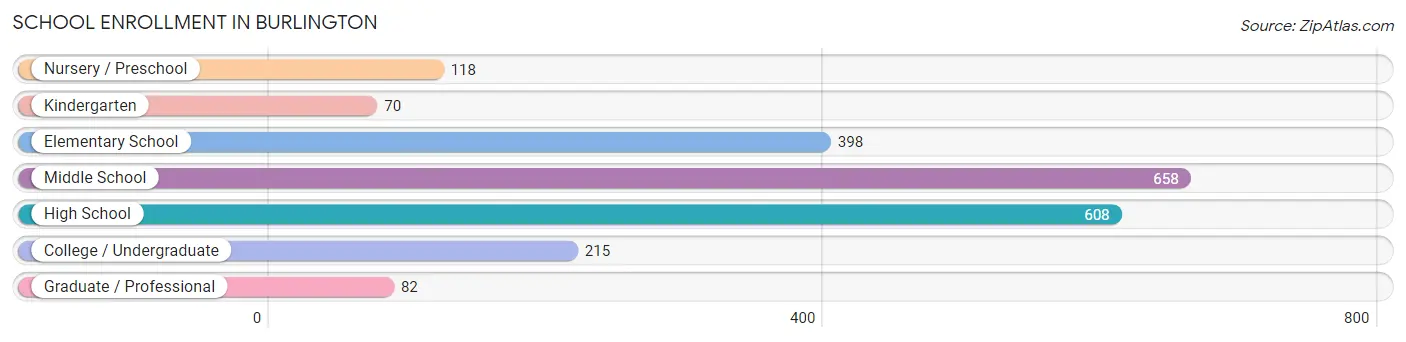
| School Level | # Students | % Students |
| Nursery / Preschool | 118 | 5.5% |
| Kindergarten | 70 | 3.3% |
| Elementary School | 398 | 18.5% |
| Middle School | 658 | 30.6% |
| High School | 608 | 28.3% |
| College / Undergraduate | 215 | 10.0% |
| Graduate / Professional | 82 | 3.8% |
| Total | 2,149 | 100.0% |
School Enrollment by Age by Funding Source in Burlington
Out of a total of 2,149 students who are enrolled in schools in Burlington, 275 (12.8%) attend a private institution, while the remaining 1,874 (87.2%) are enrolled in public schools. The age group of 35 years and over has the highest likelihood of being enrolled in private schools, with 44 (44.0% in the age bracket) enrolled. Conversely, the age group of 3 to 4 year olds has the lowest likelihood of being enrolled in a private school, with 62 (100.0% in the age bracket) attending a public institution.
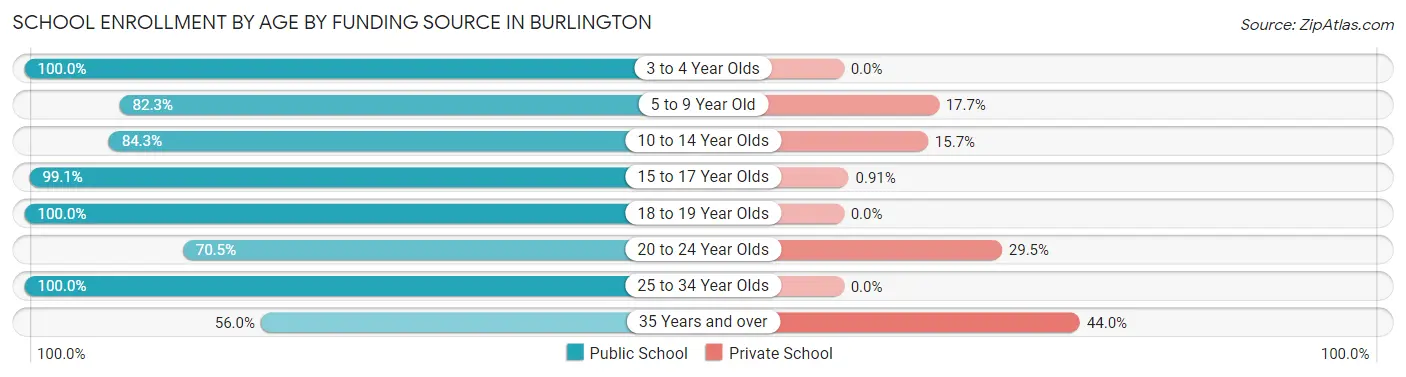
| Age Bracket | Public School | Private School |
| 3 to 4 Year Olds | 62 (100.0%) | 0 (0.0%) |
| 5 to 9 Year Old | 372 (82.3%) | 80 (17.7%) |
| 10 to 14 Year Olds | 634 (84.3%) | 118 (15.7%) |
| 15 to 17 Year Olds | 436 (99.1%) | 4 (0.9%) |
| 18 to 19 Year Olds | 120 (100.0%) | 0 (0.0%) |
| 20 to 24 Year Olds | 67 (70.5%) | 28 (29.5%) |
| 25 to 34 Year Olds | 128 (100.0%) | 0 (0.0%) |
| 35 Years and over | 56 (56.0%) | 44 (44.0%) |
| Total | 1,874 (87.2%) | 275 (12.8%) |
Educational Attainment by Field of Study in Burlington
Business (269 | 16.2%), science & technology (223 | 13.4%), bio, nature & agricultural (201 | 12.1%), psychology (159 | 9.6%), and education (157 | 9.5%) are the most common fields of study among 1,662 individuals in Burlington who have obtained a bachelor's degree or higher.
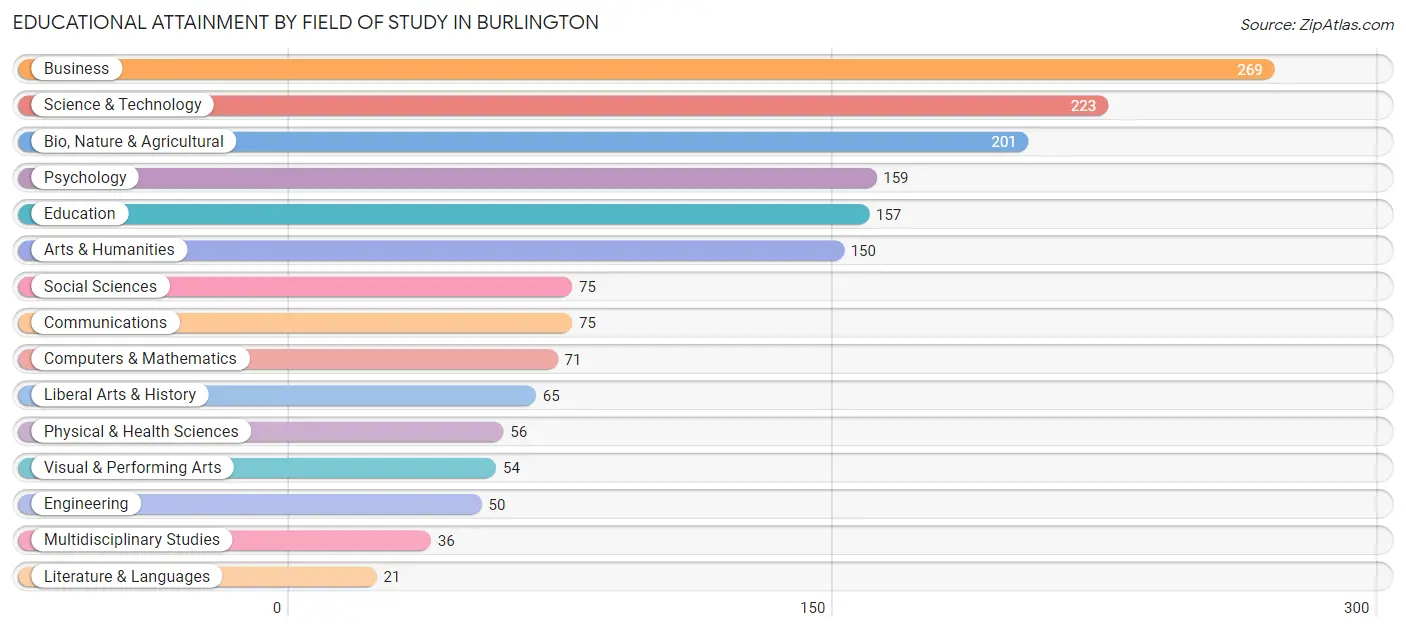
| Field of Study | # Graduates | % Graduates |
| Computers & Mathematics | 71 | 4.3% |
| Bio, Nature & Agricultural | 201 | 12.1% |
| Physical & Health Sciences | 56 | 3.4% |
| Psychology | 159 | 9.6% |
| Social Sciences | 75 | 4.5% |
| Engineering | 50 | 3.0% |
| Multidisciplinary Studies | 36 | 2.2% |
| Science & Technology | 223 | 13.4% |
| Business | 269 | 16.2% |
| Education | 157 | 9.5% |
| Literature & Languages | 21 | 1.3% |
| Liberal Arts & History | 65 | 3.9% |
| Visual & Performing Arts | 54 | 3.3% |
| Communications | 75 | 4.5% |
| Arts & Humanities | 150 | 9.0% |
| Total | 1,662 | 100.0% |
Transportation & Commute in Burlington
Vehicle Availability by Sex in Burlington
The most prevalent vehicle ownership categories in Burlington are males with 2 vehicles (743, accounting for 31.9%) and females with 2 vehicles (658, making up 35.0%).
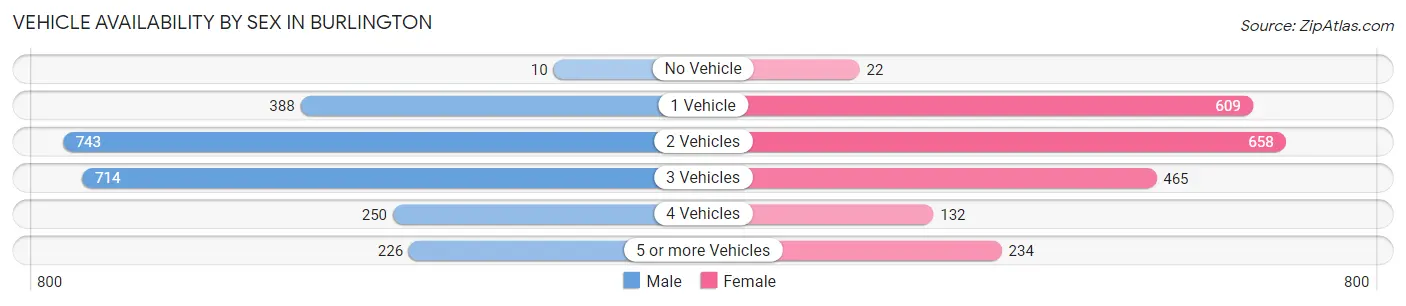
| Vehicles Available | Male | Female |
| No Vehicle | 10 (0.4%) | 22 (1.0%) |
| 1 Vehicle | 388 (16.7%) | 609 (28.7%) |
| 2 Vehicles | 743 (31.9%) | 658 (31.0%) |
| 3 Vehicles | 714 (30.6%) | 465 (21.9%) |
| 4 Vehicles | 250 (10.7%) | 132 (6.2%) |
| 5 or more Vehicles | 226 (9.7%) | 234 (11.0%) |
| Total | 2,331 (100.0%) | 2,120 (100.0%) |
Commute Time in Burlington
The most frequently occuring commute durations in Burlington are 10 to 14 minutes (962 commuters, 22.6%), 5 to 9 minutes (858 commuters, 20.2%), and 15 to 19 minutes (688 commuters, 16.2%).
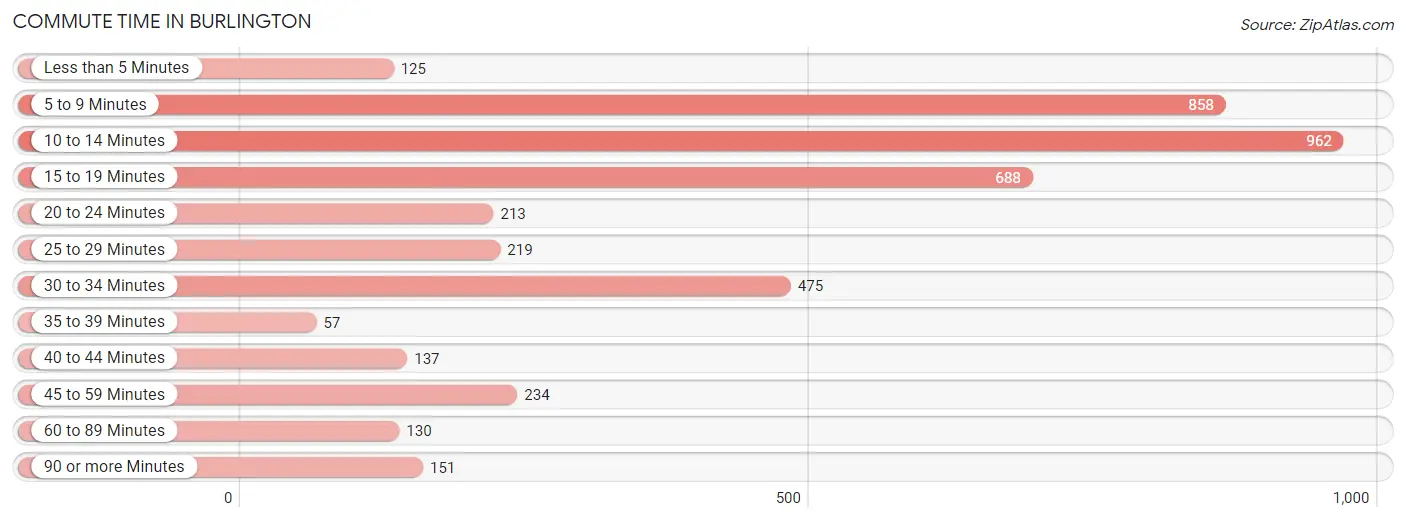
| Commute Time | # Commuters | % Commuters |
| Less than 5 Minutes | 125 | 2.9% |
| 5 to 9 Minutes | 858 | 20.2% |
| 10 to 14 Minutes | 962 | 22.6% |
| 15 to 19 Minutes | 688 | 16.2% |
| 20 to 24 Minutes | 213 | 5.0% |
| 25 to 29 Minutes | 219 | 5.1% |
| 30 to 34 Minutes | 475 | 11.2% |
| 35 to 39 Minutes | 57 | 1.3% |
| 40 to 44 Minutes | 137 | 3.2% |
| 45 to 59 Minutes | 234 | 5.5% |
| 60 to 89 Minutes | 130 | 3.1% |
| 90 or more Minutes | 151 | 3.5% |
Commute Time by Sex in Burlington
The most common commute times in Burlington are 10 to 14 minutes (503 commuters, 22.4%) for males and 10 to 14 minutes (459 commuters, 23.0%) for females.
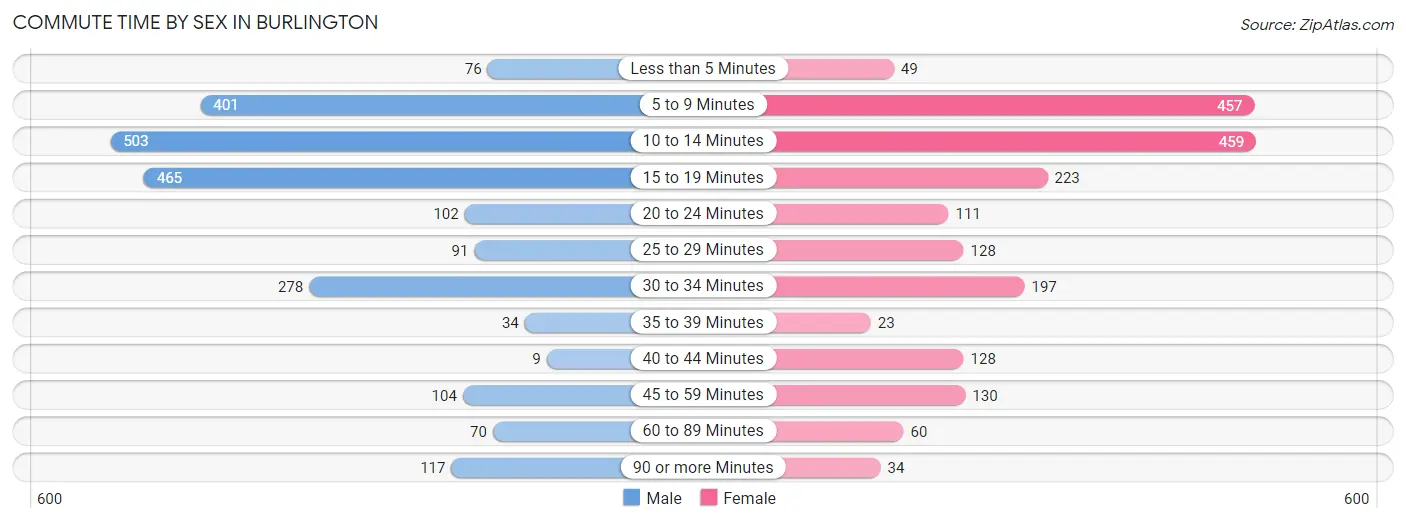
| Commute Time | Male | Female |
| Less than 5 Minutes | 76 (3.4%) | 49 (2.5%) |
| 5 to 9 Minutes | 401 (17.8%) | 457 (22.9%) |
| 10 to 14 Minutes | 503 (22.4%) | 459 (23.0%) |
| 15 to 19 Minutes | 465 (20.7%) | 223 (11.2%) |
| 20 to 24 Minutes | 102 (4.5%) | 111 (5.6%) |
| 25 to 29 Minutes | 91 (4.0%) | 128 (6.4%) |
| 30 to 34 Minutes | 278 (12.4%) | 197 (9.9%) |
| 35 to 39 Minutes | 34 (1.5%) | 23 (1.1%) |
| 40 to 44 Minutes | 9 (0.4%) | 128 (6.4%) |
| 45 to 59 Minutes | 104 (4.6%) | 130 (6.5%) |
| 60 to 89 Minutes | 70 (3.1%) | 60 (3.0%) |
| 90 or more Minutes | 117 (5.2%) | 34 (1.7%) |
Time of Departure to Work by Sex in Burlington
The most frequent times of departure to work in Burlington are 6:00 AM to 6:29 AM (468, 20.8%) for males and 7:30 AM to 7:59 AM (316, 15.8%) for females.
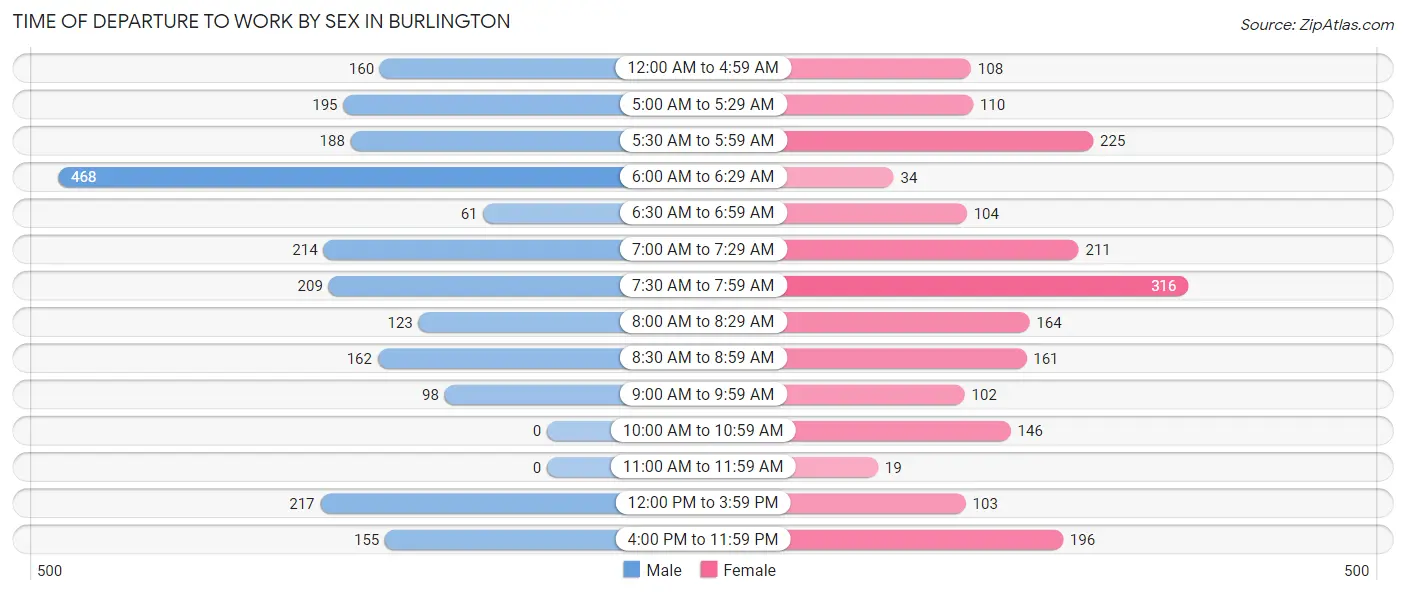
| Time of Departure | Male | Female |
| 12:00 AM to 4:59 AM | 160 (7.1%) | 108 (5.4%) |
| 5:00 AM to 5:29 AM | 195 (8.7%) | 110 (5.5%) |
| 5:30 AM to 5:59 AM | 188 (8.4%) | 225 (11.3%) |
| 6:00 AM to 6:29 AM | 468 (20.8%) | 34 (1.7%) |
| 6:30 AM to 6:59 AM | 61 (2.7%) | 104 (5.2%) |
| 7:00 AM to 7:29 AM | 214 (9.5%) | 211 (10.6%) |
| 7:30 AM to 7:59 AM | 209 (9.3%) | 316 (15.8%) |
| 8:00 AM to 8:29 AM | 123 (5.5%) | 164 (8.2%) |
| 8:30 AM to 8:59 AM | 162 (7.2%) | 161 (8.1%) |
| 9:00 AM to 9:59 AM | 98 (4.4%) | 102 (5.1%) |
| 10:00 AM to 10:59 AM | 0 (0.0%) | 146 (7.3%) |
| 11:00 AM to 11:59 AM | 0 (0.0%) | 19 (0.9%) |
| 12:00 PM to 3:59 PM | 217 (9.6%) | 103 (5.1%) |
| 4:00 PM to 11:59 PM | 155 (6.9%) | 196 (9.8%) |
| Total | 2,250 (100.0%) | 1,999 (100.0%) |
Housing Occupancy in Burlington
Occupancy by Ownership in Burlington
Of the total 3,850 dwellings in Burlington, owner-occupied units account for 1,822 (47.3%), while renter-occupied units make up 2,028 (52.7%).
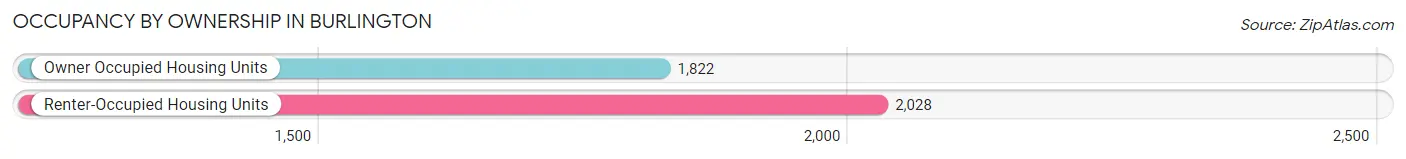
| Occupancy | # Housing Units | % Housing Units |
| Owner Occupied Housing Units | 1,822 | 47.3% |
| Renter-Occupied Housing Units | 2,028 | 52.7% |
| Total Occupied Housing Units | 3,850 | 100.0% |
Occupancy by Household Size in Burlington
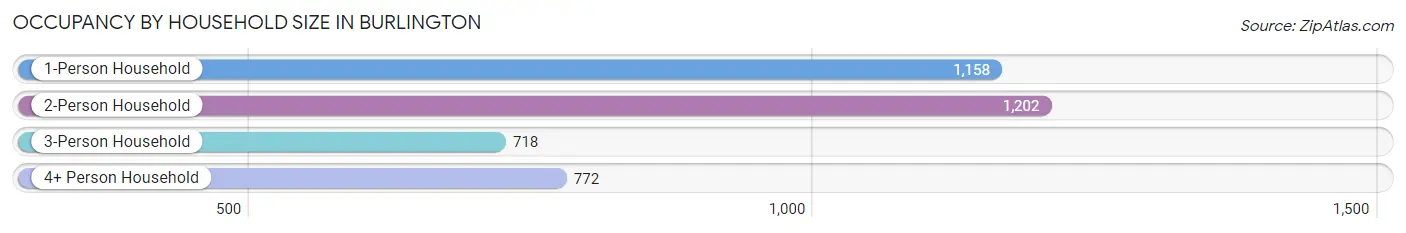
| Household Size | # Housing Units | % Housing Units |
| 1-Person Household | 1,158 | 30.1% |
| 2-Person Household | 1,202 | 31.2% |
| 3-Person Household | 718 | 18.6% |
| 4+ Person Household | 772 | 20.1% |
| Total Housing Units | 3,850 | 100.0% |
Occupancy by Ownership by Household Size in Burlington
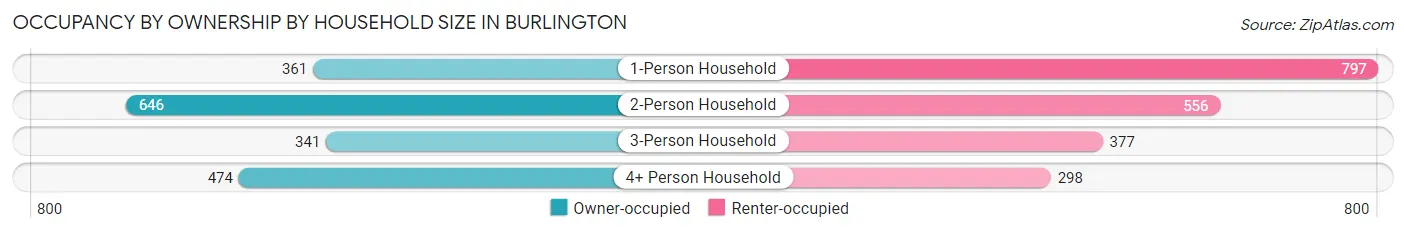
| Household Size | Owner-occupied | Renter-occupied |
| 1-Person Household | 361 (31.2%) | 797 (68.8%) |
| 2-Person Household | 646 (53.7%) | 556 (46.3%) |
| 3-Person Household | 341 (47.5%) | 377 (52.5%) |
| 4+ Person Household | 474 (61.4%) | 298 (38.6%) |
| Total Housing Units | 1,822 (47.3%) | 2,028 (52.7%) |
Occupancy by Educational Attainment in Burlington
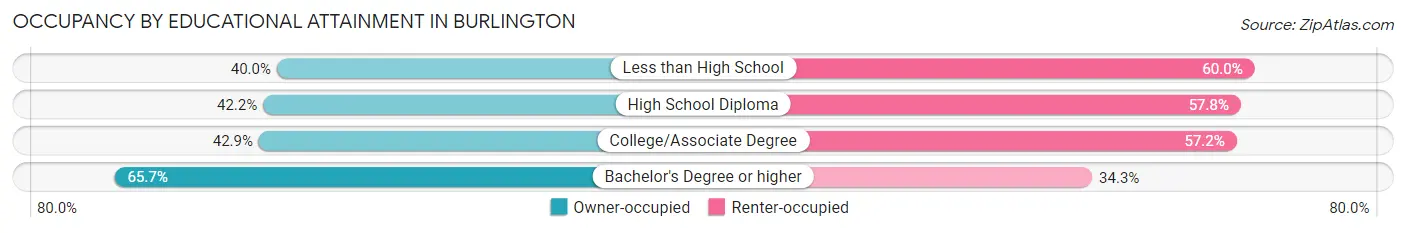
| Household Size | Owner-occupied | Renter-occupied |
| Less than High School | 100 (40.0%) | 150 (60.0%) |
| High School Diploma | 564 (42.2%) | 773 (57.8%) |
| College/Associate Degree | 617 (42.8%) | 823 (57.2%) |
| Bachelor's Degree or higher | 541 (65.7%) | 282 (34.3%) |
Occupancy by Age of Householder in Burlington
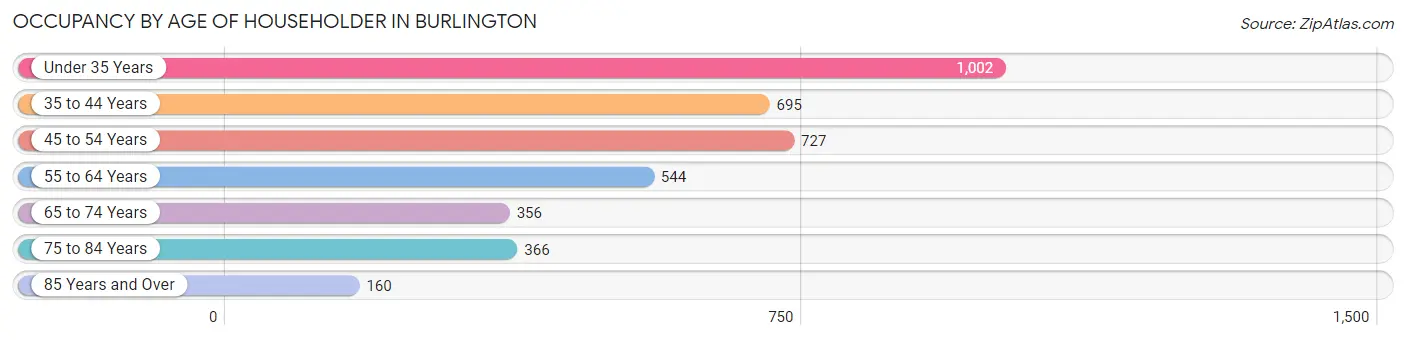
| Age Bracket | # Households | % Households |
| Under 35 Years | 1,002 | 26.0% |
| 35 to 44 Years | 695 | 18.0% |
| 45 to 54 Years | 727 | 18.9% |
| 55 to 64 Years | 544 | 14.1% |
| 65 to 74 Years | 356 | 9.2% |
| 75 to 84 Years | 366 | 9.5% |
| 85 Years and Over | 160 | 4.2% |
| Total | 3,850 | 100.0% |
Housing Finances in Burlington
Median Income by Occupancy in Burlington
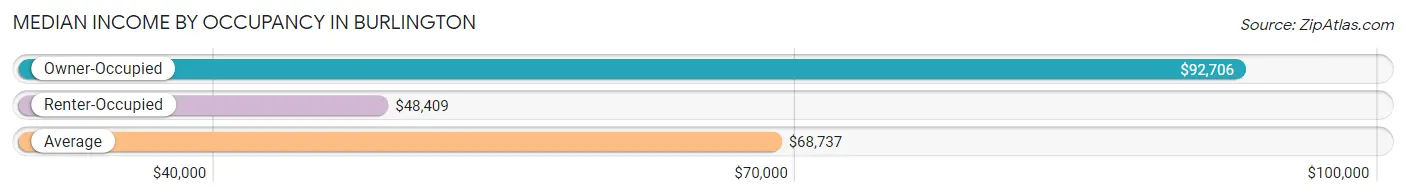
| Occupancy Type | # Households | Median Income |
| Owner-Occupied | 1,822 (47.3%) | $92,706 |
| Renter-Occupied | 2,028 (52.7%) | $48,409 |
| Average | 3,850 (100.0%) | $68,737 |
Occupancy by Householder Income Bracket in Burlington
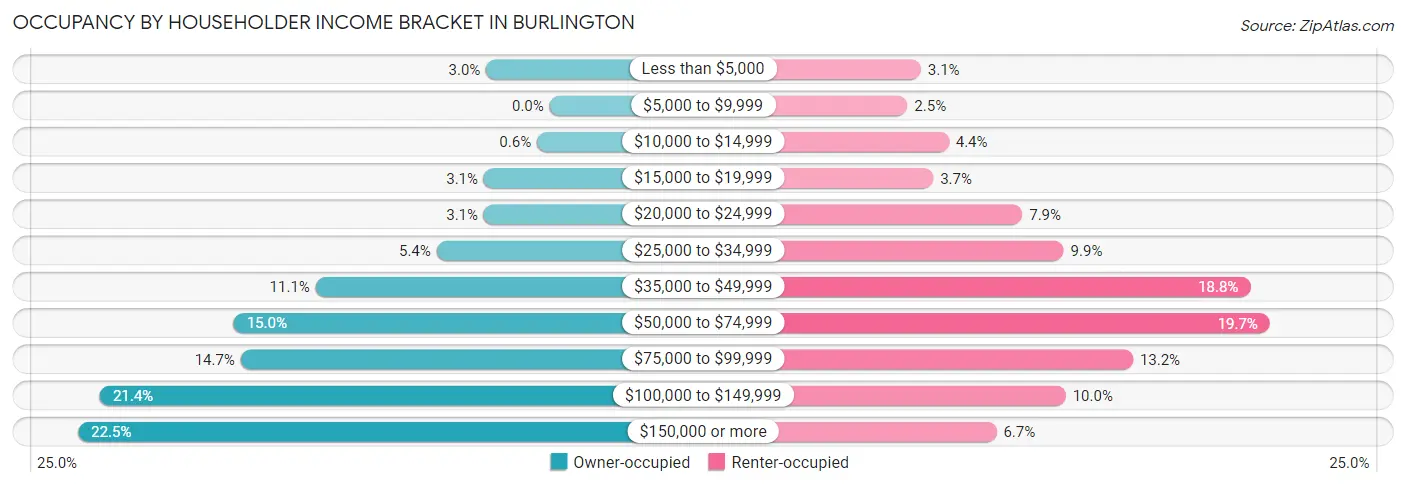
| Income Bracket | Owner-occupied | Renter-occupied |
| Less than $5,000 | 55 (3.0%) | 63 (3.1%) |
| $5,000 to $9,999 | 0 (0.0%) | 50 (2.5%) |
| $10,000 to $14,999 | 11 (0.6%) | 90 (4.4%) |
| $15,000 to $19,999 | 57 (3.1%) | 75 (3.7%) |
| $20,000 to $24,999 | 57 (3.1%) | 161 (7.9%) |
| $25,000 to $34,999 | 98 (5.4%) | 201 (9.9%) |
| $35,000 to $49,999 | 203 (11.1%) | 381 (18.8%) |
| $50,000 to $74,999 | 274 (15.0%) | 400 (19.7%) |
| $75,000 to $99,999 | 268 (14.7%) | 268 (13.2%) |
| $100,000 to $149,999 | 390 (21.4%) | 203 (10.0%) |
| $150,000 or more | 409 (22.5%) | 136 (6.7%) |
| Total | 1,822 (100.0%) | 2,028 (100.0%) |
Monthly Housing Cost Tiers in Burlington
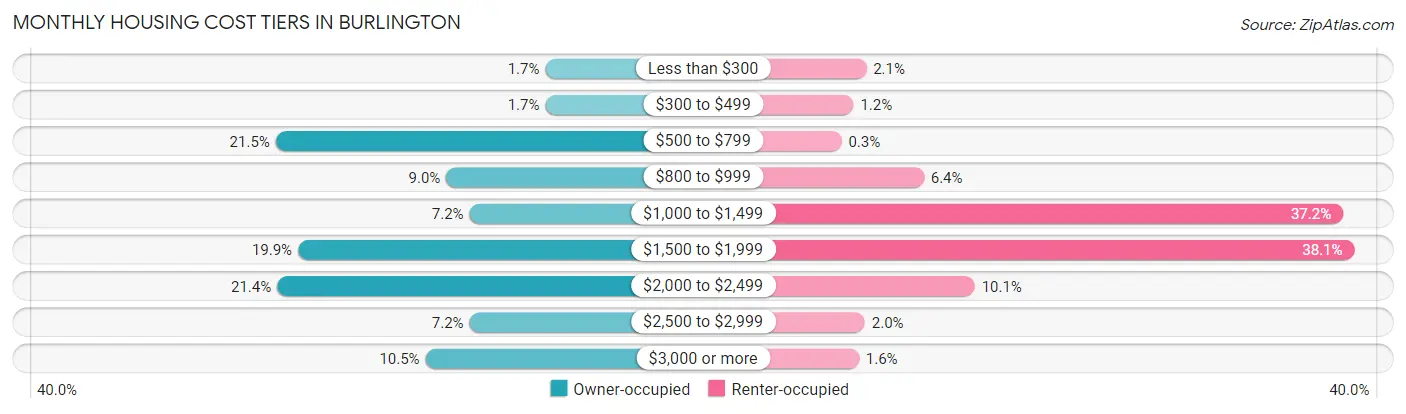
| Monthly Cost | Owner-occupied | Renter-occupied |
| Less than $300 | 30 (1.7%) | 43 (2.1%) |
| $300 to $499 | 30 (1.7%) | 24 (1.2%) |
| $500 to $799 | 392 (21.5%) | 6 (0.3%) |
| $800 to $999 | 163 (8.9%) | 129 (6.4%) |
| $1,000 to $1,499 | 132 (7.2%) | 755 (37.2%) |
| $1,500 to $1,999 | 362 (19.9%) | 772 (38.1%) |
| $2,000 to $2,499 | 390 (21.4%) | 205 (10.1%) |
| $2,500 to $2,999 | 132 (7.2%) | 41 (2.0%) |
| $3,000 or more | 191 (10.5%) | 32 (1.6%) |
| Total | 1,822 (100.0%) | 2,028 (100.0%) |
Physical Housing Characteristics in Burlington
Housing Structures in Burlington
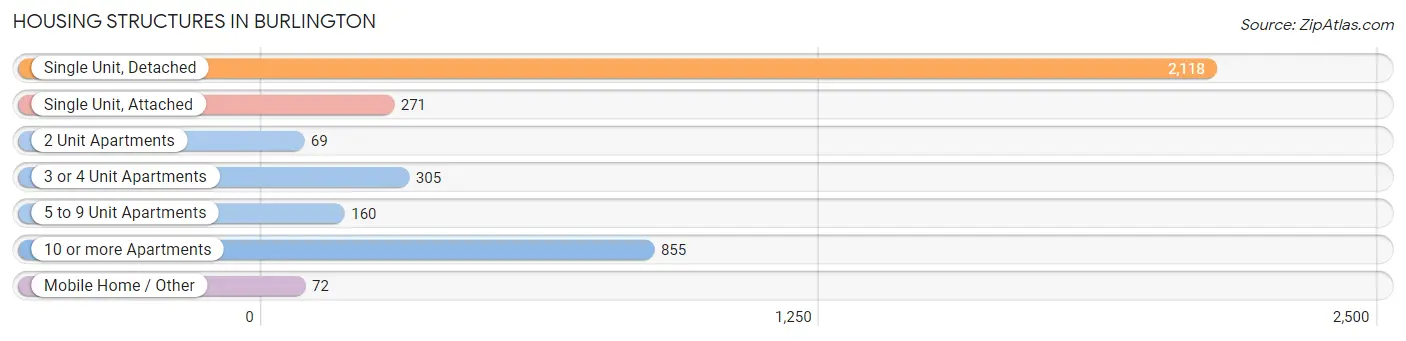
| Structure Type | # Housing Units | % Housing Units |
| Single Unit, Detached | 2,118 | 55.0% |
| Single Unit, Attached | 271 | 7.0% |
| 2 Unit Apartments | 69 | 1.8% |
| 3 or 4 Unit Apartments | 305 | 7.9% |
| 5 to 9 Unit Apartments | 160 | 4.2% |
| 10 or more Apartments | 855 | 22.2% |
| Mobile Home / Other | 72 | 1.9% |
| Total | 3,850 | 100.0% |
Housing Structures by Occupancy in Burlington
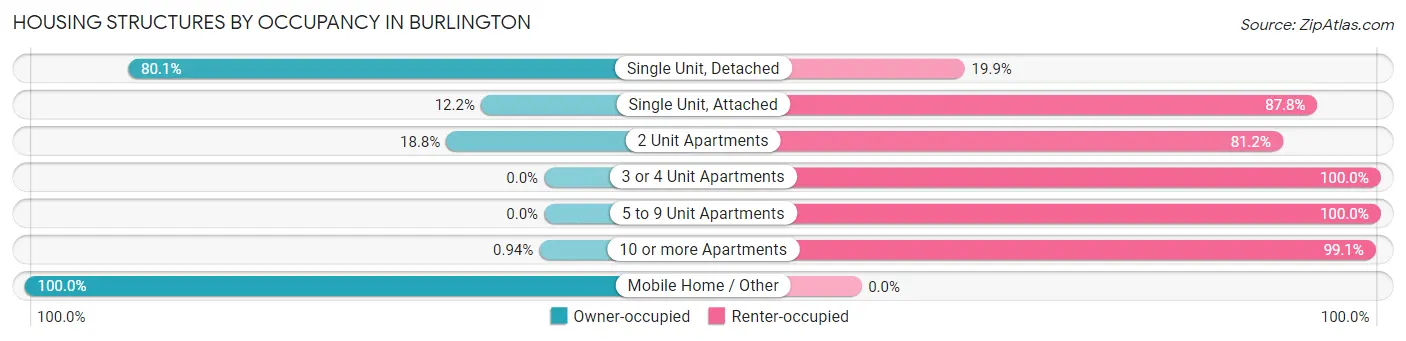
| Structure Type | Owner-occupied | Renter-occupied |
| Single Unit, Detached | 1,696 (80.1%) | 422 (19.9%) |
| Single Unit, Attached | 33 (12.2%) | 238 (87.8%) |
| 2 Unit Apartments | 13 (18.8%) | 56 (81.2%) |
| 3 or 4 Unit Apartments | 0 (0.0%) | 305 (100.0%) |
| 5 to 9 Unit Apartments | 0 (0.0%) | 160 (100.0%) |
| 10 or more Apartments | 8 (0.9%) | 847 (99.1%) |
| Mobile Home / Other | 72 (100.0%) | 0 (0.0%) |
| Total | 1,822 (47.3%) | 2,028 (52.7%) |
Housing Structures by Number of Rooms in Burlington
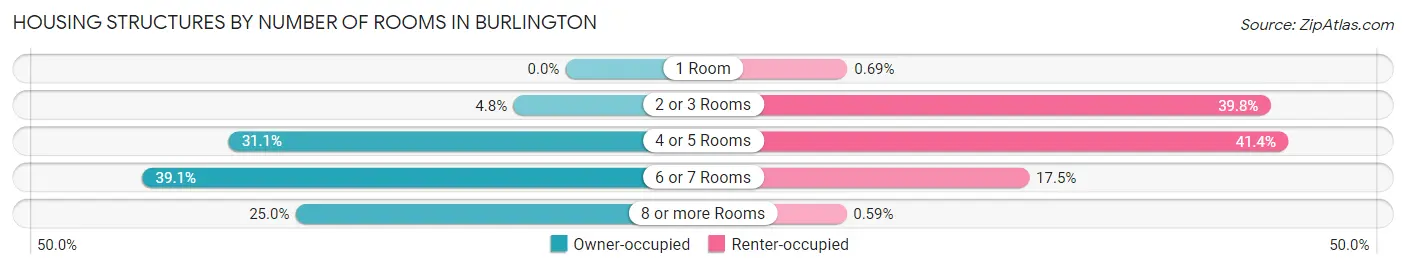
| Number of Rooms | Owner-occupied | Renter-occupied |
| 1 Room | 0 (0.0%) | 14 (0.7%) |
| 2 or 3 Rooms | 88 (4.8%) | 807 (39.8%) |
| 4 or 5 Rooms | 567 (31.1%) | 840 (41.4%) |
| 6 or 7 Rooms | 712 (39.1%) | 355 (17.5%) |
| 8 or more Rooms | 455 (25.0%) | 12 (0.6%) |
| Total | 1,822 (100.0%) | 2,028 (100.0%) |
Housing Structure by Heating Type in Burlington
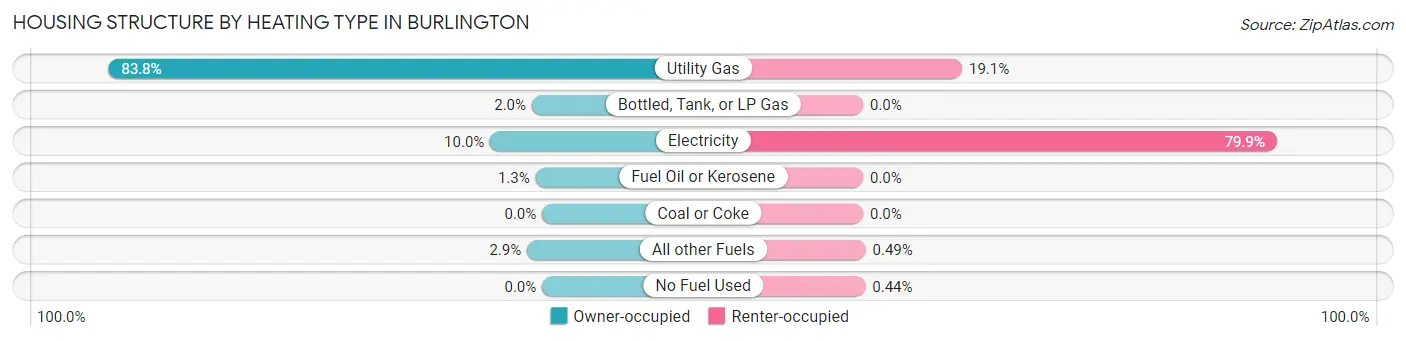
| Heating Type | Owner-occupied | Renter-occupied |
| Utility Gas | 1,527 (83.8%) | 388 (19.1%) |
| Bottled, Tank, or LP Gas | 36 (2.0%) | 0 (0.0%) |
| Electricity | 183 (10.0%) | 1,621 (79.9%) |
| Fuel Oil or Kerosene | 23 (1.3%) | 0 (0.0%) |
| Coal or Coke | 0 (0.0%) | 0 (0.0%) |
| All other Fuels | 53 (2.9%) | 10 (0.5%) |
| No Fuel Used | 0 (0.0%) | 9 (0.4%) |
| Total | 1,822 (100.0%) | 2,028 (100.0%) |
Household Vehicle Usage in Burlington
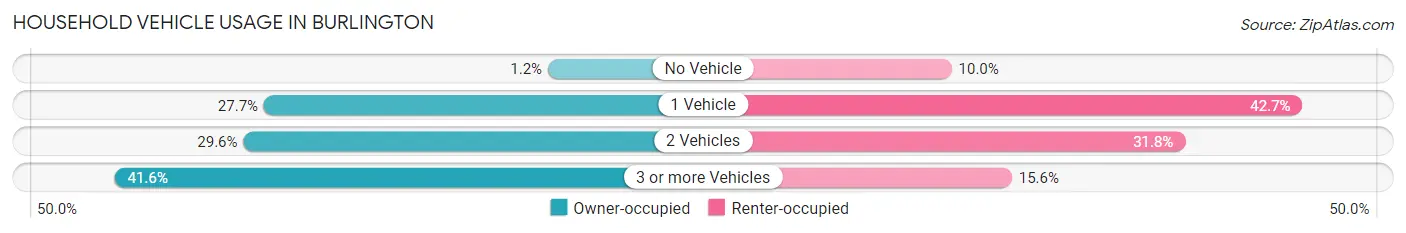
| Vehicles per Household | Owner-occupied | Renter-occupied |
| No Vehicle | 21 (1.1%) | 202 (10.0%) |
| 1 Vehicle | 504 (27.7%) | 866 (42.7%) |
| 2 Vehicles | 539 (29.6%) | 644 (31.8%) |
| 3 or more Vehicles | 758 (41.6%) | 316 (15.6%) |
| Total | 1,822 (100.0%) | 2,028 (100.0%) |
Real Estate & Mortgages in Burlington
Real Estate and Mortgage Overview in Burlington
| Characteristic | Without Mortgage | With Mortgage |
| Housing Units | 516 | 1,306 |
| Median Property Value | $393,300 | $398,000 |
| Median Household Income | $50,500 | $383 |
| Monthly Housing Costs | $681 | $191 |
| Real Estate Taxes | $3,356 | $42 |
Property Value by Mortgage Status in Burlington
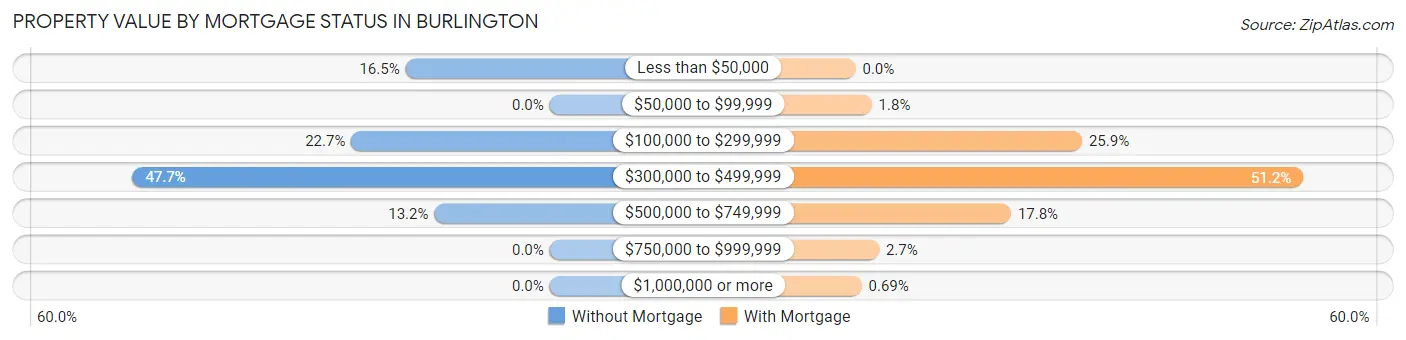
| Property Value | Without Mortgage | With Mortgage |
| Less than $50,000 | 85 (16.5%) | 0 (0.0%) |
| $50,000 to $99,999 | 0 (0.0%) | 24 (1.8%) |
| $100,000 to $299,999 | 117 (22.7%) | 338 (25.9%) |
| $300,000 to $499,999 | 246 (47.7%) | 668 (51.1%) |
| $500,000 to $749,999 | 68 (13.2%) | 232 (17.8%) |
| $750,000 to $999,999 | 0 (0.0%) | 35 (2.7%) |
| $1,000,000 or more | 0 (0.0%) | 9 (0.7%) |
| Total | 516 (100.0%) | 1,306 (100.0%) |
Household Income by Mortgage Status in Burlington
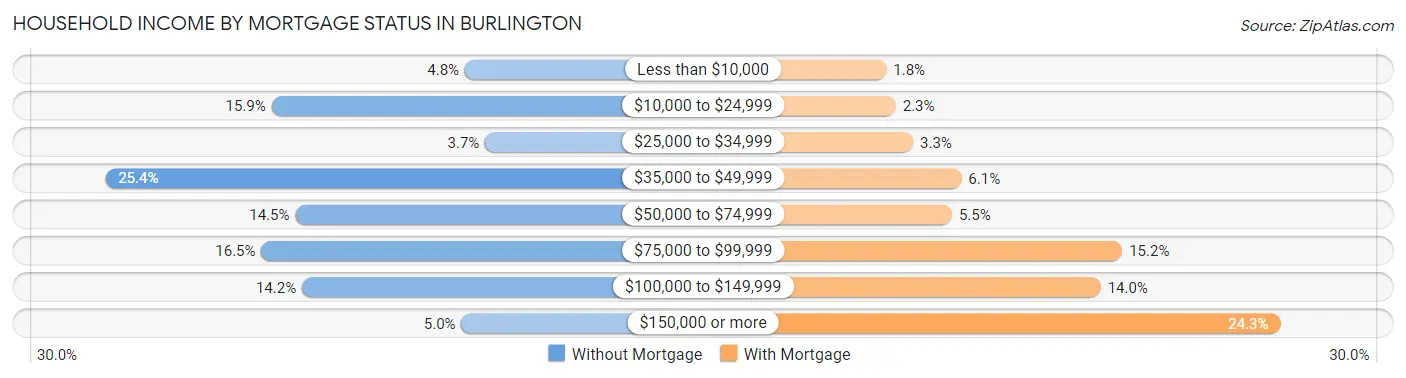
| Household Income | Without Mortgage | With Mortgage |
| Less than $10,000 | 25 (4.8%) | 23 (1.8%) |
| $10,000 to $24,999 | 82 (15.9%) | 30 (2.3%) |
| $25,000 to $34,999 | 19 (3.7%) | 43 (3.3%) |
| $35,000 to $49,999 | 131 (25.4%) | 79 (6.0%) |
| $50,000 to $74,999 | 75 (14.5%) | 72 (5.5%) |
| $75,000 to $99,999 | 85 (16.5%) | 199 (15.2%) |
| $100,000 to $149,999 | 73 (14.1%) | 183 (14.0%) |
| $150,000 or more | 26 (5.0%) | 317 (24.3%) |
| Total | 516 (100.0%) | 1,306 (100.0%) |
Property Value to Household Income Ratio in Burlington
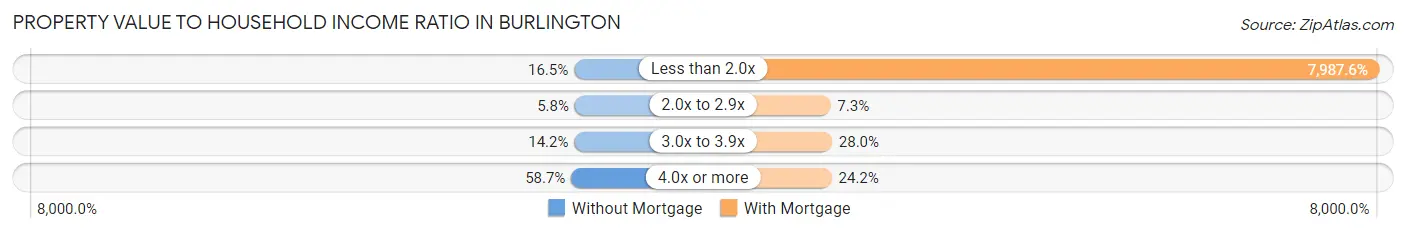
| Value-to-Income Ratio | Without Mortgage | With Mortgage |
| Less than 2.0x | 85 (16.5%) | 104,318 (7,987.6%) |
| 2.0x to 2.9x | 30 (5.8%) | 95 (7.3%) |
| 3.0x to 3.9x | 73 (14.1%) | 365 (28.0%) |
| 4.0x or more | 303 (58.7%) | 316 (24.2%) |
| Total | 516 (100.0%) | 1,306 (100.0%) |
Real Estate Taxes by Mortgage Status in Burlington
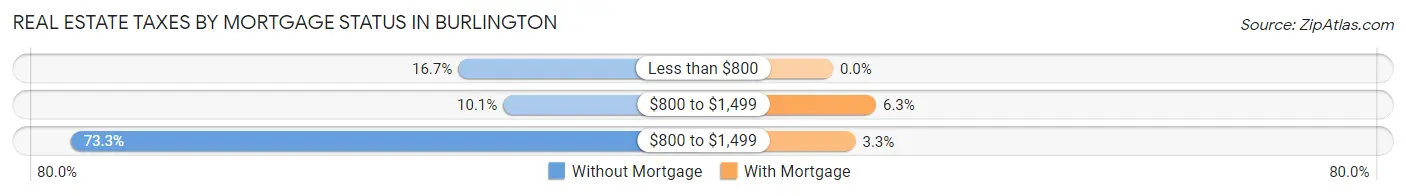
| Property Taxes | Without Mortgage | With Mortgage |
| Less than $800 | 86 (16.7%) | 0 (0.0%) |
| $800 to $1,499 | 52 (10.1%) | 82 (6.3%) |
| $800 to $1,499 | 378 (73.3%) | 43 (3.3%) |
| Total | 516 (100.0%) | 1,306 (100.0%) |
Health & Disability in Burlington
Health Insurance Coverage by Age in Burlington
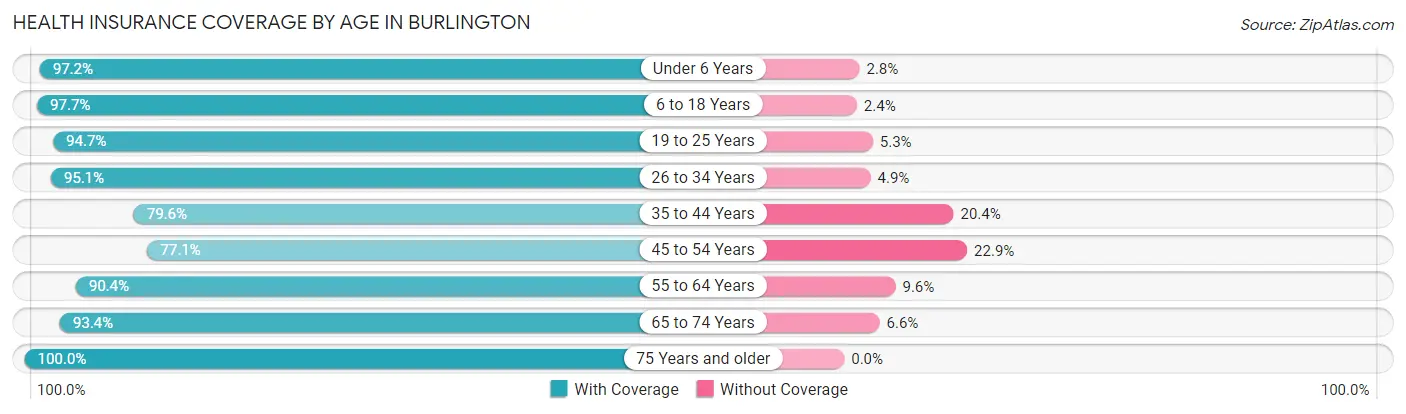
| Age Bracket | With Coverage | Without Coverage |
| Under 6 Years | 444 (97.2%) | 13 (2.8%) |
| 6 to 18 Years | 1,707 (97.7%) | 41 (2.4%) |
| 19 to 25 Years | 905 (94.7%) | 51 (5.3%) |
| 26 to 34 Years | 989 (95.1%) | 51 (4.9%) |
| 35 to 44 Years | 1,286 (79.6%) | 329 (20.4%) |
| 45 to 54 Years | 801 (77.1%) | 238 (22.9%) |
| 55 to 64 Years | 814 (90.4%) | 86 (9.6%) |
| 65 to 74 Years | 610 (93.4%) | 43 (6.6%) |
| 75 Years and older | 752 (100.0%) | 0 (0.0%) |
| Total | 8,308 (90.7%) | 852 (9.3%) |
Health Insurance Coverage by Citizenship Status in Burlington
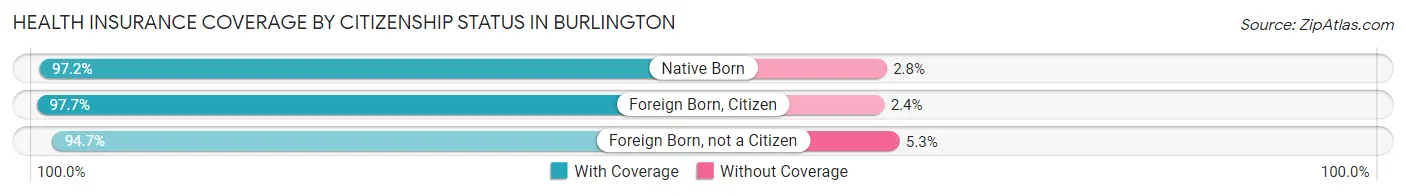
| Citizenship Status | With Coverage | Without Coverage |
| Native Born | 444 (97.2%) | 13 (2.8%) |
| Foreign Born, Citizen | 1,707 (97.7%) | 41 (2.4%) |
| Foreign Born, not a Citizen | 905 (94.7%) | 51 (5.3%) |
Health Insurance Coverage by Household Income in Burlington
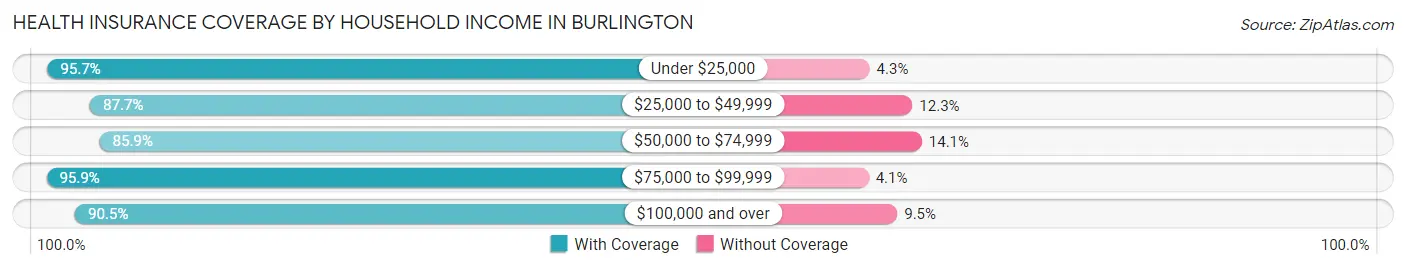
| Household Income | With Coverage | Without Coverage |
| Under $25,000 | 917 (95.7%) | 41 (4.3%) |
| $25,000 to $49,999 | 1,327 (87.7%) | 186 (12.3%) |
| $50,000 to $74,999 | 1,278 (85.9%) | 209 (14.1%) |
| $75,000 to $99,999 | 1,333 (95.9%) | 57 (4.1%) |
| $100,000 and over | 3,416 (90.5%) | 357 (9.5%) |
Public vs Private Health Insurance Coverage by Age in Burlington
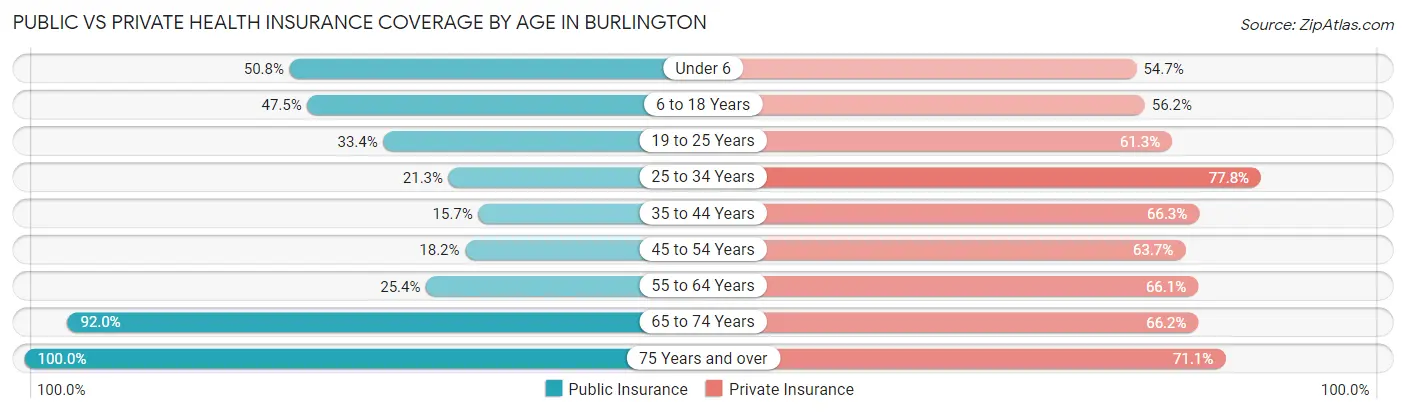
| Age Bracket | Public Insurance | Private Insurance |
| Under 6 | 232 (50.8%) | 250 (54.7%) |
| 6 to 18 Years | 830 (47.5%) | 983 (56.2%) |
| 19 to 25 Years | 319 (33.4%) | 586 (61.3%) |
| 25 to 34 Years | 221 (21.2%) | 809 (77.8%) |
| 35 to 44 Years | 254 (15.7%) | 1,071 (66.3%) |
| 45 to 54 Years | 189 (18.2%) | 662 (63.7%) |
| 55 to 64 Years | 229 (25.4%) | 595 (66.1%) |
| 65 to 74 Years | 601 (92.0%) | 432 (66.2%) |
| 75 Years and over | 752 (100.0%) | 535 (71.1%) |
| Total | 3,627 (39.6%) | 5,923 (64.7%) |
Disability Status by Sex by Age in Burlington
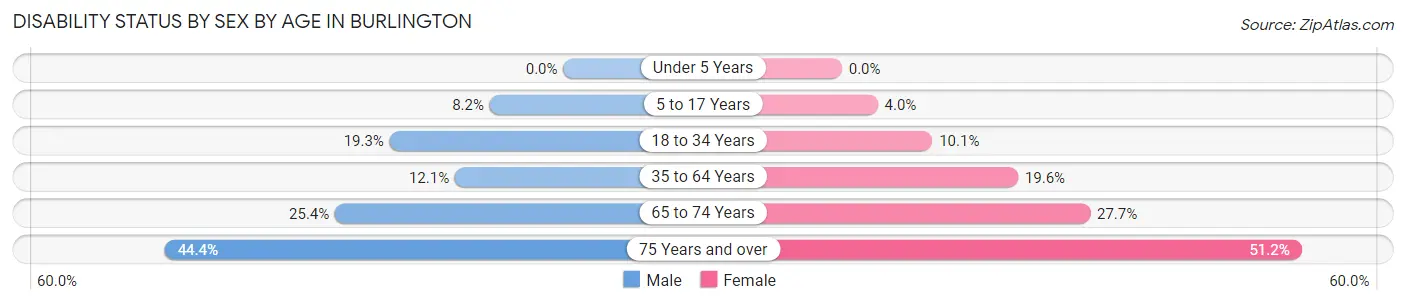
| Age Bracket | Male | Female |
| Under 5 Years | 0 (0.0%) | 0 (0.0%) |
| 5 to 17 Years | 61 (8.2%) | 38 (4.0%) |
| 18 to 34 Years | 177 (19.3%) | 123 (10.1%) |
| 35 to 64 Years | 221 (12.1%) | 338 (19.6%) |
| 65 to 74 Years | 75 (25.4%) | 99 (27.7%) |
| 75 Years and over | 91 (44.4%) | 280 (51.2%) |
Disability Class by Sex by Age in Burlington
Disability Class: Hearing Difficulty
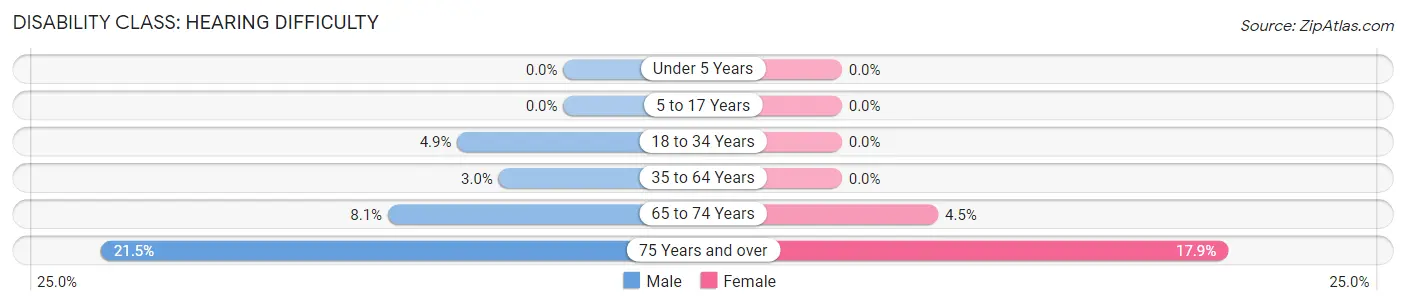
| Age Bracket | Male | Female |
| Under 5 Years | 0 (0.0%) | 0 (0.0%) |
| 5 to 17 Years | 0 (0.0%) | 0 (0.0%) |
| 18 to 34 Years | 45 (4.9%) | 0 (0.0%) |
| 35 to 64 Years | 55 (3.0%) | 0 (0.0%) |
| 65 to 74 Years | 24 (8.1%) | 16 (4.5%) |
| 75 Years and over | 44 (21.5%) | 98 (17.9%) |
Disability Class: Vision Difficulty
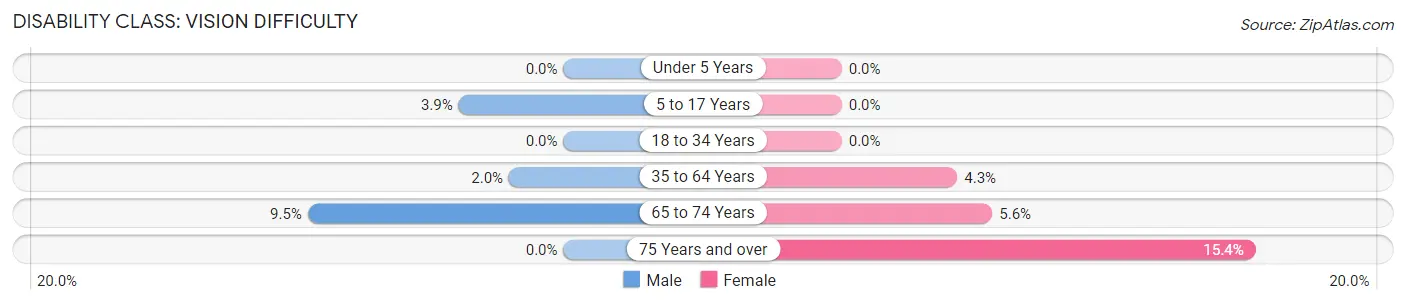
| Age Bracket | Male | Female |
| Under 5 Years | 0 (0.0%) | 0 (0.0%) |
| 5 to 17 Years | 29 (3.9%) | 0 (0.0%) |
| 18 to 34 Years | 0 (0.0%) | 0 (0.0%) |
| 35 to 64 Years | 37 (2.0%) | 74 (4.3%) |
| 65 to 74 Years | 28 (9.5%) | 20 (5.6%) |
| 75 Years and over | 0 (0.0%) | 84 (15.4%) |
Disability Class: Cognitive Difficulty
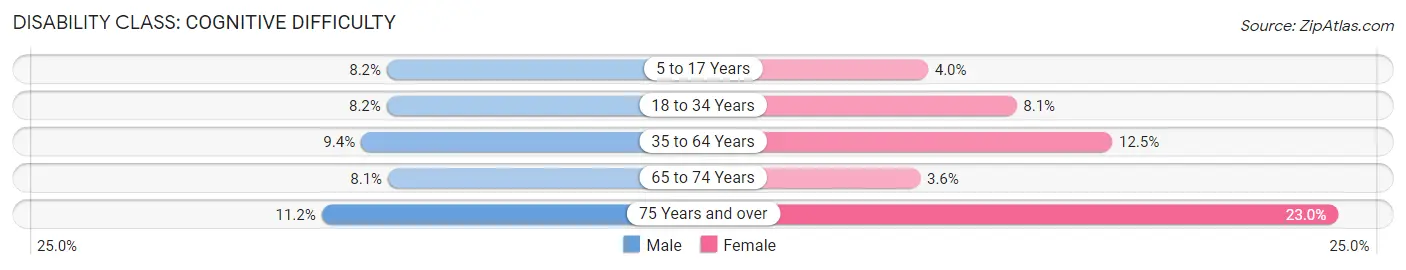
| Age Bracket | Male | Female |
| 5 to 17 Years | 61 (8.2%) | 38 (4.0%) |
| 18 to 34 Years | 75 (8.2%) | 99 (8.1%) |
| 35 to 64 Years | 172 (9.4%) | 216 (12.5%) |
| 65 to 74 Years | 24 (8.1%) | 13 (3.6%) |
| 75 Years and over | 23 (11.2%) | 126 (23.0%) |
Disability Class: Ambulatory Difficulty
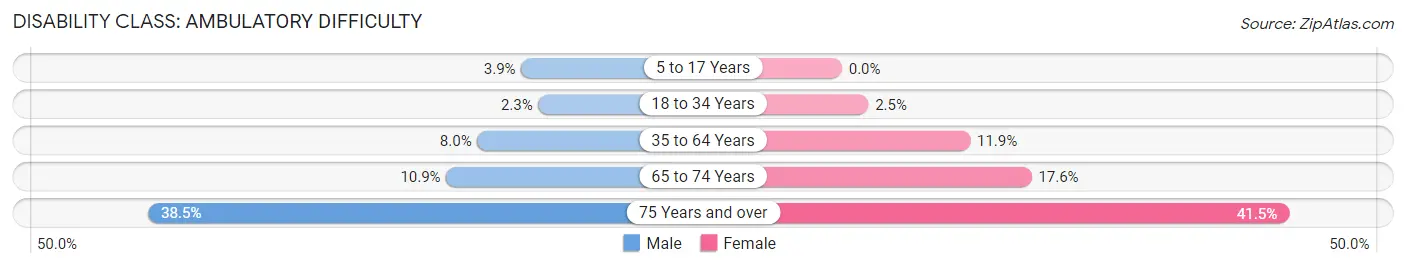
| Age Bracket | Male | Female |
| 5 to 17 Years | 29 (3.9%) | 0 (0.0%) |
| 18 to 34 Years | 21 (2.3%) | 30 (2.5%) |
| 35 to 64 Years | 146 (8.0%) | 205 (11.9%) |
| 65 to 74 Years | 32 (10.8%) | 63 (17.6%) |
| 75 Years and over | 79 (38.5%) | 227 (41.5%) |
Disability Class: Self-Care Difficulty
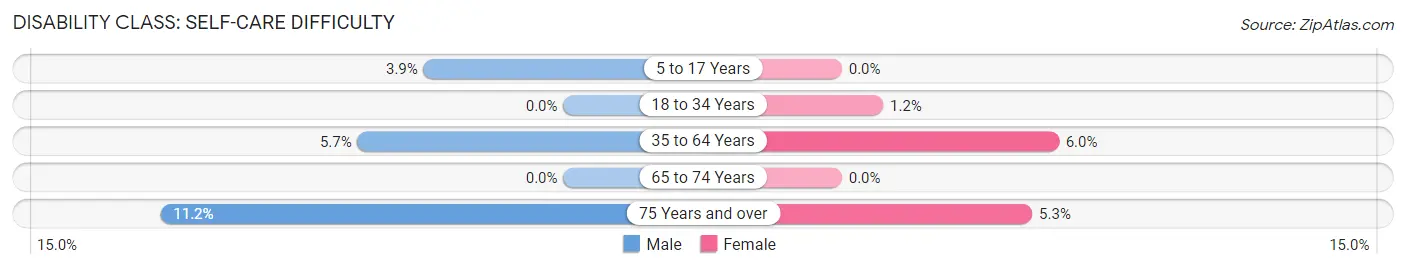
| Age Bracket | Male | Female |
| 5 to 17 Years | 29 (3.9%) | 0 (0.0%) |
| 18 to 34 Years | 0 (0.0%) | 14 (1.1%) |
| 35 to 64 Years | 105 (5.7%) | 104 (6.0%) |
| 65 to 74 Years | 0 (0.0%) | 0 (0.0%) |
| 75 Years and over | 23 (11.2%) | 29 (5.3%) |
Technology Access in Burlington
Computing Device Access in Burlington
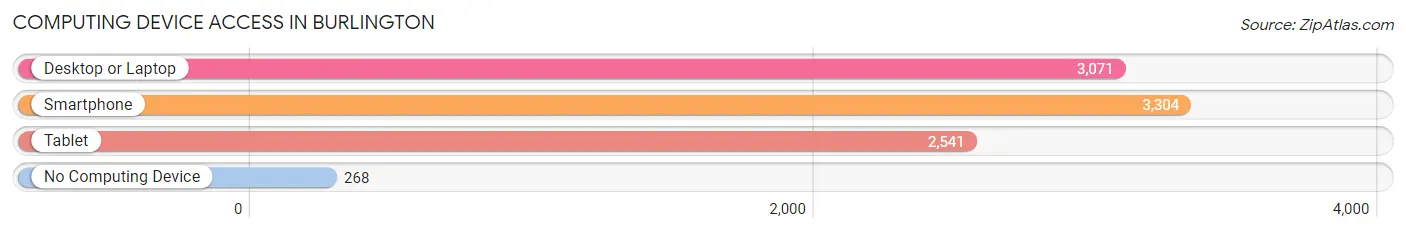
| Device Type | # Households | % Households |
| Desktop or Laptop | 3,071 | 79.8% |
| Smartphone | 3,304 | 85.8% |
| Tablet | 2,541 | 66.0% |
| No Computing Device | 268 | 7.0% |
| Total | 3,850 | 100.0% |
Internet Access in Burlington
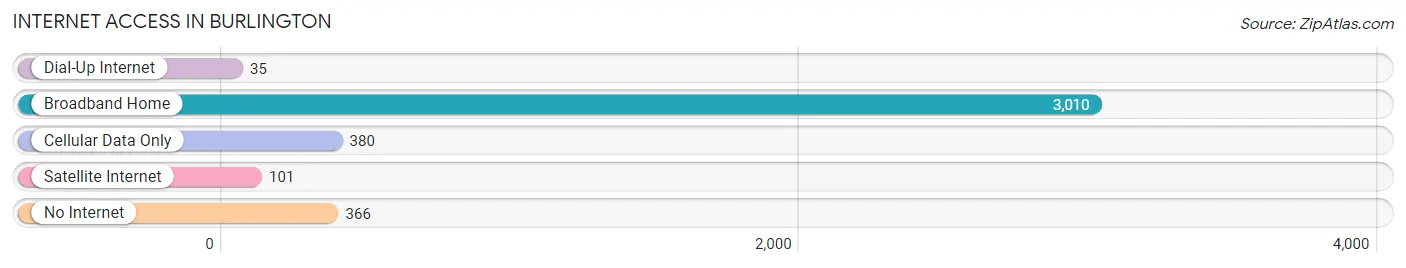
| Internet Type | # Households | % Households |
| Dial-Up Internet | 35 | 0.9% |
| Broadband Home | 3,010 | 78.2% |
| Cellular Data Only | 380 | 9.9% |
| Satellite Internet | 101 | 2.6% |
| No Internet | 366 | 9.5% |
| Total | 3,850 | 100.0% |
Burlington Summary
Burlington, Washington is a small city located in Skagit County, Washington, United States. It is situated on the banks of the Skagit River, approximately 50 miles north of Seattle. The city has a population of 8,388 as of the 2010 census, making it the largest city in Skagit County.
History
The area that is now Burlington was first settled in the late 1800s by settlers from the Midwest. The first permanent settlement was established in 1883 by a group of settlers from Iowa. The settlement was originally called "Skagit City" but was later renamed "Burlington" after Burlington, Iowa.
The city was officially incorporated in 1902 and quickly grew to become the largest city in Skagit County. The city was a major hub for the logging industry in the early 1900s and was home to several sawmills and lumber yards. The city also served as a major shipping port for the region, with goods being shipped to Seattle and other nearby cities.
The city experienced a period of decline in the mid-1900s as the logging industry declined and the population decreased. However, the city has since experienced a resurgence in recent years, with new businesses and development projects being established.
Geography
Burlington is located in Skagit County, Washington, approximately 50 miles north of Seattle. The city is situated on the banks of the Skagit River and is surrounded by the Cascade Mountains to the east and the Olympic Mountains to the west. The city has a total area of 4.3 square miles, all of which is land.
The climate in Burlington is mild and temperate, with warm summers and cool winters. The average annual temperature is around 50 degrees Fahrenheit. The city receives an average of 37 inches of precipitation per year, with most of it falling in the winter months.
Economy
The economy of Burlington is largely based on agriculture and tourism. The city is home to several farms and ranches, which produce a variety of crops and livestock. The city is also a popular tourist destination, with visitors coming to enjoy the city's natural beauty and outdoor activities.
The city is also home to several manufacturing and technology companies, including Boeing, Microsoft, and Amazon. These companies provide a significant number of jobs to the local economy.
Demographics
As of the 2010 census, the population of Burlington was 8,388. The racial makeup of the city was 87.3% White, 1.3% African American, 0.7% Native American, 2.2% Asian, 0.2% Pacific Islander, and 5.2% from other races. The median household income was $50,945 and the median family income was $60,945.
The city is home to several churches, including the First Presbyterian Church, the First Baptist Church, and the Church of Jesus Christ of Latter-day Saints. The city also has several schools, including Burlington-Edison High School, Burlington Elementary School, and Cascade Christian Academy.
Conclusion
Burlington, Washington is a small city located in Skagit County, Washington, United States. It is situated on the banks of the Skagit River, approximately 50 miles north of Seattle. The city has a population of 8,388 as of the 2010 census, making it the largest city in Skagit County. The economy of Burlington is largely based on agriculture and tourism, with several farms and ranches producing a variety of crops and livestock. The city is also home to several manufacturing and technology companies, providing a significant number of jobs to the local economy. The racial makeup of the city is 87.3% White, 1.3% African American, 0.7% Native American, 2.2% Asian, 0.2% Pacific Islander, and 5.2% from other races. The median household income was $50,945 and the median family income was $60,945.
Common Questions
What is Per Capita Income in Burlington?
Per Capita income in Burlington is $34,942.
What is the Median Family Income in Burlington?
Median Family Income in Burlington is $90,900.
What is the Median Household income in Burlington?
Median Household Income in Burlington is $68,737.
What is Income or Wage Gap in Burlington?
Income or Wage Gap in Burlington is 14.9%.
Women in Burlington earn 85.1 cents for every dollar earned by a man.
What is Inequality or Gini Index in Burlington?
Inequality or Gini Index in Burlington is 0.40.
What is the Total Population of Burlington?
Total Population of Burlington is 9,361.
What is the Total Male Population of Burlington?
Total Male Population of Burlington is 4,222.
What is the Total Female Population of Burlington?
Total Female Population of Burlington is 5,139.
What is the Ratio of Males per 100 Females in Burlington?
There are 82.16 Males per 100 Females in Burlington.
What is the Ratio of Females per 100 Males in Burlington?
There are 121.72 Females per 100 Males in Burlington.
What is the Median Population Age in Burlington?
Median Population Age in Burlington is 37.0 Years.
What is the Average Family Size in Burlington
Average Family Size in Burlington is 3.0 People.
What is the Average Household Size in Burlington
Average Household Size in Burlington is 2.4 People.
How Large is the Labor Force in Burlington?
There are 4,973 People in the Labor Forcein in Burlington.
What is the Percentage of People in the Labor Force in Burlington?
65.5% of People are in the Labor Force in Burlington.
What is the Unemployment Rate in Burlington?
Unemployment Rate in Burlington is 5.4%.