Latah, WA Map & Demographics
Latah Map
Latah Overview
$17,882
PER CAPITA INCOME
0.54
INEQUALITY / GINI INDEX
168
TOTAL POPULATION
100
MALE POPULATION
68
FEMALE POPULATION
147.06
MALES / 100 FEMALES
68.00
FEMALES / 100 MALES
40.0
MEDIAN AGE
2.8
AVG FAMILY SIZE
2.9
AVG HOUSEHOLD SIZE
47
LABOR FORCE [ PEOPLE ]
36.7%
PERCENT IN LABOR FORCE
Latah Zip Codes
Latah Area Codes
Income in Latah
Income Overview in Latah
| Characteristic | Number | Measure |
| Per Capita Income | 168 | $17,882 |
| Median Family Income | 37 | $0 |
| Mean Family Income | 37 | $58,041 |
| Median Household Income | 59 | $0 |
| Mean Household Income | 59 | $47,532 |
| Income Deficit | 37 | $0 |
| Wage / Income Gap (%) | 168 | 0.00% |
| Wage / Income Gap ($) | 168 | 100.00¢ per $1 |
| Gini / Inequality Index | 168 | 0.54 |
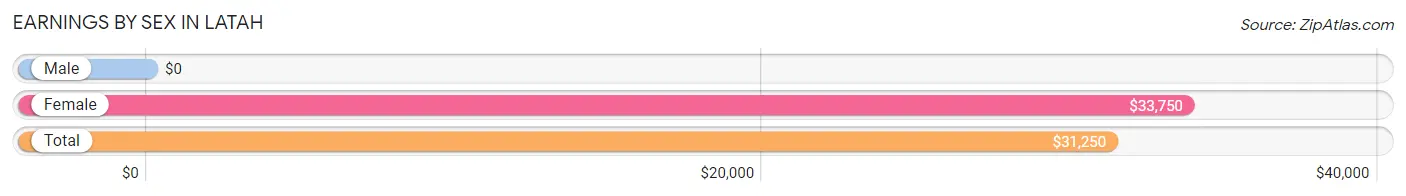
Earnings by Sex in Latah
| Sex | Number | Average Earnings |
| Male | 36 (69.2%) | $0 |
| Female | 16 (30.8%) | $33,750 |
| Total | 52 (100.0%) | $31,250 |
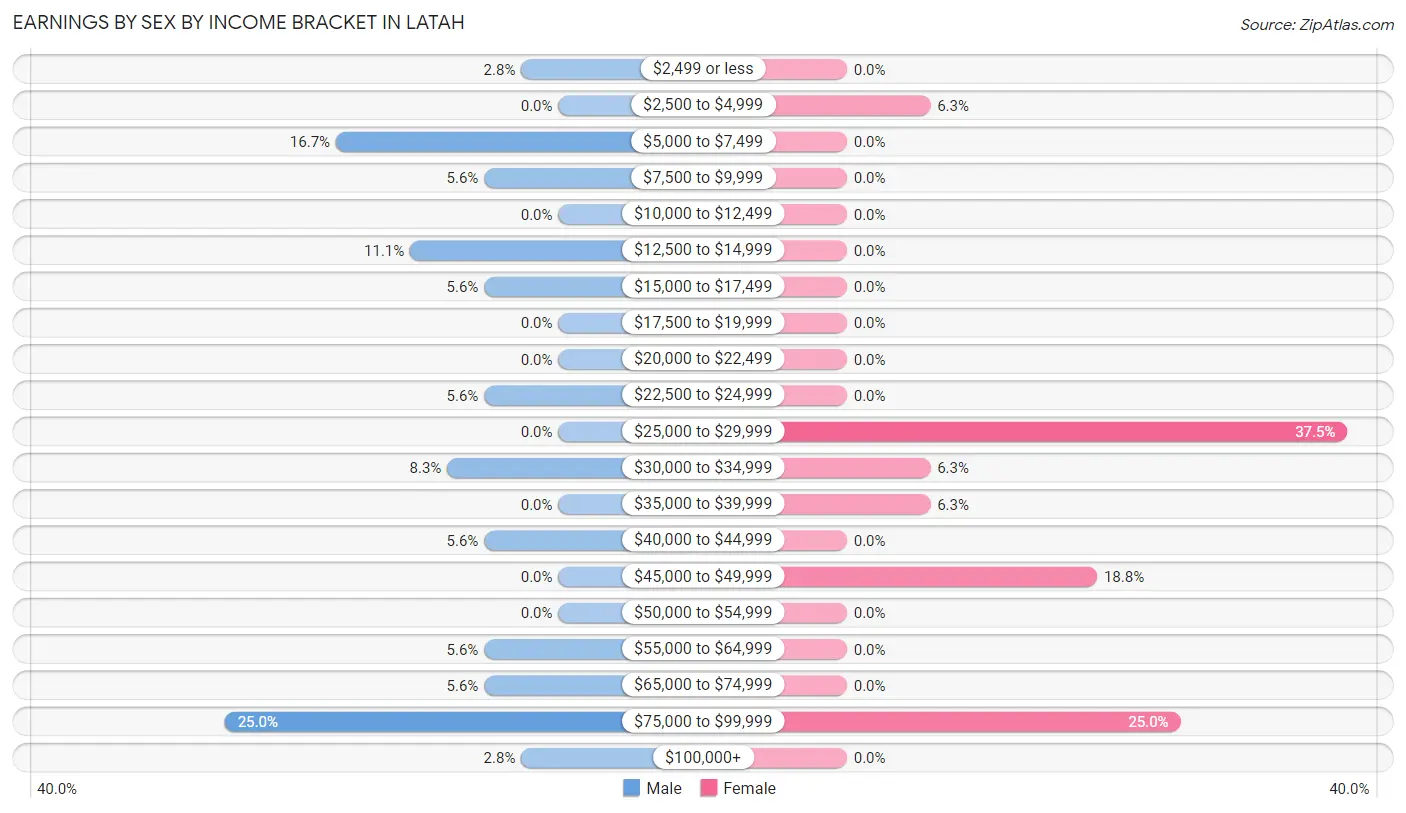
Earnings by Sex by Income Bracket in Latah
The most common earnings brackets in Latah are $75,000 to $99,999 for men (9 | 25.0%) and $25,000 to $29,999 for women (6 | 37.5%).
| Income | Male | Female |
| $2,499 or less | 1 (2.8%) | 0 (0.0%) |
| $2,500 to $4,999 | 0 (0.0%) | 1 (6.2%) |
| $5,000 to $7,499 | 6 (16.7%) | 0 (0.0%) |
| $7,500 to $9,999 | 2 (5.6%) | 0 (0.0%) |
| $10,000 to $12,499 | 0 (0.0%) | 0 (0.0%) |
| $12,500 to $14,999 | 4 (11.1%) | 0 (0.0%) |
| $15,000 to $17,499 | 2 (5.6%) | 0 (0.0%) |
| $17,500 to $19,999 | 0 (0.0%) | 0 (0.0%) |
| $20,000 to $22,499 | 0 (0.0%) | 0 (0.0%) |
| $22,500 to $24,999 | 2 (5.6%) | 0 (0.0%) |
| $25,000 to $29,999 | 0 (0.0%) | 6 (37.5%) |
| $30,000 to $34,999 | 3 (8.3%) | 1 (6.2%) |
| $35,000 to $39,999 | 0 (0.0%) | 1 (6.2%) |
| $40,000 to $44,999 | 2 (5.6%) | 0 (0.0%) |
| $45,000 to $49,999 | 0 (0.0%) | 3 (18.8%) |
| $50,000 to $54,999 | 0 (0.0%) | 0 (0.0%) |
| $55,000 to $64,999 | 2 (5.6%) | 0 (0.0%) |
| $65,000 to $74,999 | 2 (5.6%) | 0 (0.0%) |
| $75,000 to $99,999 | 9 (25.0%) | 4 (25.0%) |
| $100,000+ | 1 (2.8%) | 0 (0.0%) |
| Total | 36 (100.0%) | 16 (100.0%) |
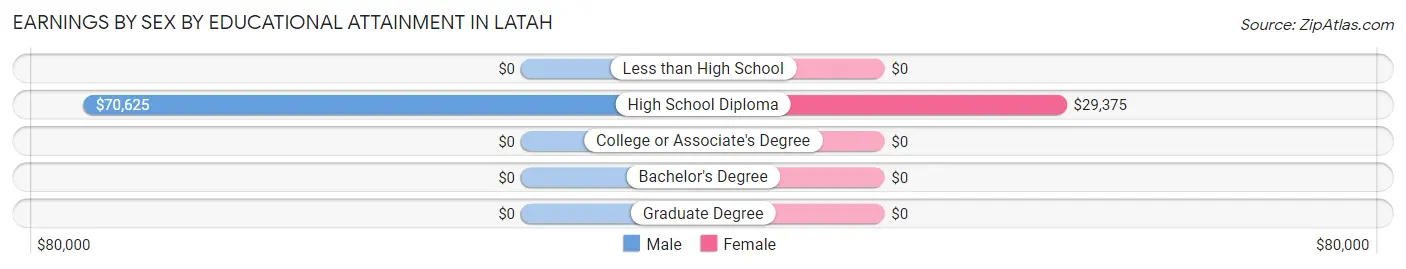
Earnings by Sex by Educational Attainment in Latah
Average earnings in Latah are $70,625 for men and $33,750 for women, a difference of 52.2%. Men with an educational attainment of high school diploma enjoy the highest average annual earnings of $70,625, while those with high school diploma education earn the least with $70,625. Women with an educational attainment of high school diploma earn the most with the average annual earnings of $29,375, while those with high school diploma education have the smallest earnings of $29,375.
| Educational Attainment | Male Income | Female Income |
| Less than High School | - | - |
| High School Diploma | $70,625 | $29,375 |
| College or Associate's Degree | - | - |
| Bachelor's Degree | - | - |
| Graduate Degree | - | - |
| Total | $70,625 | $33,750 |
Family Income in Latah
Family Income Brackets in Latah
According to the Latah family income data, there are 15 families falling into the less than $10,000 income range, which is the most common income bracket and makes up 40.5% of all families.
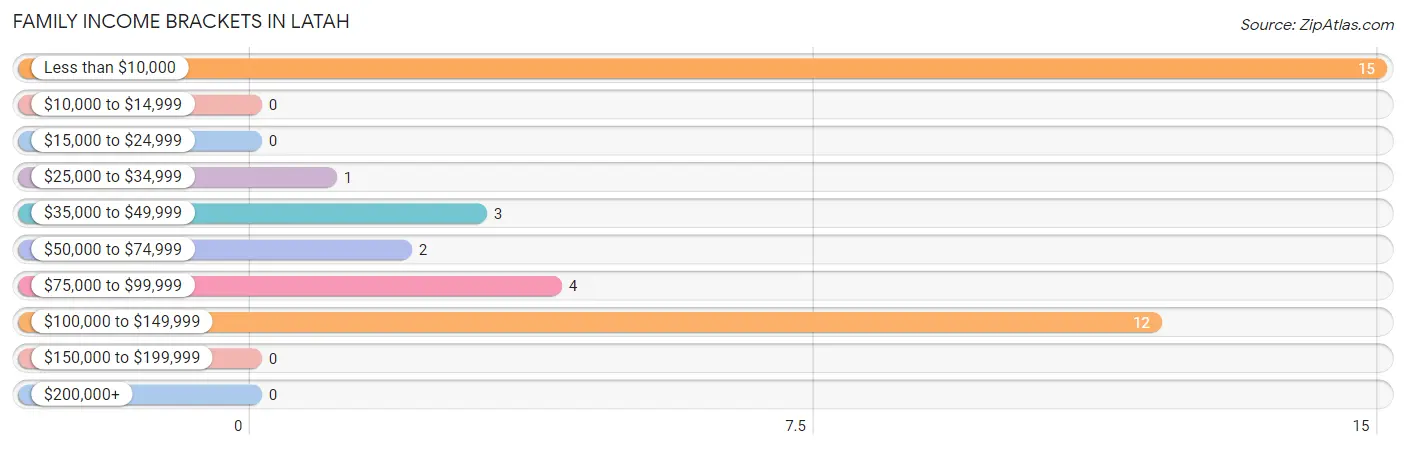
| Income Bracket | # Families | % Families |
| Less than $10,000 | 15 | 40.5% |
| $10,000 to $14,999 | 0 | 0.0% |
| $15,000 to $24,999 | 0 | 0.0% |
| $25,000 to $34,999 | 1 | 2.7% |
| $35,000 to $49,999 | 3 | 8.1% |
| $50,000 to $74,999 | 2 | 5.4% |
| $75,000 to $99,999 | 4 | 10.8% |
| $100,000 to $149,999 | 12 | 32.4% |
| $150,000 to $199,999 | 0 | 0.0% |
| $200,000+ | 0 | 0.0% |
Family Income by Famaliy Size in Latah
4-person families (10 | 27.0%) account for the highest median family income in Latah with $120,417 per family, while 4-person families (10 | 27.0%) have the highest median income of $30,104 per family member.
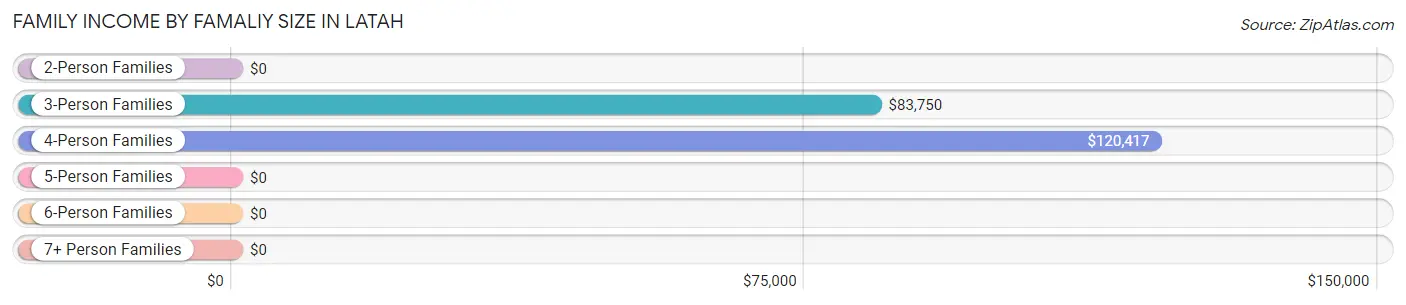
| Income Bracket | # Families | Median Income |
| 2-Person Families | 18 (48.6%) | $0 |
| 3-Person Families | 8 (21.6%) | $83,750 |
| 4-Person Families | 10 (27.0%) | $120,417 |
| 5-Person Families | 0 (0.0%) | $0 |
| 6-Person Families | 1 (2.7%) | $0 |
| 7+ Person Families | 0 (0.0%) | $0 |
| Total | 37 (100.0%) | $0 |
Family Income by Number of Earners in Latah
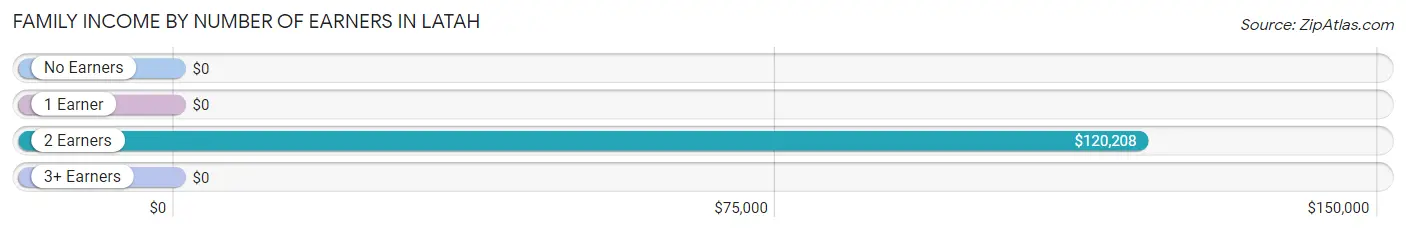
| Number of Earners | # Families | Median Income |
| No Earners | 19 (51.3%) | $0 |
| 1 Earner | 5 (13.5%) | $0 |
| 2 Earners | 13 (35.1%) | $120,208 |
| 3+ Earners | 0 (0.0%) | $0 |
| Total | 37 (100.0%) | $0 |
Household Income in Latah
Household Income Brackets in Latah
With 19 households falling in the category, the less than $10,000 income range is the most frequent in Latah, accounting for 32.2% of all households.
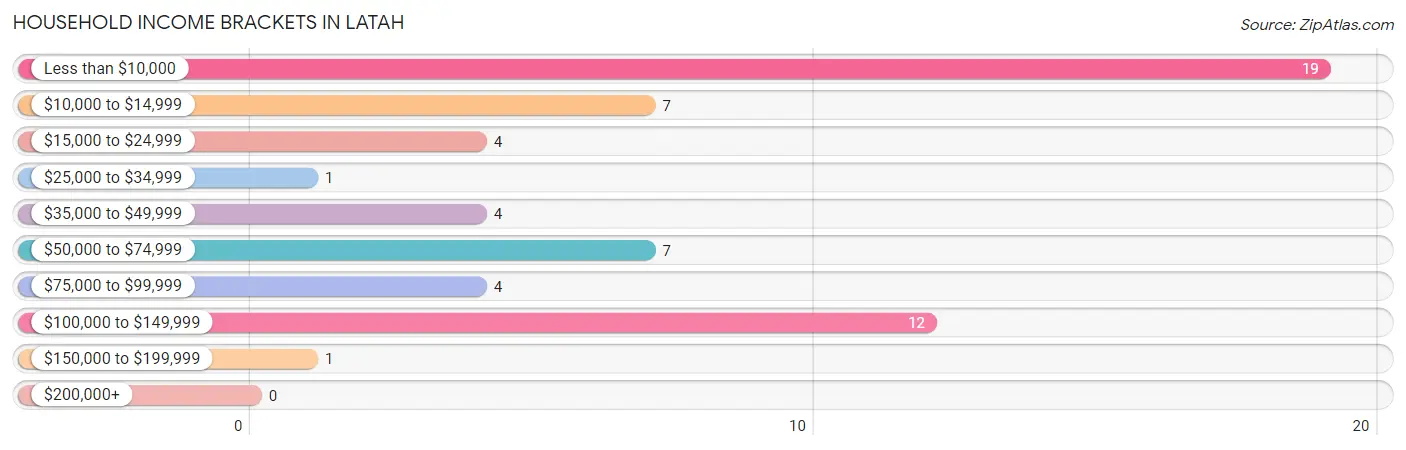
| Income Bracket | # Households | % Households |
| Less than $10,000 | 19 | 32.2% |
| $10,000 to $14,999 | 7 | 11.9% |
| $15,000 to $24,999 | 4 | 6.8% |
| $25,000 to $34,999 | 1 | 1.7% |
| $35,000 to $49,999 | 4 | 6.8% |
| $50,000 to $74,999 | 7 | 11.9% |
| $75,000 to $99,999 | 4 | 6.8% |
| $100,000 to $149,999 | 12 | 20.3% |
| $150,000 to $199,999 | 1 | 1.7% |
| $200,000+ | 0 | 0.0% |
Household Income by Householder Age in Latah
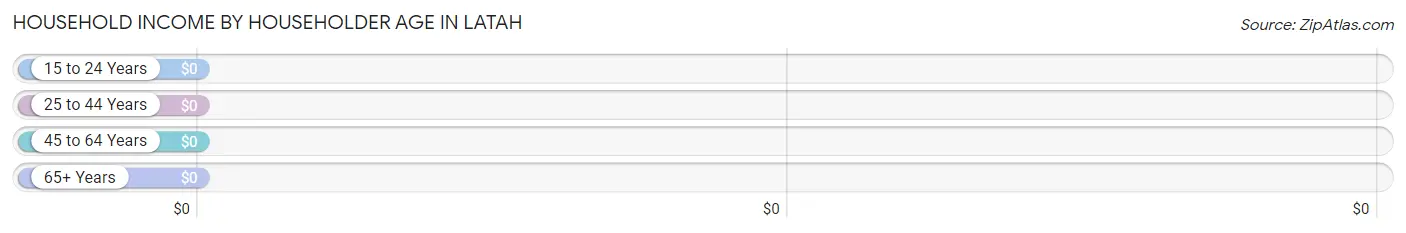
| Income Bracket | # Households | Median Income |
| 15 to 24 Years | 5 (8.5%) | $0 |
| 25 to 44 Years | 12 (20.3%) | $0 |
| 45 to 64 Years | 30 (50.8%) | $0 |
| 65+ Years | 12 (20.3%) | $0 |
| Total | 59 (100.0%) | $0 |
Poverty in Latah
Income Below Poverty by Sex and Age in Latah
With 58.3% poverty level for males and 35.3% for females among the residents of Latah, 16 and 17 year old males and 45 to 54 year old females are the most vulnerable to poverty, with 4 males (100.0%) and 13 females (92.9%) in their respective age groups living below the poverty level.
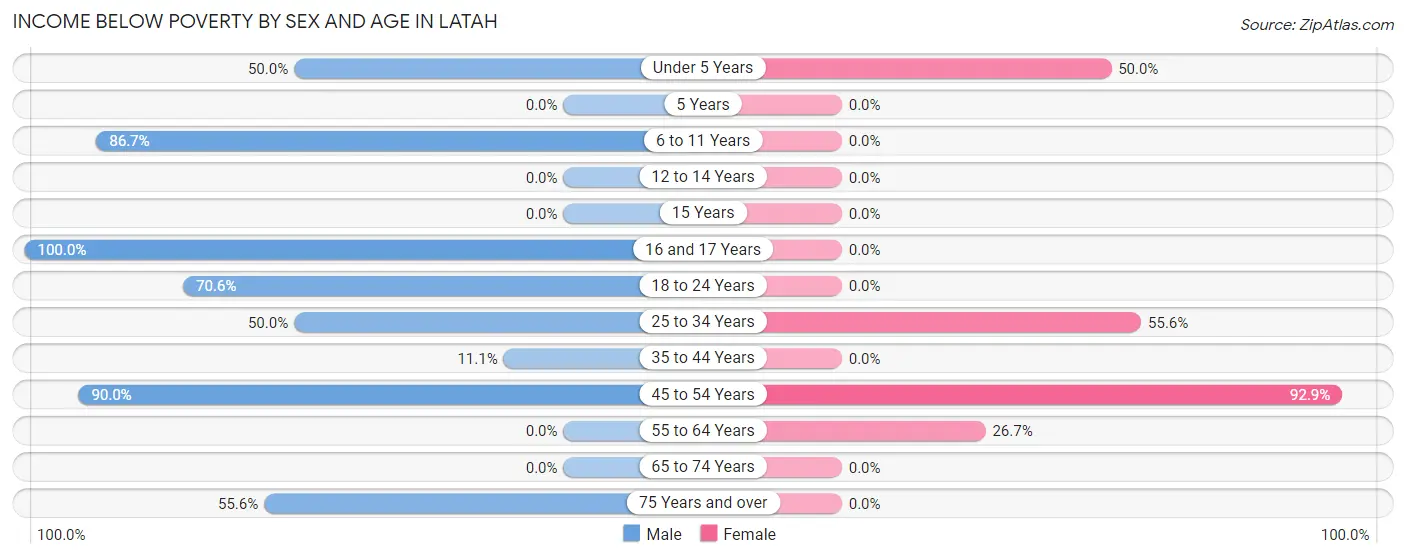
| Age Bracket | Male | Female |
| Under 5 Years | 1 (50.0%) | 2 (50.0%) |
| 5 Years | 0 (0.0%) | 0 (0.0%) |
| 6 to 11 Years | 13 (86.7%) | 0 (0.0%) |
| 12 to 14 Years | 0 (0.0%) | 0 (0.0%) |
| 15 Years | 0 (0.0%) | 0 (0.0%) |
| 16 and 17 Years | 4 (100.0%) | 0 (0.0%) |
| 18 to 24 Years | 12 (70.6%) | 0 (0.0%) |
| 25 to 34 Years | 2 (50.0%) | 5 (55.6%) |
| 35 to 44 Years | 1 (11.1%) | 0 (0.0%) |
| 45 to 54 Years | 18 (90.0%) | 13 (92.9%) |
| 55 to 64 Years | 0 (0.0%) | 4 (26.7%) |
| 65 to 74 Years | 0 (0.0%) | 0 (0.0%) |
| 75 Years and over | 5 (55.6%) | 0 (0.0%) |
| Total | 56 (58.3%) | 24 (35.3%) |
Income Above Poverty by Sex and Age in Latah
According to the poverty statistics in Latah, males aged 55 to 64 years and females aged 6 to 11 years are the age groups that are most secure financially, with 100.0% of males and 100.0% of females in these age groups living above the poverty line.
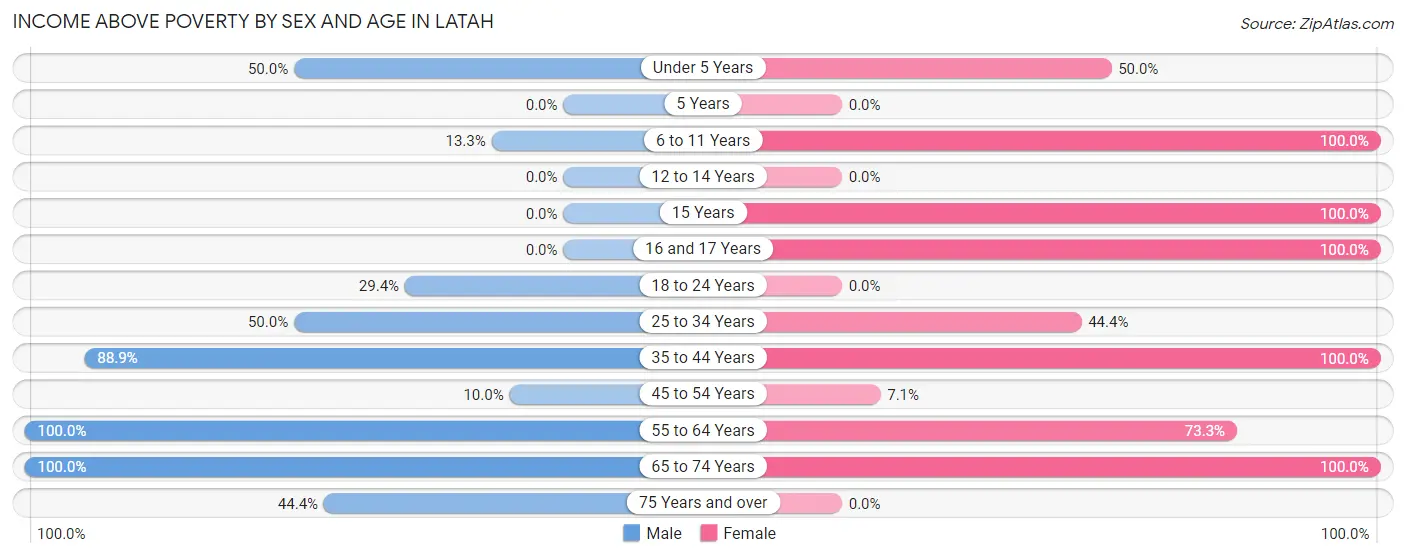
| Age Bracket | Male | Female |
| Under 5 Years | 1 (50.0%) | 2 (50.0%) |
| 5 Years | 0 (0.0%) | 0 (0.0%) |
| 6 to 11 Years | 2 (13.3%) | 7 (100.0%) |
| 12 to 14 Years | 0 (0.0%) | 0 (0.0%) |
| 15 Years | 0 (0.0%) | 8 (100.0%) |
| 16 and 17 Years | 0 (0.0%) | 1 (100.0%) |
| 18 to 24 Years | 5 (29.4%) | 0 (0.0%) |
| 25 to 34 Years | 2 (50.0%) | 4 (44.4%) |
| 35 to 44 Years | 8 (88.9%) | 7 (100.0%) |
| 45 to 54 Years | 2 (10.0%) | 1 (7.1%) |
| 55 to 64 Years | 9 (100.0%) | 11 (73.3%) |
| 65 to 74 Years | 7 (100.0%) | 3 (100.0%) |
| 75 Years and over | 4 (44.4%) | 0 (0.0%) |
| Total | 40 (41.7%) | 44 (64.7%) |
Income Below Poverty Among Married-Couple Families in Latah
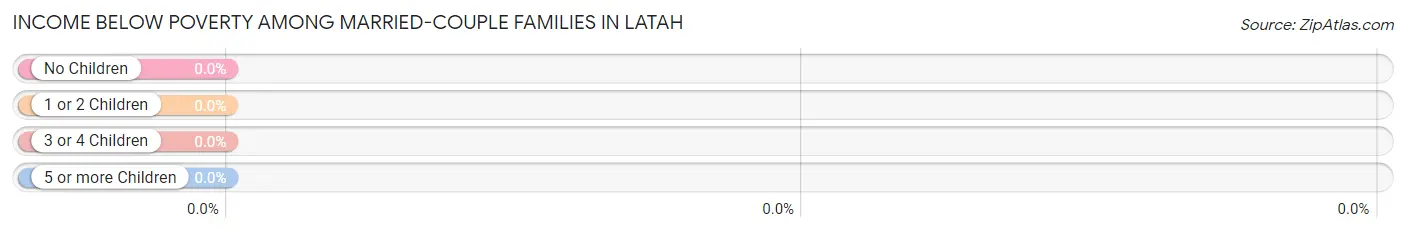
| Children | Above Poverty | Below Poverty |
| No Children | 9 (100.0%) | 0 (0.0%) |
| 1 or 2 Children | 11 (100.0%) | 0 (0.0%) |
| 3 or 4 Children | 1 (100.0%) | 0 (0.0%) |
| 5 or more Children | 0 (0.0%) | 0 (0.0%) |
| Total | 21 (100.0%) | 0 (0.0%) |
Income Below Poverty Among Single-Parent Households in Latah
According to the poverty data in Latah, 100.0% or 2 single-father households and 92.9% or 13 single-mother households are living below the poverty line. Among single-father households, those with 3 or 4 children have the highest poverty rate, with 2 households (100.0%) experiencing poverty. Likewise, among single-mother households, those with 1 or 2 children have the highest poverty rate, with 13 households (100.0%) falling below the poverty line.
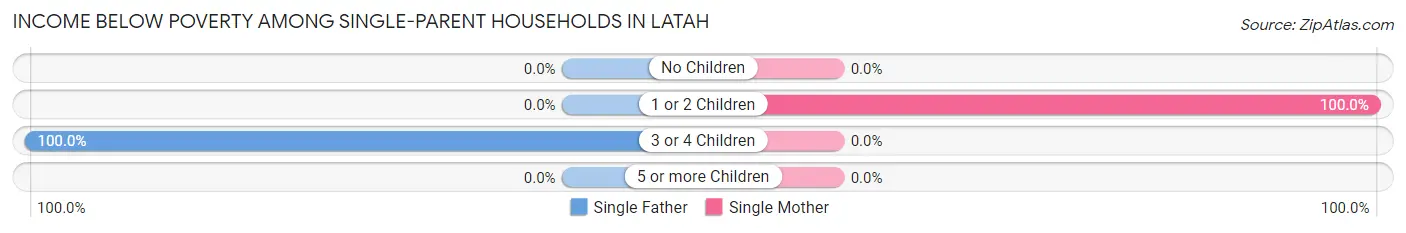
| Children | Single Father | Single Mother |
| No Children | 0 (0.0%) | 0 (0.0%) |
| 1 or 2 Children | 0 (0.0%) | 13 (100.0%) |
| 3 or 4 Children | 2 (100.0%) | 0 (0.0%) |
| 5 or more Children | 0 (0.0%) | 0 (0.0%) |
| Total | 2 (100.0%) | 13 (92.9%) |
Income Below Poverty Among Married-Couple vs Single-Parent Households in Latah
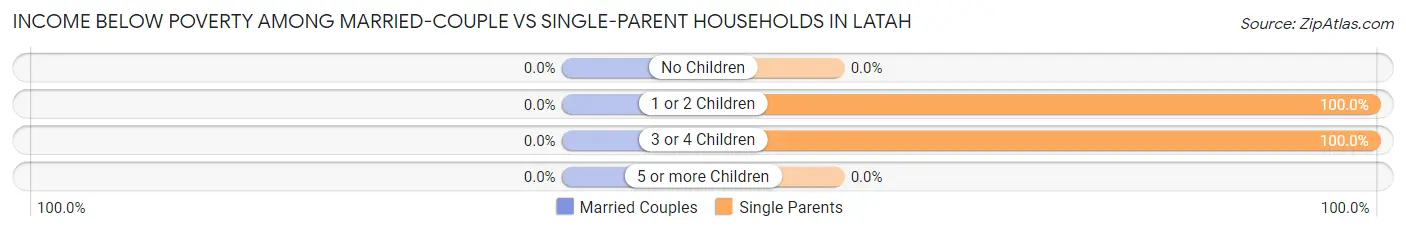
| Children | Married-Couple Families | Single-Parent Households |
| No Children | 0 (0.0%) | 0 (0.0%) |
| 1 or 2 Children | 0 (0.0%) | 13 (100.0%) |
| 3 or 4 Children | 0 (0.0%) | 2 (100.0%) |
| 5 or more Children | 0 (0.0%) | 0 (0.0%) |
| Total | 0 (0.0%) | 15 (93.8%) |
Race in Latah
The most populous races in Latah are White / Caucasian (156 | 92.9%), Two or more Races (8 | 4.8%), and Hispanic or Latino (7 | 4.2%).
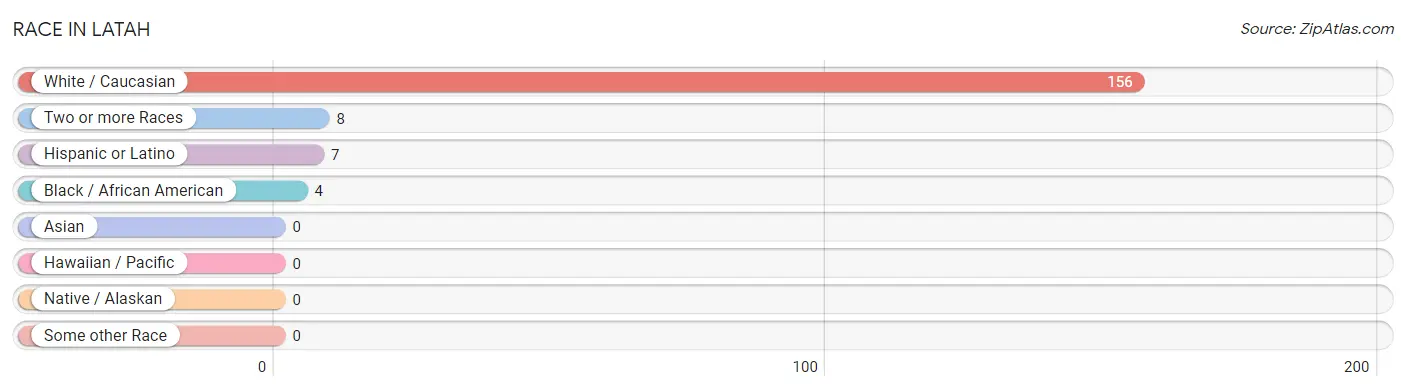
| Race | # Population | % Population |
| Asian | 0 | 0.0% |
| Black / African American | 4 | 2.4% |
| Hawaiian / Pacific | 0 | 0.0% |
| Hispanic or Latino | 7 | 4.2% |
| Native / Alaskan | 0 | 0.0% |
| White / Caucasian | 156 | 92.9% |
| Two or more Races | 8 | 4.8% |
| Some other Race | 0 | 0.0% |
| Total | 168 | 100.0% |
Ancestry in Latah
The most populous ancestries reported in Latah are English (23 | 13.7%), German (18 | 10.7%), Irish (16 | 9.5%), Italian (9 | 5.4%), and Welsh (7 | 4.2%), together accounting for 43.4% of all Latah residents.
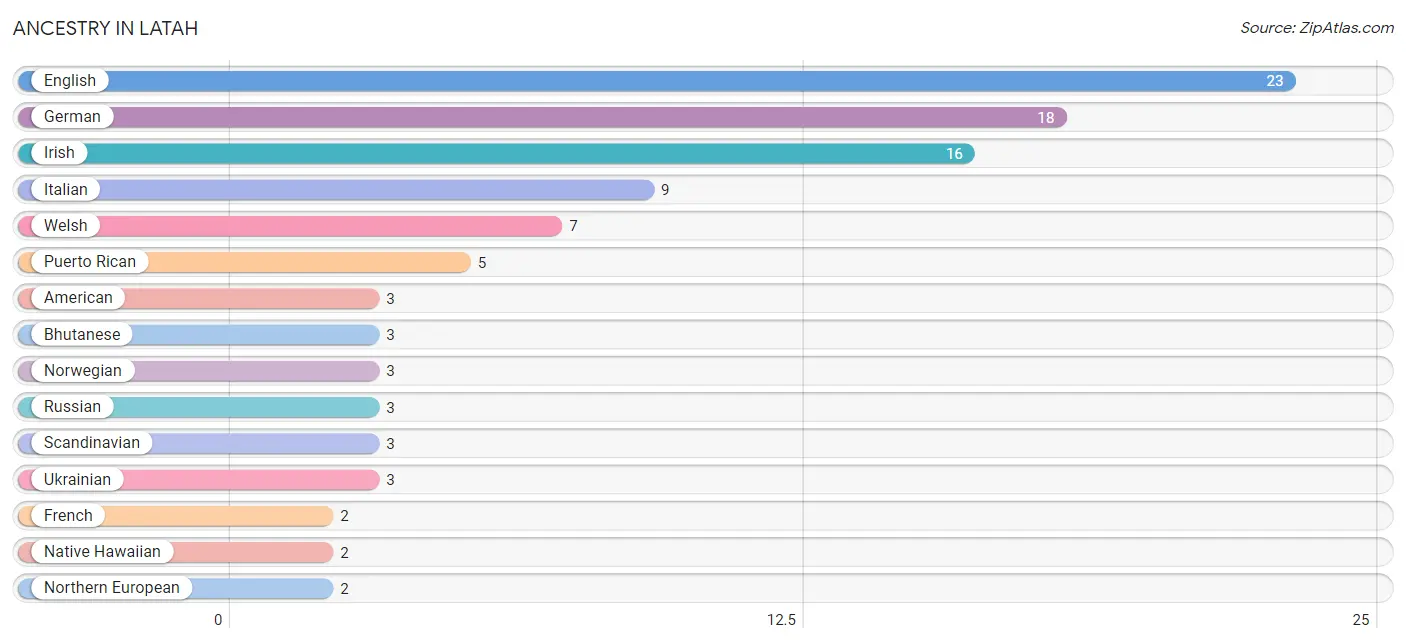
| Ancestry | # Population | % Population |
| American | 3 | 1.8% |
| Bhutanese | 3 | 1.8% |
| Blackfeet | 1 | 0.6% |
| Cherokee | 1 | 0.6% |
| English | 23 | 13.7% |
| French | 2 | 1.2% |
| German | 18 | 10.7% |
| Irish | 16 | 9.5% |
| Iroquois | 1 | 0.6% |
| Italian | 9 | 5.4% |
| Native Hawaiian | 2 | 1.2% |
| Northern European | 2 | 1.2% |
| Norwegian | 3 | 1.8% |
| Puerto Rican | 5 | 3.0% |
| Romanian | 2 | 1.2% |
| Russian | 3 | 1.8% |
| Scandinavian | 3 | 1.8% |
| Scotch-Irish | 2 | 1.2% |
| Scottish | 2 | 1.2% |
| Spanish | 2 | 1.2% |
| Sri Lankan | 1 | 0.6% |
| Thai | 1 | 0.6% |
| Ukrainian | 3 | 1.8% |
| Welsh | 7 | 4.2% | View All 24 Rows |
Immigrants in Latah

| Immigration Origin | # Population | % Population | View All 0 Rows |
Sex and Age in Latah
Sex and Age in Latah
The most populous age groups in Latah are 5 to 9 Years (19 | 19.0%) for men and 45 to 49 Years (13 | 19.1%) for women.
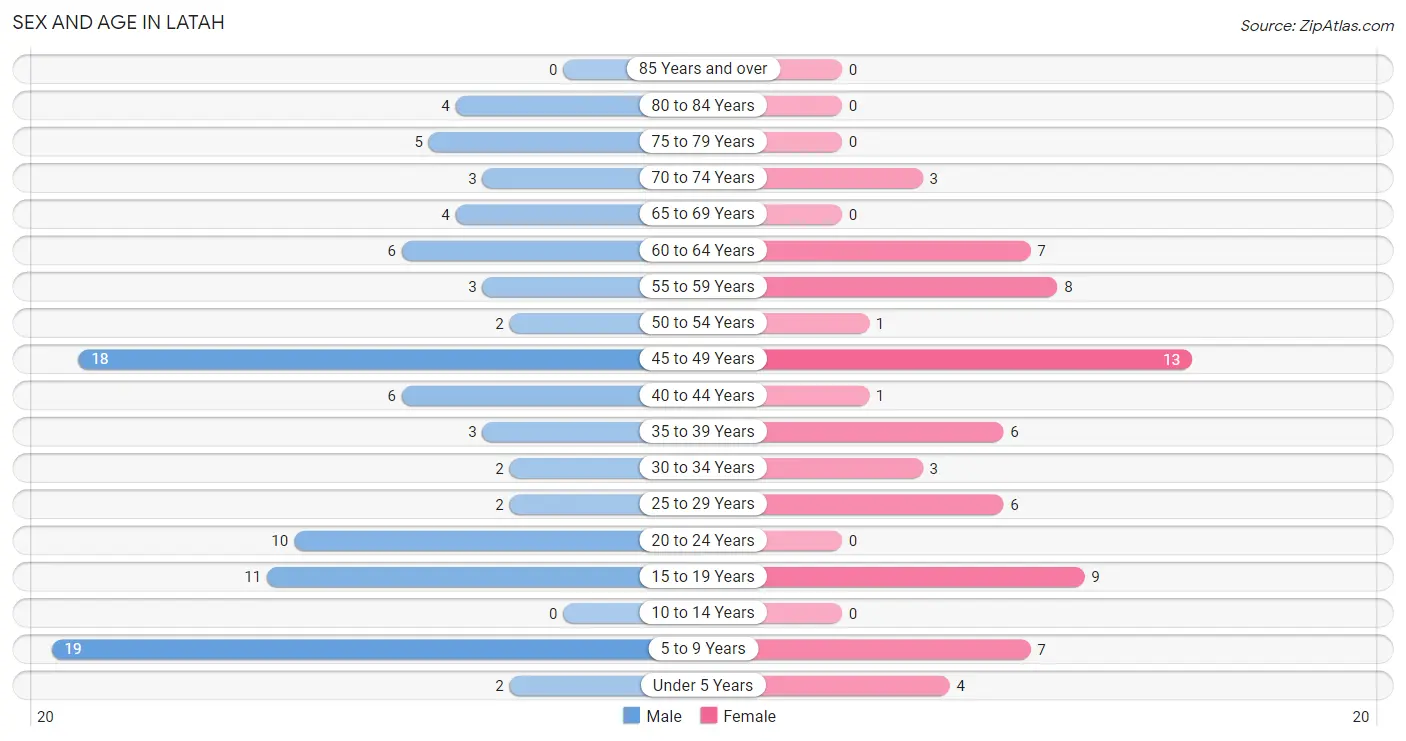
| Age Bracket | Male | Female |
| Under 5 Years | 2 (2.0%) | 4 (5.9%) |
| 5 to 9 Years | 19 (19.0%) | 7 (10.3%) |
| 10 to 14 Years | 0 (0.0%) | 0 (0.0%) |
| 15 to 19 Years | 11 (11.0%) | 9 (13.2%) |
| 20 to 24 Years | 10 (10.0%) | 0 (0.0%) |
| 25 to 29 Years | 2 (2.0%) | 6 (8.8%) |
| 30 to 34 Years | 2 (2.0%) | 3 (4.4%) |
| 35 to 39 Years | 3 (3.0%) | 6 (8.8%) |
| 40 to 44 Years | 6 (6.0%) | 1 (1.5%) |
| 45 to 49 Years | 18 (18.0%) | 13 (19.1%) |
| 50 to 54 Years | 2 (2.0%) | 1 (1.5%) |
| 55 to 59 Years | 3 (3.0%) | 8 (11.8%) |
| 60 to 64 Years | 6 (6.0%) | 7 (10.3%) |
| 65 to 69 Years | 4 (4.0%) | 0 (0.0%) |
| 70 to 74 Years | 3 (3.0%) | 3 (4.4%) |
| 75 to 79 Years | 5 (5.0%) | 0 (0.0%) |
| 80 to 84 Years | 4 (4.0%) | 0 (0.0%) |
| 85 Years and over | 0 (0.0%) | 0 (0.0%) |
| Total | 100 (100.0%) | 68 (100.0%) |
Families and Households in Latah
Median Family Size in Latah
The median family size in Latah is 2.76 persons per family, with married-couple families (21 | 56.8%) accounting for the largest median family size of 3.24 persons per family. On the other hand, single female/mother families (14 | 37.8%) represent the smallest median family size with 2.00 persons per family.
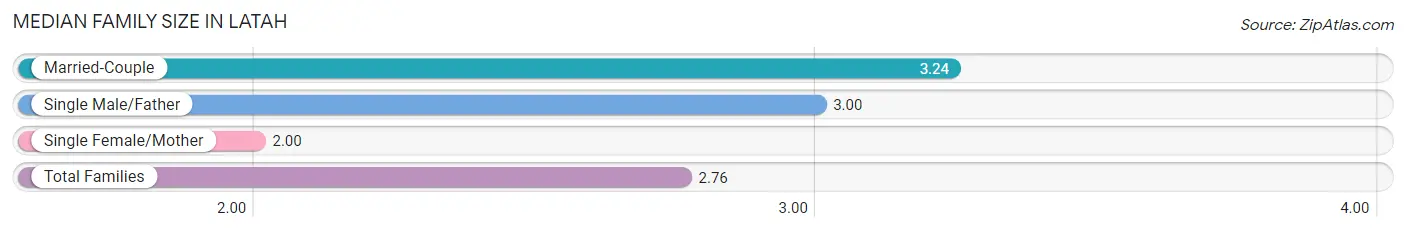
| Family Type | # Families | Family Size |
| Married-Couple | 21 (56.8%) | 3.24 |
| Single Male/Father | 2 (5.4%) | 3.00 |
| Single Female/Mother | 14 (37.8%) | 2.00 |
| Total Families | 37 (100.0%) | 2.76 |
Median Household Size in Latah
The median household size in Latah is 2.85 persons per household, with single male/father households (2 | 3.4%) accounting for the largest median household size of 3.5 persons per household. non-family households (22 | 37.3%) represent the smallest median household size with 2.14 persons per household.
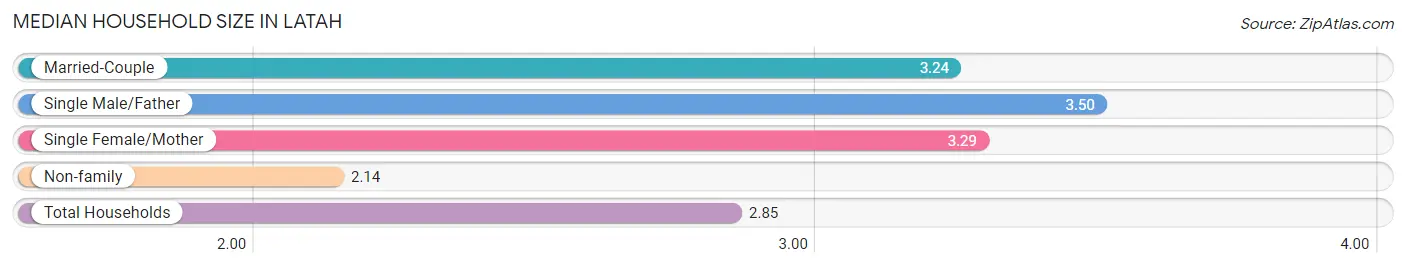
| Household Type | # Households | Household Size |
| Married-Couple | 21 (35.6%) | 3.24 |
| Single Male/Father | 2 (3.4%) | 3.50 |
| Single Female/Mother | 14 (23.7%) | 3.29 |
| Non-family | 22 (37.3%) | 2.14 |
| Total Households | 59 (100.0%) | 2.85 |
Household Size by Marriage Status in Latah
Out of a total of 59 households in Latah, 37 (62.7%) are family households, while 22 (37.3%) are nonfamily households. The most numerous type of family households are 3-person households, comprising 21, and the most common type of nonfamily households are 1-person households, comprising 15.
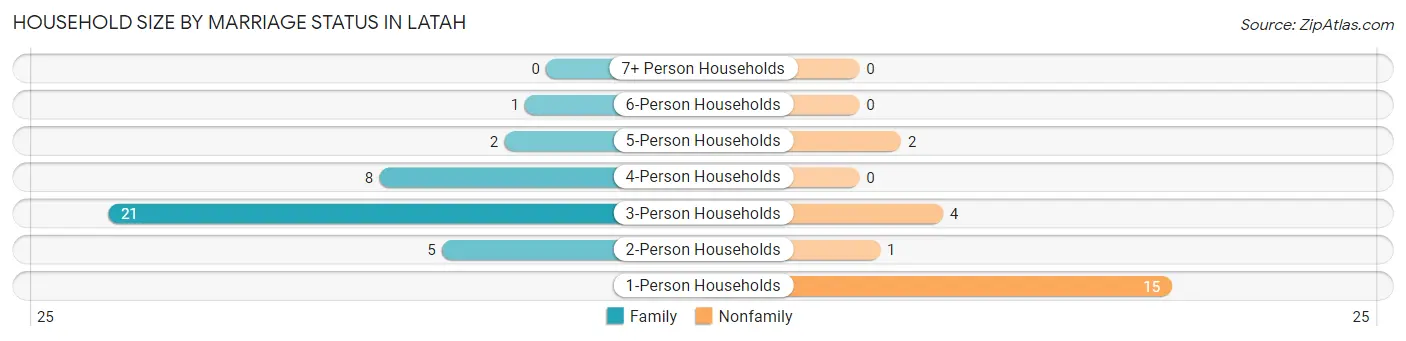
| Household Size | Family Households | Nonfamily Households |
| 1-Person Households | - | 15 (25.4%) |
| 2-Person Households | 5 (8.5%) | 1 (1.7%) |
| 3-Person Households | 21 (35.6%) | 4 (6.8%) |
| 4-Person Households | 8 (13.6%) | 0 (0.0%) |
| 5-Person Households | 2 (3.4%) | 2 (3.4%) |
| 6-Person Households | 1 (1.7%) | 0 (0.0%) |
| 7+ Person Households | 0 (0.0%) | 0 (0.0%) |
| Total | 37 (62.7%) | 22 (37.3%) |
Female Fertility in Latah
Fertility by Age in Latah
| Age Bracket | Women with Births | Births / 1,000 Women |
| 15 to 19 years | 0 (0.0%) | 0.0 |
| 20 to 34 years | 0 (0.0%) | 0.0 |
| 35 to 50 years | 0 (0.0%) | 0.0 |
| Total | 0 (0.0%) | 0.0 |
Fertility by Age by Marriage Status in Latah
| Age Bracket | Married | Unmarried |
| 15 to 19 years | 0 (0.0%) | 0 (0.0%) |
| 20 to 34 years | 0 (0.0%) | 0 (0.0%) |
| 35 to 50 years | 0 (0.0%) | 0 (0.0%) |
| Total | 0 (0.0%) | 0 (0.0%) |
Fertility by Education in Latah
| Educational Attainment | Women with Births | Births / 1,000 Women |
| Less than High School | 0 (0.0%) | 0.0 |
| High School Diploma | 0 (0.0%) | 0.0 |
| College or Associate's Degree | 0 (0.0%) | 0.0 |
| Bachelor's Degree | 0 (0.0%) | 0.0 |
| Graduate Degree | 0 (0.0%) | 0.0 |
| Total | 0 (0.0%) | 0.0 |
Fertility by Education by Marriage Status in Latah
| Educational Attainment | Married | Unmarried |
| Less than High School | 0 (0.0%) | 0 (0.0%) |
| High School Diploma | 0 (0.0%) | 0 (0.0%) |
| College or Associate's Degree | 0 (0.0%) | 0 (0.0%) |
| Bachelor's Degree | 0 (0.0%) | 0 (0.0%) |
| Graduate Degree | 0 (0.0%) | 0 (0.0%) |
| Total | 0 (0.0%) | 0 (0.0%) |
Employment Characteristics in Latah
Employment by Class of Employer in Latah
Among the 47 employed individuals in Latah, private company employees (36 | 76.6%), not-for-profit organizations (9 | 19.2%), and self-employed (not incorporated) (2 | 4.3%) make up the most common classes of employment.
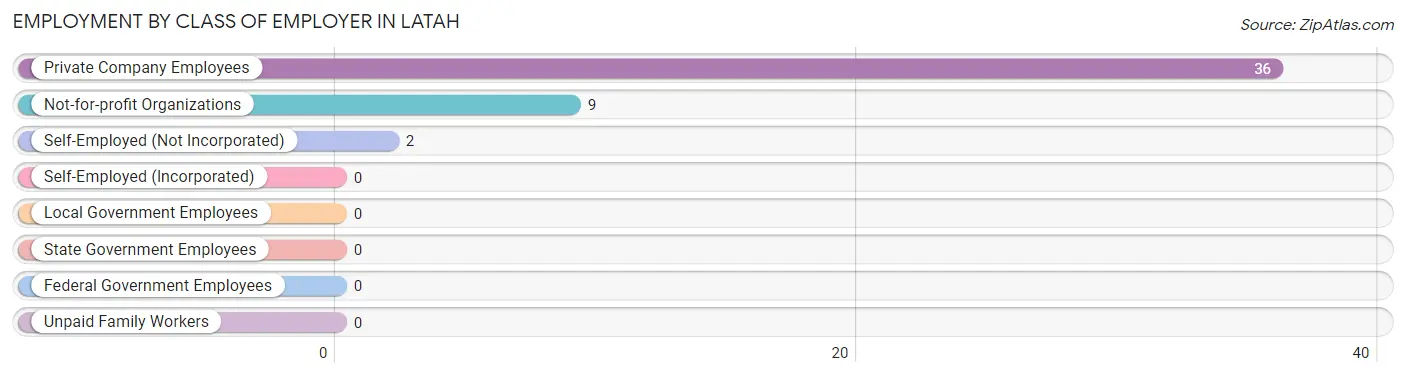
| Employer Class | # Employees | % Employees |
| Private Company Employees | 36 | 76.6% |
| Self-Employed (Incorporated) | 0 | 0.0% |
| Self-Employed (Not Incorporated) | 2 | 4.3% |
| Not-for-profit Organizations | 9 | 19.2% |
| Local Government Employees | 0 | 0.0% |
| State Government Employees | 0 | 0.0% |
| Federal Government Employees | 0 | 0.0% |
| Unpaid Family Workers | 0 | 0.0% |
| Total | 47 | 100.0% |
Employment Status by Age in Latah
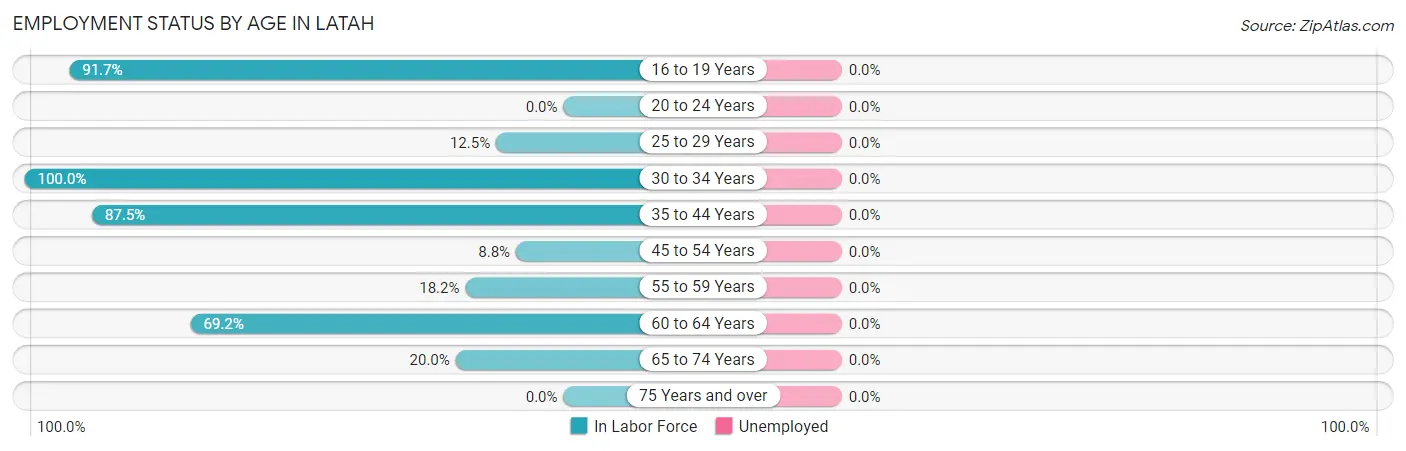
| Age Bracket | In Labor Force | Unemployed |
| 16 to 19 Years | 11 (91.7%) | 0 (0.0%) |
| 20 to 24 Years | 0 (0.0%) | 0 (0.0%) |
| 25 to 29 Years | 1 (12.5%) | 0 (0.0%) |
| 30 to 34 Years | 5 (100.0%) | 0 (0.0%) |
| 35 to 44 Years | 14 (87.5%) | 0 (0.0%) |
| 45 to 54 Years | 3 (8.8%) | 0 (0.0%) |
| 55 to 59 Years | 2 (18.2%) | 0 (0.0%) |
| 60 to 64 Years | 9 (69.2%) | 0 (0.0%) |
| 65 to 74 Years | 2 (20.0%) | 0 (0.0%) |
| 75 Years and over | 0 (0.0%) | 0 (0.0%) |
| Total | 47 (36.7%) | 0 (0.0%) |
Employment Status by Educational Attainment in Latah
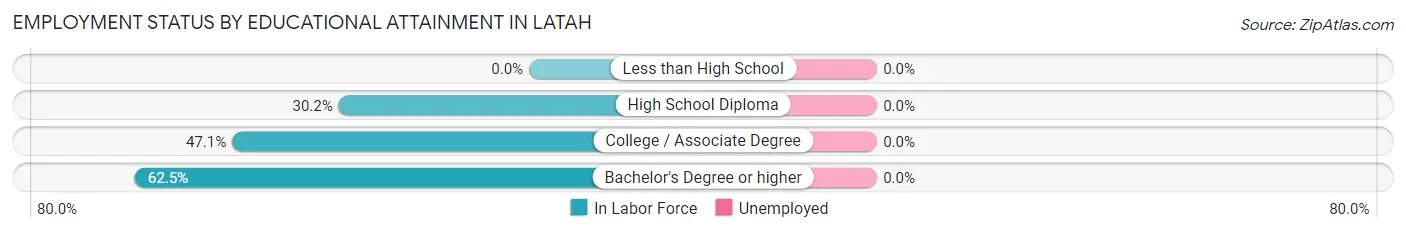
| Educational Attainment | In Labor Force | Unemployed |
| Less than High School | 0 (0.0%) | 0 (0.0%) |
| High School Diploma | 16 (30.2%) | 0 (0.0%) |
| College / Associate Degree | 8 (47.1%) | 0 (0.0%) |
| Bachelor's Degree or higher | 10 (62.5%) | 0 (0.0%) |
| Total | 34 (39.1%) | 0 (0.0%) |
Employment Occupations by Sex in Latah
Management, Business, Science and Arts Occupations
The most common Management, Business, Science and Arts occupations in Latah are Computers, Engineering & Science (6 | 12.8%), Life, Physical & Social Science (6 | 12.8%), Business & Financial (4 | 8.5%), Community & Social Service (4 | 8.5%), and Education, Arts & Media (3 | 6.4%).
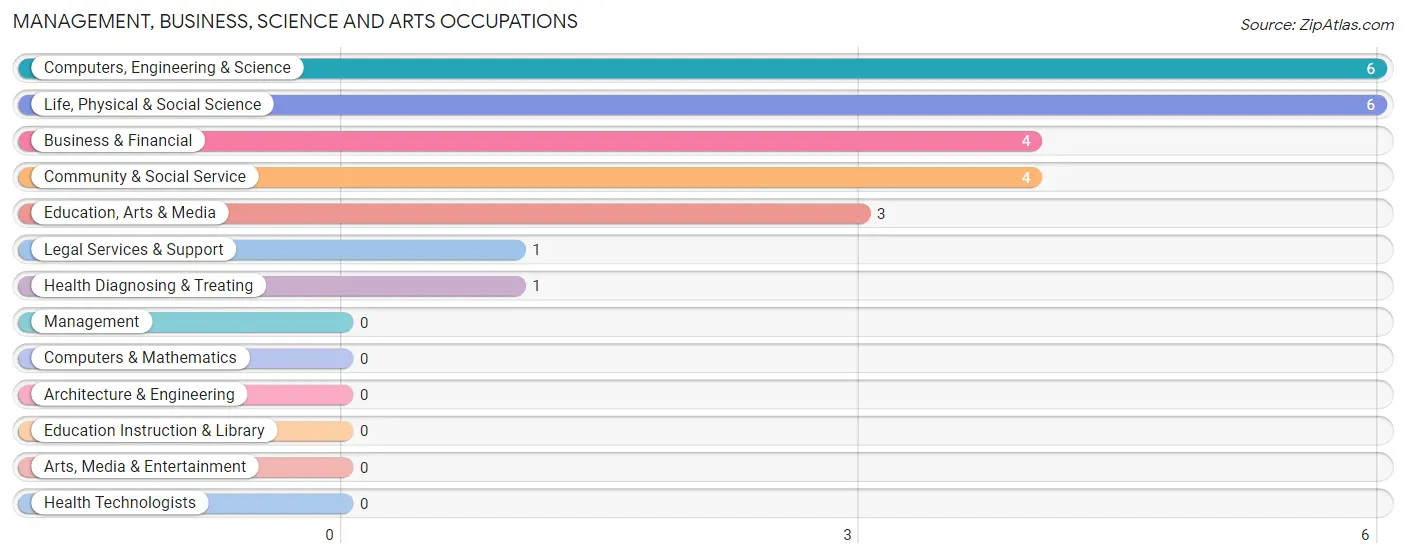
Management, Business, Science and Arts Occupations by Sex
Within the Management, Business, Science and Arts occupations in Latah, the most male-oriented occupations are Computers, Engineering & Science (100.0%), Life, Physical & Social Science (100.0%), and Business & Financial (75.0%), while the most female-oriented occupations are Community & Social Service (100.0%), Education, Arts & Media (100.0%), and Legal Services & Support (100.0%).
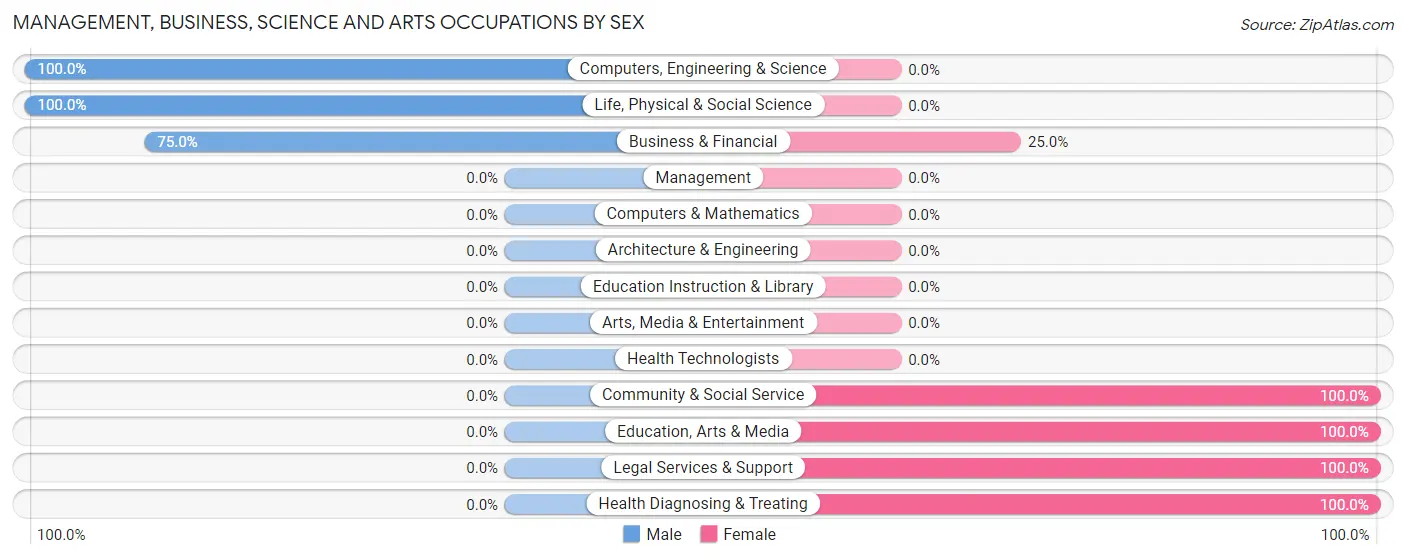
| Occupation | Male | Female |
| Management | 0 (0.0%) | 0 (0.0%) |
| Business & Financial | 3 (75.0%) | 1 (25.0%) |
| Computers, Engineering & Science | 6 (100.0%) | 0 (0.0%) |
| Computers & Mathematics | 0 (0.0%) | 0 (0.0%) |
| Architecture & Engineering | 0 (0.0%) | 0 (0.0%) |
| Life, Physical & Social Science | 6 (100.0%) | 0 (0.0%) |
| Community & Social Service | 0 (0.0%) | 4 (100.0%) |
| Education, Arts & Media | 0 (0.0%) | 3 (100.0%) |
| Legal Services & Support | 0 (0.0%) | 1 (100.0%) |
| Education Instruction & Library | 0 (0.0%) | 0 (0.0%) |
| Arts, Media & Entertainment | 0 (0.0%) | 0 (0.0%) |
| Health Diagnosing & Treating | 0 (0.0%) | 1 (100.0%) |
| Health Technologists | 0 (0.0%) | 0 (0.0%) |
| Total (Category) | 9 (60.0%) | 6 (40.0%) |
| Total (Overall) | 31 (66.0%) | 16 (34.0%) |
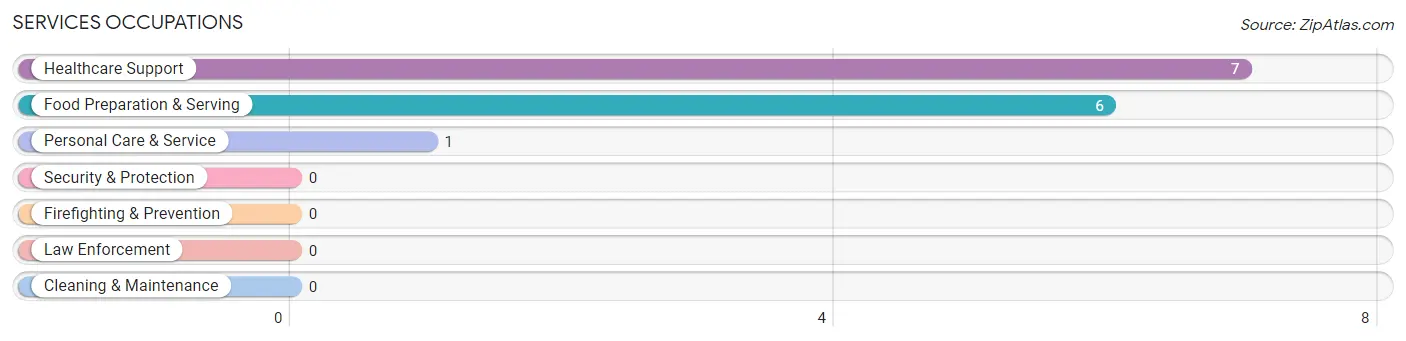
Services Occupations
The most common Services occupations in Latah are Healthcare Support (7 | 14.9%), Food Preparation & Serving (6 | 12.8%), and Personal Care & Service (1 | 2.1%).
Services Occupations by Sex
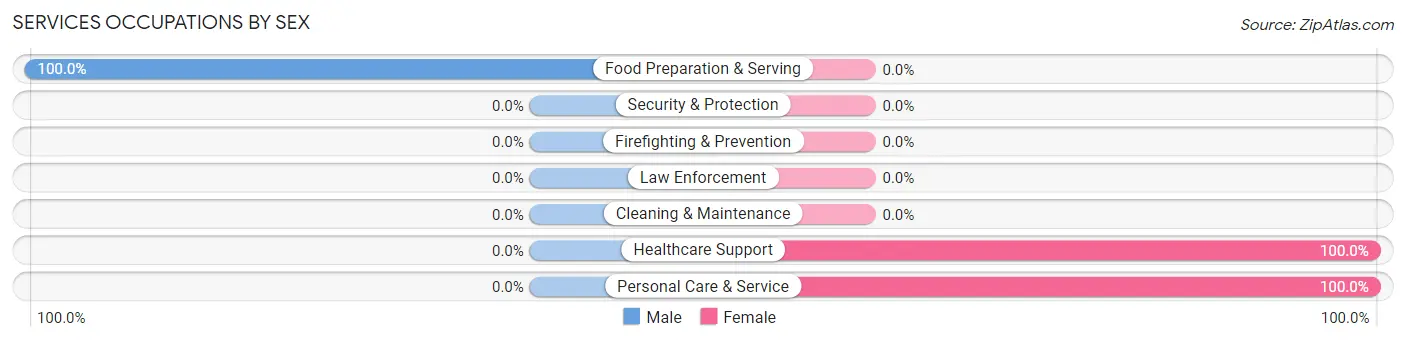
| Occupation | Male | Female |
| Healthcare Support | 0 (0.0%) | 7 (100.0%) |
| Security & Protection | 0 (0.0%) | 0 (0.0%) |
| Firefighting & Prevention | 0 (0.0%) | 0 (0.0%) |
| Law Enforcement | 0 (0.0%) | 0 (0.0%) |
| Food Preparation & Serving | 6 (100.0%) | 0 (0.0%) |
| Cleaning & Maintenance | 0 (0.0%) | 0 (0.0%) |
| Personal Care & Service | 0 (0.0%) | 1 (100.0%) |
| Total (Category) | 6 (42.9%) | 8 (57.1%) |
| Total (Overall) | 31 (66.0%) | 16 (34.0%) |
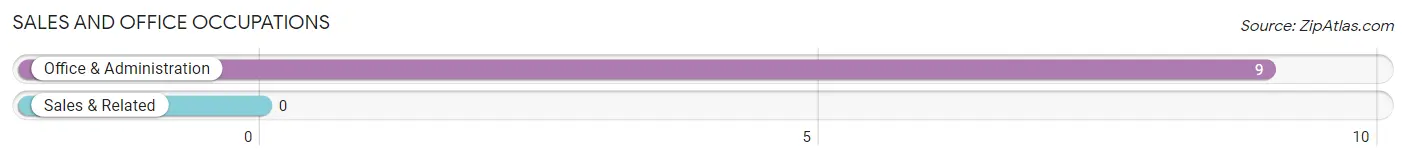
Sales and Office Occupations
The most common Sales and Office occupations in Latah are , and Office & Administration (9 | 19.2%).
Sales and Office Occupations by Sex
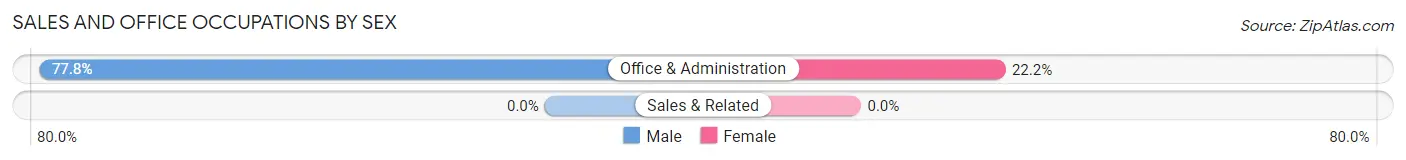
| Occupation | Male | Female |
| Sales & Related | 0 (0.0%) | 0 (0.0%) |
| Office & Administration | 7 (77.8%) | 2 (22.2%) |
| Total (Category) | 7 (77.8%) | 2 (22.2%) |
| Total (Overall) | 31 (66.0%) | 16 (34.0%) |
Natural Resources, Construction and Maintenance Occupations
The most common Natural Resources, Construction and Maintenance occupations in Latah are , and Installation, Maintenance & Repair (4 | 8.5%).
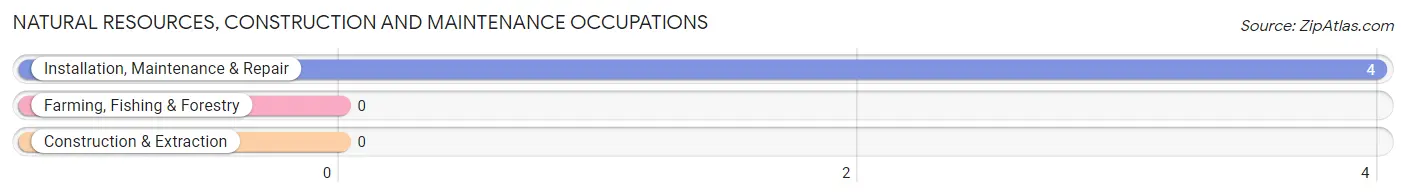
Natural Resources, Construction and Maintenance Occupations by Sex
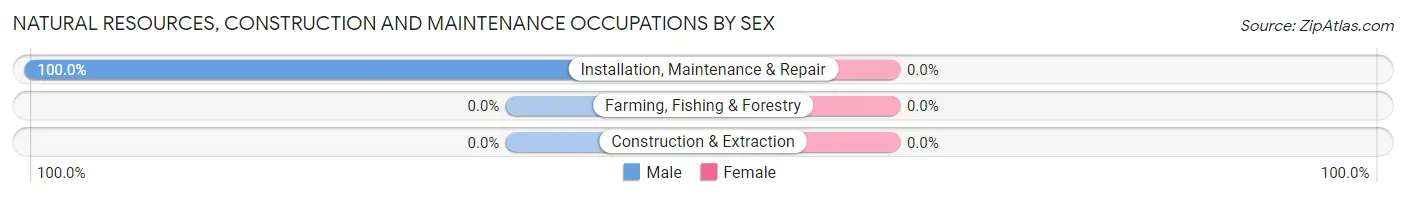
| Occupation | Male | Female |
| Farming, Fishing & Forestry | 0 (0.0%) | 0 (0.0%) |
| Construction & Extraction | 0 (0.0%) | 0 (0.0%) |
| Installation, Maintenance & Repair | 4 (100.0%) | 0 (0.0%) |
| Total (Category) | 4 (100.0%) | 0 (0.0%) |
| Total (Overall) | 31 (66.0%) | 16 (34.0%) |
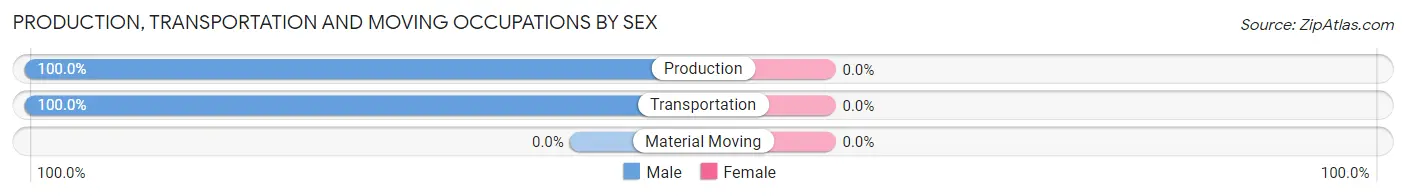
Production, Transportation and Moving Occupations
The most common Production, Transportation and Moving occupations in Latah are Production (3 | 6.4%), and Transportation (2 | 4.3%).
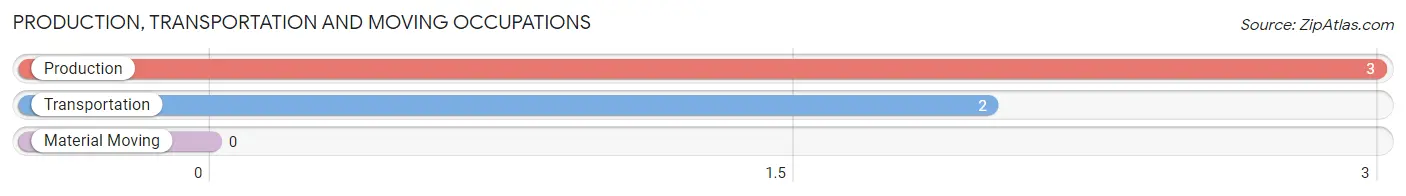
Production, Transportation and Moving Occupations by Sex
| Occupation | Male | Female |
| Production | 3 (100.0%) | 0 (0.0%) |
| Transportation | 2 (100.0%) | 0 (0.0%) |
| Material Moving | 0 (0.0%) | 0 (0.0%) |
| Total (Category) | 5 (100.0%) | 0 (0.0%) |
| Total (Overall) | 31 (66.0%) | 16 (34.0%) |
Employment Industries by Sex in Latah
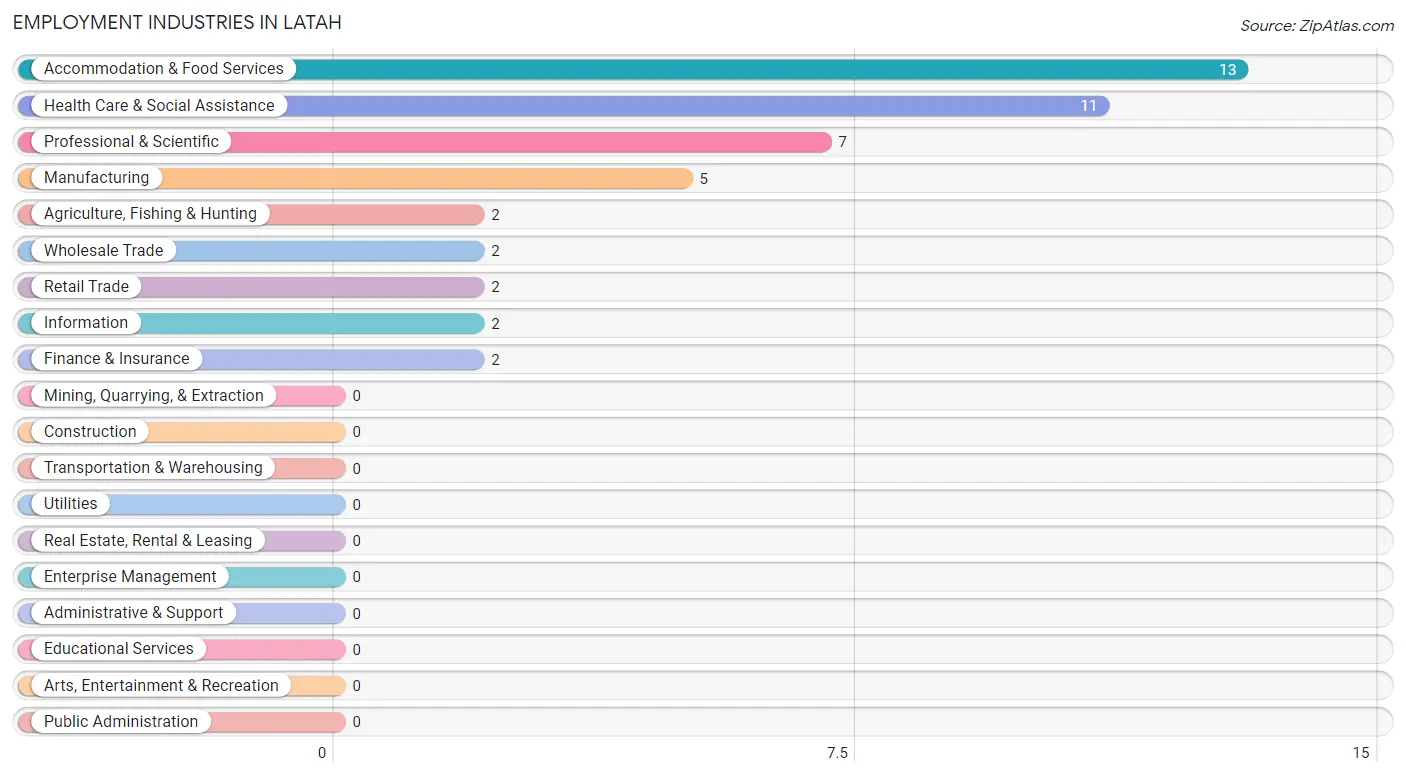
Employment Industries in Latah
The major employment industries in Latah include Accommodation & Food Services (13 | 27.7%), Health Care & Social Assistance (11 | 23.4%), Professional & Scientific (7 | 14.9%), Manufacturing (5 | 10.6%), and Agriculture, Fishing & Hunting (2 | 4.3%).
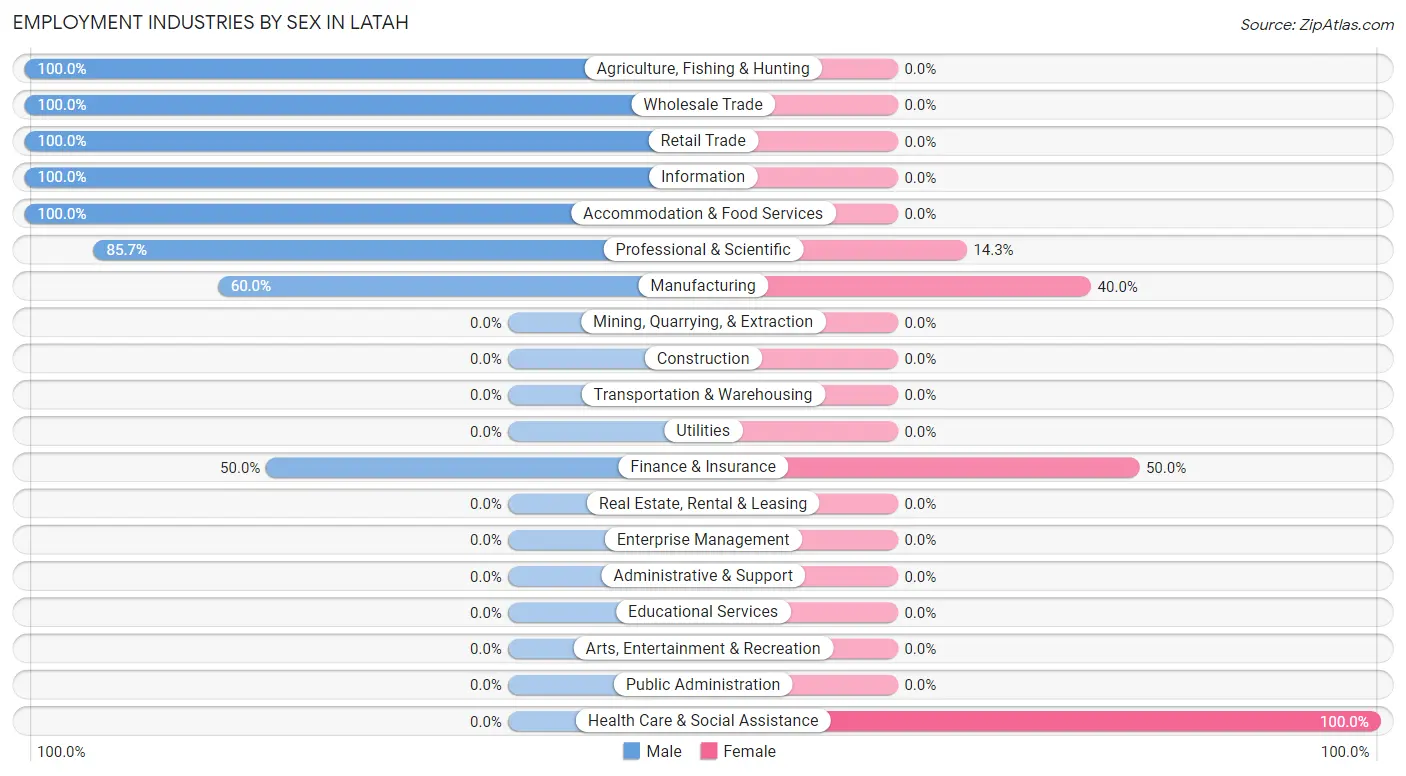
Employment Industries by Sex in Latah
The Latah industries that see more men than women are Agriculture, Fishing & Hunting (100.0%), Wholesale Trade (100.0%), and Retail Trade (100.0%), whereas the industries that tend to have a higher number of women are Health Care & Social Assistance (100.0%), Finance & Insurance (50.0%), and Manufacturing (40.0%).
| Industry | Male | Female |
| Agriculture, Fishing & Hunting | 2 (100.0%) | 0 (0.0%) |
| Mining, Quarrying, & Extraction | 0 (0.0%) | 0 (0.0%) |
| Construction | 0 (0.0%) | 0 (0.0%) |
| Manufacturing | 3 (60.0%) | 2 (40.0%) |
| Wholesale Trade | 2 (100.0%) | 0 (0.0%) |
| Retail Trade | 2 (100.0%) | 0 (0.0%) |
| Transportation & Warehousing | 0 (0.0%) | 0 (0.0%) |
| Utilities | 0 (0.0%) | 0 (0.0%) |
| Information | 2 (100.0%) | 0 (0.0%) |
| Finance & Insurance | 1 (50.0%) | 1 (50.0%) |
| Real Estate, Rental & Leasing | 0 (0.0%) | 0 (0.0%) |
| Professional & Scientific | 6 (85.7%) | 1 (14.3%) |
| Enterprise Management | 0 (0.0%) | 0 (0.0%) |
| Administrative & Support | 0 (0.0%) | 0 (0.0%) |
| Educational Services | 0 (0.0%) | 0 (0.0%) |
| Health Care & Social Assistance | 0 (0.0%) | 11 (100.0%) |
| Arts, Entertainment & Recreation | 0 (0.0%) | 0 (0.0%) |
| Accommodation & Food Services | 13 (100.0%) | 0 (0.0%) |
| Public Administration | 0 (0.0%) | 0 (0.0%) |
| Total | 31 (66.0%) | 16 (34.0%) |
Education in Latah
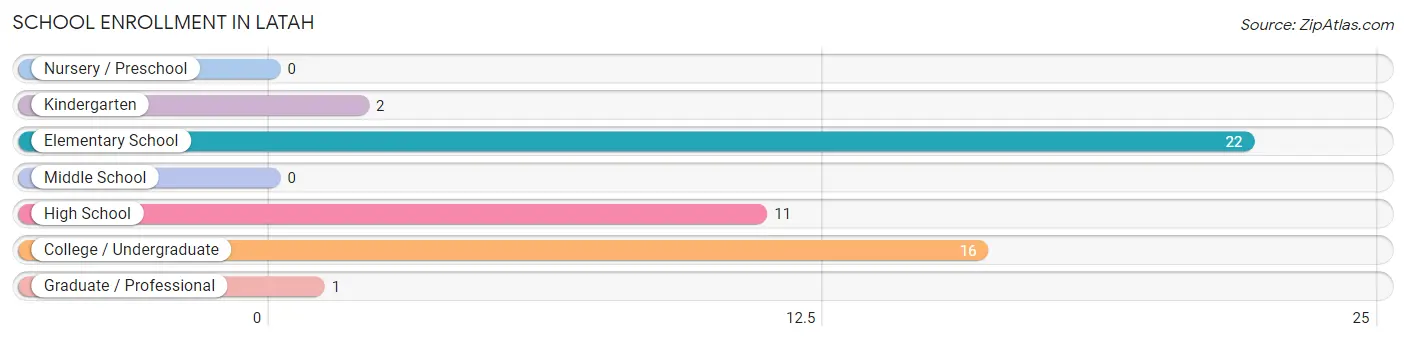
School Enrollment in Latah
The most common levels of schooling among the 52 students in Latah are elementary school (22 | 42.3%), college / undergraduate (16 | 30.8%), and high school (11 | 21.1%).
| School Level | # Students | % Students |
| Nursery / Preschool | 0 | 0.0% |
| Kindergarten | 2 | 3.8% |
| Elementary School | 22 | 42.3% |
| Middle School | 0 | 0.0% |
| High School | 11 | 21.1% |
| College / Undergraduate | 16 | 30.8% |
| Graduate / Professional | 1 | 1.9% |
| Total | 52 | 100.0% |
School Enrollment by Age by Funding Source in Latah
Out of a total of 52 students who are enrolled in schools in Latah, 2 (3.8%) attend a private institution, while the remaining 50 (96.2%) are enrolled in public schools. The age group of 5 to 9 year old has the highest likelihood of being enrolled in private schools, with 2 (8.3% in the age bracket) enrolled. Conversely, the age group of 15 to 17 year olds has the lowest likelihood of being enrolled in a private school, with 9 (100.0% in the age bracket) attending a public institution.
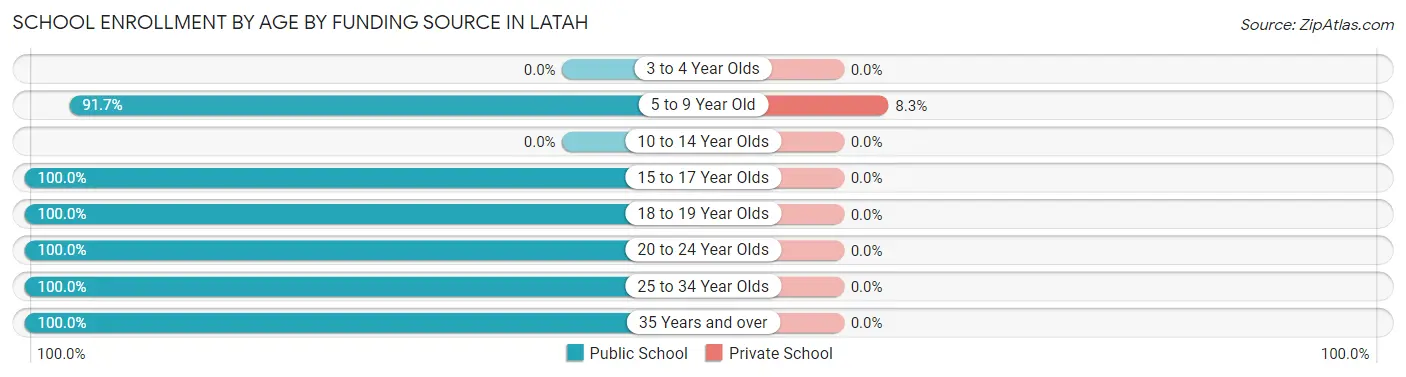
| Age Bracket | Public School | Private School |
| 3 to 4 Year Olds | 0 (0.0%) | 0 (0.0%) |
| 5 to 9 Year Old | 22 (91.7%) | 2 (8.3%) |
| 10 to 14 Year Olds | 0 (0.0%) | 0 (0.0%) |
| 15 to 17 Year Olds | 9 (100.0%) | 0 (0.0%) |
| 18 to 19 Year Olds | 4 (100.0%) | 0 (0.0%) |
| 20 to 24 Year Olds | 10 (100.0%) | 0 (0.0%) |
| 25 to 34 Year Olds | 4 (100.0%) | 0 (0.0%) |
| 35 Years and over | 1 (100.0%) | 0 (0.0%) |
| Total | 50 (96.2%) | 2 (3.8%) |
Educational Attainment by Field of Study in Latah
Bio, nature & agricultural (6 | 28.6%), psychology (6 | 28.6%), communications (5 | 23.8%), arts & humanities (3 | 14.3%), and business (1 | 4.8%) are the most common fields of study among 21 individuals in Latah who have obtained a bachelor's degree or higher.
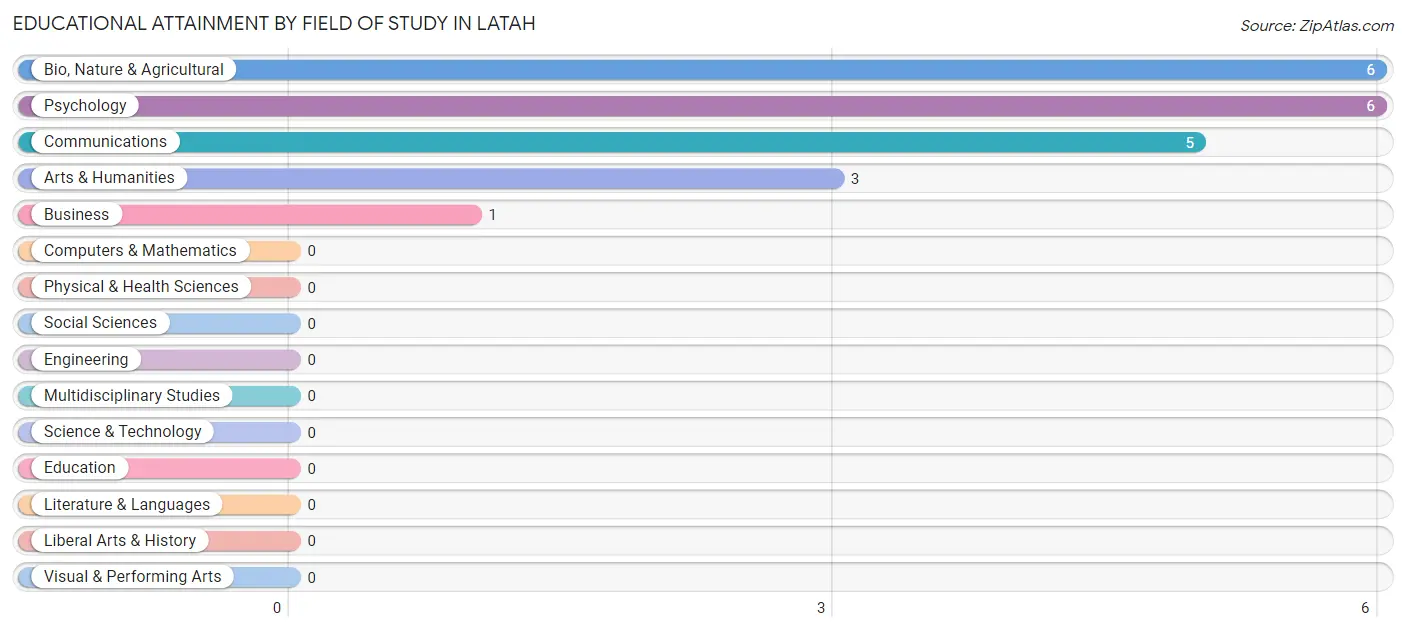
| Field of Study | # Graduates | % Graduates |
| Computers & Mathematics | 0 | 0.0% |
| Bio, Nature & Agricultural | 6 | 28.6% |
| Physical & Health Sciences | 0 | 0.0% |
| Psychology | 6 | 28.6% |
| Social Sciences | 0 | 0.0% |
| Engineering | 0 | 0.0% |
| Multidisciplinary Studies | 0 | 0.0% |
| Science & Technology | 0 | 0.0% |
| Business | 1 | 4.8% |
| Education | 0 | 0.0% |
| Literature & Languages | 0 | 0.0% |
| Liberal Arts & History | 0 | 0.0% |
| Visual & Performing Arts | 0 | 0.0% |
| Communications | 5 | 23.8% |
| Arts & Humanities | 3 | 14.3% |
| Total | 21 | 100.0% |
Transportation & Commute in Latah
Vehicle Availability by Sex in Latah
The most prevalent vehicle ownership categories in Latah are males with 3 vehicles (18, accounting for 58.1%) and females with 3 vehicles (6, making up 112.5%).
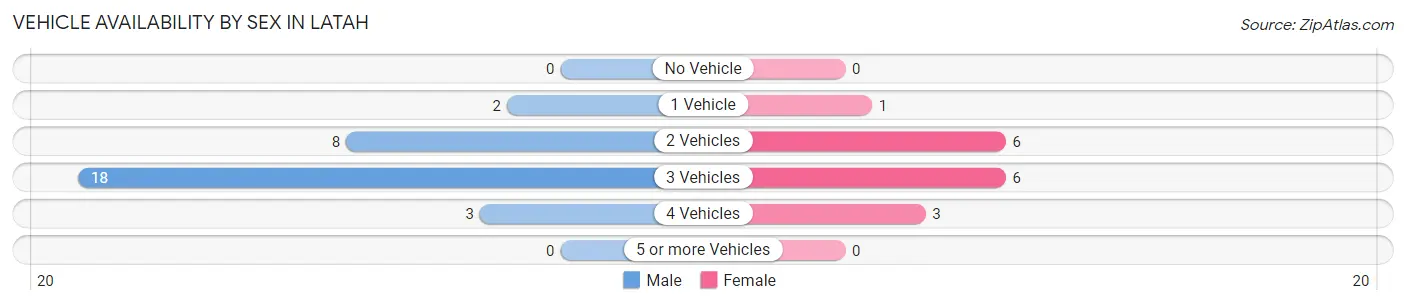
| Vehicles Available | Male | Female |
| No Vehicle | 0 (0.0%) | 0 (0.0%) |
| 1 Vehicle | 2 (6.5%) | 1 (6.2%) |
| 2 Vehicles | 8 (25.8%) | 6 (37.5%) |
| 3 Vehicles | 18 (58.1%) | 6 (37.5%) |
| 4 Vehicles | 3 (9.7%) | 3 (18.8%) |
| 5 or more Vehicles | 0 (0.0%) | 0 (0.0%) |
| Total | 31 (100.0%) | 16 (100.0%) |
Commute Time in Latah
The most frequently occuring commute durations in Latah are 30 to 34 minutes (13 commuters, 28.9%), 60 to 89 minutes (9 commuters, 20.0%), and 15 to 19 minutes (8 commuters, 17.8%).
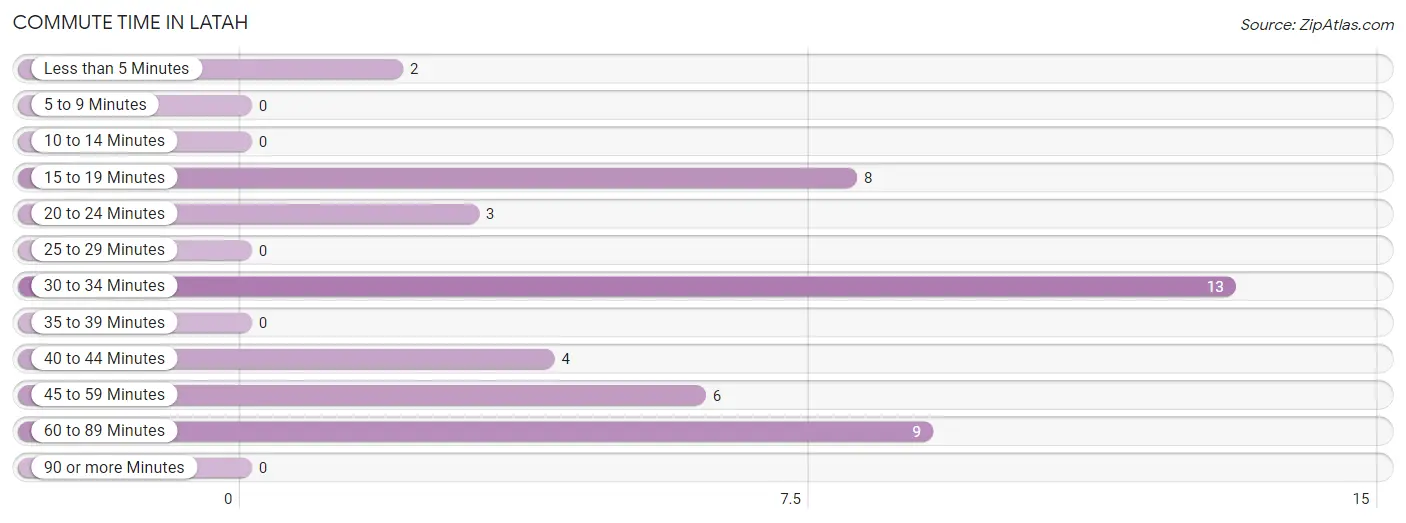
| Commute Time | # Commuters | % Commuters |
| Less than 5 Minutes | 2 | 4.4% |
| 5 to 9 Minutes | 0 | 0.0% |
| 10 to 14 Minutes | 0 | 0.0% |
| 15 to 19 Minutes | 8 | 17.8% |
| 20 to 24 Minutes | 3 | 6.7% |
| 25 to 29 Minutes | 0 | 0.0% |
| 30 to 34 Minutes | 13 | 28.9% |
| 35 to 39 Minutes | 0 | 0.0% |
| 40 to 44 Minutes | 4 | 8.9% |
| 45 to 59 Minutes | 6 | 13.3% |
| 60 to 89 Minutes | 9 | 20.0% |
| 90 or more Minutes | 0 | 0.0% |
Commute Time by Sex in Latah
The most common commute times in Latah are 30 to 34 minutes (10 commuters, 32.3%) for males and 15 to 19 minutes (8 commuters, 57.1%) for females.
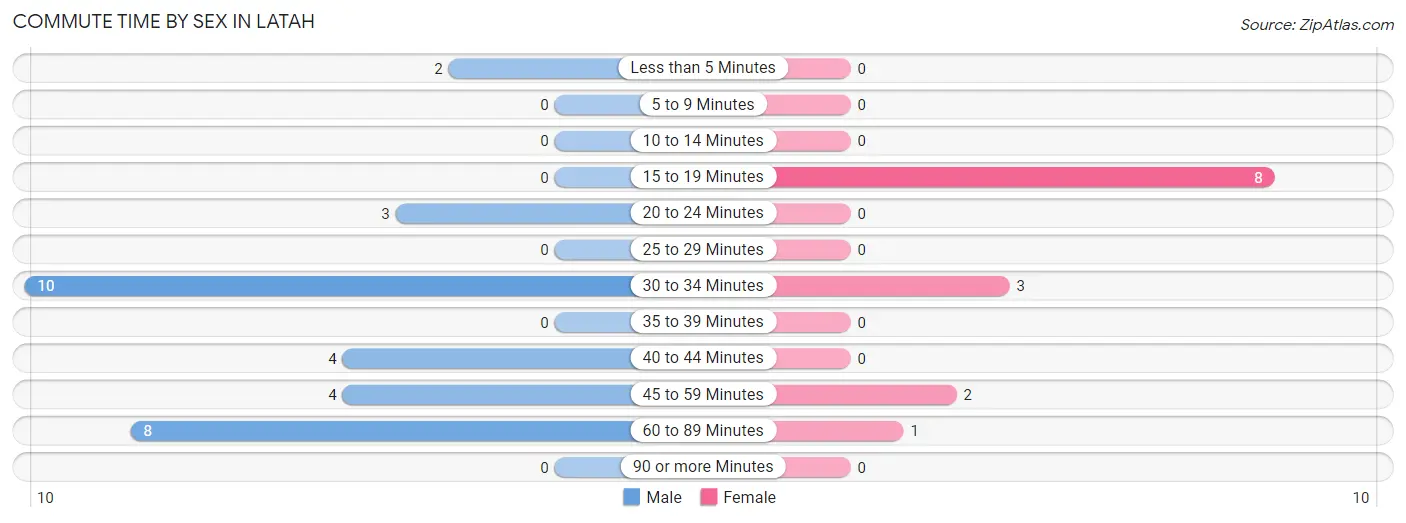
| Commute Time | Male | Female |
| Less than 5 Minutes | 2 (6.5%) | 0 (0.0%) |
| 5 to 9 Minutes | 0 (0.0%) | 0 (0.0%) |
| 10 to 14 Minutes | 0 (0.0%) | 0 (0.0%) |
| 15 to 19 Minutes | 0 (0.0%) | 8 (57.1%) |
| 20 to 24 Minutes | 3 (9.7%) | 0 (0.0%) |
| 25 to 29 Minutes | 0 (0.0%) | 0 (0.0%) |
| 30 to 34 Minutes | 10 (32.3%) | 3 (21.4%) |
| 35 to 39 Minutes | 0 (0.0%) | 0 (0.0%) |
| 40 to 44 Minutes | 4 (12.9%) | 0 (0.0%) |
| 45 to 59 Minutes | 4 (12.9%) | 2 (14.3%) |
| 60 to 89 Minutes | 8 (25.8%) | 1 (7.1%) |
| 90 or more Minutes | 0 (0.0%) | 0 (0.0%) |
Time of Departure to Work by Sex in Latah
The most frequent times of departure to work in Latah are 6:30 AM to 6:59 AM (11, 35.5%) for males and 12:00 PM to 3:59 PM (6, 42.9%) for females.
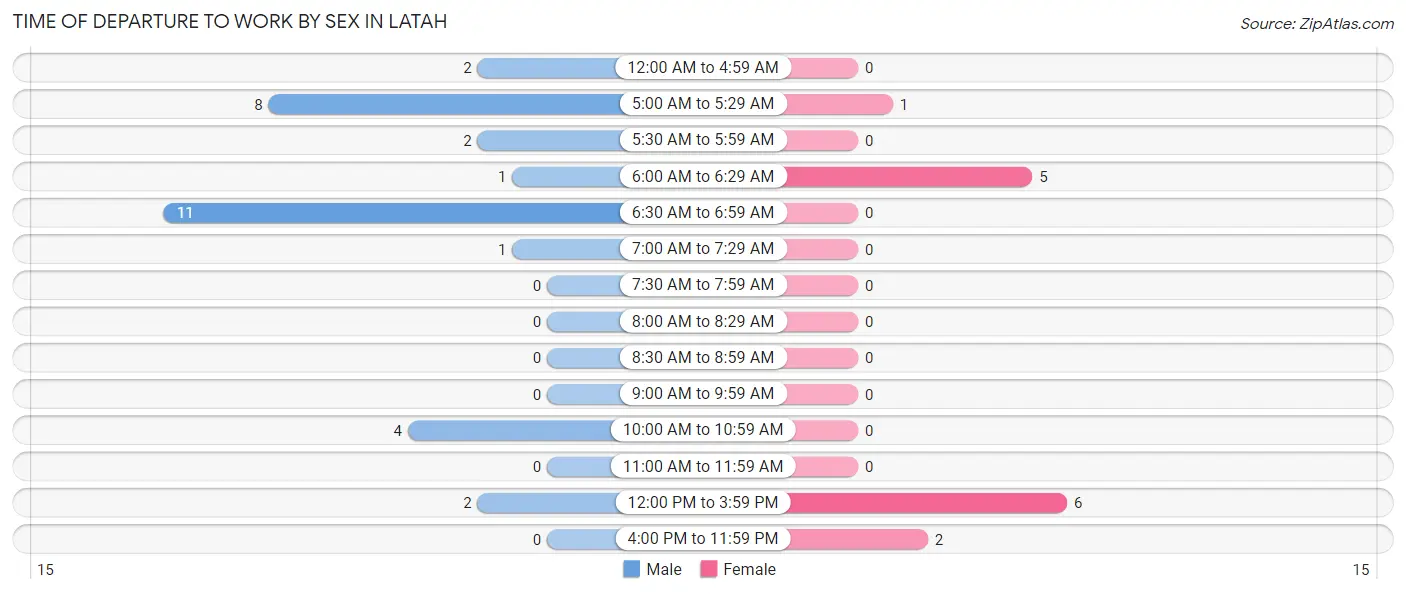
| Time of Departure | Male | Female |
| 12:00 AM to 4:59 AM | 2 (6.5%) | 0 (0.0%) |
| 5:00 AM to 5:29 AM | 8 (25.8%) | 1 (7.1%) |
| 5:30 AM to 5:59 AM | 2 (6.5%) | 0 (0.0%) |
| 6:00 AM to 6:29 AM | 1 (3.2%) | 5 (35.7%) |
| 6:30 AM to 6:59 AM | 11 (35.5%) | 0 (0.0%) |
| 7:00 AM to 7:29 AM | 1 (3.2%) | 0 (0.0%) |
| 7:30 AM to 7:59 AM | 0 (0.0%) | 0 (0.0%) |
| 8:00 AM to 8:29 AM | 0 (0.0%) | 0 (0.0%) |
| 8:30 AM to 8:59 AM | 0 (0.0%) | 0 (0.0%) |
| 9:00 AM to 9:59 AM | 0 (0.0%) | 0 (0.0%) |
| 10:00 AM to 10:59 AM | 4 (12.9%) | 0 (0.0%) |
| 11:00 AM to 11:59 AM | 0 (0.0%) | 0 (0.0%) |
| 12:00 PM to 3:59 PM | 2 (6.5%) | 6 (42.9%) |
| 4:00 PM to 11:59 PM | 0 (0.0%) | 2 (14.3%) |
| Total | 31 (100.0%) | 14 (100.0%) |
Housing Occupancy in Latah
Occupancy by Ownership in Latah
Of the total 59 dwellings in Latah, owner-occupied units account for 47 (79.7%), while renter-occupied units make up 12 (20.3%).
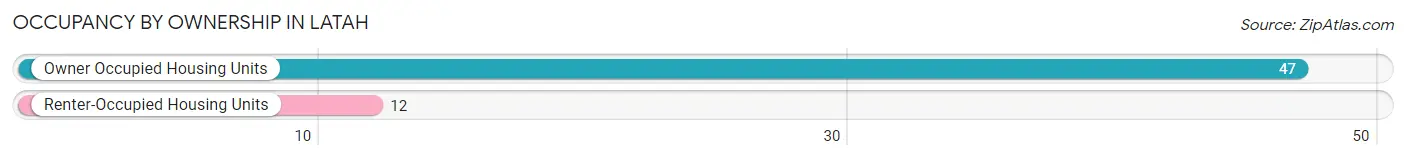
| Occupancy | # Housing Units | % Housing Units |
| Owner Occupied Housing Units | 47 | 79.7% |
| Renter-Occupied Housing Units | 12 | 20.3% |
| Total Occupied Housing Units | 59 | 100.0% |
Occupancy by Household Size in Latah
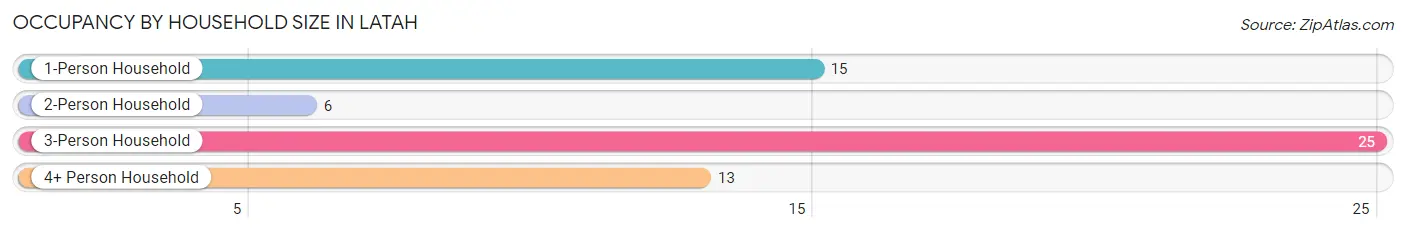
| Household Size | # Housing Units | % Housing Units |
| 1-Person Household | 15 | 25.4% |
| 2-Person Household | 6 | 10.2% |
| 3-Person Household | 25 | 42.4% |
| 4+ Person Household | 13 | 22.0% |
| Total Housing Units | 59 | 100.0% |
Occupancy by Ownership by Household Size in Latah
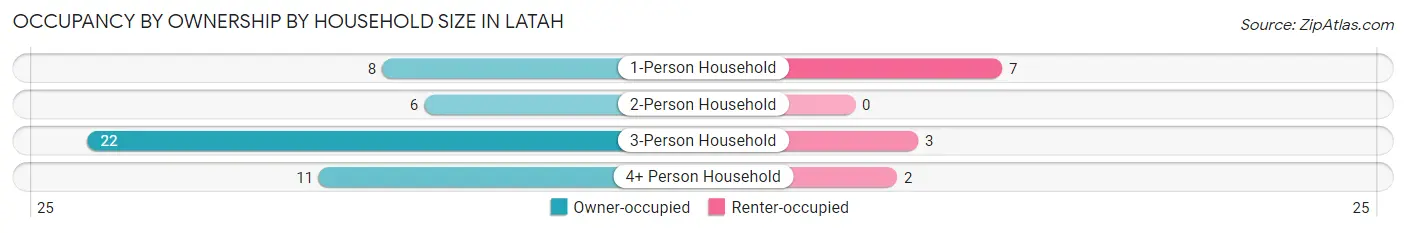
| Household Size | Owner-occupied | Renter-occupied |
| 1-Person Household | 8 (53.3%) | 7 (46.7%) |
| 2-Person Household | 6 (100.0%) | 0 (0.0%) |
| 3-Person Household | 22 (88.0%) | 3 (12.0%) |
| 4+ Person Household | 11 (84.6%) | 2 (15.4%) |
| Total Housing Units | 47 (79.7%) | 12 (20.3%) |
Occupancy by Educational Attainment in Latah
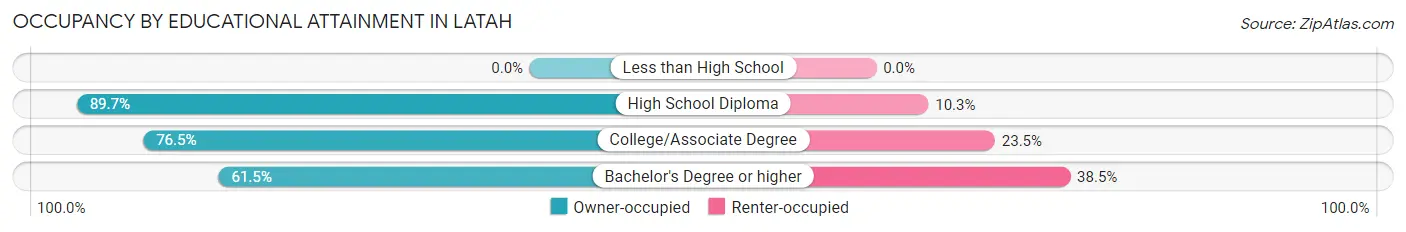
| Household Size | Owner-occupied | Renter-occupied |
| Less than High School | 0 (0.0%) | 0 (0.0%) |
| High School Diploma | 26 (89.7%) | 3 (10.3%) |
| College/Associate Degree | 13 (76.5%) | 4 (23.5%) |
| Bachelor's Degree or higher | 8 (61.5%) | 5 (38.5%) |
Occupancy by Age of Householder in Latah
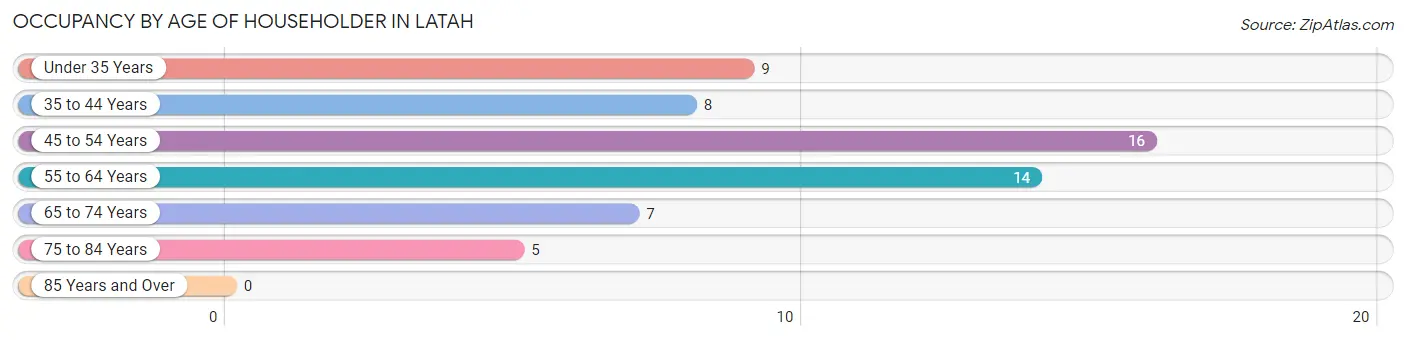
| Age Bracket | # Households | % Households |
| Under 35 Years | 9 | 15.2% |
| 35 to 44 Years | 8 | 13.6% |
| 45 to 54 Years | 16 | 27.1% |
| 55 to 64 Years | 14 | 23.7% |
| 65 to 74 Years | 7 | 11.9% |
| 75 to 84 Years | 5 | 8.5% |
| 85 Years and Over | 0 | 0.0% |
| Total | 59 | 100.0% |
Housing Finances in Latah
Median Income by Occupancy in Latah
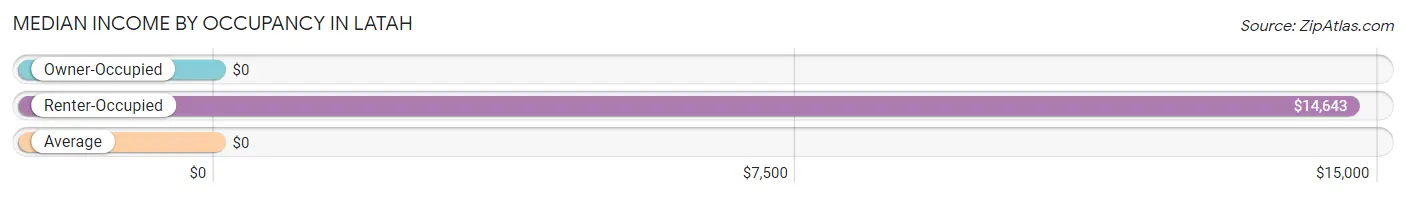
| Occupancy Type | # Households | Median Income |
| Owner-Occupied | 47 (79.7%) | $0 |
| Renter-Occupied | 12 (20.3%) | $14,643 |
| Average | 59 (100.0%) | $0 |
Occupancy by Householder Income Bracket in Latah
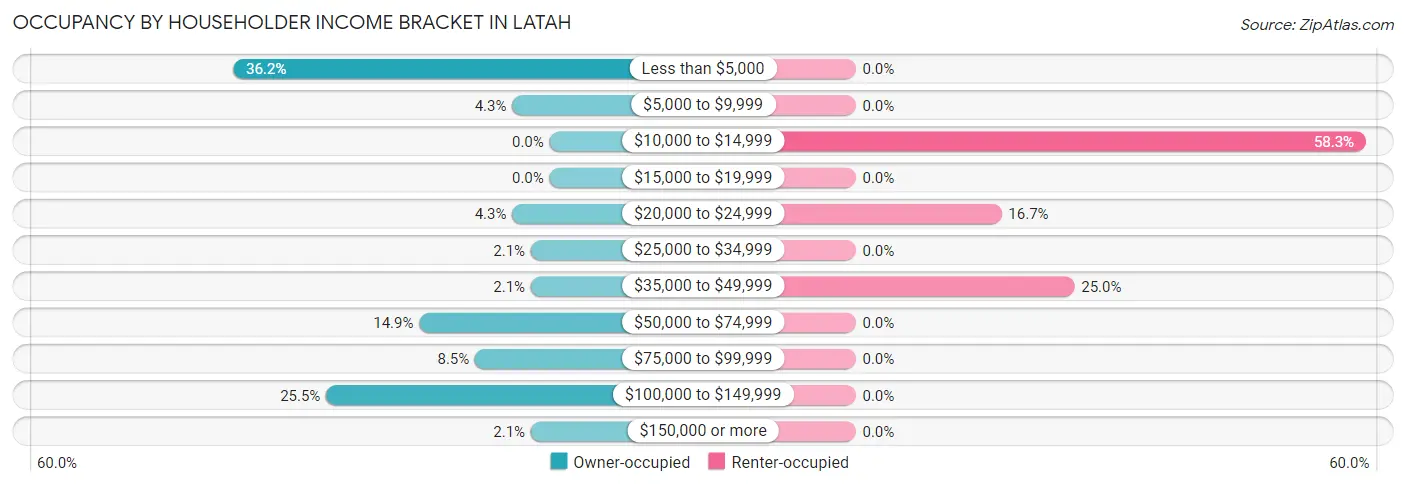
| Income Bracket | Owner-occupied | Renter-occupied |
| Less than $5,000 | 17 (36.2%) | 0 (0.0%) |
| $5,000 to $9,999 | 2 (4.3%) | 0 (0.0%) |
| $10,000 to $14,999 | 0 (0.0%) | 7 (58.3%) |
| $15,000 to $19,999 | 0 (0.0%) | 0 (0.0%) |
| $20,000 to $24,999 | 2 (4.3%) | 2 (16.7%) |
| $25,000 to $34,999 | 1 (2.1%) | 0 (0.0%) |
| $35,000 to $49,999 | 1 (2.1%) | 3 (25.0%) |
| $50,000 to $74,999 | 7 (14.9%) | 0 (0.0%) |
| $75,000 to $99,999 | 4 (8.5%) | 0 (0.0%) |
| $100,000 to $149,999 | 12 (25.5%) | 0 (0.0%) |
| $150,000 or more | 1 (2.1%) | 0 (0.0%) |
| Total | 47 (100.0%) | 12 (100.0%) |
Monthly Housing Cost Tiers in Latah
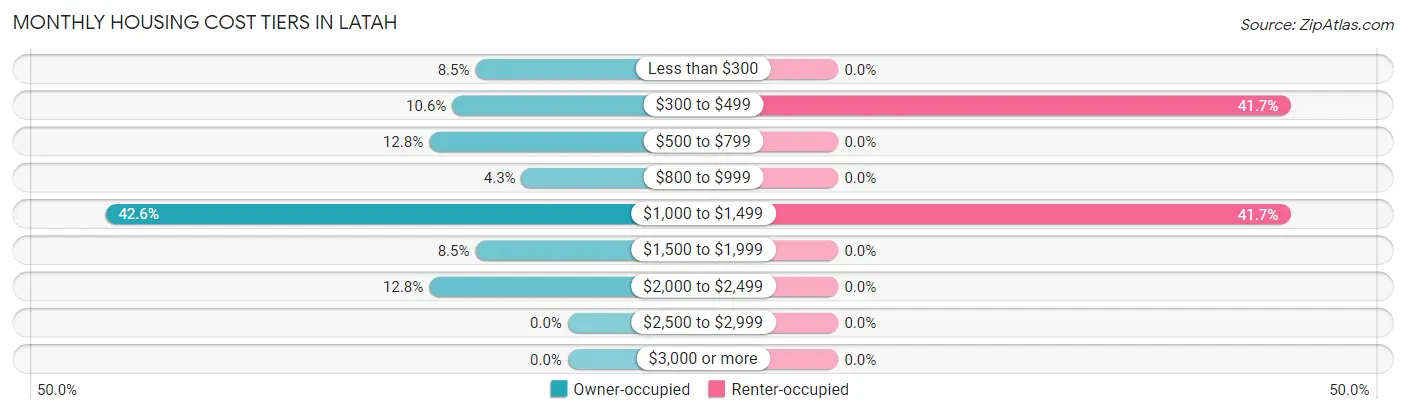
| Monthly Cost | Owner-occupied | Renter-occupied |
| Less than $300 | 4 (8.5%) | 0 (0.0%) |
| $300 to $499 | 5 (10.6%) | 5 (41.7%) |
| $500 to $799 | 6 (12.8%) | 0 (0.0%) |
| $800 to $999 | 2 (4.3%) | 0 (0.0%) |
| $1,000 to $1,499 | 20 (42.5%) | 5 (41.7%) |
| $1,500 to $1,999 | 4 (8.5%) | 0 (0.0%) |
| $2,000 to $2,499 | 6 (12.8%) | 0 (0.0%) |
| $2,500 to $2,999 | 0 (0.0%) | 0 (0.0%) |
| $3,000 or more | 0 (0.0%) | 0 (0.0%) |
| Total | 47 (100.0%) | 12 (100.0%) |
Physical Housing Characteristics in Latah
Housing Structures in Latah
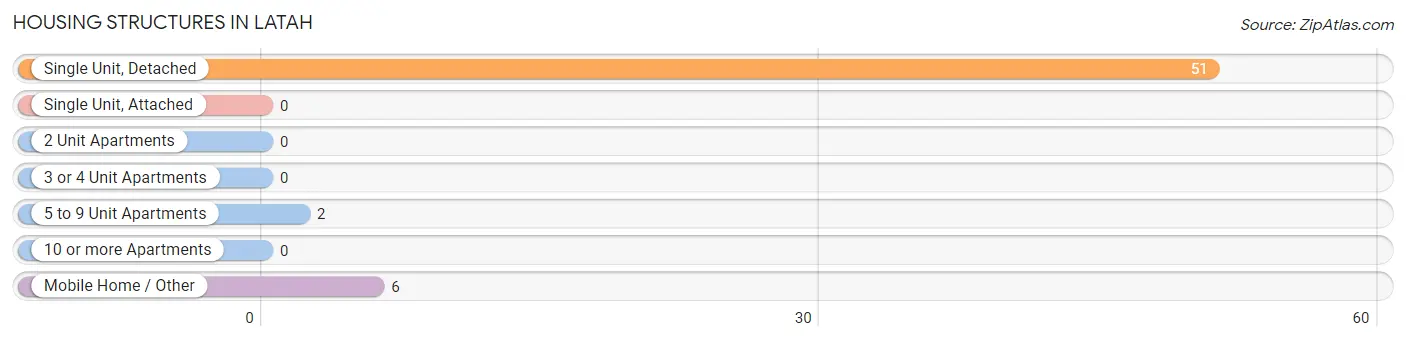
| Structure Type | # Housing Units | % Housing Units |
| Single Unit, Detached | 51 | 86.4% |
| Single Unit, Attached | 0 | 0.0% |
| 2 Unit Apartments | 0 | 0.0% |
| 3 or 4 Unit Apartments | 0 | 0.0% |
| 5 to 9 Unit Apartments | 2 | 3.4% |
| 10 or more Apartments | 0 | 0.0% |
| Mobile Home / Other | 6 | 10.2% |
| Total | 59 | 100.0% |
Housing Structures by Occupancy in Latah
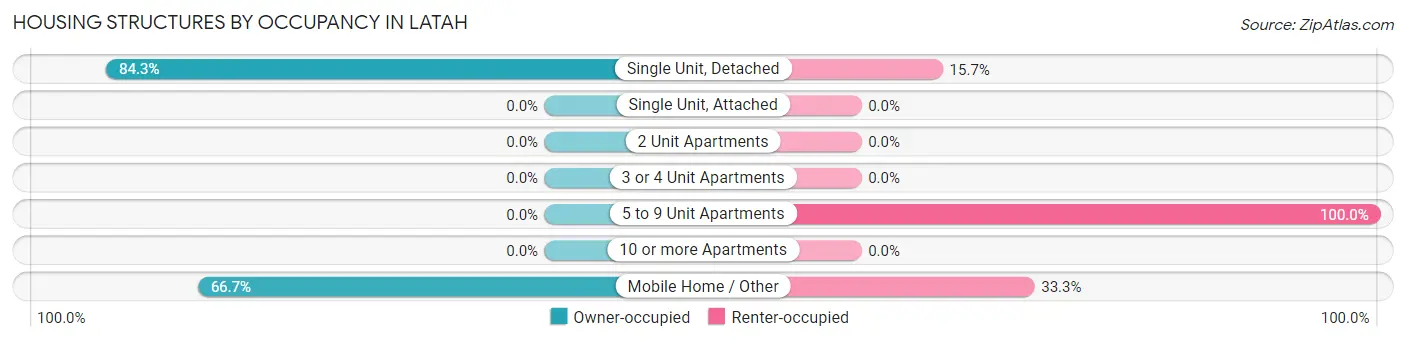
| Structure Type | Owner-occupied | Renter-occupied |
| Single Unit, Detached | 43 (84.3%) | 8 (15.7%) |
| Single Unit, Attached | 0 (0.0%) | 0 (0.0%) |
| 2 Unit Apartments | 0 (0.0%) | 0 (0.0%) |
| 3 or 4 Unit Apartments | 0 (0.0%) | 0 (0.0%) |
| 5 to 9 Unit Apartments | 0 (0.0%) | 2 (100.0%) |
| 10 or more Apartments | 0 (0.0%) | 0 (0.0%) |
| Mobile Home / Other | 4 (66.7%) | 2 (33.3%) |
| Total | 47 (79.7%) | 12 (20.3%) |
Housing Structures by Number of Rooms in Latah
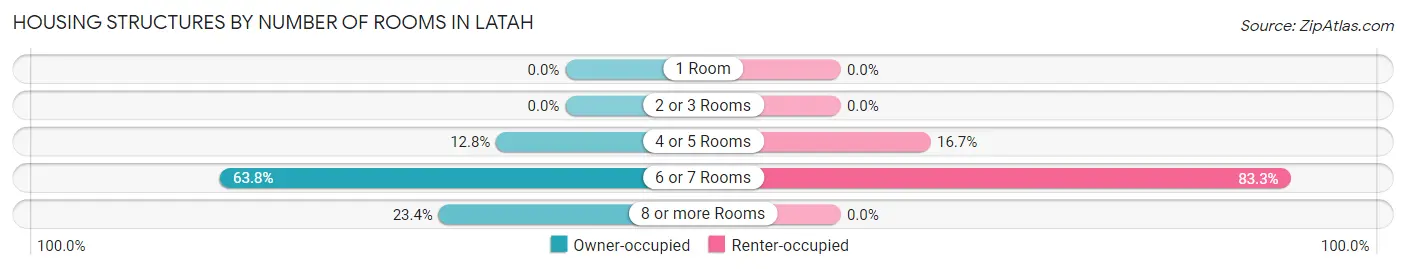
| Number of Rooms | Owner-occupied | Renter-occupied |
| 1 Room | 0 (0.0%) | 0 (0.0%) |
| 2 or 3 Rooms | 0 (0.0%) | 0 (0.0%) |
| 4 or 5 Rooms | 6 (12.8%) | 2 (16.7%) |
| 6 or 7 Rooms | 30 (63.8%) | 10 (83.3%) |
| 8 or more Rooms | 11 (23.4%) | 0 (0.0%) |
| Total | 47 (100.0%) | 12 (100.0%) |
Housing Structure by Heating Type in Latah
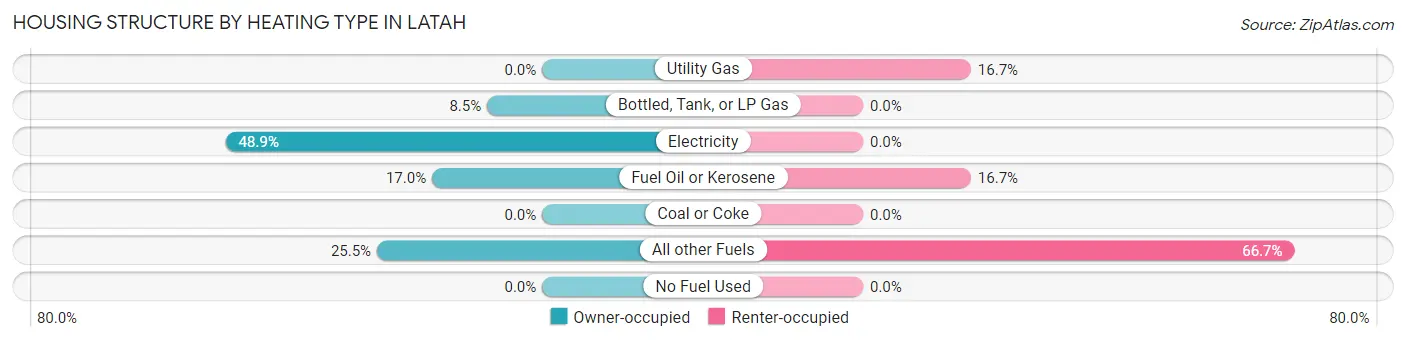
| Heating Type | Owner-occupied | Renter-occupied |
| Utility Gas | 0 (0.0%) | 2 (16.7%) |
| Bottled, Tank, or LP Gas | 4 (8.5%) | 0 (0.0%) |
| Electricity | 23 (48.9%) | 0 (0.0%) |
| Fuel Oil or Kerosene | 8 (17.0%) | 2 (16.7%) |
| Coal or Coke | 0 (0.0%) | 0 (0.0%) |
| All other Fuels | 12 (25.5%) | 8 (66.7%) |
| No Fuel Used | 0 (0.0%) | 0 (0.0%) |
| Total | 47 (100.0%) | 12 (100.0%) |
Household Vehicle Usage in Latah
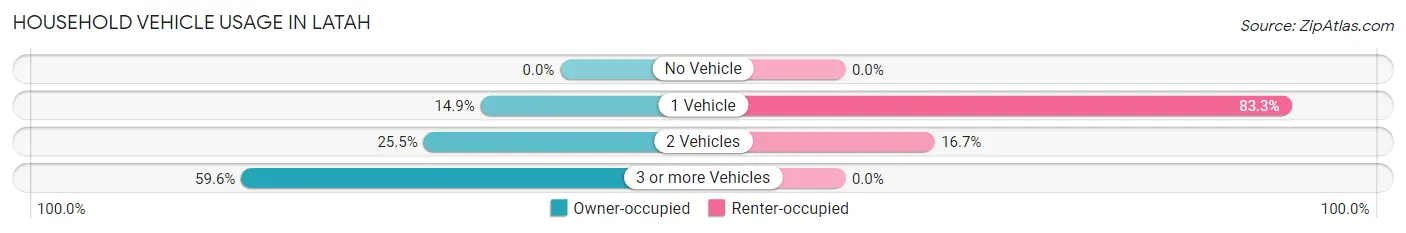
| Vehicles per Household | Owner-occupied | Renter-occupied |
| No Vehicle | 0 (0.0%) | 0 (0.0%) |
| 1 Vehicle | 7 (14.9%) | 10 (83.3%) |
| 2 Vehicles | 12 (25.5%) | 2 (16.7%) |
| 3 or more Vehicles | 28 (59.6%) | 0 (0.0%) |
| Total | 47 (100.0%) | 12 (100.0%) |
Real Estate & Mortgages in Latah
Real Estate and Mortgage Overview in Latah
| Characteristic | Without Mortgage | With Mortgage |
| Housing Units | 14 | 33 |
| Median Property Value | $80,000 | $0 |
| Median Household Income | - | - |
| Monthly Housing Costs | $450 | $0 |
| Real Estate Taxes | $1,222 | $0 |
Property Value by Mortgage Status in Latah
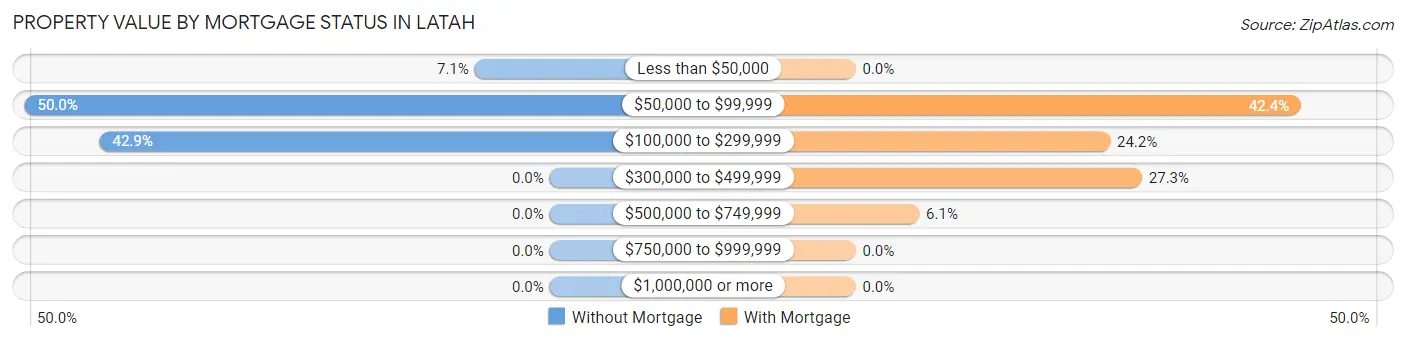
| Property Value | Without Mortgage | With Mortgage |
| Less than $50,000 | 1 (7.1%) | 0 (0.0%) |
| $50,000 to $99,999 | 7 (50.0%) | 14 (42.4%) |
| $100,000 to $299,999 | 6 (42.9%) | 8 (24.2%) |
| $300,000 to $499,999 | 0 (0.0%) | 9 (27.3%) |
| $500,000 to $749,999 | 0 (0.0%) | 2 (6.1%) |
| $750,000 to $999,999 | 0 (0.0%) | 0 (0.0%) |
| $1,000,000 or more | 0 (0.0%) | 0 (0.0%) |
| Total | 14 (100.0%) | 33 (100.0%) |
Household Income by Mortgage Status in Latah
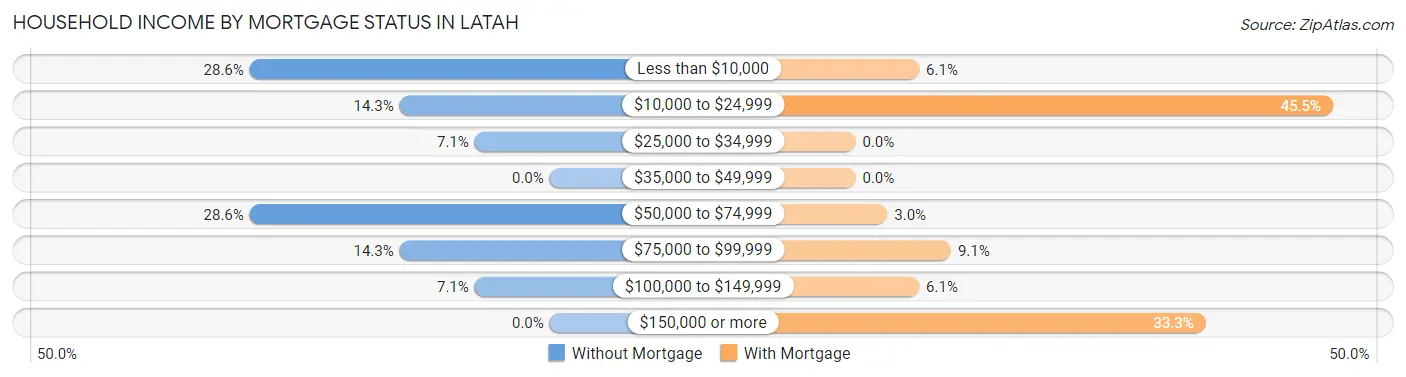
| Household Income | Without Mortgage | With Mortgage |
| Less than $10,000 | 4 (28.6%) | 2 (6.1%) |
| $10,000 to $24,999 | 2 (14.3%) | 15 (45.5%) |
| $25,000 to $34,999 | 1 (7.1%) | 0 (0.0%) |
| $35,000 to $49,999 | 0 (0.0%) | 0 (0.0%) |
| $50,000 to $74,999 | 4 (28.6%) | 1 (3.0%) |
| $75,000 to $99,999 | 2 (14.3%) | 3 (9.1%) |
| $100,000 to $149,999 | 1 (7.1%) | 2 (6.1%) |
| $150,000 or more | 0 (0.0%) | 11 (33.3%) |
| Total | 14 (100.0%) | 33 (100.0%) |
Property Value to Household Income Ratio in Latah
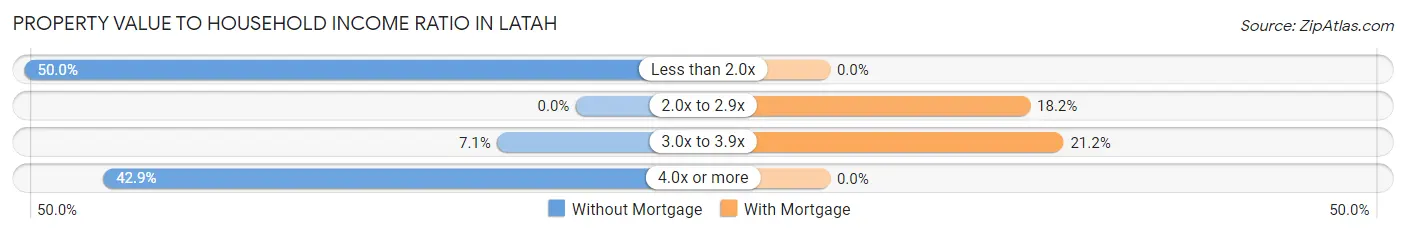
| Value-to-Income Ratio | Without Mortgage | With Mortgage |
| Less than 2.0x | 7 (50.0%) | 0 (0.0%) |
| 2.0x to 2.9x | 0 (0.0%) | 6 (18.2%) |
| 3.0x to 3.9x | 1 (7.1%) | 7 (21.2%) |
| 4.0x or more | 6 (42.9%) | 0 (0.0%) |
| Total | 14 (100.0%) | 33 (100.0%) |
Real Estate Taxes by Mortgage Status in Latah
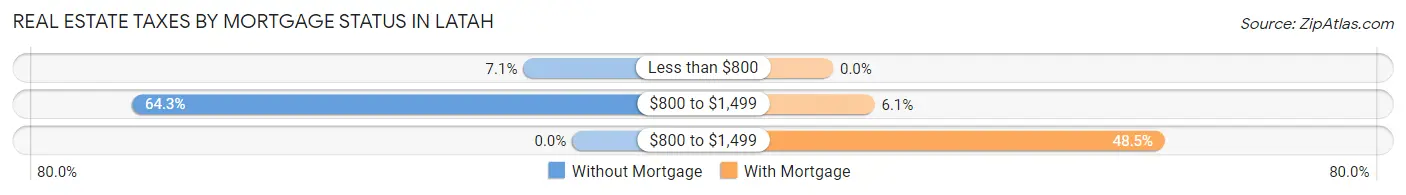
| Property Taxes | Without Mortgage | With Mortgage |
| Less than $800 | 1 (7.1%) | 0 (0.0%) |
| $800 to $1,499 | 9 (64.3%) | 2 (6.1%) |
| $800 to $1,499 | 0 (0.0%) | 16 (48.5%) |
| Total | 14 (100.0%) | 33 (100.0%) |
Health & Disability in Latah
Health Insurance Coverage by Age in Latah
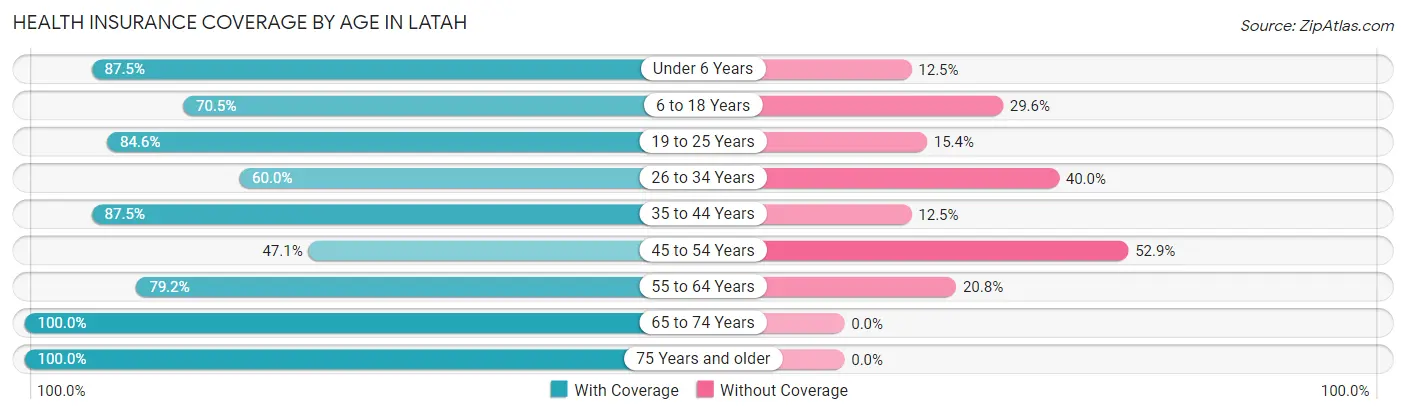
| Age Bracket | With Coverage | Without Coverage |
| Under 6 Years | 7 (87.5%) | 1 (12.5%) |
| 6 to 18 Years | 31 (70.5%) | 13 (29.5%) |
| 19 to 25 Years | 11 (84.6%) | 2 (15.4%) |
| 26 to 34 Years | 6 (60.0%) | 4 (40.0%) |
| 35 to 44 Years | 14 (87.5%) | 2 (12.5%) |
| 45 to 54 Years | 16 (47.1%) | 18 (52.9%) |
| 55 to 64 Years | 19 (79.2%) | 5 (20.8%) |
| 65 to 74 Years | 10 (100.0%) | 0 (0.0%) |
| 75 Years and older | 9 (100.0%) | 0 (0.0%) |
| Total | 123 (73.2%) | 45 (26.8%) |
Health Insurance Coverage by Citizenship Status in Latah
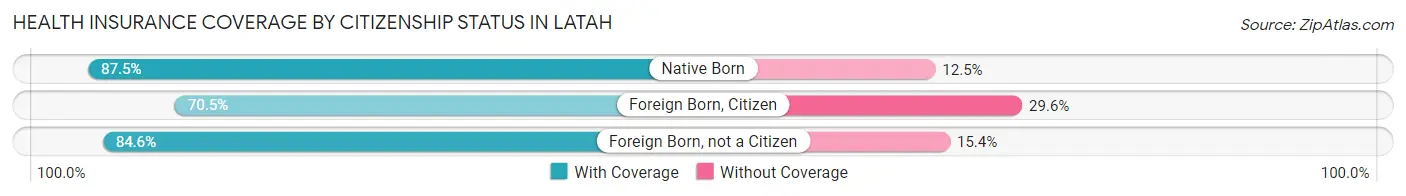
| Citizenship Status | With Coverage | Without Coverage |
| Native Born | 7 (87.5%) | 1 (12.5%) |
| Foreign Born, Citizen | 31 (70.5%) | 13 (29.5%) |
| Foreign Born, not a Citizen | 11 (84.6%) | 2 (15.4%) |
Health Insurance Coverage by Household Income in Latah
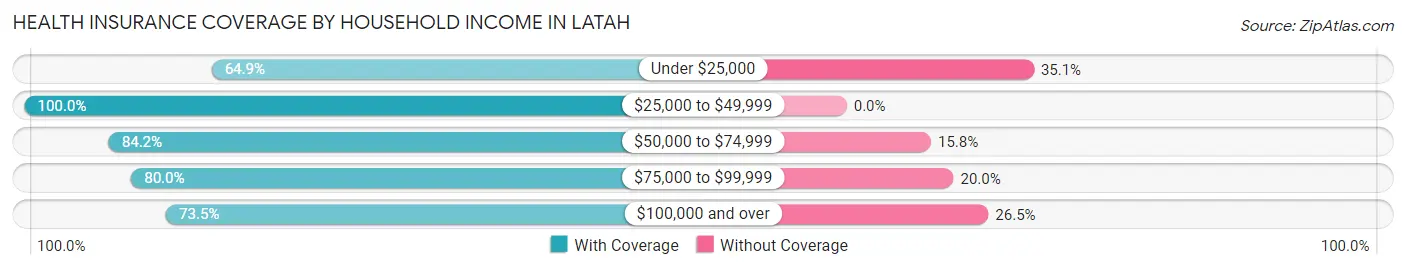
| Household Income | With Coverage | Without Coverage |
| Under $25,000 | 50 (64.9%) | 27 (35.1%) |
| $25,000 to $49,999 | 13 (100.0%) | 0 (0.0%) |
| $50,000 to $74,999 | 16 (84.2%) | 3 (15.8%) |
| $75,000 to $99,999 | 8 (80.0%) | 2 (20.0%) |
| $100,000 and over | 36 (73.5%) | 13 (26.5%) |
Public vs Private Health Insurance Coverage by Age in Latah
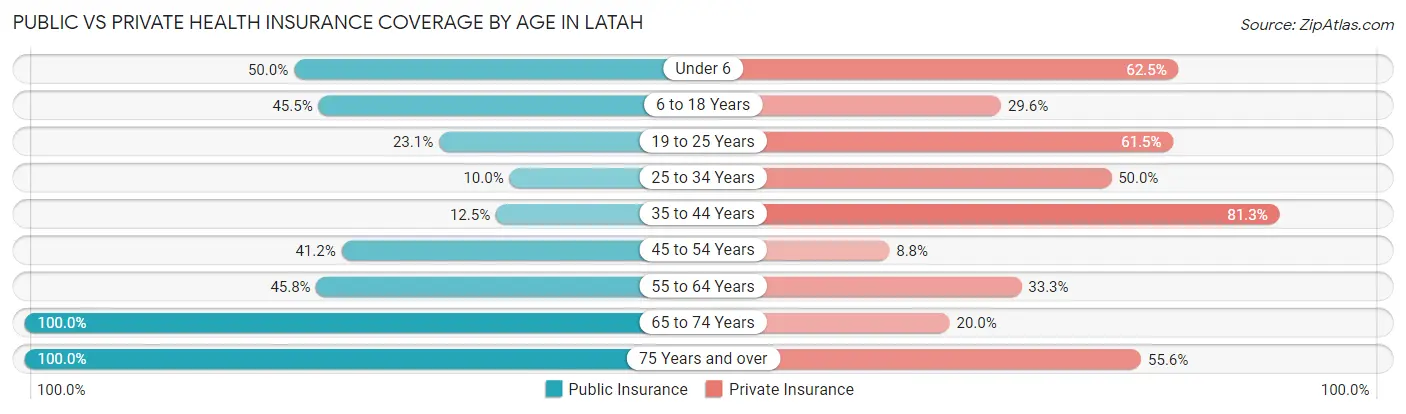
| Age Bracket | Public Insurance | Private Insurance |
| Under 6 | 4 (50.0%) | 5 (62.5%) |
| 6 to 18 Years | 20 (45.5%) | 13 (29.5%) |
| 19 to 25 Years | 3 (23.1%) | 8 (61.5%) |
| 25 to 34 Years | 1 (10.0%) | 5 (50.0%) |
| 35 to 44 Years | 2 (12.5%) | 13 (81.2%) |
| 45 to 54 Years | 14 (41.2%) | 3 (8.8%) |
| 55 to 64 Years | 11 (45.8%) | 8 (33.3%) |
| 65 to 74 Years | 10 (100.0%) | 2 (20.0%) |
| 75 Years and over | 9 (100.0%) | 5 (55.6%) |
| Total | 74 (44.1%) | 62 (36.9%) |
Disability Status by Sex by Age in Latah
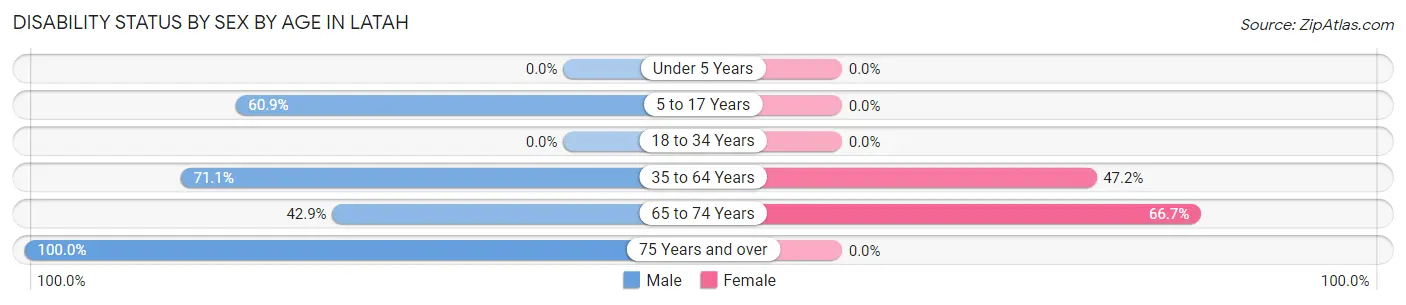
| Age Bracket | Male | Female |
| Under 5 Years | 0 (0.0%) | 0 (0.0%) |
| 5 to 17 Years | 14 (60.9%) | 0 (0.0%) |
| 18 to 34 Years | 0 (0.0%) | 0 (0.0%) |
| 35 to 64 Years | 27 (71.1%) | 17 (47.2%) |
| 65 to 74 Years | 3 (42.9%) | 2 (66.7%) |
| 75 Years and over | 9 (100.0%) | 0 (0.0%) |
Disability Class by Sex by Age in Latah
Disability Class: Hearing Difficulty
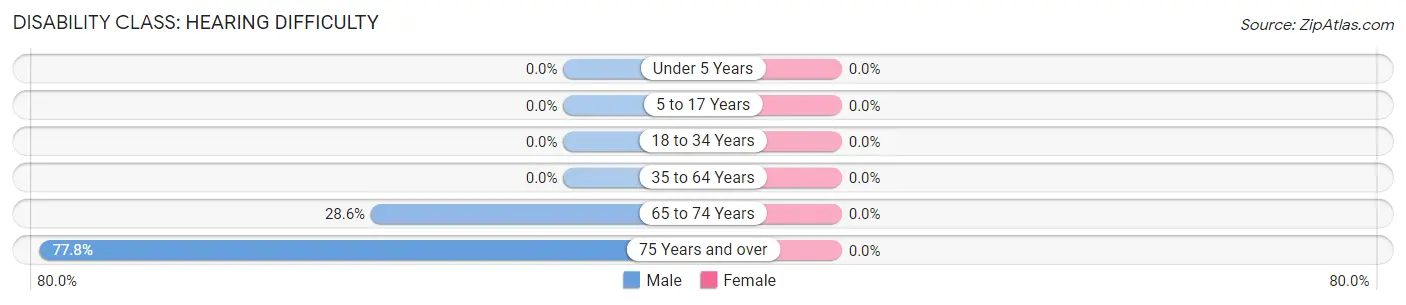
| Age Bracket | Male | Female |
| Under 5 Years | 0 (0.0%) | 0 (0.0%) |
| 5 to 17 Years | 0 (0.0%) | 0 (0.0%) |
| 18 to 34 Years | 0 (0.0%) | 0 (0.0%) |
| 35 to 64 Years | 0 (0.0%) | 0 (0.0%) |
| 65 to 74 Years | 2 (28.6%) | 0 (0.0%) |
| 75 Years and over | 7 (77.8%) | 0 (0.0%) |
Disability Class: Vision Difficulty
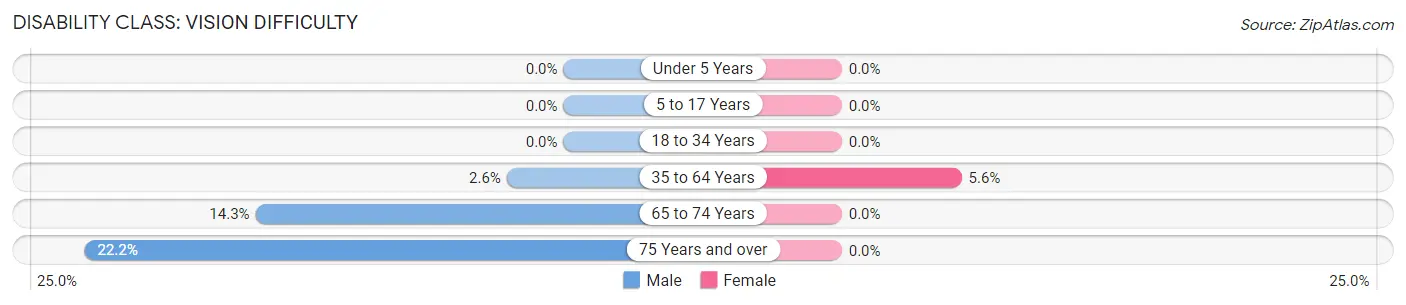
| Age Bracket | Male | Female |
| Under 5 Years | 0 (0.0%) | 0 (0.0%) |
| 5 to 17 Years | 0 (0.0%) | 0 (0.0%) |
| 18 to 34 Years | 0 (0.0%) | 0 (0.0%) |
| 35 to 64 Years | 1 (2.6%) | 2 (5.6%) |
| 65 to 74 Years | 1 (14.3%) | 0 (0.0%) |
| 75 Years and over | 2 (22.2%) | 0 (0.0%) |
Disability Class: Cognitive Difficulty
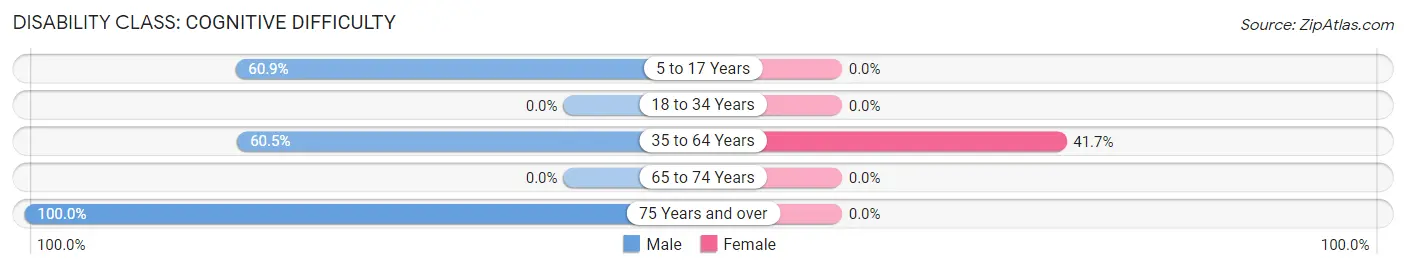
| Age Bracket | Male | Female |
| 5 to 17 Years | 14 (60.9%) | 0 (0.0%) |
| 18 to 34 Years | 0 (0.0%) | 0 (0.0%) |
| 35 to 64 Years | 23 (60.5%) | 15 (41.7%) |
| 65 to 74 Years | 0 (0.0%) | 0 (0.0%) |
| 75 Years and over | 9 (100.0%) | 0 (0.0%) |
Disability Class: Ambulatory Difficulty
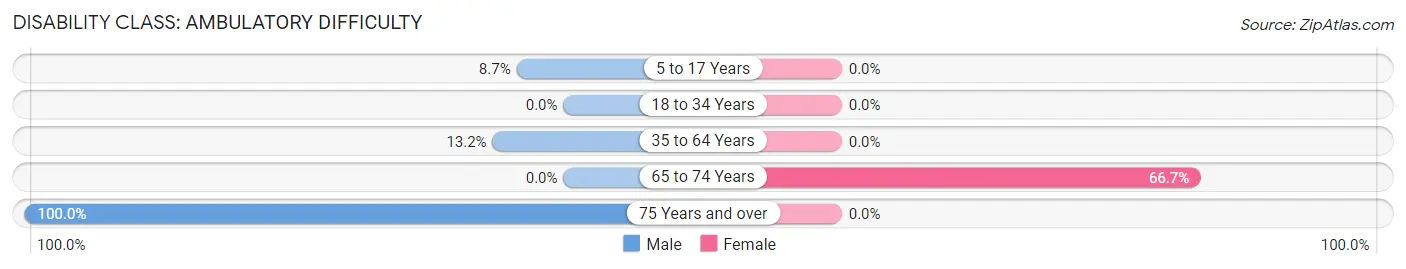
| Age Bracket | Male | Female |
| 5 to 17 Years | 2 (8.7%) | 0 (0.0%) |
| 18 to 34 Years | 0 (0.0%) | 0 (0.0%) |
| 35 to 64 Years | 5 (13.2%) | 0 (0.0%) |
| 65 to 74 Years | 0 (0.0%) | 2 (66.7%) |
| 75 Years and over | 9 (100.0%) | 0 (0.0%) |
Disability Class: Self-Care Difficulty
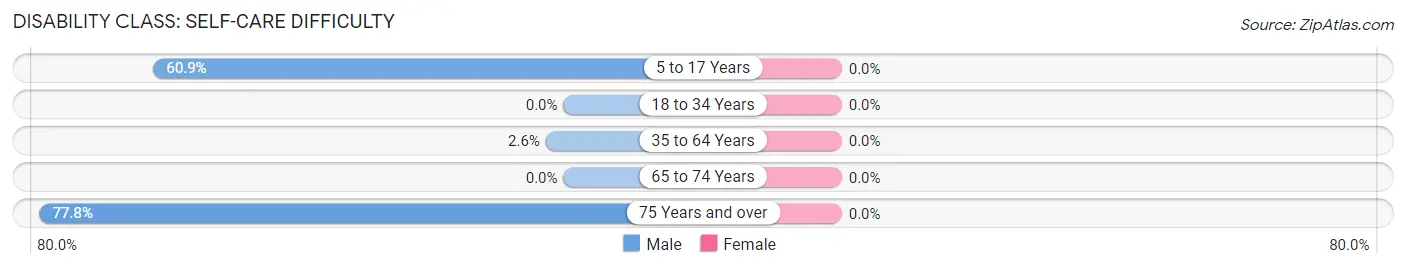
| Age Bracket | Male | Female |
| 5 to 17 Years | 14 (60.9%) | 0 (0.0%) |
| 18 to 34 Years | 0 (0.0%) | 0 (0.0%) |
| 35 to 64 Years | 1 (2.6%) | 0 (0.0%) |
| 65 to 74 Years | 0 (0.0%) | 0 (0.0%) |
| 75 Years and over | 7 (77.8%) | 0 (0.0%) |
Technology Access in Latah
Computing Device Access in Latah
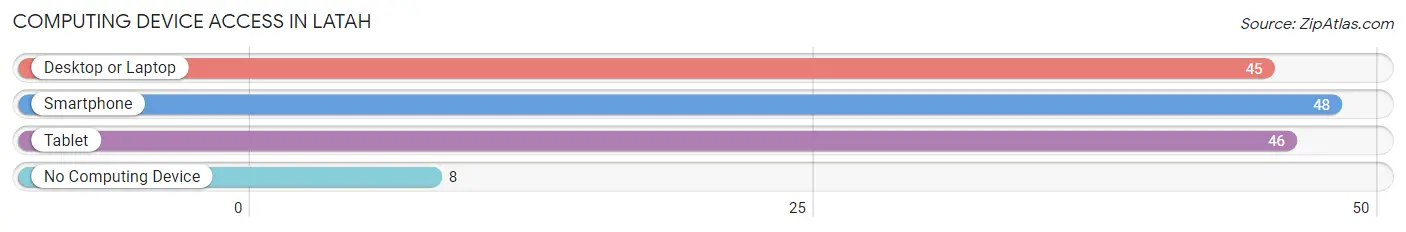
| Device Type | # Households | % Households |
| Desktop or Laptop | 45 | 76.3% |
| Smartphone | 48 | 81.4% |
| Tablet | 46 | 78.0% |
| No Computing Device | 8 | 13.6% |
| Total | 59 | 100.0% |
Internet Access in Latah
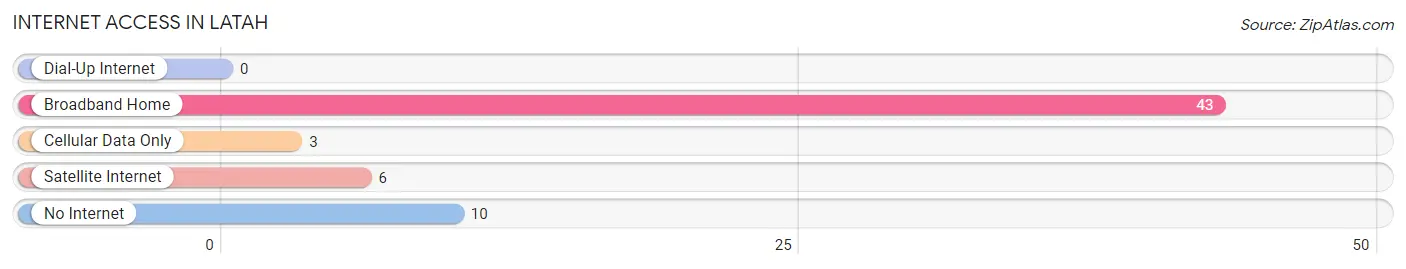
| Internet Type | # Households | % Households |
| Dial-Up Internet | 0 | 0.0% |
| Broadband Home | 43 | 72.9% |
| Cellular Data Only | 3 | 5.1% |
| Satellite Internet | 6 | 10.2% |
| No Internet | 10 | 17.0% |
| Total | 59 | 100.0% |
Latah Summary
Latah, Washington is a small unincorporated community located in the southeastern corner of Spokane County, Washington. It is situated on the Spokane River, approximately 20 miles south of Spokane. The population of Latah was estimated to be around 1,000 in 2020.
History
Latah was first settled in the late 1800s by homesteaders who were attracted to the area by its fertile soil and abundant natural resources. The town was originally known as "Latah Station" and was a stop on the Spokane, Portland and Seattle Railway. The town was officially incorporated in 1909 and was named after the nearby Latah Creek.
Latah has a rich history of agriculture and logging. The area was home to several sawmills and logging camps, and the town was a major supplier of lumber to the region. The town also had a thriving dairy industry, with several local farms producing milk and other dairy products.
Geography
Latah is located in the southeastern corner of Spokane County, Washington. It is situated on the Spokane River, approximately 20 miles south of Spokane. The town is surrounded by rolling hills and is located in a valley between two mountain ranges. The area is known for its scenic beauty and is home to several parks and recreational areas.
Latah has a humid continental climate, with hot summers and cold winters. The average annual temperature is around 50 degrees Fahrenheit, and the average annual precipitation is around 20 inches.
Economy
Latah's economy is largely based on agriculture and tourism. The town is home to several farms and ranches, and the area is known for its production of wheat, barley, and other grains. The town is also home to several wineries and breweries, and the area is a popular destination for wine and beer enthusiasts.
Latah is also home to several small businesses, including restaurants, shops, and other services. The town is also home to several bed and breakfasts, and the area is a popular destination for tourists.
Demographics
Latah has a population of around 1,000 people. The town is predominantly white, with around 90% of the population identifying as Caucasian. The town also has a small Hispanic population, with around 5% of the population identifying as Hispanic or Latino. The median household income in Latah is around $50,000, and the median home value is around $200,000.
Latah is a small, rural community with a strong sense of community and a rich history. The town is home to several parks and recreational areas, and the area is known for its scenic beauty and abundance of natural resources. The town is also home to several small businesses, and the area is a popular destination for tourists.
Common Questions
What is Per Capita Income in Latah?
Per Capita income in Latah is $17,882.
What is Inequality or Gini Index in Latah?
Inequality or Gini Index in Latah is 0.54.
What is the Total Population of Latah?
Total Population of Latah is 168.
What is the Total Male Population of Latah?
Total Male Population of Latah is 100.
What is the Total Female Population of Latah?
Total Female Population of Latah is 68.
What is the Ratio of Males per 100 Females in Latah?
There are 147.06 Males per 100 Females in Latah.
What is the Ratio of Females per 100 Males in Latah?
There are 68.00 Females per 100 Males in Latah.
What is the Median Population Age in Latah?
Median Population Age in Latah is 40.0 Years.
What is the Average Family Size in Latah
Average Family Size in Latah is 2.8 People.
What is the Average Household Size in Latah
Average Household Size in Latah is 2.9 People.
How Large is the Labor Force in Latah?
There are 47 People in the Labor Forcein in Latah.
What is the Percentage of People in the Labor Force in Latah?
36.7% of People are in the Labor Force in Latah.