Carson, WA Map & Demographics
Carson Map
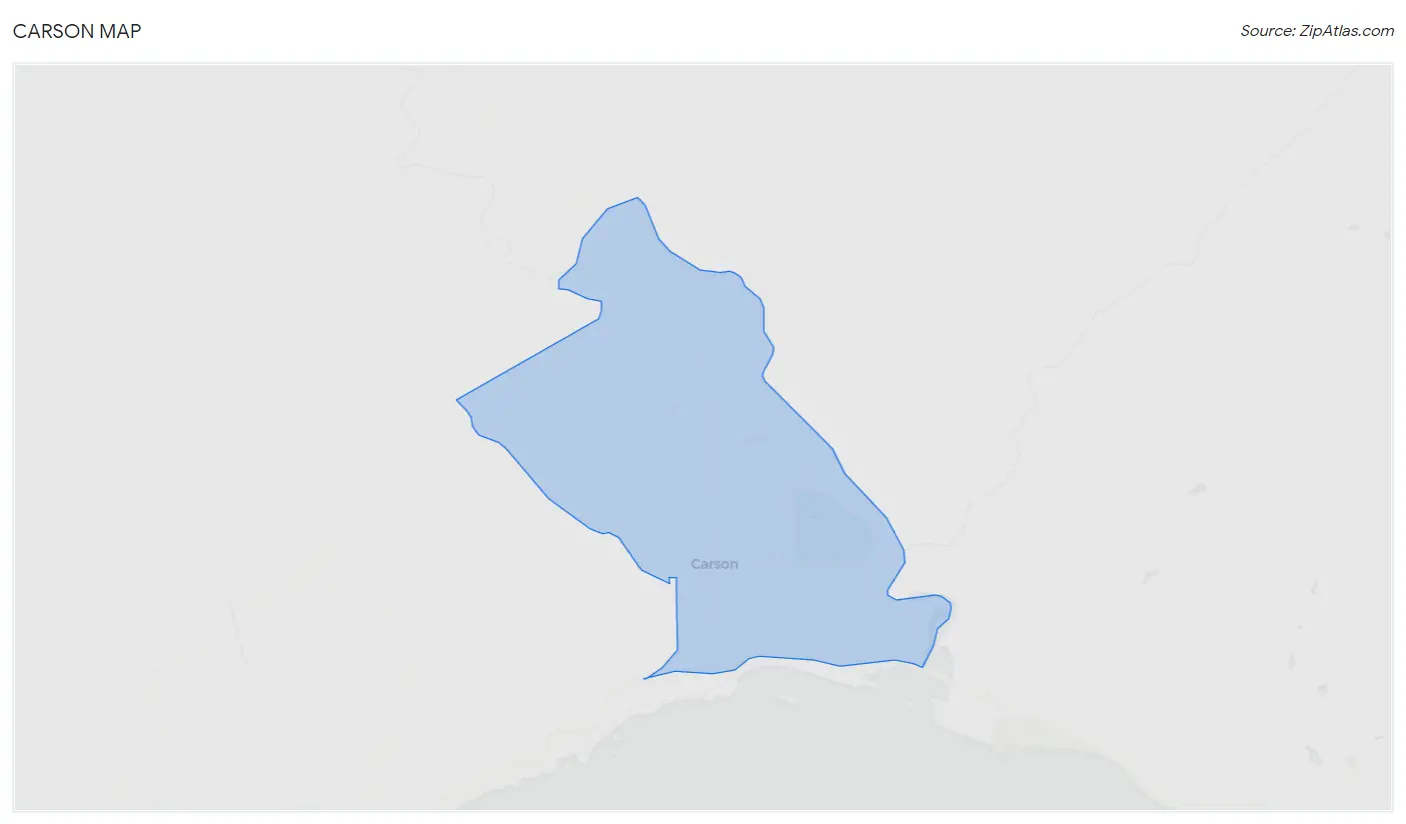
Carson Overview
$31,651
PER CAPITA INCOME
$82,566
AVG FAMILY INCOME
$65,898
AVG HOUSEHOLD INCOME
16.0%
WAGE / INCOME GAP [ % ]
84.0¢/ $1
WAGE / INCOME GAP [ $ ]
0.42
INEQUALITY / GINI INDEX
2,349
TOTAL POPULATION
1,149
MALE POPULATION
1,200
FEMALE POPULATION
95.75
MALES / 100 FEMALES
104.44
FEMALES / 100 MALES
51.4
MEDIAN AGE
2.8
AVG FAMILY SIZE
2.3
AVG HOUSEHOLD SIZE
1,025
LABOR FORCE [ PEOPLE ]
51.6%
PERCENT IN LABOR FORCE
6.2%
UNEMPLOYMENT RATE
Carson Zip Codes
Carson Area Codes
Income in Carson
Income Overview in Carson
Per Capita Income in Carson is $31,651, while median incomes of families and households are $82,566 and $65,898 respectively.
| Characteristic | Number | Measure |
| Per Capita Income | 2,349 | $31,651 |
| Median Family Income | 651 | $82,566 |
| Mean Family Income | 651 | $87,943 |
| Median Household Income | 1,009 | $65,898 |
| Mean Household Income | 1,009 | $70,816 |
| Income Deficit | 651 | $0 |
| Wage / Income Gap (%) | 2,349 | 16.05% |
| Wage / Income Gap ($) | 2,349 | 83.95¢ per $1 |
| Gini / Inequality Index | 2,349 | 0.42 |
Earnings by Sex in Carson
Average Earnings in Carson are $42,039, $48,036 for men and $40,327 for women, a difference of 16.1%.
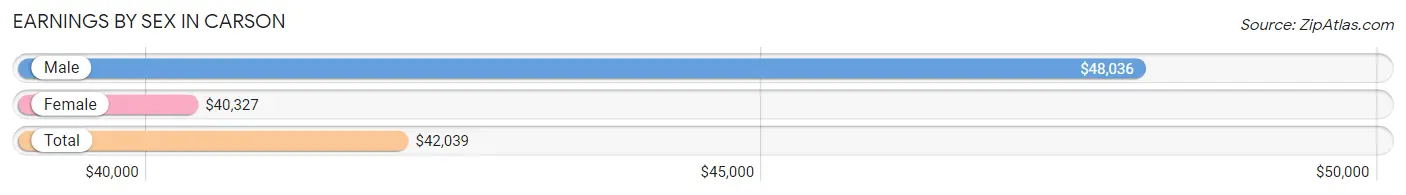
| Sex | Number | Average Earnings |
| Male | 658 (62.4%) | $48,036 |
| Female | 397 (37.6%) | $40,327 |
| Total | 1,055 (100.0%) | $42,039 |
Earnings by Sex by Income Bracket in Carson
The most common earnings brackets in Carson are $55,000 to $64,999 for men (109 | 16.6%) and $75,000 to $99,999 for women (65 | 16.4%).
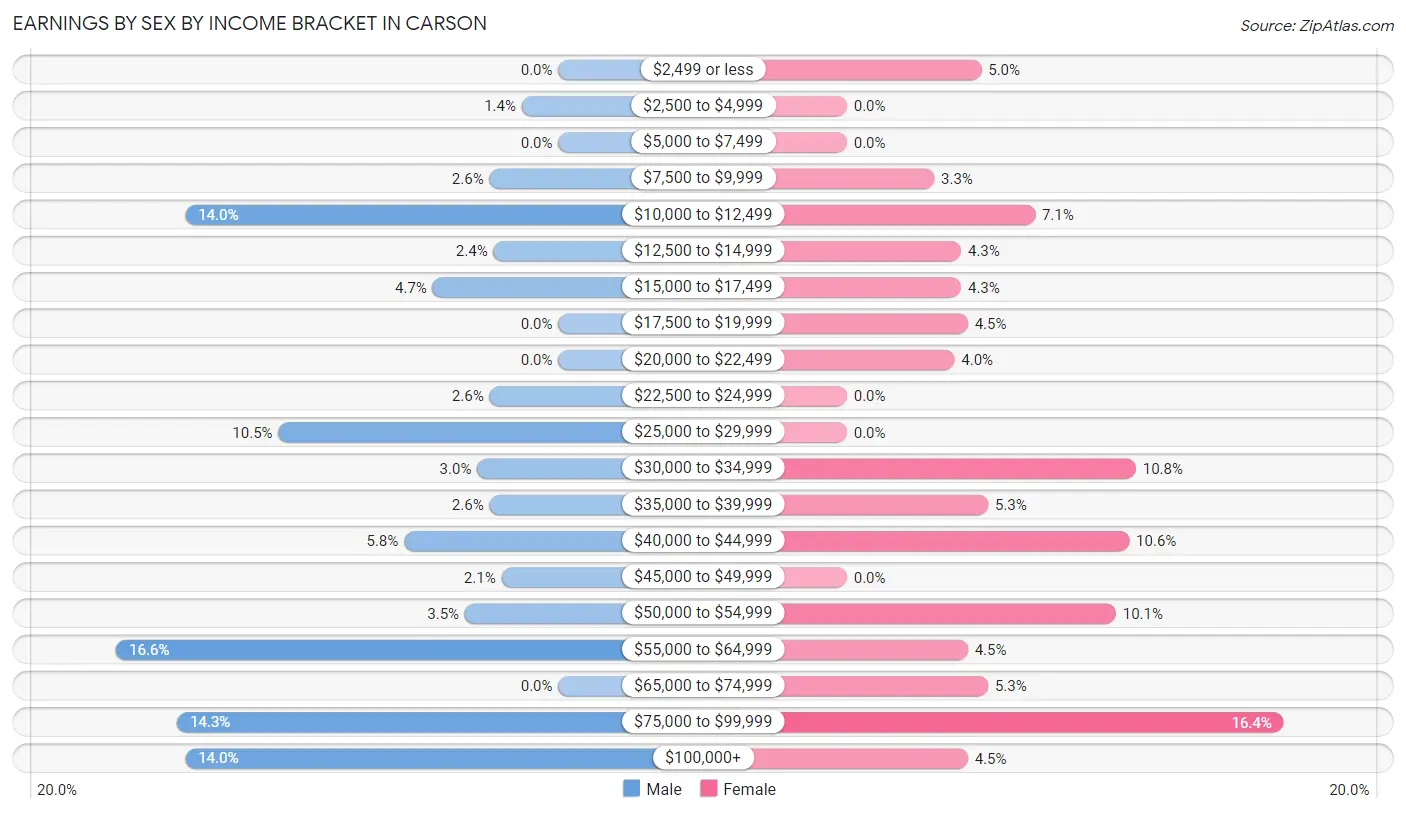
| Income | Male | Female |
| $2,499 or less | 0 (0.0%) | 20 (5.0%) |
| $2,500 to $4,999 | 9 (1.4%) | 0 (0.0%) |
| $5,000 to $7,499 | 0 (0.0%) | 0 (0.0%) |
| $7,500 to $9,999 | 17 (2.6%) | 13 (3.3%) |
| $10,000 to $12,499 | 92 (14.0%) | 28 (7.0%) |
| $12,500 to $14,999 | 16 (2.4%) | 17 (4.3%) |
| $15,000 to $17,499 | 31 (4.7%) | 17 (4.3%) |
| $17,500 to $19,999 | 0 (0.0%) | 18 (4.5%) |
| $20,000 to $22,499 | 0 (0.0%) | 16 (4.0%) |
| $22,500 to $24,999 | 17 (2.6%) | 0 (0.0%) |
| $25,000 to $29,999 | 69 (10.5%) | 0 (0.0%) |
| $30,000 to $34,999 | 20 (3.0%) | 43 (10.8%) |
| $35,000 to $39,999 | 17 (2.6%) | 21 (5.3%) |
| $40,000 to $44,999 | 38 (5.8%) | 42 (10.6%) |
| $45,000 to $49,999 | 14 (2.1%) | 0 (0.0%) |
| $50,000 to $54,999 | 23 (3.5%) | 40 (10.1%) |
| $55,000 to $64,999 | 109 (16.6%) | 18 (4.5%) |
| $65,000 to $74,999 | 0 (0.0%) | 21 (5.3%) |
| $75,000 to $99,999 | 94 (14.3%) | 65 (16.4%) |
| $100,000+ | 92 (14.0%) | 18 (4.5%) |
| Total | 658 (100.0%) | 397 (100.0%) |
Earnings by Sex by Educational Attainment in Carson
Average earnings in Carson are $53,533 for men and $40,327 for women, a difference of 24.7%. Men with an educational attainment of college or associate's degree enjoy the highest average annual earnings of $60,543, while those with high school diploma education earn the least with $49,286. Women with an educational attainment of college or associate's degree earn the most with the average annual earnings of $50,813, while those with high school diploma education have the smallest earnings of $33,438.
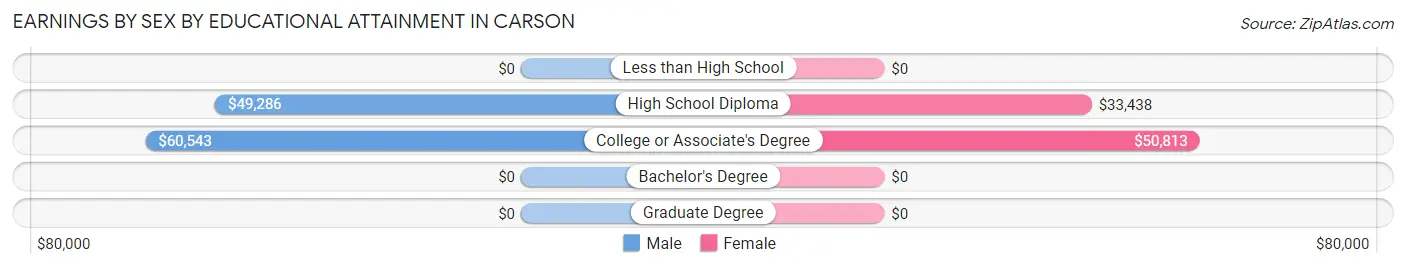
| Educational Attainment | Male Income | Female Income |
| Less than High School | - | - |
| High School Diploma | $49,286 | $33,438 |
| College or Associate's Degree | $60,543 | $50,813 |
| Bachelor's Degree | - | - |
| Graduate Degree | - | - |
| Total | $53,533 | $40,327 |
Family Income in Carson
Family Income Brackets in Carson
According to the Carson family income data, there are 188 families falling into the $100,000 to $149,999 income range, which is the most common income bracket and makes up 28.9% of all families.
| Income Bracket | # Families | % Families |
| Less than $10,000 | 0 | 0.0% |
| $10,000 to $14,999 | 46 | 7.1% |
| $15,000 to $24,999 | 17 | 2.6% |
| $25,000 to $34,999 | 56 | 8.6% |
| $35,000 to $49,999 | 32 | 4.9% |
| $50,000 to $74,999 | 157 | 24.1% |
| $75,000 to $99,999 | 108 | 16.6% |
| $100,000 to $149,999 | 188 | 28.9% |
| $150,000 to $199,999 | 39 | 6.0% |
| $200,000+ | 8 | 1.2% |
Family Income by Famaliy Size in Carson
4-person families (69 | 10.6%) account for the highest median family income in Carson with $121,250 per family, while 2-person families (421 | 64.7%) have the highest median income of $40,037 per family member.
| Income Bracket | # Families | Median Income |
| 2-Person Families | 421 (64.7%) | $80,074 |
| 3-Person Families | 119 (18.3%) | $0 |
| 4-Person Families | 69 (10.6%) | $121,250 |
| 5-Person Families | 22 (3.4%) | $0 |
| 6-Person Families | 20 (3.1%) | $0 |
| 7+ Person Families | 0 (0.0%) | $0 |
| Total | 651 (100.0%) | $82,566 |
Family Income by Number of Earners in Carson
| Number of Earners | # Families | Median Income |
| No Earners | 135 (20.7%) | $66,523 |
| 1 Earner | 213 (32.7%) | $68,021 |
| 2 Earners | 261 (40.1%) | $96,250 |
| 3+ Earners | 42 (6.5%) | $0 |
| Total | 651 (100.0%) | $82,566 |
Household Income in Carson
Household Income Brackets in Carson
With 208 households falling in the category, the $100,000 to $149,999 income range is the most frequent in Carson, accounting for 20.6% of all households. In contrast, only 22 households (2.2%) fall into the $150,000 to $199,999 income bracket, making it the least populous group.
| Income Bracket | # Households | % Households |
| Less than $10,000 | 26 | 2.6% |
| $10,000 to $14,999 | 61 | 6.0% |
| $15,000 to $24,999 | 200 | 19.8% |
| $25,000 to $34,999 | 106 | 10.5% |
| $35,000 to $49,999 | 40 | 4.0% |
| $50,000 to $74,999 | 180 | 17.8% |
| $75,000 to $99,999 | 141 | 14.0% |
| $100,000 to $149,999 | 208 | 20.6% |
| $150,000 to $199,999 | 22 | 2.2% |
| $200,000+ | 25 | 2.5% |
Household Income by Householder Age in Carson
The median household income in Carson is $65,898, with the highest median household income of $86,611 found in the 45 to 64 years age bracket for the primary householder. A total of 376 households (37.3%) fall into this category.
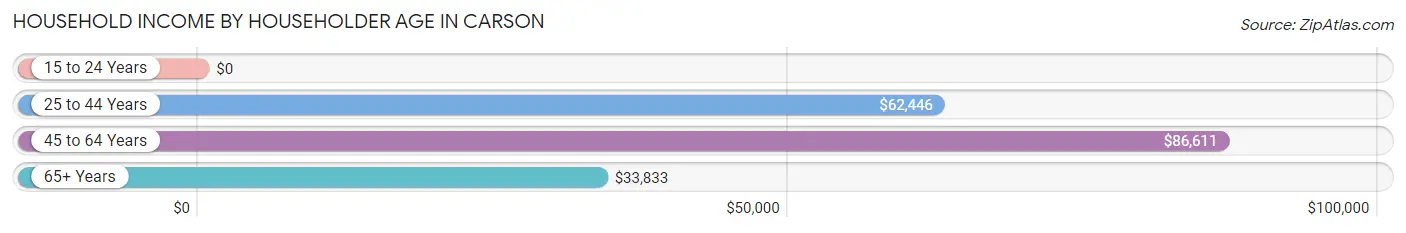
| Income Bracket | # Households | Median Income |
| 15 to 24 Years | 0 (0.0%) | $0 |
| 25 to 44 Years | 235 (23.3%) | $62,446 |
| 45 to 64 Years | 376 (37.3%) | $86,611 |
| 65+ Years | 398 (39.4%) | $33,833 |
| Total | 1,009 (100.0%) | $65,898 |
Poverty in Carson
Income Below Poverty by Sex and Age in Carson
With 7.7% poverty level for males and 14.1% for females among the residents of Carson, 6 to 11 year old males and 18 to 24 year old females are the most vulnerable to poverty, with 24 males (60.0%) and 33 females (100.0%) in their respective age groups living below the poverty level.
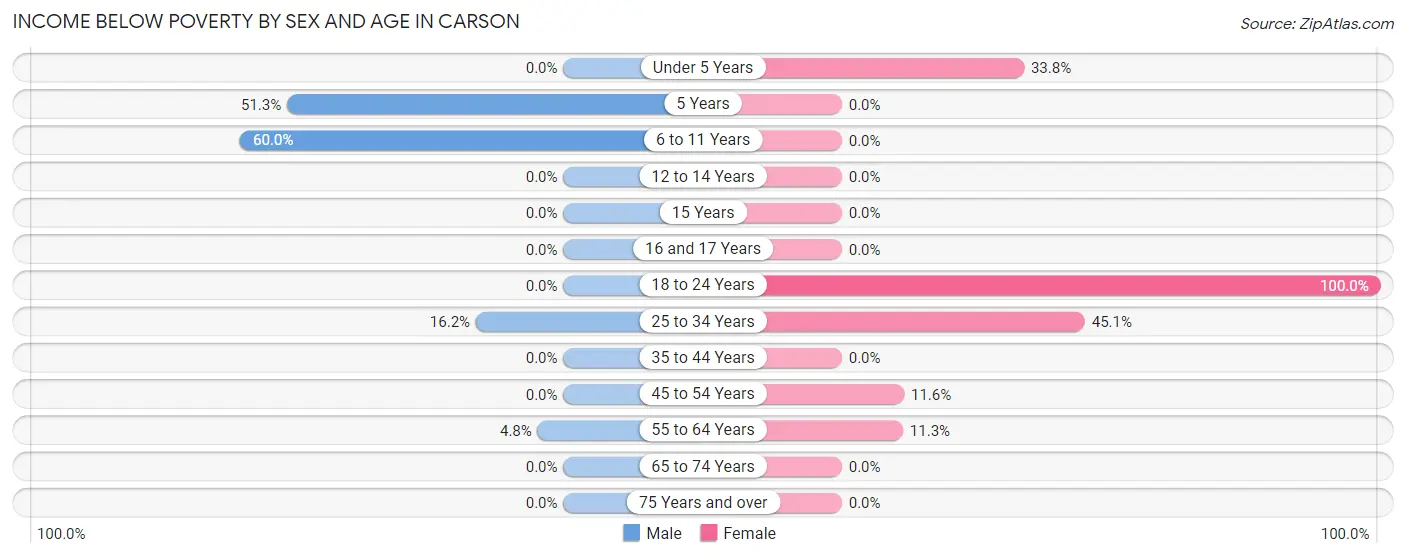
| Age Bracket | Male | Female |
| Under 5 Years | 0 (0.0%) | 23 (33.8%) |
| 5 Years | 20 (51.3%) | 0 (0.0%) |
| 6 to 11 Years | 24 (60.0%) | 0 (0.0%) |
| 12 to 14 Years | 0 (0.0%) | 0 (0.0%) |
| 15 Years | 0 (0.0%) | 0 (0.0%) |
| 16 and 17 Years | 0 (0.0%) | 0 (0.0%) |
| 18 to 24 Years | 0 (0.0%) | 33 (100.0%) |
| 25 to 34 Years | 31 (16.2%) | 60 (45.1%) |
| 35 to 44 Years | 0 (0.0%) | 0 (0.0%) |
| 45 to 54 Years | 0 (0.0%) | 20 (11.6%) |
| 55 to 64 Years | 14 (4.8%) | 28 (11.3%) |
| 65 to 74 Years | 0 (0.0%) | 0 (0.0%) |
| 75 Years and over | 0 (0.0%) | 0 (0.0%) |
| Total | 89 (7.7%) | 164 (14.1%) |
Income Above Poverty by Sex and Age in Carson
According to the poverty statistics in Carson, males aged under 5 years and females aged 6 to 11 years are the age groups that are most secure financially, with 100.0% of males and 100.0% of females in these age groups living above the poverty line.
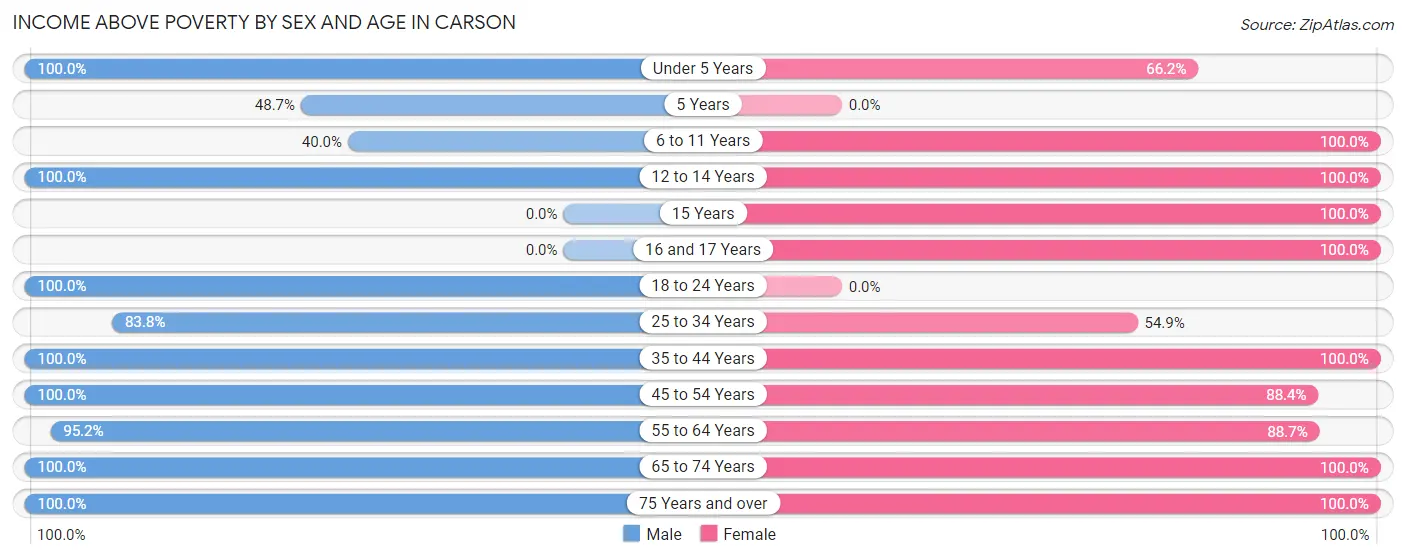
| Age Bracket | Male | Female |
| Under 5 Years | 21 (100.0%) | 45 (66.2%) |
| 5 Years | 19 (48.7%) | 0 (0.0%) |
| 6 to 11 Years | 16 (40.0%) | 53 (100.0%) |
| 12 to 14 Years | 29 (100.0%) | 45 (100.0%) |
| 15 Years | 0 (0.0%) | 28 (100.0%) |
| 16 and 17 Years | 0 (0.0%) | 32 (100.0%) |
| 18 to 24 Years | 92 (100.0%) | 0 (0.0%) |
| 25 to 34 Years | 160 (83.8%) | 73 (54.9%) |
| 35 to 44 Years | 146 (100.0%) | 62 (100.0%) |
| 45 to 54 Years | 106 (100.0%) | 153 (88.4%) |
| 55 to 64 Years | 279 (95.2%) | 219 (88.7%) |
| 65 to 74 Years | 126 (100.0%) | 66 (100.0%) |
| 75 Years and over | 66 (100.0%) | 221 (100.0%) |
| Total | 1,060 (92.2%) | 997 (85.9%) |
Income Below Poverty Among Married-Couple Families in Carson
The poverty statistics for married-couple families in Carson show that 3.1% or 14 of the total 448 families live below the poverty line. Families with no children have the highest poverty rate of 4.1%, comprising of 14 families. On the other hand, families with 1 or 2 children have the lowest poverty rate of 0.0%, which includes 0 families.
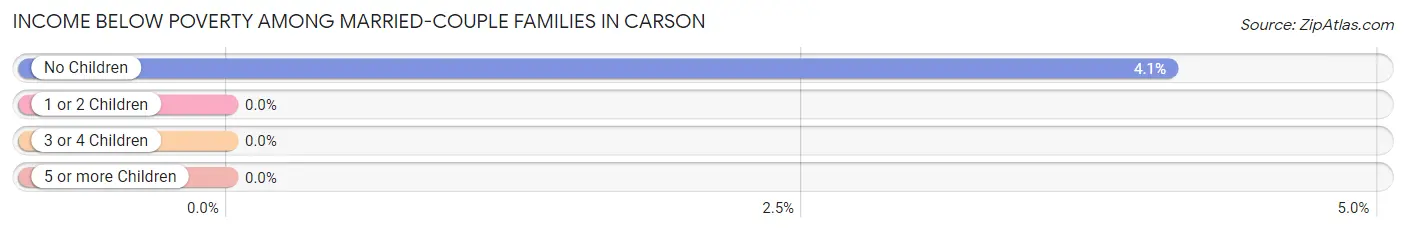
| Children | Above Poverty | Below Poverty |
| No Children | 328 (95.9%) | 14 (4.1%) |
| 1 or 2 Children | 106 (100.0%) | 0 (0.0%) |
| 3 or 4 Children | 0 (0.0%) | 0 (0.0%) |
| 5 or more Children | 0 (0.0%) | 0 (0.0%) |
| Total | 434 (96.9%) | 14 (3.1%) |
Income Below Poverty Among Single-Parent Households in Carson
According to the poverty data in Carson, 20.8% or 15 single-father households and 26.0% or 34 single-mother households are living below the poverty line. Among single-father households, those with 1 or 2 children have the highest poverty rate, with 15 households (42.9%) experiencing poverty. Likewise, among single-mother households, those with 1 or 2 children have the highest poverty rate, with 34 households (60.7%) falling below the poverty line.
| Children | Single Father | Single Mother |
| No Children | 0 (0.0%) | 0 (0.0%) |
| 1 or 2 Children | 15 (42.9%) | 34 (60.7%) |
| 3 or 4 Children | 0 (0.0%) | 0 (0.0%) |
| 5 or more Children | 0 (0.0%) | 0 (0.0%) |
| Total | 15 (20.8%) | 34 (26.0%) |
Income Below Poverty Among Married-Couple vs Single-Parent Households in Carson
The poverty data for Carson shows that 14 of the married-couple family households (3.1%) and 49 of the single-parent households (24.1%) are living below the poverty level. Within the married-couple family households, those with no children have the highest poverty rate, with 14 households (4.1%) falling below the poverty line. Among the single-parent households, those with 1 or 2 children have the highest poverty rate, with 49 household (53.8%) living below poverty.
| Children | Married-Couple Families | Single-Parent Households |
| No Children | 14 (4.1%) | 0 (0.0%) |
| 1 or 2 Children | 0 (0.0%) | 49 (53.8%) |
| 3 or 4 Children | 0 (0.0%) | 0 (0.0%) |
| 5 or more Children | 0 (0.0%) | 0 (0.0%) |
| Total | 14 (3.1%) | 49 (24.1%) |
Race in Carson
The most populous races in Carson are White / Caucasian (2,072 | 88.2%), Native / Alaskan (163 | 6.9%), and Hispanic or Latino (138 | 5.9%).
| Race | # Population | % Population |
| Asian | 27 | 1.1% |
| Black / African American | 0 | 0.0% |
| Hawaiian / Pacific | 0 | 0.0% |
| Hispanic or Latino | 138 | 5.9% |
| Native / Alaskan | 163 | 6.9% |
| White / Caucasian | 2,072 | 88.2% |
| Two or more Races | 87 | 3.7% |
| Some other Race | 0 | 0.0% |
| Total | 2,349 | 100.0% |
Ancestry in Carson
The most populous ancestries reported in Carson are Irish (472 | 20.1%), German (442 | 18.8%), American (424 | 18.0%), English (251 | 10.7%), and Mexican (129 | 5.5%), together accounting for 73.1% of all Carson residents.
| Ancestry | # Population | % Population |
| Alaska Native | 31 | 1.3% |
| American | 424 | 18.0% |
| Bhutanese | 27 | 1.1% |
| Choctaw | 33 | 1.4% |
| Croatian | 35 | 1.5% |
| Danish | 23 | 1.0% |
| English | 251 | 10.7% |
| European | 69 | 2.9% |
| French | 35 | 1.5% |
| German | 442 | 18.8% |
| Irish | 472 | 20.1% |
| Iroquois | 40 | 1.7% |
| Italian | 29 | 1.2% |
| Mexican | 129 | 5.5% |
| Norwegian | 66 | 2.8% |
| Scandinavian | 39 | 1.7% |
| Scotch-Irish | 36 | 1.5% |
| Scottish | 65 | 2.8% |
| Spanish | 9 | 0.4% |
| Swedish | 84 | 3.6% | View All 20 Rows |
Immigrants in Carson
The most numerous immigrant groups reported in Carson came from Central America (16 | 0.7%), Latin America (16 | 0.7%), and Mexico (16 | 0.7%), together accounting for 2.0% of all Carson residents.
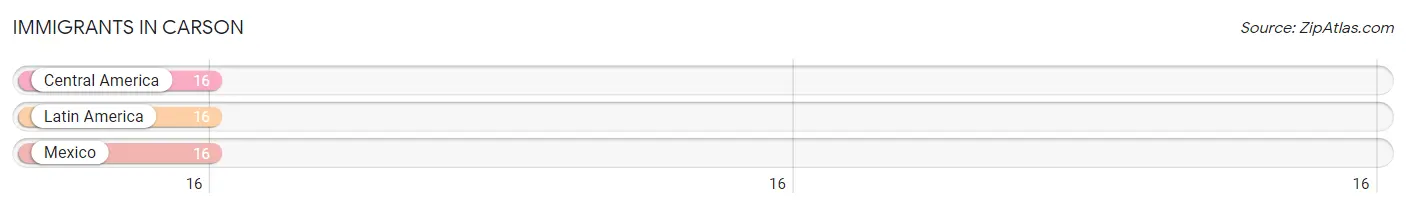
| Immigration Origin | # Population | % Population |
| Central America | 16 | 0.7% |
| Latin America | 16 | 0.7% |
| Mexico | 16 | 0.7% | View All 3 Rows |
Sex and Age in Carson
Sex and Age in Carson
The most populous age groups in Carson are 55 to 59 Years (157 | 13.7%) for men and 60 to 64 Years (186 | 15.5%) for women.
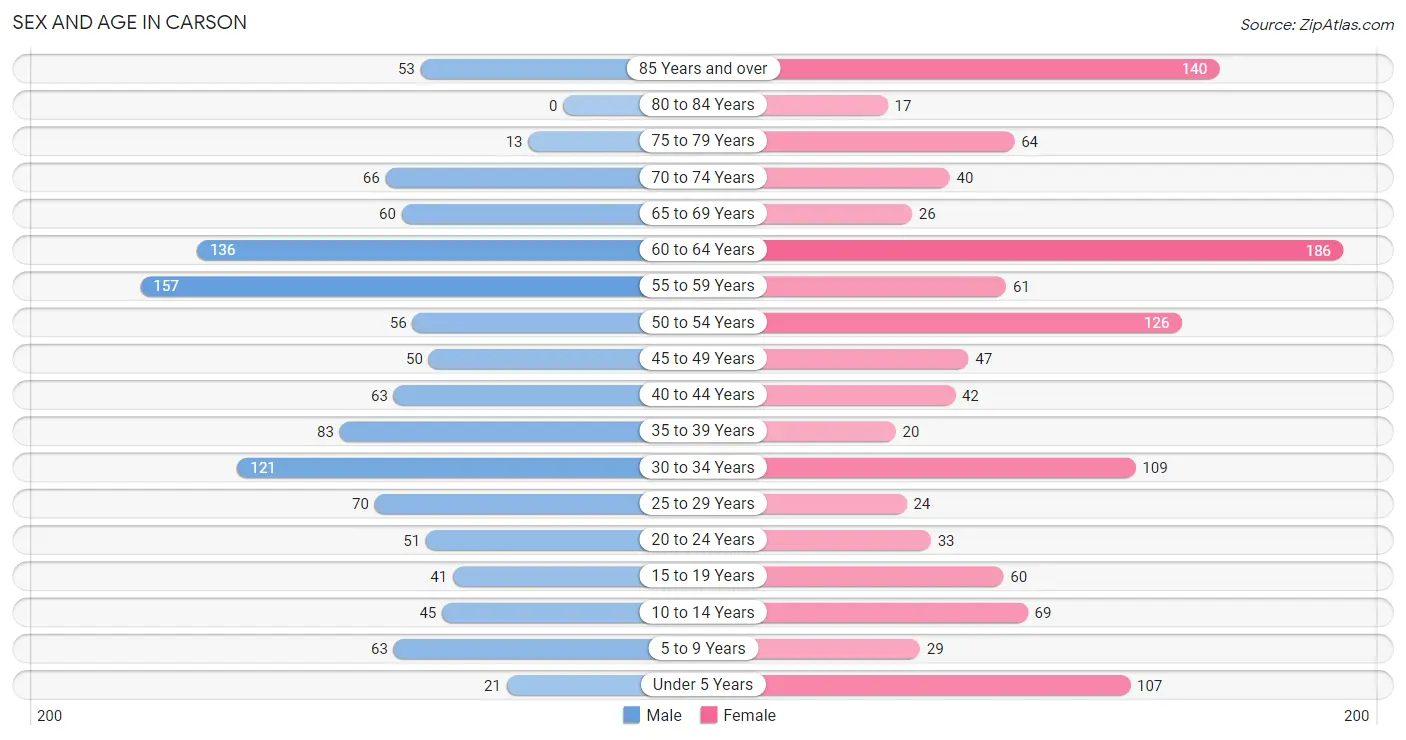
| Age Bracket | Male | Female |
| Under 5 Years | 21 (1.8%) | 107 (8.9%) |
| 5 to 9 Years | 63 (5.5%) | 29 (2.4%) |
| 10 to 14 Years | 45 (3.9%) | 69 (5.8%) |
| 15 to 19 Years | 41 (3.6%) | 60 (5.0%) |
| 20 to 24 Years | 51 (4.4%) | 33 (2.8%) |
| 25 to 29 Years | 70 (6.1%) | 24 (2.0%) |
| 30 to 34 Years | 121 (10.5%) | 109 (9.1%) |
| 35 to 39 Years | 83 (7.2%) | 20 (1.7%) |
| 40 to 44 Years | 63 (5.5%) | 42 (3.5%) |
| 45 to 49 Years | 50 (4.3%) | 47 (3.9%) |
| 50 to 54 Years | 56 (4.9%) | 126 (10.5%) |
| 55 to 59 Years | 157 (13.7%) | 61 (5.1%) |
| 60 to 64 Years | 136 (11.8%) | 186 (15.5%) |
| 65 to 69 Years | 60 (5.2%) | 26 (2.2%) |
| 70 to 74 Years | 66 (5.7%) | 40 (3.3%) |
| 75 to 79 Years | 13 (1.1%) | 64 (5.3%) |
| 80 to 84 Years | 0 (0.0%) | 17 (1.4%) |
| 85 Years and over | 53 (4.6%) | 140 (11.7%) |
| Total | 1,149 (100.0%) | 1,200 (100.0%) |
Families and Households in Carson
Median Family Size in Carson
The median family size in Carson is 2.82 persons per family, with single female/mother families (131 | 20.1%) accounting for the largest median family size of 3.73 persons per family. On the other hand, single male/father families (72 | 11.1%) represent the smallest median family size with 2.44 persons per family.
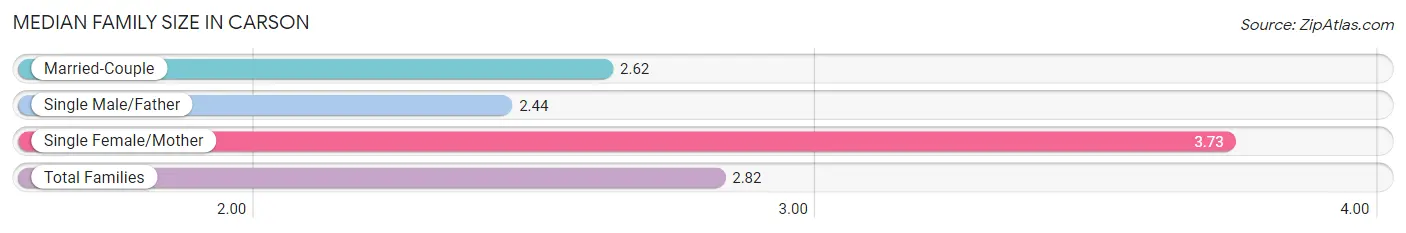
| Family Type | # Families | Family Size |
| Married-Couple | 448 (68.8%) | 2.62 |
| Single Male/Father | 72 (11.1%) | 2.44 |
| Single Female/Mother | 131 (20.1%) | 3.73 |
| Total Families | 651 (100.0%) | 2.82 |
Median Household Size in Carson
The median household size in Carson is 2.33 persons per household, with single female/mother households (131 | 13.0%) accounting for the largest median household size of 3.73 persons per household. non-family households (358 | 35.5%) represent the smallest median household size with 1.16 persons per household.
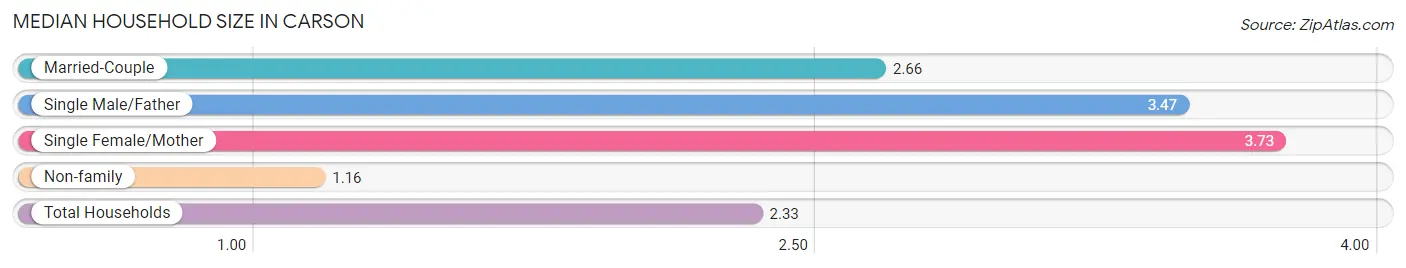
| Household Type | # Households | Household Size |
| Married-Couple | 448 (44.4%) | 2.66 |
| Single Male/Father | 72 (7.1%) | 3.47 |
| Single Female/Mother | 131 (13.0%) | 3.73 |
| Non-family | 358 (35.5%) | 1.16 |
| Total Households | 1,009 (100.0%) | 2.33 |
Household Size by Marriage Status in Carson
Out of a total of 1,009 households in Carson, 651 (64.5%) are family households, while 358 (35.5%) are nonfamily households. The most numerous type of family households are 2-person households, comprising 384, and the most common type of nonfamily households are 1-person households, comprising 312.
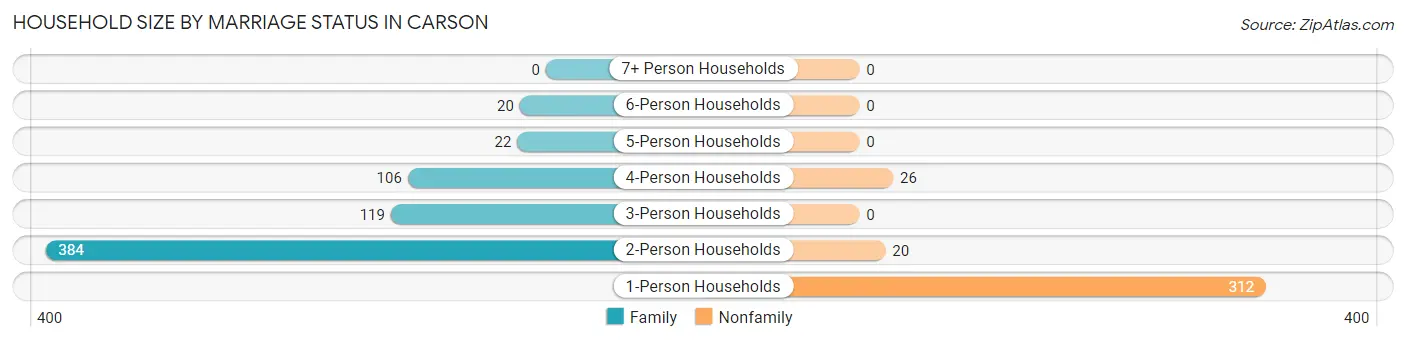
| Household Size | Family Households | Nonfamily Households |
| 1-Person Households | - | 312 (30.9%) |
| 2-Person Households | 384 (38.1%) | 20 (2.0%) |
| 3-Person Households | 119 (11.8%) | 0 (0.0%) |
| 4-Person Households | 106 (10.5%) | 26 (2.6%) |
| 5-Person Households | 22 (2.2%) | 0 (0.0%) |
| 6-Person Households | 20 (2.0%) | 0 (0.0%) |
| 7+ Person Households | 0 (0.0%) | 0 (0.0%) |
| Total | 651 (64.5%) | 358 (35.5%) |
Female Fertility in Carson
Fertility by Age in Carson
| Age Bracket | Women with Births | Births / 1,000 Women |
| 15 to 19 years | 0 (0.0%) | 0.0 |
| 20 to 34 years | 0 (0.0%) | 0.0 |
| 35 to 50 years | 0 (0.0%) | 0.0 |
| Total | 0 (0.0%) | 0.0 |
Fertility by Age by Marriage Status in Carson
| Age Bracket | Married | Unmarried |
| 15 to 19 years | 0 (0.0%) | 0 (0.0%) |
| 20 to 34 years | 0 (0.0%) | 0 (0.0%) |
| 35 to 50 years | 0 (0.0%) | 0 (0.0%) |
| Total | 0 (0.0%) | 0 (0.0%) |
Fertility by Education in Carson
| Educational Attainment | Women with Births | Births / 1,000 Women |
| Less than High School | 0 (0.0%) | 0.0 |
| High School Diploma | 0 (0.0%) | 0.0 |
| College or Associate's Degree | 0 (0.0%) | 0.0 |
| Bachelor's Degree | 0 (0.0%) | 0.0 |
| Graduate Degree | 0 (0.0%) | 0.0 |
| Total | 0 (0.0%) | 0.0 |
Fertility by Education by Marriage Status in Carson
| Educational Attainment | Married | Unmarried |
| Less than High School | 0 (0.0%) | 0 (0.0%) |
| High School Diploma | 0 (0.0%) | 0 (0.0%) |
| College or Associate's Degree | 0 (0.0%) | 0 (0.0%) |
| Bachelor's Degree | 0 (0.0%) | 0 (0.0%) |
| Graduate Degree | 0 (0.0%) | 0 (0.0%) |
| Total | 0 (0.0%) | 0 (0.0%) |
Employment Characteristics in Carson
Employment by Class of Employer in Carson
Among the 930 employed individuals in Carson, private company employees (610 | 65.6%), not-for-profit organizations (75 | 8.1%), and state government employees (58 | 6.2%) make up the most common classes of employment.
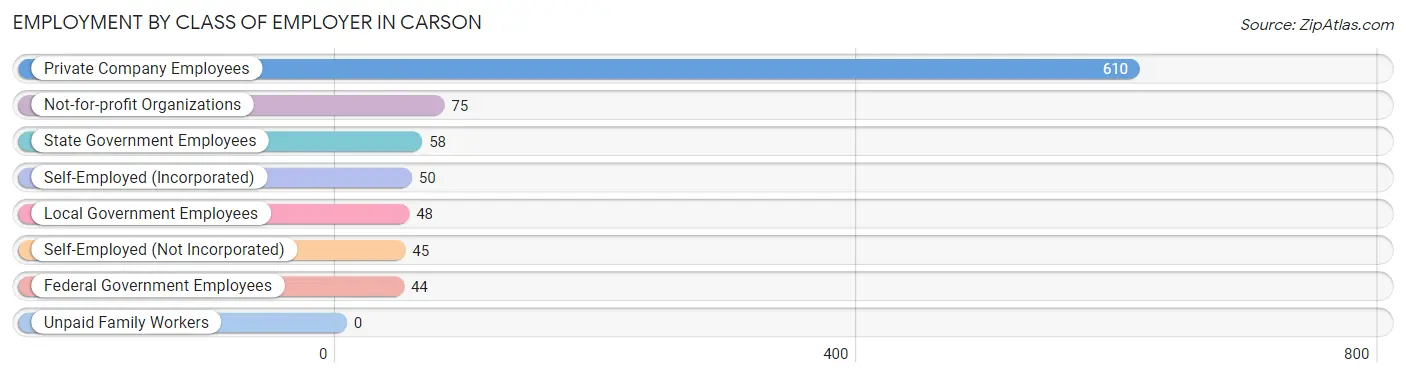
| Employer Class | # Employees | % Employees |
| Private Company Employees | 610 | 65.6% |
| Self-Employed (Incorporated) | 50 | 5.4% |
| Self-Employed (Not Incorporated) | 45 | 4.8% |
| Not-for-profit Organizations | 75 | 8.1% |
| Local Government Employees | 48 | 5.2% |
| State Government Employees | 58 | 6.2% |
| Federal Government Employees | 44 | 4.7% |
| Unpaid Family Workers | 0 | 0.0% |
| Total | 930 | 100.0% |
Employment Status by Age in Carson
According to the labor force statistics for Carson, out of the total population over 16 years of age (1,987), 51.6% or 1,025 individuals are in the labor force, with 6.2% or 64 of them unemployed. The age group with the highest labor force participation rate is 25 to 29 years, with 100.0% or 94 individuals in the labor force. Within the labor force, the 20 to 24 years age range has the highest percentage of unemployed individuals, with 100.0% or 51 of them being unemployed.
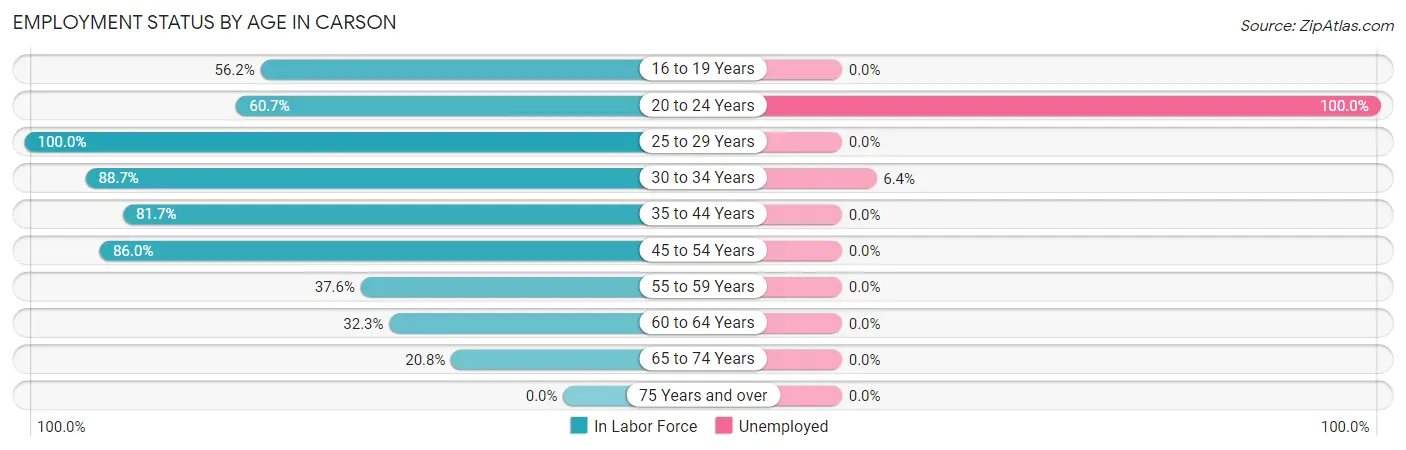
| Age Bracket | In Labor Force | Unemployed |
| 16 to 19 Years | 41 (56.2%) | 0 (0.0%) |
| 20 to 24 Years | 51 (60.7%) | 51 (100.0%) |
| 25 to 29 Years | 94 (100.0%) | 0 (0.0%) |
| 30 to 34 Years | 204 (88.7%) | 13 (6.4%) |
| 35 to 44 Years | 170 (81.7%) | 0 (0.0%) |
| 45 to 54 Years | 240 (86.0%) | 0 (0.0%) |
| 55 to 59 Years | 82 (37.6%) | 0 (0.0%) |
| 60 to 64 Years | 104 (32.3%) | 0 (0.0%) |
| 65 to 74 Years | 40 (20.8%) | 0 (0.0%) |
| 75 Years and over | 0 (0.0%) | 0 (0.0%) |
| Total | 1,025 (51.6%) | 64 (6.2%) |
Employment Status by Educational Attainment in Carson
According to labor force statistics for Carson, 66.2% of individuals (894) out of the total population between 25 and 64 years of age (1,351) are in the labor force, with 1.5% or 13 of them being unemployed. The group with the highest labor force participation rate are those with the educational attainment of high school diploma, with 91.3% or 491 individuals in the labor force. Within the labor force, individuals with bachelor's degree or higher education have the highest percentage of unemployment, with 11.4% or 13 of them being unemployed.
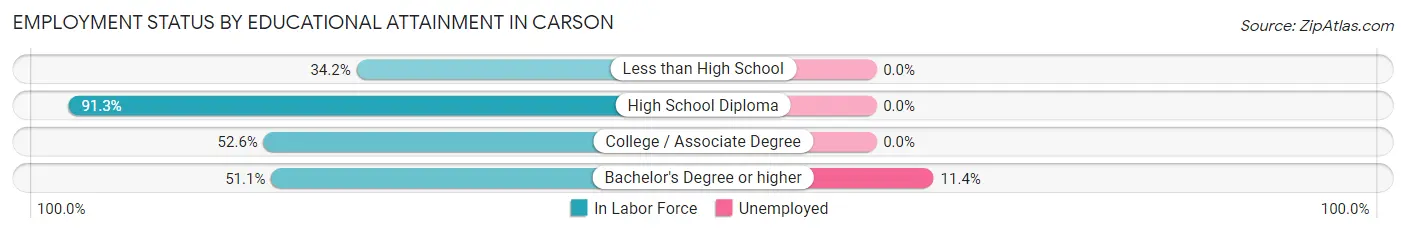
| Educational Attainment | In Labor Force | Unemployed |
| Less than High School | 40 (34.2%) | 0 (0.0%) |
| High School Diploma | 491 (91.3%) | 0 (0.0%) |
| College / Associate Degree | 249 (52.6%) | 0 (0.0%) |
| Bachelor's Degree or higher | 114 (51.1%) | 25 (11.4%) |
| Total | 894 (66.2%) | 20 (1.5%) |
Employment Occupations by Sex in Carson
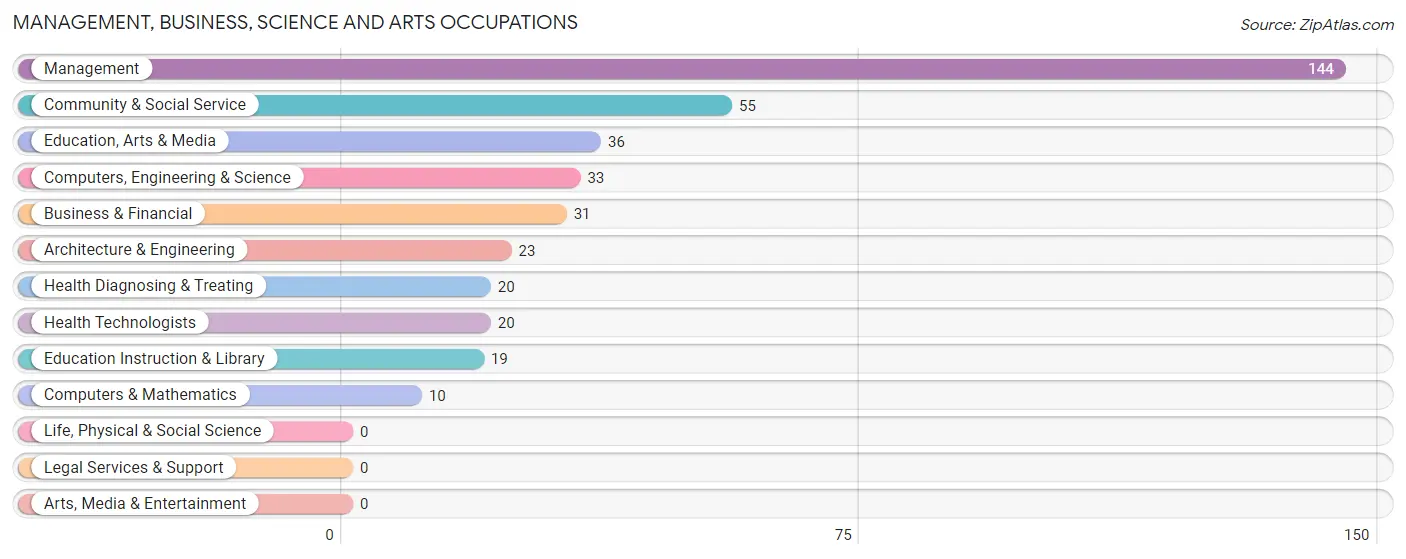
Management, Business, Science and Arts Occupations
The most common Management, Business, Science and Arts occupations in Carson are Management (144 | 15.0%), Community & Social Service (55 | 5.7%), Education, Arts & Media (36 | 3.7%), Computers, Engineering & Science (33 | 3.4%), and Business & Financial (31 | 3.2%).
Management, Business, Science and Arts Occupations by Sex
Within the Management, Business, Science and Arts occupations in Carson, the most male-oriented occupations are Computers, Engineering & Science (100.0%), Computers & Mathematics (100.0%), and Architecture & Engineering (100.0%), while the most female-oriented occupations are Education Instruction & Library (100.0%), Management (66.7%), and Business & Financial (61.3%).
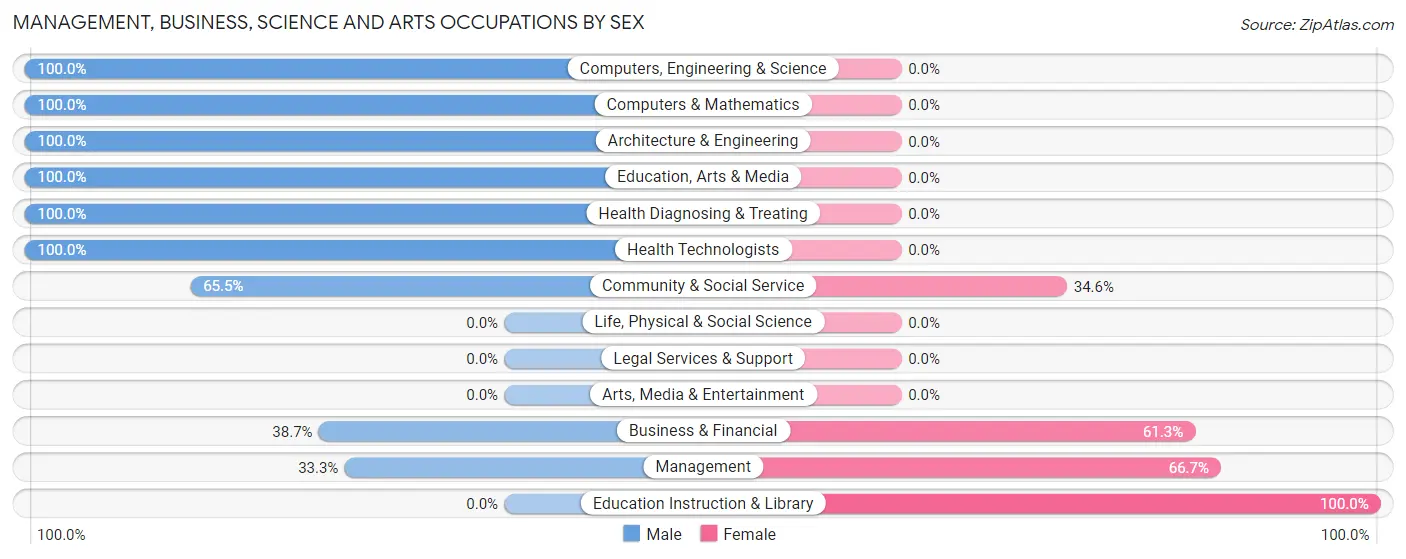
| Occupation | Male | Female |
| Management | 48 (33.3%) | 96 (66.7%) |
| Business & Financial | 12 (38.7%) | 19 (61.3%) |
| Computers, Engineering & Science | 33 (100.0%) | 0 (0.0%) |
| Computers & Mathematics | 10 (100.0%) | 0 (0.0%) |
| Architecture & Engineering | 23 (100.0%) | 0 (0.0%) |
| Life, Physical & Social Science | 0 (0.0%) | 0 (0.0%) |
| Community & Social Service | 36 (65.4%) | 19 (34.5%) |
| Education, Arts & Media | 36 (100.0%) | 0 (0.0%) |
| Legal Services & Support | 0 (0.0%) | 0 (0.0%) |
| Education Instruction & Library | 0 (0.0%) | 19 (100.0%) |
| Arts, Media & Entertainment | 0 (0.0%) | 0 (0.0%) |
| Health Diagnosing & Treating | 20 (100.0%) | 0 (0.0%) |
| Health Technologists | 20 (100.0%) | 0 (0.0%) |
| Total (Category) | 149 (52.6%) | 134 (47.3%) |
| Total (Overall) | 627 (65.2%) | 335 (34.8%) |
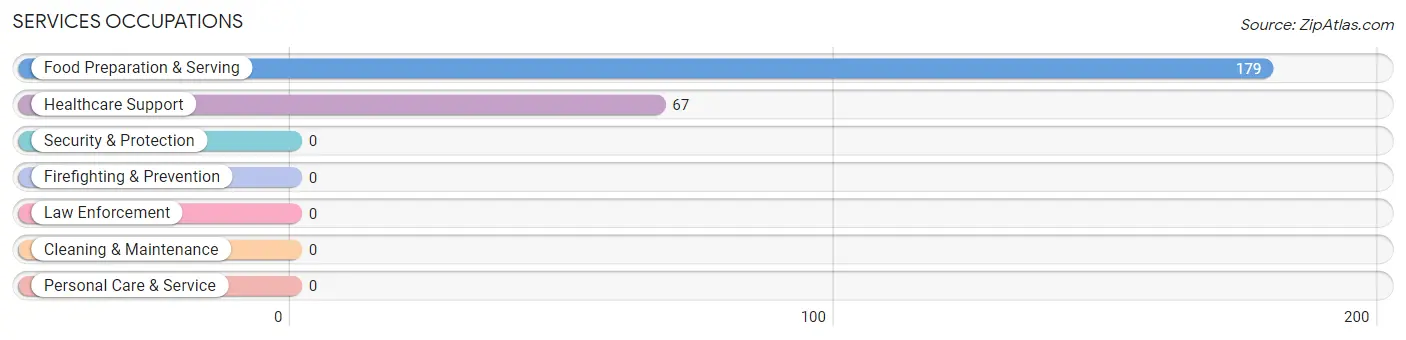
Services Occupations
The most common Services occupations in Carson are Food Preparation & Serving (179 | 18.6%), and Healthcare Support (67 | 7.0%).
Services Occupations by Sex
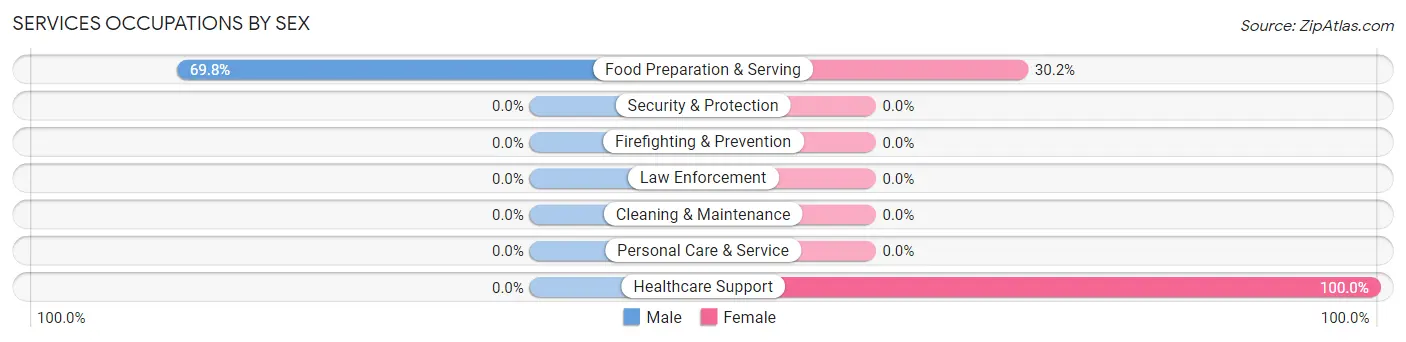
| Occupation | Male | Female |
| Healthcare Support | 0 (0.0%) | 67 (100.0%) |
| Security & Protection | 0 (0.0%) | 0 (0.0%) |
| Firefighting & Prevention | 0 (0.0%) | 0 (0.0%) |
| Law Enforcement | 0 (0.0%) | 0 (0.0%) |
| Food Preparation & Serving | 125 (69.8%) | 54 (30.2%) |
| Cleaning & Maintenance | 0 (0.0%) | 0 (0.0%) |
| Personal Care & Service | 0 (0.0%) | 0 (0.0%) |
| Total (Category) | 125 (50.8%) | 121 (49.2%) |
| Total (Overall) | 627 (65.2%) | 335 (34.8%) |
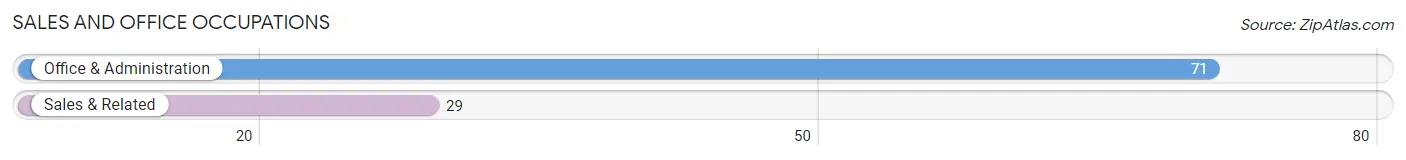
Sales and Office Occupations
The most common Sales and Office occupations in Carson are Office & Administration (71 | 7.4%), and Sales & Related (29 | 3.0%).
Sales and Office Occupations by Sex
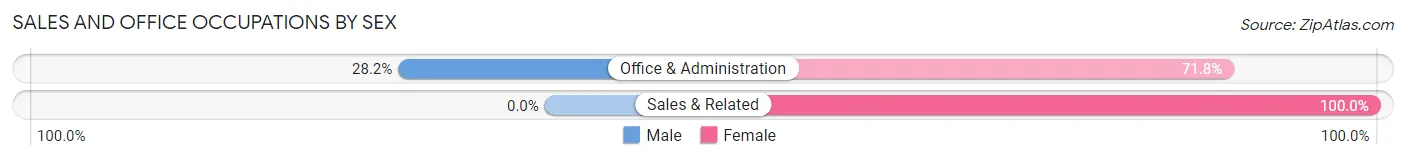
| Occupation | Male | Female |
| Sales & Related | 0 (0.0%) | 29 (100.0%) |
| Office & Administration | 20 (28.2%) | 51 (71.8%) |
| Total (Category) | 20 (20.0%) | 80 (80.0%) |
| Total (Overall) | 627 (65.2%) | 335 (34.8%) |
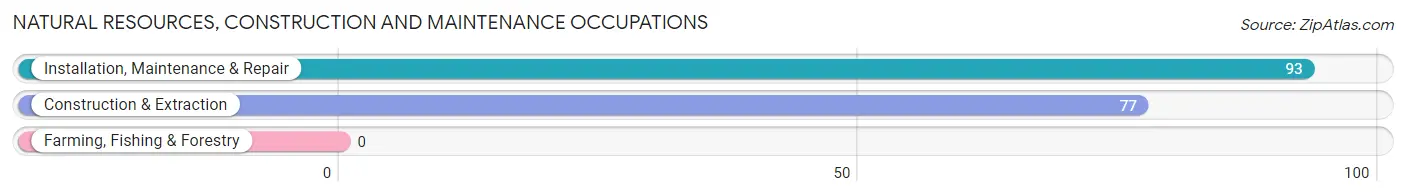
Natural Resources, Construction and Maintenance Occupations
The most common Natural Resources, Construction and Maintenance occupations in Carson are Installation, Maintenance & Repair (93 | 9.7%), and Construction & Extraction (77 | 8.0%).
Natural Resources, Construction and Maintenance Occupations by Sex
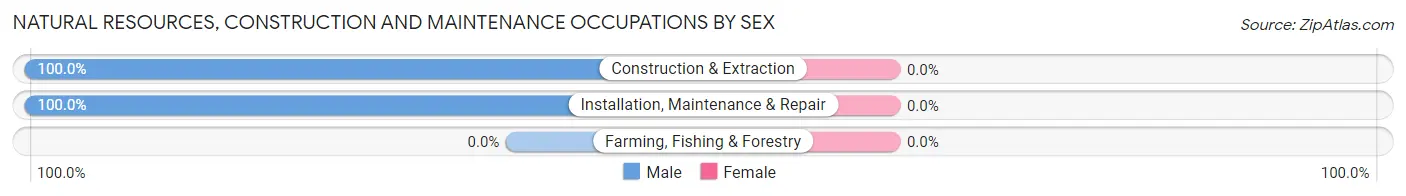
| Occupation | Male | Female |
| Farming, Fishing & Forestry | 0 (0.0%) | 0 (0.0%) |
| Construction & Extraction | 77 (100.0%) | 0 (0.0%) |
| Installation, Maintenance & Repair | 93 (100.0%) | 0 (0.0%) |
| Total (Category) | 170 (100.0%) | 0 (0.0%) |
| Total (Overall) | 627 (65.2%) | 335 (34.8%) |
Production, Transportation and Moving Occupations
The most common Production, Transportation and Moving occupations in Carson are Transportation (73 | 7.6%), Production (53 | 5.5%), and Material Moving (37 | 3.8%).
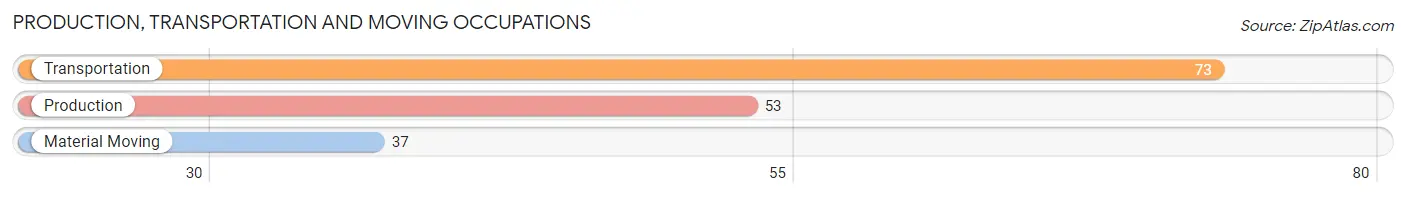
Production, Transportation and Moving Occupations by Sex
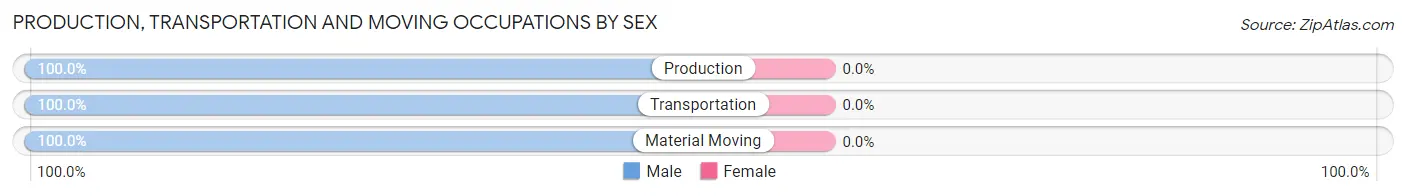
| Occupation | Male | Female |
| Production | 53 (100.0%) | 0 (0.0%) |
| Transportation | 73 (100.0%) | 0 (0.0%) |
| Material Moving | 37 (100.0%) | 0 (0.0%) |
| Total (Category) | 163 (100.0%) | 0 (0.0%) |
| Total (Overall) | 627 (65.2%) | 335 (34.8%) |
Employment Industries by Sex in Carson
Employment Industries in Carson
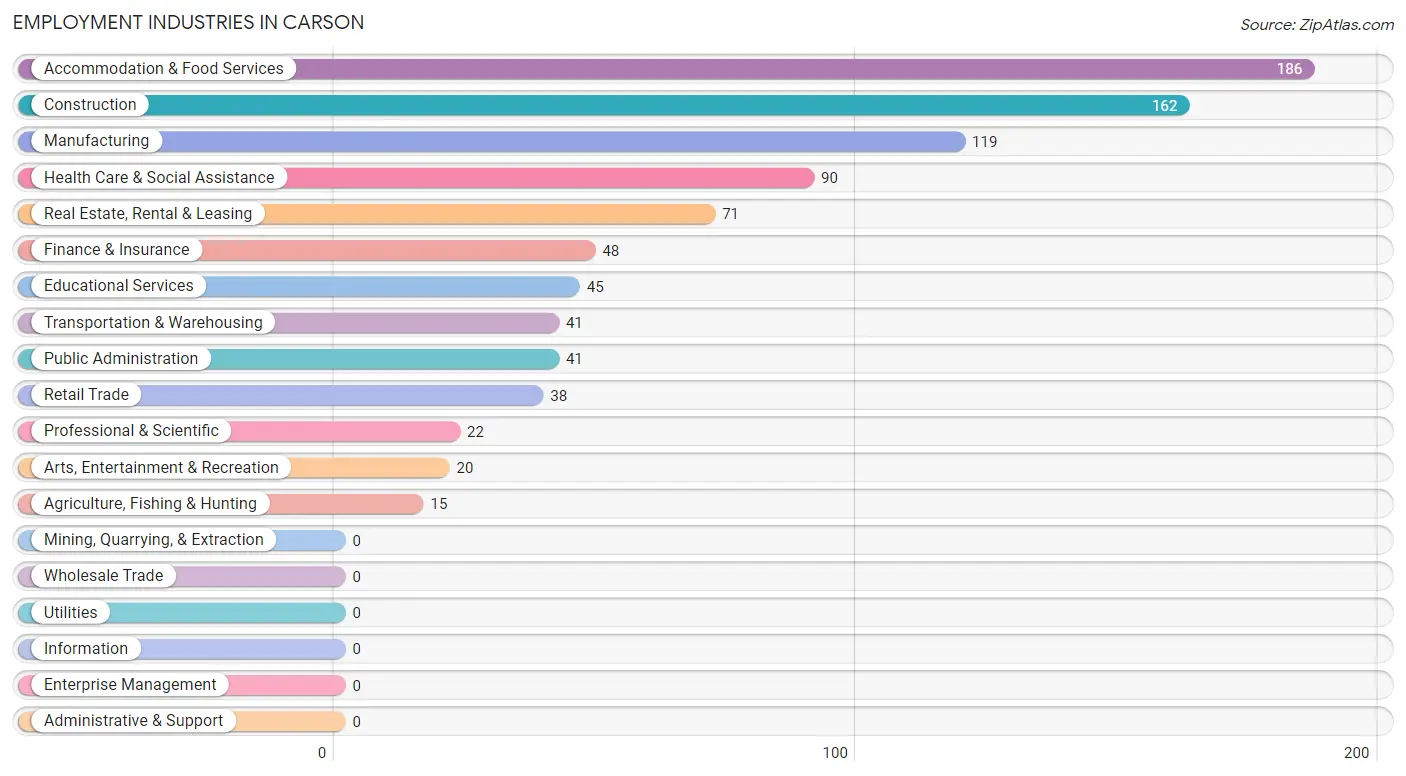
The major employment industries in Carson include Accommodation & Food Services (186 | 19.3%), Construction (162 | 16.8%), Manufacturing (119 | 12.4%), Health Care & Social Assistance (90 | 9.4%), and Real Estate, Rental & Leasing (71 | 7.4%).
Employment Industries by Sex in Carson
The Carson industries that see more men than women are Agriculture, Fishing & Hunting (100.0%), Construction (100.0%), and Transportation & Warehousing (100.0%), whereas the industries that tend to have a higher number of women are Finance & Insurance (100.0%), Educational Services (100.0%), and Public Administration (100.0%).
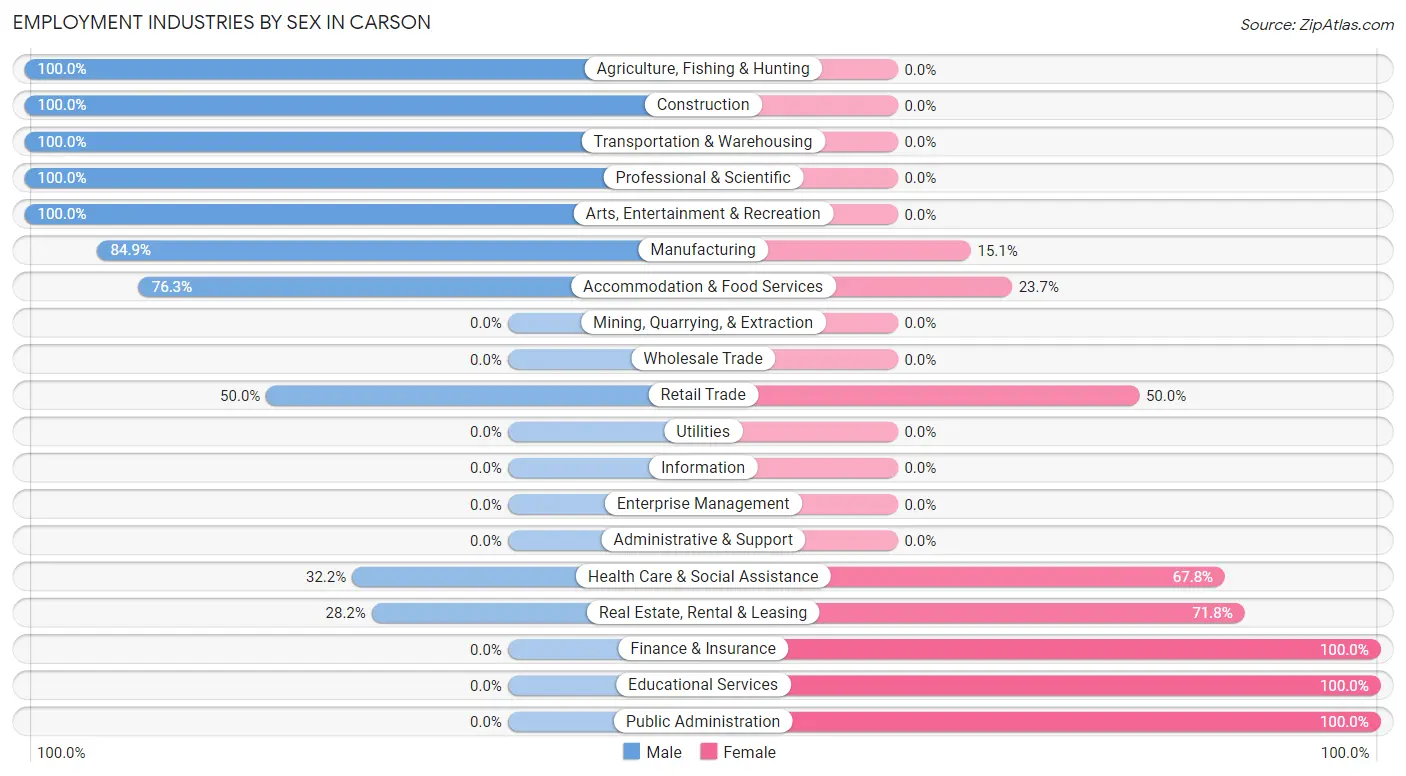
| Industry | Male | Female |
| Agriculture, Fishing & Hunting | 15 (100.0%) | 0 (0.0%) |
| Mining, Quarrying, & Extraction | 0 (0.0%) | 0 (0.0%) |
| Construction | 162 (100.0%) | 0 (0.0%) |
| Manufacturing | 101 (84.9%) | 18 (15.1%) |
| Wholesale Trade | 0 (0.0%) | 0 (0.0%) |
| Retail Trade | 19 (50.0%) | 19 (50.0%) |
| Transportation & Warehousing | 41 (100.0%) | 0 (0.0%) |
| Utilities | 0 (0.0%) | 0 (0.0%) |
| Information | 0 (0.0%) | 0 (0.0%) |
| Finance & Insurance | 0 (0.0%) | 48 (100.0%) |
| Real Estate, Rental & Leasing | 20 (28.2%) | 51 (71.8%) |
| Professional & Scientific | 22 (100.0%) | 0 (0.0%) |
| Enterprise Management | 0 (0.0%) | 0 (0.0%) |
| Administrative & Support | 0 (0.0%) | 0 (0.0%) |
| Educational Services | 0 (0.0%) | 45 (100.0%) |
| Health Care & Social Assistance | 29 (32.2%) | 61 (67.8%) |
| Arts, Entertainment & Recreation | 20 (100.0%) | 0 (0.0%) |
| Accommodation & Food Services | 142 (76.3%) | 44 (23.7%) |
| Public Administration | 0 (0.0%) | 41 (100.0%) |
| Total | 627 (65.2%) | 335 (34.8%) |
Education in Carson
School Enrollment in Carson
The most common levels of schooling among the 260 students in Carson are middle school (90 | 34.6%), high school (61 | 23.5%), and elementary school (53 | 20.4%).
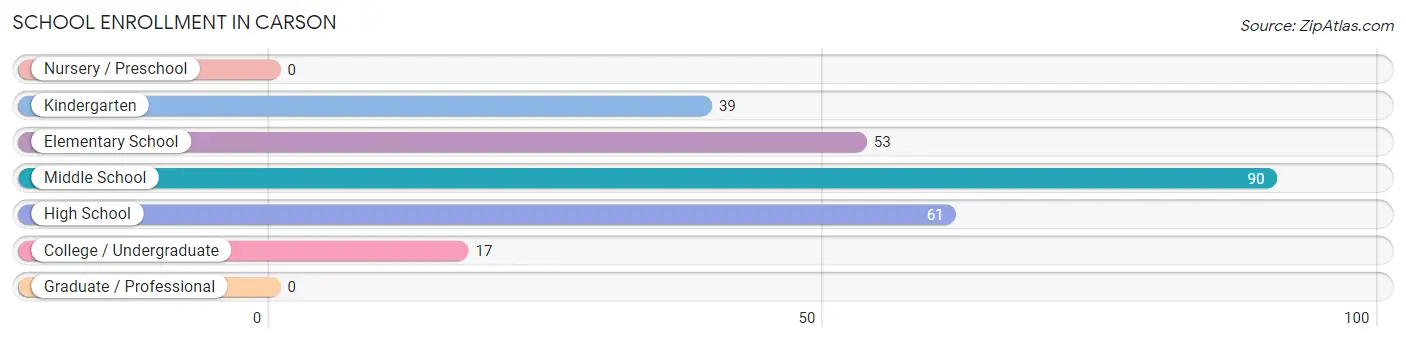
| School Level | # Students | % Students |
| Nursery / Preschool | 0 | 0.0% |
| Kindergarten | 39 | 15.0% |
| Elementary School | 53 | 20.4% |
| Middle School | 90 | 34.6% |
| High School | 61 | 23.5% |
| College / Undergraduate | 17 | 6.5% |
| Graduate / Professional | 0 | 0.0% |
| Total | 260 | 100.0% |
School Enrollment by Age by Funding Source in Carson
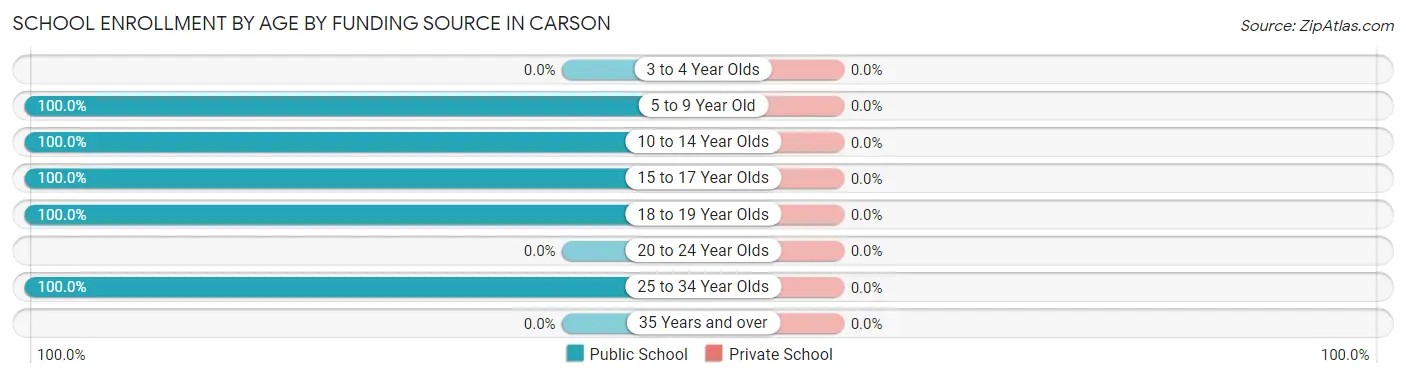
| Age Bracket | Public School | Private School |
| 3 to 4 Year Olds | 0 (0.0%) | 0 (0.0%) |
| 5 to 9 Year Old | 92 (100.0%) | 0 (0.0%) |
| 10 to 14 Year Olds | 114 (100.0%) | 0 (0.0%) |
| 15 to 17 Year Olds | 28 (100.0%) | 0 (0.0%) |
| 18 to 19 Year Olds | 9 (100.0%) | 0 (0.0%) |
| 20 to 24 Year Olds | 0 (0.0%) | 0 (0.0%) |
| 25 to 34 Year Olds | 17 (100.0%) | 0 (0.0%) |
| 35 Years and over | 0 (0.0%) | 0 (0.0%) |
| Total | 260 (100.0%) | 0 (0.0%) |
Educational Attainment by Field of Study in Carson
Education (85 | 31.1%), business (56 | 20.5%), science & technology (36 | 13.2%), arts & humanities (33 | 12.1%), and multidisciplinary studies (20 | 7.3%) are the most common fields of study among 273 individuals in Carson who have obtained a bachelor's degree or higher.
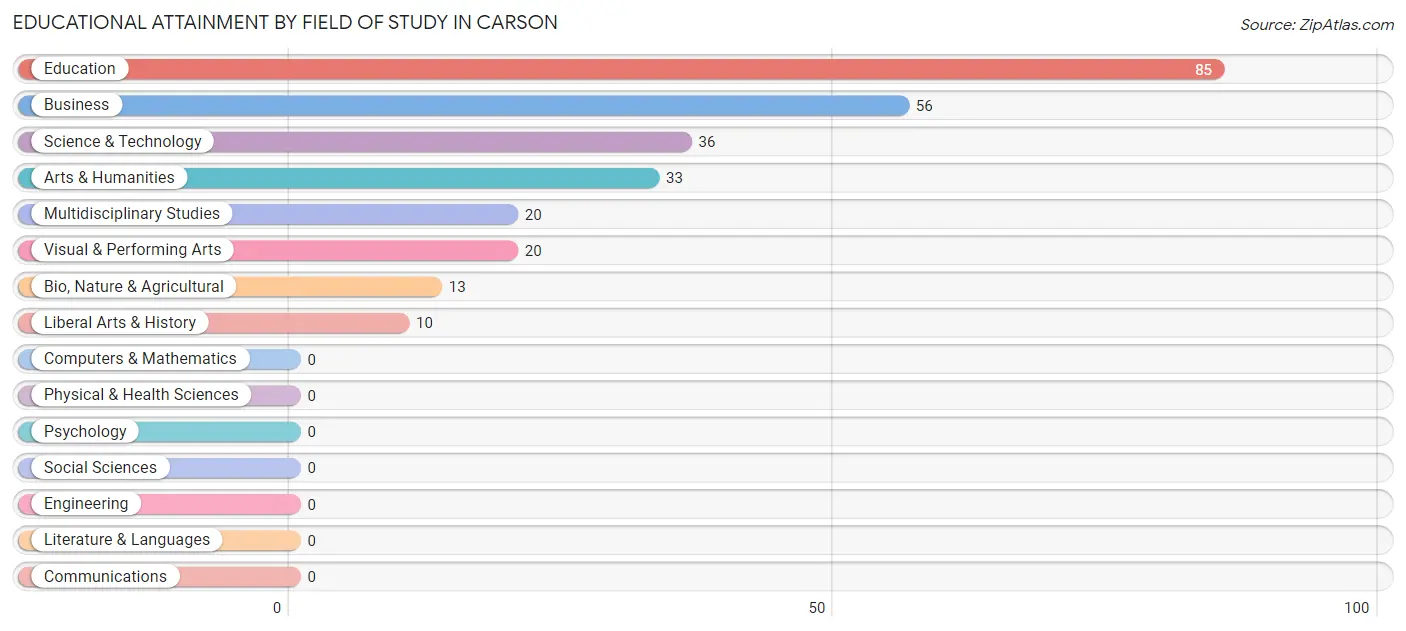
| Field of Study | # Graduates | % Graduates |
| Computers & Mathematics | 0 | 0.0% |
| Bio, Nature & Agricultural | 13 | 4.8% |
| Physical & Health Sciences | 0 | 0.0% |
| Psychology | 0 | 0.0% |
| Social Sciences | 0 | 0.0% |
| Engineering | 0 | 0.0% |
| Multidisciplinary Studies | 20 | 7.3% |
| Science & Technology | 36 | 13.2% |
| Business | 56 | 20.5% |
| Education | 85 | 31.1% |
| Literature & Languages | 0 | 0.0% |
| Liberal Arts & History | 10 | 3.7% |
| Visual & Performing Arts | 20 | 7.3% |
| Communications | 0 | 0.0% |
| Arts & Humanities | 33 | 12.1% |
| Total | 273 | 100.0% |
Transportation & Commute in Carson
Vehicle Availability by Sex in Carson
The most prevalent vehicle ownership categories in Carson are males with 2 vehicles (201, accounting for 33.3%) and females with 2 vehicles (73, making up 61.5%).
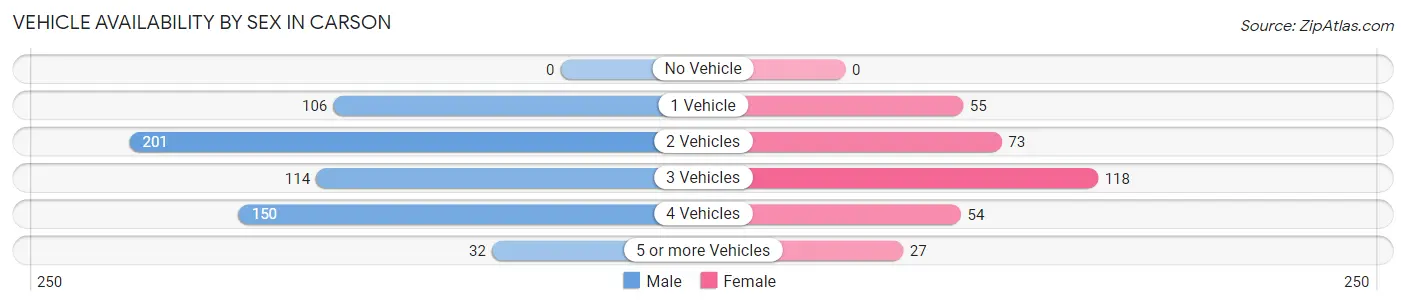
| Vehicles Available | Male | Female |
| No Vehicle | 0 (0.0%) | 0 (0.0%) |
| 1 Vehicle | 106 (17.6%) | 55 (16.8%) |
| 2 Vehicles | 201 (33.3%) | 73 (22.3%) |
| 3 Vehicles | 114 (18.9%) | 118 (36.1%) |
| 4 Vehicles | 150 (24.9%) | 54 (16.5%) |
| 5 or more Vehicles | 32 (5.3%) | 27 (8.3%) |
| Total | 603 (100.0%) | 327 (100.0%) |
Commute Time in Carson
The most frequently occuring commute durations in Carson are 5 to 9 minutes (190 commuters, 22.7%), 15 to 19 minutes (181 commuters, 21.6%), and 10 to 14 minutes (87 commuters, 10.4%).
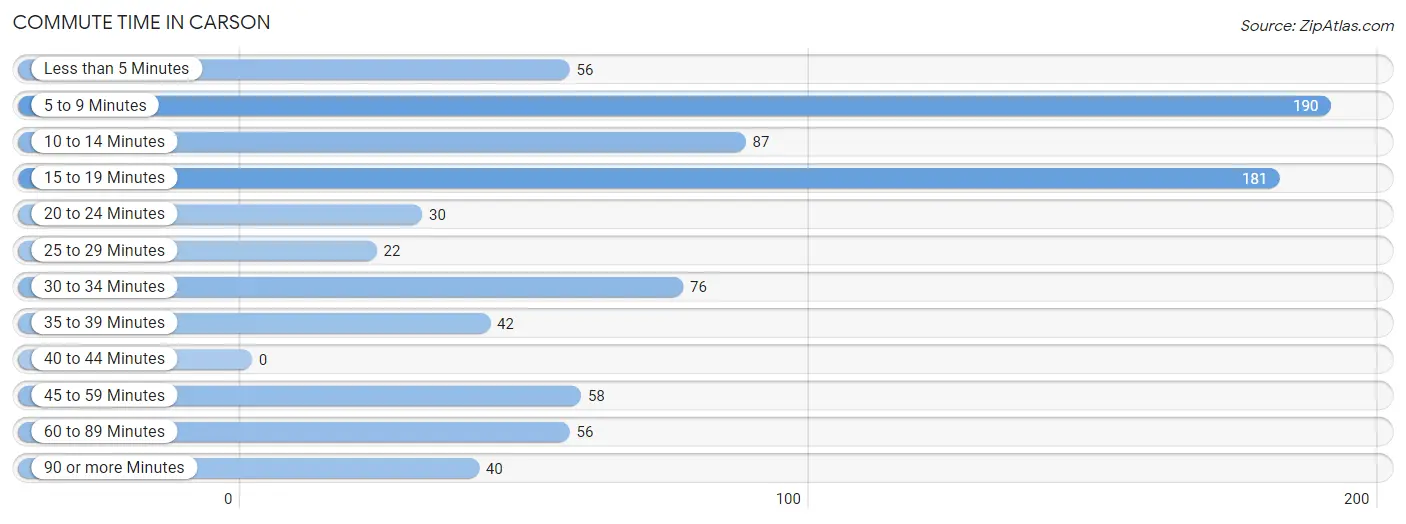
| Commute Time | # Commuters | % Commuters |
| Less than 5 Minutes | 56 | 6.7% |
| 5 to 9 Minutes | 190 | 22.7% |
| 10 to 14 Minutes | 87 | 10.4% |
| 15 to 19 Minutes | 181 | 21.6% |
| 20 to 24 Minutes | 30 | 3.6% |
| 25 to 29 Minutes | 22 | 2.6% |
| 30 to 34 Minutes | 76 | 9.1% |
| 35 to 39 Minutes | 42 | 5.0% |
| 40 to 44 Minutes | 0 | 0.0% |
| 45 to 59 Minutes | 58 | 6.9% |
| 60 to 89 Minutes | 56 | 6.7% |
| 90 or more Minutes | 40 | 4.8% |
Commute Time by Sex in Carson
The most common commute times in Carson are 5 to 9 minutes (111 commuters, 19.5%) for males and 15 to 19 minutes (92 commuters, 34.1%) for females.
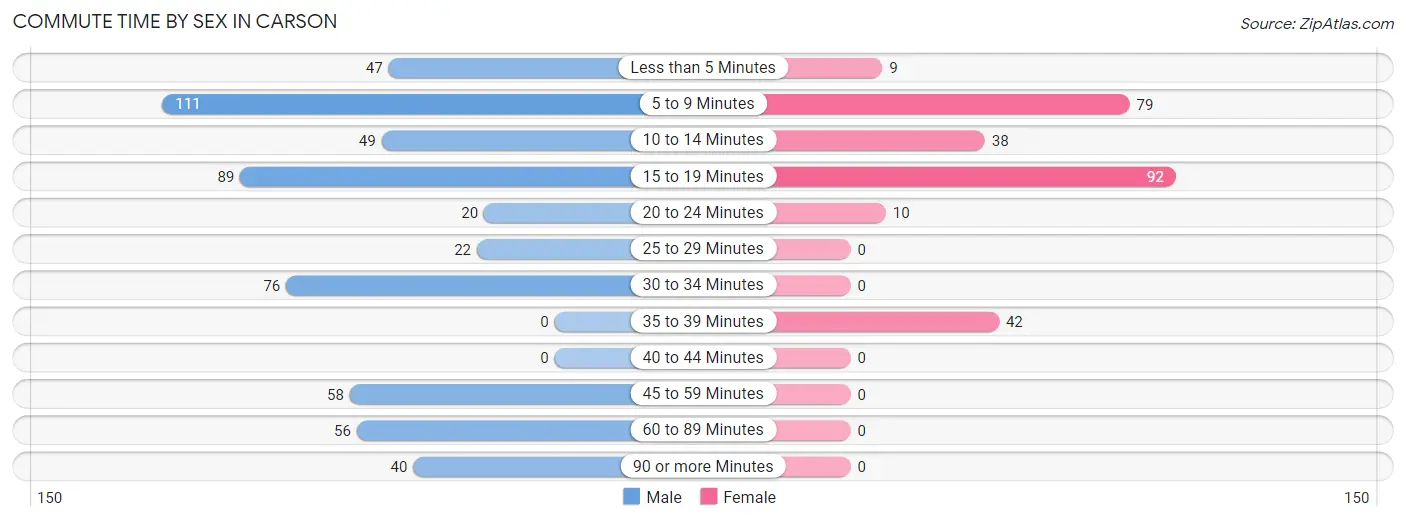
| Commute Time | Male | Female |
| Less than 5 Minutes | 47 (8.3%) | 9 (3.3%) |
| 5 to 9 Minutes | 111 (19.5%) | 79 (29.3%) |
| 10 to 14 Minutes | 49 (8.6%) | 38 (14.1%) |
| 15 to 19 Minutes | 89 (15.7%) | 92 (34.1%) |
| 20 to 24 Minutes | 20 (3.5%) | 10 (3.7%) |
| 25 to 29 Minutes | 22 (3.9%) | 0 (0.0%) |
| 30 to 34 Minutes | 76 (13.4%) | 0 (0.0%) |
| 35 to 39 Minutes | 0 (0.0%) | 42 (15.6%) |
| 40 to 44 Minutes | 0 (0.0%) | 0 (0.0%) |
| 45 to 59 Minutes | 58 (10.2%) | 0 (0.0%) |
| 60 to 89 Minutes | 56 (9.9%) | 0 (0.0%) |
| 90 or more Minutes | 40 (7.0%) | 0 (0.0%) |
Time of Departure to Work by Sex in Carson
The most frequent times of departure to work in Carson are 12:00 AM to 4:59 AM (136, 23.9%) for males and 12:00 PM to 3:59 PM (83, 30.7%) for females.
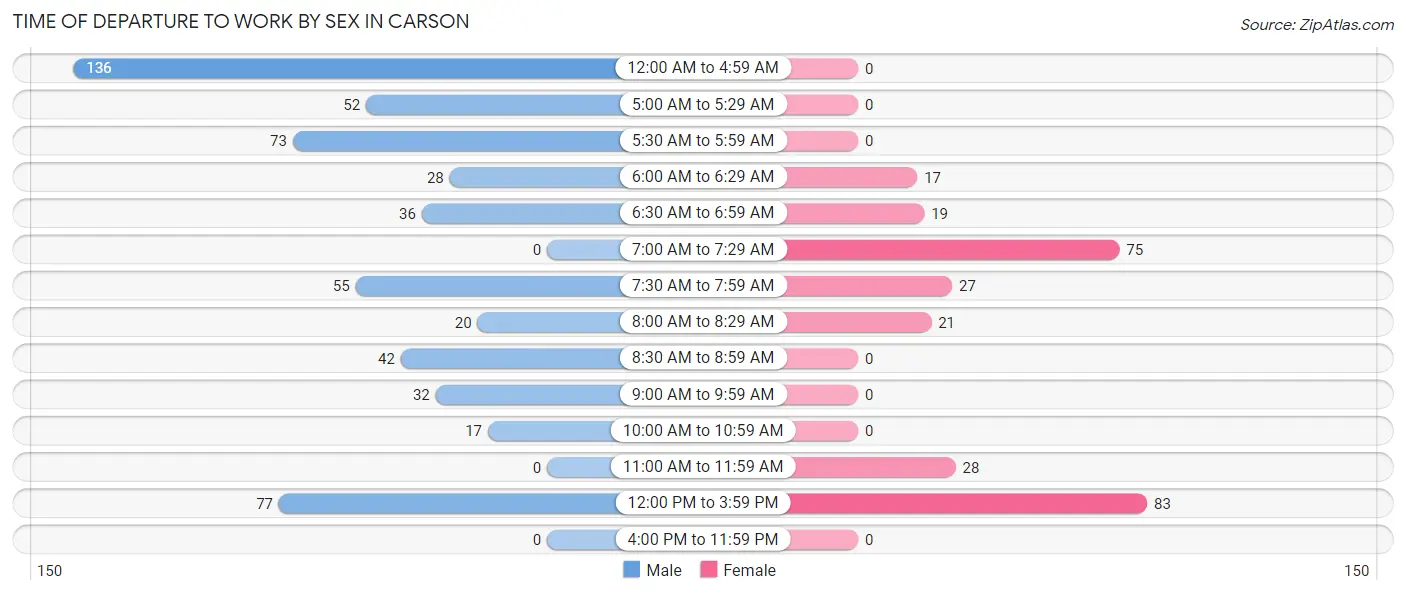
| Time of Departure | Male | Female |
| 12:00 AM to 4:59 AM | 136 (23.9%) | 0 (0.0%) |
| 5:00 AM to 5:29 AM | 52 (9.1%) | 0 (0.0%) |
| 5:30 AM to 5:59 AM | 73 (12.9%) | 0 (0.0%) |
| 6:00 AM to 6:29 AM | 28 (4.9%) | 17 (6.3%) |
| 6:30 AM to 6:59 AM | 36 (6.3%) | 19 (7.0%) |
| 7:00 AM to 7:29 AM | 0 (0.0%) | 75 (27.8%) |
| 7:30 AM to 7:59 AM | 55 (9.7%) | 27 (10.0%) |
| 8:00 AM to 8:29 AM | 20 (3.5%) | 21 (7.8%) |
| 8:30 AM to 8:59 AM | 42 (7.4%) | 0 (0.0%) |
| 9:00 AM to 9:59 AM | 32 (5.6%) | 0 (0.0%) |
| 10:00 AM to 10:59 AM | 17 (3.0%) | 0 (0.0%) |
| 11:00 AM to 11:59 AM | 0 (0.0%) | 28 (10.4%) |
| 12:00 PM to 3:59 PM | 77 (13.6%) | 83 (30.7%) |
| 4:00 PM to 11:59 PM | 0 (0.0%) | 0 (0.0%) |
| Total | 568 (100.0%) | 270 (100.0%) |
Housing Occupancy in Carson
Occupancy by Ownership in Carson
Of the total 1,009 dwellings in Carson, owner-occupied units account for 772 (76.5%), while renter-occupied units make up 237 (23.5%).
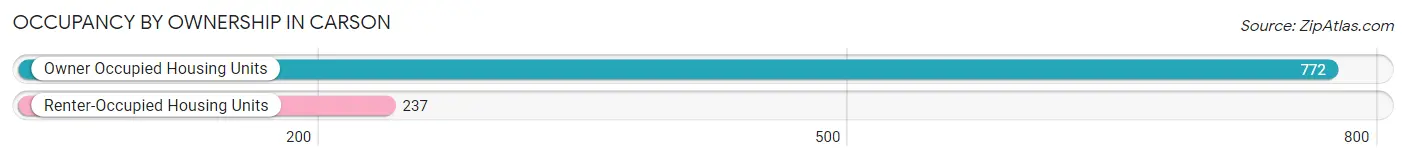
| Occupancy | # Housing Units | % Housing Units |
| Owner Occupied Housing Units | 772 | 76.5% |
| Renter-Occupied Housing Units | 237 | 23.5% |
| Total Occupied Housing Units | 1,009 | 100.0% |
Occupancy by Household Size in Carson
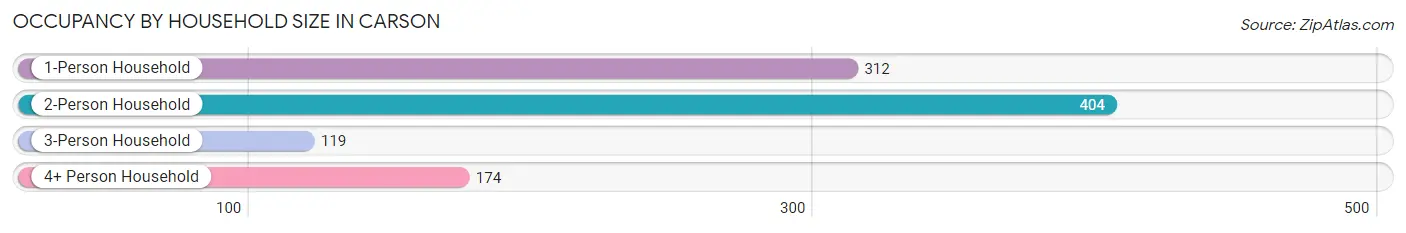
| Household Size | # Housing Units | % Housing Units |
| 1-Person Household | 312 | 30.9% |
| 2-Person Household | 404 | 40.0% |
| 3-Person Household | 119 | 11.8% |
| 4+ Person Household | 174 | 17.2% |
| Total Housing Units | 1,009 | 100.0% |
Occupancy by Ownership by Household Size in Carson
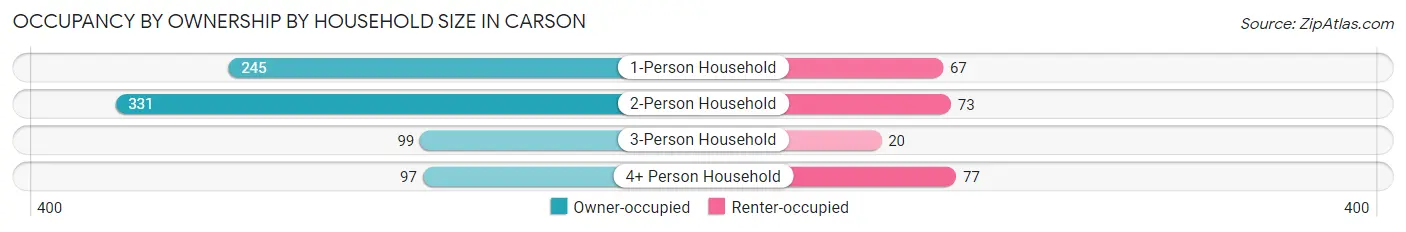
| Household Size | Owner-occupied | Renter-occupied |
| 1-Person Household | 245 (78.5%) | 67 (21.5%) |
| 2-Person Household | 331 (81.9%) | 73 (18.1%) |
| 3-Person Household | 99 (83.2%) | 20 (16.8%) |
| 4+ Person Household | 97 (55.7%) | 77 (44.3%) |
| Total Housing Units | 772 (76.5%) | 237 (23.5%) |
Occupancy by Educational Attainment in Carson
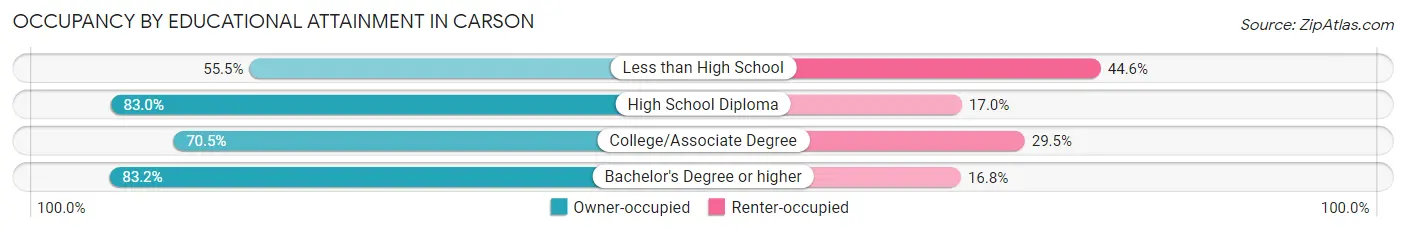
| Household Size | Owner-occupied | Renter-occupied |
| Less than High School | 56 (55.4%) | 45 (44.6%) |
| High School Diploma | 404 (83.0%) | 83 (17.0%) |
| College/Associate Degree | 213 (70.5%) | 89 (29.5%) |
| Bachelor's Degree or higher | 99 (83.2%) | 20 (16.8%) |
Occupancy by Age of Householder in Carson
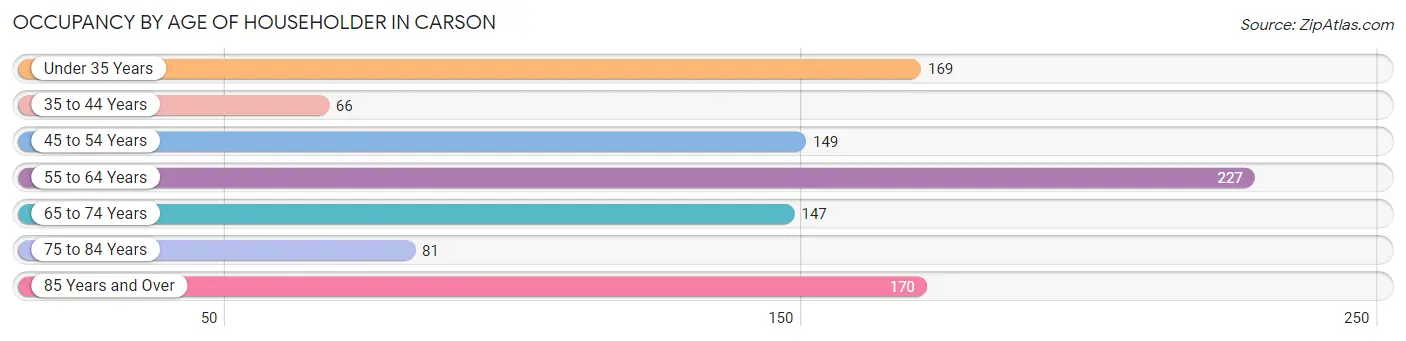
| Age Bracket | # Households | % Households |
| Under 35 Years | 169 | 16.8% |
| 35 to 44 Years | 66 | 6.5% |
| 45 to 54 Years | 149 | 14.8% |
| 55 to 64 Years | 227 | 22.5% |
| 65 to 74 Years | 147 | 14.6% |
| 75 to 84 Years | 81 | 8.0% |
| 85 Years and Over | 170 | 16.9% |
| Total | 1,009 | 100.0% |
Housing Finances in Carson
Median Income by Occupancy in Carson
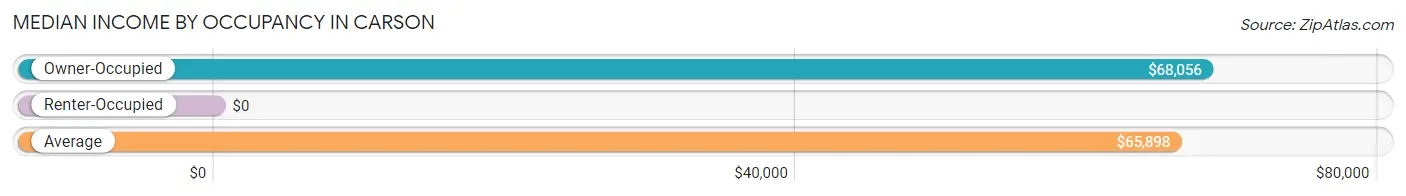
| Occupancy Type | # Households | Median Income |
| Owner-Occupied | 772 (76.5%) | $68,056 |
| Renter-Occupied | 237 (23.5%) | $0 |
| Average | 1,009 (100.0%) | $65,898 |
Occupancy by Householder Income Bracket in Carson
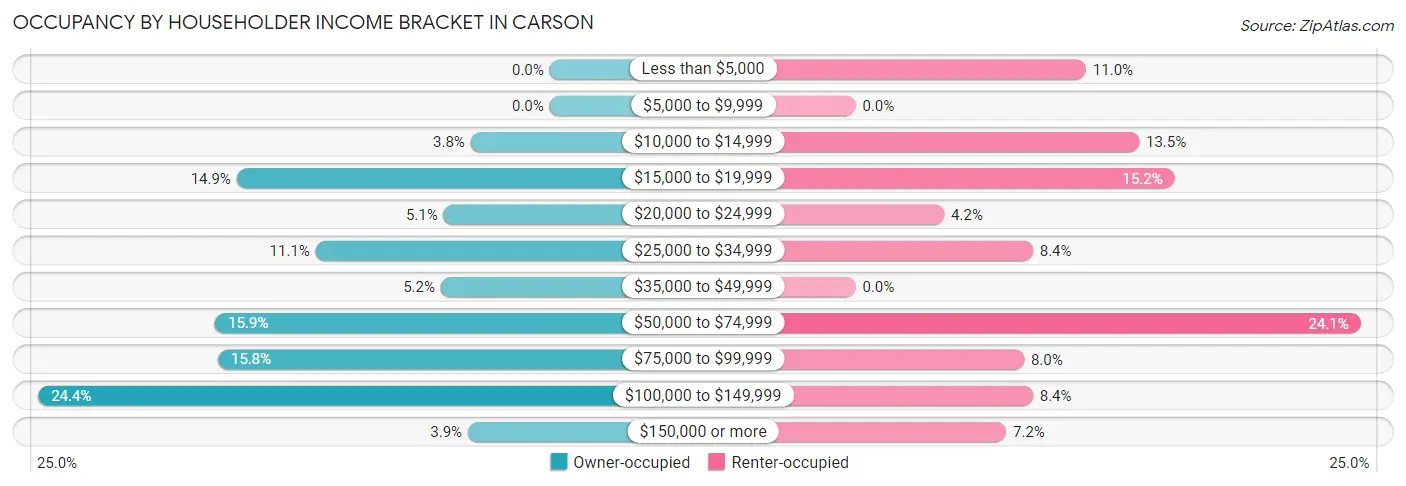
| Income Bracket | Owner-occupied | Renter-occupied |
| Less than $5,000 | 0 (0.0%) | 26 (11.0%) |
| $5,000 to $9,999 | 0 (0.0%) | 0 (0.0%) |
| $10,000 to $14,999 | 29 (3.8%) | 32 (13.5%) |
| $15,000 to $19,999 | 115 (14.9%) | 36 (15.2%) |
| $20,000 to $24,999 | 39 (5.1%) | 10 (4.2%) |
| $25,000 to $34,999 | 86 (11.1%) | 20 (8.4%) |
| $35,000 to $49,999 | 40 (5.2%) | 0 (0.0%) |
| $50,000 to $74,999 | 123 (15.9%) | 57 (24.0%) |
| $75,000 to $99,999 | 122 (15.8%) | 19 (8.0%) |
| $100,000 to $149,999 | 188 (24.3%) | 20 (8.4%) |
| $150,000 or more | 30 (3.9%) | 17 (7.2%) |
| Total | 772 (100.0%) | 237 (100.0%) |
Monthly Housing Cost Tiers in Carson
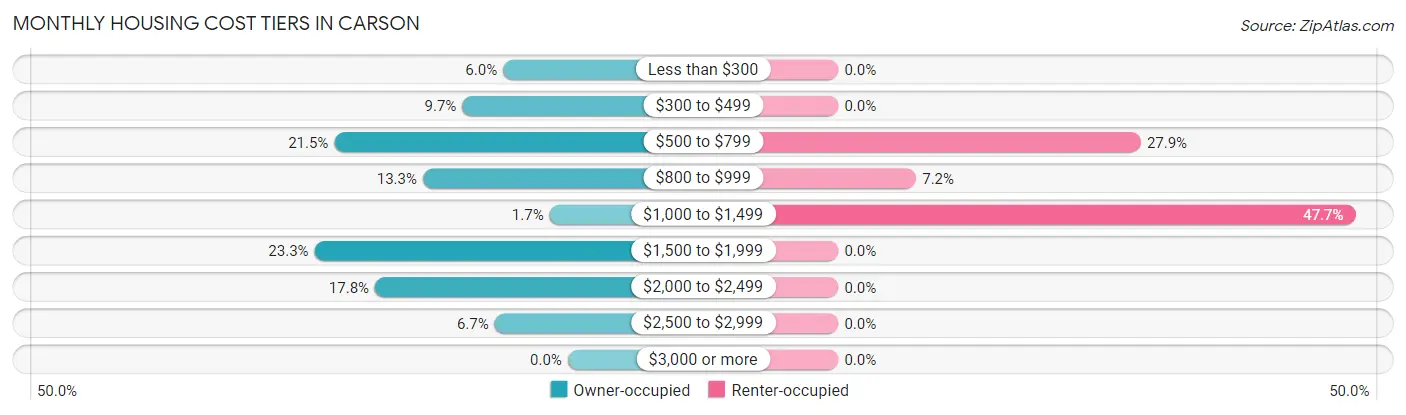
| Monthly Cost | Owner-occupied | Renter-occupied |
| Less than $300 | 46 (6.0%) | 0 (0.0%) |
| $300 to $499 | 75 (9.7%) | 0 (0.0%) |
| $500 to $799 | 166 (21.5%) | 66 (27.9%) |
| $800 to $999 | 103 (13.3%) | 17 (7.2%) |
| $1,000 to $1,499 | 13 (1.7%) | 113 (47.7%) |
| $1,500 to $1,999 | 180 (23.3%) | 0 (0.0%) |
| $2,000 to $2,499 | 137 (17.7%) | 0 (0.0%) |
| $2,500 to $2,999 | 52 (6.7%) | 0 (0.0%) |
| $3,000 or more | 0 (0.0%) | 0 (0.0%) |
| Total | 772 (100.0%) | 237 (100.0%) |
Physical Housing Characteristics in Carson
Housing Structures in Carson
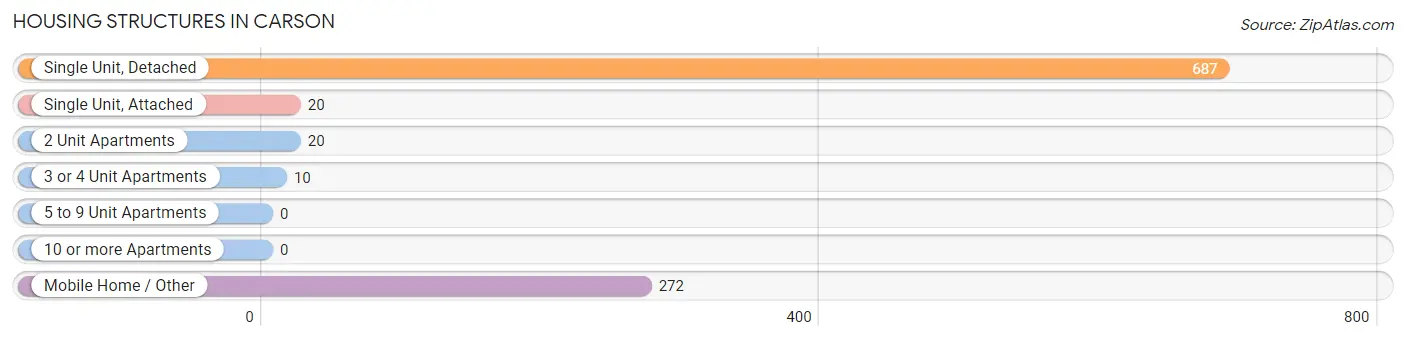
| Structure Type | # Housing Units | % Housing Units |
| Single Unit, Detached | 687 | 68.1% |
| Single Unit, Attached | 20 | 2.0% |
| 2 Unit Apartments | 20 | 2.0% |
| 3 or 4 Unit Apartments | 10 | 1.0% |
| 5 to 9 Unit Apartments | 0 | 0.0% |
| 10 or more Apartments | 0 | 0.0% |
| Mobile Home / Other | 272 | 27.0% |
| Total | 1,009 | 100.0% |
Housing Structures by Occupancy in Carson
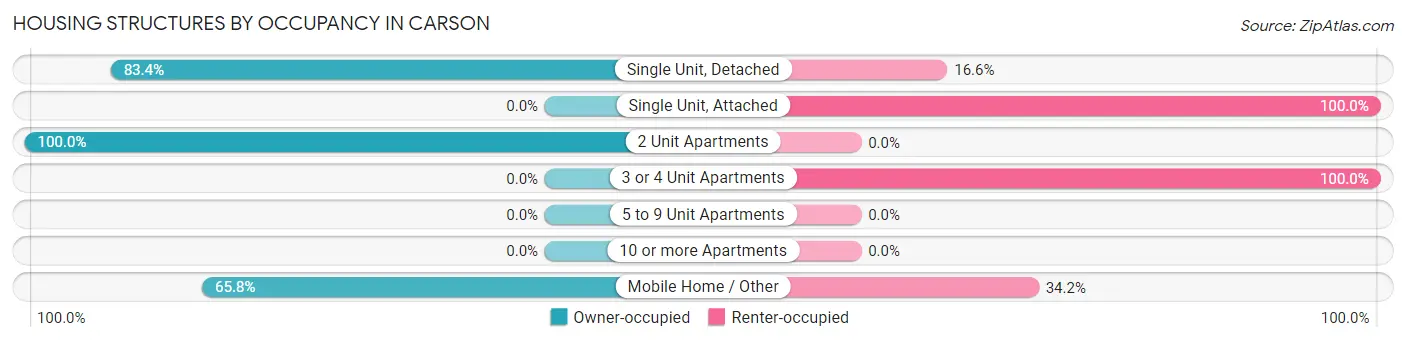
| Structure Type | Owner-occupied | Renter-occupied |
| Single Unit, Detached | 573 (83.4%) | 114 (16.6%) |
| Single Unit, Attached | 0 (0.0%) | 20 (100.0%) |
| 2 Unit Apartments | 20 (100.0%) | 0 (0.0%) |
| 3 or 4 Unit Apartments | 0 (0.0%) | 10 (100.0%) |
| 5 to 9 Unit Apartments | 0 (0.0%) | 0 (0.0%) |
| 10 or more Apartments | 0 (0.0%) | 0 (0.0%) |
| Mobile Home / Other | 179 (65.8%) | 93 (34.2%) |
| Total | 772 (76.5%) | 237 (23.5%) |
Housing Structures by Number of Rooms in Carson
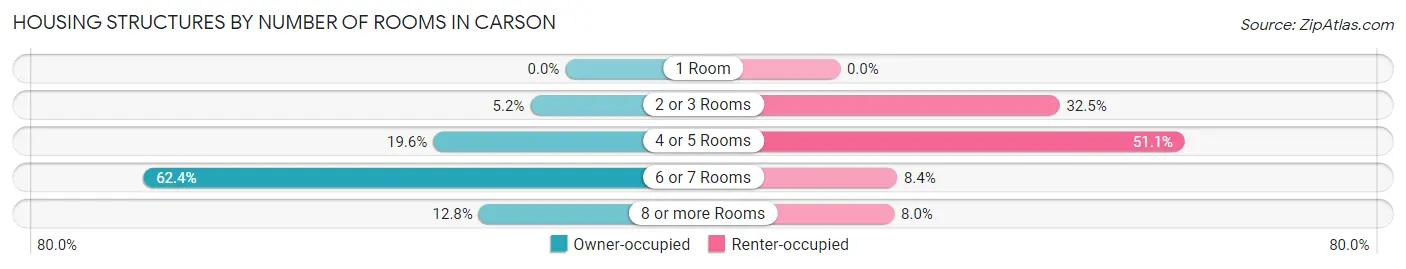
| Number of Rooms | Owner-occupied | Renter-occupied |
| 1 Room | 0 (0.0%) | 0 (0.0%) |
| 2 or 3 Rooms | 40 (5.2%) | 77 (32.5%) |
| 4 or 5 Rooms | 151 (19.6%) | 121 (51.0%) |
| 6 or 7 Rooms | 482 (62.4%) | 20 (8.4%) |
| 8 or more Rooms | 99 (12.8%) | 19 (8.0%) |
| Total | 772 (100.0%) | 237 (100.0%) |
Housing Structure by Heating Type in Carson
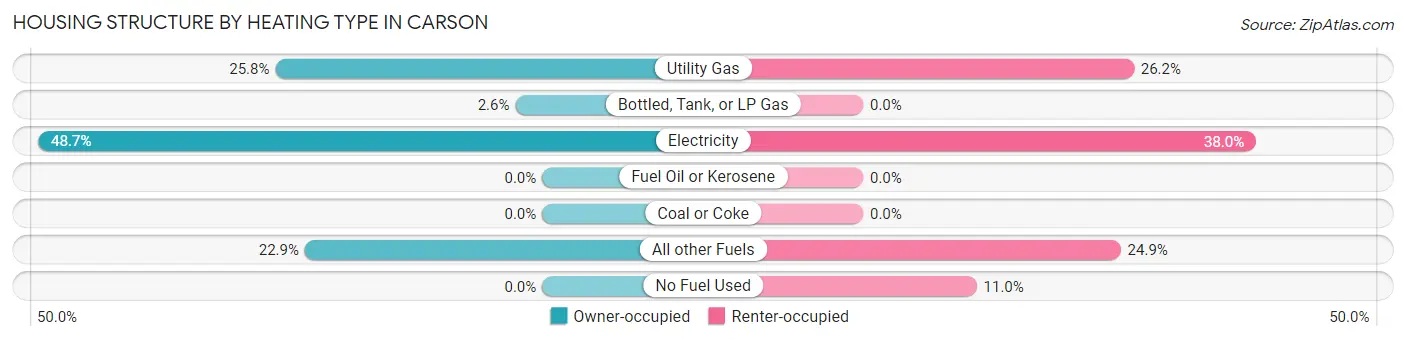
| Heating Type | Owner-occupied | Renter-occupied |
| Utility Gas | 199 (25.8%) | 62 (26.2%) |
| Bottled, Tank, or LP Gas | 20 (2.6%) | 0 (0.0%) |
| Electricity | 376 (48.7%) | 90 (38.0%) |
| Fuel Oil or Kerosene | 0 (0.0%) | 0 (0.0%) |
| Coal or Coke | 0 (0.0%) | 0 (0.0%) |
| All other Fuels | 177 (22.9%) | 59 (24.9%) |
| No Fuel Used | 0 (0.0%) | 26 (11.0%) |
| Total | 772 (100.0%) | 237 (100.0%) |
Household Vehicle Usage in Carson
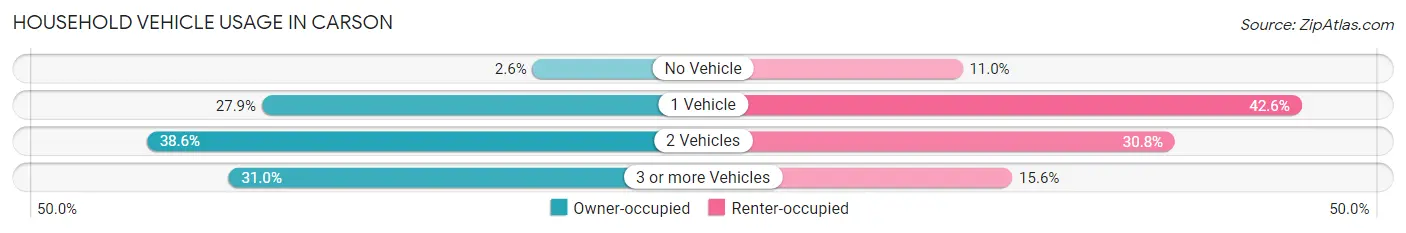
| Vehicles per Household | Owner-occupied | Renter-occupied |
| No Vehicle | 20 (2.6%) | 26 (11.0%) |
| 1 Vehicle | 215 (27.9%) | 101 (42.6%) |
| 2 Vehicles | 298 (38.6%) | 73 (30.8%) |
| 3 or more Vehicles | 239 (31.0%) | 37 (15.6%) |
| Total | 772 (100.0%) | 237 (100.0%) |
Real Estate & Mortgages in Carson
Real Estate and Mortgage Overview in Carson
| Characteristic | Without Mortgage | With Mortgage |
| Housing Units | 313 | 459 |
| Median Property Value | $287,500 | $337,100 |
| Median Household Income | $47,031 | $30 |
| Monthly Housing Costs | $577 | $0 |
| Real Estate Taxes | $1,316 | $77 |
Property Value by Mortgage Status in Carson
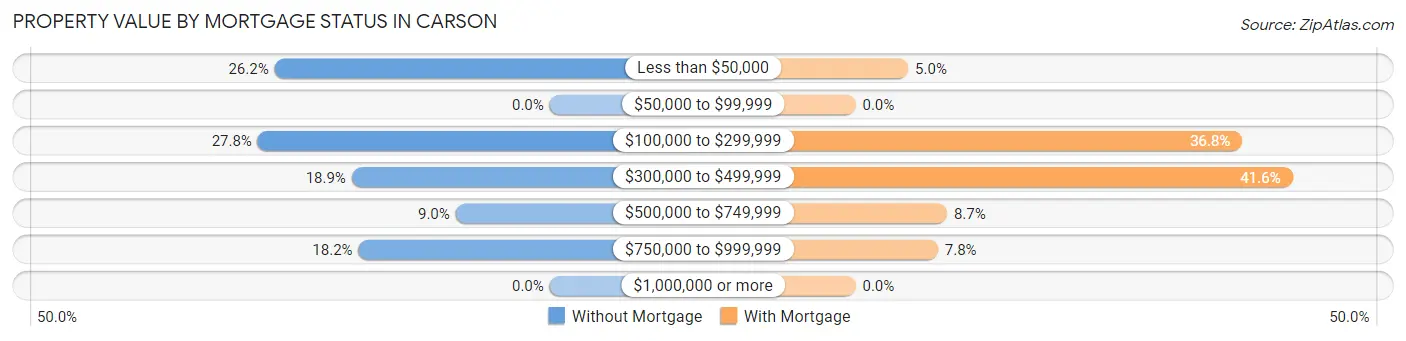
| Property Value | Without Mortgage | With Mortgage |
| Less than $50,000 | 82 (26.2%) | 23 (5.0%) |
| $50,000 to $99,999 | 0 (0.0%) | 0 (0.0%) |
| $100,000 to $299,999 | 87 (27.8%) | 169 (36.8%) |
| $300,000 to $499,999 | 59 (18.9%) | 191 (41.6%) |
| $500,000 to $749,999 | 28 (8.9%) | 40 (8.7%) |
| $750,000 to $999,999 | 57 (18.2%) | 36 (7.8%) |
| $1,000,000 or more | 0 (0.0%) | 0 (0.0%) |
| Total | 313 (100.0%) | 459 (100.0%) |
Household Income by Mortgage Status in Carson
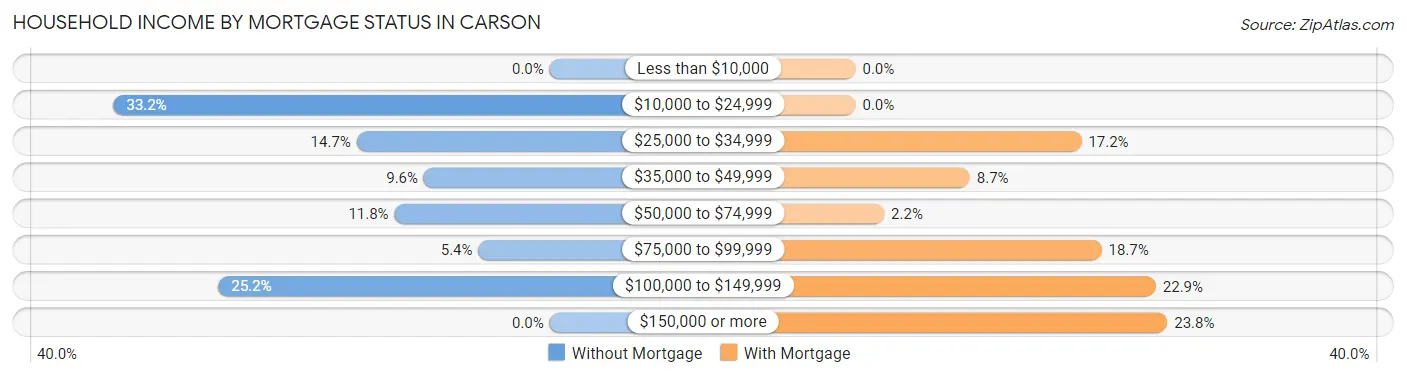
| Household Income | Without Mortgage | With Mortgage |
| Less than $10,000 | 0 (0.0%) | 0 (0.0%) |
| $10,000 to $24,999 | 104 (33.2%) | 0 (0.0%) |
| $25,000 to $34,999 | 46 (14.7%) | 79 (17.2%) |
| $35,000 to $49,999 | 30 (9.6%) | 40 (8.7%) |
| $50,000 to $74,999 | 37 (11.8%) | 10 (2.2%) |
| $75,000 to $99,999 | 17 (5.4%) | 86 (18.7%) |
| $100,000 to $149,999 | 79 (25.2%) | 105 (22.9%) |
| $150,000 or more | 0 (0.0%) | 109 (23.7%) |
| Total | 313 (100.0%) | 459 (100.0%) |
Property Value to Household Income Ratio in Carson
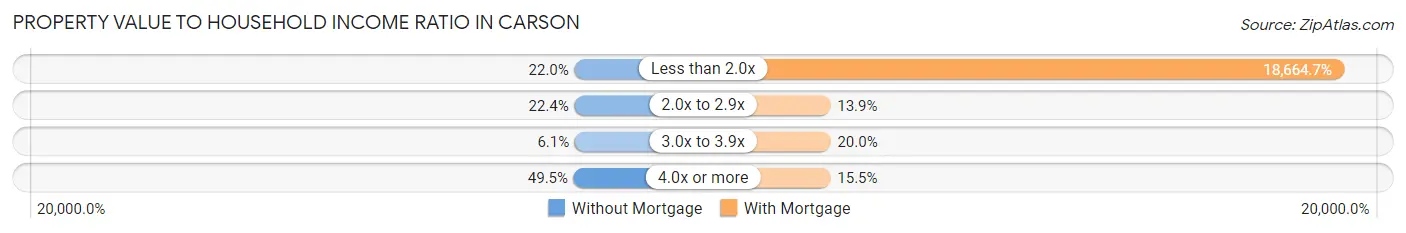
| Value-to-Income Ratio | Without Mortgage | With Mortgage |
| Less than 2.0x | 69 (22.0%) | 85,671 (18,664.7%) |
| 2.0x to 2.9x | 70 (22.4%) | 64 (13.9%) |
| 3.0x to 3.9x | 19 (6.1%) | 92 (20.0%) |
| 4.0x or more | 155 (49.5%) | 71 (15.5%) |
| Total | 313 (100.0%) | 459 (100.0%) |
Real Estate Taxes by Mortgage Status in Carson
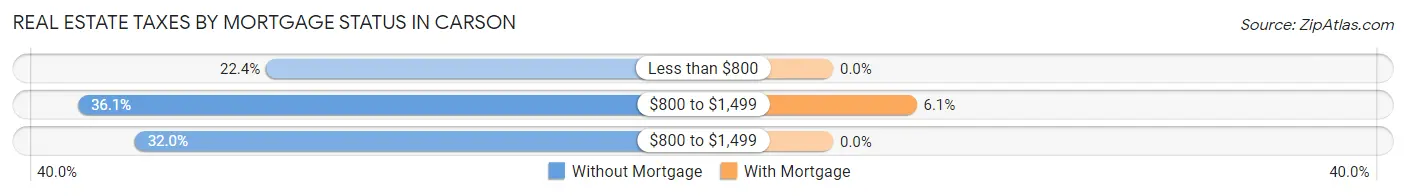
| Property Taxes | Without Mortgage | With Mortgage |
| Less than $800 | 70 (22.4%) | 0 (0.0%) |
| $800 to $1,499 | 113 (36.1%) | 28 (6.1%) |
| $800 to $1,499 | 100 (32.0%) | 0 (0.0%) |
| Total | 313 (100.0%) | 459 (100.0%) |
Health & Disability in Carson
Health Insurance Coverage by Age in Carson
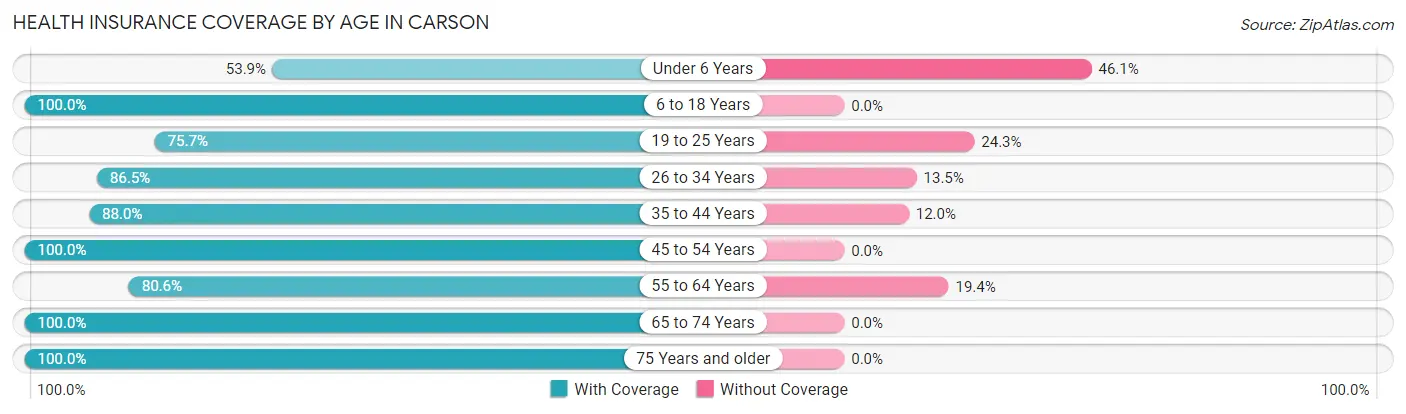
| Age Bracket | With Coverage | Without Coverage |
| Under 6 Years | 90 (53.9%) | 77 (46.1%) |
| 6 to 18 Years | 236 (100.0%) | 0 (0.0%) |
| 19 to 25 Years | 103 (75.7%) | 33 (24.3%) |
| 26 to 34 Years | 263 (86.5%) | 41 (13.5%) |
| 35 to 44 Years | 183 (88.0%) | 25 (12.0%) |
| 45 to 54 Years | 279 (100.0%) | 0 (0.0%) |
| 55 to 64 Years | 435 (80.6%) | 105 (19.4%) |
| 65 to 74 Years | 192 (100.0%) | 0 (0.0%) |
| 75 Years and older | 287 (100.0%) | 0 (0.0%) |
| Total | 2,068 (88.0%) | 281 (12.0%) |
Health Insurance Coverage by Citizenship Status in Carson
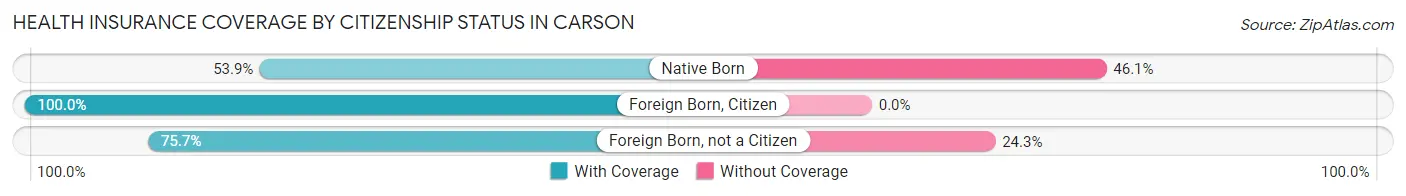
| Citizenship Status | With Coverage | Without Coverage |
| Native Born | 90 (53.9%) | 77 (46.1%) |
| Foreign Born, Citizen | 236 (100.0%) | 0 (0.0%) |
| Foreign Born, not a Citizen | 103 (75.7%) | 33 (24.3%) |
Health Insurance Coverage by Household Income in Carson
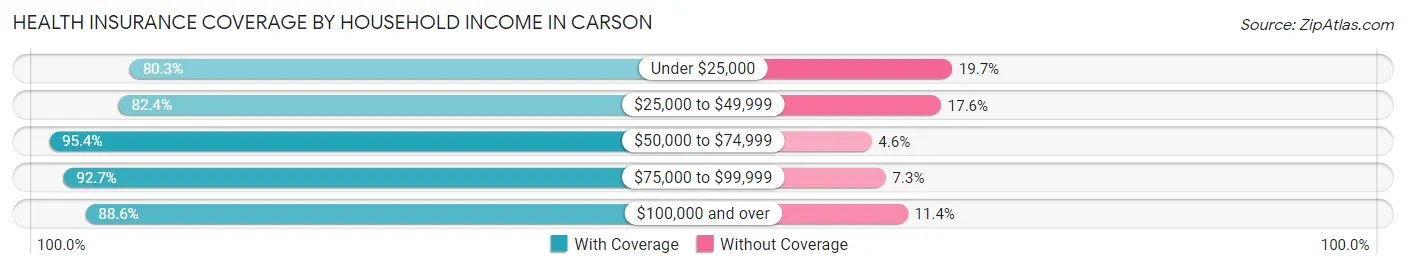
| Household Income | With Coverage | Without Coverage |
| Under $25,000 | 326 (80.3%) | 80 (19.7%) |
| $25,000 to $49,999 | 332 (82.4%) | 71 (17.6%) |
| $50,000 to $74,999 | 393 (95.4%) | 19 (4.6%) |
| $75,000 to $99,999 | 395 (92.7%) | 31 (7.3%) |
| $100,000 and over | 622 (88.6%) | 80 (11.4%) |
Public vs Private Health Insurance Coverage by Age in Carson
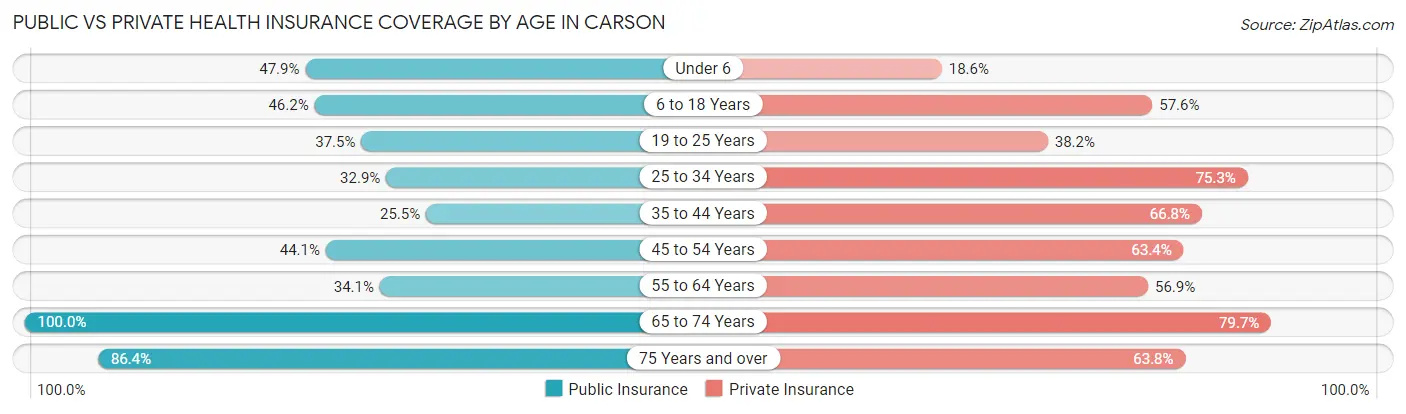
| Age Bracket | Public Insurance | Private Insurance |
| Under 6 | 80 (47.9%) | 31 (18.6%) |
| 6 to 18 Years | 109 (46.2%) | 136 (57.6%) |
| 19 to 25 Years | 51 (37.5%) | 52 (38.2%) |
| 25 to 34 Years | 100 (32.9%) | 229 (75.3%) |
| 35 to 44 Years | 53 (25.5%) | 139 (66.8%) |
| 45 to 54 Years | 123 (44.1%) | 177 (63.4%) |
| 55 to 64 Years | 184 (34.1%) | 307 (56.9%) |
| 65 to 74 Years | 192 (100.0%) | 153 (79.7%) |
| 75 Years and over | 248 (86.4%) | 183 (63.8%) |
| Total | 1,140 (48.5%) | 1,407 (59.9%) |
Disability Status by Sex by Age in Carson
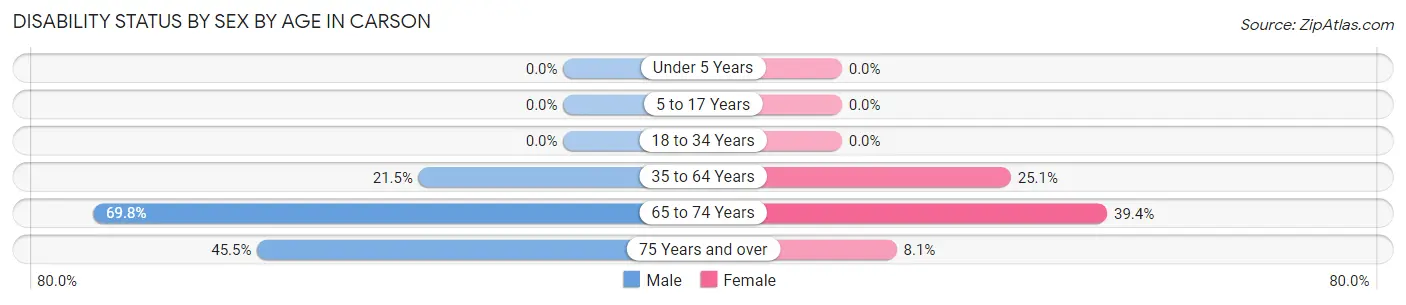
| Age Bracket | Male | Female |
| Under 5 Years | 0 (0.0%) | 0 (0.0%) |
| 5 to 17 Years | 0 (0.0%) | 0 (0.0%) |
| 18 to 34 Years | 0 (0.0%) | 0 (0.0%) |
| 35 to 64 Years | 117 (21.5%) | 121 (25.1%) |
| 65 to 74 Years | 88 (69.8%) | 26 (39.4%) |
| 75 Years and over | 30 (45.5%) | 18 (8.1%) |
Disability Class by Sex by Age in Carson
Disability Class: Hearing Difficulty
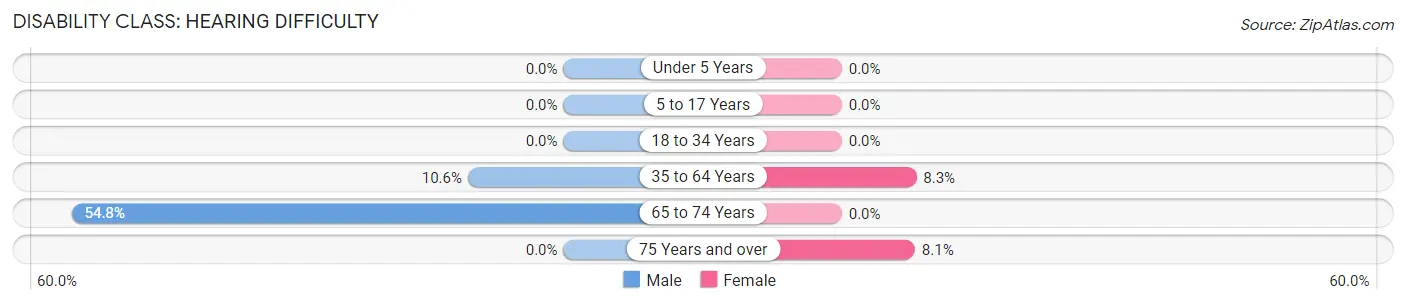
| Age Bracket | Male | Female |
| Under 5 Years | 0 (0.0%) | 0 (0.0%) |
| 5 to 17 Years | 0 (0.0%) | 0 (0.0%) |
| 18 to 34 Years | 0 (0.0%) | 0 (0.0%) |
| 35 to 64 Years | 58 (10.6%) | 40 (8.3%) |
| 65 to 74 Years | 69 (54.8%) | 0 (0.0%) |
| 75 Years and over | 0 (0.0%) | 18 (8.1%) |
Disability Class: Vision Difficulty
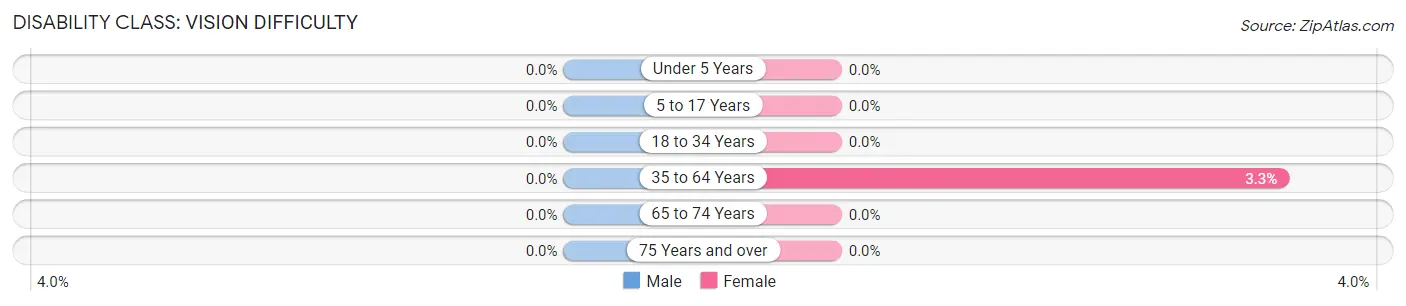
| Age Bracket | Male | Female |
| Under 5 Years | 0 (0.0%) | 0 (0.0%) |
| 5 to 17 Years | 0 (0.0%) | 0 (0.0%) |
| 18 to 34 Years | 0 (0.0%) | 0 (0.0%) |
| 35 to 64 Years | 0 (0.0%) | 16 (3.3%) |
| 65 to 74 Years | 0 (0.0%) | 0 (0.0%) |
| 75 Years and over | 0 (0.0%) | 0 (0.0%) |
Disability Class: Cognitive Difficulty
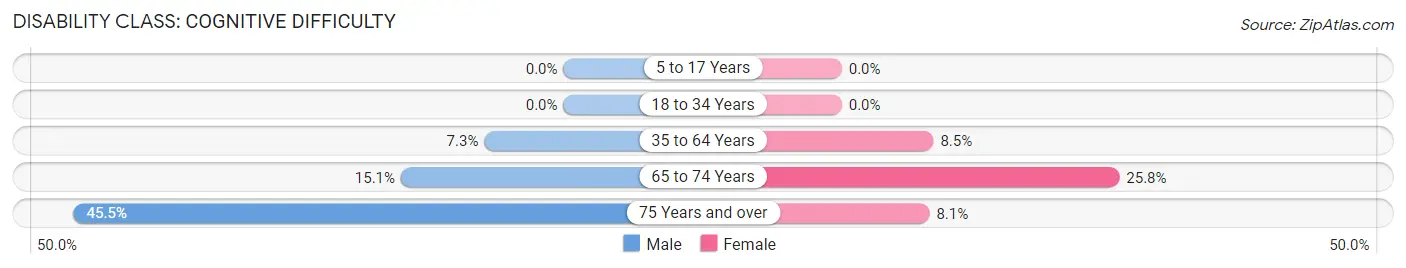
| Age Bracket | Male | Female |
| 5 to 17 Years | 0 (0.0%) | 0 (0.0%) |
| 18 to 34 Years | 0 (0.0%) | 0 (0.0%) |
| 35 to 64 Years | 40 (7.3%) | 41 (8.5%) |
| 65 to 74 Years | 19 (15.1%) | 17 (25.8%) |
| 75 Years and over | 30 (45.5%) | 18 (8.1%) |
Disability Class: Ambulatory Difficulty
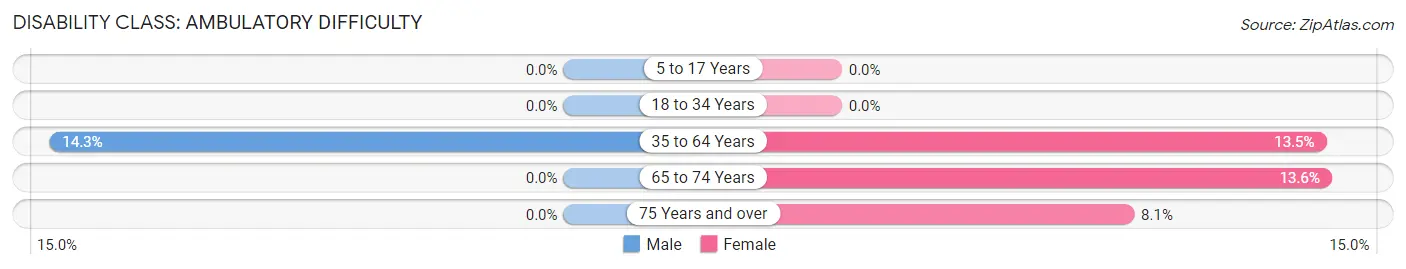
| Age Bracket | Male | Female |
| 5 to 17 Years | 0 (0.0%) | 0 (0.0%) |
| 18 to 34 Years | 0 (0.0%) | 0 (0.0%) |
| 35 to 64 Years | 78 (14.3%) | 65 (13.5%) |
| 65 to 74 Years | 0 (0.0%) | 9 (13.6%) |
| 75 Years and over | 0 (0.0%) | 18 (8.1%) |
Disability Class: Self-Care Difficulty
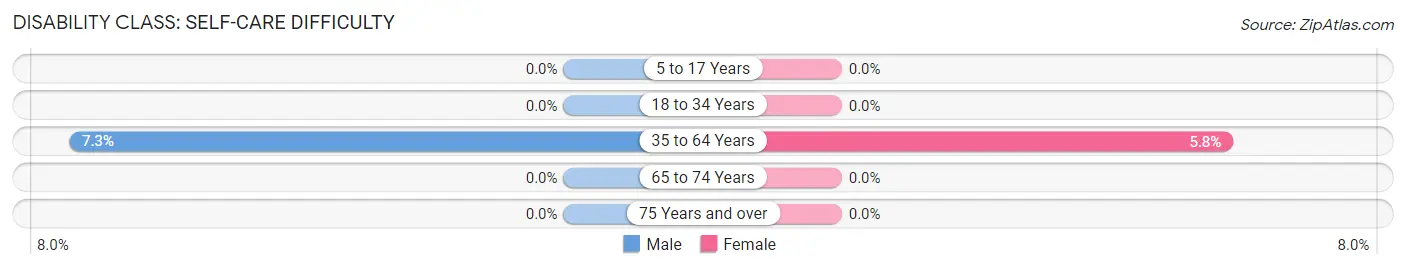
| Age Bracket | Male | Female |
| 5 to 17 Years | 0 (0.0%) | 0 (0.0%) |
| 18 to 34 Years | 0 (0.0%) | 0 (0.0%) |
| 35 to 64 Years | 40 (7.3%) | 28 (5.8%) |
| 65 to 74 Years | 0 (0.0%) | 0 (0.0%) |
| 75 Years and over | 0 (0.0%) | 0 (0.0%) |
Technology Access in Carson
Computing Device Access in Carson
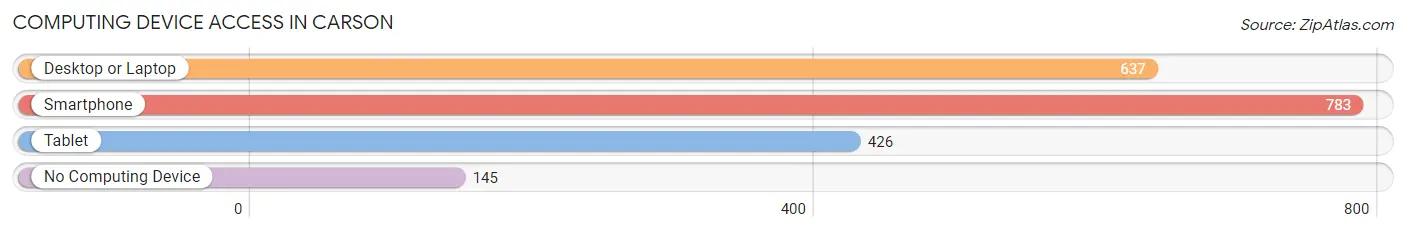
| Device Type | # Households | % Households |
| Desktop or Laptop | 637 | 63.1% |
| Smartphone | 783 | 77.6% |
| Tablet | 426 | 42.2% |
| No Computing Device | 145 | 14.4% |
| Total | 1,009 | 100.0% |
Internet Access in Carson
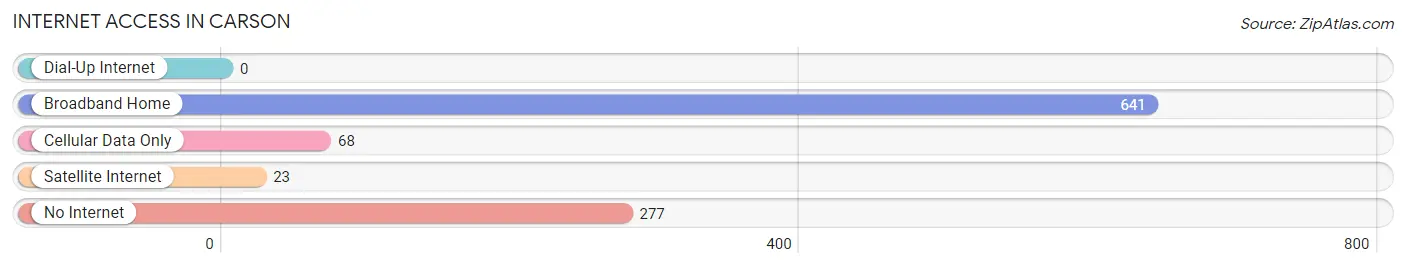
| Internet Type | # Households | % Households |
| Dial-Up Internet | 0 | 0.0% |
| Broadband Home | 641 | 63.5% |
| Cellular Data Only | 68 | 6.7% |
| Satellite Internet | 23 | 2.3% |
| No Internet | 277 | 27.5% |
| Total | 1,009 | 100.0% |
Carson Summary
Carson is a small town located in the state of Washington, United States. It is situated in the foothills of the Cascade Mountains, about 25 miles east of Seattle. The town has a population of about 1,500 people and is part of the King County metropolitan area.
History
The area that is now Carson was first settled in the late 1800s by homesteaders. The town was officially incorporated in 1909 and was named after the Carson family, who were among the first settlers. The town was originally a logging and farming community, but in the early 1900s, it began to develop into a tourist destination. The town was known for its scenic beauty and its proximity to Seattle.
In the 1950s, the town began to experience a decline in population as people moved away to larger cities. However, in the late 1970s, the town began to experience a resurgence in population as people moved back to the area. This was due to the town's proximity to Seattle and its scenic beauty.
Geography
Carson is located in the foothills of the Cascade Mountains, about 25 miles east of Seattle. The town is situated at an elevation of about 1,000 feet and is surrounded by forests and mountains. The town is located in a valley and is bordered by the Snoqualmie River to the north and the Tolt River to the south.
The climate in Carson is mild and temperate. Summers are warm and dry, while winters are cold and wet. The average annual temperature is around 50 degrees Fahrenheit.
Economy
The economy of Carson is largely based on tourism. The town is known for its scenic beauty and its proximity to Seattle. The town is also home to several small businesses, including restaurants, shops, and galleries.
The town is also home to several wineries and vineyards, which produce a variety of wines. The town is also home to several farms, which produce a variety of fruits and vegetables.
Demographics
As of the 2010 census, the population of Carson was 1,500. The town is predominantly white, with about 90% of the population being Caucasian. The town also has a small Hispanic population, with about 5% of the population being Hispanic. The median household income in Carson is around $50,000.
Conclusion
Carson is a small town located in the state of Washington, United States. It is situated in the foothills of the Cascade Mountains, about 25 miles east of Seattle. The town has a population of about 1,500 people and is part of the King County metropolitan area. The town is known for its scenic beauty and its proximity to Seattle. The economy of Carson is largely based on tourism, with the town being home to several small businesses, wineries, and farms. The population of Carson is predominantly white, with about 90% of the population being Caucasian. The median household income in Carson is around $50,000.
Common Questions
What is Per Capita Income in Carson?
Per Capita income in Carson is $31,651.
What is the Median Family Income in Carson?
Median Family Income in Carson is $82,566.
What is the Median Household income in Carson?
Median Household Income in Carson is $65,898.
What is Income or Wage Gap in Carson?
Income or Wage Gap in Carson is 16.0%.
Women in Carson earn 84.0 cents for every dollar earned by a man.
What is Inequality or Gini Index in Carson?
Inequality or Gini Index in Carson is 0.42.
What is the Total Population of Carson?
Total Population of Carson is 2,349.
What is the Total Male Population of Carson?
Total Male Population of Carson is 1,149.
What is the Total Female Population of Carson?
Total Female Population of Carson is 1,200.
What is the Ratio of Males per 100 Females in Carson?
There are 95.75 Males per 100 Females in Carson.
What is the Ratio of Females per 100 Males in Carson?
There are 104.44 Females per 100 Males in Carson.
What is the Median Population Age in Carson?
Median Population Age in Carson is 51.4 Years.
What is the Average Family Size in Carson
Average Family Size in Carson is 2.8 People.
What is the Average Household Size in Carson
Average Household Size in Carson is 2.3 People.
How Large is the Labor Force in Carson?
There are 1,025 People in the Labor Forcein in Carson.
What is the Percentage of People in the Labor Force in Carson?
51.6% of People are in the Labor Force in Carson.
What is the Unemployment Rate in Carson?
Unemployment Rate in Carson is 6.2%.