Sequim, WA Map & Demographics
Sequim Map
Sequim Overview
$34,171
PER CAPITA INCOME
$68,614
AVG FAMILY INCOME
$48,015
AVG HOUSEHOLD INCOME
42.8%
WAGE / INCOME GAP [ % ]
57.2¢/ $1
WAGE / INCOME GAP [ $ ]
0.48
INEQUALITY / GINI INDEX
8,073
TOTAL POPULATION
3,760
MALE POPULATION
4,313
FEMALE POPULATION
87.18
MALES / 100 FEMALES
114.71
FEMALES / 100 MALES
57.1
MEDIAN AGE
2.6
AVG FAMILY SIZE
1.9
AVG HOUSEHOLD SIZE
2,834
LABOR FORCE [ PEOPLE ]
42.0%
PERCENT IN LABOR FORCE
5.9%
UNEMPLOYMENT RATE
Sequim Zip Codes
Sequim Area Codes
Income in Sequim
Income Overview in Sequim
Per Capita Income in Sequim is $34,171, while median incomes of families and households are $68,614 and $48,015 respectively.
| Characteristic | Number | Measure |
| Per Capita Income | 8,073 | $34,171 |
| Median Family Income | 2,025 | $68,614 |
| Mean Family Income | 2,025 | $87,611 |
| Median Household Income | 3,969 | $48,015 |
| Mean Household Income | 3,969 | $67,324 |
| Income Deficit | 2,025 | $0 |
| Wage / Income Gap (%) | 8,073 | 42.81% |
| Wage / Income Gap ($) | 8,073 | 57.19¢ per $1 |
| Gini / Inequality Index | 8,073 | 0.48 |
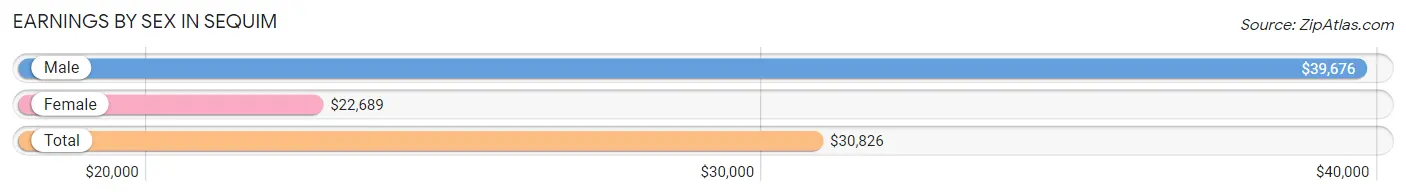
Earnings by Sex in Sequim
Average Earnings in Sequim are $30,826, $39,676 for men and $22,689 for women, a difference of 42.8%.
| Sex | Number | Average Earnings |
| Male | 1,420 (49.2%) | $39,676 |
| Female | 1,463 (50.7%) | $22,689 |
| Total | 2,883 (100.0%) | $30,826 |
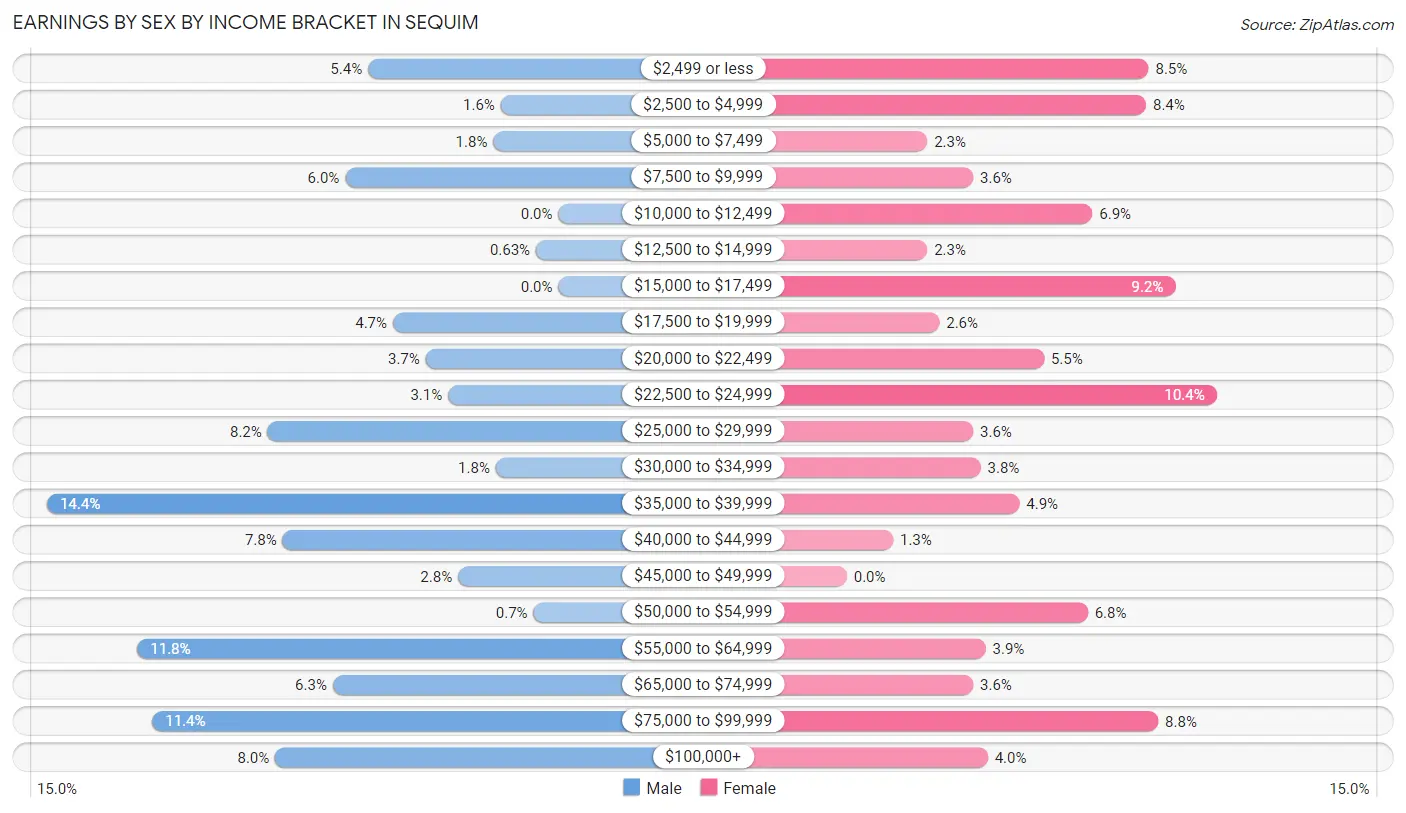
Earnings by Sex by Income Bracket in Sequim
The most common earnings brackets in Sequim are $35,000 to $39,999 for men (204 | 14.4%) and $22,500 to $24,999 for women (152 | 10.4%).
| Income | Male | Female |
| $2,499 or less | 76 (5.3%) | 124 (8.5%) |
| $2,500 to $4,999 | 23 (1.6%) | 123 (8.4%) |
| $5,000 to $7,499 | 26 (1.8%) | 33 (2.3%) |
| $7,500 to $9,999 | 85 (6.0%) | 52 (3.5%) |
| $10,000 to $12,499 | 0 (0.0%) | 101 (6.9%) |
| $12,500 to $14,999 | 9 (0.6%) | 33 (2.3%) |
| $15,000 to $17,499 | 0 (0.0%) | 135 (9.2%) |
| $17,500 to $19,999 | 66 (4.6%) | 38 (2.6%) |
| $20,000 to $22,499 | 53 (3.7%) | 81 (5.5%) |
| $22,500 to $24,999 | 44 (3.1%) | 152 (10.4%) |
| $25,000 to $29,999 | 116 (8.2%) | 52 (3.5%) |
| $30,000 to $34,999 | 25 (1.8%) | 55 (3.8%) |
| $35,000 to $39,999 | 204 (14.4%) | 71 (4.9%) |
| $40,000 to $44,999 | 110 (7.7%) | 19 (1.3%) |
| $45,000 to $49,999 | 40 (2.8%) | 0 (0.0%) |
| $50,000 to $54,999 | 10 (0.7%) | 99 (6.8%) |
| $55,000 to $64,999 | 168 (11.8%) | 57 (3.9%) |
| $65,000 to $74,999 | 90 (6.3%) | 52 (3.5%) |
| $75,000 to $99,999 | 162 (11.4%) | 128 (8.7%) |
| $100,000+ | 113 (8.0%) | 58 (4.0%) |
| Total | 1,420 (100.0%) | 1,463 (100.0%) |
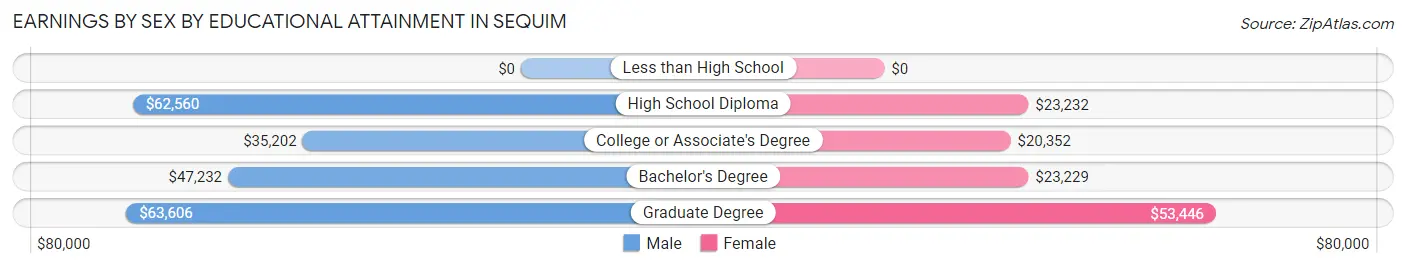
Earnings by Sex by Educational Attainment in Sequim
Average earnings in Sequim are $41,988 for men and $23,421 for women, a difference of 44.2%. Men with an educational attainment of graduate degree enjoy the highest average annual earnings of $63,606, while those with college or associate's degree education earn the least with $35,202. Women with an educational attainment of graduate degree earn the most with the average annual earnings of $53,446, while those with college or associate's degree education have the smallest earnings of $20,352.
| Educational Attainment | Male Income | Female Income |
| Less than High School | - | - |
| High School Diploma | $62,560 | $23,232 |
| College or Associate's Degree | $35,202 | $20,352 |
| Bachelor's Degree | $47,232 | $23,229 |
| Graduate Degree | $63,606 | $53,446 |
| Total | $41,988 | $23,421 |
Family Income in Sequim
Family Income Brackets in Sequim
According to the Sequim family income data, there are 371 families falling into the $50,000 to $74,999 income range, which is the most common income bracket and makes up 18.3% of all families. Conversely, the $10,000 to $14,999 income bracket is the least frequent group with only 22 families (1.1%) belonging to this category.
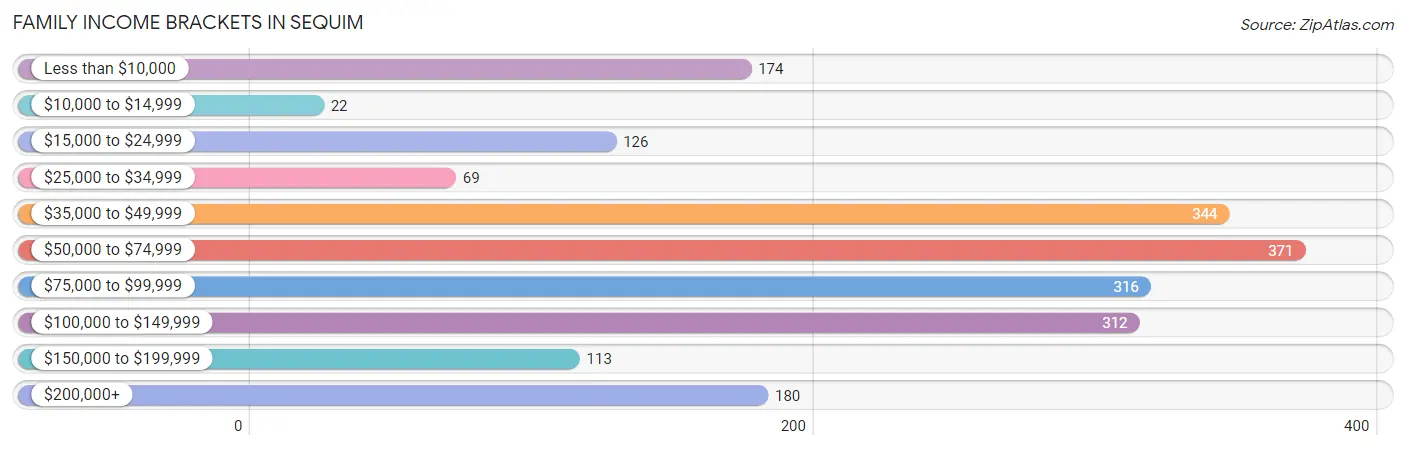
| Income Bracket | # Families | % Families |
| Less than $10,000 | 174 | 8.6% |
| $10,000 to $14,999 | 22 | 1.1% |
| $15,000 to $24,999 | 126 | 6.2% |
| $25,000 to $34,999 | 69 | 3.4% |
| $35,000 to $49,999 | 344 | 17.0% |
| $50,000 to $74,999 | 371 | 18.3% |
| $75,000 to $99,999 | 316 | 15.6% |
| $100,000 to $149,999 | 312 | 15.4% |
| $150,000 to $199,999 | 113 | 5.6% |
| $200,000+ | 180 | 8.9% |
Family Income by Famaliy Size in Sequim
3-person families (321 | 15.9%) account for the highest median family income in Sequim with $84,830 per family, while 2-person families (1,369 | 67.6%) have the highest median income of $29,068 per family member.
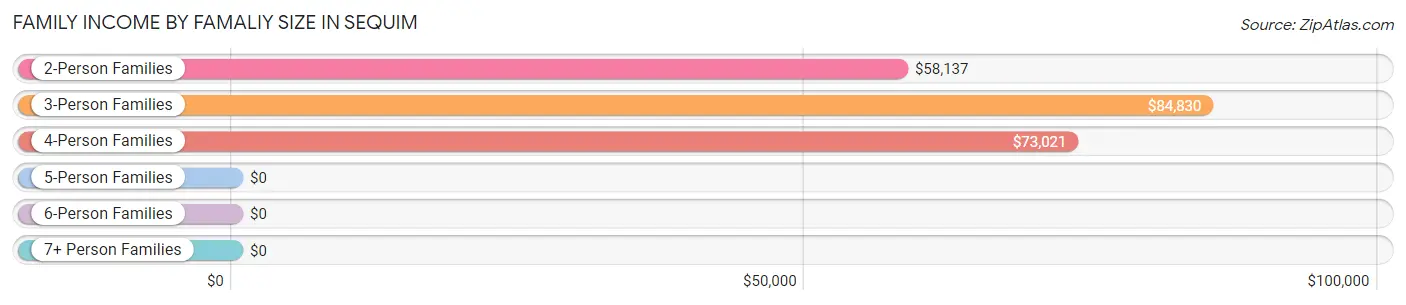
| Income Bracket | # Families | Median Income |
| 2-Person Families | 1,369 (67.6%) | $58,137 |
| 3-Person Families | 321 (15.9%) | $84,830 |
| 4-Person Families | 233 (11.5%) | $73,021 |
| 5-Person Families | 80 (4.0%) | $0 |
| 6-Person Families | 8 (0.4%) | $0 |
| 7+ Person Families | 14 (0.7%) | $0 |
| Total | 2,025 (100.0%) | $68,614 |
Family Income by Number of Earners in Sequim
The median family income in Sequim is $68,614, with families comprising 3+ earners (75) having the highest median family income of $128,393, while families with 1 earner (625) have the lowest median family income of $46,339, accounting for 3.7% and 30.9% of families, respectively.
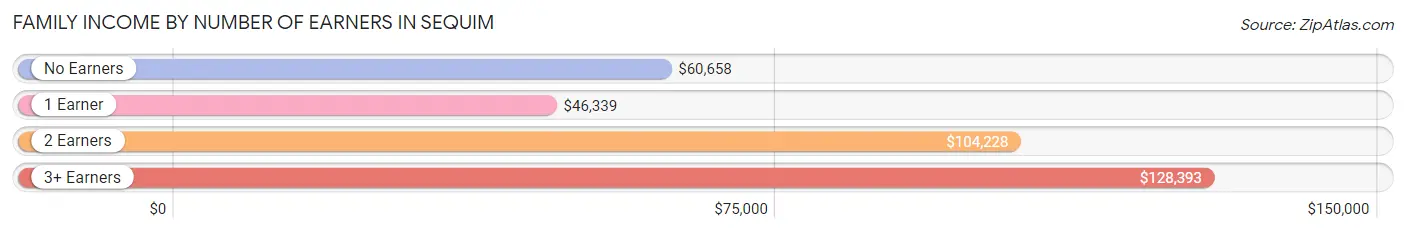
| Number of Earners | # Families | Median Income |
| No Earners | 818 (40.4%) | $60,658 |
| 1 Earner | 625 (30.9%) | $46,339 |
| 2 Earners | 507 (25.0%) | $104,228 |
| 3+ Earners | 75 (3.7%) | $128,393 |
| Total | 2,025 (100.0%) | $68,614 |
Household Income in Sequim
Household Income Brackets in Sequim
With 655 households falling in the category, the $35,000 to $49,999 income range is the most frequent in Sequim, accounting for 16.5% of all households. In contrast, only 111 households (2.8%) fall into the $150,000 to $199,999 income bracket, making it the least populous group.
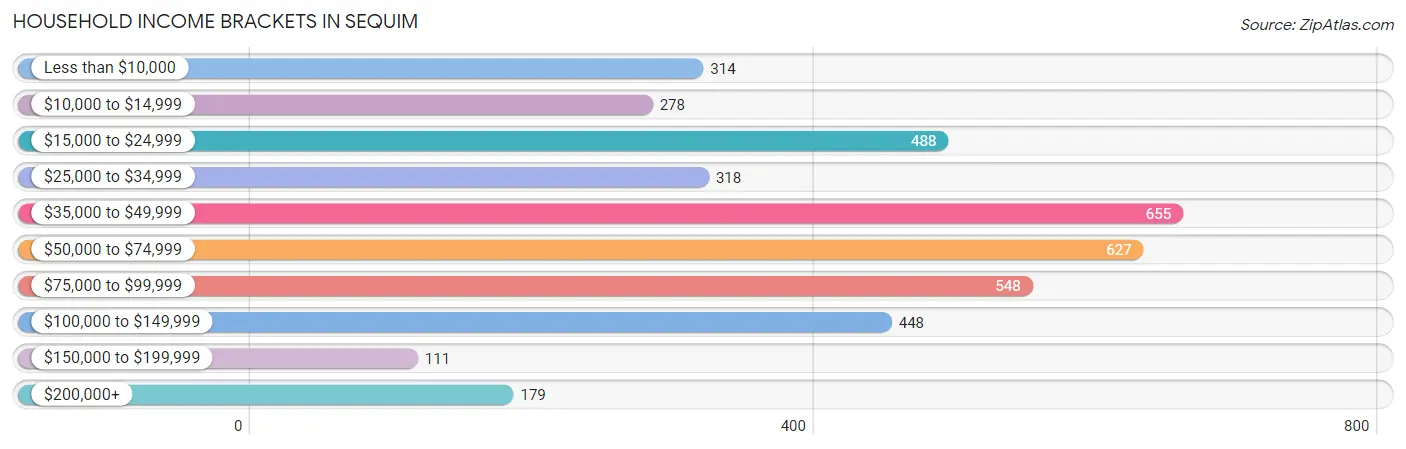
| Income Bracket | # Households | % Households |
| Less than $10,000 | 314 | 7.9% |
| $10,000 to $14,999 | 278 | 7.0% |
| $15,000 to $24,999 | 488 | 12.3% |
| $25,000 to $34,999 | 318 | 8.0% |
| $35,000 to $49,999 | 655 | 16.5% |
| $50,000 to $74,999 | 627 | 15.8% |
| $75,000 to $99,999 | 548 | 13.8% |
| $100,000 to $149,999 | 448 | 11.3% |
| $150,000 to $199,999 | 111 | 2.8% |
| $200,000+ | 179 | 4.5% |
Household Income by Householder Age in Sequim
The median household income in Sequim is $48,015, with the highest median household income of $49,836 found in the 65+ years age bracket for the primary householder. A total of 1,928 households (48.6%) fall into this category. Meanwhile, the 15 to 24 years age bracket for the primary householder has the lowest median household income of $21,594, with 116 households (2.9%) in this group.
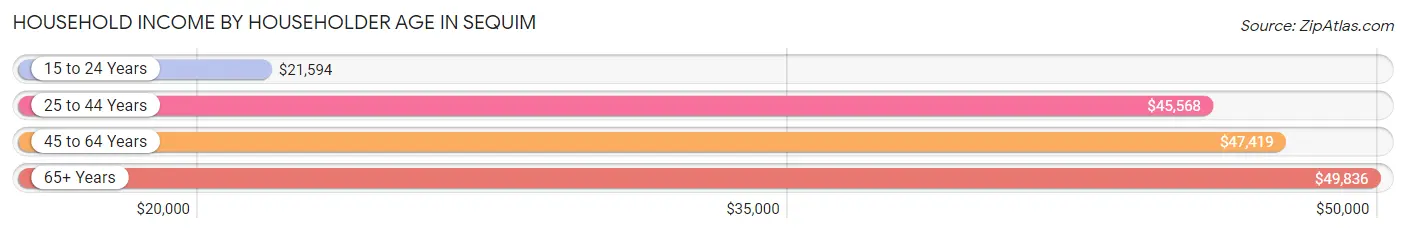
| Income Bracket | # Households | Median Income |
| 15 to 24 Years | 116 (2.9%) | $21,594 |
| 25 to 44 Years | 803 (20.2%) | $45,568 |
| 45 to 64 Years | 1,122 (28.3%) | $47,419 |
| 65+ Years | 1,928 (48.6%) | $49,836 |
| Total | 3,969 (100.0%) | $48,015 |
Poverty in Sequim
Income Below Poverty by Sex and Age in Sequim
With 13.4% poverty level for males and 17.2% for females among the residents of Sequim, 18 to 24 year old males and 5 year old females are the most vulnerable to poverty, with 126 males (43.3%) and 43 females (86.0%) in their respective age groups living below the poverty level.
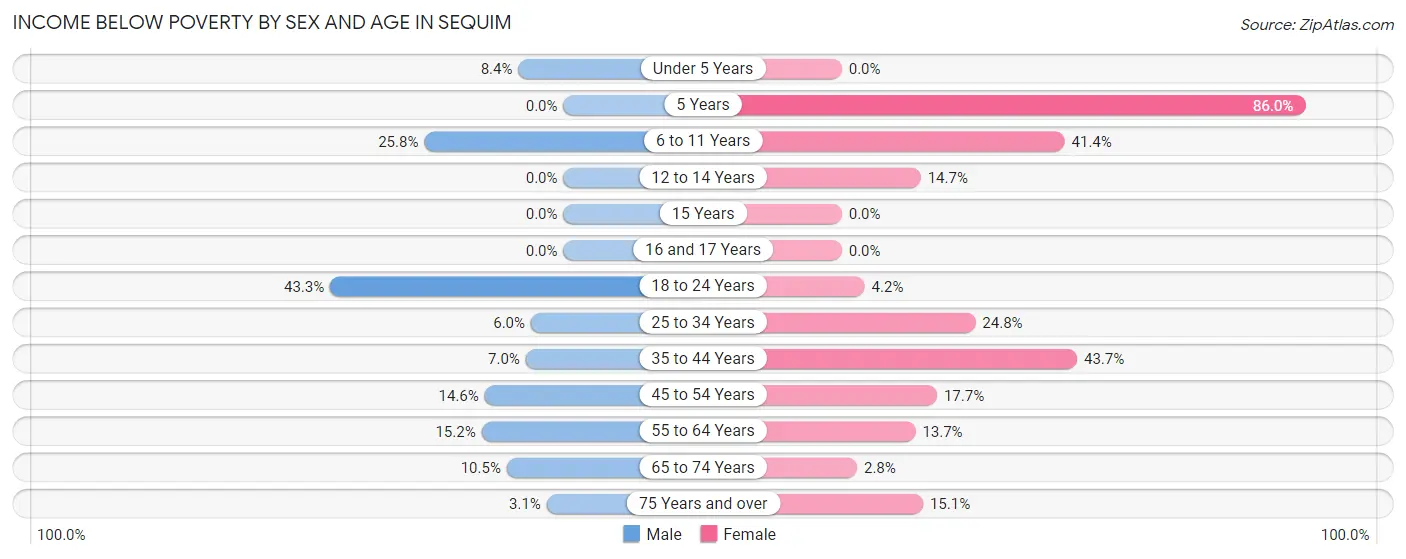
| Age Bracket | Male | Female |
| Under 5 Years | 21 (8.4%) | 0 (0.0%) |
| 5 Years | 0 (0.0%) | 43 (86.0%) |
| 6 to 11 Years | 94 (25.8%) | 79 (41.4%) |
| 12 to 14 Years | 0 (0.0%) | 29 (14.6%) |
| 15 Years | 0 (0.0%) | 0 (0.0%) |
| 16 and 17 Years | 0 (0.0%) | 0 (0.0%) |
| 18 to 24 Years | 126 (43.3%) | 7 (4.2%) |
| 25 to 34 Years | 17 (6.0%) | 124 (24.8%) |
| 35 to 44 Years | 18 (7.0%) | 145 (43.7%) |
| 45 to 54 Years | 44 (14.6%) | 47 (17.7%) |
| 55 to 64 Years | 97 (15.2%) | 83 (13.7%) |
| 65 to 74 Years | 54 (10.5%) | 23 (2.8%) |
| 75 Years and over | 19 (3.1%) | 124 (15.1%) |
| Total | 490 (13.4%) | 704 (17.2%) |
Income Above Poverty by Sex and Age in Sequim
According to the poverty statistics in Sequim, males aged 5 years and females aged under 5 years are the age groups that are most secure financially, with 100.0% of males and 100.0% of females in these age groups living above the poverty line.
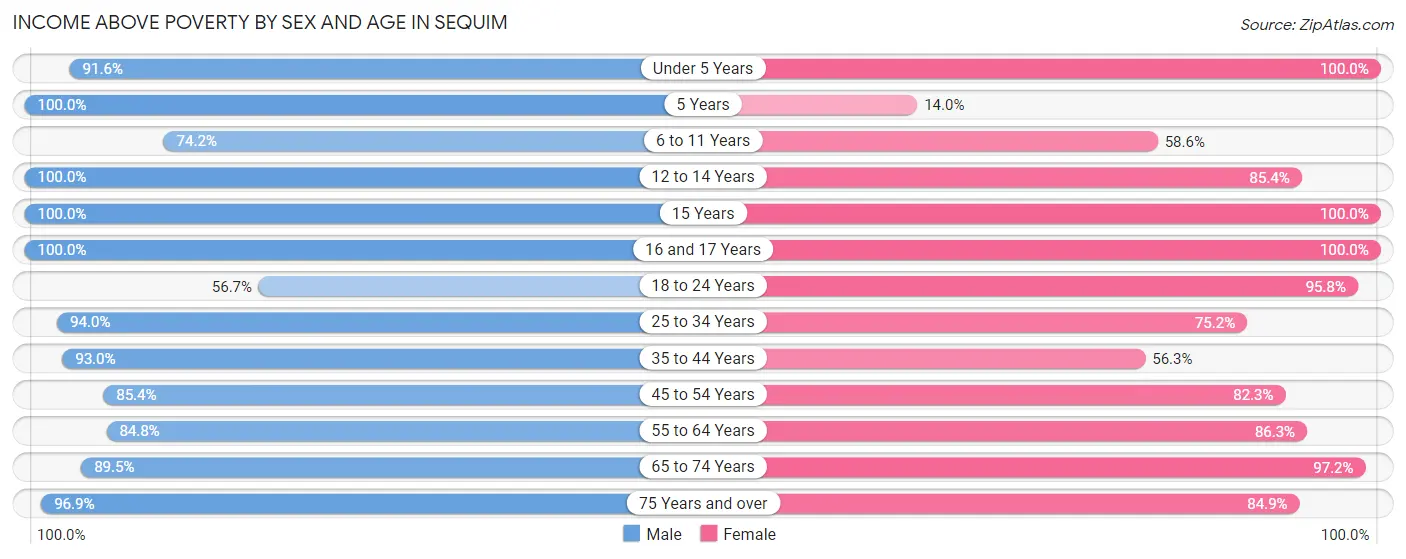
| Age Bracket | Male | Female |
| Under 5 Years | 230 (91.6%) | 50 (100.0%) |
| 5 Years | 13 (100.0%) | 7 (14.0%) |
| 6 to 11 Years | 270 (74.2%) | 112 (58.6%) |
| 12 to 14 Years | 87 (100.0%) | 169 (85.4%) |
| 15 Years | 6 (100.0%) | 86 (100.0%) |
| 16 and 17 Years | 37 (100.0%) | 4 (100.0%) |
| 18 to 24 Years | 165 (56.7%) | 158 (95.8%) |
| 25 to 34 Years | 265 (94.0%) | 376 (75.2%) |
| 35 to 44 Years | 239 (93.0%) | 187 (56.3%) |
| 45 to 54 Years | 257 (85.4%) | 219 (82.3%) |
| 55 to 64 Years | 541 (84.8%) | 524 (86.3%) |
| 65 to 74 Years | 460 (89.5%) | 789 (97.2%) |
| 75 Years and over | 596 (96.9%) | 699 (84.9%) |
| Total | 3,166 (86.6%) | 3,380 (82.8%) |
Income Below Poverty Among Married-Couple Families in Sequim
The poverty statistics for married-couple families in Sequim show that 5.2% or 74 of the total 1,423 families live below the poverty line. Families with no children have the highest poverty rate of 6.4%, comprising of 74 families. On the other hand, families with 1 or 2 children have the lowest poverty rate of 0.0%, which includes 0 families.
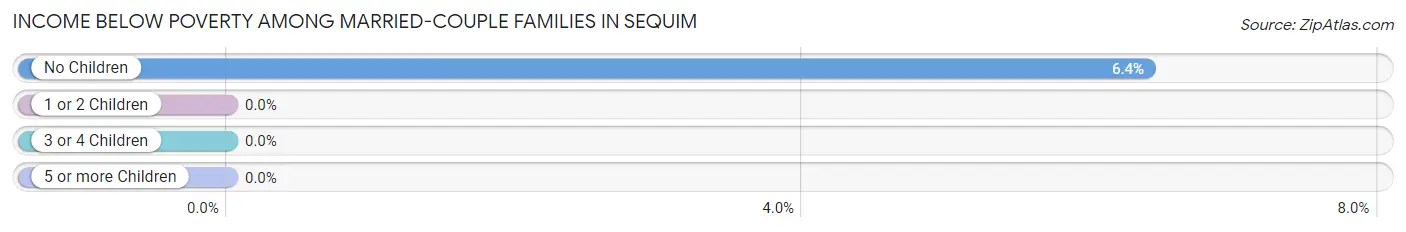
| Children | Above Poverty | Below Poverty |
| No Children | 1,084 (93.6%) | 74 (6.4%) |
| 1 or 2 Children | 243 (100.0%) | 0 (0.0%) |
| 3 or 4 Children | 8 (100.0%) | 0 (0.0%) |
| 5 or more Children | 14 (100.0%) | 0 (0.0%) |
| Total | 1,349 (94.8%) | 74 (5.2%) |
Income Below Poverty Among Single-Parent Households in Sequim
According to the poverty data in Sequim, 18.9% or 17 single-father households and 23.6% or 121 single-mother households are living below the poverty line. Among single-father households, those with no children have the highest poverty rate, with 17 households (21.8%) experiencing poverty. Likewise, among single-mother households, those with 3 or 4 children have the highest poverty rate, with 52 households (43.0%) falling below the poverty line.
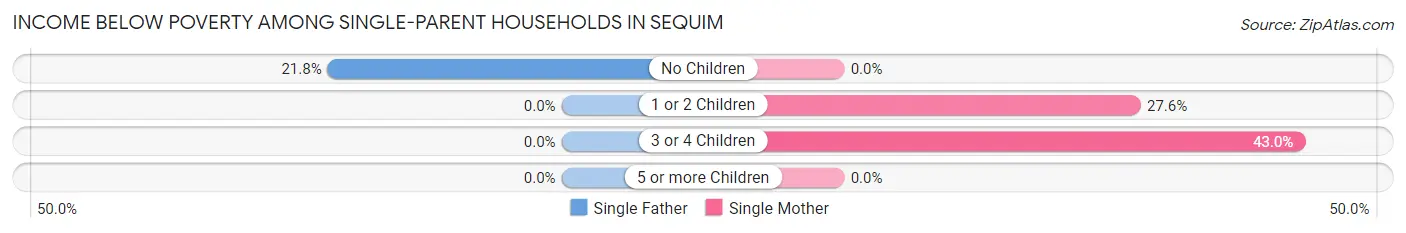
| Children | Single Father | Single Mother |
| No Children | 17 (21.8%) | 0 (0.0%) |
| 1 or 2 Children | 0 (0.0%) | 69 (27.6%) |
| 3 or 4 Children | 0 (0.0%) | 52 (43.0%) |
| 5 or more Children | 0 (0.0%) | 0 (0.0%) |
| Total | 17 (18.9%) | 121 (23.6%) |
Income Below Poverty Among Married-Couple vs Single-Parent Households in Sequim
The poverty data for Sequim shows that 74 of the married-couple family households (5.2%) and 138 of the single-parent households (22.9%) are living below the poverty level. Within the married-couple family households, those with no children have the highest poverty rate, with 74 households (6.4%) falling below the poverty line. Among the single-parent households, those with 3 or 4 children have the highest poverty rate, with 52 household (43.0%) living below poverty.
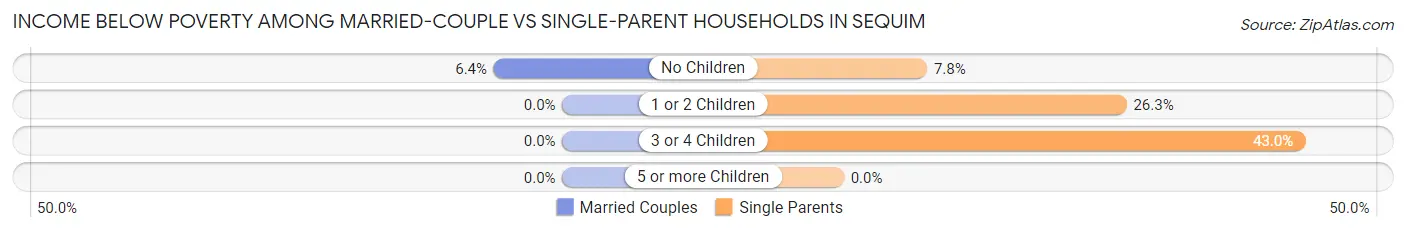
| Children | Married-Couple Families | Single-Parent Households |
| No Children | 74 (6.4%) | 17 (7.8%) |
| 1 or 2 Children | 0 (0.0%) | 69 (26.3%) |
| 3 or 4 Children | 0 (0.0%) | 52 (43.0%) |
| 5 or more Children | 0 (0.0%) | 0 (0.0%) |
| Total | 74 (5.2%) | 138 (22.9%) |
Race in Sequim
The most populous races in Sequim are White / Caucasian (6,962 | 86.2%), Hispanic or Latino (523 | 6.5%), and Two or more Races (455 | 5.6%).
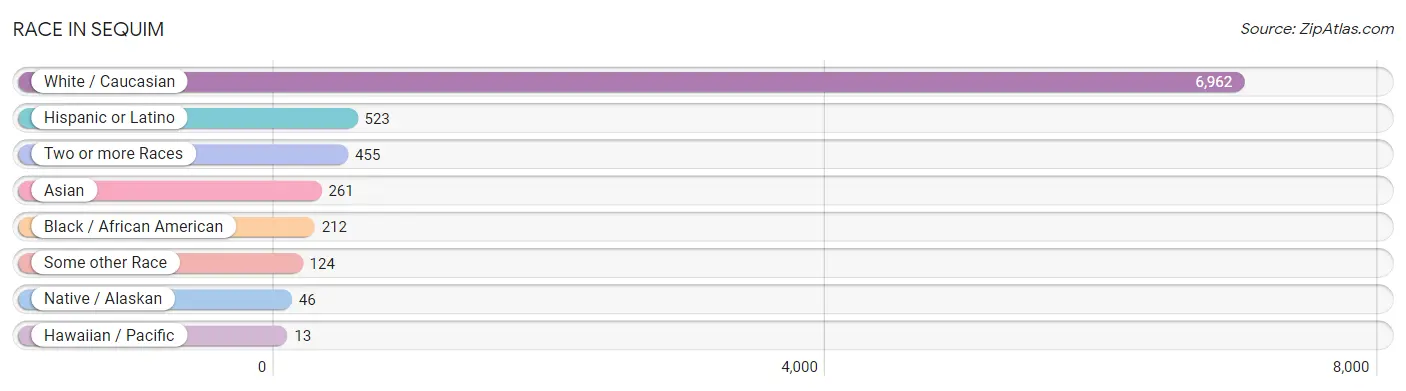
| Race | # Population | % Population |
| Asian | 261 | 3.2% |
| Black / African American | 212 | 2.6% |
| Hawaiian / Pacific | 13 | 0.2% |
| Hispanic or Latino | 523 | 6.5% |
| Native / Alaskan | 46 | 0.6% |
| White / Caucasian | 6,962 | 86.2% |
| Two or more Races | 455 | 5.6% |
| Some other Race | 124 | 1.5% |
| Total | 8,073 | 100.0% |
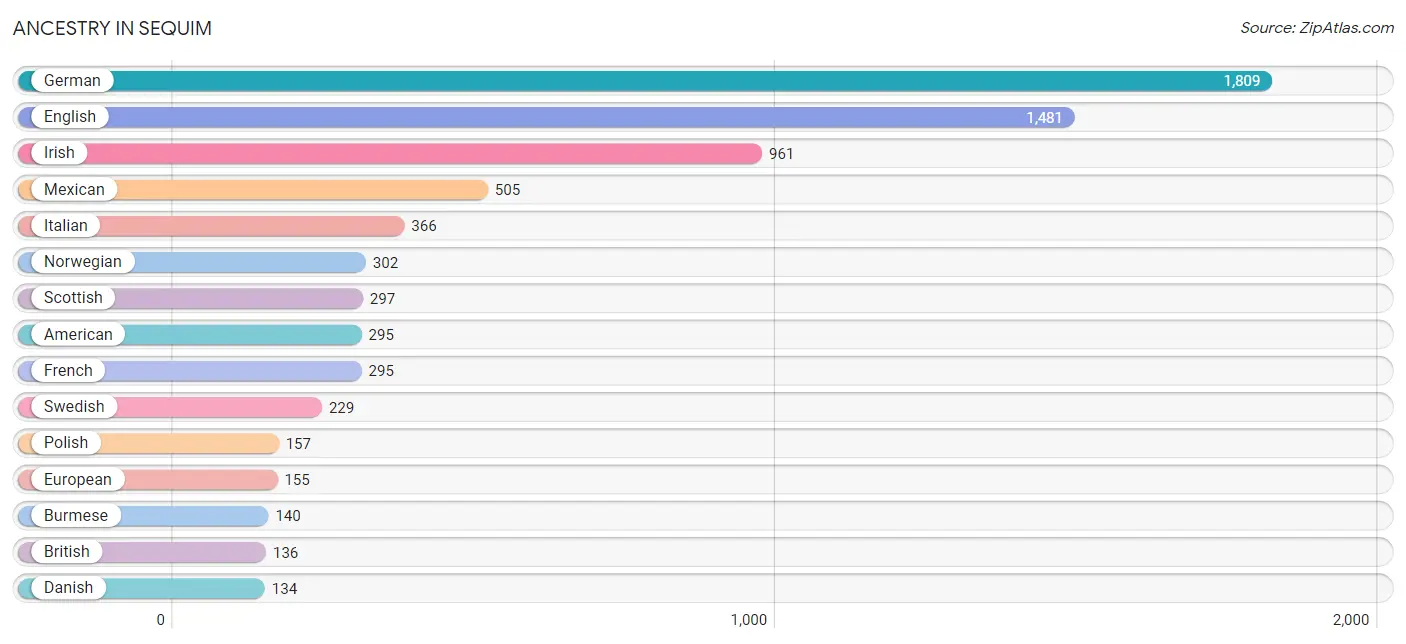
Ancestry in Sequim
The most populous ancestries reported in Sequim are German (1,809 | 22.4%), English (1,481 | 18.3%), Irish (961 | 11.9%), Mexican (505 | 6.3%), and Italian (366 | 4.5%), together accounting for 63.4% of all Sequim residents.
| Ancestry | # Population | % Population |
| Aleut | 10 | 0.1% |
| American | 295 | 3.6% |
| Austrian | 21 | 0.3% |
| Bahamian | 14 | 0.2% |
| Belgian | 7 | 0.1% |
| Bhutanese | 26 | 0.3% |
| Blackfeet | 11 | 0.1% |
| British | 136 | 1.7% |
| Burmese | 140 | 1.7% |
| Canadian | 24 | 0.3% |
| Carpatho Rusyn | 16 | 0.2% |
| Celtic | 7 | 0.1% |
| Cherokee | 67 | 0.8% |
| Cheyenne | 17 | 0.2% |
| Chickasaw | 90 | 1.1% |
| Croatian | 7 | 0.1% |
| Czech | 18 | 0.2% |
| Danish | 134 | 1.7% |
| Dutch | 112 | 1.4% |
| Eastern European | 19 | 0.2% |
| English | 1,481 | 18.3% |
| European | 155 | 1.9% |
| Finnish | 19 | 0.2% |
| French | 295 | 3.6% |
| French American Indian | 96 | 1.2% |
| German | 1,809 | 22.4% |
| Greek | 29 | 0.4% |
| Hungarian | 59 | 0.7% |
| Indian (Asian) | 51 | 0.6% |
| Irish | 961 | 11.9% |
| Italian | 366 | 4.5% |
| Japanese | 31 | 0.4% |
| Kiowa | 8 | 0.1% |
| Korean | 110 | 1.4% |
| Latvian | 10 | 0.1% |
| Mexican | 505 | 6.3% |
| Native Hawaiian | 13 | 0.2% |
| Northern European | 78 | 1.0% |
| Norwegian | 302 | 3.7% |
| Polish | 157 | 1.9% |
| Portuguese | 97 | 1.2% |
| Russian | 80 | 1.0% |
| Samoan | 13 | 0.2% |
| Scandinavian | 111 | 1.4% |
| Scotch-Irish | 106 | 1.3% |
| Scottish | 297 | 3.7% |
| Serbian | 10 | 0.1% |
| Slovene | 7 | 0.1% |
| South American | 18 | 0.2% |
| Swedish | 229 | 2.8% |
| Swiss | 62 | 0.8% |
| Thai | 51 | 0.6% |
| Ukrainian | 7 | 0.1% |
| Venezuelan | 18 | 0.2% |
| Welsh | 41 | 0.5% |
| Yugoslavian | 6 | 0.1% | View All 56 Rows |
Immigrants in Sequim
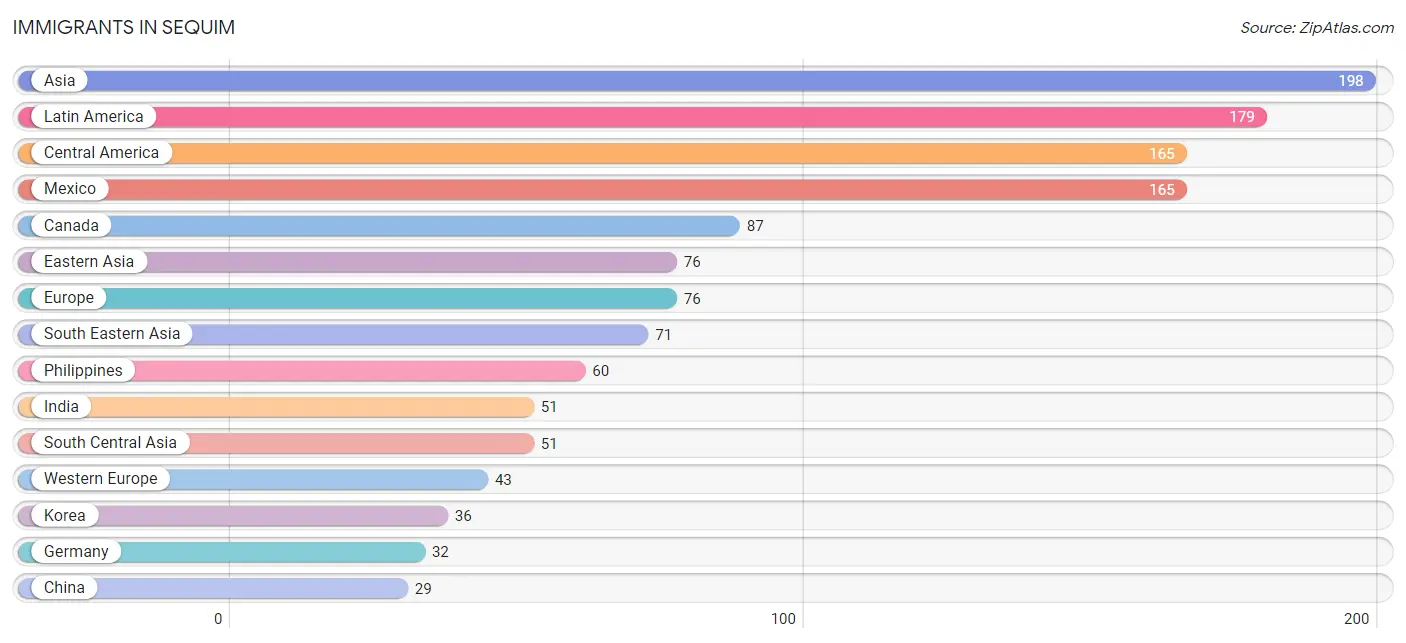
The most numerous immigrant groups reported in Sequim came from Asia (198 | 2.5%), Latin America (179 | 2.2%), Central America (165 | 2.0%), Mexico (165 | 2.0%), and Canada (87 | 1.1%), together accounting for 9.8% of all Sequim residents.
| Immigration Origin | # Population | % Population |
| Africa | 9 | 0.1% |
| Asia | 198 | 2.5% |
| Bahamas | 14 | 0.2% |
| Belgium | 11 | 0.1% |
| Canada | 87 | 1.1% |
| Caribbean | 14 | 0.2% |
| Central America | 165 | 2.0% |
| China | 29 | 0.4% |
| Eastern Asia | 76 | 0.9% |
| Eastern Europe | 25 | 0.3% |
| England | 8 | 0.1% |
| Europe | 76 | 0.9% |
| Germany | 32 | 0.4% |
| Hungary | 12 | 0.2% |
| India | 51 | 0.6% |
| Japan | 11 | 0.1% |
| Korea | 36 | 0.4% |
| Latin America | 179 | 2.2% |
| Malaysia | 11 | 0.1% |
| Mexico | 165 | 2.0% |
| Northern Europe | 8 | 0.1% |
| Oceania | 7 | 0.1% |
| Philippines | 60 | 0.7% |
| Poland | 13 | 0.2% |
| South Central Asia | 51 | 0.6% |
| South Eastern Asia | 71 | 0.9% |
| Taiwan | 29 | 0.4% |
| Western Europe | 43 | 0.5% | View All 28 Rows |
Sex and Age in Sequim
Sex and Age in Sequim
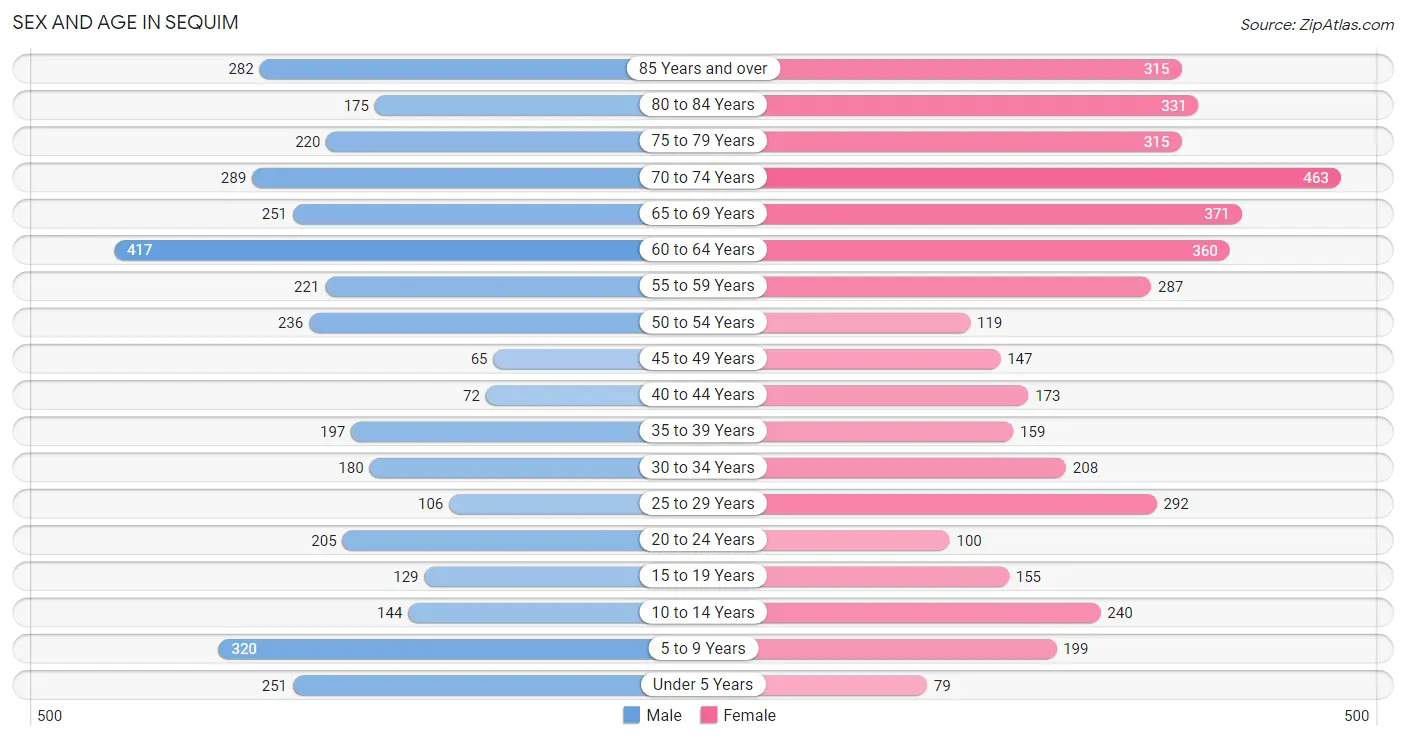
The most populous age groups in Sequim are 60 to 64 Years (417 | 11.1%) for men and 70 to 74 Years (463 | 10.7%) for women.
| Age Bracket | Male | Female |
| Under 5 Years | 251 (6.7%) | 79 (1.8%) |
| 5 to 9 Years | 320 (8.5%) | 199 (4.6%) |
| 10 to 14 Years | 144 (3.8%) | 240 (5.6%) |
| 15 to 19 Years | 129 (3.4%) | 155 (3.6%) |
| 20 to 24 Years | 205 (5.4%) | 100 (2.3%) |
| 25 to 29 Years | 106 (2.8%) | 292 (6.8%) |
| 30 to 34 Years | 180 (4.8%) | 208 (4.8%) |
| 35 to 39 Years | 197 (5.2%) | 159 (3.7%) |
| 40 to 44 Years | 72 (1.9%) | 173 (4.0%) |
| 45 to 49 Years | 65 (1.7%) | 147 (3.4%) |
| 50 to 54 Years | 236 (6.3%) | 119 (2.8%) |
| 55 to 59 Years | 221 (5.9%) | 287 (6.7%) |
| 60 to 64 Years | 417 (11.1%) | 360 (8.4%) |
| 65 to 69 Years | 251 (6.7%) | 371 (8.6%) |
| 70 to 74 Years | 289 (7.7%) | 463 (10.7%) |
| 75 to 79 Years | 220 (5.9%) | 315 (7.3%) |
| 80 to 84 Years | 175 (4.6%) | 331 (7.7%) |
| 85 Years and over | 282 (7.5%) | 315 (7.3%) |
| Total | 3,760 (100.0%) | 4,313 (100.0%) |
Families and Households in Sequim
Median Family Size in Sequim
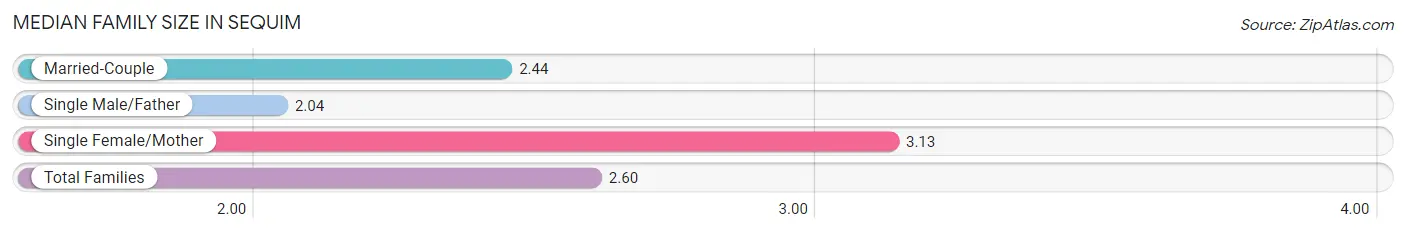
The median family size in Sequim is 2.60 persons per family, with single female/mother families (512 | 25.3%) accounting for the largest median family size of 3.13 persons per family. On the other hand, single male/father families (90 | 4.4%) represent the smallest median family size with 2.04 persons per family.
| Family Type | # Families | Family Size |
| Married-Couple | 1,423 (70.3%) | 2.44 |
| Single Male/Father | 90 (4.4%) | 2.04 |
| Single Female/Mother | 512 (25.3%) | 3.13 |
| Total Families | 2,025 (100.0%) | 2.60 |
Median Household Size in Sequim
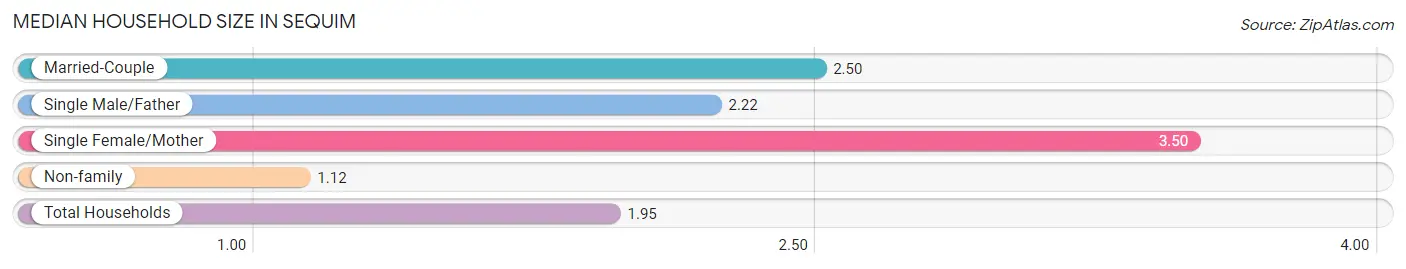
The median household size in Sequim is 1.95 persons per household, with single female/mother households (512 | 12.9%) accounting for the largest median household size of 3.5 persons per household. non-family households (1,944 | 49.0%) represent the smallest median household size with 1.12 persons per household.
| Household Type | # Households | Household Size |
| Married-Couple | 1,423 (35.8%) | 2.50 |
| Single Male/Father | 90 (2.3%) | 2.22 |
| Single Female/Mother | 512 (12.9%) | 3.50 |
| Non-family | 1,944 (49.0%) | 1.12 |
| Total Households | 3,969 (100.0%) | 1.95 |
Household Size by Marriage Status in Sequim
Out of a total of 3,969 households in Sequim, 2,025 (51.0%) are family households, while 1,944 (49.0%) are nonfamily households. The most numerous type of family households are 2-person households, comprising 1,216, and the most common type of nonfamily households are 1-person households, comprising 1,741.
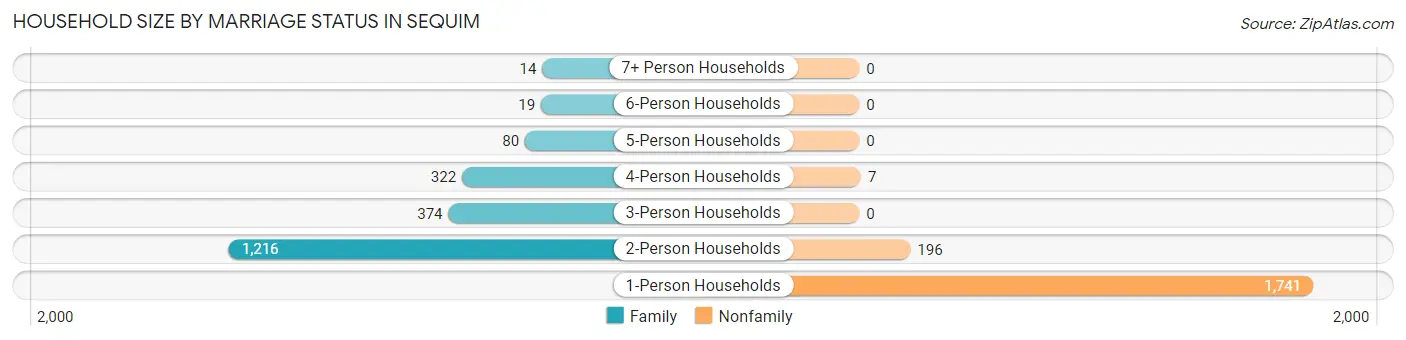
| Household Size | Family Households | Nonfamily Households |
| 1-Person Households | - | 1,741 (43.9%) |
| 2-Person Households | 1,216 (30.6%) | 196 (4.9%) |
| 3-Person Households | 374 (9.4%) | 0 (0.0%) |
| 4-Person Households | 322 (8.1%) | 7 (0.2%) |
| 5-Person Households | 80 (2.0%) | 0 (0.0%) |
| 6-Person Households | 19 (0.5%) | 0 (0.0%) |
| 7+ Person Households | 14 (0.4%) | 0 (0.0%) |
| Total | 2,025 (51.0%) | 1,944 (49.0%) |
Female Fertility in Sequim
Fertility by Age in Sequim
Average fertility rate in Sequim is 19.0 births per 1,000 women. Women in the age bracket of 20 to 34 years have the highest fertility rate with 42.0 births per 1,000 women. Women in the age bracket of 20 to 34 years acount for 100.0% of all women with births.
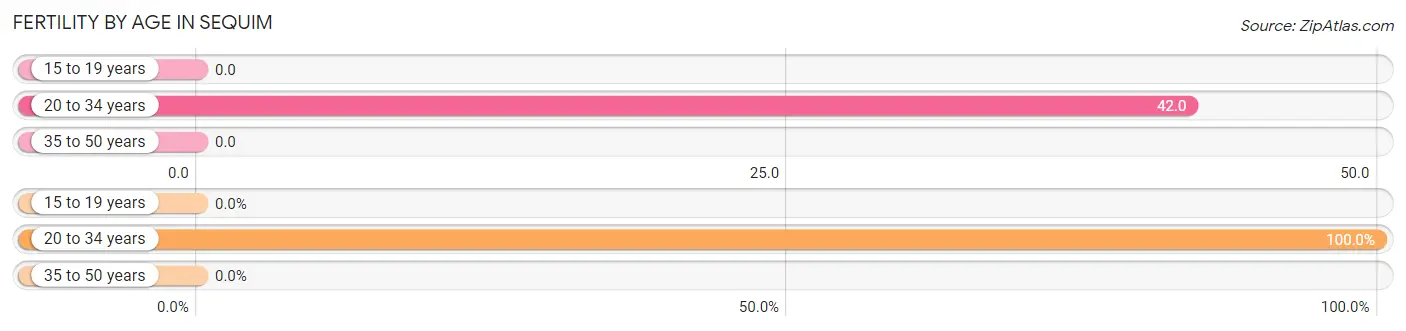
| Age Bracket | Women with Births | Births / 1,000 Women |
| 15 to 19 years | 0 (0.0%) | 0.0 |
| 20 to 34 years | 25 (100.0%) | 42.0 |
| 35 to 50 years | 0 (0.0%) | 0.0 |
| Total | 25 (100.0%) | 19.0 |
Fertility by Age by Marriage Status in Sequim
40.0% of women with births (25) in Sequim are married. The highest percentage of unmarried women with births falls into 20 to 34 years age bracket with 60.0% of them unmarried at the time of birth, while the lowest percentage of unmarried women with births belong to 20 to 34 years age bracket with 60.0% of them unmarried.
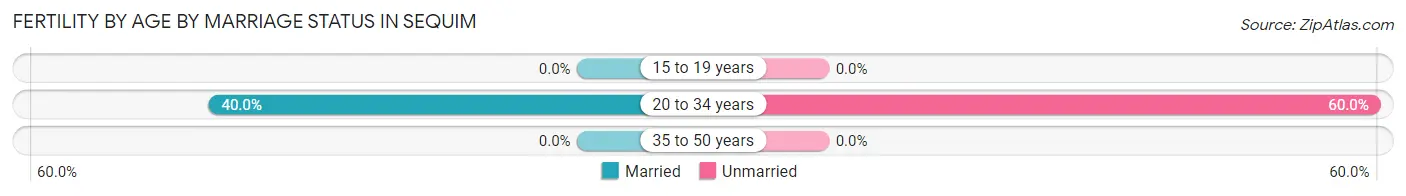
| Age Bracket | Married | Unmarried |
| 15 to 19 years | 0 (0.0%) | 0 (0.0%) |
| 20 to 34 years | 10 (40.0%) | 15 (60.0%) |
| 35 to 50 years | 0 (0.0%) | 0 (0.0%) |
| Total | 10 (40.0%) | 15 (60.0%) |
Fertility by Education in Sequim
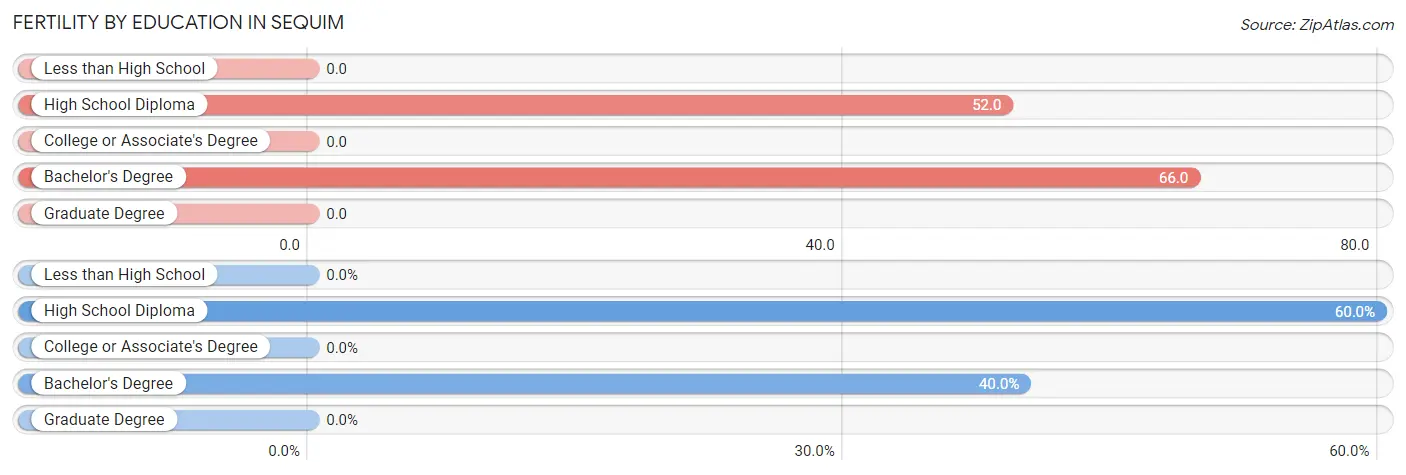
| Educational Attainment | Women with Births | Births / 1,000 Women |
| Less than High School | 0 (0.0%) | 0.0 |
| High School Diploma | 15 (60.0%) | 52.0 |
| College or Associate's Degree | 0 (0.0%) | 0.0 |
| Bachelor's Degree | 10 (40.0%) | 66.0 |
| Graduate Degree | 0 (0.0%) | 0.0 |
| Total | 25 (100.0%) | 19.0 |
Fertility by Education by Marriage Status in Sequim
60.0% of women with births in Sequim are unmarried. Women with the educational attainment of bachelor's degree are most likely to be married with 100.0% of them married at childbirth, while women with the educational attainment of high school diploma are least likely to be married with 100.0% of them unmarried at childbirth.
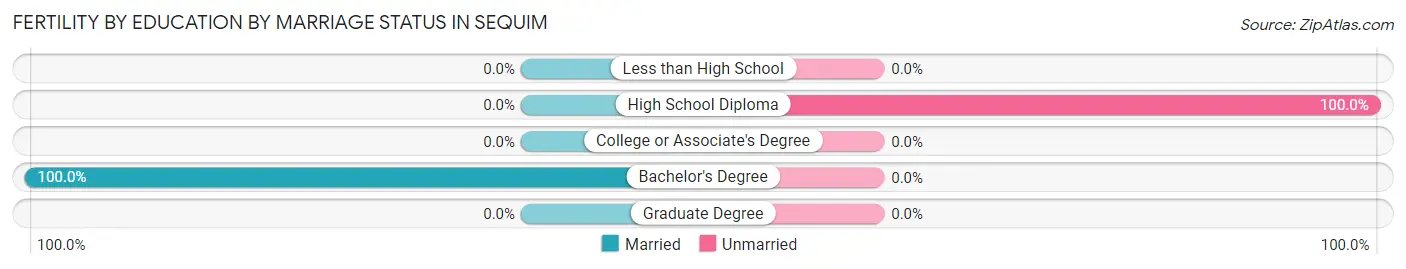
| Educational Attainment | Married | Unmarried |
| Less than High School | 0 (0.0%) | 0 (0.0%) |
| High School Diploma | 0 (0.0%) | 15 (100.0%) |
| College or Associate's Degree | 0 (0.0%) | 0 (0.0%) |
| Bachelor's Degree | 10 (100.0%) | 0 (0.0%) |
| Graduate Degree | 0 (0.0%) | 0 (0.0%) |
| Total | 10 (40.0%) | 15 (60.0%) |
Employment Characteristics in Sequim
Employment by Class of Employer in Sequim
Among the 2,590 employed individuals in Sequim, private company employees (1,519 | 58.7%), self-employed (not incorporated) (263 | 10.2%), and not-for-profit organizations (227 | 8.8%) make up the most common classes of employment.
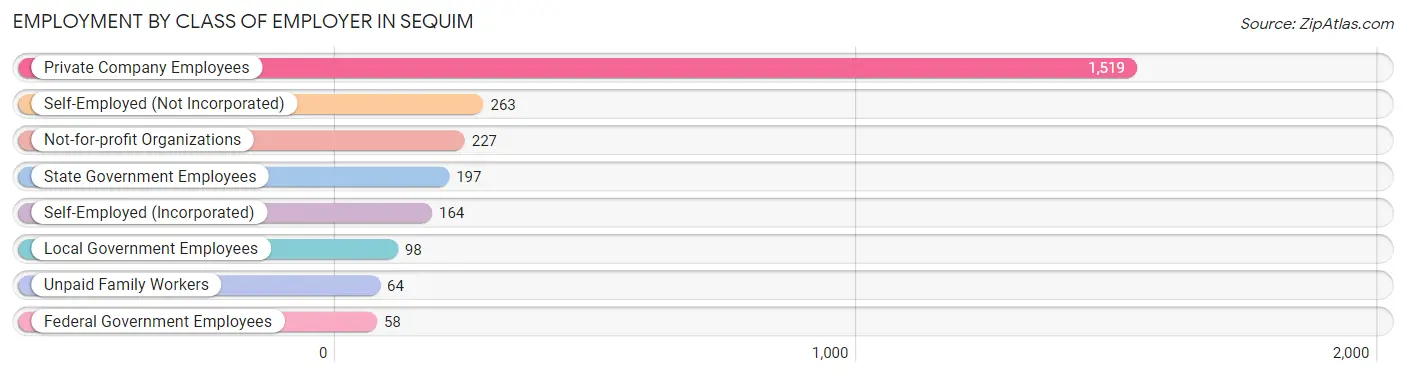
| Employer Class | # Employees | % Employees |
| Private Company Employees | 1,519 | 58.7% |
| Self-Employed (Incorporated) | 164 | 6.3% |
| Self-Employed (Not Incorporated) | 263 | 10.2% |
| Not-for-profit Organizations | 227 | 8.8% |
| Local Government Employees | 98 | 3.8% |
| State Government Employees | 197 | 7.6% |
| Federal Government Employees | 58 | 2.2% |
| Unpaid Family Workers | 64 | 2.5% |
| Total | 2,590 | 100.0% |
Employment Status by Age in Sequim
According to the labor force statistics for Sequim, out of the total population over 16 years of age (6,748), 42.0% or 2,834 individuals are in the labor force, with 5.9% or 167 of them unemployed. The age group with the highest labor force participation rate is 25 to 29 years, with 96.0% or 382 individuals in the labor force. Within the labor force, the 16 to 19 years age range has the highest percentage of unemployed individuals, with 41.4% or 41 of them being unemployed.
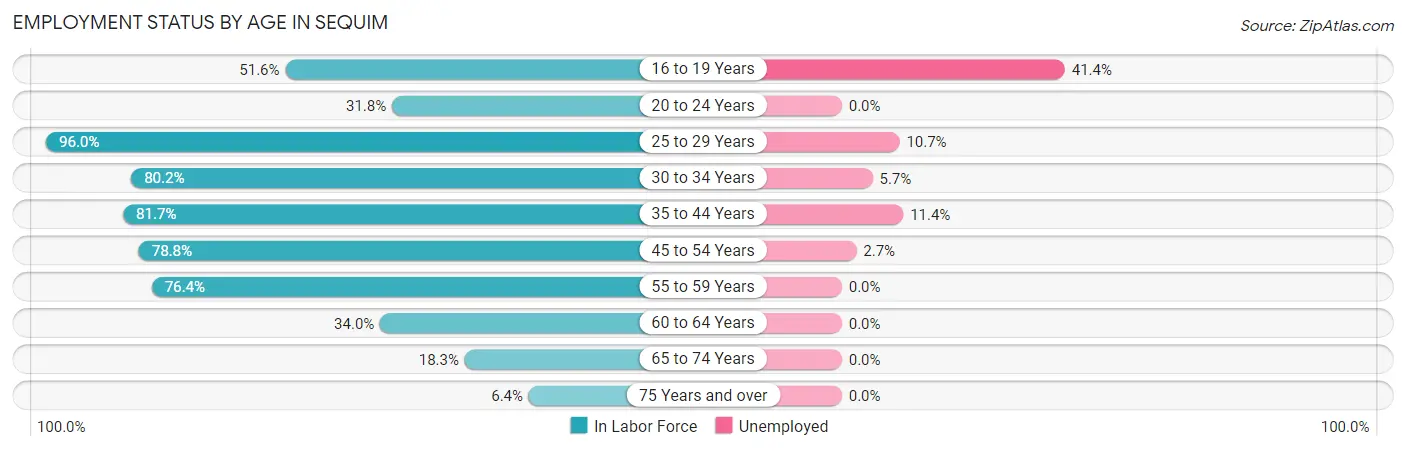
| Age Bracket | In Labor Force | Unemployed |
| 16 to 19 Years | 99 (51.6%) | 41 (41.4%) |
| 20 to 24 Years | 97 (31.8%) | 0 (0.0%) |
| 25 to 29 Years | 382 (96.0%) | 41 (10.7%) |
| 30 to 34 Years | 311 (80.2%) | 18 (5.7%) |
| 35 to 44 Years | 491 (81.7%) | 56 (11.4%) |
| 45 to 54 Years | 447 (78.8%) | 12 (2.7%) |
| 55 to 59 Years | 388 (76.4%) | 0 (0.0%) |
| 60 to 64 Years | 264 (34.0%) | 0 (0.0%) |
| 65 to 74 Years | 251 (18.3%) | 0 (0.0%) |
| 75 Years and over | 105 (6.4%) | 0 (0.0%) |
| Total | 2,834 (42.0%) | 167 (5.9%) |
Employment Status by Educational Attainment in Sequim
According to labor force statistics for Sequim, 70.5% of individuals (2,283) out of the total population between 25 and 64 years of age (3,239) are in the labor force, with 5.6% or 128 of them being unemployed. The group with the highest labor force participation rate are those with the educational attainment of bachelor's degree or higher, with 77.7% or 883 individuals in the labor force. Within the labor force, individuals with less than high school education have the highest percentage of unemployment, with 34.2% or 41 of them being unemployed.
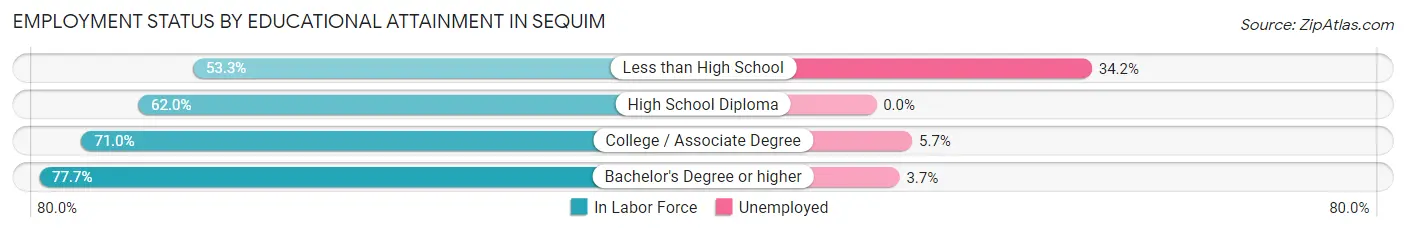
| Educational Attainment | In Labor Force | Unemployed |
| Less than High School | 120 (53.3%) | 77 (34.2%) |
| High School Diploma | 359 (62.0%) | 0 (0.0%) |
| College / Associate Degree | 922 (71.0%) | 74 (5.7%) |
| Bachelor's Degree or higher | 883 (77.7%) | 42 (3.7%) |
| Total | 2,283 (70.5%) | 181 (5.6%) |
Employment Occupations by Sex in Sequim
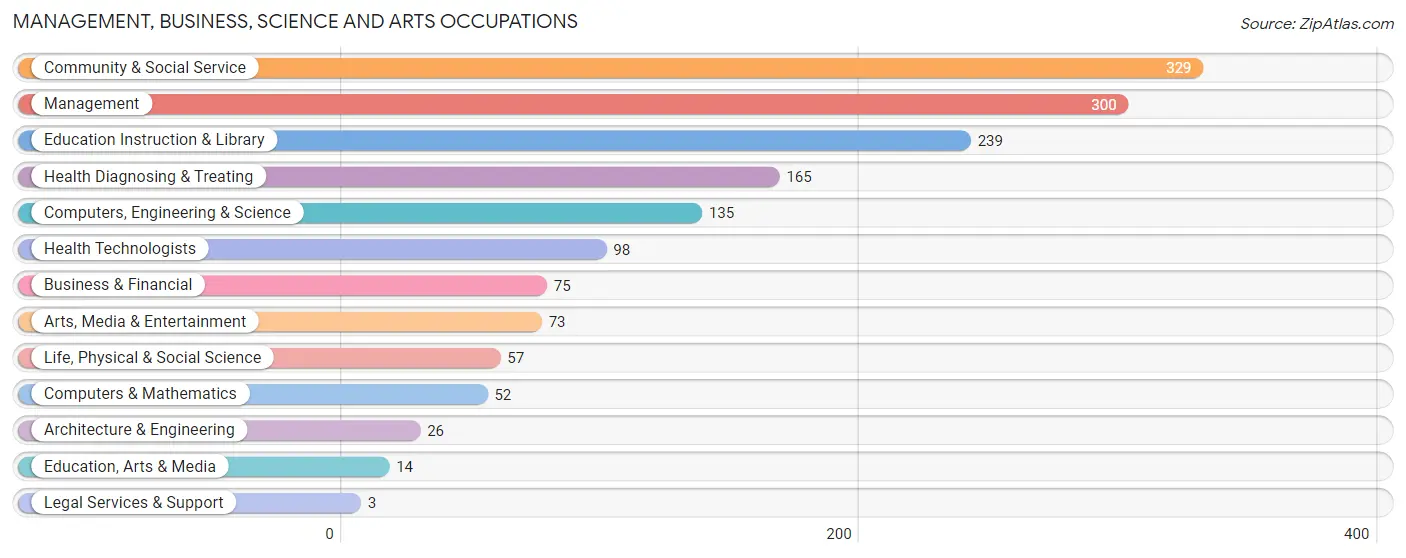
Management, Business, Science and Arts Occupations
The most common Management, Business, Science and Arts occupations in Sequim are Community & Social Service (329 | 12.4%), Management (300 | 11.3%), Education Instruction & Library (239 | 9.0%), Health Diagnosing & Treating (165 | 6.2%), and Computers, Engineering & Science (135 | 5.1%).
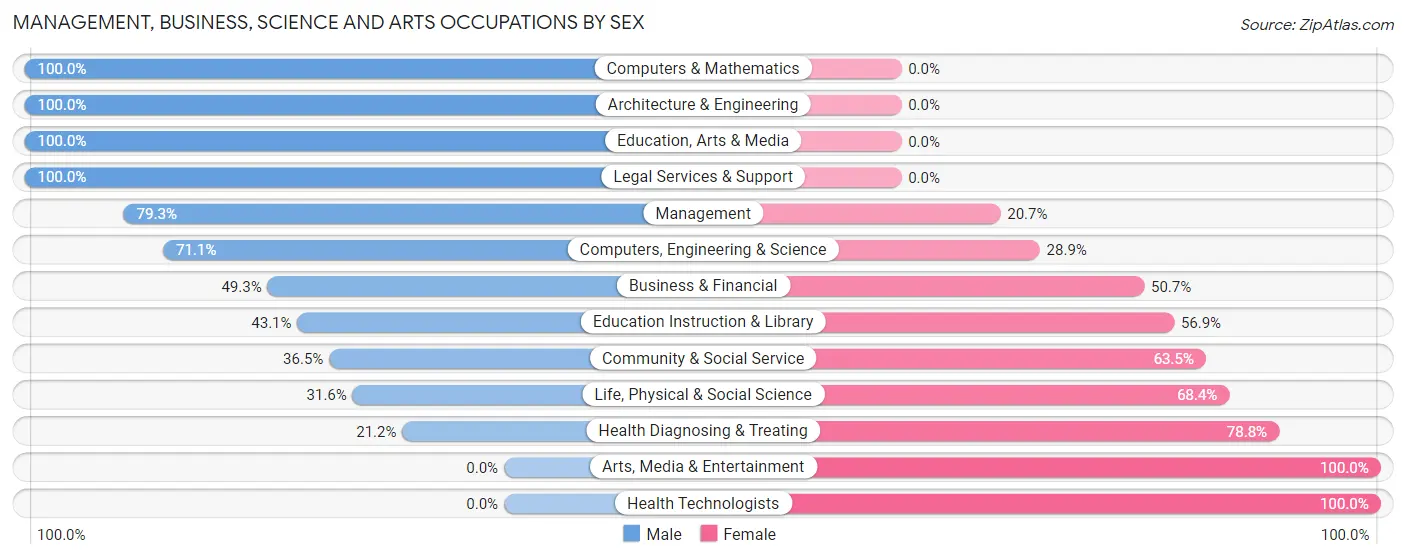
Management, Business, Science and Arts Occupations by Sex
Within the Management, Business, Science and Arts occupations in Sequim, the most male-oriented occupations are Computers & Mathematics (100.0%), Architecture & Engineering (100.0%), and Education, Arts & Media (100.0%), while the most female-oriented occupations are Arts, Media & Entertainment (100.0%), Health Technologists (100.0%), and Health Diagnosing & Treating (78.8%).
| Occupation | Male | Female |
| Management | 238 (79.3%) | 62 (20.7%) |
| Business & Financial | 37 (49.3%) | 38 (50.7%) |
| Computers, Engineering & Science | 96 (71.1%) | 39 (28.9%) |
| Computers & Mathematics | 52 (100.0%) | 0 (0.0%) |
| Architecture & Engineering | 26 (100.0%) | 0 (0.0%) |
| Life, Physical & Social Science | 18 (31.6%) | 39 (68.4%) |
| Community & Social Service | 120 (36.5%) | 209 (63.5%) |
| Education, Arts & Media | 14 (100.0%) | 0 (0.0%) |
| Legal Services & Support | 3 (100.0%) | 0 (0.0%) |
| Education Instruction & Library | 103 (43.1%) | 136 (56.9%) |
| Arts, Media & Entertainment | 0 (0.0%) | 73 (100.0%) |
| Health Diagnosing & Treating | 35 (21.2%) | 130 (78.8%) |
| Health Technologists | 0 (0.0%) | 98 (100.0%) |
| Total (Category) | 526 (52.4%) | 478 (47.6%) |
| Total (Overall) | 1,336 (50.3%) | 1,319 (49.7%) |
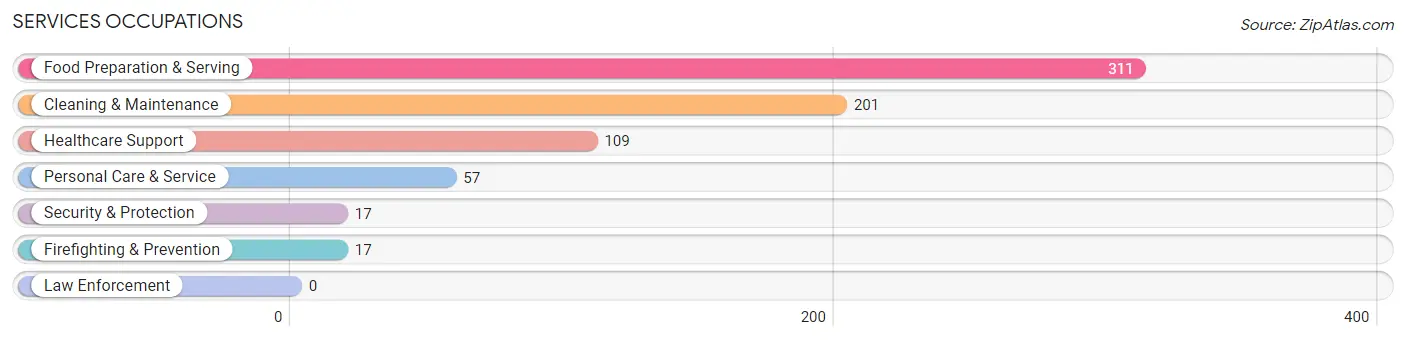
Services Occupations
The most common Services occupations in Sequim are Food Preparation & Serving (311 | 11.7%), Cleaning & Maintenance (201 | 7.6%), Healthcare Support (109 | 4.1%), Personal Care & Service (57 | 2.1%), and Security & Protection (17 | 0.6%).
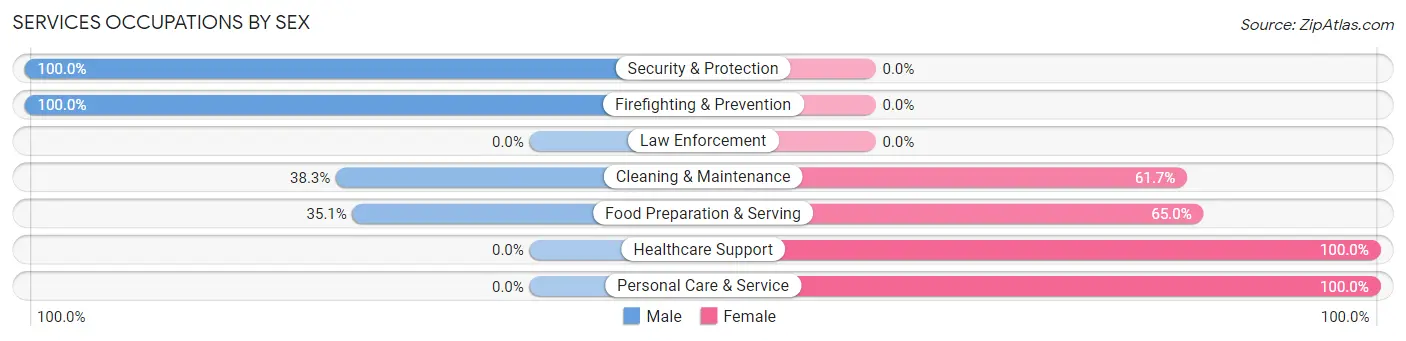
Services Occupations by Sex
Within the Services occupations in Sequim, the most male-oriented occupations are Security & Protection (100.0%), Firefighting & Prevention (100.0%), and Cleaning & Maintenance (38.3%), while the most female-oriented occupations are Healthcare Support (100.0%), Personal Care & Service (100.0%), and Food Preparation & Serving (64.9%).
| Occupation | Male | Female |
| Healthcare Support | 0 (0.0%) | 109 (100.0%) |
| Security & Protection | 17 (100.0%) | 0 (0.0%) |
| Firefighting & Prevention | 17 (100.0%) | 0 (0.0%) |
| Law Enforcement | 0 (0.0%) | 0 (0.0%) |
| Food Preparation & Serving | 109 (35.0%) | 202 (64.9%) |
| Cleaning & Maintenance | 77 (38.3%) | 124 (61.7%) |
| Personal Care & Service | 0 (0.0%) | 57 (100.0%) |
| Total (Category) | 203 (29.2%) | 492 (70.8%) |
| Total (Overall) | 1,336 (50.3%) | 1,319 (49.7%) |
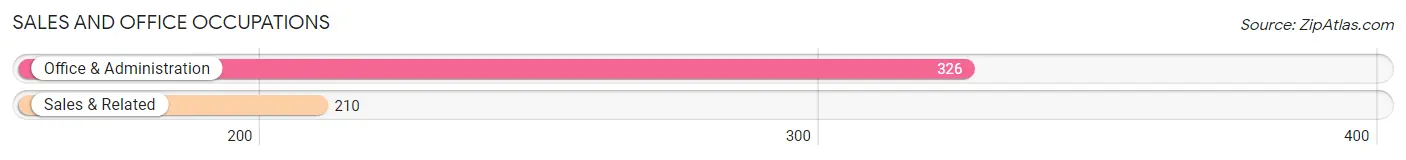
Sales and Office Occupations
The most common Sales and Office occupations in Sequim are Office & Administration (326 | 12.3%), and Sales & Related (210 | 7.9%).
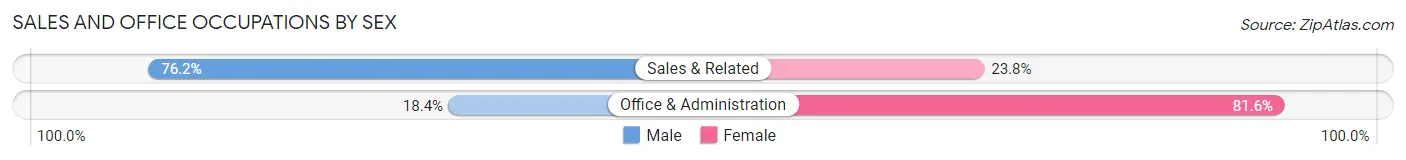
Sales and Office Occupations by Sex
| Occupation | Male | Female |
| Sales & Related | 160 (76.2%) | 50 (23.8%) |
| Office & Administration | 60 (18.4%) | 266 (81.6%) |
| Total (Category) | 220 (41.0%) | 316 (59.0%) |
| Total (Overall) | 1,336 (50.3%) | 1,319 (49.7%) |
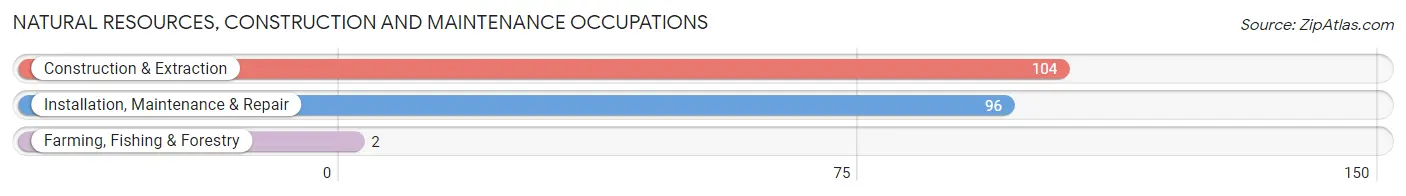
Natural Resources, Construction and Maintenance Occupations
The most common Natural Resources, Construction and Maintenance occupations in Sequim are Construction & Extraction (104 | 3.9%), Installation, Maintenance & Repair (96 | 3.6%), and Farming, Fishing & Forestry (2 | 0.1%).
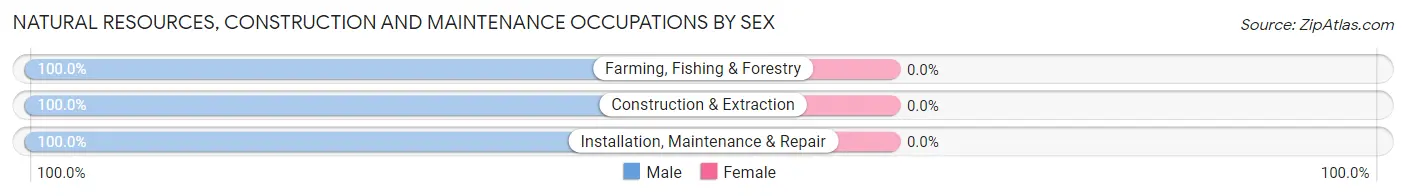
Natural Resources, Construction and Maintenance Occupations by Sex
| Occupation | Male | Female |
| Farming, Fishing & Forestry | 2 (100.0%) | 0 (0.0%) |
| Construction & Extraction | 104 (100.0%) | 0 (0.0%) |
| Installation, Maintenance & Repair | 96 (100.0%) | 0 (0.0%) |
| Total (Category) | 202 (100.0%) | 0 (0.0%) |
| Total (Overall) | 1,336 (50.3%) | 1,319 (49.7%) |
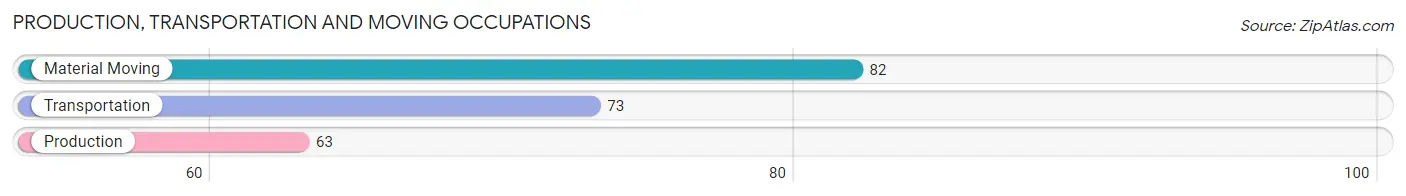
Production, Transportation and Moving Occupations
The most common Production, Transportation and Moving occupations in Sequim are Material Moving (82 | 3.1%), Transportation (73 | 2.8%), and Production (63 | 2.4%).
Production, Transportation and Moving Occupations by Sex
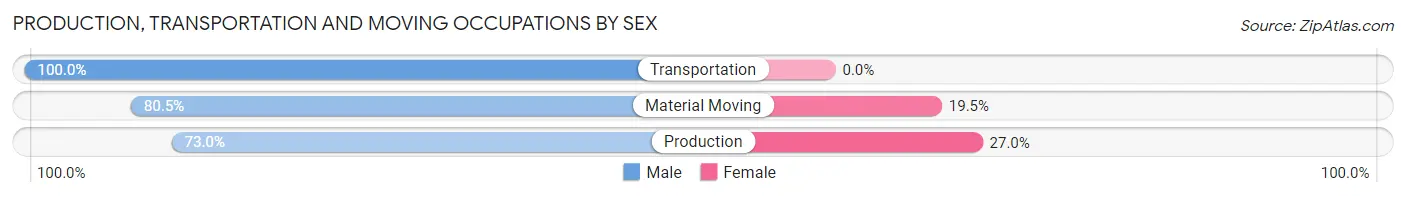
| Occupation | Male | Female |
| Production | 46 (73.0%) | 17 (27.0%) |
| Transportation | 73 (100.0%) | 0 (0.0%) |
| Material Moving | 66 (80.5%) | 16 (19.5%) |
| Total (Category) | 185 (84.9%) | 33 (15.1%) |
| Total (Overall) | 1,336 (50.3%) | 1,319 (49.7%) |
Employment Industries by Sex in Sequim
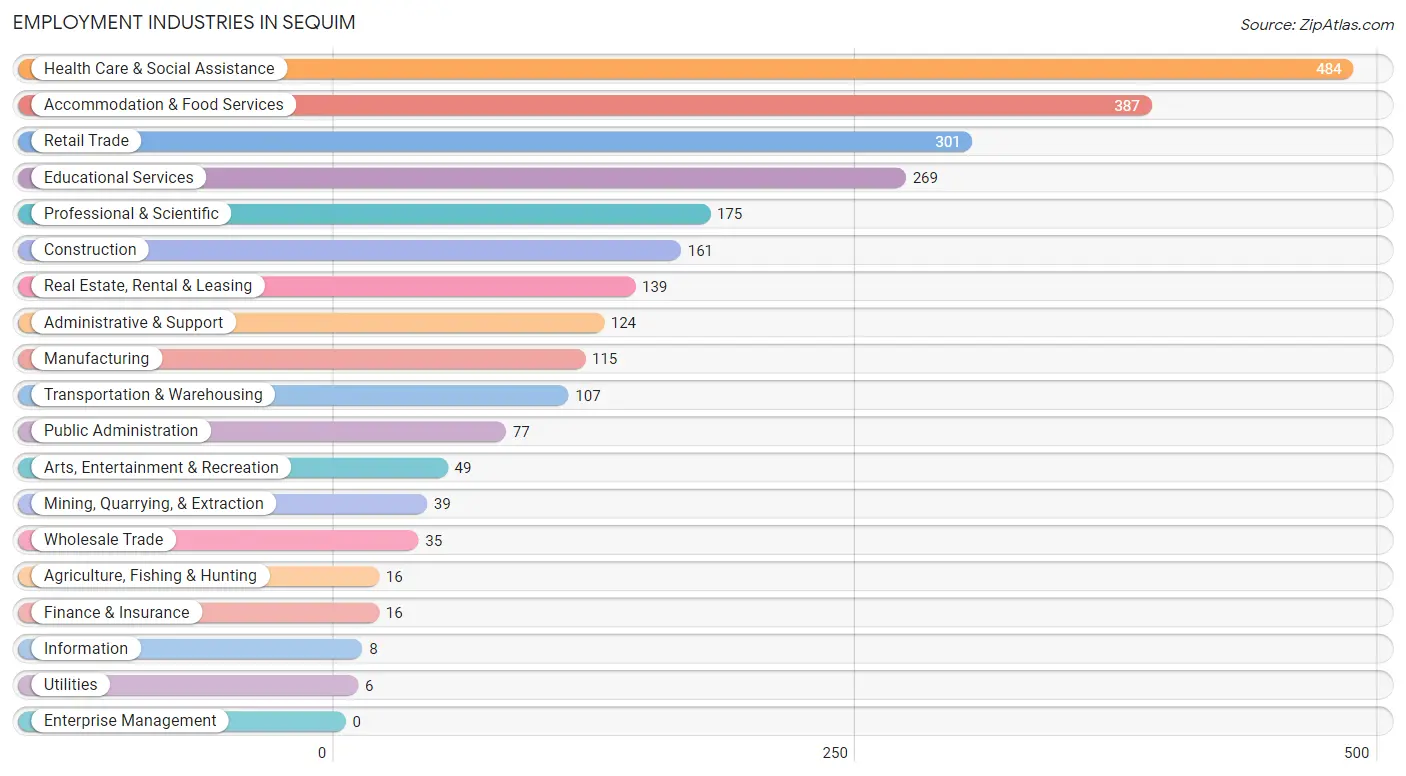
Employment Industries in Sequim
The major employment industries in Sequim include Health Care & Social Assistance (484 | 18.2%), Accommodation & Food Services (387 | 14.6%), Retail Trade (301 | 11.3%), Educational Services (269 | 10.1%), and Professional & Scientific (175 | 6.6%).
Employment Industries by Sex in Sequim
The Sequim industries that see more men than women are Agriculture, Fishing & Hunting (100.0%), Construction (100.0%), and Utilities (100.0%), whereas the industries that tend to have a higher number of women are Mining, Quarrying, & Extraction (100.0%), Information (100.0%), and Finance & Insurance (100.0%).
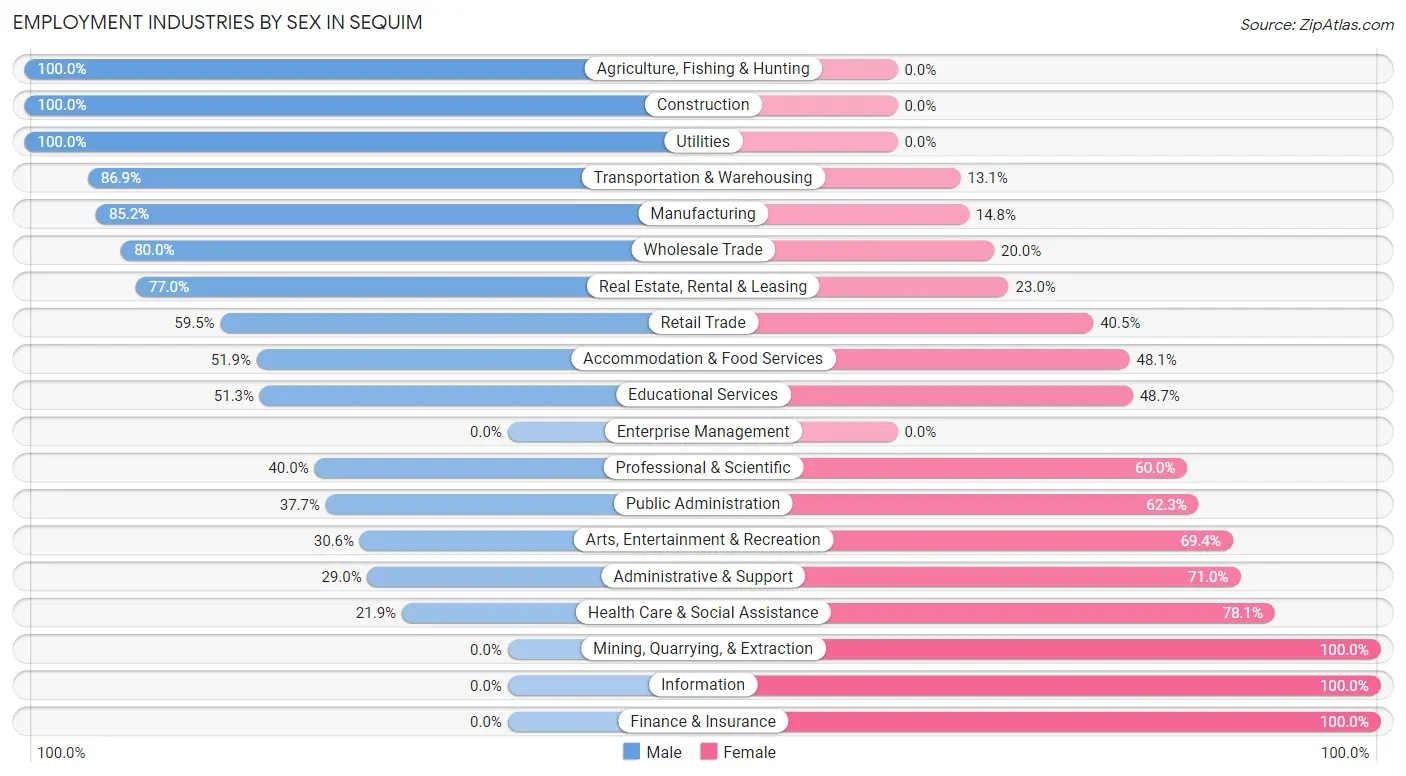
| Industry | Male | Female |
| Agriculture, Fishing & Hunting | 16 (100.0%) | 0 (0.0%) |
| Mining, Quarrying, & Extraction | 0 (0.0%) | 39 (100.0%) |
| Construction | 161 (100.0%) | 0 (0.0%) |
| Manufacturing | 98 (85.2%) | 17 (14.8%) |
| Wholesale Trade | 28 (80.0%) | 7 (20.0%) |
| Retail Trade | 179 (59.5%) | 122 (40.5%) |
| Transportation & Warehousing | 93 (86.9%) | 14 (13.1%) |
| Utilities | 6 (100.0%) | 0 (0.0%) |
| Information | 0 (0.0%) | 8 (100.0%) |
| Finance & Insurance | 0 (0.0%) | 16 (100.0%) |
| Real Estate, Rental & Leasing | 107 (77.0%) | 32 (23.0%) |
| Professional & Scientific | 70 (40.0%) | 105 (60.0%) |
| Enterprise Management | 0 (0.0%) | 0 (0.0%) |
| Administrative & Support | 36 (29.0%) | 88 (71.0%) |
| Educational Services | 138 (51.3%) | 131 (48.7%) |
| Health Care & Social Assistance | 106 (21.9%) | 378 (78.1%) |
| Arts, Entertainment & Recreation | 15 (30.6%) | 34 (69.4%) |
| Accommodation & Food Services | 201 (51.9%) | 186 (48.1%) |
| Public Administration | 29 (37.7%) | 48 (62.3%) |
| Total | 1,336 (50.3%) | 1,319 (49.7%) |
Education in Sequim
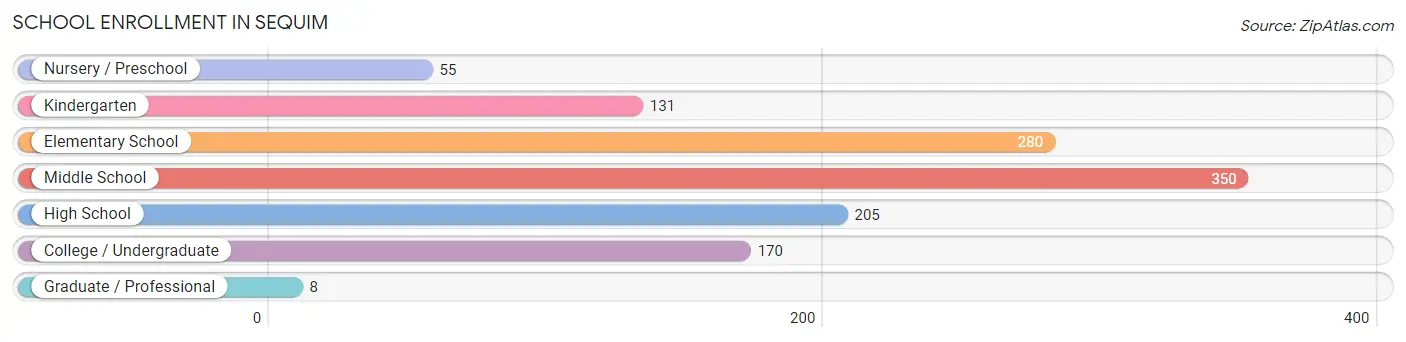
School Enrollment in Sequim
The most common levels of schooling among the 1,199 students in Sequim are middle school (350 | 29.2%), elementary school (280 | 23.4%), and high school (205 | 17.1%).
| School Level | # Students | % Students |
| Nursery / Preschool | 55 | 4.6% |
| Kindergarten | 131 | 10.9% |
| Elementary School | 280 | 23.4% |
| Middle School | 350 | 29.2% |
| High School | 205 | 17.1% |
| College / Undergraduate | 170 | 14.2% |
| Graduate / Professional | 8 | 0.7% |
| Total | 1,199 | 100.0% |
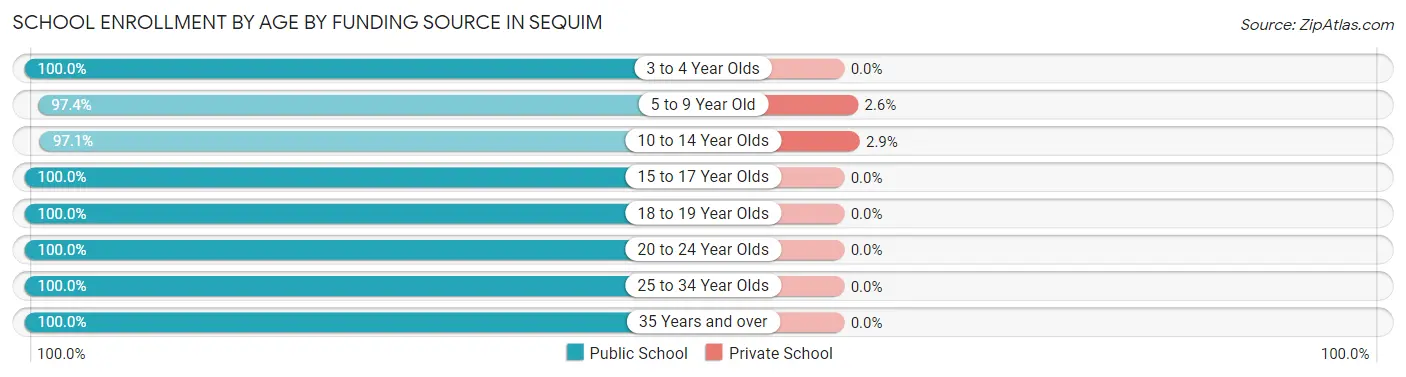
School Enrollment by Age by Funding Source in Sequim
Out of a total of 1,199 students who are enrolled in schools in Sequim, 22 (1.8%) attend a private institution, while the remaining 1,177 (98.2%) are enrolled in public schools. The age group of 10 to 14 year olds has the highest likelihood of being enrolled in private schools, with 11 (2.9% in the age bracket) enrolled. Conversely, the age group of 3 to 4 year olds has the lowest likelihood of being enrolled in a private school, with 55 (100.0% in the age bracket) attending a public institution.
| Age Bracket | Public School | Private School |
| 3 to 4 Year Olds | 55 (100.0%) | 0 (0.0%) |
| 5 to 9 Year Old | 377 (97.4%) | 10 (2.6%) |
| 10 to 14 Year Olds | 373 (97.1%) | 11 (2.9%) |
| 15 to 17 Year Olds | 133 (100.0%) | 0 (0.0%) |
| 18 to 19 Year Olds | 67 (100.0%) | 0 (0.0%) |
| 20 to 24 Year Olds | 44 (100.0%) | 0 (0.0%) |
| 25 to 34 Year Olds | 52 (100.0%) | 0 (0.0%) |
| 35 Years and over | 77 (100.0%) | 0 (0.0%) |
| Total | 1,177 (98.2%) | 22 (1.8%) |
Educational Attainment by Field of Study in Sequim
Education (455 | 20.1%), business (322 | 14.2%), liberal arts & history (293 | 13.0%), literature & languages (188 | 8.3%), and social sciences (182 | 8.1%) are the most common fields of study among 2,259 individuals in Sequim who have obtained a bachelor's degree or higher.
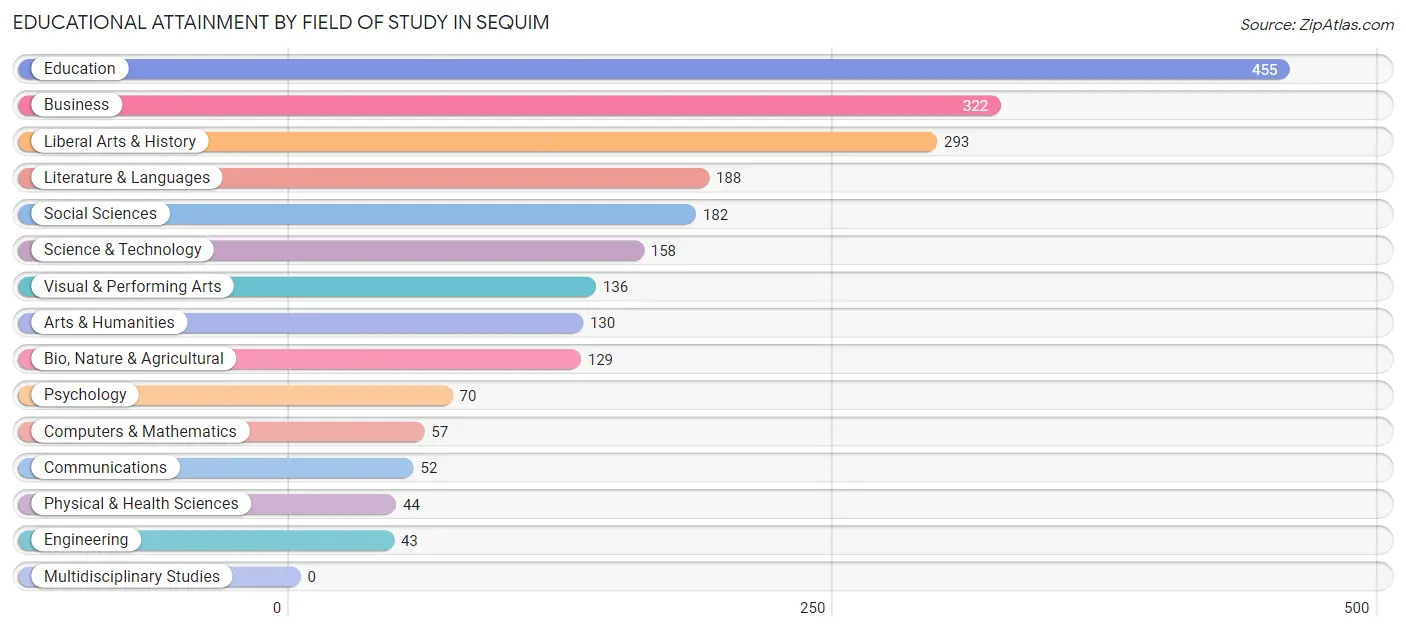
| Field of Study | # Graduates | % Graduates |
| Computers & Mathematics | 57 | 2.5% |
| Bio, Nature & Agricultural | 129 | 5.7% |
| Physical & Health Sciences | 44 | 1.9% |
| Psychology | 70 | 3.1% |
| Social Sciences | 182 | 8.1% |
| Engineering | 43 | 1.9% |
| Multidisciplinary Studies | 0 | 0.0% |
| Science & Technology | 158 | 7.0% |
| Business | 322 | 14.2% |
| Education | 455 | 20.1% |
| Literature & Languages | 188 | 8.3% |
| Liberal Arts & History | 293 | 13.0% |
| Visual & Performing Arts | 136 | 6.0% |
| Communications | 52 | 2.3% |
| Arts & Humanities | 130 | 5.8% |
| Total | 2,259 | 100.0% |
Transportation & Commute in Sequim
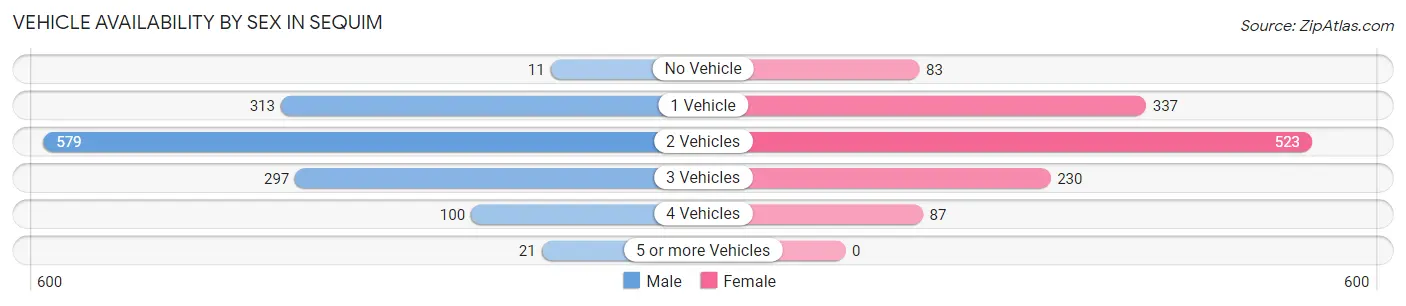
Vehicle Availability by Sex in Sequim
The most prevalent vehicle ownership categories in Sequim are males with 2 vehicles (579, accounting for 43.8%) and females with 2 vehicles (523, making up 46.0%).
| Vehicles Available | Male | Female |
| No Vehicle | 11 (0.8%) | 83 (6.6%) |
| 1 Vehicle | 313 (23.7%) | 337 (26.8%) |
| 2 Vehicles | 579 (43.8%) | 523 (41.5%) |
| 3 Vehicles | 297 (22.5%) | 230 (18.2%) |
| 4 Vehicles | 100 (7.6%) | 87 (6.9%) |
| 5 or more Vehicles | 21 (1.6%) | 0 (0.0%) |
| Total | 1,321 (100.0%) | 1,260 (100.0%) |
Commute Time in Sequim
The most frequently occuring commute durations in Sequim are 5 to 9 minutes (610 commuters, 26.6%), 10 to 14 minutes (437 commuters, 19.0%), and less than 5 minutes (229 commuters, 10.0%).
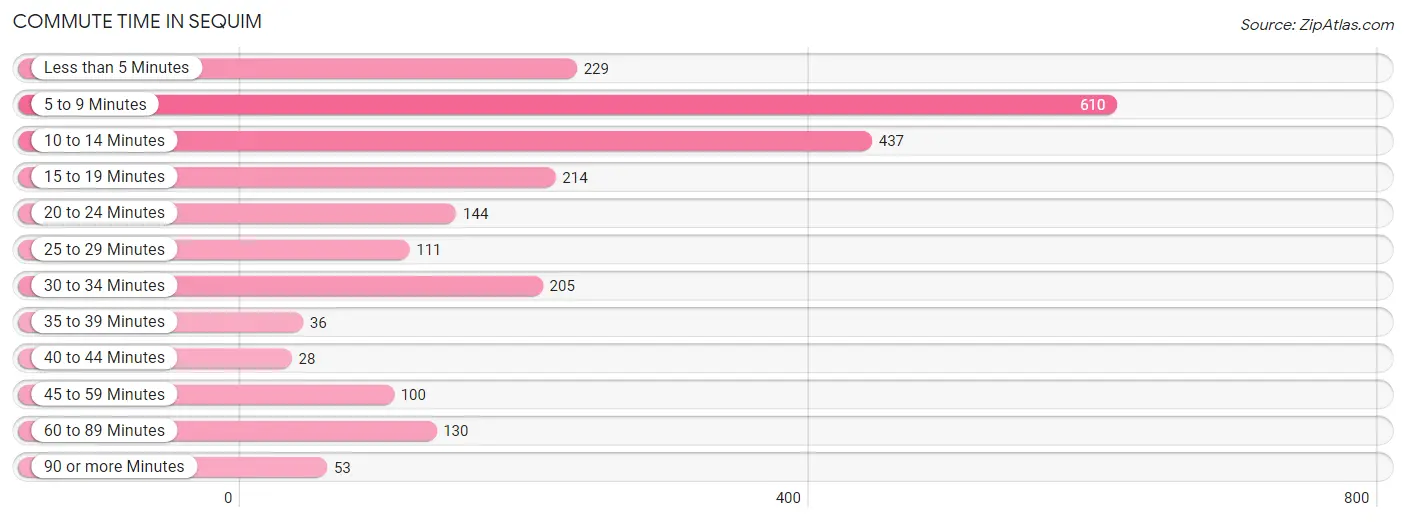
| Commute Time | # Commuters | % Commuters |
| Less than 5 Minutes | 229 | 10.0% |
| 5 to 9 Minutes | 610 | 26.6% |
| 10 to 14 Minutes | 437 | 19.0% |
| 15 to 19 Minutes | 214 | 9.3% |
| 20 to 24 Minutes | 144 | 6.3% |
| 25 to 29 Minutes | 111 | 4.8% |
| 30 to 34 Minutes | 205 | 8.9% |
| 35 to 39 Minutes | 36 | 1.6% |
| 40 to 44 Minutes | 28 | 1.2% |
| 45 to 59 Minutes | 100 | 4.3% |
| 60 to 89 Minutes | 130 | 5.7% |
| 90 or more Minutes | 53 | 2.3% |
Commute Time by Sex in Sequim
The most common commute times in Sequim are 5 to 9 minutes (314 commuters, 25.6%) for males and 5 to 9 minutes (296 commuters, 27.7%) for females.
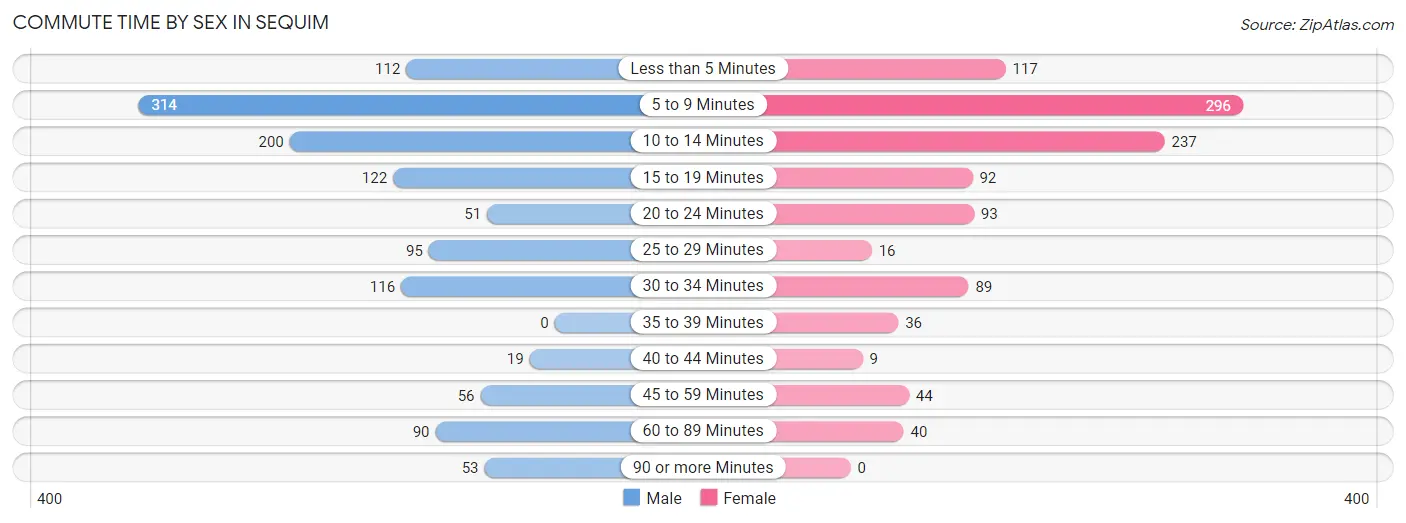
| Commute Time | Male | Female |
| Less than 5 Minutes | 112 (9.1%) | 117 (10.9%) |
| 5 to 9 Minutes | 314 (25.6%) | 296 (27.7%) |
| 10 to 14 Minutes | 200 (16.3%) | 237 (22.2%) |
| 15 to 19 Minutes | 122 (9.9%) | 92 (8.6%) |
| 20 to 24 Minutes | 51 (4.2%) | 93 (8.7%) |
| 25 to 29 Minutes | 95 (7.7%) | 16 (1.5%) |
| 30 to 34 Minutes | 116 (9.5%) | 89 (8.3%) |
| 35 to 39 Minutes | 0 (0.0%) | 36 (3.4%) |
| 40 to 44 Minutes | 19 (1.5%) | 9 (0.8%) |
| 45 to 59 Minutes | 56 (4.6%) | 44 (4.1%) |
| 60 to 89 Minutes | 90 (7.3%) | 40 (3.7%) |
| 90 or more Minutes | 53 (4.3%) | 0 (0.0%) |
Time of Departure to Work by Sex in Sequim
The most frequent times of departure to work in Sequim are 6:30 AM to 6:59 AM (168, 13.7%) for males and 7:30 AM to 7:59 AM (321, 30.0%) for females.
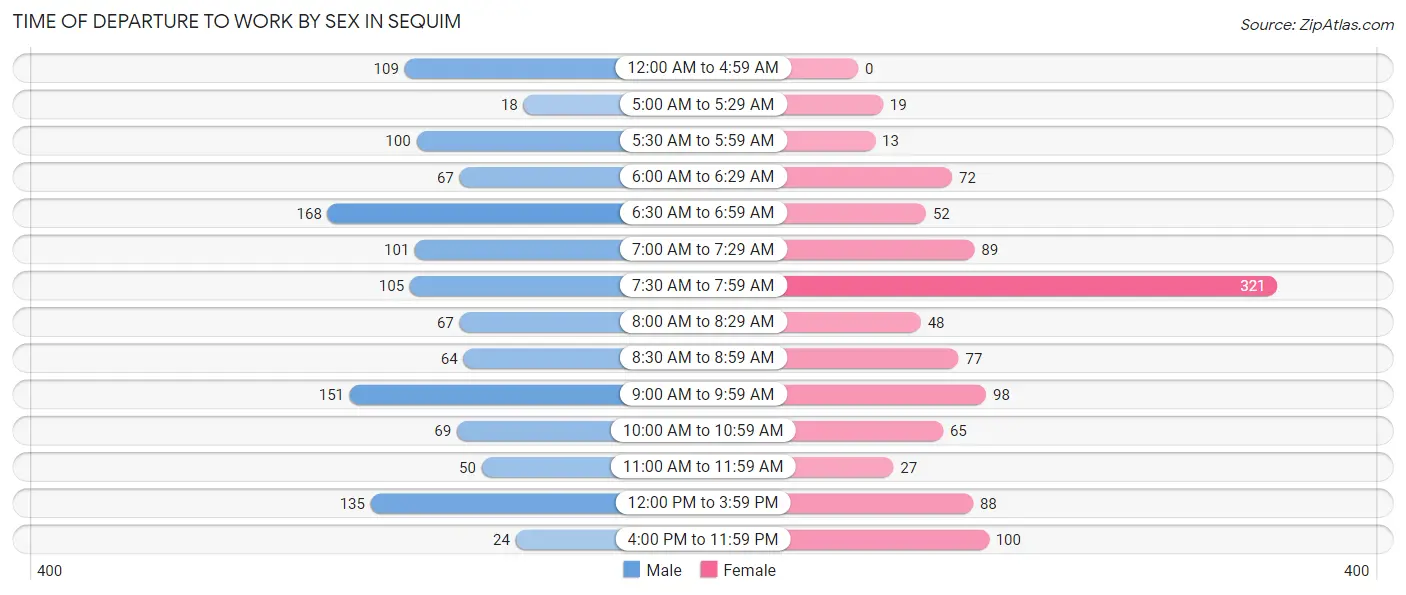
| Time of Departure | Male | Female |
| 12:00 AM to 4:59 AM | 109 (8.9%) | 0 (0.0%) |
| 5:00 AM to 5:29 AM | 18 (1.5%) | 19 (1.8%) |
| 5:30 AM to 5:59 AM | 100 (8.1%) | 13 (1.2%) |
| 6:00 AM to 6:29 AM | 67 (5.5%) | 72 (6.7%) |
| 6:30 AM to 6:59 AM | 168 (13.7%) | 52 (4.9%) |
| 7:00 AM to 7:29 AM | 101 (8.2%) | 89 (8.3%) |
| 7:30 AM to 7:59 AM | 105 (8.6%) | 321 (30.0%) |
| 8:00 AM to 8:29 AM | 67 (5.5%) | 48 (4.5%) |
| 8:30 AM to 8:59 AM | 64 (5.2%) | 77 (7.2%) |
| 9:00 AM to 9:59 AM | 151 (12.3%) | 98 (9.2%) |
| 10:00 AM to 10:59 AM | 69 (5.6%) | 65 (6.1%) |
| 11:00 AM to 11:59 AM | 50 (4.1%) | 27 (2.5%) |
| 12:00 PM to 3:59 PM | 135 (11.0%) | 88 (8.2%) |
| 4:00 PM to 11:59 PM | 24 (1.9%) | 100 (9.3%) |
| Total | 1,228 (100.0%) | 1,069 (100.0%) |
Housing Occupancy in Sequim
Occupancy by Ownership in Sequim
Of the total 3,969 dwellings in Sequim, owner-occupied units account for 2,331 (58.7%), while renter-occupied units make up 1,638 (41.3%).
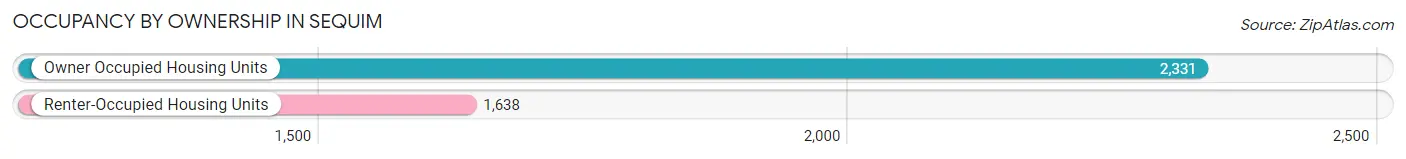
| Occupancy | # Housing Units | % Housing Units |
| Owner Occupied Housing Units | 2,331 | 58.7% |
| Renter-Occupied Housing Units | 1,638 | 41.3% |
| Total Occupied Housing Units | 3,969 | 100.0% |
Occupancy by Household Size in Sequim
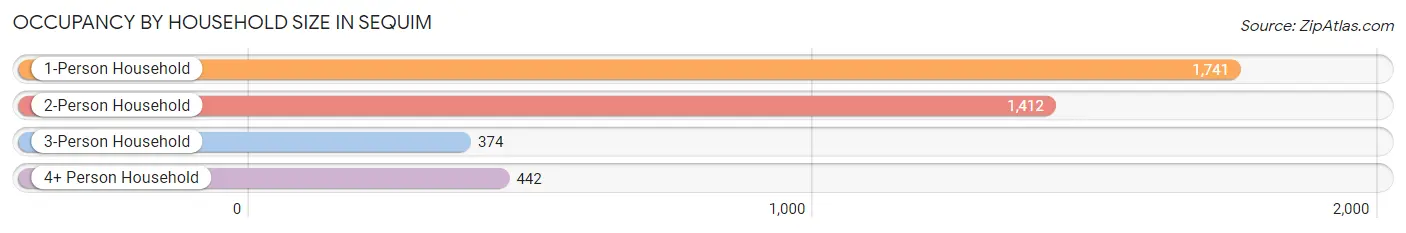
| Household Size | # Housing Units | % Housing Units |
| 1-Person Household | 1,741 | 43.9% |
| 2-Person Household | 1,412 | 35.6% |
| 3-Person Household | 374 | 9.4% |
| 4+ Person Household | 442 | 11.1% |
| Total Housing Units | 3,969 | 100.0% |
Occupancy by Ownership by Household Size in Sequim
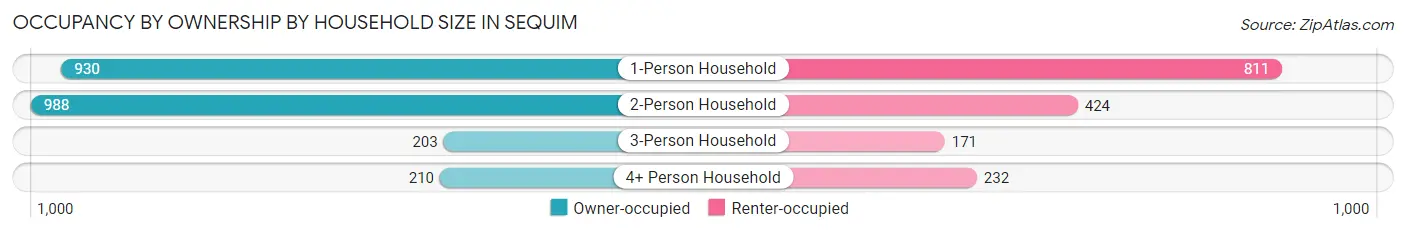
| Household Size | Owner-occupied | Renter-occupied |
| 1-Person Household | 930 (53.4%) | 811 (46.6%) |
| 2-Person Household | 988 (70.0%) | 424 (30.0%) |
| 3-Person Household | 203 (54.3%) | 171 (45.7%) |
| 4+ Person Household | 210 (47.5%) | 232 (52.5%) |
| Total Housing Units | 2,331 (58.7%) | 1,638 (41.3%) |
Occupancy by Educational Attainment in Sequim
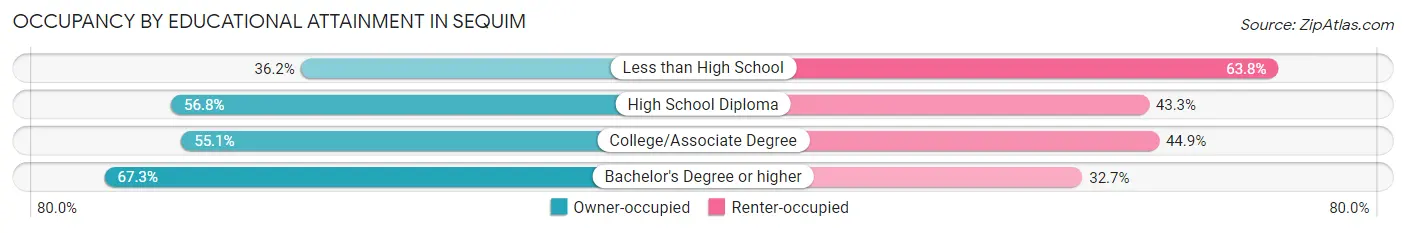
| Household Size | Owner-occupied | Renter-occupied |
| Less than High School | 67 (36.2%) | 118 (63.8%) |
| High School Diploma | 433 (56.8%) | 330 (43.2%) |
| College/Associate Degree | 917 (55.1%) | 746 (44.9%) |
| Bachelor's Degree or higher | 914 (67.3%) | 444 (32.7%) |
Occupancy by Age of Householder in Sequim
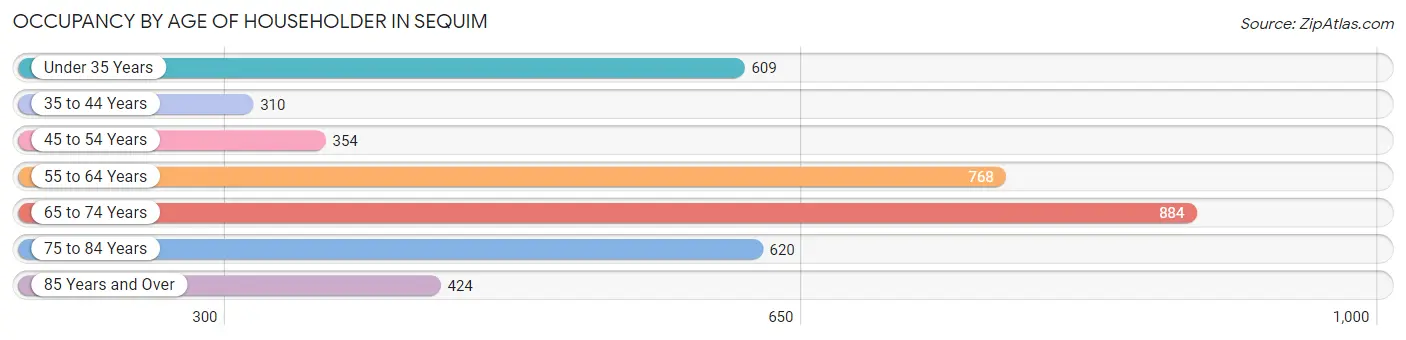
| Age Bracket | # Households | % Households |
| Under 35 Years | 609 | 15.3% |
| 35 to 44 Years | 310 | 7.8% |
| 45 to 54 Years | 354 | 8.9% |
| 55 to 64 Years | 768 | 19.4% |
| 65 to 74 Years | 884 | 22.3% |
| 75 to 84 Years | 620 | 15.6% |
| 85 Years and Over | 424 | 10.7% |
| Total | 3,969 | 100.0% |
Housing Finances in Sequim
Median Income by Occupancy in Sequim
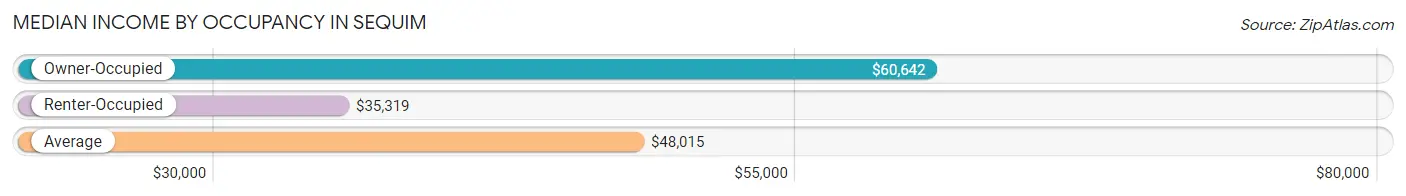
| Occupancy Type | # Households | Median Income |
| Owner-Occupied | 2,331 (58.7%) | $60,642 |
| Renter-Occupied | 1,638 (41.3%) | $35,319 |
| Average | 3,969 (100.0%) | $48,015 |
Occupancy by Householder Income Bracket in Sequim
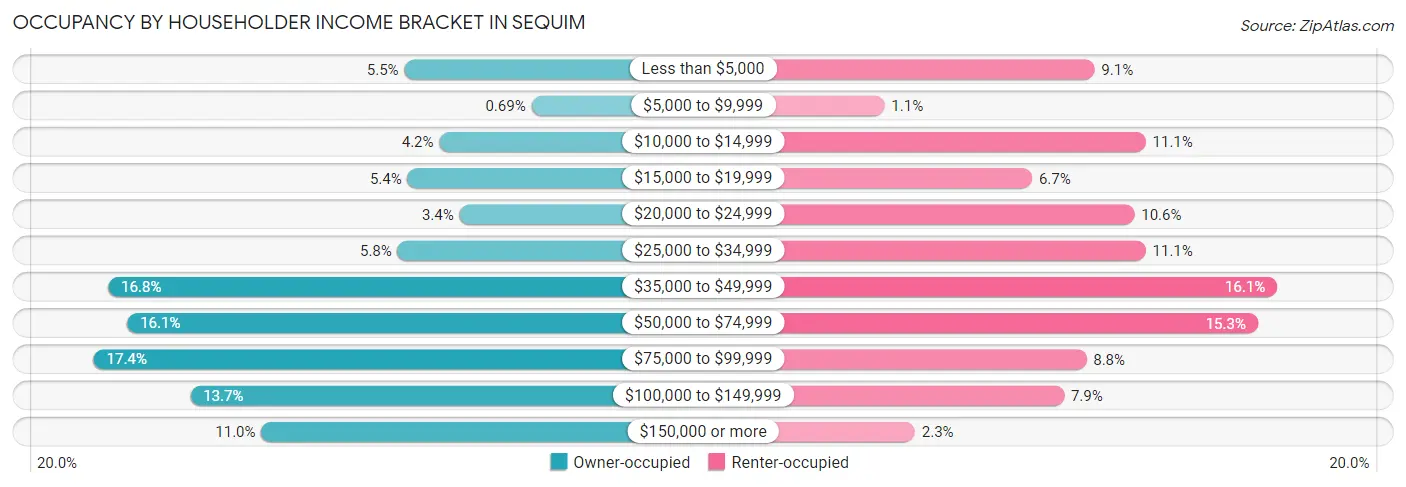
| Income Bracket | Owner-occupied | Renter-occupied |
| Less than $5,000 | 129 (5.5%) | 149 (9.1%) |
| $5,000 to $9,999 | 16 (0.7%) | 18 (1.1%) |
| $10,000 to $14,999 | 98 (4.2%) | 181 (11.1%) |
| $15,000 to $19,999 | 126 (5.4%) | 110 (6.7%) |
| $20,000 to $24,999 | 80 (3.4%) | 174 (10.6%) |
| $25,000 to $34,999 | 135 (5.8%) | 181 (11.1%) |
| $35,000 to $49,999 | 392 (16.8%) | 263 (16.1%) |
| $50,000 to $74,999 | 375 (16.1%) | 251 (15.3%) |
| $75,000 to $99,999 | 405 (17.4%) | 144 (8.8%) |
| $100,000 to $149,999 | 319 (13.7%) | 130 (7.9%) |
| $150,000 or more | 256 (11.0%) | 37 (2.3%) |
| Total | 2,331 (100.0%) | 1,638 (100.0%) |
Monthly Housing Cost Tiers in Sequim
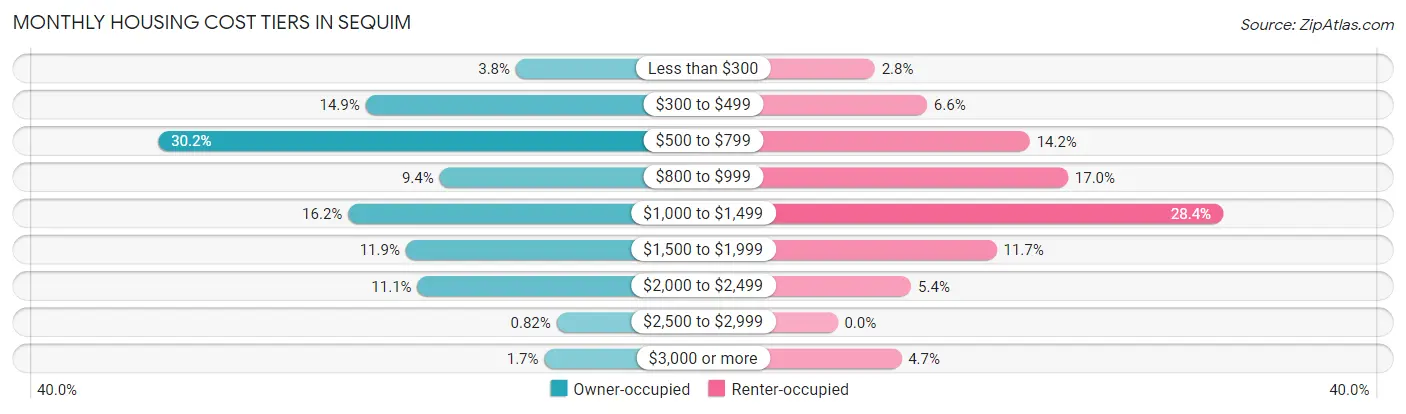
| Monthly Cost | Owner-occupied | Renter-occupied |
| Less than $300 | 89 (3.8%) | 45 (2.8%) |
| $300 to $499 | 347 (14.9%) | 108 (6.6%) |
| $500 to $799 | 703 (30.2%) | 232 (14.2%) |
| $800 to $999 | 220 (9.4%) | 278 (17.0%) |
| $1,000 to $1,499 | 377 (16.2%) | 465 (28.4%) |
| $1,500 to $1,999 | 278 (11.9%) | 192 (11.7%) |
| $2,000 to $2,499 | 258 (11.1%) | 89 (5.4%) |
| $2,500 to $2,999 | 19 (0.8%) | 0 (0.0%) |
| $3,000 or more | 40 (1.7%) | 77 (4.7%) |
| Total | 2,331 (100.0%) | 1,638 (100.0%) |
Physical Housing Characteristics in Sequim
Housing Structures in Sequim
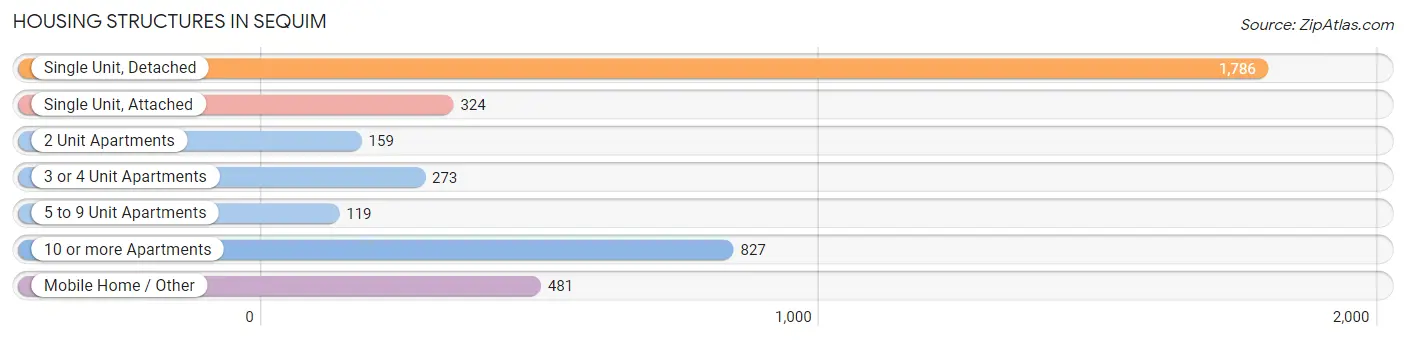
| Structure Type | # Housing Units | % Housing Units |
| Single Unit, Detached | 1,786 | 45.0% |
| Single Unit, Attached | 324 | 8.2% |
| 2 Unit Apartments | 159 | 4.0% |
| 3 or 4 Unit Apartments | 273 | 6.9% |
| 5 to 9 Unit Apartments | 119 | 3.0% |
| 10 or more Apartments | 827 | 20.8% |
| Mobile Home / Other | 481 | 12.1% |
| Total | 3,969 | 100.0% |
Housing Structures by Occupancy in Sequim
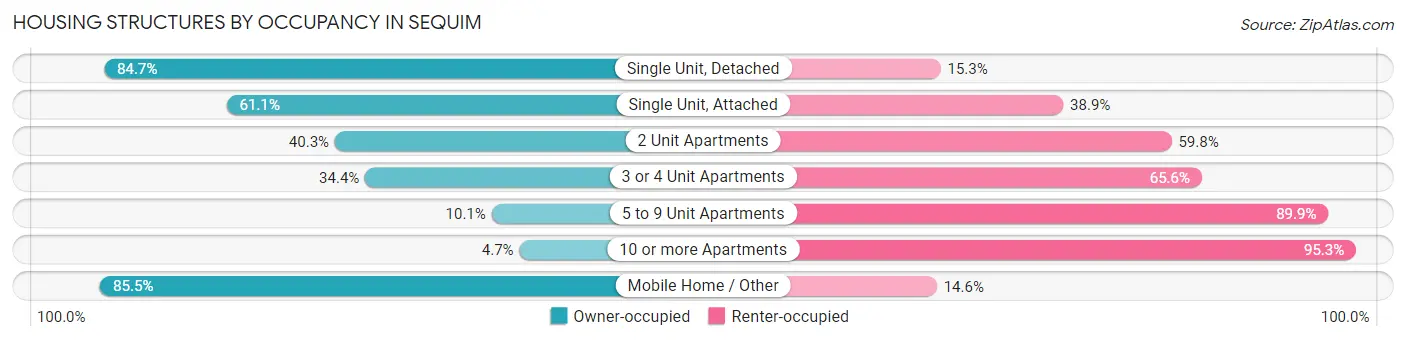
| Structure Type | Owner-occupied | Renter-occupied |
| Single Unit, Detached | 1,513 (84.7%) | 273 (15.3%) |
| Single Unit, Attached | 198 (61.1%) | 126 (38.9%) |
| 2 Unit Apartments | 64 (40.3%) | 95 (59.8%) |
| 3 or 4 Unit Apartments | 94 (34.4%) | 179 (65.6%) |
| 5 to 9 Unit Apartments | 12 (10.1%) | 107 (89.9%) |
| 10 or more Apartments | 39 (4.7%) | 788 (95.3%) |
| Mobile Home / Other | 411 (85.5%) | 70 (14.5%) |
| Total | 2,331 (58.7%) | 1,638 (41.3%) |
Housing Structures by Number of Rooms in Sequim
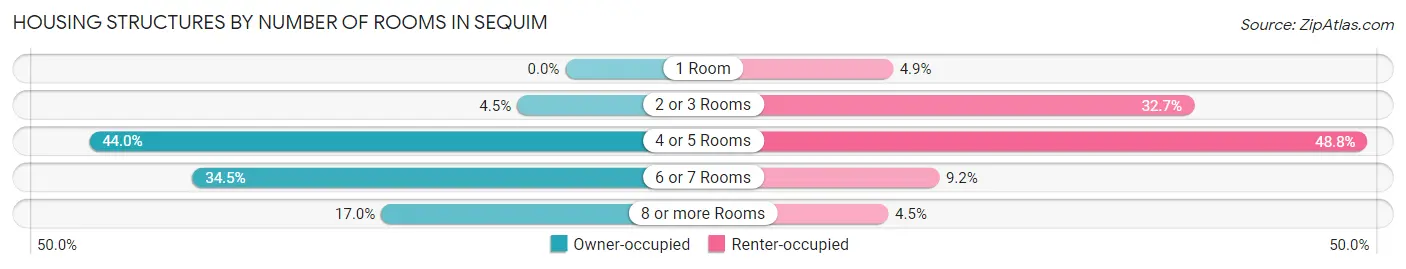
| Number of Rooms | Owner-occupied | Renter-occupied |
| 1 Room | 0 (0.0%) | 80 (4.9%) |
| 2 or 3 Rooms | 104 (4.5%) | 536 (32.7%) |
| 4 or 5 Rooms | 1,026 (44.0%) | 799 (48.8%) |
| 6 or 7 Rooms | 804 (34.5%) | 150 (9.2%) |
| 8 or more Rooms | 397 (17.0%) | 73 (4.5%) |
| Total | 2,331 (100.0%) | 1,638 (100.0%) |
Housing Structure by Heating Type in Sequim
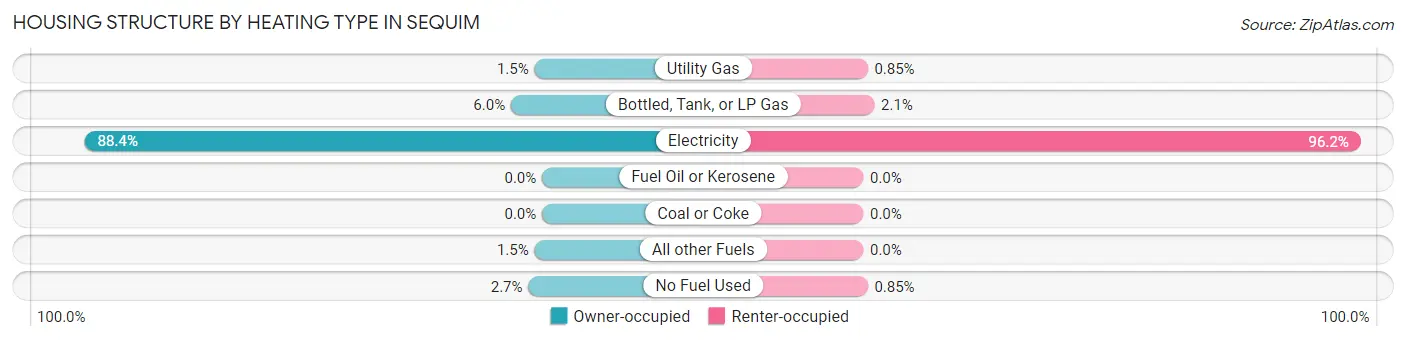
| Heating Type | Owner-occupied | Renter-occupied |
| Utility Gas | 34 (1.5%) | 14 (0.9%) |
| Bottled, Tank, or LP Gas | 140 (6.0%) | 35 (2.1%) |
| Electricity | 2,061 (88.4%) | 1,575 (96.2%) |
| Fuel Oil or Kerosene | 0 (0.0%) | 0 (0.0%) |
| Coal or Coke | 0 (0.0%) | 0 (0.0%) |
| All other Fuels | 34 (1.5%) | 0 (0.0%) |
| No Fuel Used | 62 (2.7%) | 14 (0.9%) |
| Total | 2,331 (100.0%) | 1,638 (100.0%) |
Household Vehicle Usage in Sequim
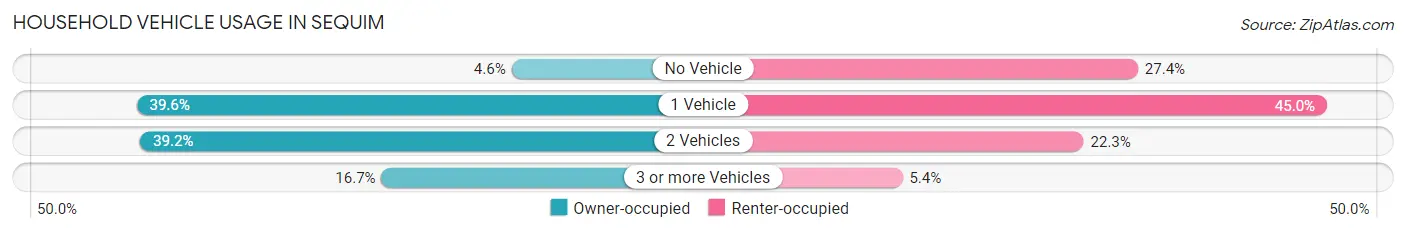
| Vehicles per Household | Owner-occupied | Renter-occupied |
| No Vehicle | 106 (4.5%) | 448 (27.4%) |
| 1 Vehicle | 922 (39.6%) | 737 (45.0%) |
| 2 Vehicles | 914 (39.2%) | 365 (22.3%) |
| 3 or more Vehicles | 389 (16.7%) | 88 (5.4%) |
| Total | 2,331 (100.0%) | 1,638 (100.0%) |
Real Estate & Mortgages in Sequim
Real Estate and Mortgage Overview in Sequim
| Characteristic | Without Mortgage | With Mortgage |
| Housing Units | 1,324 | 1,007 |
| Median Property Value | $320,400 | $336,500 |
| Median Household Income | $50,156 | $155 |
| Monthly Housing Costs | $623 | $40 |
| Real Estate Taxes | $2,484 | $0 |
Property Value by Mortgage Status in Sequim
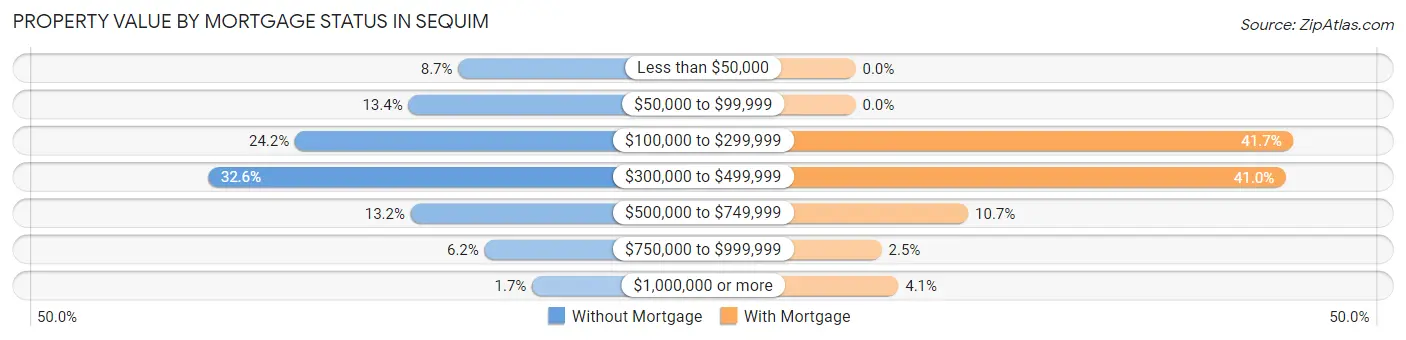
| Property Value | Without Mortgage | With Mortgage |
| Less than $50,000 | 115 (8.7%) | 0 (0.0%) |
| $50,000 to $99,999 | 178 (13.4%) | 0 (0.0%) |
| $100,000 to $299,999 | 321 (24.2%) | 420 (41.7%) |
| $300,000 to $499,999 | 431 (32.6%) | 413 (41.0%) |
| $500,000 to $749,999 | 175 (13.2%) | 108 (10.7%) |
| $750,000 to $999,999 | 82 (6.2%) | 25 (2.5%) |
| $1,000,000 or more | 22 (1.7%) | 41 (4.1%) |
| Total | 1,324 (100.0%) | 1,007 (100.0%) |
Household Income by Mortgage Status in Sequim
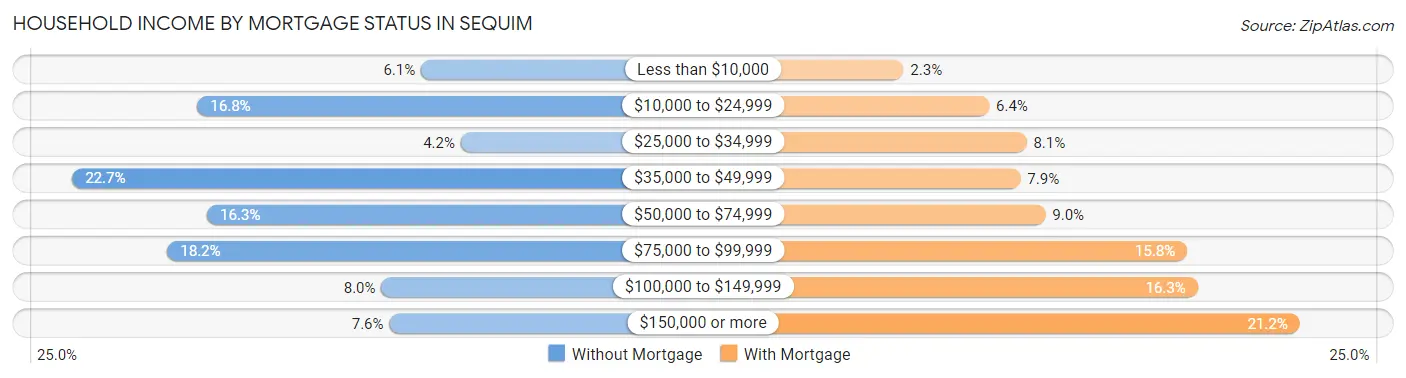
| Household Income | Without Mortgage | With Mortgage |
| Less than $10,000 | 81 (6.1%) | 23 (2.3%) |
| $10,000 to $24,999 | 222 (16.8%) | 64 (6.4%) |
| $25,000 to $34,999 | 56 (4.2%) | 82 (8.1%) |
| $35,000 to $49,999 | 301 (22.7%) | 79 (7.9%) |
| $50,000 to $74,999 | 216 (16.3%) | 91 (9.0%) |
| $75,000 to $99,999 | 241 (18.2%) | 159 (15.8%) |
| $100,000 to $149,999 | 106 (8.0%) | 164 (16.3%) |
| $150,000 or more | 101 (7.6%) | 213 (21.1%) |
| Total | 1,324 (100.0%) | 1,007 (100.0%) |
Property Value to Household Income Ratio in Sequim
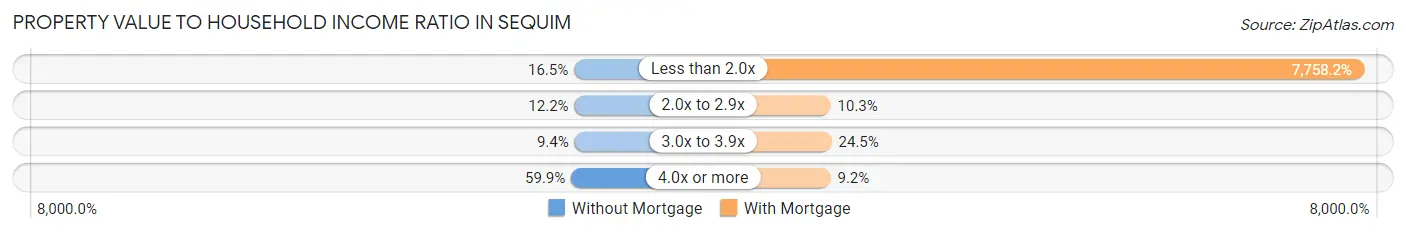
| Value-to-Income Ratio | Without Mortgage | With Mortgage |
| Less than 2.0x | 218 (16.5%) | 78,125 (7,758.2%) |
| 2.0x to 2.9x | 161 (12.2%) | 104 (10.3%) |
| 3.0x to 3.9x | 125 (9.4%) | 247 (24.5%) |
| 4.0x or more | 793 (59.9%) | 93 (9.2%) |
| Total | 1,324 (100.0%) | 1,007 (100.0%) |
Real Estate Taxes by Mortgage Status in Sequim
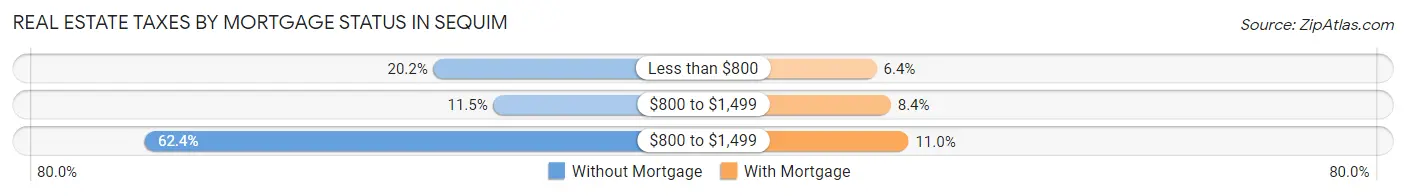
| Property Taxes | Without Mortgage | With Mortgage |
| Less than $800 | 268 (20.2%) | 64 (6.4%) |
| $800 to $1,499 | 152 (11.5%) | 85 (8.4%) |
| $800 to $1,499 | 826 (62.4%) | 111 (11.0%) |
| Total | 1,324 (100.0%) | 1,007 (100.0%) |
Health & Disability in Sequim
Health Insurance Coverage by Age in Sequim
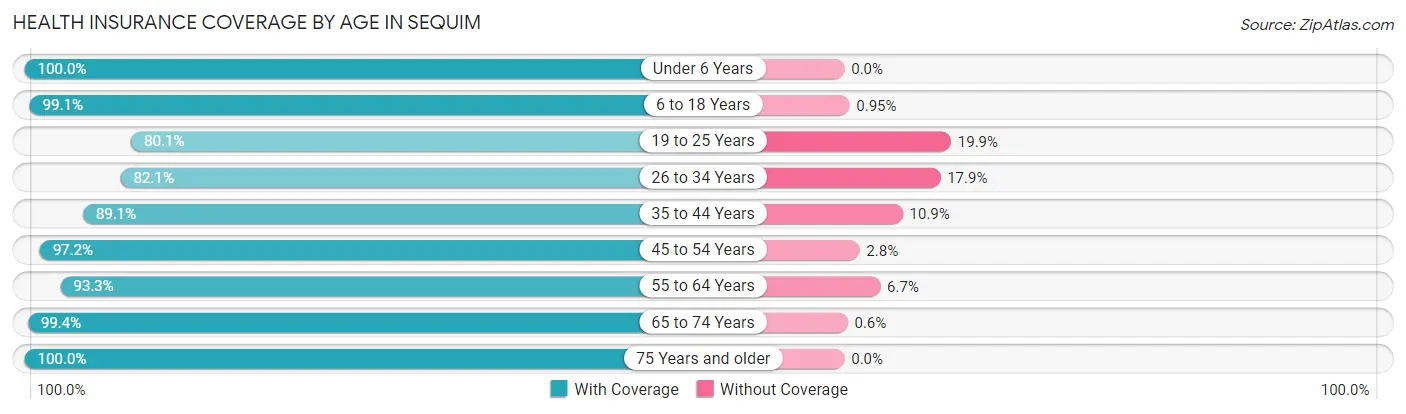
| Age Bracket | With Coverage | Without Coverage |
| Under 6 Years | 393 (100.0%) | 0 (0.0%) |
| 6 to 18 Years | 1,047 (99.1%) | 10 (0.9%) |
| 19 to 25 Years | 359 (80.1%) | 89 (19.9%) |
| 26 to 34 Years | 569 (82.1%) | 124 (17.9%) |
| 35 to 44 Years | 525 (89.1%) | 64 (10.9%) |
| 45 to 54 Years | 551 (97.2%) | 16 (2.8%) |
| 55 to 64 Years | 1,162 (93.3%) | 83 (6.7%) |
| 65 to 74 Years | 1,318 (99.4%) | 8 (0.6%) |
| 75 Years and older | 1,438 (100.0%) | 0 (0.0%) |
| Total | 7,362 (94.9%) | 394 (5.1%) |
Health Insurance Coverage by Citizenship Status in Sequim
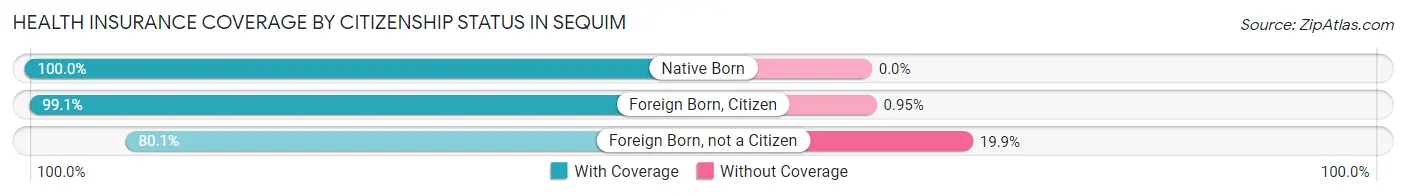
| Citizenship Status | With Coverage | Without Coverage |
| Native Born | 393 (100.0%) | 0 (0.0%) |
| Foreign Born, Citizen | 1,047 (99.1%) | 10 (0.9%) |
| Foreign Born, not a Citizen | 359 (80.1%) | 89 (19.9%) |
Health Insurance Coverage by Household Income in Sequim
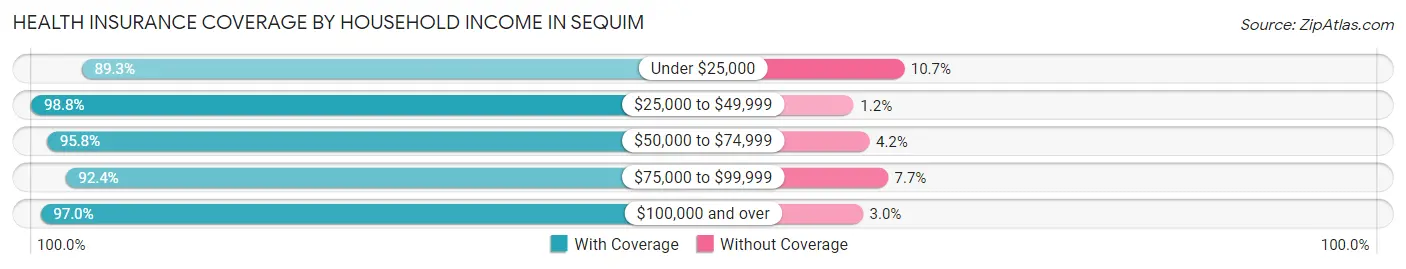
| Household Income | With Coverage | Without Coverage |
| Under $25,000 | 1,372 (89.3%) | 164 (10.7%) |
| $25,000 to $49,999 | 1,517 (98.8%) | 19 (1.2%) |
| $50,000 to $74,999 | 1,403 (95.8%) | 61 (4.2%) |
| $75,000 to $99,999 | 1,062 (92.3%) | 88 (7.6%) |
| $100,000 and over | 1,969 (97.0%) | 60 (3.0%) |
Public vs Private Health Insurance Coverage by Age in Sequim
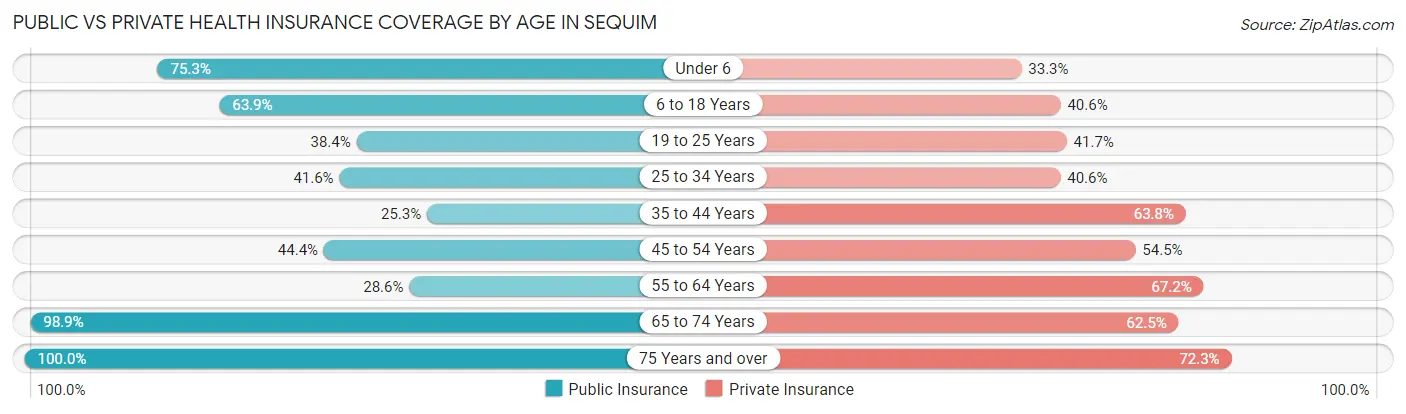
| Age Bracket | Public Insurance | Private Insurance |
| Under 6 | 296 (75.3%) | 131 (33.3%) |
| 6 to 18 Years | 675 (63.9%) | 429 (40.6%) |
| 19 to 25 Years | 172 (38.4%) | 187 (41.7%) |
| 25 to 34 Years | 288 (41.6%) | 281 (40.6%) |
| 35 to 44 Years | 149 (25.3%) | 376 (63.8%) |
| 45 to 54 Years | 252 (44.4%) | 309 (54.5%) |
| 55 to 64 Years | 356 (28.6%) | 836 (67.1%) |
| 65 to 74 Years | 1,312 (98.9%) | 829 (62.5%) |
| 75 Years and over | 1,438 (100.0%) | 1,040 (72.3%) |
| Total | 4,938 (63.7%) | 4,418 (57.0%) |
Disability Status by Sex by Age in Sequim
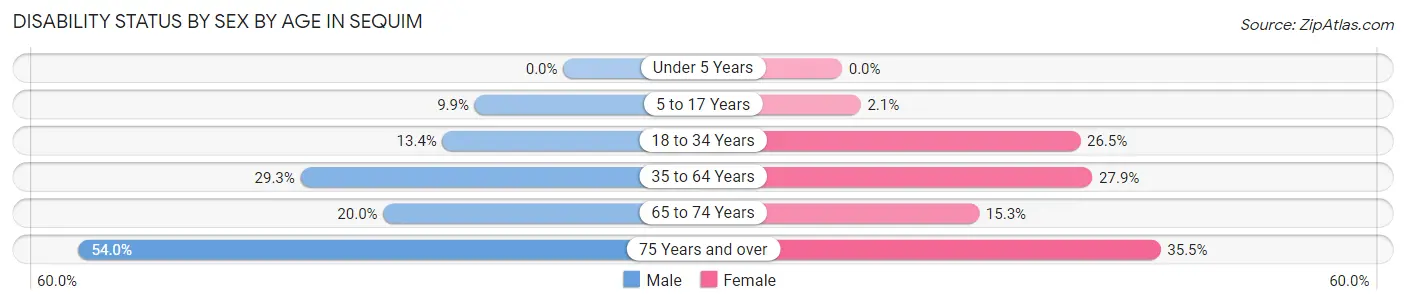
| Age Bracket | Male | Female |
| Under 5 Years | 0 (0.0%) | 0 (0.0%) |
| 5 to 17 Years | 50 (9.9%) | 11 (2.1%) |
| 18 to 34 Years | 77 (13.4%) | 173 (26.5%) |
| 35 to 64 Years | 350 (29.3%) | 336 (27.9%) |
| 65 to 74 Years | 103 (20.0%) | 124 (15.3%) |
| 75 Years and over | 332 (54.0%) | 292 (35.5%) |
Disability Class by Sex by Age in Sequim
Disability Class: Hearing Difficulty
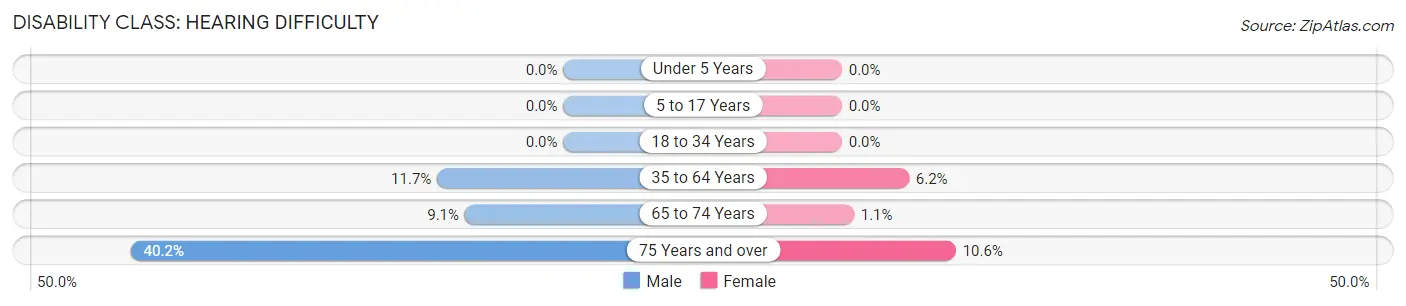
| Age Bracket | Male | Female |
| Under 5 Years | 0 (0.0%) | 0 (0.0%) |
| 5 to 17 Years | 0 (0.0%) | 0 (0.0%) |
| 18 to 34 Years | 0 (0.0%) | 0 (0.0%) |
| 35 to 64 Years | 140 (11.7%) | 75 (6.2%) |
| 65 to 74 Years | 47 (9.1%) | 9 (1.1%) |
| 75 Years and over | 247 (40.2%) | 87 (10.6%) |
Disability Class: Vision Difficulty
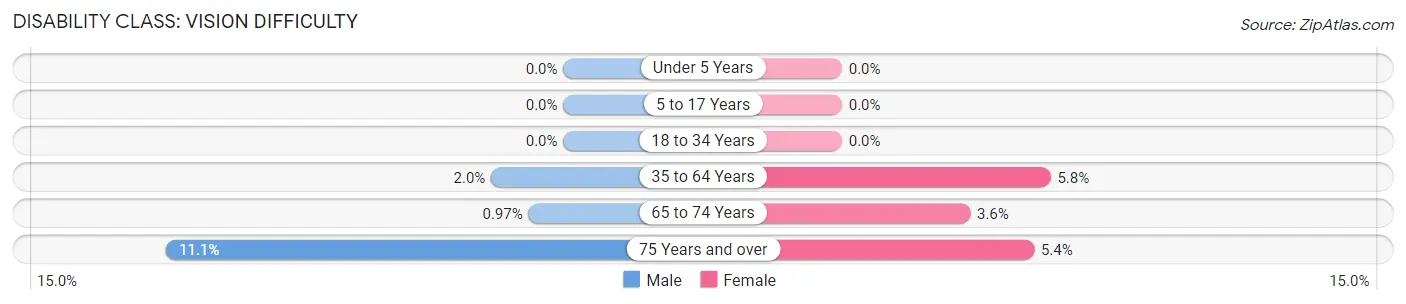
| Age Bracket | Male | Female |
| Under 5 Years | 0 (0.0%) | 0 (0.0%) |
| 5 to 17 Years | 0 (0.0%) | 0 (0.0%) |
| 18 to 34 Years | 0 (0.0%) | 0 (0.0%) |
| 35 to 64 Years | 24 (2.0%) | 70 (5.8%) |
| 65 to 74 Years | 5 (1.0%) | 29 (3.6%) |
| 75 Years and over | 68 (11.1%) | 44 (5.3%) |
Disability Class: Cognitive Difficulty
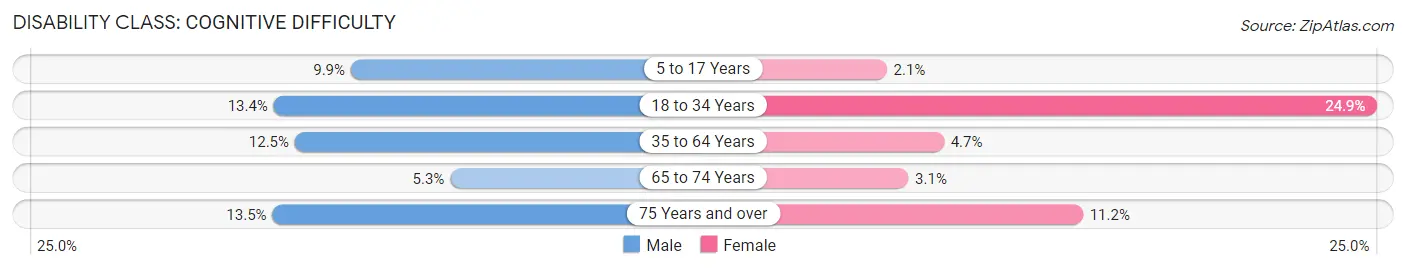
| Age Bracket | Male | Female |
| 5 to 17 Years | 50 (9.9%) | 11 (2.1%) |
| 18 to 34 Years | 77 (13.4%) | 162 (24.8%) |
| 35 to 64 Years | 149 (12.5%) | 57 (4.7%) |
| 65 to 74 Years | 27 (5.2%) | 25 (3.1%) |
| 75 Years and over | 83 (13.5%) | 92 (11.2%) |
Disability Class: Ambulatory Difficulty
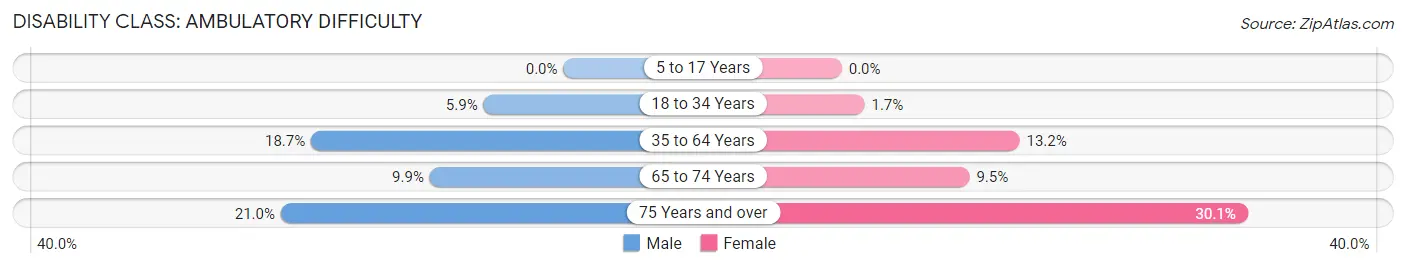
| Age Bracket | Male | Female |
| 5 to 17 Years | 0 (0.0%) | 0 (0.0%) |
| 18 to 34 Years | 34 (5.9%) | 11 (1.7%) |
| 35 to 64 Years | 224 (18.7%) | 159 (13.2%) |
| 65 to 74 Years | 51 (9.9%) | 77 (9.5%) |
| 75 Years and over | 129 (21.0%) | 248 (30.1%) |
Disability Class: Self-Care Difficulty
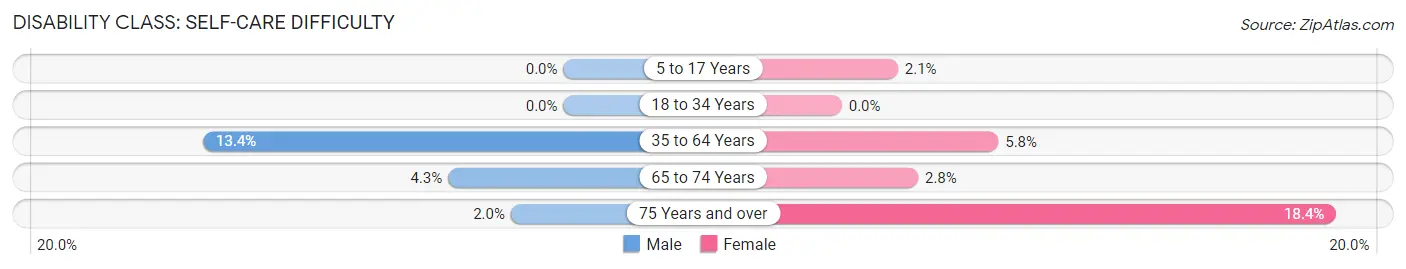
| Age Bracket | Male | Female |
| 5 to 17 Years | 0 (0.0%) | 11 (2.1%) |
| 18 to 34 Years | 0 (0.0%) | 0 (0.0%) |
| 35 to 64 Years | 160 (13.4%) | 70 (5.8%) |
| 65 to 74 Years | 22 (4.3%) | 23 (2.8%) |
| 75 Years and over | 12 (1.9%) | 151 (18.3%) |
Technology Access in Sequim
Computing Device Access in Sequim
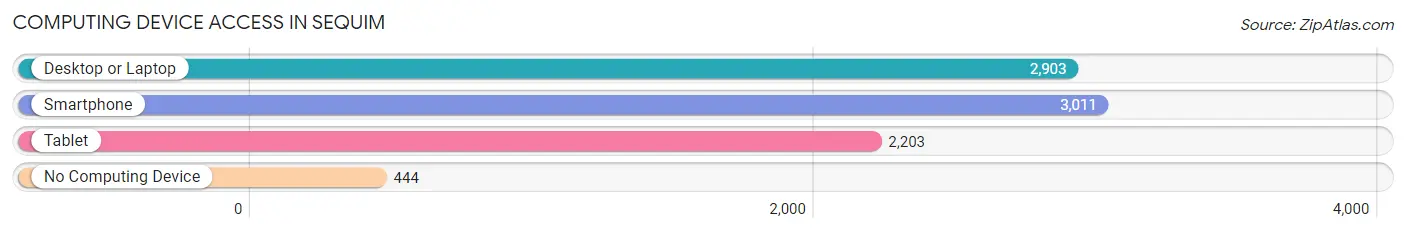
| Device Type | # Households | % Households |
| Desktop or Laptop | 2,903 | 73.1% |
| Smartphone | 3,011 | 75.9% |
| Tablet | 2,203 | 55.5% |
| No Computing Device | 444 | 11.2% |
| Total | 3,969 | 100.0% |
Internet Access in Sequim
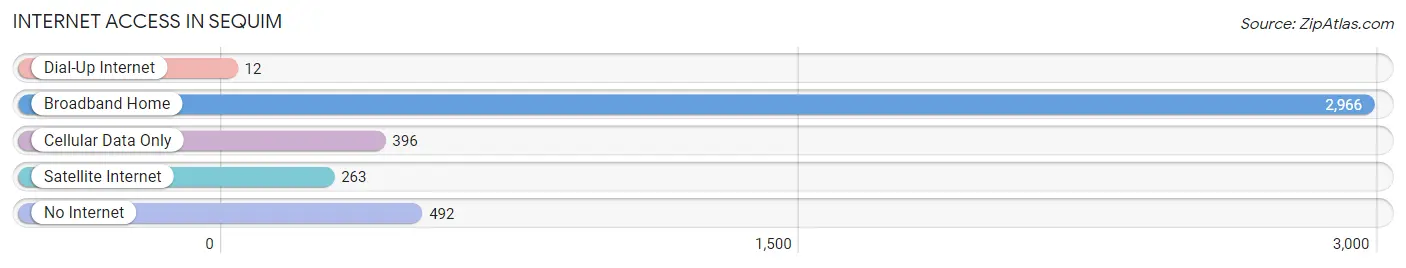
| Internet Type | # Households | % Households |
| Dial-Up Internet | 12 | 0.3% |
| Broadband Home | 2,966 | 74.7% |
| Cellular Data Only | 396 | 10.0% |
| Satellite Internet | 263 | 6.6% |
| No Internet | 492 | 12.4% |
| Total | 3,969 | 100.0% |
Sequim Summary
Situated on the Olympic Peninsula in Washington State, the city of Sequim is a small but vibrant community with a rich history, diverse geography, and a strong economy. With a population of 6,606 in 2000, Sequim is the largest city in Clallam County and is located just 20 miles east of the Strait of Juan de Fuca and the Pacific Ocean.
History
The area now known as Sequim was first inhabited by the S’Klallam people, who lived in the area for thousands of years before the arrival of European settlers. The first Europeans to explore the area were Spanish explorers, who arrived in the late 1700s. In the early 1800s, the area was explored by American fur traders, who established trading posts in the area.
In 1857, the first permanent settlers arrived in the area, led by William Shelton and his family. The Shelton family established a homestead in the area, which they named Sequim, after the S’Klallam word for “quiet waters.” The Shelton family was soon joined by other settlers, and the area began to grow.
In the late 1800s, the area was transformed by the arrival of the railroad. The railroad brought new settlers to the area, as well as new businesses and industries. The railroad also helped to connect Sequim to the rest of the state, and the area began to grow rapidly.
In the early 1900s, Sequim was transformed again by the arrival of the Dungeness Valley Irrigation Project. The project brought water to the area, allowing for the growth of agriculture and the development of the area’s economy.
Geography
Sequim is located on the Olympic Peninsula in Washington State, approximately 20 miles east of the Strait of Juan de Fuca and the Pacific Ocean. The city is situated in a valley between the Olympic Mountains to the west and the Dungeness Range to the east. The city is surrounded by forests, mountains, and rivers, and is known for its mild climate and abundant sunshine.
Economy
Sequim’s economy is largely based on agriculture, tourism, and retail. The area is home to a number of farms, which produce a variety of crops, including apples, pears, and berries. The area is also home to a number of wineries, which produce award-winning wines.
Tourism is also an important part of the local economy. The area is home to a number of attractions, including the Olympic Game Farm, the Dungeness National Wildlife Refuge, and the Olympic National Park. The area is also home to a number of festivals and events, including the Sequim Lavender Festival and the Sequim Irrigation Festival.
Retail is also an important part of the local economy. The area is home to a number of shops, restaurants, and other businesses, which provide goods and services to the local community.
Demographics
As of the 2000 census, the population of Sequim was 6,606. The population was spread out, with 25.2% under the age of 18, 6.2% from 18 to 24, 28.2% from 25 to 44, 24.2% from 45 to 64, and 16.2% who were 65 years of age or older. The median age was 40 years.
The racial makeup of the city was 92.2% White, 0.3% African American, 0.9% Native American, 1.2% Asian, 0.1% Pacific Islander, 2.2% from other races, and 3.1% from two or more races. Hispanic or Latino of any race were 5.2% of the population.
The median income for a household in the city was $37,917, and the median income for a family was $45,938. Males had a median income of $35,938 versus $25,917 for females. The per capita income for the city was $20,938. About 8.2% of families and 11.2% of the population were below the poverty line, including 15.2% of those under age 18 and 6.2% of those age 65 or over.
Overall, Sequim is a vibrant and diverse community with a rich history, diverse geography, and a strong economy. The city is home to a variety of businesses, attractions, and events, and is a great place to live and work.
Common Questions
What is Per Capita Income in Sequim?
Per Capita income in Sequim is $34,171.
What is the Median Family Income in Sequim?
Median Family Income in Sequim is $68,614.
What is the Median Household income in Sequim?
Median Household Income in Sequim is $48,015.
What is Income or Wage Gap in Sequim?
Income or Wage Gap in Sequim is 42.8%.
Women in Sequim earn 57.2 cents for every dollar earned by a man.
What is Inequality or Gini Index in Sequim?
Inequality or Gini Index in Sequim is 0.48.
What is the Total Population of Sequim?
Total Population of Sequim is 8,073.
What is the Total Male Population of Sequim?
Total Male Population of Sequim is 3,760.
What is the Total Female Population of Sequim?
Total Female Population of Sequim is 4,313.
What is the Ratio of Males per 100 Females in Sequim?
There are 87.18 Males per 100 Females in Sequim.
What is the Ratio of Females per 100 Males in Sequim?
There are 114.71 Females per 100 Males in Sequim.
What is the Median Population Age in Sequim?
Median Population Age in Sequim is 57.1 Years.
What is the Average Family Size in Sequim
Average Family Size in Sequim is 2.6 People.
What is the Average Household Size in Sequim
Average Household Size in Sequim is 1.9 People.
How Large is the Labor Force in Sequim?
There are 2,834 People in the Labor Forcein in Sequim.
What is the Percentage of People in the Labor Force in Sequim?
42.0% of People are in the Labor Force in Sequim.
What is the Unemployment Rate in Sequim?
Unemployment Rate in Sequim is 5.9%.