Central, UT Map & Demographics
Central Map
Central Overview
$34,708
PER CAPITA INCOME
$78,021
AVG FAMILY INCOME
$69,444
AVG HOUSEHOLD INCOME
23.8%
WAGE / INCOME GAP [ % ]
76.2¢/ $1
WAGE / INCOME GAP [ $ ]
0.32
INEQUALITY / GINI INDEX
902
TOTAL POPULATION
518
MALE POPULATION
384
FEMALE POPULATION
134.90
MALES / 100 FEMALES
74.13
FEMALES / 100 MALES
49.4
MEDIAN AGE
2.8
AVG FAMILY SIZE
2.6
AVG HOUSEHOLD SIZE
370
LABOR FORCE [ PEOPLE ]
52.9%
PERCENT IN LABOR FORCE
9.5%
UNEMPLOYMENT RATE
Central Zip Codes
Central Area Codes
Income in Central
Income Overview in Central
Per Capita Income in Central is $34,708, while median incomes of families and households are $78,021 and $69,444 respectively.
| Characteristic | Number | Measure |
| Per Capita Income | 902 | $34,708 |
| Median Family Income | 305 | $78,021 |
| Mean Family Income | 305 | $94,145 |
| Median Household Income | 346 | $69,444 |
| Mean Household Income | 346 | $86,554 |
| Income Deficit | 305 | $0 |
| Wage / Income Gap (%) | 902 | 23.84% |
| Wage / Income Gap ($) | 902 | 76.16¢ per $1 |
| Gini / Inequality Index | 902 | 0.32 |
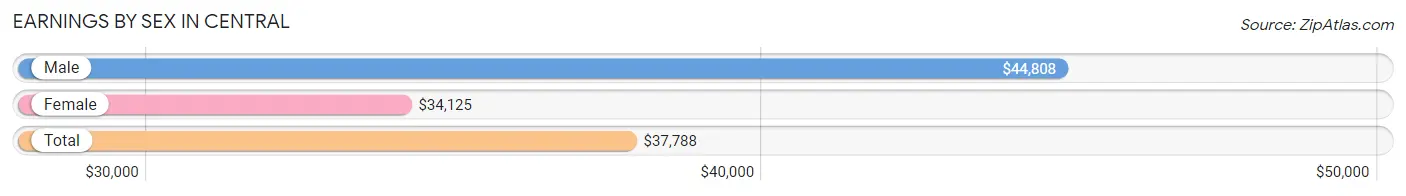
Earnings by Sex in Central
Average Earnings in Central are $37,788, $44,808 for men and $34,125 for women, a difference of 23.8%.
| Sex | Number | Average Earnings |
| Male | 256 (59.4%) | $44,808 |
| Female | 175 (40.6%) | $34,125 |
| Total | 431 (100.0%) | $37,788 |
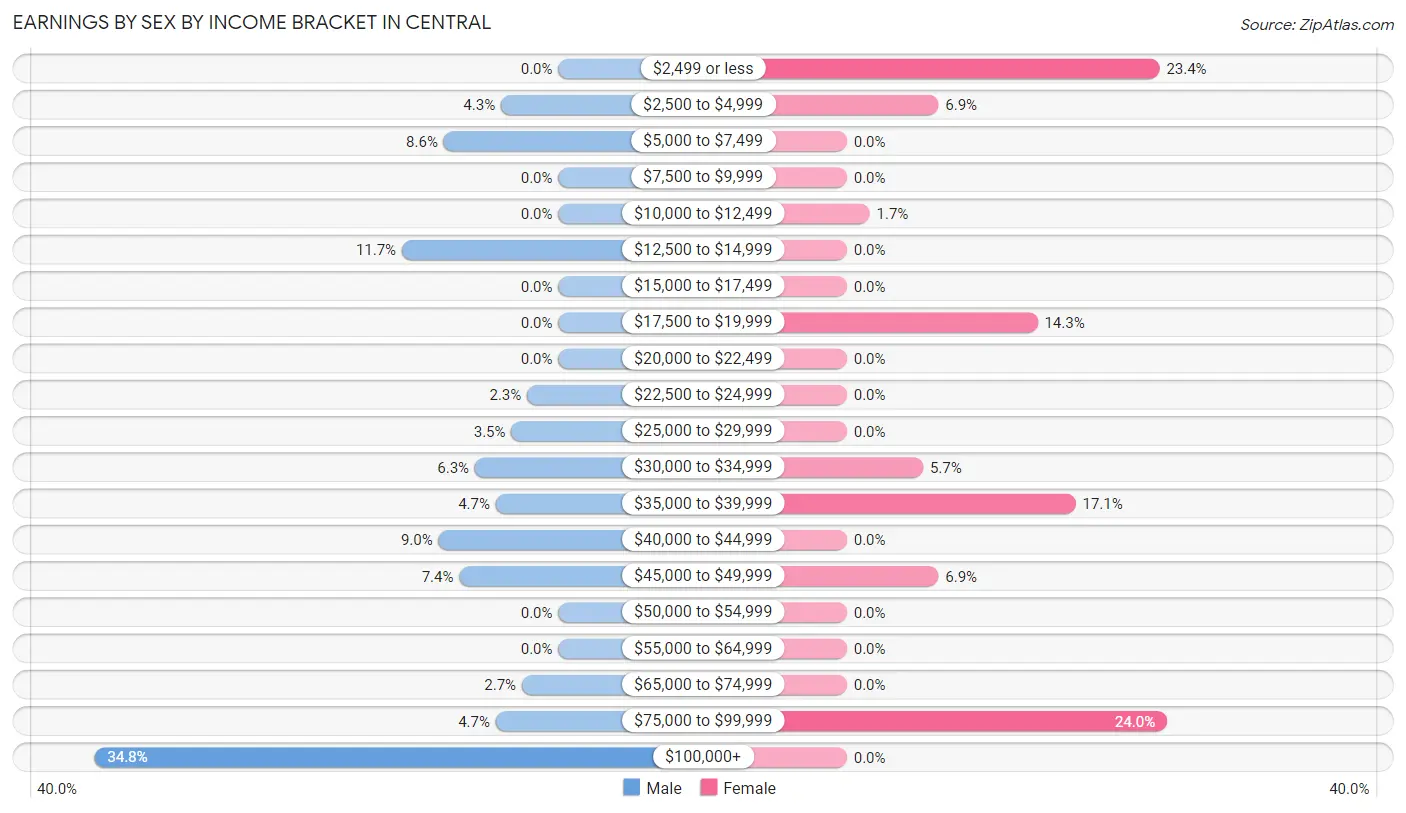
Earnings by Sex by Income Bracket in Central
The most common earnings brackets in Central are $100,000+ for men (89 | 34.8%) and $75,000 to $99,999 for women (42 | 24.0%).
| Income | Male | Female |
| $2,499 or less | 0 (0.0%) | 41 (23.4%) |
| $2,500 to $4,999 | 11 (4.3%) | 12 (6.9%) |
| $5,000 to $7,499 | 22 (8.6%) | 0 (0.0%) |
| $7,500 to $9,999 | 0 (0.0%) | 0 (0.0%) |
| $10,000 to $12,499 | 0 (0.0%) | 3 (1.7%) |
| $12,500 to $14,999 | 30 (11.7%) | 0 (0.0%) |
| $15,000 to $17,499 | 0 (0.0%) | 0 (0.0%) |
| $17,500 to $19,999 | 0 (0.0%) | 25 (14.3%) |
| $20,000 to $22,499 | 0 (0.0%) | 0 (0.0%) |
| $22,500 to $24,999 | 6 (2.3%) | 0 (0.0%) |
| $25,000 to $29,999 | 9 (3.5%) | 0 (0.0%) |
| $30,000 to $34,999 | 16 (6.2%) | 10 (5.7%) |
| $35,000 to $39,999 | 12 (4.7%) | 30 (17.1%) |
| $40,000 to $44,999 | 23 (9.0%) | 0 (0.0%) |
| $45,000 to $49,999 | 19 (7.4%) | 12 (6.9%) |
| $50,000 to $54,999 | 0 (0.0%) | 0 (0.0%) |
| $55,000 to $64,999 | 0 (0.0%) | 0 (0.0%) |
| $65,000 to $74,999 | 7 (2.7%) | 0 (0.0%) |
| $75,000 to $99,999 | 12 (4.7%) | 42 (24.0%) |
| $100,000+ | 89 (34.8%) | 0 (0.0%) |
| Total | 256 (100.0%) | 175 (100.0%) |
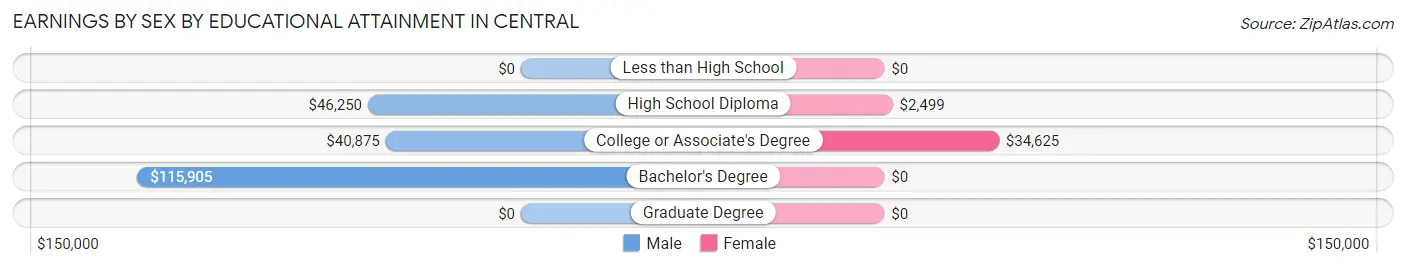
Earnings by Sex by Educational Attainment in Central
| Educational Attainment | Male Income | Female Income |
| Less than High School | - | - |
| High School Diploma | $46,250 | $2,499 |
| College or Associate's Degree | $40,875 | $34,625 |
| Bachelor's Degree | $115,905 | $0 |
| Graduate Degree | - | - |
| Total | - | - |
Family Income in Central
Family Income Brackets in Central
According to the Central family income data, there are 96 families falling into the $100,000 to $149,999 income range, which is the most common income bracket and makes up 31.5% of all families.
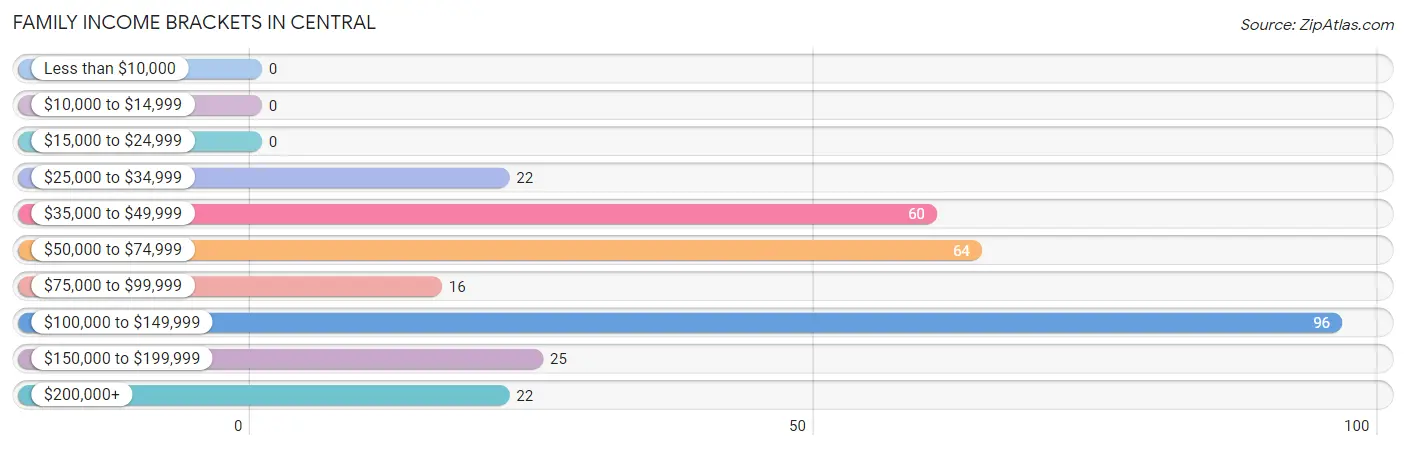
| Income Bracket | # Families | % Families |
| Less than $10,000 | 0 | 0.0% |
| $10,000 to $14,999 | 0 | 0.0% |
| $15,000 to $24,999 | 0 | 0.0% |
| $25,000 to $34,999 | 22 | 7.2% |
| $35,000 to $49,999 | 60 | 19.7% |
| $50,000 to $74,999 | 64 | 21.0% |
| $75,000 to $99,999 | 16 | 5.2% |
| $100,000 to $149,999 | 96 | 31.5% |
| $150,000 to $199,999 | 25 | 8.2% |
| $200,000+ | 22 | 7.2% |
Family Income by Famaliy Size in Central
2-person families (226 | 74.1%) account for the highest median family income in Central with $69,318 per family, while 2-person families (226 | 74.1%) have the highest median income of $34,659 per family member.
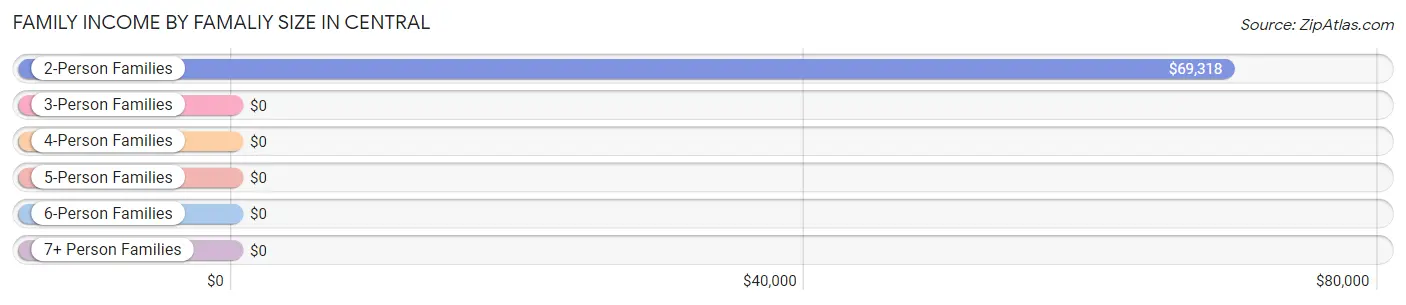
| Income Bracket | # Families | Median Income |
| 2-Person Families | 226 (74.1%) | $69,318 |
| 3-Person Families | 41 (13.4%) | $0 |
| 4-Person Families | 9 (2.9%) | $0 |
| 5-Person Families | 0 (0.0%) | $0 |
| 6-Person Families | 29 (9.5%) | $0 |
| 7+ Person Families | 0 (0.0%) | $0 |
| Total | 305 (100.0%) | $78,021 |
Family Income by Number of Earners in Central
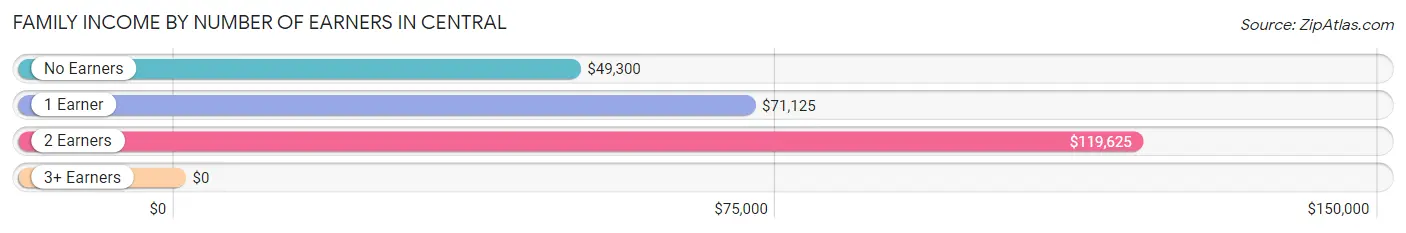
| Number of Earners | # Families | Median Income |
| No Earners | 62 (20.3%) | $49,300 |
| 1 Earner | 145 (47.5%) | $71,125 |
| 2 Earners | 77 (25.3%) | $119,625 |
| 3+ Earners | 21 (6.9%) | $0 |
| Total | 305 (100.0%) | $78,021 |
Household Income in Central
Household Income Brackets in Central
With 96 households falling in the category, the $100,000 to $149,999 income range is the most frequent in Central, accounting for 27.8% of all households.
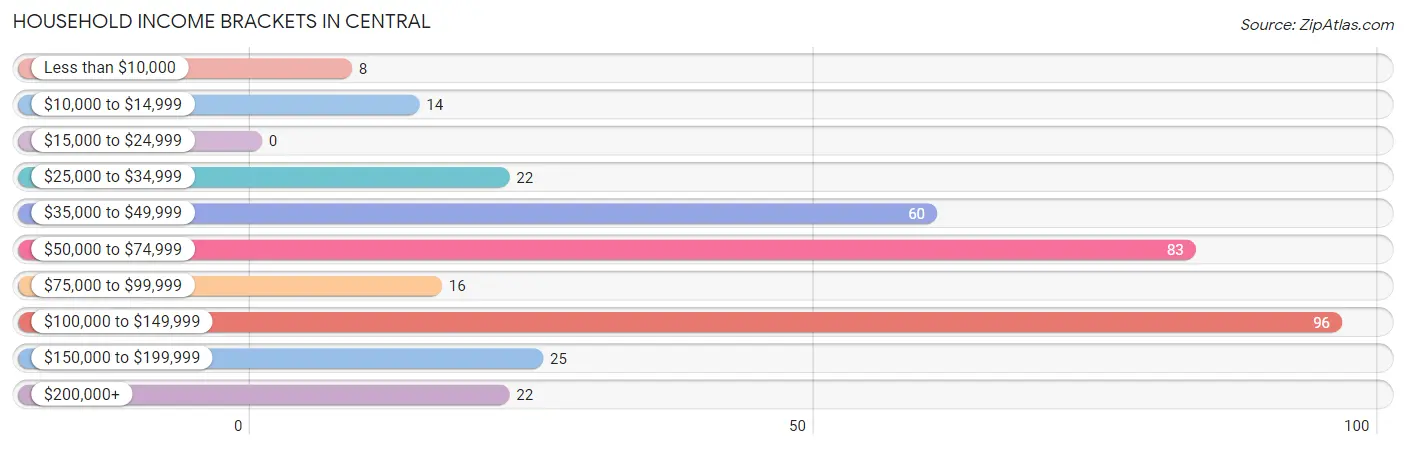
| Income Bracket | # Households | % Households |
| Less than $10,000 | 8 | 2.3% |
| $10,000 to $14,999 | 14 | 4.0% |
| $15,000 to $24,999 | 0 | 0.0% |
| $25,000 to $34,999 | 22 | 6.4% |
| $35,000 to $49,999 | 60 | 17.3% |
| $50,000 to $74,999 | 83 | 24.0% |
| $75,000 to $99,999 | 16 | 4.6% |
| $100,000 to $149,999 | 96 | 27.7% |
| $150,000 to $199,999 | 25 | 7.2% |
| $200,000+ | 22 | 6.4% |
Household Income by Householder Age in Central
The median household income in Central is $69,444, with the highest median household income of $116,681 found in the 25 to 44 years age bracket for the primary householder. A total of 79 households (22.8%) fall into this category. Meanwhile, the 15 to 24 years age bracket for the primary householder has the lowest median household income of $0, with 3 households (0.9%) in this group.
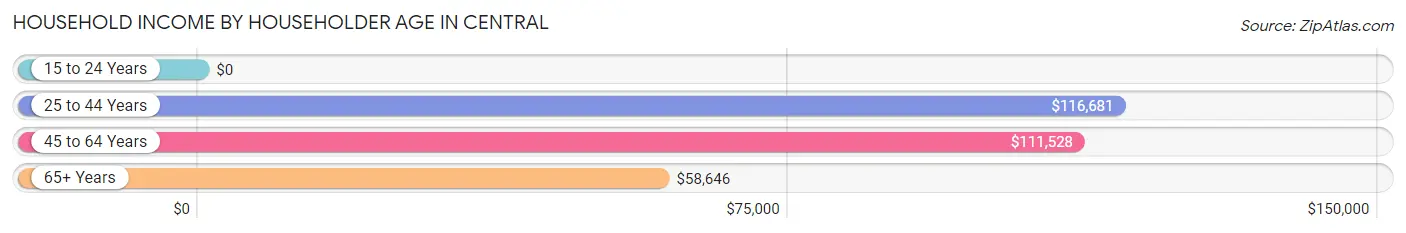
| Income Bracket | # Households | Median Income |
| 15 to 24 Years | 3 (0.9%) | $0 |
| 25 to 44 Years | 79 (22.8%) | $116,681 |
| 45 to 64 Years | 119 (34.4%) | $111,528 |
| 65+ Years | 145 (41.9%) | $58,646 |
| Total | 346 (100.0%) | $69,444 |
Poverty in Central
Income Below Poverty by Sex and Age in Central
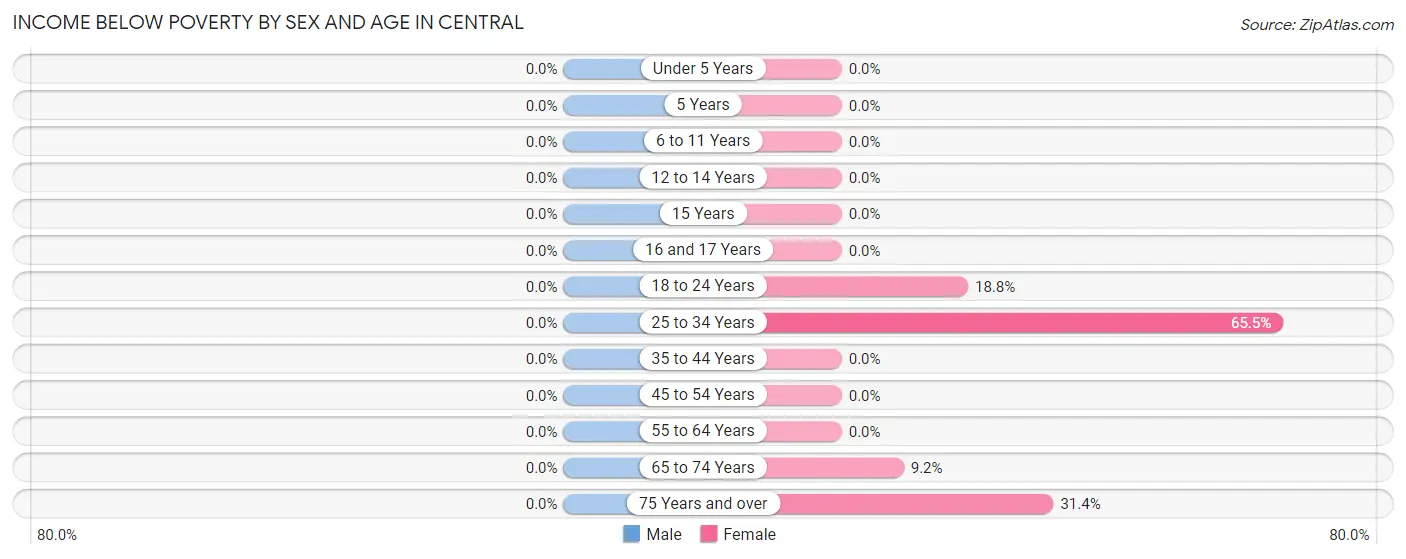
| Age Bracket | Male | Female |
| Under 5 Years | 0 (0.0%) | 0 (0.0%) |
| 5 Years | 0 (0.0%) | 0 (0.0%) |
| 6 to 11 Years | 0 (0.0%) | 0 (0.0%) |
| 12 to 14 Years | 0 (0.0%) | 0 (0.0%) |
| 15 Years | 0 (0.0%) | 0 (0.0%) |
| 16 and 17 Years | 0 (0.0%) | 0 (0.0%) |
| 18 to 24 Years | 0 (0.0%) | 3 (18.8%) |
| 25 to 34 Years | 0 (0.0%) | 19 (65.5%) |
| 35 to 44 Years | 0 (0.0%) | 0 (0.0%) |
| 45 to 54 Years | 0 (0.0%) | 0 (0.0%) |
| 55 to 64 Years | 0 (0.0%) | 0 (0.0%) |
| 65 to 74 Years | 0 (0.0%) | 8 (9.2%) |
| 75 Years and over | 0 (0.0%) | 11 (31.4%) |
| Total | 0 (0.0%) | 41 (10.7%) |
Income Above Poverty by Sex and Age in Central
According to the poverty statistics in Central, males aged under 5 years and females aged 12 to 14 years are the age groups that are most secure financially, with 100.0% of males and 100.0% of females in these age groups living above the poverty line.
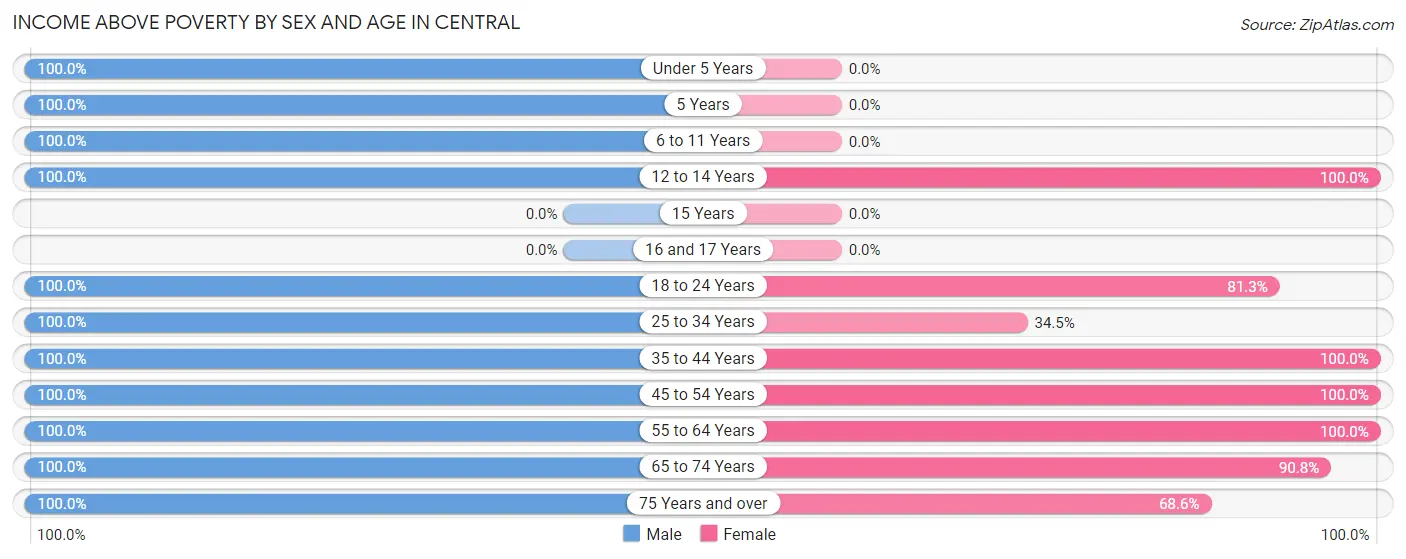
| Age Bracket | Male | Female |
| Under 5 Years | 70 (100.0%) | 0 (0.0%) |
| 5 Years | 27 (100.0%) | 0 (0.0%) |
| 6 to 11 Years | 60 (100.0%) | 0 (0.0%) |
| 12 to 14 Years | 6 (100.0%) | 40 (100.0%) |
| 15 Years | 0 (0.0%) | 0 (0.0%) |
| 16 and 17 Years | 0 (0.0%) | 0 (0.0%) |
| 18 to 24 Years | 22 (100.0%) | 13 (81.2%) |
| 25 to 34 Years | 13 (100.0%) | 10 (34.5%) |
| 35 to 44 Years | 66 (100.0%) | 66 (100.0%) |
| 45 to 54 Years | 55 (100.0%) | 39 (100.0%) |
| 55 to 64 Years | 69 (100.0%) | 72 (100.0%) |
| 65 to 74 Years | 58 (100.0%) | 79 (90.8%) |
| 75 Years and over | 72 (100.0%) | 24 (68.6%) |
| Total | 518 (100.0%) | 343 (89.3%) |
Income Below Poverty Among Married-Couple Families in Central
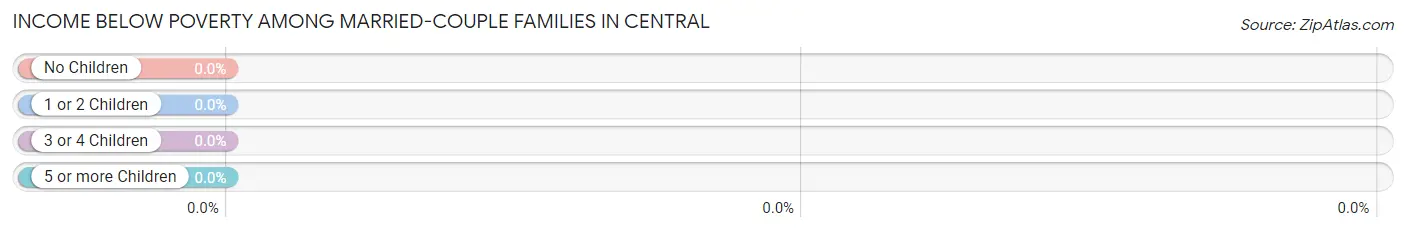
| Children | Above Poverty | Below Poverty |
| No Children | 219 (100.0%) | 0 (0.0%) |
| 1 or 2 Children | 9 (100.0%) | 0 (0.0%) |
| 3 or 4 Children | 29 (100.0%) | 0 (0.0%) |
| 5 or more Children | 0 (0.0%) | 0 (0.0%) |
| Total | 257 (100.0%) | 0 (0.0%) |
Income Below Poverty Among Single-Parent Households in Central
| Children | Single Father | Single Mother |
| No Children | 0 (0.0%) | 0 (0.0%) |
| 1 or 2 Children | 0 (0.0%) | 0 (0.0%) |
| 3 or 4 Children | 0 (0.0%) | 0 (0.0%) |
| 5 or more Children | 0 (0.0%) | 0 (0.0%) |
| Total | 0 (0.0%) | 0 (0.0%) |
Income Below Poverty Among Married-Couple vs Single-Parent Households in Central
| Children | Married-Couple Families | Single-Parent Households |
| No Children | 0 (0.0%) | 0 (0.0%) |
| 1 or 2 Children | 0 (0.0%) | 0 (0.0%) |
| 3 or 4 Children | 0 (0.0%) | 0 (0.0%) |
| 5 or more Children | 0 (0.0%) | 0 (0.0%) |
| Total | 0 (0.0%) | 0 (0.0%) |
Race in Central
The most populous races in Central are , and White / Caucasian (902 | 100.0%).
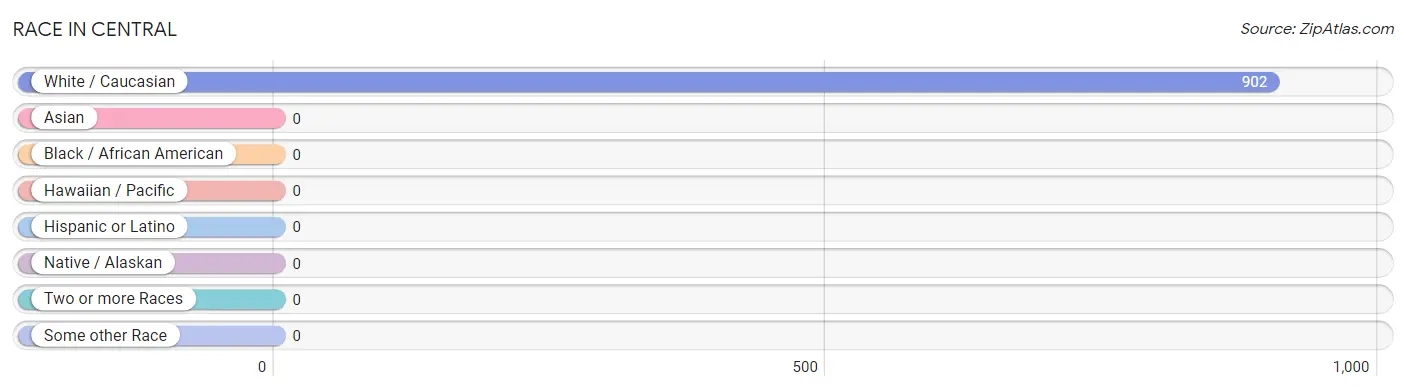
| Race | # Population | % Population |
| Asian | 0 | 0.0% |
| Black / African American | 0 | 0.0% |
| Hawaiian / Pacific | 0 | 0.0% |
| Hispanic or Latino | 0 | 0.0% |
| Native / Alaskan | 0 | 0.0% |
| White / Caucasian | 902 | 100.0% |
| Two or more Races | 0 | 0.0% |
| Some other Race | 0 | 0.0% |
| Total | 902 | 100.0% |
Ancestry in Central
The most populous ancestries reported in Central are English (414 | 45.9%), Irish (123 | 13.6%), German (115 | 12.8%), Northern European (42 | 4.7%), and Scottish (41 | 4.5%), together accounting for 81.5% of all Central residents.
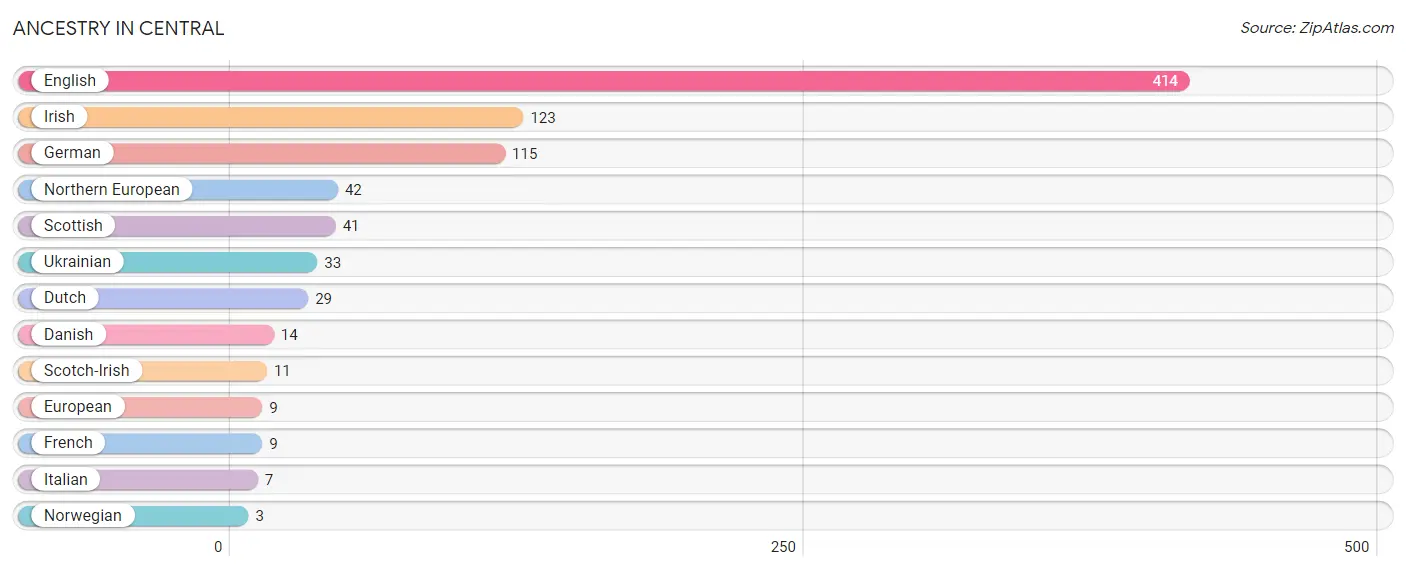
| Ancestry | # Population | % Population |
| Danish | 14 | 1.5% |
| Dutch | 29 | 3.2% |
| English | 414 | 45.9% |
| European | 9 | 1.0% |
| French | 9 | 1.0% |
| German | 115 | 12.8% |
| Irish | 123 | 13.6% |
| Italian | 7 | 0.8% |
| Northern European | 42 | 4.7% |
| Norwegian | 3 | 0.3% |
| Scotch-Irish | 11 | 1.2% |
| Scottish | 41 | 4.5% |
| Ukrainian | 33 | 3.7% | View All 13 Rows |
Immigrants in Central

| Immigration Origin | # Population | % Population | View All 0 Rows |
Sex and Age in Central
Sex and Age in Central
The most populous age groups in Central are Under 5 Years (70 | 13.5%) for men and 70 to 74 Years (60 | 15.6%) for women.
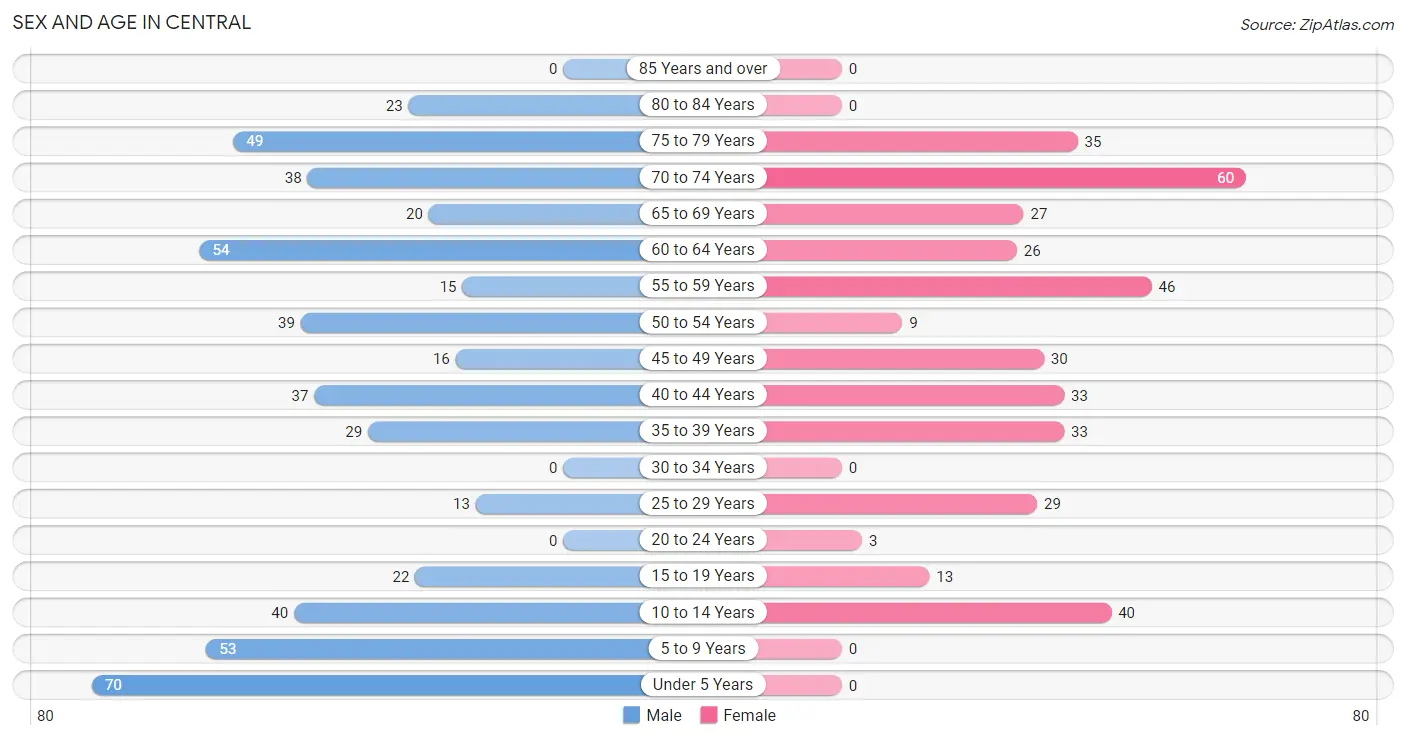
| Age Bracket | Male | Female |
| Under 5 Years | 70 (13.5%) | 0 (0.0%) |
| 5 to 9 Years | 53 (10.2%) | 0 (0.0%) |
| 10 to 14 Years | 40 (7.7%) | 40 (10.4%) |
| 15 to 19 Years | 22 (4.3%) | 13 (3.4%) |
| 20 to 24 Years | 0 (0.0%) | 3 (0.8%) |
| 25 to 29 Years | 13 (2.5%) | 29 (7.5%) |
| 30 to 34 Years | 0 (0.0%) | 0 (0.0%) |
| 35 to 39 Years | 29 (5.6%) | 33 (8.6%) |
| 40 to 44 Years | 37 (7.1%) | 33 (8.6%) |
| 45 to 49 Years | 16 (3.1%) | 30 (7.8%) |
| 50 to 54 Years | 39 (7.5%) | 9 (2.3%) |
| 55 to 59 Years | 15 (2.9%) | 46 (12.0%) |
| 60 to 64 Years | 54 (10.4%) | 26 (6.8%) |
| 65 to 69 Years | 20 (3.9%) | 27 (7.0%) |
| 70 to 74 Years | 38 (7.3%) | 60 (15.6%) |
| 75 to 79 Years | 49 (9.5%) | 35 (9.1%) |
| 80 to 84 Years | 23 (4.4%) | 0 (0.0%) |
| 85 Years and over | 0 (0.0%) | 0 (0.0%) |
| Total | 518 (100.0%) | 384 (100.0%) |
Families and Households in Central
Median Family Size in Central
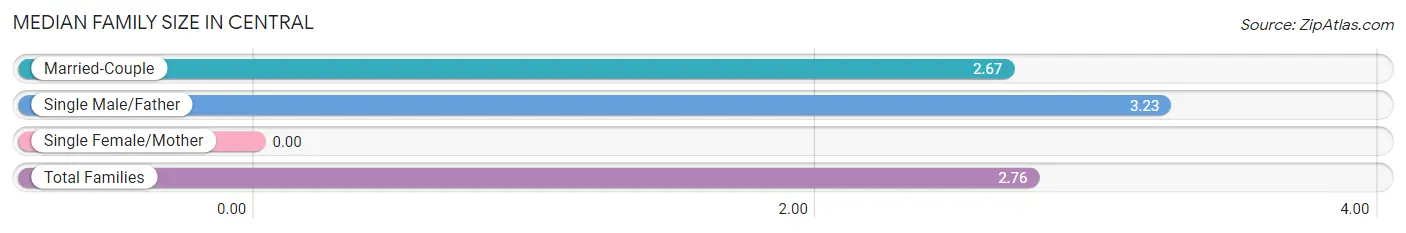
| Family Type | # Families | Family Size |
| Married-Couple | 257 (84.3%) | 2.67 |
| Single Male/Father | 48 (15.7%) | 3.23 |
| Single Female/Mother | 0 (0.0%) | - |
| Total Families | 305 (100.0%) | 2.76 |
Median Household Size in Central
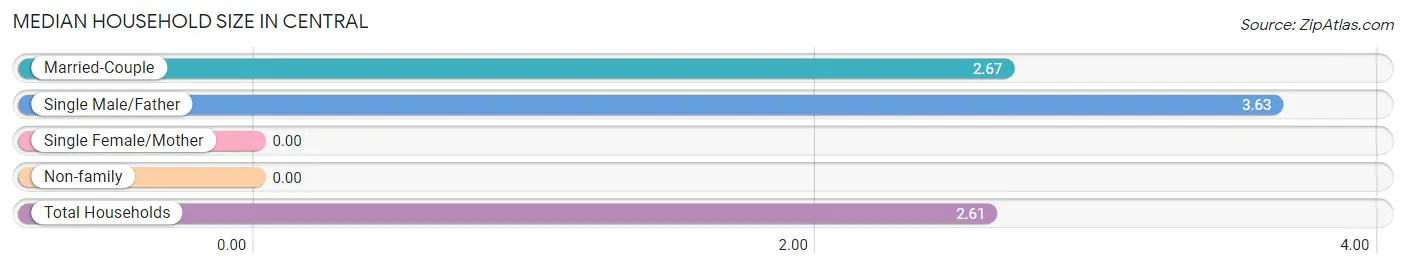
| Household Type | # Households | Household Size |
| Married-Couple | 257 (74.3%) | 2.67 |
| Single Male/Father | 48 (13.9%) | 3.63 |
| Single Female/Mother | 0 (0.0%) | - |
| Non-family | 41 (11.8%) | - |
| Total Households | 346 (100.0%) | 2.61 |
Household Size by Marriage Status in Central
Out of a total of 346 households in Central, 305 (88.1%) are family households, while 41 (11.8%) are nonfamily households. The most numerous type of family households are 2-person households, comprising 226, and the most common type of nonfamily households are 1-person households, comprising 41.
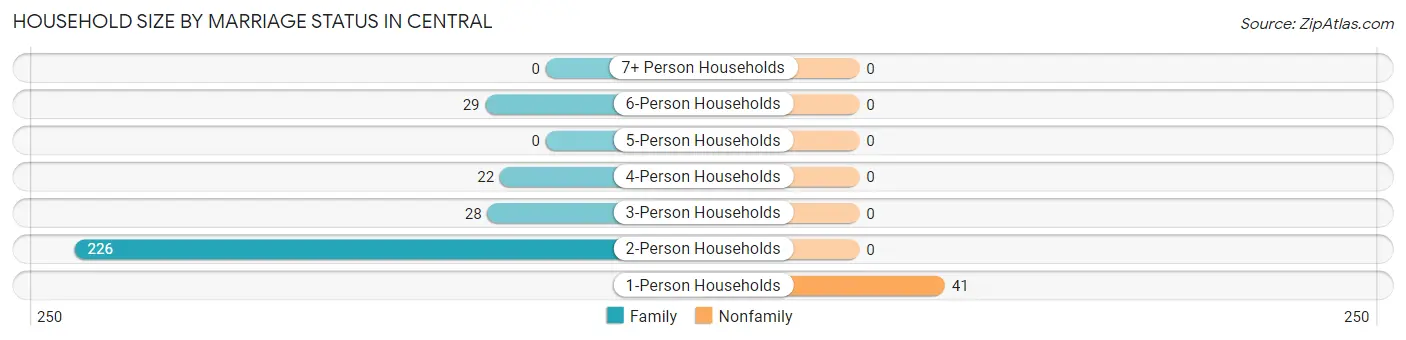
| Household Size | Family Households | Nonfamily Households |
| 1-Person Households | - | 41 (11.8%) |
| 2-Person Households | 226 (65.3%) | 0 (0.0%) |
| 3-Person Households | 28 (8.1%) | 0 (0.0%) |
| 4-Person Households | 22 (6.4%) | 0 (0.0%) |
| 5-Person Households | 0 (0.0%) | 0 (0.0%) |
| 6-Person Households | 29 (8.4%) | 0 (0.0%) |
| 7+ Person Households | 0 (0.0%) | 0 (0.0%) |
| Total | 305 (88.1%) | 41 (11.8%) |
Female Fertility in Central
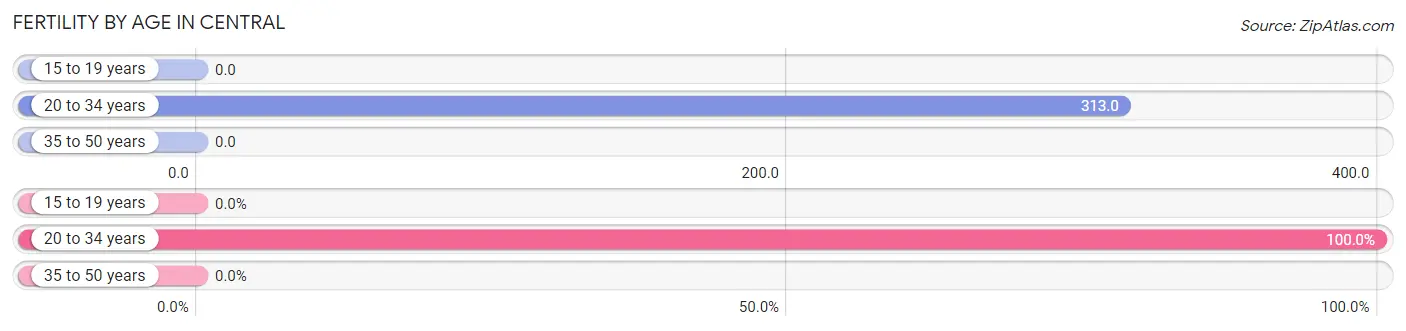
Fertility by Age in Central
Average fertility rate in Central is 71.0 births per 1,000 women. Women in the age bracket of 20 to 34 years have the highest fertility rate with 313.0 births per 1,000 women. Women in the age bracket of 20 to 34 years acount for 100.0% of all women with births.
| Age Bracket | Women with Births | Births / 1,000 Women |
| 15 to 19 years | 0 (0.0%) | 0.0 |
| 20 to 34 years | 10 (100.0%) | 313.0 |
| 35 to 50 years | 0 (0.0%) | 0.0 |
| Total | 10 (100.0%) | 71.0 |
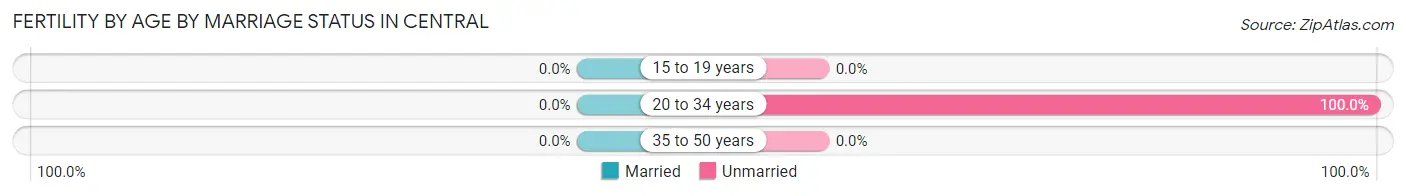
Fertility by Age by Marriage Status in Central
| Age Bracket | Married | Unmarried |
| 15 to 19 years | 0 (0.0%) | 0 (0.0%) |
| 20 to 34 years | 0 (0.0%) | 10 (100.0%) |
| 35 to 50 years | 0 (0.0%) | 0 (0.0%) |
| Total | 0 (0.0%) | 10 (100.0%) |
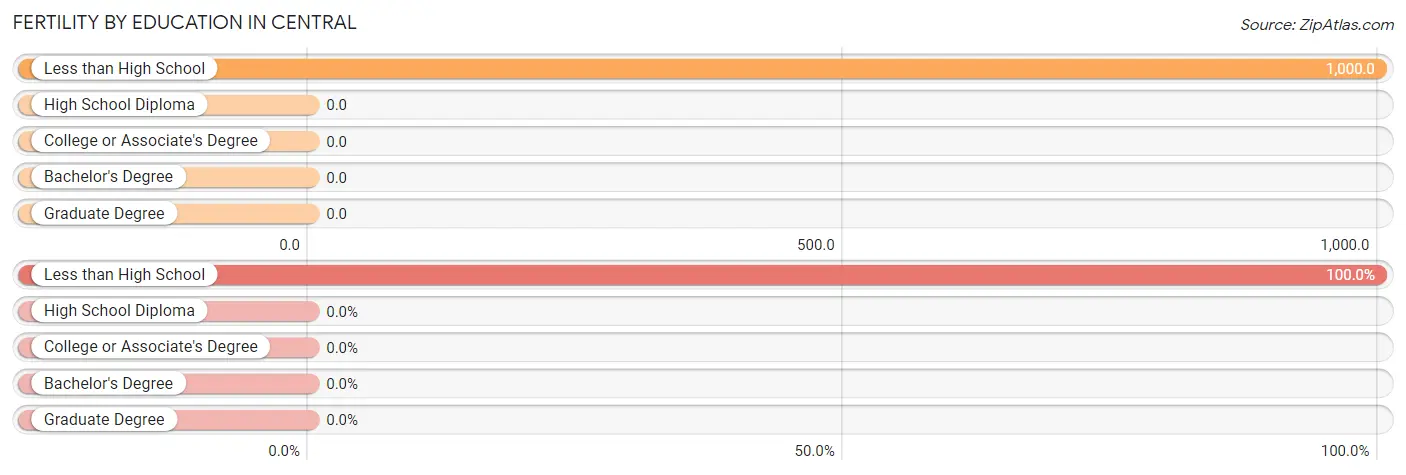
Fertility by Education in Central
| Educational Attainment | Women with Births | Births / 1,000 Women |
| Less than High School | 10 (100.0%) | 1,000.0 |
| High School Diploma | 0 (0.0%) | 0.0 |
| College or Associate's Degree | 0 (0.0%) | 0.0 |
| Bachelor's Degree | 0 (0.0%) | 0.0 |
| Graduate Degree | 0 (0.0%) | 0.0 |
| Total | 10 (100.0%) | 71.0 |
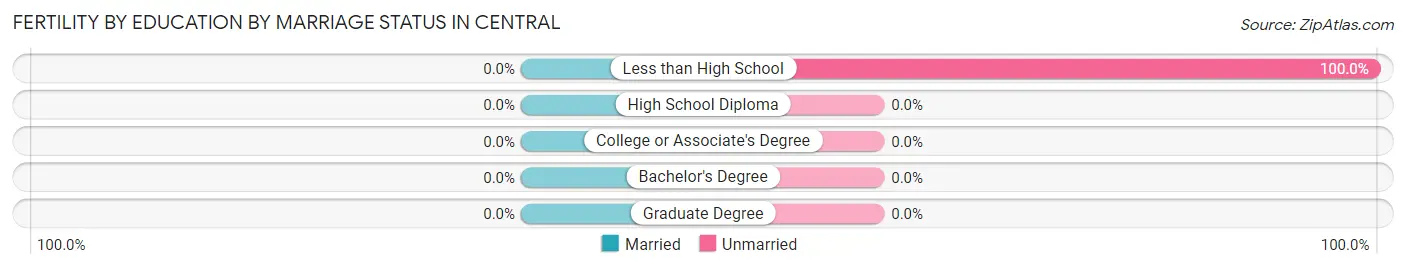
Fertility by Education by Marriage Status in Central
| Educational Attainment | Married | Unmarried |
| Less than High School | 0 (0.0%) | 10 (100.0%) |
| High School Diploma | 0 (0.0%) | 0 (0.0%) |
| College or Associate's Degree | 0 (0.0%) | 0 (0.0%) |
| Bachelor's Degree | 0 (0.0%) | 0 (0.0%) |
| Graduate Degree | 0 (0.0%) | 0 (0.0%) |
| Total | 0 (0.0%) | 10 (100.0%) |
Employment Characteristics in Central
Employment by Class of Employer in Central
Among the 335 employed individuals in Central, private company employees (224 | 66.9%), state government employees (42 | 12.5%), and not-for-profit organizations (29 | 8.7%) make up the most common classes of employment.
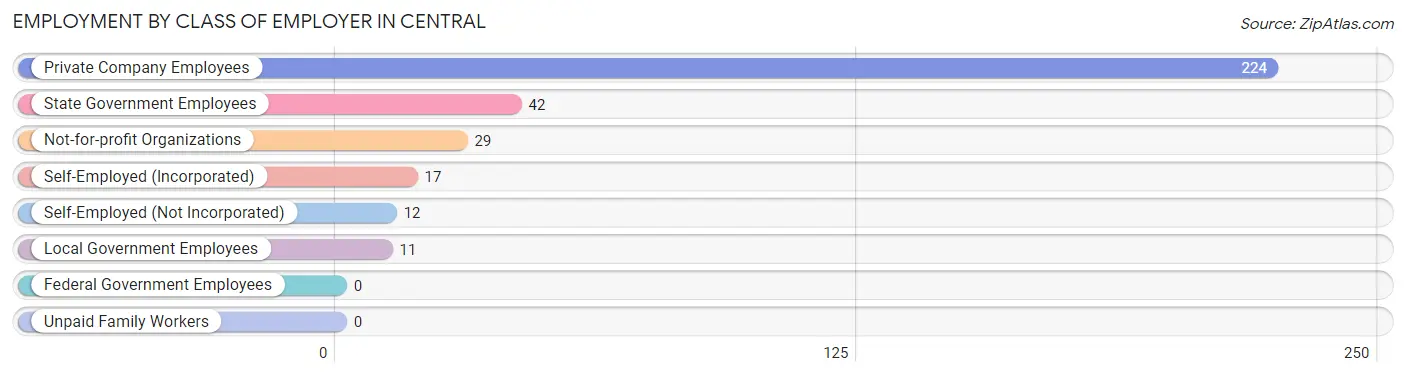
| Employer Class | # Employees | % Employees |
| Private Company Employees | 224 | 66.9% |
| Self-Employed (Incorporated) | 17 | 5.1% |
| Self-Employed (Not Incorporated) | 12 | 3.6% |
| Not-for-profit Organizations | 29 | 8.7% |
| Local Government Employees | 11 | 3.3% |
| State Government Employees | 42 | 12.5% |
| Federal Government Employees | 0 | 0.0% |
| Unpaid Family Workers | 0 | 0.0% |
| Total | 335 | 100.0% |
Employment Status by Age in Central
According to the labor force statistics for Central, out of the total population over 16 years of age (699), 52.9% or 370 individuals are in the labor force, with 9.5% or 35 of them unemployed. The age group with the highest labor force participation rate is 16 to 19 years, with 100.0% or 35 individuals in the labor force. Within the labor force, the 16 to 19 years age range has the highest percentage of unemployed individuals, with 62.9% or 22 of them being unemployed.
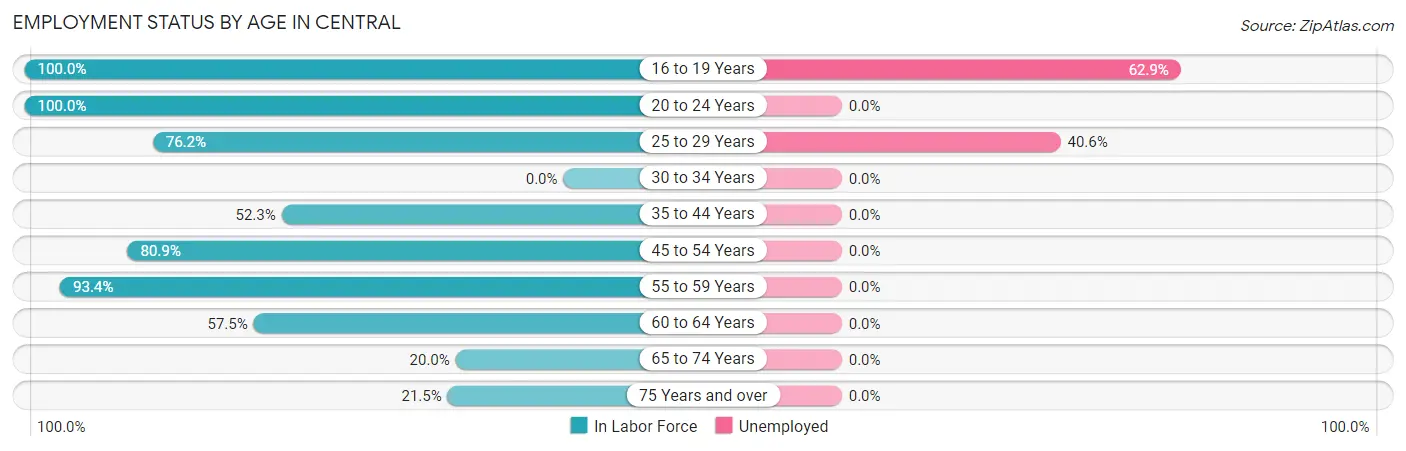
| Age Bracket | In Labor Force | Unemployed |
| 16 to 19 Years | 35 (100.0%) | 22 (62.9%) |
| 20 to 24 Years | 3 (100.0%) | 0 (0.0%) |
| 25 to 29 Years | 32 (76.2%) | 13 (40.6%) |
| 30 to 34 Years | 0 (0.0%) | 0 (0.0%) |
| 35 to 44 Years | 69 (52.3%) | 0 (0.0%) |
| 45 to 54 Years | 76 (80.9%) | 0 (0.0%) |
| 55 to 59 Years | 57 (93.4%) | 0 (0.0%) |
| 60 to 64 Years | 46 (57.5%) | 0 (0.0%) |
| 65 to 74 Years | 29 (20.0%) | 0 (0.0%) |
| 75 Years and over | 23 (21.5%) | 0 (0.0%) |
| Total | 370 (52.9%) | 35 (9.5%) |
Employment Status by Educational Attainment in Central
According to labor force statistics for Central, 68.5% of individuals (280) out of the total population between 25 and 64 years of age (409) are in the labor force, with 4.6% or 13 of them being unemployed. The group with the highest labor force participation rate are those with the educational attainment of college / associate degree, with 79.2% or 95 individuals in the labor force. Within the labor force, individuals with high school diploma education have the highest percentage of unemployment, with 24.5% or 13 of them being unemployed.
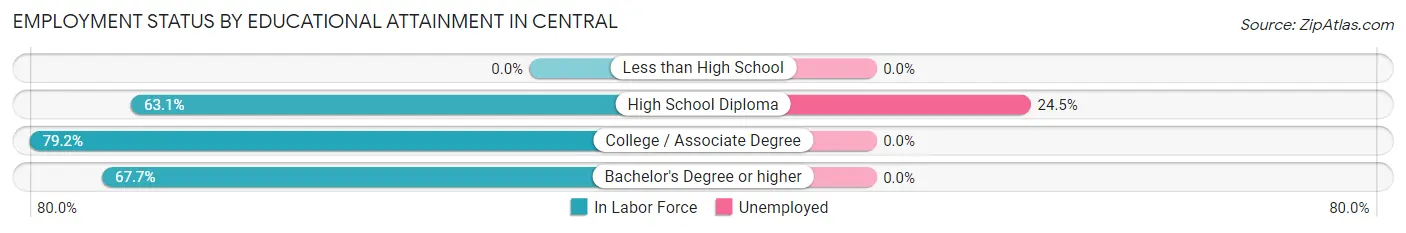
| Educational Attainment | In Labor Force | Unemployed |
| Less than High School | 0 (0.0%) | 0 (0.0%) |
| High School Diploma | 53 (63.1%) | 21 (24.5%) |
| College / Associate Degree | 95 (79.2%) | 0 (0.0%) |
| Bachelor's Degree or higher | 132 (67.7%) | 0 (0.0%) |
| Total | 280 (68.5%) | 19 (4.6%) |
Employment Occupations by Sex in Central
Management, Business, Science and Arts Occupations
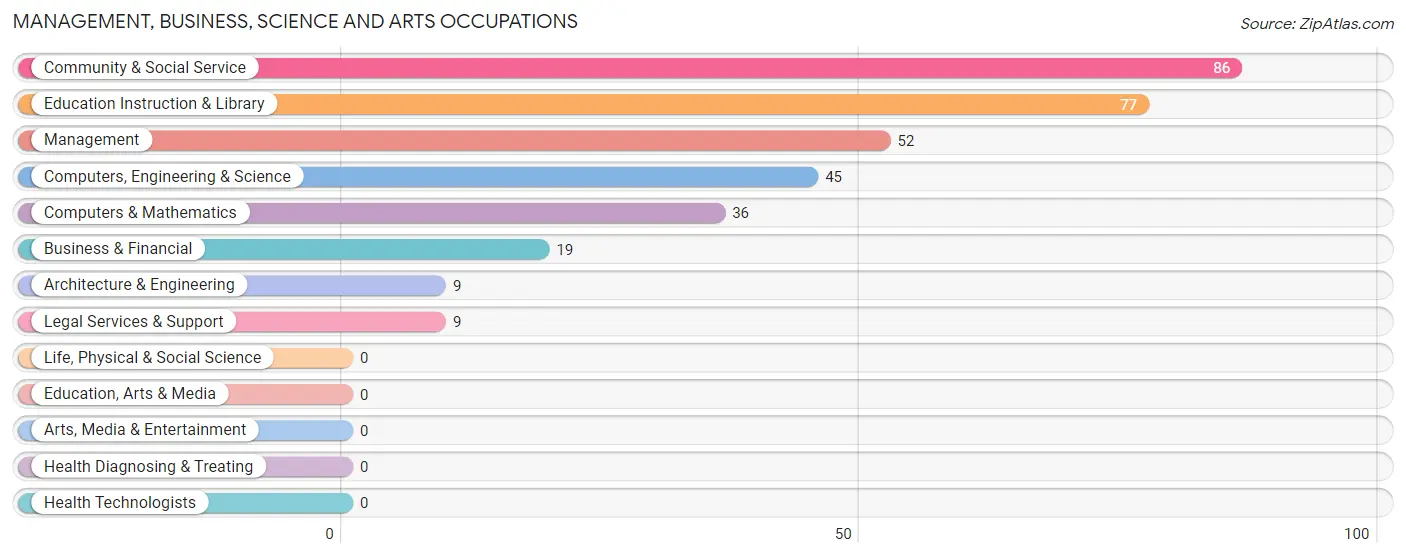
The most common Management, Business, Science and Arts occupations in Central are Community & Social Service (86 | 25.7%), Education Instruction & Library (77 | 23.0%), Management (52 | 15.5%), Computers, Engineering & Science (45 | 13.4%), and Computers & Mathematics (36 | 10.7%).
Management, Business, Science and Arts Occupations by Sex
Within the Management, Business, Science and Arts occupations in Central, the most male-oriented occupations are Management (100.0%), Computers, Engineering & Science (100.0%), and Computers & Mathematics (100.0%), while the most female-oriented occupations are Community & Social Service (100.0%), Legal Services & Support (100.0%), and Education Instruction & Library (100.0%).
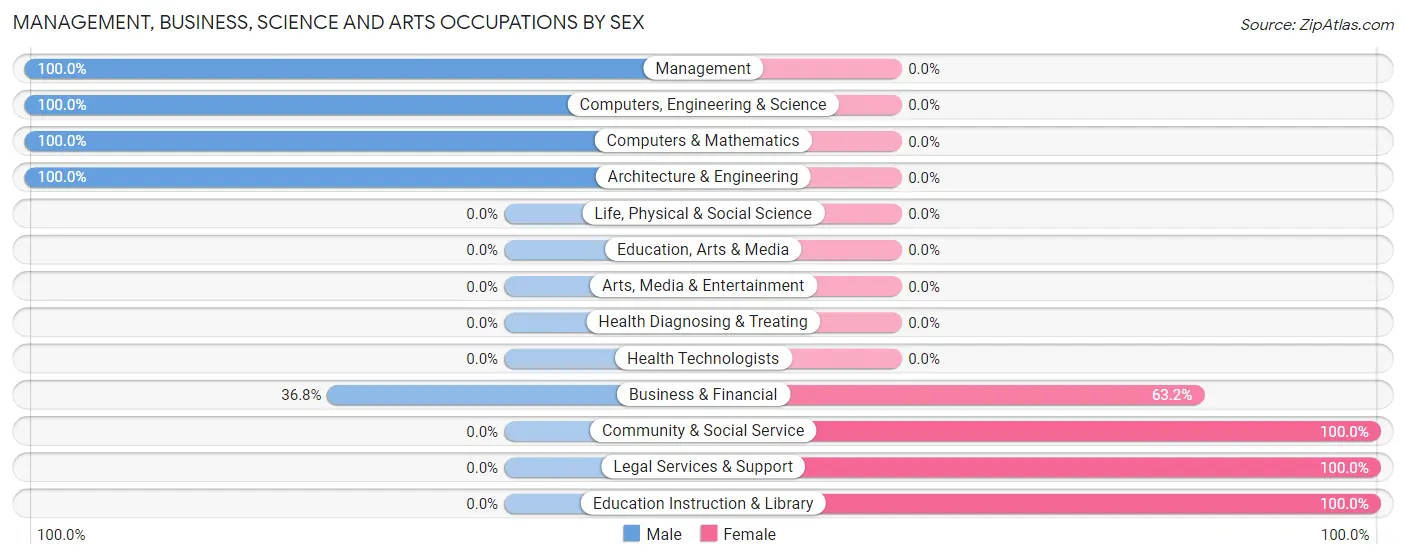
| Occupation | Male | Female |
| Management | 52 (100.0%) | 0 (0.0%) |
| Business & Financial | 7 (36.8%) | 12 (63.2%) |
| Computers, Engineering & Science | 45 (100.0%) | 0 (0.0%) |
| Computers & Mathematics | 36 (100.0%) | 0 (0.0%) |
| Architecture & Engineering | 9 (100.0%) | 0 (0.0%) |
| Life, Physical & Social Science | 0 (0.0%) | 0 (0.0%) |
| Community & Social Service | 0 (0.0%) | 86 (100.0%) |
| Education, Arts & Media | 0 (0.0%) | 0 (0.0%) |
| Legal Services & Support | 0 (0.0%) | 9 (100.0%) |
| Education Instruction & Library | 0 (0.0%) | 77 (100.0%) |
| Arts, Media & Entertainment | 0 (0.0%) | 0 (0.0%) |
| Health Diagnosing & Treating | 0 (0.0%) | 0 (0.0%) |
| Health Technologists | 0 (0.0%) | 0 (0.0%) |
| Total (Category) | 104 (51.5%) | 98 (48.5%) |
| Total (Overall) | 175 (52.2%) | 160 (47.8%) |
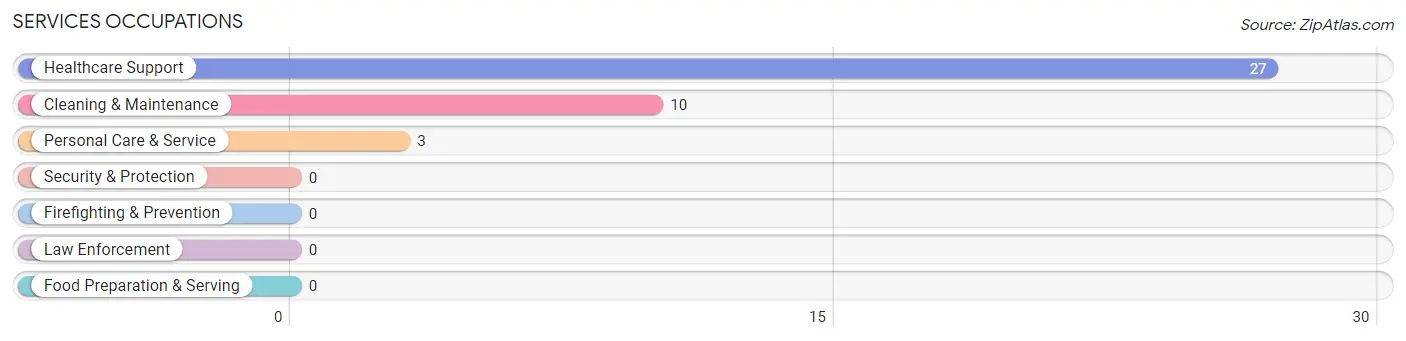
Services Occupations
The most common Services occupations in Central are Healthcare Support (27 | 8.1%), Cleaning & Maintenance (10 | 3.0%), and Personal Care & Service (3 | 0.9%).
Services Occupations by Sex
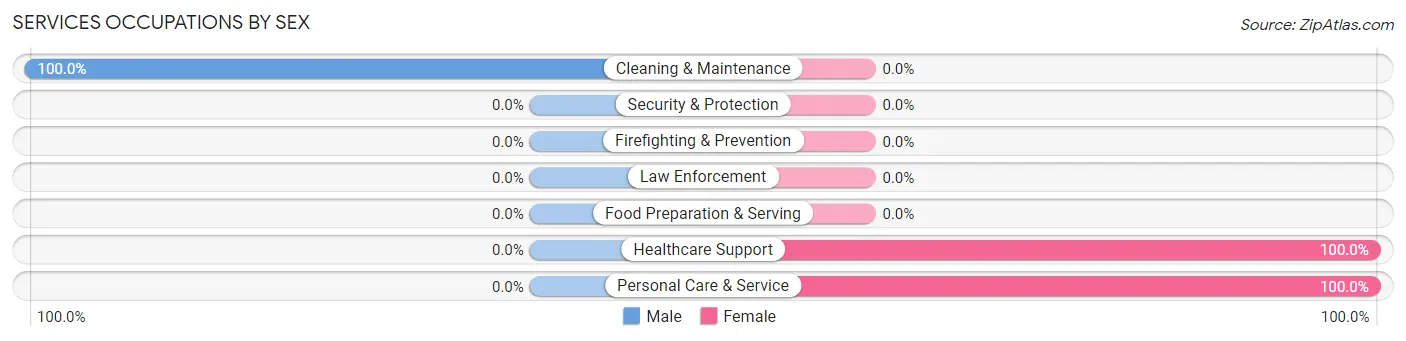
| Occupation | Male | Female |
| Healthcare Support | 0 (0.0%) | 27 (100.0%) |
| Security & Protection | 0 (0.0%) | 0 (0.0%) |
| Firefighting & Prevention | 0 (0.0%) | 0 (0.0%) |
| Law Enforcement | 0 (0.0%) | 0 (0.0%) |
| Food Preparation & Serving | 0 (0.0%) | 0 (0.0%) |
| Cleaning & Maintenance | 10 (100.0%) | 0 (0.0%) |
| Personal Care & Service | 0 (0.0%) | 3 (100.0%) |
| Total (Category) | 10 (25.0%) | 30 (75.0%) |
| Total (Overall) | 175 (52.2%) | 160 (47.8%) |
Sales and Office Occupations
The most common Sales and Office occupations in Central are Sales & Related (38 | 11.3%), and Office & Administration (19 | 5.7%).
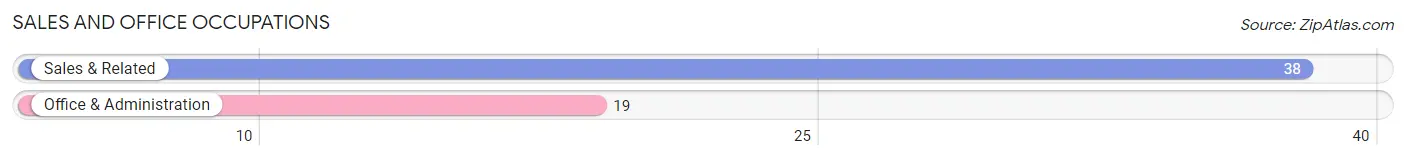
Sales and Office Occupations by Sex
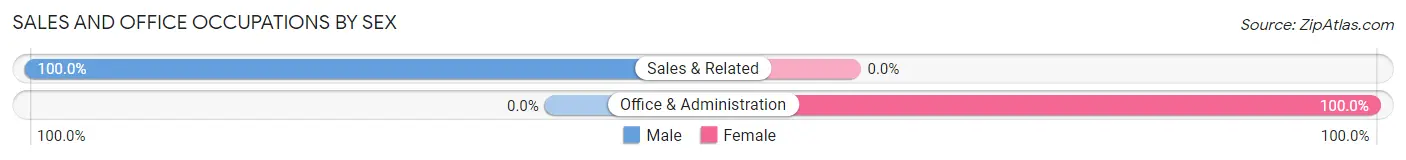
| Occupation | Male | Female |
| Sales & Related | 38 (100.0%) | 0 (0.0%) |
| Office & Administration | 0 (0.0%) | 19 (100.0%) |
| Total (Category) | 38 (66.7%) | 19 (33.3%) |
| Total (Overall) | 175 (52.2%) | 160 (47.8%) |
Natural Resources, Construction and Maintenance Occupations
The most common Natural Resources, Construction and Maintenance occupations in Central are , and Installation, Maintenance & Repair (5 | 1.5%).
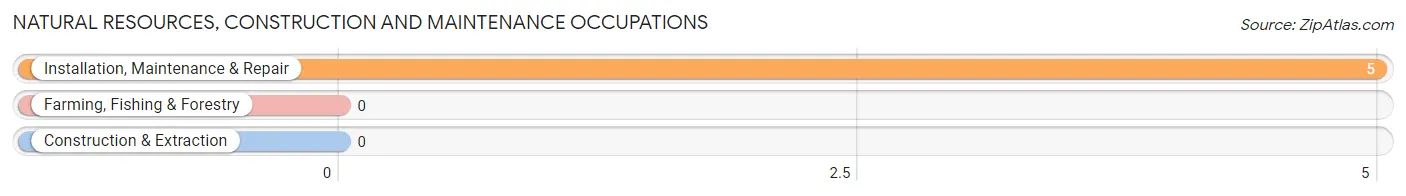
Natural Resources, Construction and Maintenance Occupations by Sex
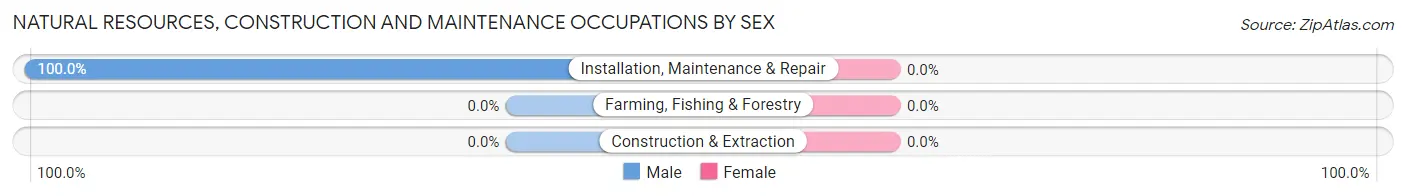
| Occupation | Male | Female |
| Farming, Fishing & Forestry | 0 (0.0%) | 0 (0.0%) |
| Construction & Extraction | 0 (0.0%) | 0 (0.0%) |
| Installation, Maintenance & Repair | 5 (100.0%) | 0 (0.0%) |
| Total (Category) | 5 (100.0%) | 0 (0.0%) |
| Total (Overall) | 175 (52.2%) | 160 (47.8%) |
Production, Transportation and Moving Occupations
The most common Production, Transportation and Moving occupations in Central are Material Moving (18 | 5.4%), and Production (13 | 3.9%).
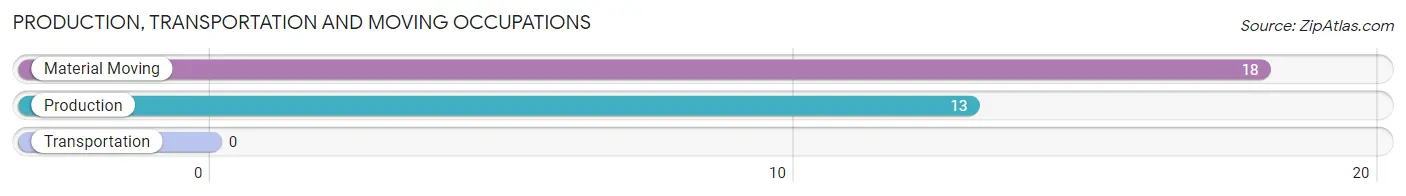
Production, Transportation and Moving Occupations by Sex
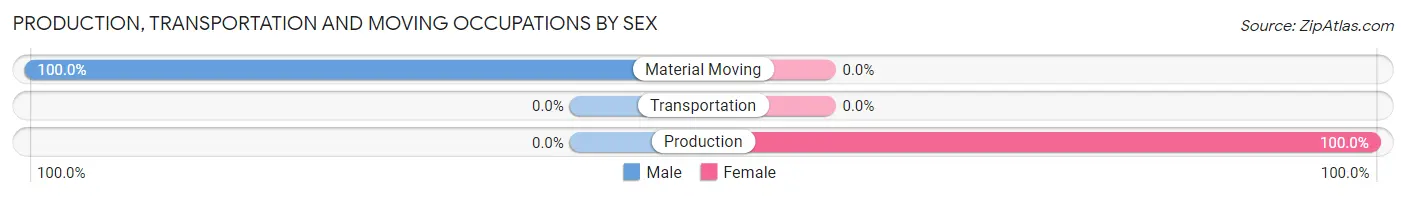
| Occupation | Male | Female |
| Production | 0 (0.0%) | 13 (100.0%) |
| Transportation | 0 (0.0%) | 0 (0.0%) |
| Material Moving | 18 (100.0%) | 0 (0.0%) |
| Total (Category) | 18 (58.1%) | 13 (41.9%) |
| Total (Overall) | 175 (52.2%) | 160 (47.8%) |
Employment Industries by Sex in Central
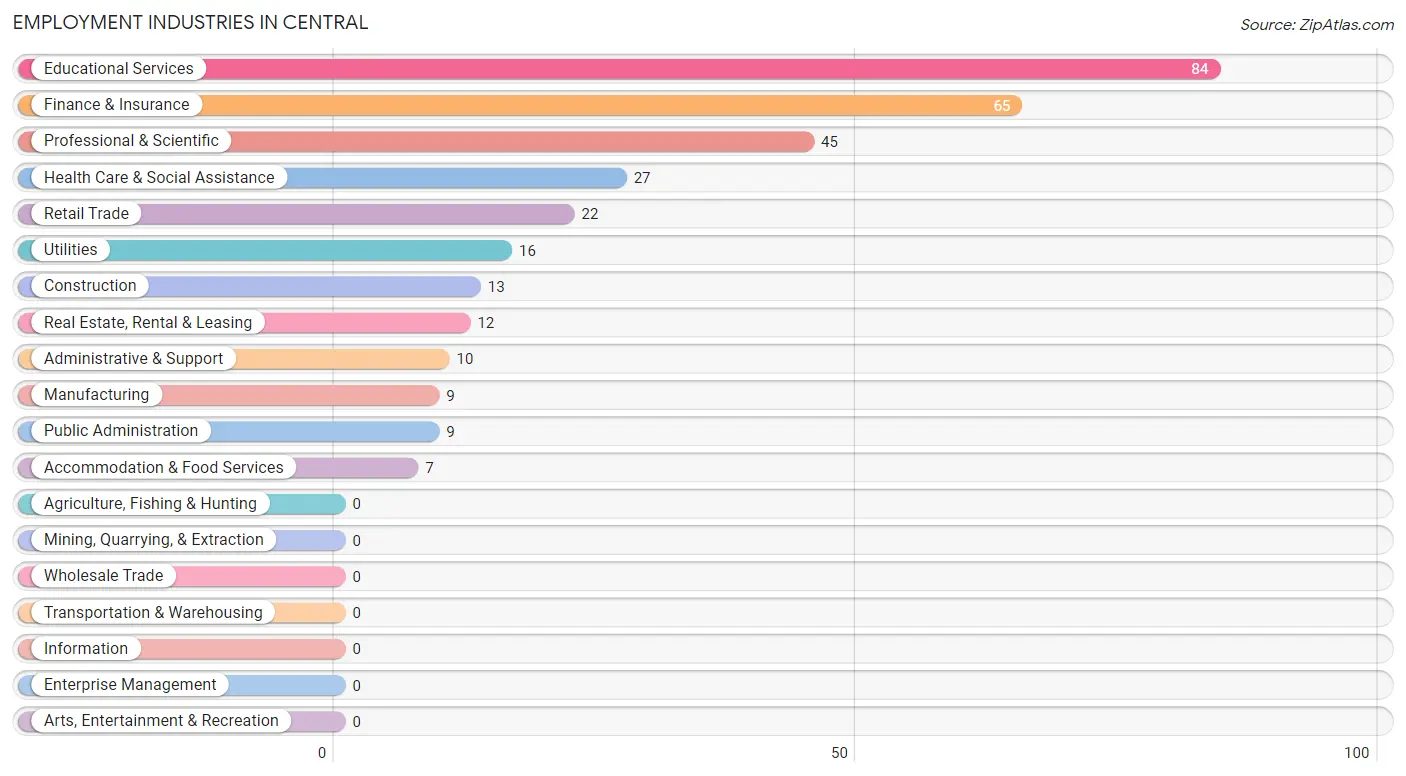
Employment Industries in Central
The major employment industries in Central include Educational Services (84 | 25.1%), Finance & Insurance (65 | 19.4%), Professional & Scientific (45 | 13.4%), Health Care & Social Assistance (27 | 8.1%), and Retail Trade (22 | 6.6%).
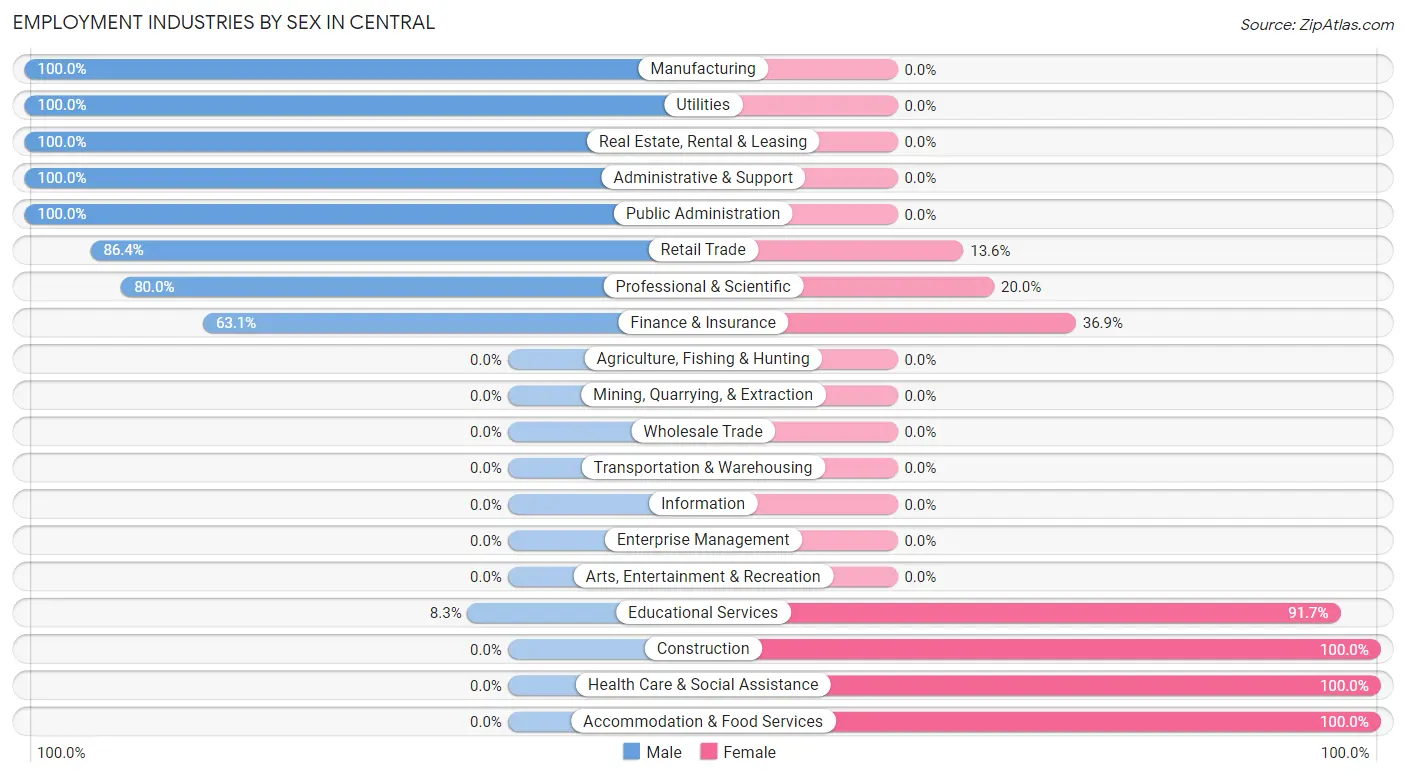
Employment Industries by Sex in Central
The Central industries that see more men than women are Manufacturing (100.0%), Utilities (100.0%), and Real Estate, Rental & Leasing (100.0%), whereas the industries that tend to have a higher number of women are Construction (100.0%), Health Care & Social Assistance (100.0%), and Accommodation & Food Services (100.0%).
| Industry | Male | Female |
| Agriculture, Fishing & Hunting | 0 (0.0%) | 0 (0.0%) |
| Mining, Quarrying, & Extraction | 0 (0.0%) | 0 (0.0%) |
| Construction | 0 (0.0%) | 13 (100.0%) |
| Manufacturing | 9 (100.0%) | 0 (0.0%) |
| Wholesale Trade | 0 (0.0%) | 0 (0.0%) |
| Retail Trade | 19 (86.4%) | 3 (13.6%) |
| Transportation & Warehousing | 0 (0.0%) | 0 (0.0%) |
| Utilities | 16 (100.0%) | 0 (0.0%) |
| Information | 0 (0.0%) | 0 (0.0%) |
| Finance & Insurance | 41 (63.1%) | 24 (36.9%) |
| Real Estate, Rental & Leasing | 12 (100.0%) | 0 (0.0%) |
| Professional & Scientific | 36 (80.0%) | 9 (20.0%) |
| Enterprise Management | 0 (0.0%) | 0 (0.0%) |
| Administrative & Support | 10 (100.0%) | 0 (0.0%) |
| Educational Services | 7 (8.3%) | 77 (91.7%) |
| Health Care & Social Assistance | 0 (0.0%) | 27 (100.0%) |
| Arts, Entertainment & Recreation | 0 (0.0%) | 0 (0.0%) |
| Accommodation & Food Services | 0 (0.0%) | 7 (100.0%) |
| Public Administration | 9 (100.0%) | 0 (0.0%) |
| Total | 175 (52.2%) | 160 (47.8%) |
Education in Central
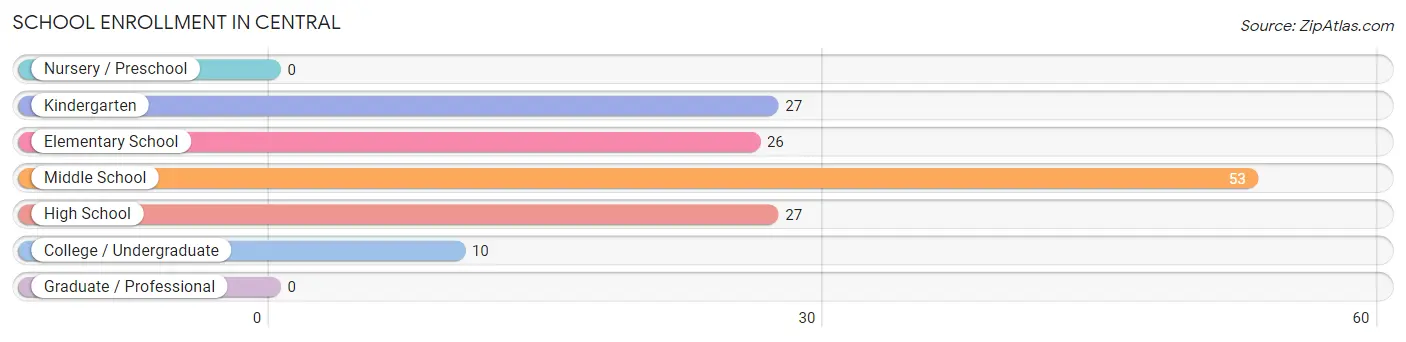
School Enrollment in Central
The most common levels of schooling among the 143 students in Central are middle school (53 | 37.1%), kindergarten (27 | 18.9%), and high school (27 | 18.9%).
| School Level | # Students | % Students |
| Nursery / Preschool | 0 | 0.0% |
| Kindergarten | 27 | 18.9% |
| Elementary School | 26 | 18.2% |
| Middle School | 53 | 37.1% |
| High School | 27 | 18.9% |
| College / Undergraduate | 10 | 7.0% |
| Graduate / Professional | 0 | 0.0% |
| Total | 143 | 100.0% |
School Enrollment by Age by Funding Source in Central
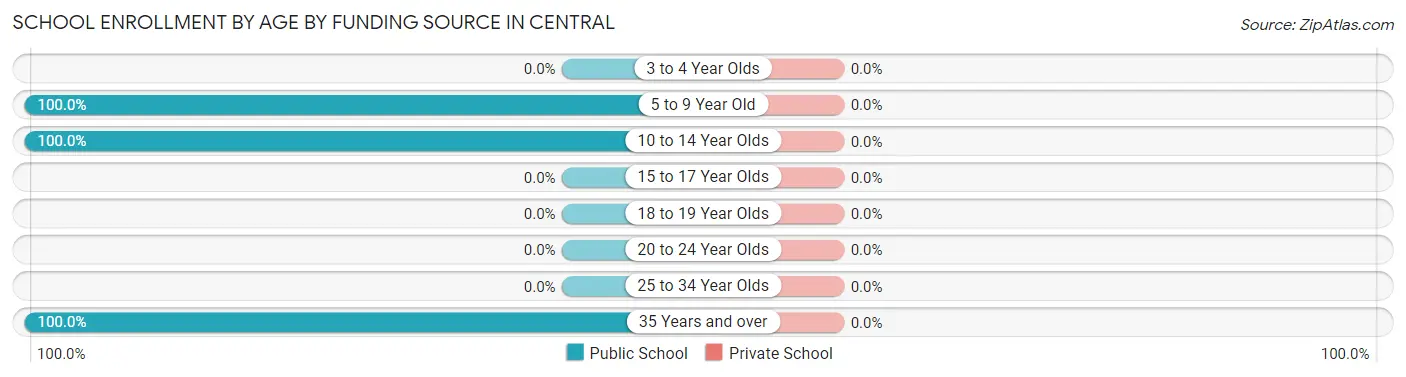
| Age Bracket | Public School | Private School |
| 3 to 4 Year Olds | 0 (0.0%) | 0 (0.0%) |
| 5 to 9 Year Old | 53 (100.0%) | 0 (0.0%) |
| 10 to 14 Year Olds | 80 (100.0%) | 0 (0.0%) |
| 15 to 17 Year Olds | 0 (0.0%) | 0 (0.0%) |
| 18 to 19 Year Olds | 0 (0.0%) | 0 (0.0%) |
| 20 to 24 Year Olds | 0 (0.0%) | 0 (0.0%) |
| 25 to 34 Year Olds | 0 (0.0%) | 0 (0.0%) |
| 35 Years and over | 10 (100.0%) | 0 (0.0%) |
| Total | 143 (100.0%) | 0 (0.0%) |
Educational Attainment by Field of Study in Central
Social sciences (81 | 28.8%), computers & mathematics (66 | 23.5%), literature & languages (63 | 22.4%), arts & humanities (33 | 11.7%), and business (29 | 10.3%) are the most common fields of study among 281 individuals in Central who have obtained a bachelor's degree or higher.
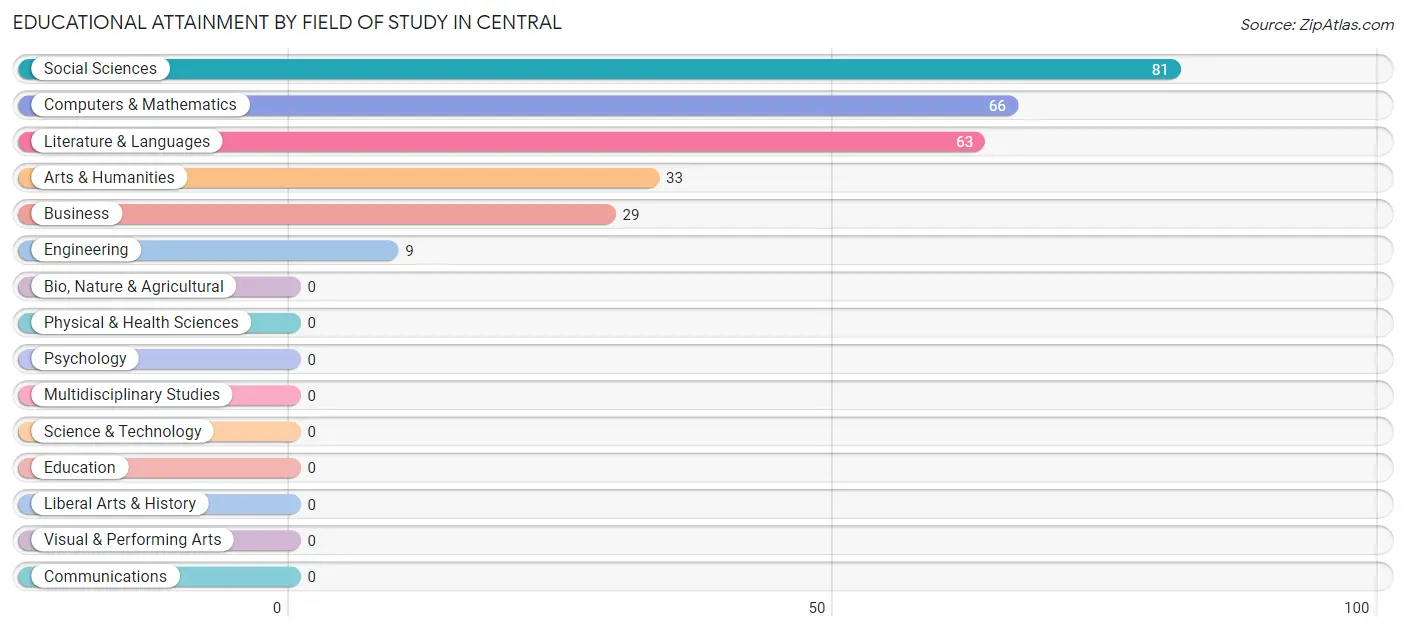
| Field of Study | # Graduates | % Graduates |
| Computers & Mathematics | 66 | 23.5% |
| Bio, Nature & Agricultural | 0 | 0.0% |
| Physical & Health Sciences | 0 | 0.0% |
| Psychology | 0 | 0.0% |
| Social Sciences | 81 | 28.8% |
| Engineering | 9 | 3.2% |
| Multidisciplinary Studies | 0 | 0.0% |
| Science & Technology | 0 | 0.0% |
| Business | 29 | 10.3% |
| Education | 0 | 0.0% |
| Literature & Languages | 63 | 22.4% |
| Liberal Arts & History | 0 | 0.0% |
| Visual & Performing Arts | 0 | 0.0% |
| Communications | 0 | 0.0% |
| Arts & Humanities | 33 | 11.7% |
| Total | 281 | 100.0% |
Transportation & Commute in Central
Vehicle Availability by Sex in Central
The most prevalent vehicle ownership categories in Central are males with 2 vehicles (103, accounting for 58.9%) and females with 2 vehicles (104, making up 64.4%).
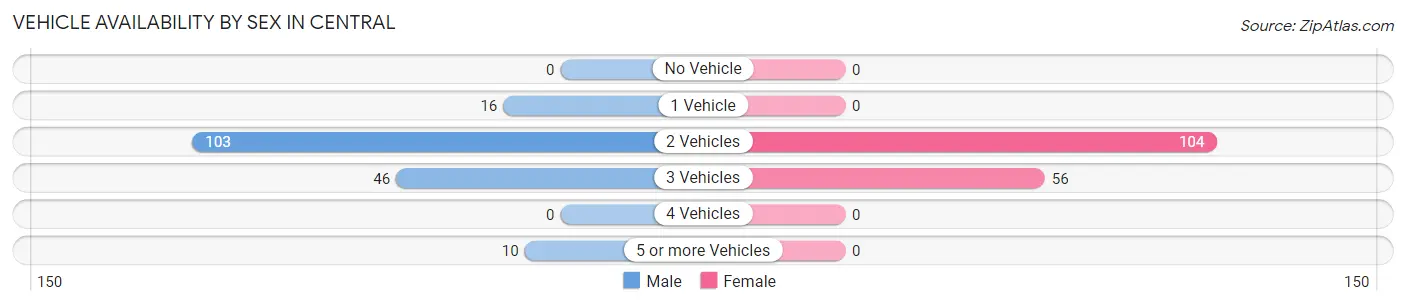
| Vehicles Available | Male | Female |
| No Vehicle | 0 (0.0%) | 0 (0.0%) |
| 1 Vehicle | 16 (9.1%) | 0 (0.0%) |
| 2 Vehicles | 103 (58.9%) | 104 (65.0%) |
| 3 Vehicles | 46 (26.3%) | 56 (35.0%) |
| 4 Vehicles | 0 (0.0%) | 0 (0.0%) |
| 5 or more Vehicles | 10 (5.7%) | 0 (0.0%) |
| Total | 175 (100.0%) | 160 (100.0%) |
Commute Time in Central
The most frequently occuring commute durations in Central are 30 to 34 minutes (51 commuters, 27.3%), 35 to 39 minutes (49 commuters, 26.2%), and 40 to 44 minutes (39 commuters, 20.9%).
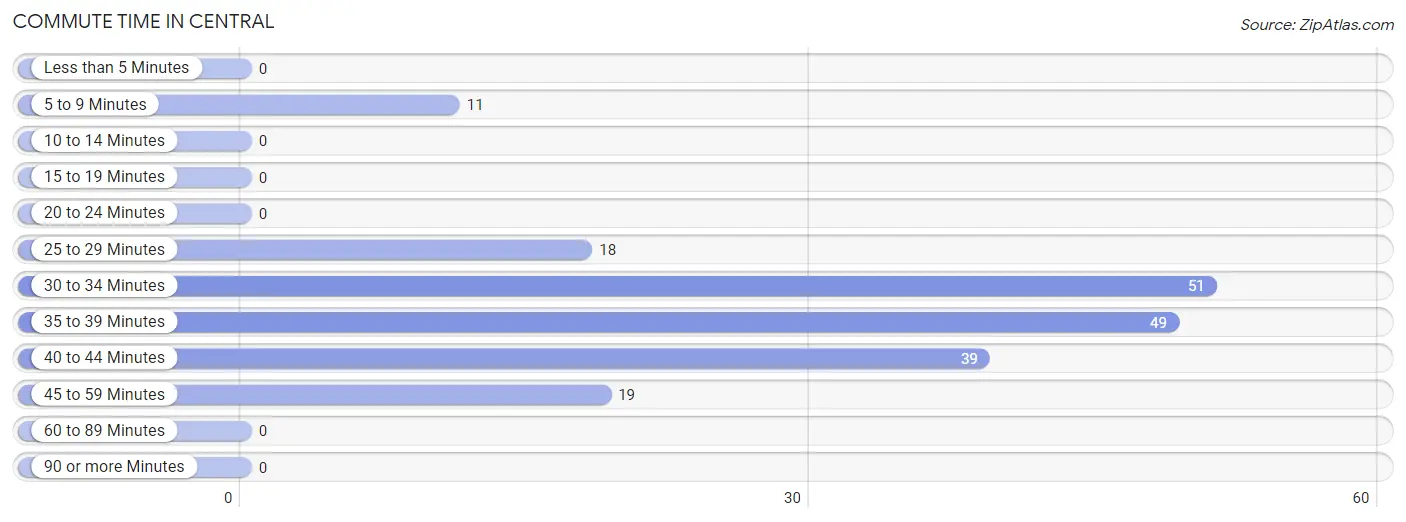
| Commute Time | # Commuters | % Commuters |
| Less than 5 Minutes | 0 | 0.0% |
| 5 to 9 Minutes | 11 | 5.9% |
| 10 to 14 Minutes | 0 | 0.0% |
| 15 to 19 Minutes | 0 | 0.0% |
| 20 to 24 Minutes | 0 | 0.0% |
| 25 to 29 Minutes | 18 | 9.6% |
| 30 to 34 Minutes | 51 | 27.3% |
| 35 to 39 Minutes | 49 | 26.2% |
| 40 to 44 Minutes | 39 | 20.9% |
| 45 to 59 Minutes | 19 | 10.2% |
| 60 to 89 Minutes | 0 | 0.0% |
| 90 or more Minutes | 0 | 0.0% |
Commute Time by Sex in Central
The most common commute times in Central are 40 to 44 minutes (22 commuters, 28.9%) for males and 30 to 34 minutes (42 commuters, 37.8%) for females.
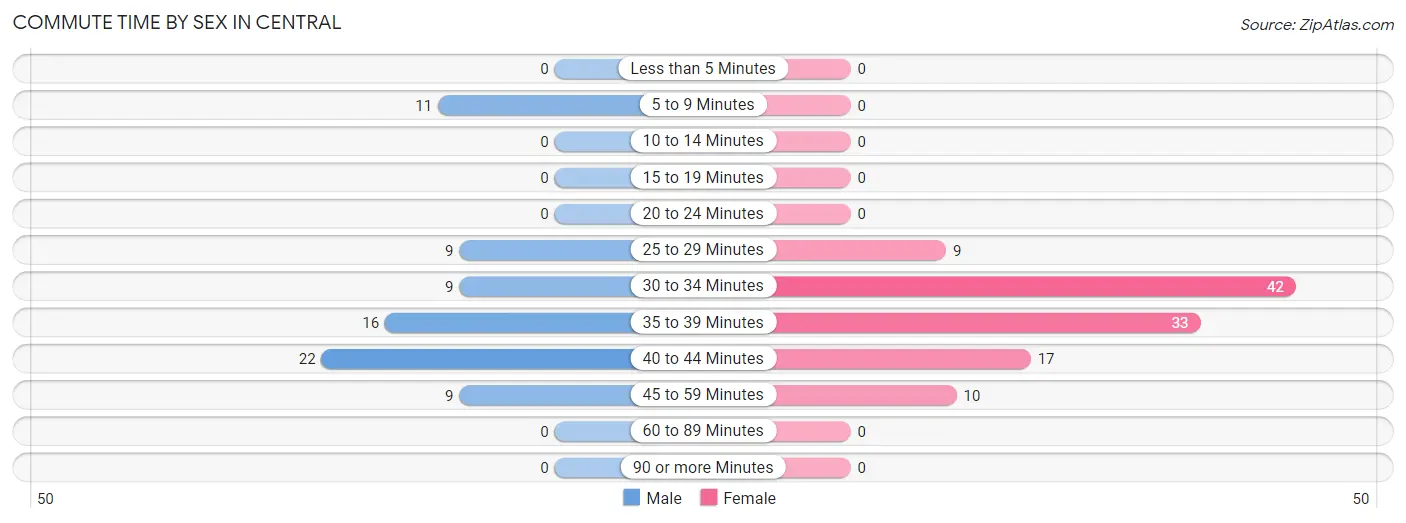
| Commute Time | Male | Female |
| Less than 5 Minutes | 0 (0.0%) | 0 (0.0%) |
| 5 to 9 Minutes | 11 (14.5%) | 0 (0.0%) |
| 10 to 14 Minutes | 0 (0.0%) | 0 (0.0%) |
| 15 to 19 Minutes | 0 (0.0%) | 0 (0.0%) |
| 20 to 24 Minutes | 0 (0.0%) | 0 (0.0%) |
| 25 to 29 Minutes | 9 (11.8%) | 9 (8.1%) |
| 30 to 34 Minutes | 9 (11.8%) | 42 (37.8%) |
| 35 to 39 Minutes | 16 (21.0%) | 33 (29.7%) |
| 40 to 44 Minutes | 22 (28.9%) | 17 (15.3%) |
| 45 to 59 Minutes | 9 (11.8%) | 10 (9.0%) |
| 60 to 89 Minutes | 0 (0.0%) | 0 (0.0%) |
| 90 or more Minutes | 0 (0.0%) | 0 (0.0%) |
Time of Departure to Work by Sex in Central
The most frequent times of departure to work in Central are 7:00 AM to 7:29 AM (30, 39.5%) for males and 9:00 AM to 9:59 AM (36, 32.4%) for females.
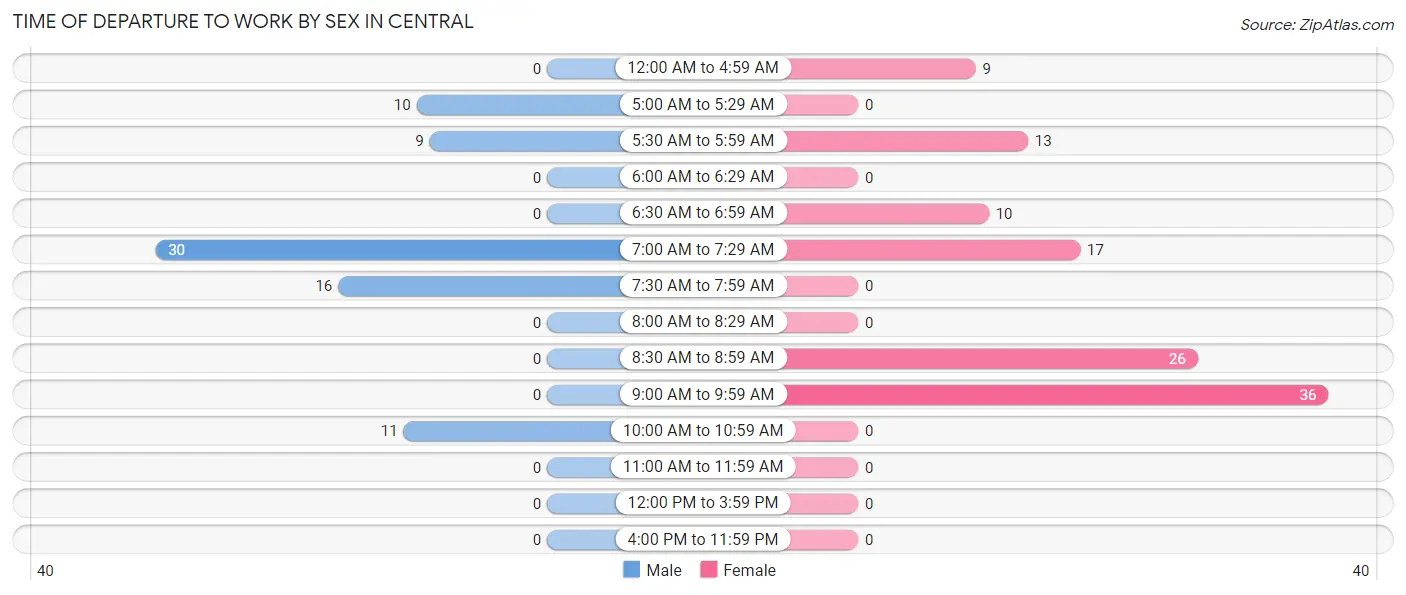
| Time of Departure | Male | Female |
| 12:00 AM to 4:59 AM | 0 (0.0%) | 9 (8.1%) |
| 5:00 AM to 5:29 AM | 10 (13.2%) | 0 (0.0%) |
| 5:30 AM to 5:59 AM | 9 (11.8%) | 13 (11.7%) |
| 6:00 AM to 6:29 AM | 0 (0.0%) | 0 (0.0%) |
| 6:30 AM to 6:59 AM | 0 (0.0%) | 10 (9.0%) |
| 7:00 AM to 7:29 AM | 30 (39.5%) | 17 (15.3%) |
| 7:30 AM to 7:59 AM | 16 (21.0%) | 0 (0.0%) |
| 8:00 AM to 8:29 AM | 0 (0.0%) | 0 (0.0%) |
| 8:30 AM to 8:59 AM | 0 (0.0%) | 26 (23.4%) |
| 9:00 AM to 9:59 AM | 0 (0.0%) | 36 (32.4%) |
| 10:00 AM to 10:59 AM | 11 (14.5%) | 0 (0.0%) |
| 11:00 AM to 11:59 AM | 0 (0.0%) | 0 (0.0%) |
| 12:00 PM to 3:59 PM | 0 (0.0%) | 0 (0.0%) |
| 4:00 PM to 11:59 PM | 0 (0.0%) | 0 (0.0%) |
| Total | 76 (100.0%) | 111 (100.0%) |
Housing Occupancy in Central
Occupancy by Ownership in Central
Of the total 346 dwellings in Central, owner-occupied units account for 335 (96.8%), while renter-occupied units make up 11 (3.2%).
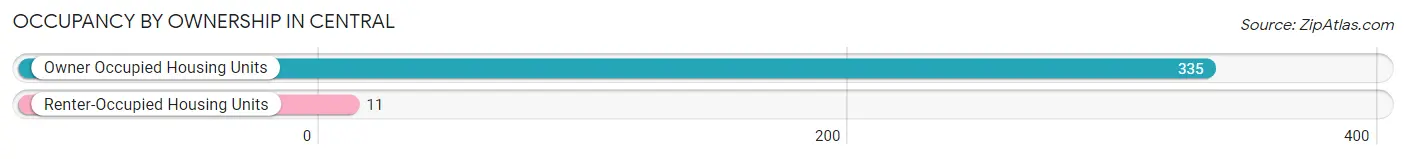
| Occupancy | # Housing Units | % Housing Units |
| Owner Occupied Housing Units | 335 | 96.8% |
| Renter-Occupied Housing Units | 11 | 3.2% |
| Total Occupied Housing Units | 346 | 100.0% |
Occupancy by Household Size in Central
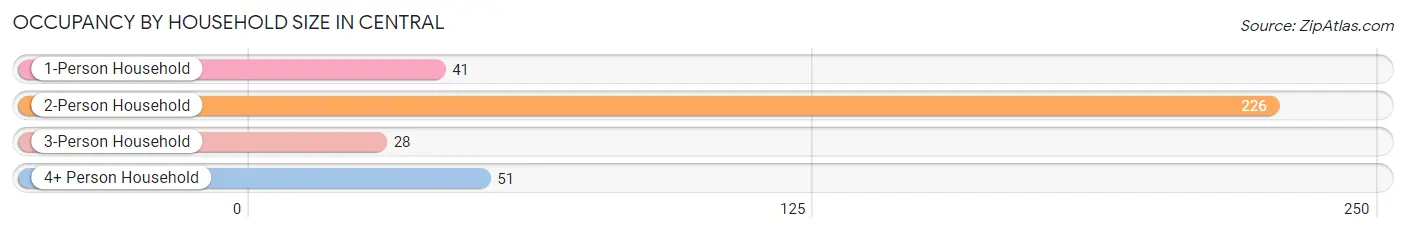
| Household Size | # Housing Units | % Housing Units |
| 1-Person Household | 41 | 11.8% |
| 2-Person Household | 226 | 65.3% |
| 3-Person Household | 28 | 8.1% |
| 4+ Person Household | 51 | 14.7% |
| Total Housing Units | 346 | 100.0% |
Occupancy by Ownership by Household Size in Central
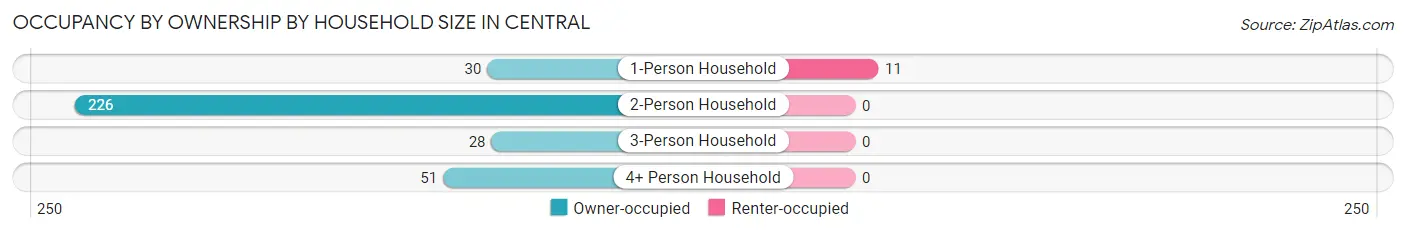
| Household Size | Owner-occupied | Renter-occupied |
| 1-Person Household | 30 (73.2%) | 11 (26.8%) |
| 2-Person Household | 226 (100.0%) | 0 (0.0%) |
| 3-Person Household | 28 (100.0%) | 0 (0.0%) |
| 4+ Person Household | 51 (100.0%) | 0 (0.0%) |
| Total Housing Units | 335 (96.8%) | 11 (3.2%) |
Occupancy by Educational Attainment in Central
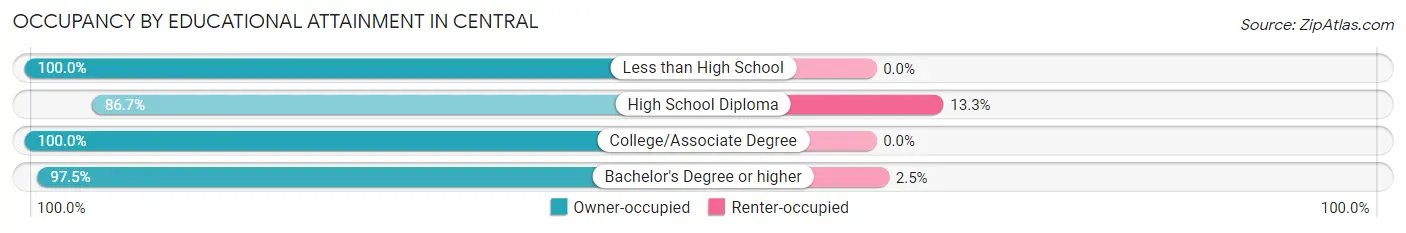
| Household Size | Owner-occupied | Renter-occupied |
| Less than High School | 25 (100.0%) | 0 (0.0%) |
| High School Diploma | 52 (86.7%) | 8 (13.3%) |
| College/Associate Degree | 142 (100.0%) | 0 (0.0%) |
| Bachelor's Degree or higher | 116 (97.5%) | 3 (2.5%) |
Occupancy by Age of Householder in Central
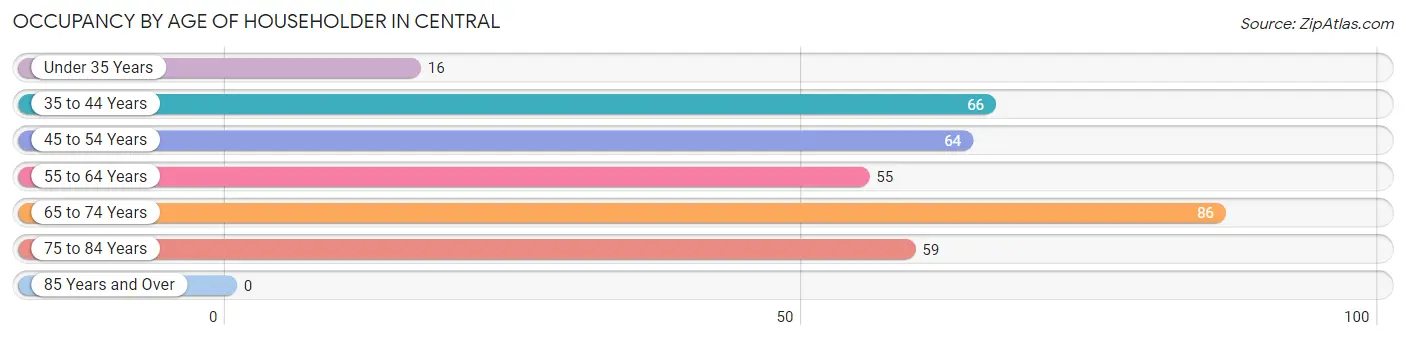
| Age Bracket | # Households | % Households |
| Under 35 Years | 16 | 4.6% |
| 35 to 44 Years | 66 | 19.1% |
| 45 to 54 Years | 64 | 18.5% |
| 55 to 64 Years | 55 | 15.9% |
| 65 to 74 Years | 86 | 24.9% |
| 75 to 84 Years | 59 | 17.1% |
| 85 Years and Over | 0 | 0.0% |
| Total | 346 | 100.0% |
Housing Finances in Central
Median Income by Occupancy in Central
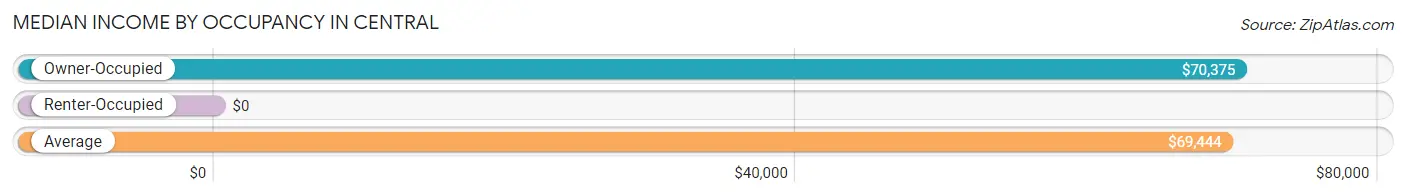
| Occupancy Type | # Households | Median Income |
| Owner-Occupied | 335 (96.8%) | $70,375 |
| Renter-Occupied | 11 (3.2%) | $0 |
| Average | 346 (100.0%) | $69,444 |
Occupancy by Householder Income Bracket in Central
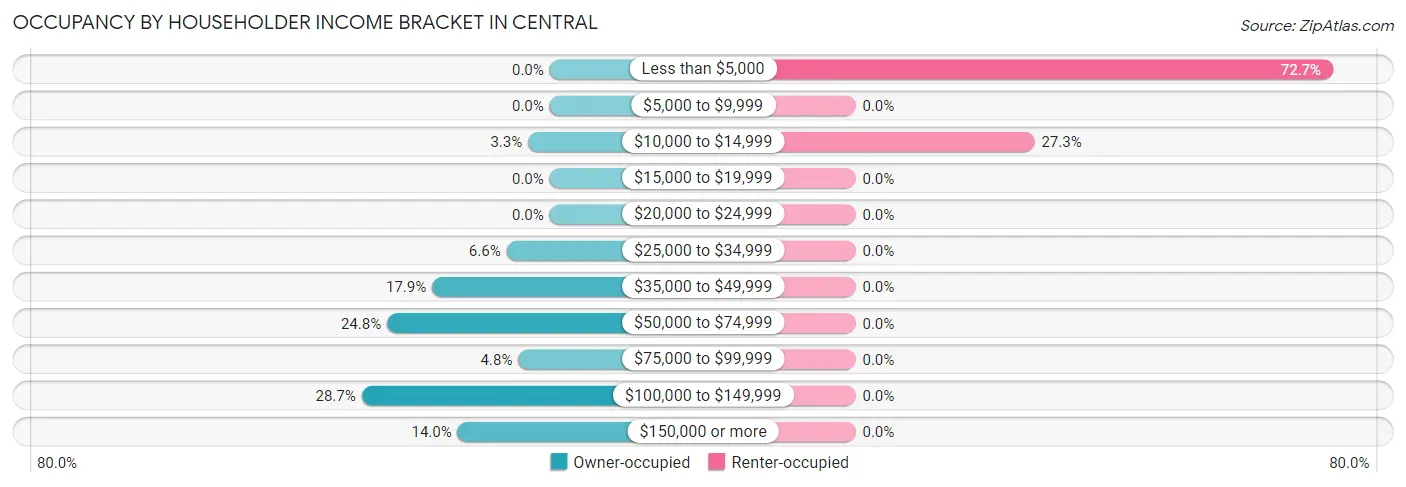
| Income Bracket | Owner-occupied | Renter-occupied |
| Less than $5,000 | 0 (0.0%) | 8 (72.7%) |
| $5,000 to $9,999 | 0 (0.0%) | 0 (0.0%) |
| $10,000 to $14,999 | 11 (3.3%) | 3 (27.3%) |
| $15,000 to $19,999 | 0 (0.0%) | 0 (0.0%) |
| $20,000 to $24,999 | 0 (0.0%) | 0 (0.0%) |
| $25,000 to $34,999 | 22 (6.6%) | 0 (0.0%) |
| $35,000 to $49,999 | 60 (17.9%) | 0 (0.0%) |
| $50,000 to $74,999 | 83 (24.8%) | 0 (0.0%) |
| $75,000 to $99,999 | 16 (4.8%) | 0 (0.0%) |
| $100,000 to $149,999 | 96 (28.7%) | 0 (0.0%) |
| $150,000 or more | 47 (14.0%) | 0 (0.0%) |
| Total | 335 (100.0%) | 11 (100.0%) |
Monthly Housing Cost Tiers in Central
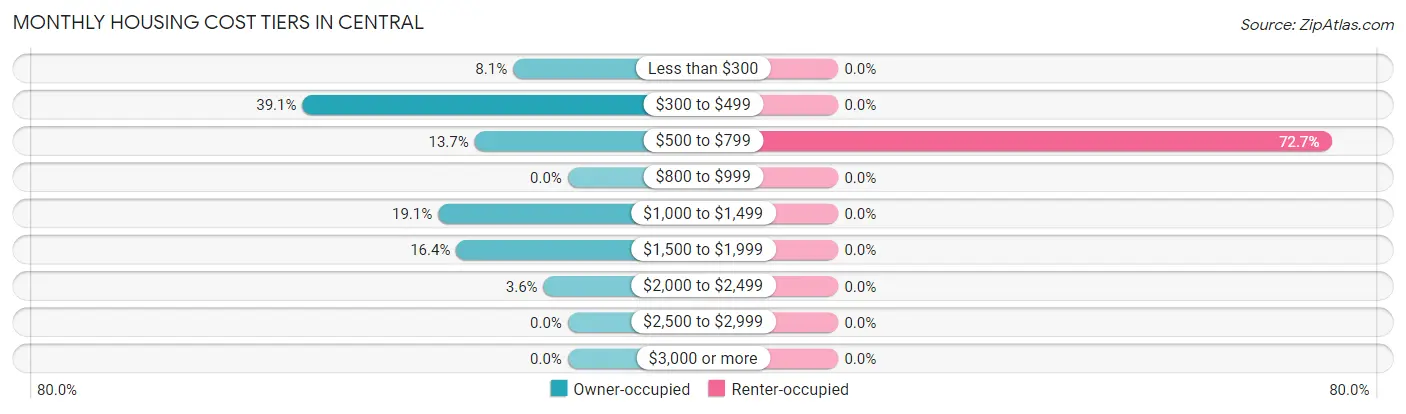
| Monthly Cost | Owner-occupied | Renter-occupied |
| Less than $300 | 27 (8.1%) | 0 (0.0%) |
| $300 to $499 | 131 (39.1%) | 0 (0.0%) |
| $500 to $799 | 46 (13.7%) | 8 (72.7%) |
| $800 to $999 | 0 (0.0%) | 0 (0.0%) |
| $1,000 to $1,499 | 64 (19.1%) | 0 (0.0%) |
| $1,500 to $1,999 | 55 (16.4%) | 0 (0.0%) |
| $2,000 to $2,499 | 12 (3.6%) | 0 (0.0%) |
| $2,500 to $2,999 | 0 (0.0%) | 0 (0.0%) |
| $3,000 or more | 0 (0.0%) | 0 (0.0%) |
| Total | 335 (100.0%) | 11 (100.0%) |
Physical Housing Characteristics in Central
Housing Structures in Central
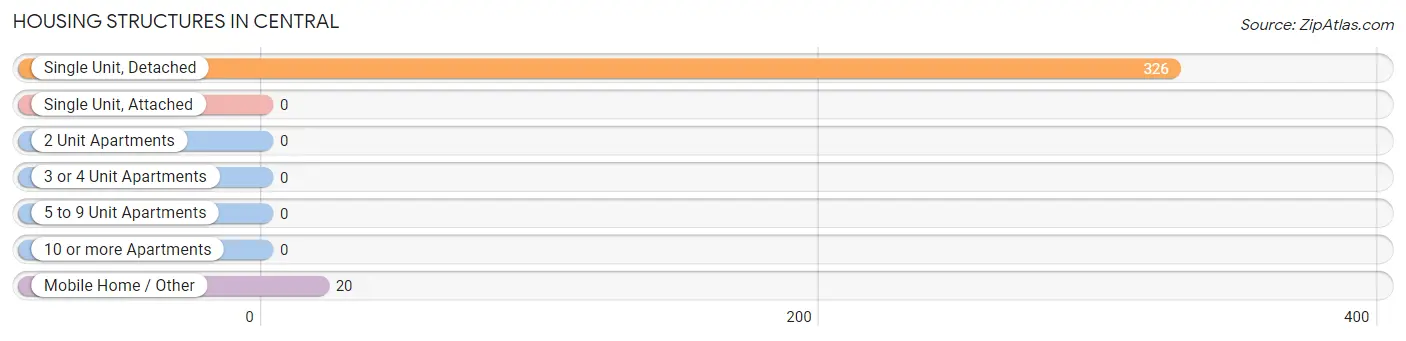
| Structure Type | # Housing Units | % Housing Units |
| Single Unit, Detached | 326 | 94.2% |
| Single Unit, Attached | 0 | 0.0% |
| 2 Unit Apartments | 0 | 0.0% |
| 3 or 4 Unit Apartments | 0 | 0.0% |
| 5 to 9 Unit Apartments | 0 | 0.0% |
| 10 or more Apartments | 0 | 0.0% |
| Mobile Home / Other | 20 | 5.8% |
| Total | 346 | 100.0% |
Housing Structures by Occupancy in Central
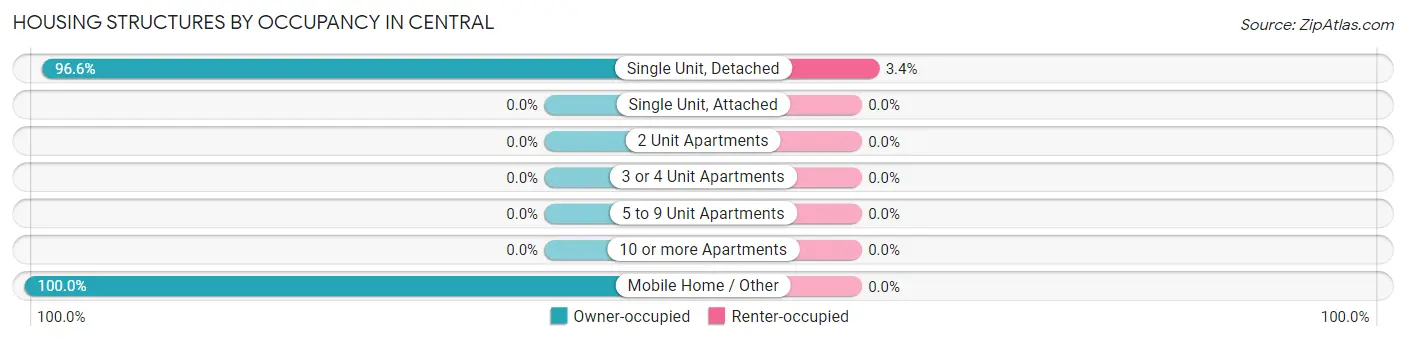
| Structure Type | Owner-occupied | Renter-occupied |
| Single Unit, Detached | 315 (96.6%) | 11 (3.4%) |
| Single Unit, Attached | 0 (0.0%) | 0 (0.0%) |
| 2 Unit Apartments | 0 (0.0%) | 0 (0.0%) |
| 3 or 4 Unit Apartments | 0 (0.0%) | 0 (0.0%) |
| 5 to 9 Unit Apartments | 0 (0.0%) | 0 (0.0%) |
| 10 or more Apartments | 0 (0.0%) | 0 (0.0%) |
| Mobile Home / Other | 20 (100.0%) | 0 (0.0%) |
| Total | 335 (96.8%) | 11 (3.2%) |
Housing Structures by Number of Rooms in Central
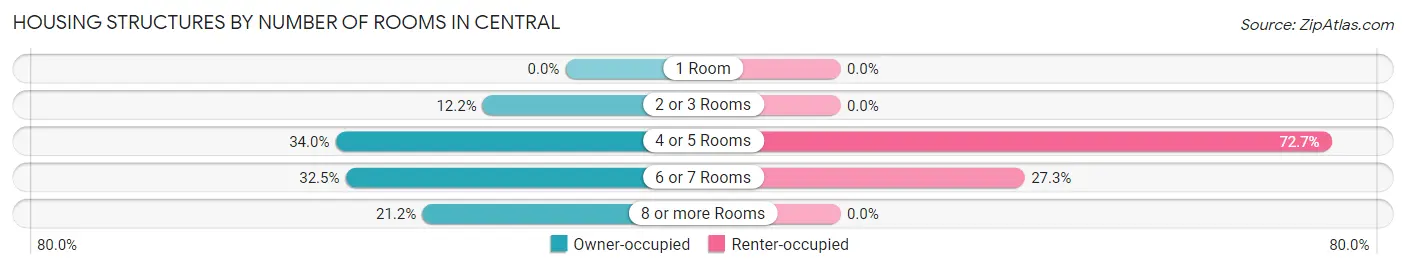
| Number of Rooms | Owner-occupied | Renter-occupied |
| 1 Room | 0 (0.0%) | 0 (0.0%) |
| 2 or 3 Rooms | 41 (12.2%) | 0 (0.0%) |
| 4 or 5 Rooms | 114 (34.0%) | 8 (72.7%) |
| 6 or 7 Rooms | 109 (32.5%) | 3 (27.3%) |
| 8 or more Rooms | 71 (21.2%) | 0 (0.0%) |
| Total | 335 (100.0%) | 11 (100.0%) |
Housing Structure by Heating Type in Central
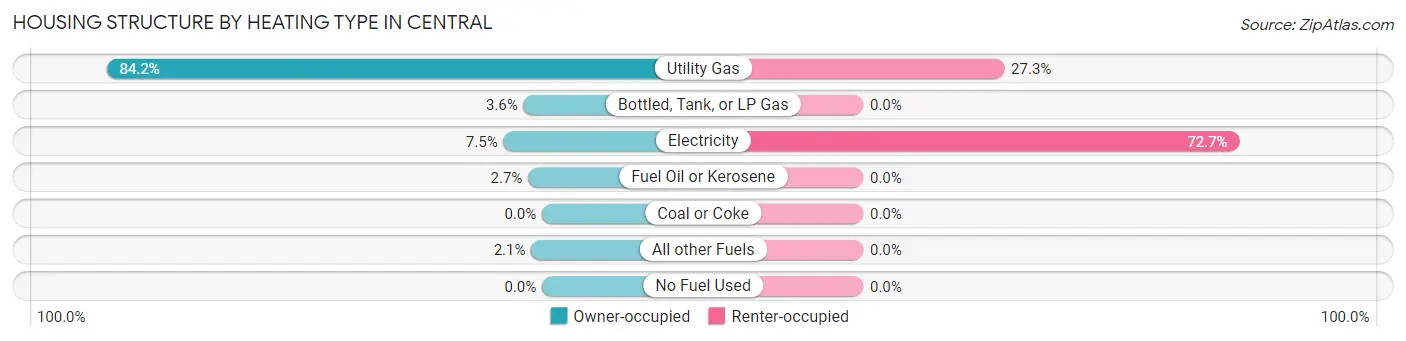
| Heating Type | Owner-occupied | Renter-occupied |
| Utility Gas | 282 (84.2%) | 3 (27.3%) |
| Bottled, Tank, or LP Gas | 12 (3.6%) | 0 (0.0%) |
| Electricity | 25 (7.5%) | 8 (72.7%) |
| Fuel Oil or Kerosene | 9 (2.7%) | 0 (0.0%) |
| Coal or Coke | 0 (0.0%) | 0 (0.0%) |
| All other Fuels | 7 (2.1%) | 0 (0.0%) |
| No Fuel Used | 0 (0.0%) | 0 (0.0%) |
| Total | 335 (100.0%) | 11 (100.0%) |
Household Vehicle Usage in Central
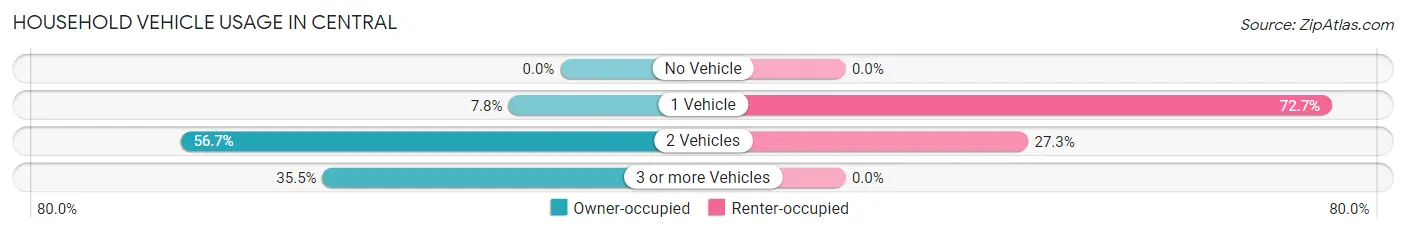
| Vehicles per Household | Owner-occupied | Renter-occupied |
| No Vehicle | 0 (0.0%) | 0 (0.0%) |
| 1 Vehicle | 26 (7.8%) | 8 (72.7%) |
| 2 Vehicles | 190 (56.7%) | 3 (27.3%) |
| 3 or more Vehicles | 119 (35.5%) | 0 (0.0%) |
| Total | 335 (100.0%) | 11 (100.0%) |
Real Estate & Mortgages in Central
Real Estate and Mortgage Overview in Central
| Characteristic | Without Mortgage | With Mortgage |
| Housing Units | 167 | 168 |
| Median Property Value | $358,900 | $312,800 |
| Median Household Income | $71,375 | $12 |
| Monthly Housing Costs | $411 | $0 |
| Real Estate Taxes | $1,401 | $0 |
Property Value by Mortgage Status in Central
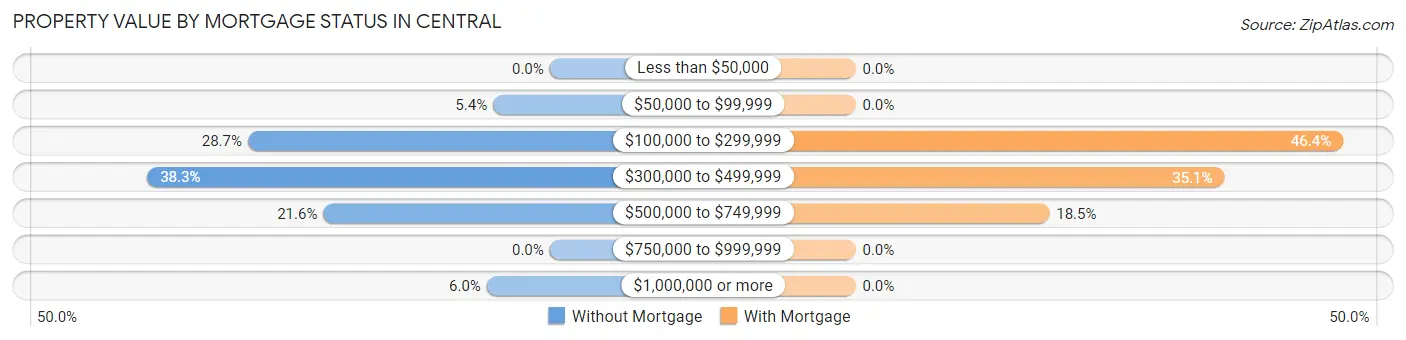
| Property Value | Without Mortgage | With Mortgage |
| Less than $50,000 | 0 (0.0%) | 0 (0.0%) |
| $50,000 to $99,999 | 9 (5.4%) | 0 (0.0%) |
| $100,000 to $299,999 | 48 (28.7%) | 78 (46.4%) |
| $300,000 to $499,999 | 64 (38.3%) | 59 (35.1%) |
| $500,000 to $749,999 | 36 (21.6%) | 31 (18.4%) |
| $750,000 to $999,999 | 0 (0.0%) | 0 (0.0%) |
| $1,000,000 or more | 10 (6.0%) | 0 (0.0%) |
| Total | 167 (100.0%) | 168 (100.0%) |
Household Income by Mortgage Status in Central
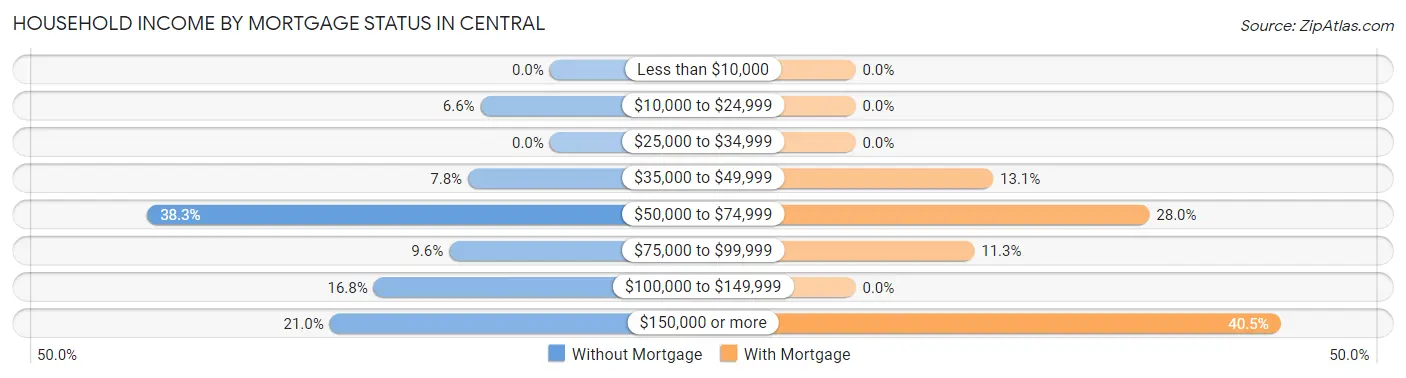
| Household Income | Without Mortgage | With Mortgage |
| Less than $10,000 | 0 (0.0%) | 0 (0.0%) |
| $10,000 to $24,999 | 11 (6.6%) | 0 (0.0%) |
| $25,000 to $34,999 | 0 (0.0%) | 0 (0.0%) |
| $35,000 to $49,999 | 13 (7.8%) | 22 (13.1%) |
| $50,000 to $74,999 | 64 (38.3%) | 47 (28.0%) |
| $75,000 to $99,999 | 16 (9.6%) | 19 (11.3%) |
| $100,000 to $149,999 | 28 (16.8%) | 0 (0.0%) |
| $150,000 or more | 35 (21.0%) | 68 (40.5%) |
| Total | 167 (100.0%) | 168 (100.0%) |
Property Value to Household Income Ratio in Central
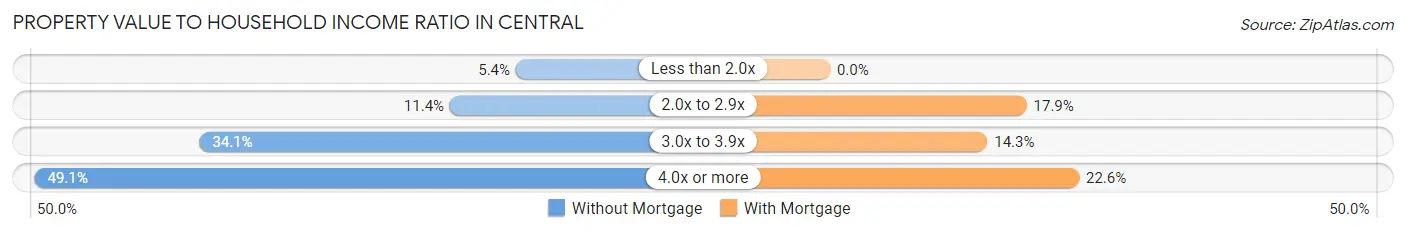
| Value-to-Income Ratio | Without Mortgage | With Mortgage |
| Less than 2.0x | 9 (5.4%) | 0 (0.0%) |
| 2.0x to 2.9x | 19 (11.4%) | 30 (17.9%) |
| 3.0x to 3.9x | 57 (34.1%) | 24 (14.3%) |
| 4.0x or more | 82 (49.1%) | 38 (22.6%) |
| Total | 167 (100.0%) | 168 (100.0%) |
Real Estate Taxes by Mortgage Status in Central
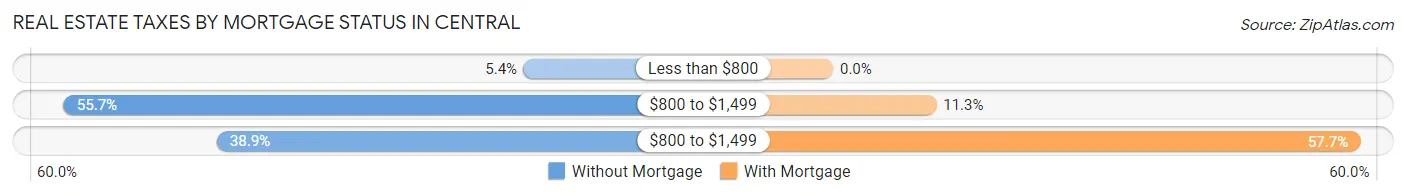
| Property Taxes | Without Mortgage | With Mortgage |
| Less than $800 | 9 (5.4%) | 0 (0.0%) |
| $800 to $1,499 | 93 (55.7%) | 19 (11.3%) |
| $800 to $1,499 | 65 (38.9%) | 97 (57.7%) |
| Total | 167 (100.0%) | 168 (100.0%) |
Health & Disability in Central
Health Insurance Coverage by Age in Central
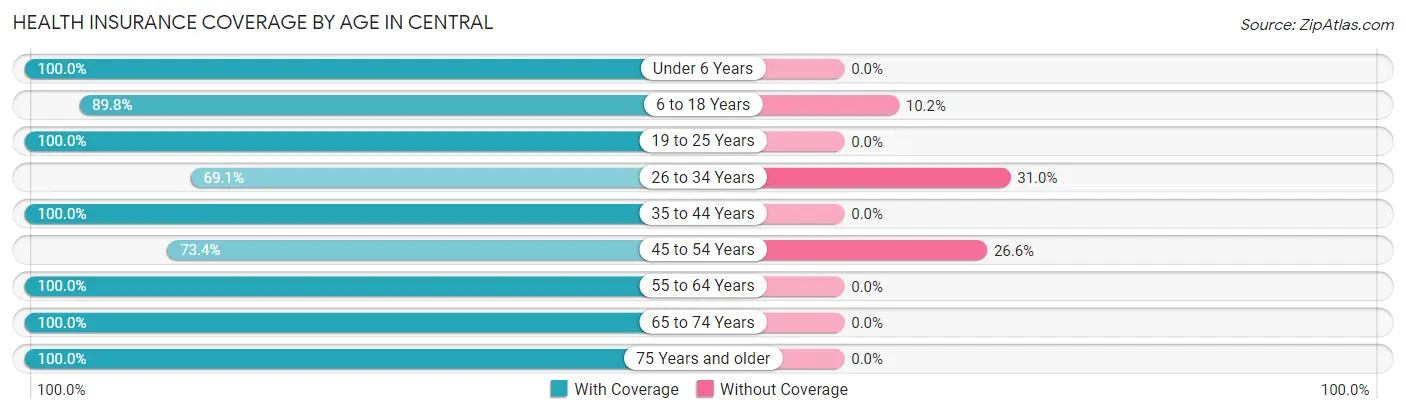
| Age Bracket | With Coverage | Without Coverage |
| Under 6 Years | 97 (100.0%) | 0 (0.0%) |
| 6 to 18 Years | 115 (89.8%) | 13 (10.2%) |
| 19 to 25 Years | 16 (100.0%) | 0 (0.0%) |
| 26 to 34 Years | 29 (69.1%) | 13 (30.9%) |
| 35 to 44 Years | 132 (100.0%) | 0 (0.0%) |
| 45 to 54 Years | 69 (73.4%) | 25 (26.6%) |
| 55 to 64 Years | 141 (100.0%) | 0 (0.0%) |
| 65 to 74 Years | 145 (100.0%) | 0 (0.0%) |
| 75 Years and older | 107 (100.0%) | 0 (0.0%) |
| Total | 851 (94.4%) | 51 (5.7%) |
Health Insurance Coverage by Citizenship Status in Central
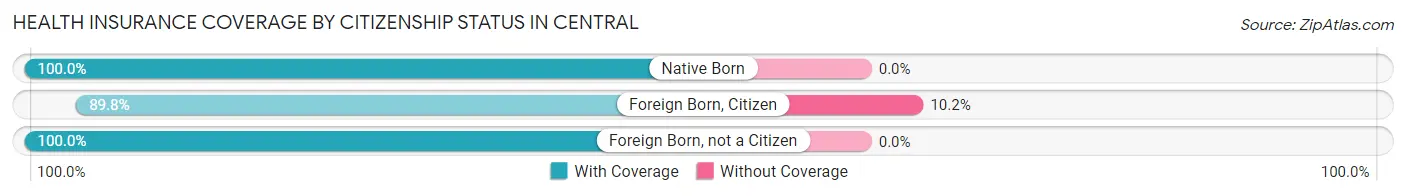
| Citizenship Status | With Coverage | Without Coverage |
| Native Born | 97 (100.0%) | 0 (0.0%) |
| Foreign Born, Citizen | 115 (89.8%) | 13 (10.2%) |
| Foreign Born, not a Citizen | 16 (100.0%) | 0 (0.0%) |
Health Insurance Coverage by Household Income in Central
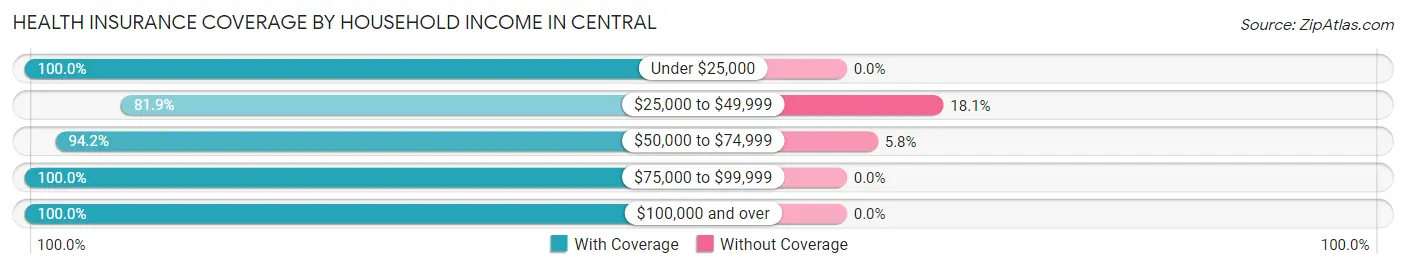
| Household Income | With Coverage | Without Coverage |
| Under $25,000 | 22 (100.0%) | 0 (0.0%) |
| $25,000 to $49,999 | 190 (81.9%) | 42 (18.1%) |
| $50,000 to $74,999 | 146 (94.2%) | 9 (5.8%) |
| $75,000 to $99,999 | 33 (100.0%) | 0 (0.0%) |
| $100,000 and over | 460 (100.0%) | 0 (0.0%) |
Public vs Private Health Insurance Coverage by Age in Central
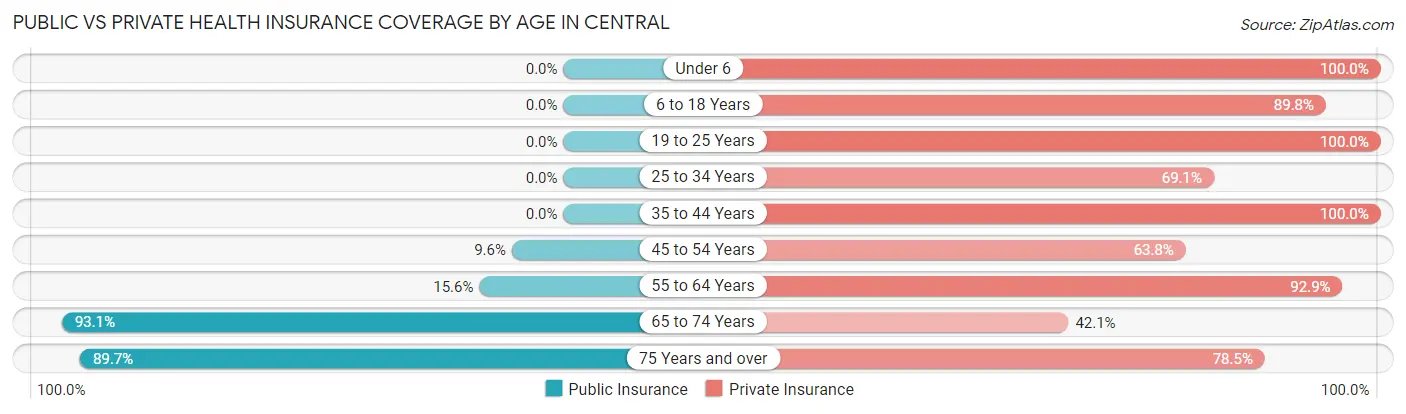
| Age Bracket | Public Insurance | Private Insurance |
| Under 6 | 0 (0.0%) | 97 (100.0%) |
| 6 to 18 Years | 0 (0.0%) | 115 (89.8%) |
| 19 to 25 Years | 0 (0.0%) | 16 (100.0%) |
| 25 to 34 Years | 0 (0.0%) | 29 (69.1%) |
| 35 to 44 Years | 0 (0.0%) | 132 (100.0%) |
| 45 to 54 Years | 9 (9.6%) | 60 (63.8%) |
| 55 to 64 Years | 22 (15.6%) | 131 (92.9%) |
| 65 to 74 Years | 135 (93.1%) | 61 (42.1%) |
| 75 Years and over | 96 (89.7%) | 84 (78.5%) |
| Total | 262 (29.0%) | 725 (80.4%) |
Disability Status by Sex by Age in Central
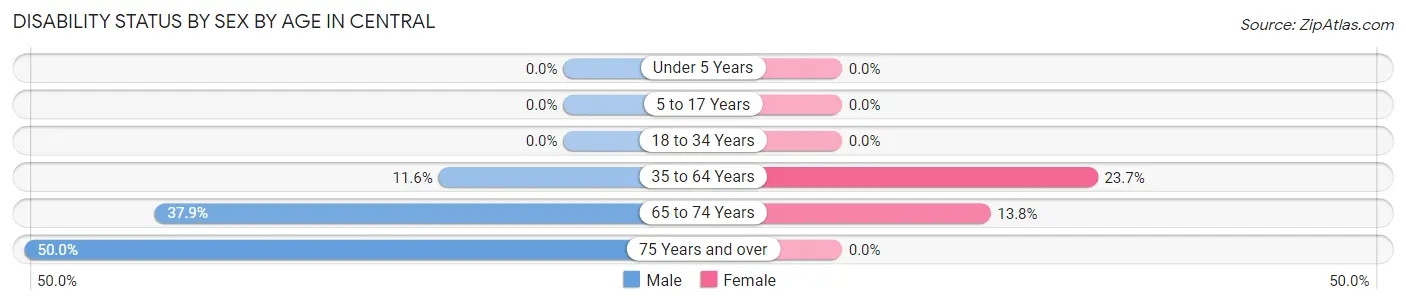
| Age Bracket | Male | Female |
| Under 5 Years | 0 (0.0%) | 0 (0.0%) |
| 5 to 17 Years | 0 (0.0%) | 0 (0.0%) |
| 18 to 34 Years | 0 (0.0%) | 0 (0.0%) |
| 35 to 64 Years | 22 (11.6%) | 42 (23.7%) |
| 65 to 74 Years | 22 (37.9%) | 12 (13.8%) |
| 75 Years and over | 36 (50.0%) | 0 (0.0%) |
Disability Class by Sex by Age in Central
Disability Class: Hearing Difficulty
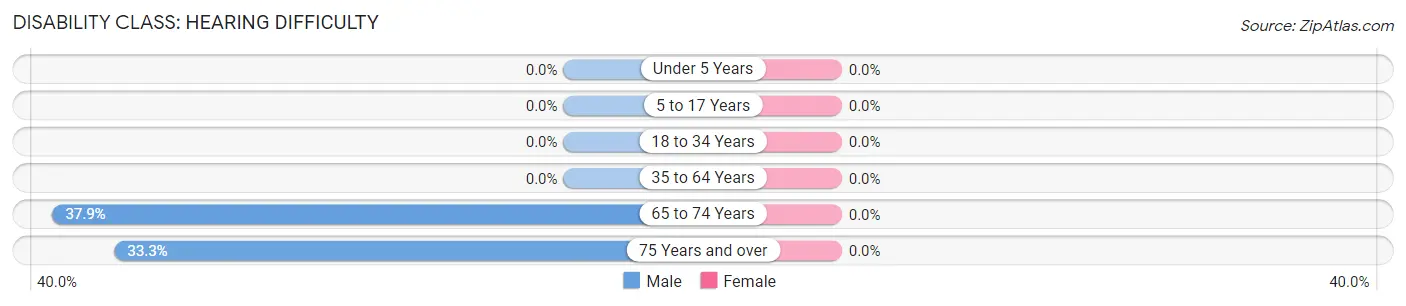
| Age Bracket | Male | Female |
| Under 5 Years | 0 (0.0%) | 0 (0.0%) |
| 5 to 17 Years | 0 (0.0%) | 0 (0.0%) |
| 18 to 34 Years | 0 (0.0%) | 0 (0.0%) |
| 35 to 64 Years | 0 (0.0%) | 0 (0.0%) |
| 65 to 74 Years | 22 (37.9%) | 0 (0.0%) |
| 75 Years and over | 24 (33.3%) | 0 (0.0%) |
Disability Class: Vision Difficulty
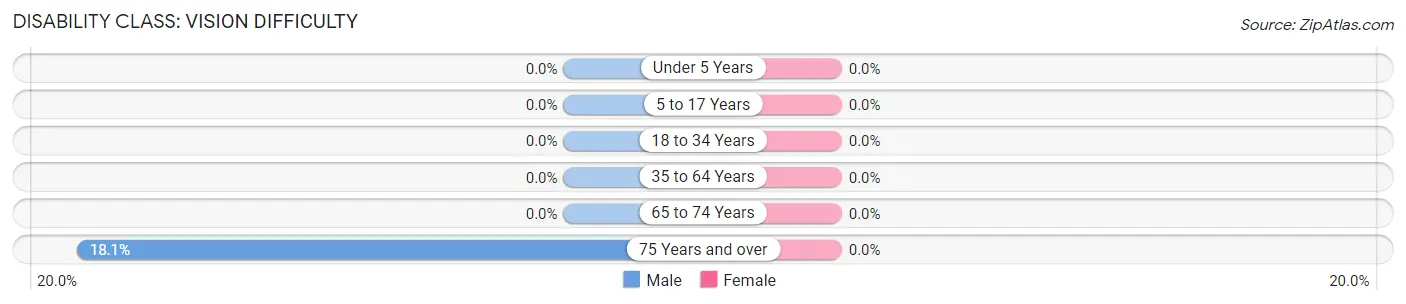
| Age Bracket | Male | Female |
| Under 5 Years | 0 (0.0%) | 0 (0.0%) |
| 5 to 17 Years | 0 (0.0%) | 0 (0.0%) |
| 18 to 34 Years | 0 (0.0%) | 0 (0.0%) |
| 35 to 64 Years | 0 (0.0%) | 0 (0.0%) |
| 65 to 74 Years | 0 (0.0%) | 0 (0.0%) |
| 75 Years and over | 13 (18.1%) | 0 (0.0%) |
Disability Class: Cognitive Difficulty
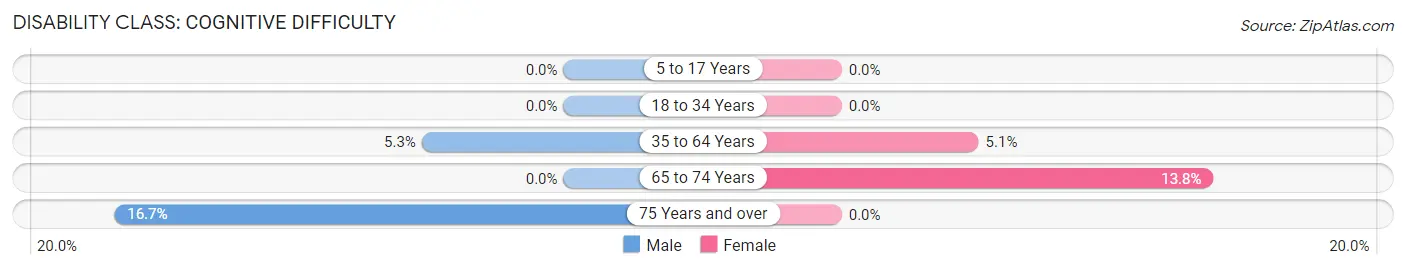
| Age Bracket | Male | Female |
| 5 to 17 Years | 0 (0.0%) | 0 (0.0%) |
| 18 to 34 Years | 0 (0.0%) | 0 (0.0%) |
| 35 to 64 Years | 10 (5.3%) | 9 (5.1%) |
| 65 to 74 Years | 0 (0.0%) | 12 (13.8%) |
| 75 Years and over | 12 (16.7%) | 0 (0.0%) |
Disability Class: Ambulatory Difficulty
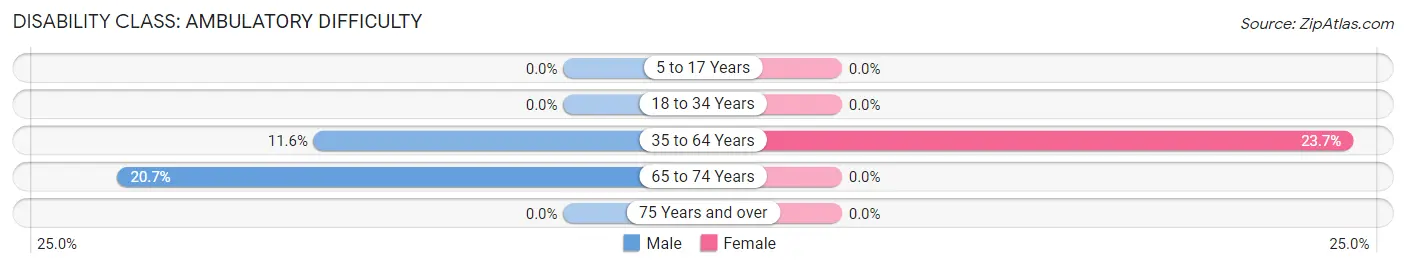
| Age Bracket | Male | Female |
| 5 to 17 Years | 0 (0.0%) | 0 (0.0%) |
| 18 to 34 Years | 0 (0.0%) | 0 (0.0%) |
| 35 to 64 Years | 22 (11.6%) | 42 (23.7%) |
| 65 to 74 Years | 12 (20.7%) | 0 (0.0%) |
| 75 Years and over | 0 (0.0%) | 0 (0.0%) |
Disability Class: Self-Care Difficulty
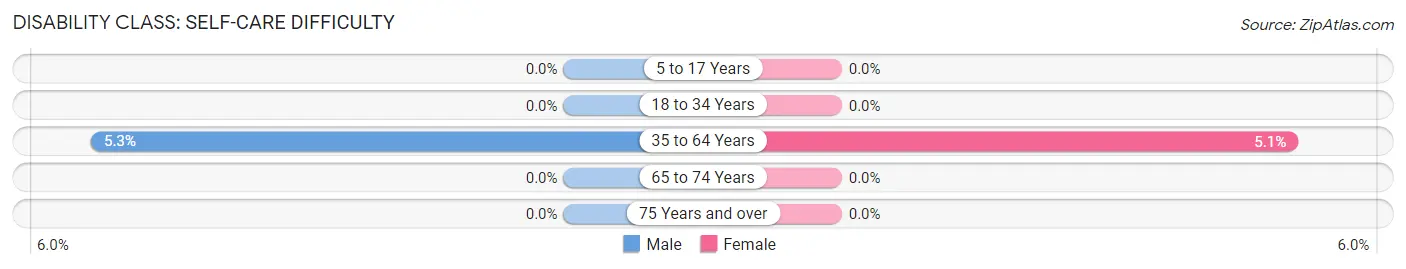
| Age Bracket | Male | Female |
| 5 to 17 Years | 0 (0.0%) | 0 (0.0%) |
| 18 to 34 Years | 0 (0.0%) | 0 (0.0%) |
| 35 to 64 Years | 10 (5.3%) | 9 (5.1%) |
| 65 to 74 Years | 0 (0.0%) | 0 (0.0%) |
| 75 Years and over | 0 (0.0%) | 0 (0.0%) |
Technology Access in Central
Computing Device Access in Central
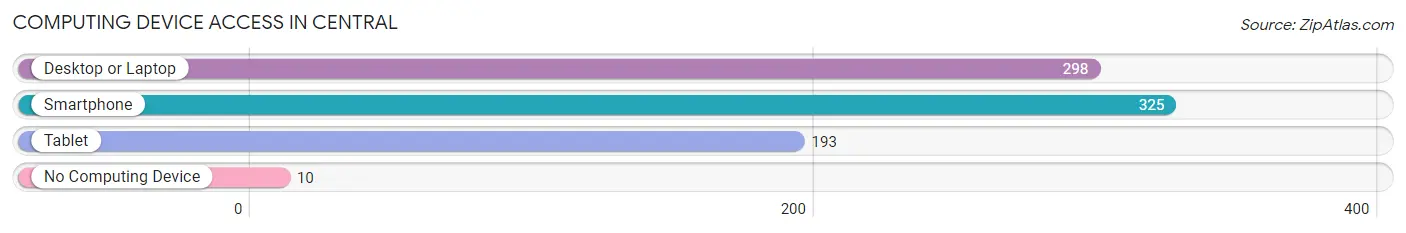
| Device Type | # Households | % Households |
| Desktop or Laptop | 298 | 86.1% |
| Smartphone | 325 | 93.9% |
| Tablet | 193 | 55.8% |
| No Computing Device | 10 | 2.9% |
| Total | 346 | 100.0% |
Internet Access in Central
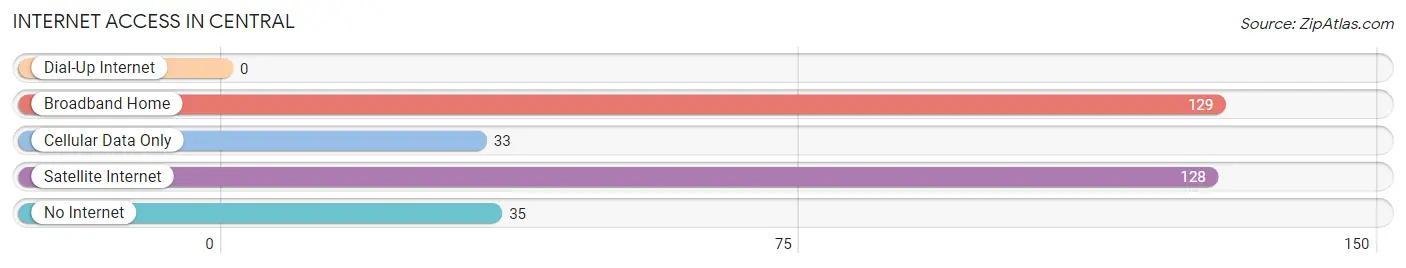
| Internet Type | # Households | % Households |
| Dial-Up Internet | 0 | 0.0% |
| Broadband Home | 129 | 37.3% |
| Cellular Data Only | 33 | 9.5% |
| Satellite Internet | 128 | 37.0% |
| No Internet | 35 | 10.1% |
| Total | 346 | 100.0% |
Central Summary
Central Utah is a region of the state of Utah that is located in the center of the state. It is bordered by the Wasatch Mountains to the east, the Great Basin to the west, the Colorado Plateau to the south, and the Uinta Mountains to the north. The region is home to a variety of landscapes, from the high desert of the Great Basin to the alpine forests of the Wasatch Mountains.
History
The history of Central Utah is closely tied to the history of the state of Utah as a whole. The region was first inhabited by Native American tribes, including the Ute, Paiute, and Shoshone. These tribes were nomadic, following the seasonal migrations of the animals they hunted. The first Europeans to explore the region were Spanish explorers in the late 1700s. In the early 1800s, fur trappers and traders began to explore the area, and in 1847, the first Mormon settlers arrived in the Salt Lake Valley.
The Mormon settlers quickly established settlements throughout Central Utah, and the region soon became an important part of the Utah Territory. In the late 1800s, the region experienced a mining boom, as gold, silver, and other minerals were discovered in the area. This led to the establishment of several towns, including Park City, Eureka, and Silver City.
Geography
Central Utah is a region of diverse geography. The region is bordered by the Wasatch Mountains to the east, the Great Basin to the west, the Colorado Plateau to the south, and the Uinta Mountains to the north. The region is home to a variety of landscapes, from the high desert of the Great Basin to the alpine forests of the Wasatch Mountains.
The region is home to several major rivers, including the Green River, the Provo River, and the Sevier River. These rivers provide water for irrigation and recreation, and are home to a variety of fish and wildlife. The region is also home to several major lakes, including Utah Lake, Bear Lake, and Flaming Gorge Reservoir.
Economy
The economy of Central Utah is largely based on agriculture, mining, and tourism. Agriculture is the largest sector of the economy, with crops such as hay, wheat, and corn being grown in the region. Mining is also an important part of the economy, with gold, silver, and other minerals being mined in the area. Tourism is also an important part of the economy, with the region being home to several ski resorts, national parks, and other attractions.
Demographics
As of the 2010 census, the population of Central Utah was 1,072,227. The region is home to a variety of ethnic and racial groups, including White (83.3%), Hispanic or Latino (9.2%), and Native American (2.2%). The region is also home to a variety of religious groups, with the largest being the Church of Jesus Christ of Latter-day Saints (62.2%). The median household income in the region is $50,945, and the median home value is $219,400.
Common Questions
What is Per Capita Income in Central?
Per Capita income in Central is $34,708.
What is the Median Family Income in Central?
Median Family Income in Central is $78,021.
What is the Median Household income in Central?
Median Household Income in Central is $69,444.
What is Income or Wage Gap in Central?
Income or Wage Gap in Central is 23.8%.
Women in Central earn 76.2 cents for every dollar earned by a man.
What is Inequality or Gini Index in Central?
Inequality or Gini Index in Central is 0.32.
What is the Total Population of Central?
Total Population of Central is 902.
What is the Total Male Population of Central?
Total Male Population of Central is 518.
What is the Total Female Population of Central?
Total Female Population of Central is 384.
What is the Ratio of Males per 100 Females in Central?
There are 134.90 Males per 100 Females in Central.
What is the Ratio of Females per 100 Males in Central?
There are 74.13 Females per 100 Males in Central.
What is the Median Population Age in Central?
Median Population Age in Central is 49.4 Years.
What is the Average Family Size in Central
Average Family Size in Central is 2.8 People.
What is the Average Household Size in Central
Average Household Size in Central is 2.6 People.
How Large is the Labor Force in Central?
There are 370 People in the Labor Forcein in Central.
What is the Percentage of People in the Labor Force in Central?
52.9% of People are in the Labor Force in Central.
What is the Unemployment Rate in Central?
Unemployment Rate in Central is 9.5%.