Garland, UT Map & Demographics
Garland Map
Garland Overview
$27,692
PER CAPITA INCOME
$68,750
AVG FAMILY INCOME
$56,332
AVG HOUSEHOLD INCOME
40.7%
WAGE / INCOME GAP [ % ]
59.3¢/ $1
WAGE / INCOME GAP [ $ ]
0.46
INEQUALITY / GINI INDEX
2,579
TOTAL POPULATION
1,156
MALE POPULATION
1,423
FEMALE POPULATION
81.24
MALES / 100 FEMALES
123.10
FEMALES / 100 MALES
28.8
MEDIAN AGE
3.7
AVG FAMILY SIZE
3.0
AVG HOUSEHOLD SIZE
1,103
LABOR FORCE [ PEOPLE ]
64.0%
PERCENT IN LABOR FORCE
3.2%
UNEMPLOYMENT RATE
Garland Zip Codes
Garland Area Codes
Income in Garland
Income Overview in Garland
Per Capita Income in Garland is $27,692, while median incomes of families and households are $68,750 and $56,332 respectively.
| Characteristic | Number | Measure |
| Per Capita Income | 2,579 | $27,692 |
| Median Family Income | 593 | $68,750 |
| Mean Family Income | 593 | $90,364 |
| Median Household Income | 865 | $56,332 |
| Mean Household Income | 865 | $77,593 |
| Income Deficit | 593 | $0 |
| Wage / Income Gap (%) | 2,579 | 40.74% |
| Wage / Income Gap ($) | 2,579 | 59.26¢ per $1 |
| Gini / Inequality Index | 2,579 | 0.46 |
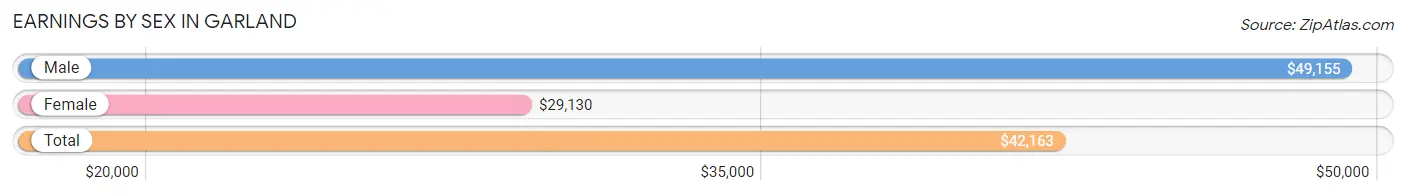
Earnings by Sex in Garland
Average Earnings in Garland are $42,163, $49,155 for men and $29,130 for women, a difference of 40.7%.
| Sex | Number | Average Earnings |
| Male | 645 (57.0%) | $49,155 |
| Female | 486 (43.0%) | $29,130 |
| Total | 1,131 (100.0%) | $42,163 |
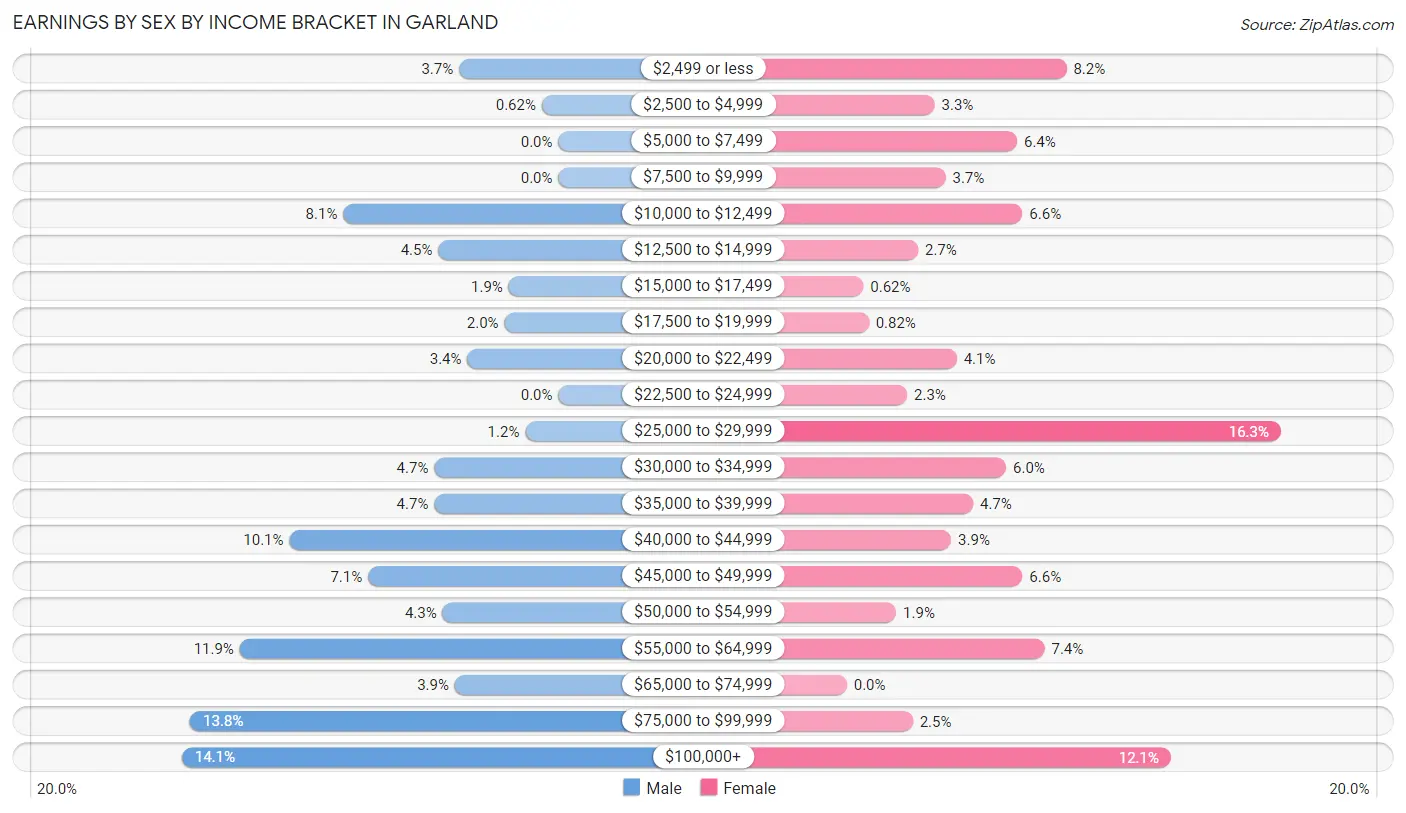
Earnings by Sex by Income Bracket in Garland
The most common earnings brackets in Garland are $100,000+ for men (91 | 14.1%) and $25,000 to $29,999 for women (79 | 16.3%).
| Income | Male | Female |
| $2,499 or less | 24 (3.7%) | 40 (8.2%) |
| $2,500 to $4,999 | 4 (0.6%) | 16 (3.3%) |
| $5,000 to $7,499 | 0 (0.0%) | 31 (6.4%) |
| $7,500 to $9,999 | 0 (0.0%) | 18 (3.7%) |
| $10,000 to $12,499 | 52 (8.1%) | 32 (6.6%) |
| $12,500 to $14,999 | 29 (4.5%) | 13 (2.7%) |
| $15,000 to $17,499 | 12 (1.9%) | 3 (0.6%) |
| $17,500 to $19,999 | 13 (2.0%) | 4 (0.8%) |
| $20,000 to $22,499 | 22 (3.4%) | 20 (4.1%) |
| $22,500 to $24,999 | 0 (0.0%) | 11 (2.3%) |
| $25,000 to $29,999 | 8 (1.2%) | 79 (16.3%) |
| $30,000 to $34,999 | 30 (4.6%) | 29 (6.0%) |
| $35,000 to $39,999 | 30 (4.6%) | 23 (4.7%) |
| $40,000 to $44,999 | 65 (10.1%) | 19 (3.9%) |
| $45,000 to $49,999 | 46 (7.1%) | 32 (6.6%) |
| $50,000 to $54,999 | 28 (4.3%) | 9 (1.8%) |
| $55,000 to $64,999 | 77 (11.9%) | 36 (7.4%) |
| $65,000 to $74,999 | 25 (3.9%) | 0 (0.0%) |
| $75,000 to $99,999 | 89 (13.8%) | 12 (2.5%) |
| $100,000+ | 91 (14.1%) | 59 (12.1%) |
| Total | 645 (100.0%) | 486 (100.0%) |
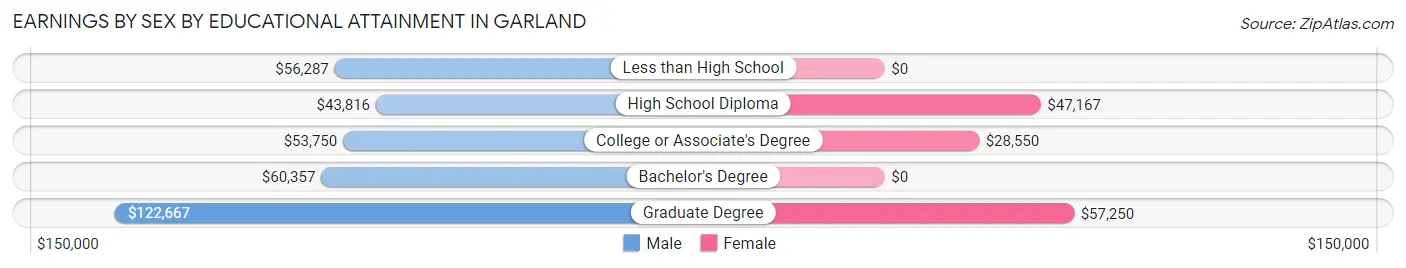
Earnings by Sex by Educational Attainment in Garland
Average earnings in Garland are $51,563 for men and $33,917 for women, a difference of 34.2%. Men with an educational attainment of graduate degree enjoy the highest average annual earnings of $122,667, while those with high school diploma education earn the least with $43,816. Women with an educational attainment of graduate degree earn the most with the average annual earnings of $57,250, while those with college or associate's degree education have the smallest earnings of $28,550.
| Educational Attainment | Male Income | Female Income |
| Less than High School | $56,287 | $0 |
| High School Diploma | $43,816 | $47,167 |
| College or Associate's Degree | $53,750 | $28,550 |
| Bachelor's Degree | $60,357 | $0 |
| Graduate Degree | $122,667 | $57,250 |
| Total | $51,563 | $33,917 |
Family Income in Garland
Family Income Brackets in Garland
According to the Garland family income data, there are 127 families falling into the $100,000 to $149,999 income range, which is the most common income bracket and makes up 21.4% of all families. Conversely, the $25,000 to $34,999 income bracket is the least frequent group with only 12 families (2.0%) belonging to this category.
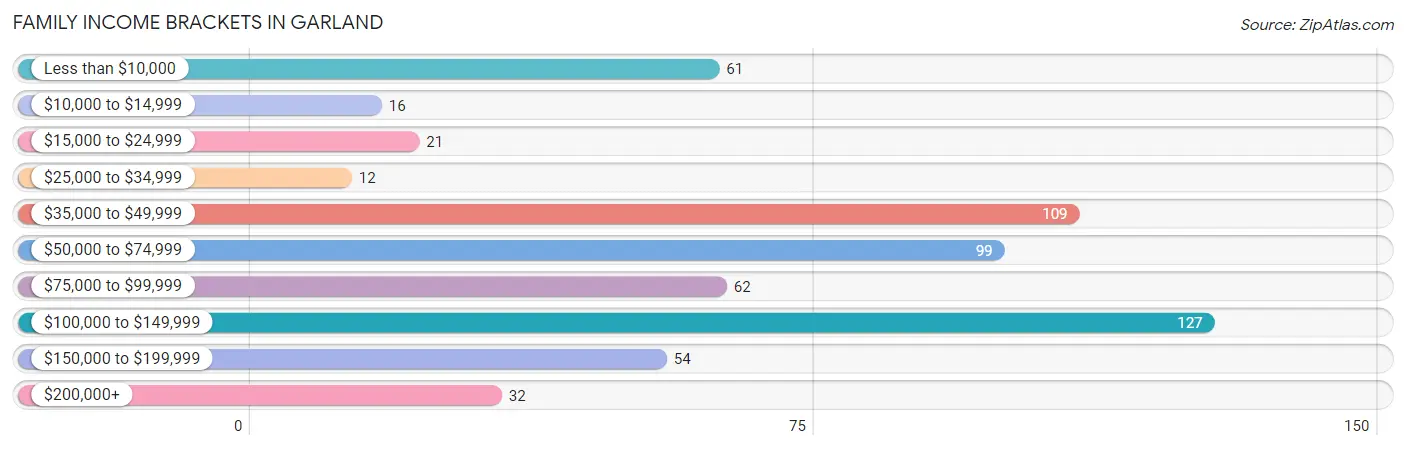
| Income Bracket | # Families | % Families |
| Less than $10,000 | 61 | 10.3% |
| $10,000 to $14,999 | 16 | 2.7% |
| $15,000 to $24,999 | 21 | 3.5% |
| $25,000 to $34,999 | 12 | 2.0% |
| $35,000 to $49,999 | 109 | 18.4% |
| $50,000 to $74,999 | 99 | 16.7% |
| $75,000 to $99,999 | 62 | 10.5% |
| $100,000 to $149,999 | 127 | 21.4% |
| $150,000 to $199,999 | 54 | 9.1% |
| $200,000+ | 32 | 5.4% |
Family Income by Famaliy Size in Garland
7+ person families (18 | 3.0%) account for the highest median family income in Garland with $123,438 per family, while 4-person families (128 | 21.6%) have the highest median income of $28,125 per family member.
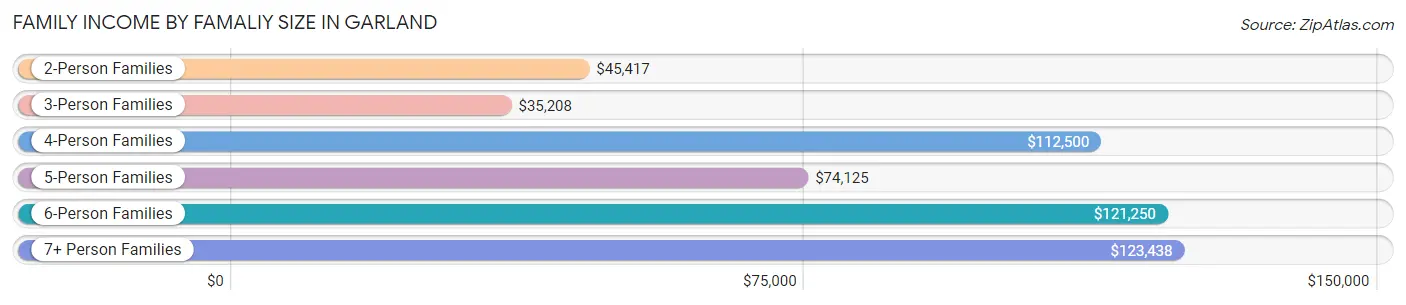
| Income Bracket | # Families | Median Income |
| 2-Person Families | 227 (38.3%) | $45,417 |
| 3-Person Families | 89 (15.0%) | $35,208 |
| 4-Person Families | 128 (21.6%) | $112,500 |
| 5-Person Families | 91 (15.3%) | $74,125 |
| 6-Person Families | 40 (6.8%) | $121,250 |
| 7+ Person Families | 18 (3.0%) | $123,438 |
| Total | 593 (100.0%) | $68,750 |
Family Income by Number of Earners in Garland
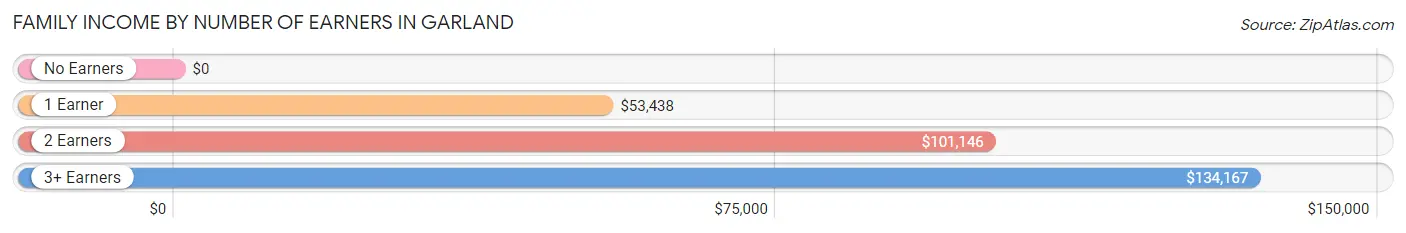
| Number of Earners | # Families | Median Income |
| No Earners | 131 (22.1%) | $0 |
| 1 Earner | 155 (26.1%) | $53,438 |
| 2 Earners | 255 (43.0%) | $101,146 |
| 3+ Earners | 52 (8.8%) | $134,167 |
| Total | 593 (100.0%) | $68,750 |
Household Income in Garland
Household Income Brackets in Garland
With 157 households falling in the category, the $50,000 to $74,999 income range is the most frequent in Garland, accounting for 18.1% of all households. In contrast, only 19 households (2.2%) fall into the less than $10,000 income bracket, making it the least populous group.
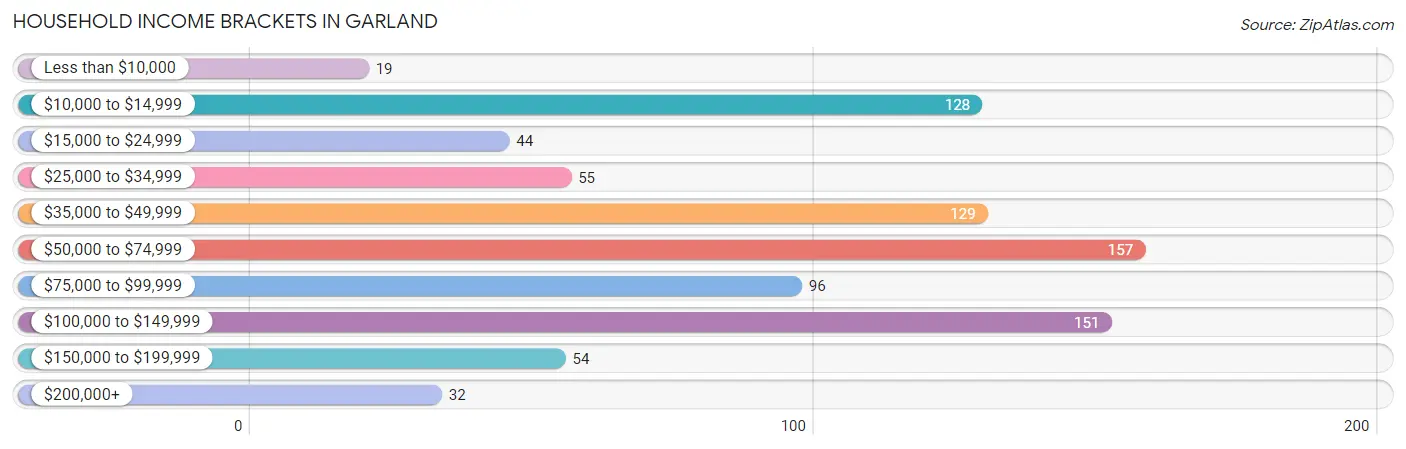
| Income Bracket | # Households | % Households |
| Less than $10,000 | 19 | 2.2% |
| $10,000 to $14,999 | 128 | 14.8% |
| $15,000 to $24,999 | 44 | 5.1% |
| $25,000 to $34,999 | 55 | 6.4% |
| $35,000 to $49,999 | 129 | 14.9% |
| $50,000 to $74,999 | 157 | 18.2% |
| $75,000 to $99,999 | 96 | 11.1% |
| $100,000 to $149,999 | 151 | 17.5% |
| $150,000 to $199,999 | 54 | 6.2% |
| $200,000+ | 32 | 3.7% |
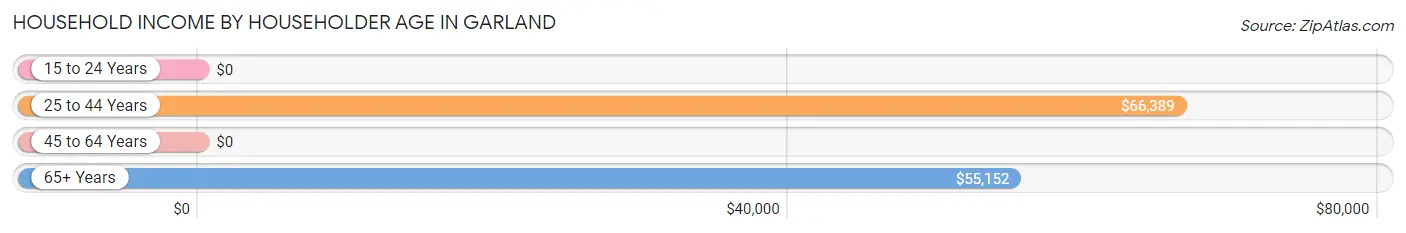
Household Income by Householder Age in Garland
The median household income in Garland is $56,332, with the highest median household income of $66,389 found in the 25 to 44 years age bracket for the primary householder. A total of 434 households (50.2%) fall into this category. Meanwhile, the 15 to 24 years age bracket for the primary householder has the lowest median household income of $0, with 56 households (6.5%) in this group.
| Income Bracket | # Households | Median Income |
| 15 to 24 Years | 56 (6.5%) | $0 |
| 25 to 44 Years | 434 (50.2%) | $66,389 |
| 45 to 64 Years | 198 (22.9%) | $0 |
| 65+ Years | 177 (20.5%) | $55,152 |
| Total | 865 (100.0%) | $56,332 |
Poverty in Garland
Income Below Poverty by Sex and Age in Garland
With 9.6% poverty level for males and 17.6% for females among the residents of Garland, 16 and 17 year old males and 25 to 34 year old females are the most vulnerable to poverty, with 15 males (27.8%) and 120 females (46.5%) in their respective age groups living below the poverty level.
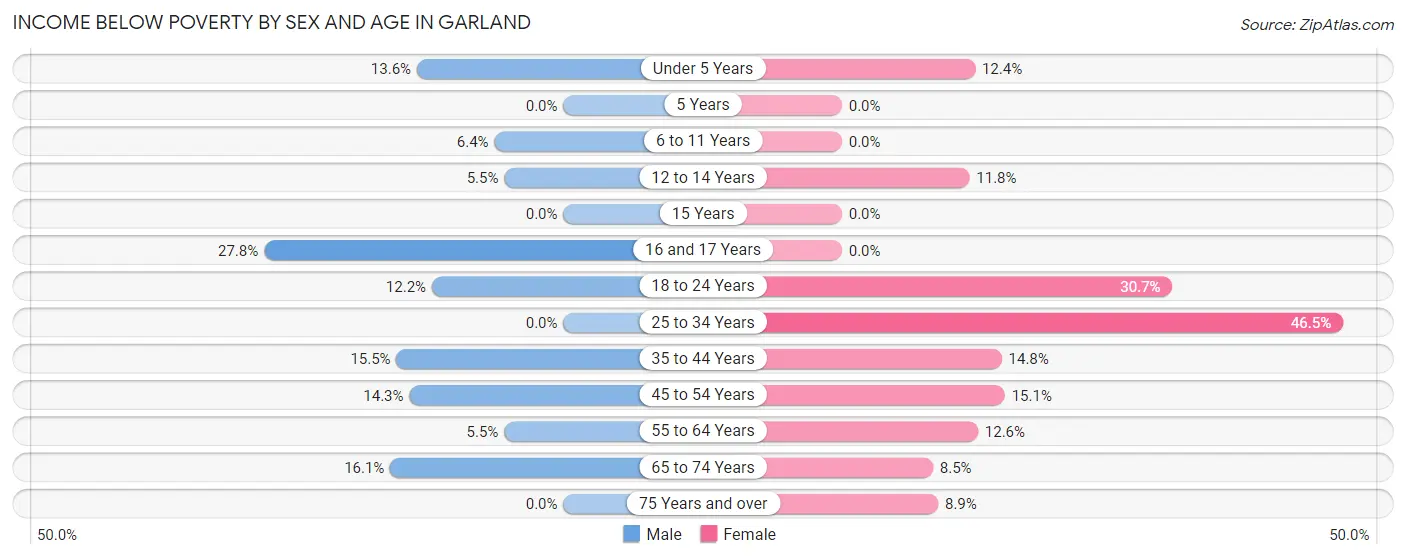
| Age Bracket | Male | Female |
| Under 5 Years | 14 (13.6%) | 22 (12.4%) |
| 5 Years | 0 (0.0%) | 0 (0.0%) |
| 6 to 11 Years | 11 (6.4%) | 0 (0.0%) |
| 12 to 14 Years | 4 (5.5%) | 9 (11.8%) |
| 15 Years | 0 (0.0%) | 0 (0.0%) |
| 16 and 17 Years | 15 (27.8%) | 0 (0.0%) |
| 18 to 24 Years | 10 (12.2%) | 27 (30.7%) |
| 25 to 34 Years | 0 (0.0%) | 120 (46.5%) |
| 35 to 44 Years | 33 (15.5%) | 31 (14.8%) |
| 45 to 54 Years | 10 (14.3%) | 13 (15.1%) |
| 55 to 64 Years | 5 (5.5%) | 12 (12.6%) |
| 65 to 74 Years | 9 (16.1%) | 6 (8.5%) |
| 75 Years and over | 0 (0.0%) | 10 (8.9%) |
| Total | 111 (9.6%) | 250 (17.6%) |
Income Above Poverty by Sex and Age in Garland
According to the poverty statistics in Garland, males aged 5 years and females aged 5 years are the age groups that are most secure financially, with 100.0% of males and 100.0% of females in these age groups living above the poverty line.
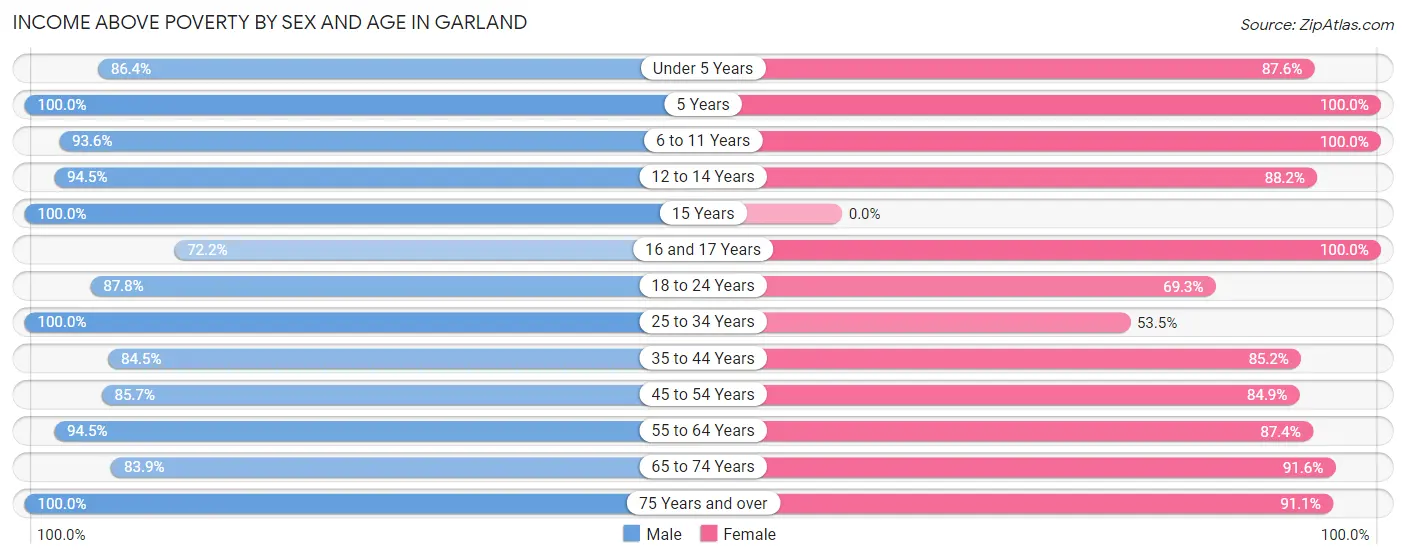
| Age Bracket | Male | Female |
| Under 5 Years | 89 (86.4%) | 156 (87.6%) |
| 5 Years | 27 (100.0%) | 38 (100.0%) |
| 6 to 11 Years | 161 (93.6%) | 177 (100.0%) |
| 12 to 14 Years | 69 (94.5%) | 67 (88.2%) |
| 15 Years | 6 (100.0%) | 0 (0.0%) |
| 16 and 17 Years | 39 (72.2%) | 29 (100.0%) |
| 18 to 24 Years | 72 (87.8%) | 61 (69.3%) |
| 25 to 34 Years | 185 (100.0%) | 138 (53.5%) |
| 35 to 44 Years | 180 (84.5%) | 178 (85.2%) |
| 45 to 54 Years | 60 (85.7%) | 73 (84.9%) |
| 55 to 64 Years | 86 (94.5%) | 83 (87.4%) |
| 65 to 74 Years | 47 (83.9%) | 65 (91.5%) |
| 75 Years and over | 24 (100.0%) | 102 (91.1%) |
| Total | 1,045 (90.4%) | 1,167 (82.4%) |
Income Below Poverty Among Married-Couple Families in Garland
The poverty statistics for married-couple families in Garland show that 5.5% or 26 of the total 471 families live below the poverty line. Families with 1 or 2 children have the highest poverty rate of 9.6%, comprising of 16 families. On the other hand, families with 3 or 4 children have the lowest poverty rate of 0.0%, which includes 0 families.
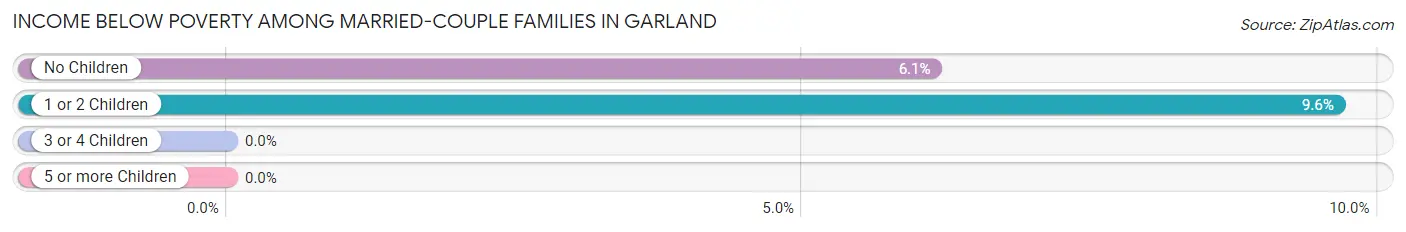
| Children | Above Poverty | Below Poverty |
| No Children | 153 (93.9%) | 10 (6.1%) |
| 1 or 2 Children | 150 (90.4%) | 16 (9.6%) |
| 3 or 4 Children | 128 (100.0%) | 0 (0.0%) |
| 5 or more Children | 14 (100.0%) | 0 (0.0%) |
| Total | 445 (94.5%) | 26 (5.5%) |
Income Below Poverty Among Single-Parent Households in Garland
According to the poverty data in Garland, 28.6% or 6 single-father households and 59.4% or 60 single-mother households are living below the poverty line. Among single-father households, those with 1 or 2 children have the highest poverty rate, with 6 households (50.0%) experiencing poverty. Likewise, among single-mother households, those with 1 or 2 children have the highest poverty rate, with 60 households (75.9%) falling below the poverty line.
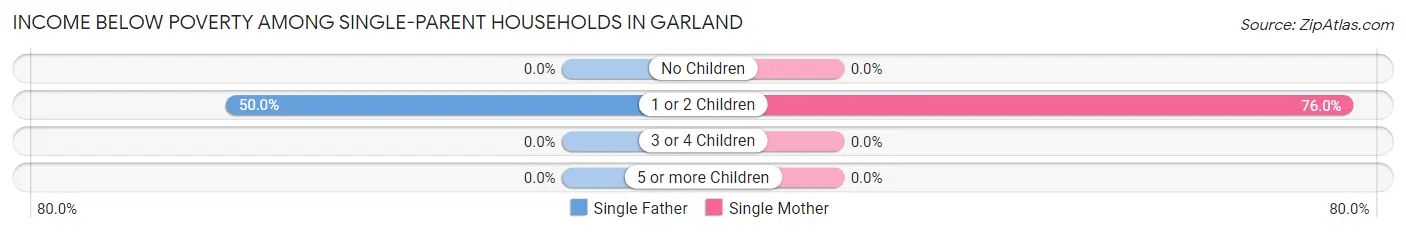
| Children | Single Father | Single Mother |
| No Children | 0 (0.0%) | 0 (0.0%) |
| 1 or 2 Children | 6 (50.0%) | 60 (75.9%) |
| 3 or 4 Children | 0 (0.0%) | 0 (0.0%) |
| 5 or more Children | 0 (0.0%) | 0 (0.0%) |
| Total | 6 (28.6%) | 60 (59.4%) |
Income Below Poverty Among Married-Couple vs Single-Parent Households in Garland
The poverty data for Garland shows that 26 of the married-couple family households (5.5%) and 66 of the single-parent households (54.1%) are living below the poverty level. Within the married-couple family households, those with 1 or 2 children have the highest poverty rate, with 16 households (9.6%) falling below the poverty line. Among the single-parent households, those with 1 or 2 children have the highest poverty rate, with 66 household (72.5%) living below poverty.
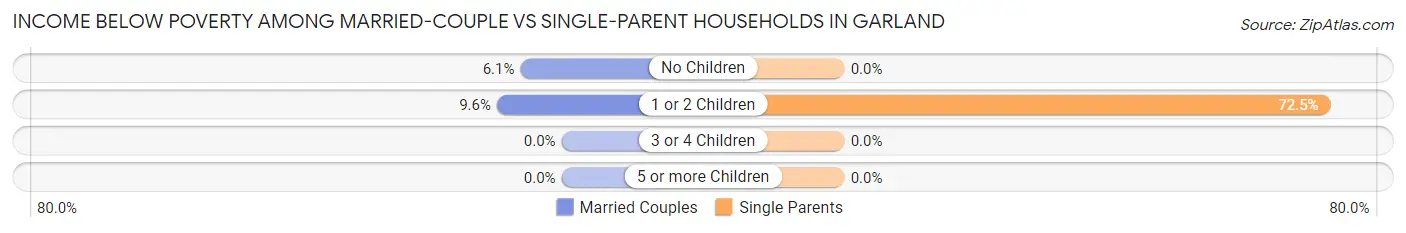
| Children | Married-Couple Families | Single-Parent Households |
| No Children | 10 (6.1%) | 0 (0.0%) |
| 1 or 2 Children | 16 (9.6%) | 66 (72.5%) |
| 3 or 4 Children | 0 (0.0%) | 0 (0.0%) |
| 5 or more Children | 0 (0.0%) | 0 (0.0%) |
| Total | 26 (5.5%) | 66 (54.1%) |
Race in Garland
The most populous races in Garland are White / Caucasian (2,216 | 85.9%), Hispanic or Latino (514 | 19.9%), and Two or more Races (241 | 9.3%).
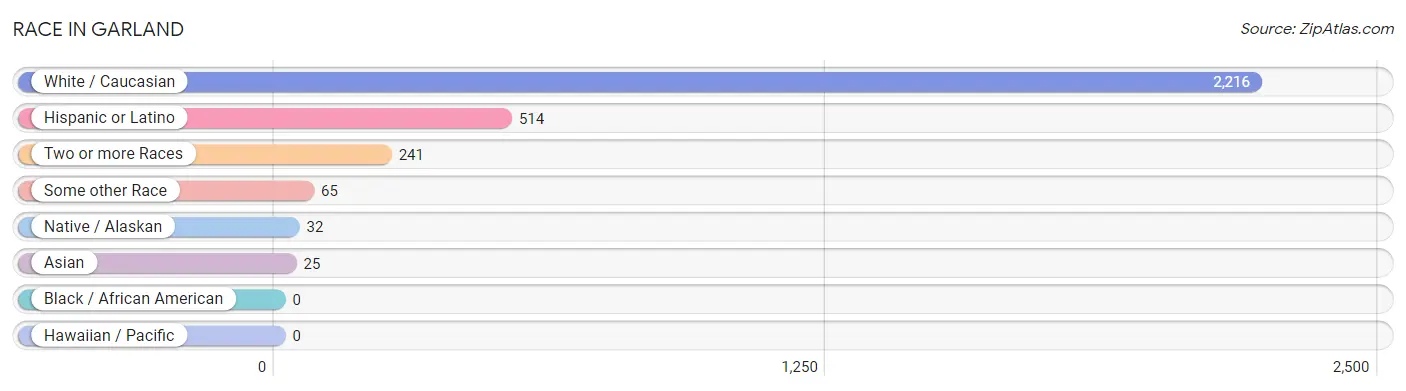
| Race | # Population | % Population |
| Asian | 25 | 1.0% |
| Black / African American | 0 | 0.0% |
| Hawaiian / Pacific | 0 | 0.0% |
| Hispanic or Latino | 514 | 19.9% |
| Native / Alaskan | 32 | 1.2% |
| White / Caucasian | 2,216 | 85.9% |
| Two or more Races | 241 | 9.3% |
| Some other Race | 65 | 2.5% |
| Total | 2,579 | 100.0% |
Ancestry in Garland
The most populous ancestries reported in Garland are English (692 | 26.8%), Mexican (453 | 17.6%), German (386 | 15.0%), American (205 | 8.0%), and Danish (151 | 5.9%), together accounting for 73.2% of all Garland residents.
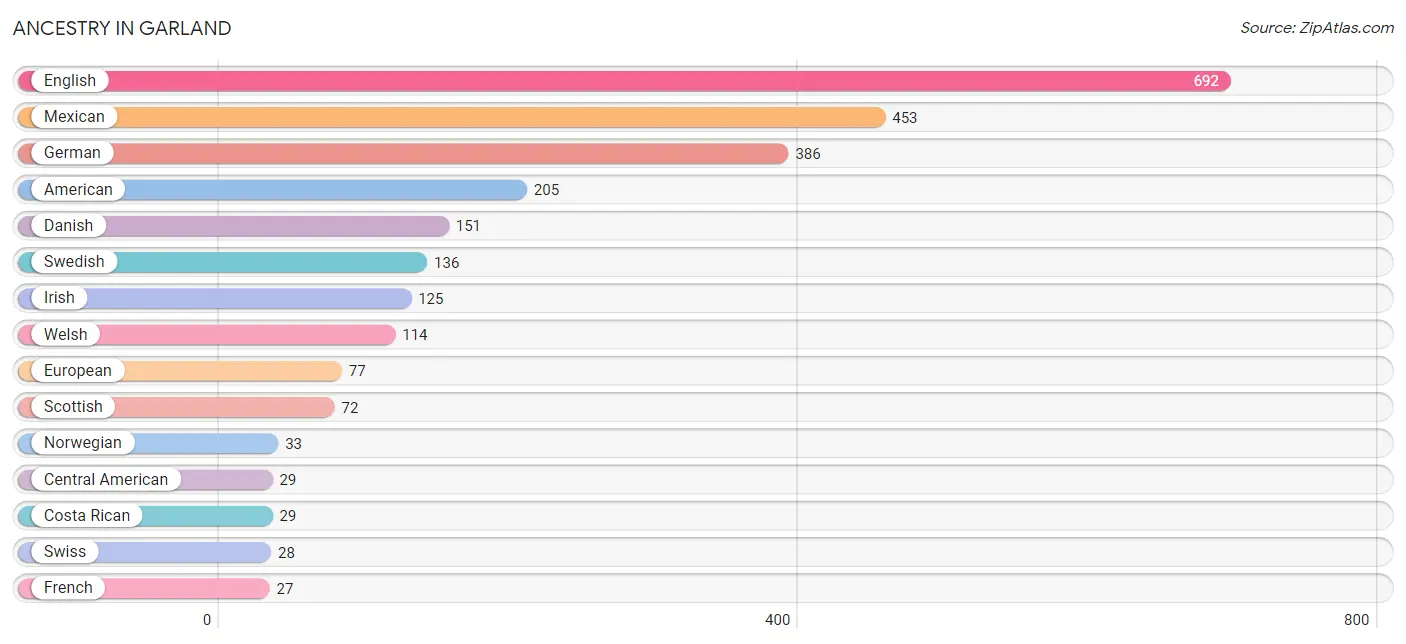
| Ancestry | # Population | % Population |
| American | 205 | 8.0% |
| Austrian | 6 | 0.2% |
| Bhutanese | 2 | 0.1% |
| British | 5 | 0.2% |
| Central American | 29 | 1.1% |
| Costa Rican | 29 | 1.1% |
| Czechoslovakian | 25 | 1.0% |
| Danish | 151 | 5.9% |
| Dutch | 11 | 0.4% |
| English | 692 | 26.8% |
| European | 77 | 3.0% |
| French | 27 | 1.1% |
| German | 386 | 15.0% |
| Icelander | 6 | 0.2% |
| Irish | 125 | 4.9% |
| Italian | 20 | 0.8% |
| Japanese | 23 | 0.9% |
| Korean | 8 | 0.3% |
| Mexican | 453 | 17.6% |
| Mexican American Indian | 12 | 0.5% |
| Navajo | 6 | 0.2% |
| Northern European | 4 | 0.2% |
| Norwegian | 33 | 1.3% |
| Russian | 6 | 0.2% |
| Scandinavian | 5 | 0.2% |
| Scotch-Irish | 10 | 0.4% |
| Scottish | 72 | 2.8% |
| Swedish | 136 | 5.3% |
| Swiss | 28 | 1.1% |
| Welsh | 114 | 4.4% | View All 30 Rows |
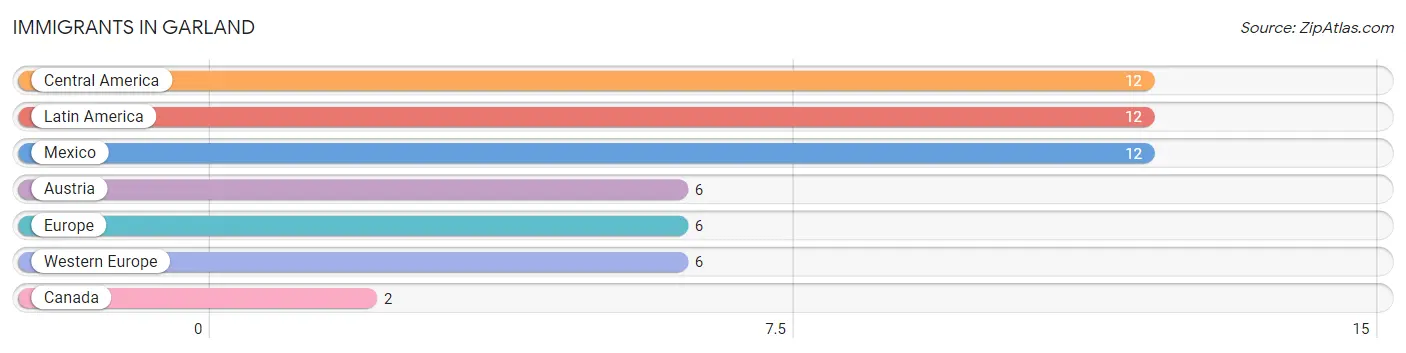
Immigrants in Garland
The most numerous immigrant groups reported in Garland came from Central America (12 | 0.5%), Latin America (12 | 0.5%), Mexico (12 | 0.5%), Austria (6 | 0.2%), and Europe (6 | 0.2%), together accounting for 1.9% of all Garland residents.
| Immigration Origin | # Population | % Population |
| Austria | 6 | 0.2% |
| Canada | 2 | 0.1% |
| Central America | 12 | 0.5% |
| Europe | 6 | 0.2% |
| Latin America | 12 | 0.5% |
| Mexico | 12 | 0.5% |
| Western Europe | 6 | 0.2% | View All 7 Rows |
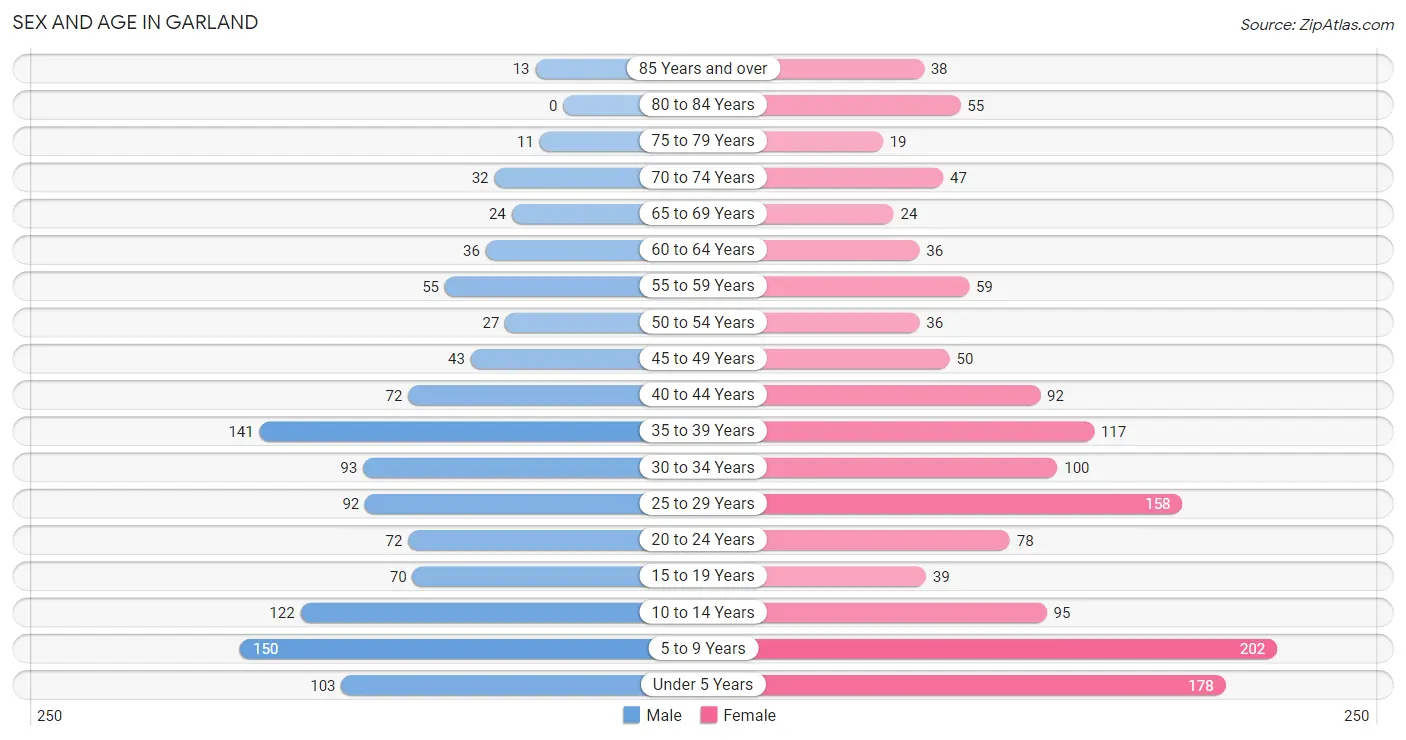
Sex and Age in Garland
Sex and Age in Garland
The most populous age groups in Garland are 5 to 9 Years (150 | 13.0%) for men and 5 to 9 Years (202 | 14.2%) for women.
| Age Bracket | Male | Female |
| Under 5 Years | 103 (8.9%) | 178 (12.5%) |
| 5 to 9 Years | 150 (13.0%) | 202 (14.2%) |
| 10 to 14 Years | 122 (10.5%) | 95 (6.7%) |
| 15 to 19 Years | 70 (6.1%) | 39 (2.7%) |
| 20 to 24 Years | 72 (6.2%) | 78 (5.5%) |
| 25 to 29 Years | 92 (8.0%) | 158 (11.1%) |
| 30 to 34 Years | 93 (8.0%) | 100 (7.0%) |
| 35 to 39 Years | 141 (12.2%) | 117 (8.2%) |
| 40 to 44 Years | 72 (6.2%) | 92 (6.5%) |
| 45 to 49 Years | 43 (3.7%) | 50 (3.5%) |
| 50 to 54 Years | 27 (2.3%) | 36 (2.5%) |
| 55 to 59 Years | 55 (4.8%) | 59 (4.2%) |
| 60 to 64 Years | 36 (3.1%) | 36 (2.5%) |
| 65 to 69 Years | 24 (2.1%) | 24 (1.7%) |
| 70 to 74 Years | 32 (2.8%) | 47 (3.3%) |
| 75 to 79 Years | 11 (0.9%) | 19 (1.3%) |
| 80 to 84 Years | 0 (0.0%) | 55 (3.9%) |
| 85 Years and over | 13 (1.1%) | 38 (2.7%) |
| Total | 1,156 (100.0%) | 1,423 (100.0%) |
Families and Households in Garland
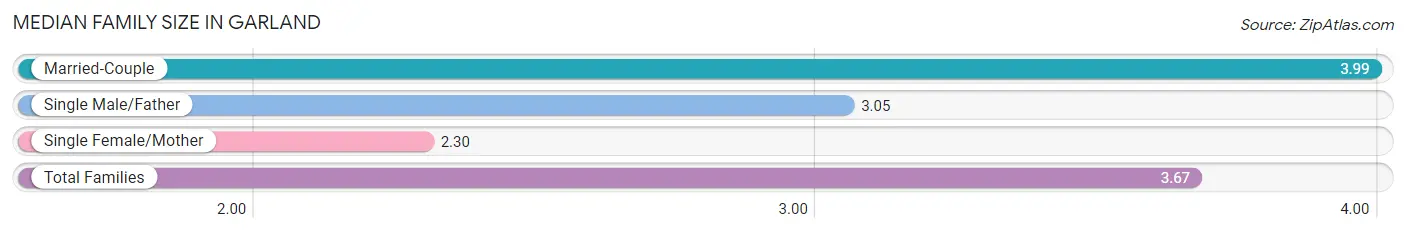
Median Family Size in Garland
The median family size in Garland is 3.67 persons per family, with married-couple families (471 | 79.4%) accounting for the largest median family size of 3.99 persons per family. On the other hand, single female/mother families (101 | 17.0%) represent the smallest median family size with 2.30 persons per family.
| Family Type | # Families | Family Size |
| Married-Couple | 471 (79.4%) | 3.99 |
| Single Male/Father | 21 (3.5%) | 3.05 |
| Single Female/Mother | 101 (17.0%) | 2.30 |
| Total Families | 593 (100.0%) | 3.67 |
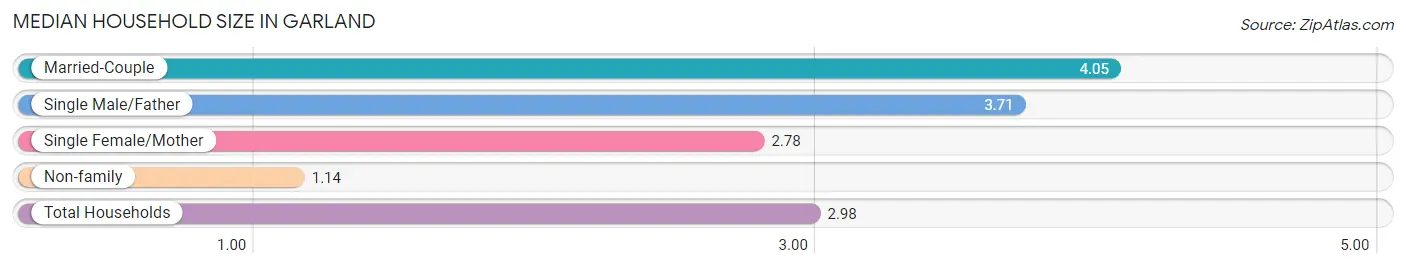
Median Household Size in Garland
The median household size in Garland is 2.98 persons per household, with married-couple households (471 | 54.4%) accounting for the largest median household size of 4.05 persons per household. non-family households (272 | 31.5%) represent the smallest median household size with 1.14 persons per household.
| Household Type | # Households | Household Size |
| Married-Couple | 471 (54.4%) | 4.05 |
| Single Male/Father | 21 (2.4%) | 3.71 |
| Single Female/Mother | 101 (11.7%) | 2.78 |
| Non-family | 272 (31.5%) | 1.14 |
| Total Households | 865 (100.0%) | 2.98 |
Household Size by Marriage Status in Garland
Out of a total of 865 households in Garland, 593 (68.5%) are family households, while 272 (31.5%) are nonfamily households. The most numerous type of family households are 2-person households, comprising 176, and the most common type of nonfamily households are 1-person households, comprising 238.
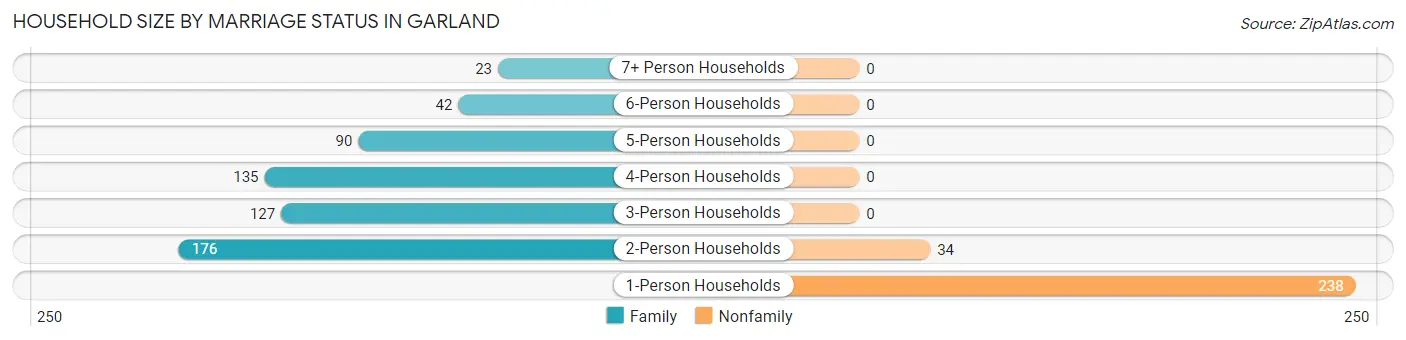
| Household Size | Family Households | Nonfamily Households |
| 1-Person Households | - | 238 (27.5%) |
| 2-Person Households | 176 (20.3%) | 34 (3.9%) |
| 3-Person Households | 127 (14.7%) | 0 (0.0%) |
| 4-Person Households | 135 (15.6%) | 0 (0.0%) |
| 5-Person Households | 90 (10.4%) | 0 (0.0%) |
| 6-Person Households | 42 (4.9%) | 0 (0.0%) |
| 7+ Person Households | 23 (2.7%) | 0 (0.0%) |
| Total | 593 (68.5%) | 272 (31.5%) |
Female Fertility in Garland
Fertility by Age in Garland
Average fertility rate in Garland is 69.0 births per 1,000 women. Women in the age bracket of 20 to 34 years have the highest fertility rate with 122.0 births per 1,000 women. Women in the age bracket of 20 to 34 years acount for 93.2% of all women with births.
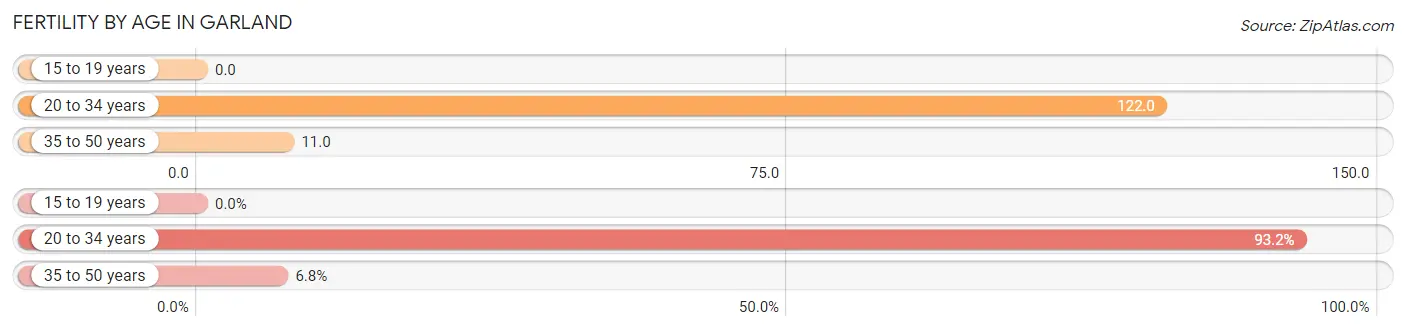
| Age Bracket | Women with Births | Births / 1,000 Women |
| 15 to 19 years | 0 (0.0%) | 0.0 |
| 20 to 34 years | 41 (93.2%) | 122.0 |
| 35 to 50 years | 3 (6.8%) | 11.0 |
| Total | 44 (100.0%) | 69.0 |
Fertility by Age by Marriage Status in Garland
86.4% of women with births (44) in Garland are married. The highest percentage of unmarried women with births falls into 20 to 34 years age bracket with 14.6% of them unmarried at the time of birth, while the lowest percentage of unmarried women with births belong to 35 to 50 years age bracket with 0.0% of them unmarried.
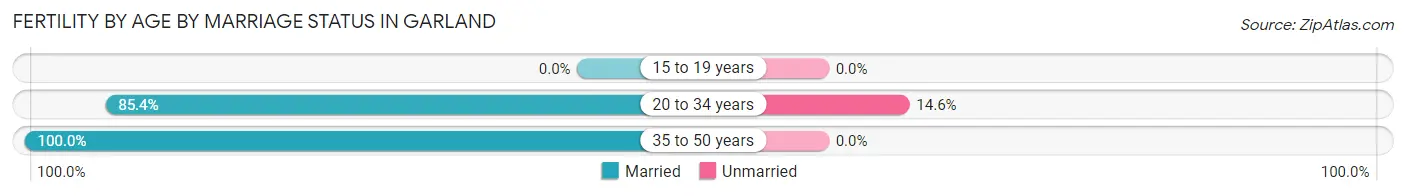
| Age Bracket | Married | Unmarried |
| 15 to 19 years | 0 (0.0%) | 0 (0.0%) |
| 20 to 34 years | 35 (85.4%) | 6 (14.6%) |
| 35 to 50 years | 3 (100.0%) | 0 (0.0%) |
| Total | 38 (86.4%) | 6 (13.6%) |
Fertility by Education in Garland
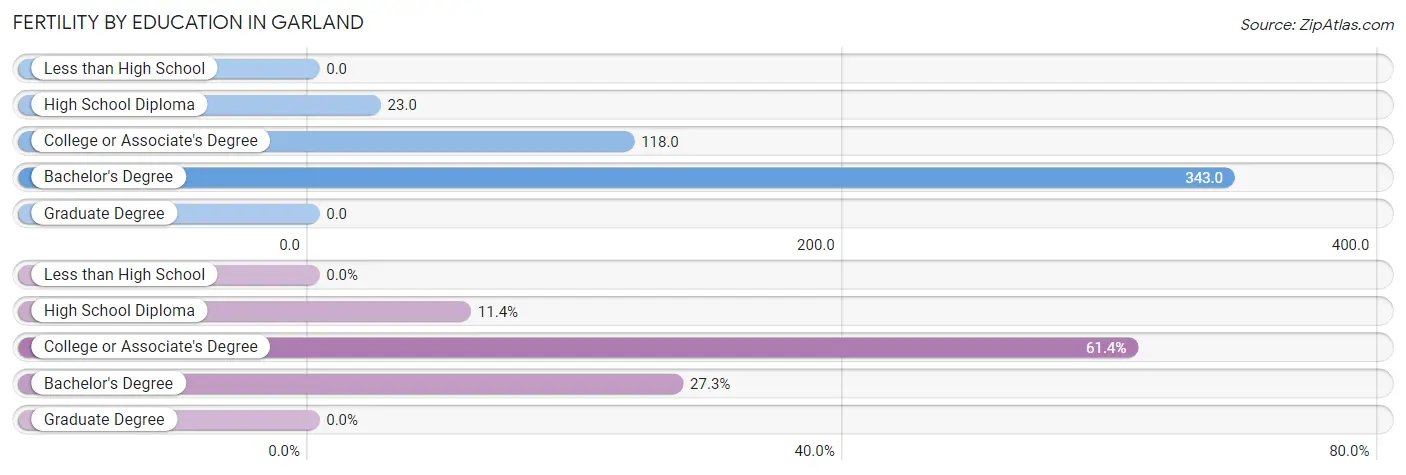
| Educational Attainment | Women with Births | Births / 1,000 Women |
| Less than High School | 0 (0.0%) | 0.0 |
| High School Diploma | 5 (11.4%) | 23.0 |
| College or Associate's Degree | 27 (61.4%) | 118.0 |
| Bachelor's Degree | 12 (27.3%) | 343.0 |
| Graduate Degree | 0 (0.0%) | 0.0 |
| Total | 44 (100.0%) | 69.0 |
Fertility by Education by Marriage Status in Garland
13.6% of women with births in Garland are unmarried. Women with the educational attainment of high school diploma are most likely to be married with 100.0% of them married at childbirth, while women with the educational attainment of college or associate's degree are least likely to be married with 22.2% of them unmarried at childbirth.
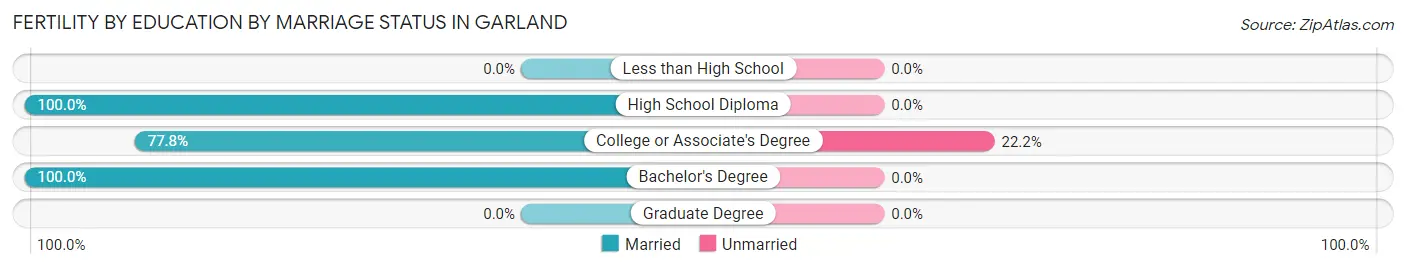
| Educational Attainment | Married | Unmarried |
| Less than High School | 0 (0.0%) | 0 (0.0%) |
| High School Diploma | 5 (100.0%) | 0 (0.0%) |
| College or Associate's Degree | 21 (77.8%) | 6 (22.2%) |
| Bachelor's Degree | 12 (100.0%) | 0 (0.0%) |
| Graduate Degree | 0 (0.0%) | 0 (0.0%) |
| Total | 38 (86.4%) | 6 (13.6%) |
Employment Characteristics in Garland
Employment by Class of Employer in Garland
Among the 1,067 employed individuals in Garland, private company employees (830 | 77.8%), local government employees (61 | 5.7%), and state government employees (55 | 5.1%) make up the most common classes of employment.
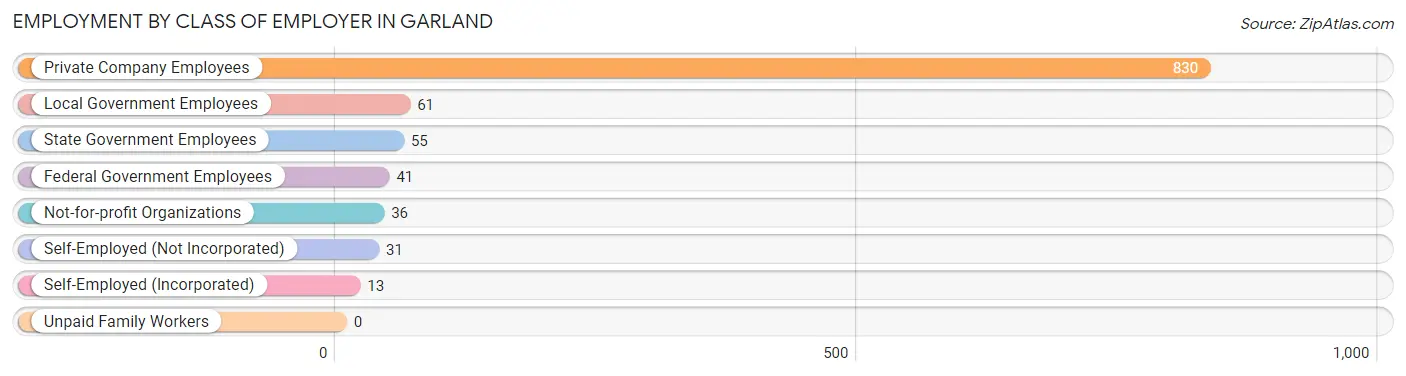
| Employer Class | # Employees | % Employees |
| Private Company Employees | 830 | 77.8% |
| Self-Employed (Incorporated) | 13 | 1.2% |
| Self-Employed (Not Incorporated) | 31 | 2.9% |
| Not-for-profit Organizations | 36 | 3.4% |
| Local Government Employees | 61 | 5.7% |
| State Government Employees | 55 | 5.1% |
| Federal Government Employees | 41 | 3.8% |
| Unpaid Family Workers | 0 | 0.0% |
| Total | 1,067 | 100.0% |
Employment Status by Age in Garland
According to the labor force statistics for Garland, out of the total population over 16 years of age (1,723), 64.0% or 1,103 individuals are in the labor force, with 3.2% or 35 of them unemployed. The age group with the highest labor force participation rate is 20 to 24 years, with 91.3% or 137 individuals in the labor force. Within the labor force, the 16 to 19 years age range has the highest percentage of unemployed individuals, with 22.0% or 11 of them being unemployed.
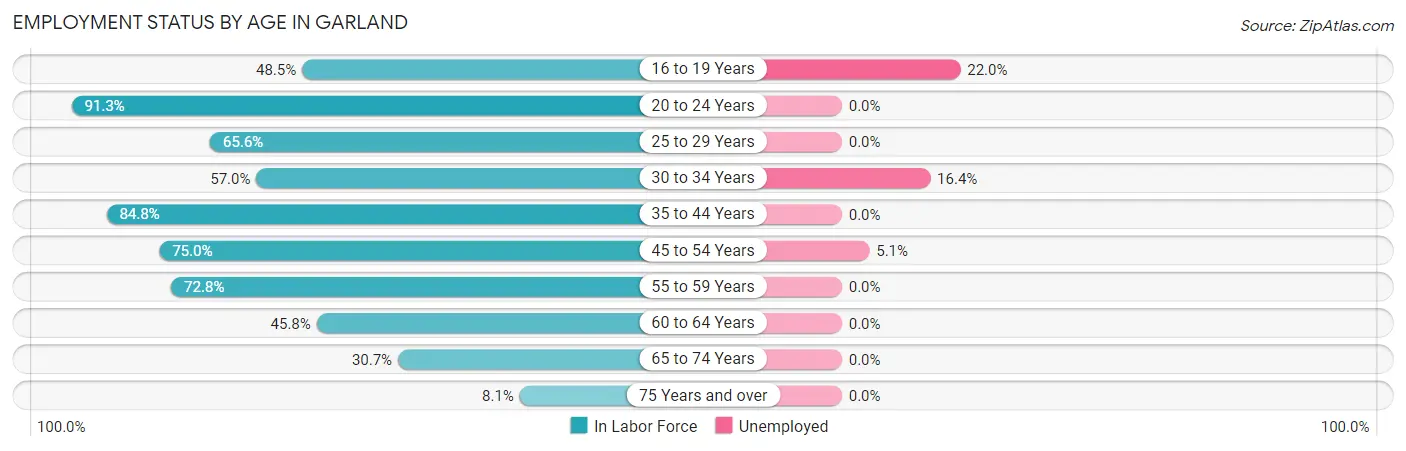
| Age Bracket | In Labor Force | Unemployed |
| 16 to 19 Years | 50 (48.5%) | 11 (22.0%) |
| 20 to 24 Years | 137 (91.3%) | 0 (0.0%) |
| 25 to 29 Years | 164 (65.6%) | 0 (0.0%) |
| 30 to 34 Years | 110 (57.0%) | 18 (16.4%) |
| 35 to 44 Years | 358 (84.8%) | 0 (0.0%) |
| 45 to 54 Years | 117 (75.0%) | 6 (5.1%) |
| 55 to 59 Years | 83 (72.8%) | 0 (0.0%) |
| 60 to 64 Years | 33 (45.8%) | 0 (0.0%) |
| 65 to 74 Years | 39 (30.7%) | 0 (0.0%) |
| 75 Years and over | 11 (8.1%) | 0 (0.0%) |
| Total | 1,103 (64.0%) | 35 (3.2%) |
Employment Status by Educational Attainment in Garland
According to labor force statistics for Garland, 71.7% of individuals (865) out of the total population between 25 and 64 years of age (1,207) are in the labor force, with 2.8% or 24 of them being unemployed. The group with the highest labor force participation rate are those with the educational attainment of high school diploma, with 80.4% or 374 individuals in the labor force. Within the labor force, individuals with high school diploma education have the highest percentage of unemployment, with 5.6% or 21 of them being unemployed.
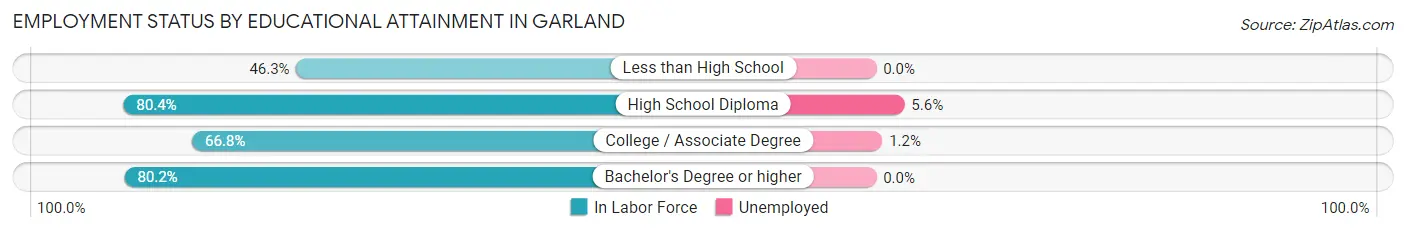
| Educational Attainment | In Labor Force | Unemployed |
| Less than High School | 74 (46.3%) | 0 (0.0%) |
| High School Diploma | 374 (80.4%) | 26 (5.6%) |
| College / Associate Degree | 247 (66.8%) | 4 (1.2%) |
| Bachelor's Degree or higher | 170 (80.2%) | 0 (0.0%) |
| Total | 865 (71.7%) | 34 (2.8%) |
Employment Occupations by Sex in Garland
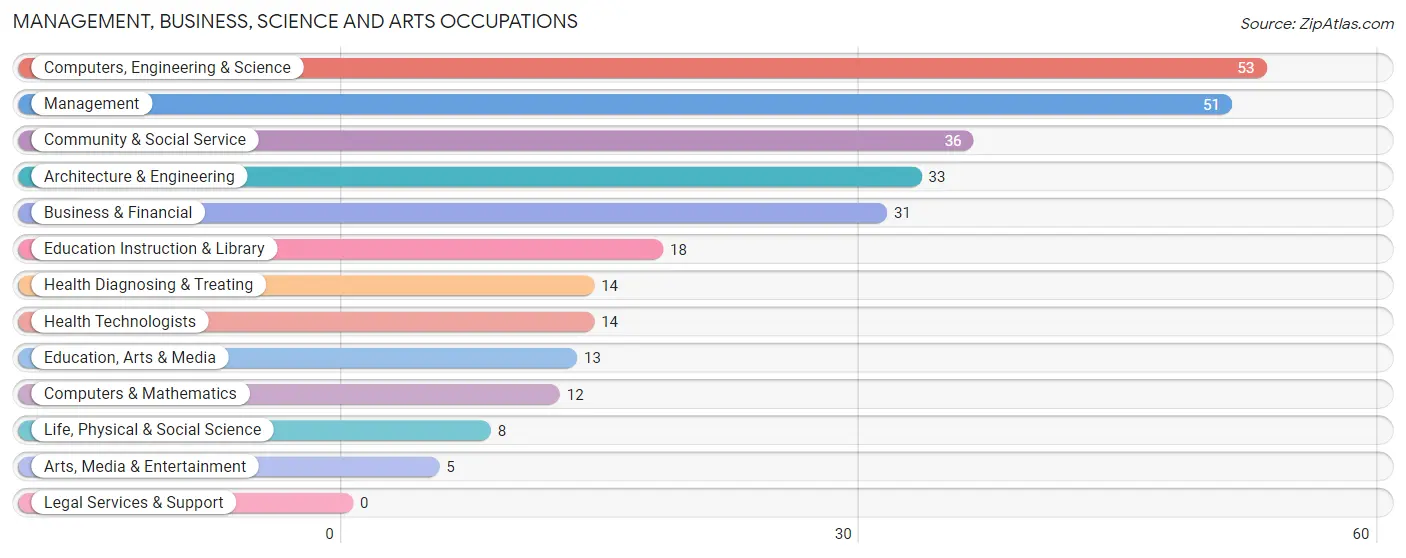
Management, Business, Science and Arts Occupations
The most common Management, Business, Science and Arts occupations in Garland are Computers, Engineering & Science (53 | 5.0%), Management (51 | 4.8%), Community & Social Service (36 | 3.4%), Architecture & Engineering (33 | 3.1%), and Business & Financial (31 | 2.9%).
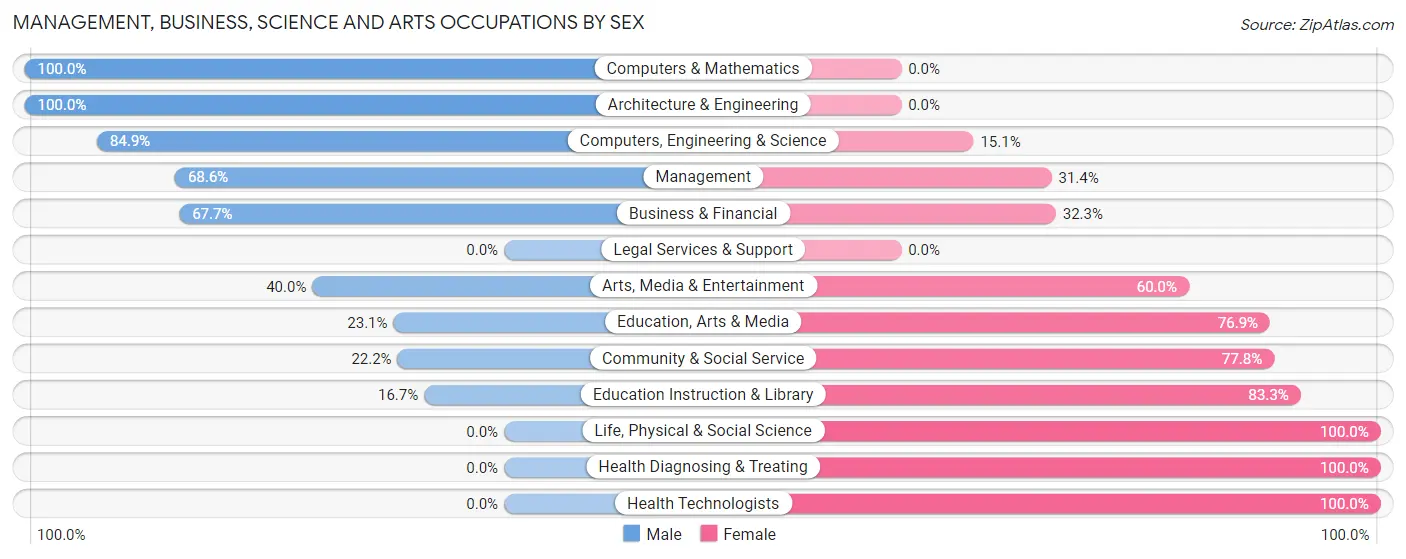
Management, Business, Science and Arts Occupations by Sex
Within the Management, Business, Science and Arts occupations in Garland, the most male-oriented occupations are Computers & Mathematics (100.0%), Architecture & Engineering (100.0%), and Computers, Engineering & Science (84.9%), while the most female-oriented occupations are Life, Physical & Social Science (100.0%), Health Diagnosing & Treating (100.0%), and Health Technologists (100.0%).
| Occupation | Male | Female |
| Management | 35 (68.6%) | 16 (31.4%) |
| Business & Financial | 21 (67.7%) | 10 (32.3%) |
| Computers, Engineering & Science | 45 (84.9%) | 8 (15.1%) |
| Computers & Mathematics | 12 (100.0%) | 0 (0.0%) |
| Architecture & Engineering | 33 (100.0%) | 0 (0.0%) |
| Life, Physical & Social Science | 0 (0.0%) | 8 (100.0%) |
| Community & Social Service | 8 (22.2%) | 28 (77.8%) |
| Education, Arts & Media | 3 (23.1%) | 10 (76.9%) |
| Legal Services & Support | 0 (0.0%) | 0 (0.0%) |
| Education Instruction & Library | 3 (16.7%) | 15 (83.3%) |
| Arts, Media & Entertainment | 2 (40.0%) | 3 (60.0%) |
| Health Diagnosing & Treating | 0 (0.0%) | 14 (100.0%) |
| Health Technologists | 0 (0.0%) | 14 (100.0%) |
| Total (Category) | 109 (58.9%) | 76 (41.1%) |
| Total (Overall) | 615 (57.6%) | 452 (42.4%) |
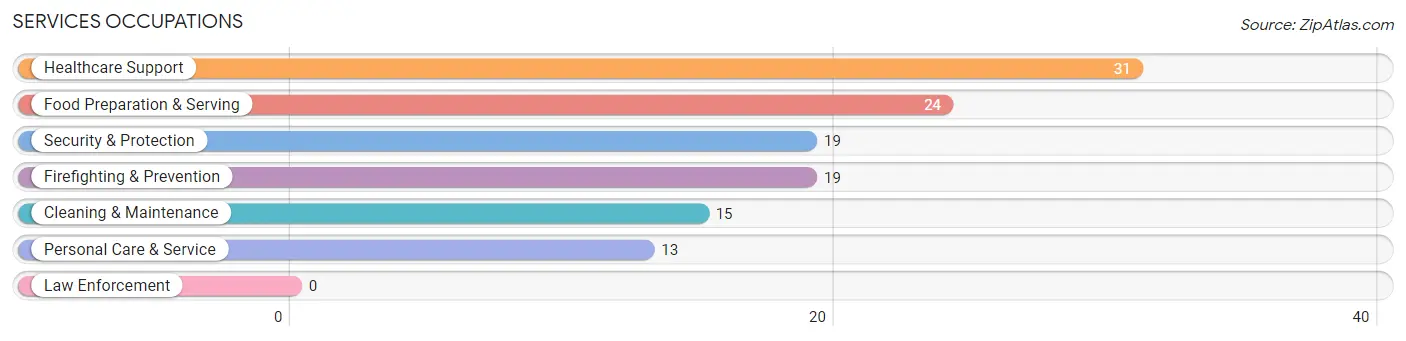
Services Occupations
The most common Services occupations in Garland are Healthcare Support (31 | 2.9%), Food Preparation & Serving (24 | 2.2%), Security & Protection (19 | 1.8%), Firefighting & Prevention (19 | 1.8%), and Cleaning & Maintenance (15 | 1.4%).
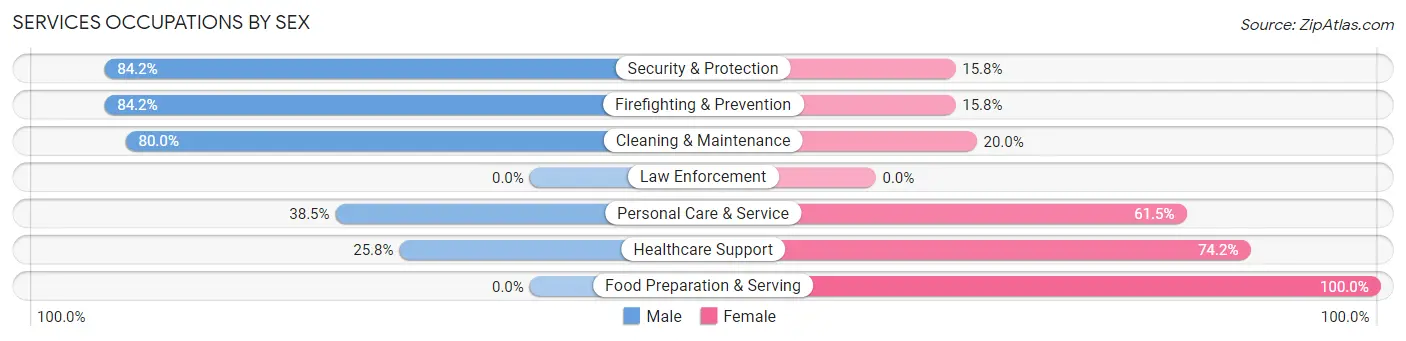
Services Occupations by Sex
Within the Services occupations in Garland, the most male-oriented occupations are Security & Protection (84.2%), Firefighting & Prevention (84.2%), and Cleaning & Maintenance (80.0%), while the most female-oriented occupations are Food Preparation & Serving (100.0%), Healthcare Support (74.2%), and Personal Care & Service (61.5%).
| Occupation | Male | Female |
| Healthcare Support | 8 (25.8%) | 23 (74.2%) |
| Security & Protection | 16 (84.2%) | 3 (15.8%) |
| Firefighting & Prevention | 16 (84.2%) | 3 (15.8%) |
| Law Enforcement | 0 (0.0%) | 0 (0.0%) |
| Food Preparation & Serving | 0 (0.0%) | 24 (100.0%) |
| Cleaning & Maintenance | 12 (80.0%) | 3 (20.0%) |
| Personal Care & Service | 5 (38.5%) | 8 (61.5%) |
| Total (Category) | 41 (40.2%) | 61 (59.8%) |
| Total (Overall) | 615 (57.6%) | 452 (42.4%) |
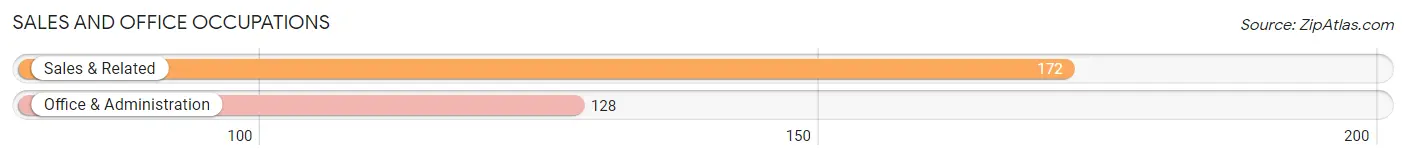
Sales and Office Occupations
The most common Sales and Office occupations in Garland are Sales & Related (172 | 16.1%), and Office & Administration (128 | 12.0%).
Sales and Office Occupations by Sex
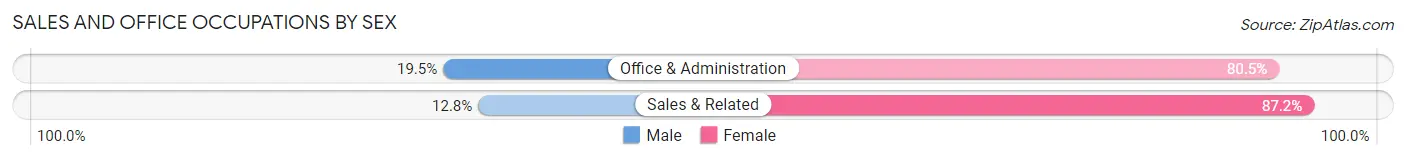
| Occupation | Male | Female |
| Sales & Related | 22 (12.8%) | 150 (87.2%) |
| Office & Administration | 25 (19.5%) | 103 (80.5%) |
| Total (Category) | 47 (15.7%) | 253 (84.3%) |
| Total (Overall) | 615 (57.6%) | 452 (42.4%) |
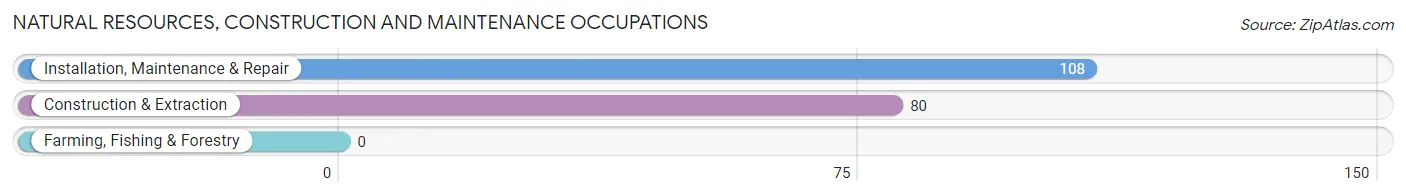
Natural Resources, Construction and Maintenance Occupations
The most common Natural Resources, Construction and Maintenance occupations in Garland are Installation, Maintenance & Repair (108 | 10.1%), and Construction & Extraction (80 | 7.5%).
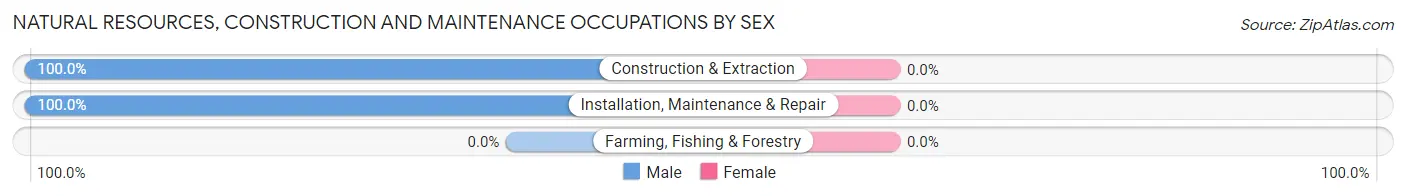
Natural Resources, Construction and Maintenance Occupations by Sex
| Occupation | Male | Female |
| Farming, Fishing & Forestry | 0 (0.0%) | 0 (0.0%) |
| Construction & Extraction | 80 (100.0%) | 0 (0.0%) |
| Installation, Maintenance & Repair | 108 (100.0%) | 0 (0.0%) |
| Total (Category) | 188 (100.0%) | 0 (0.0%) |
| Total (Overall) | 615 (57.6%) | 452 (42.4%) |
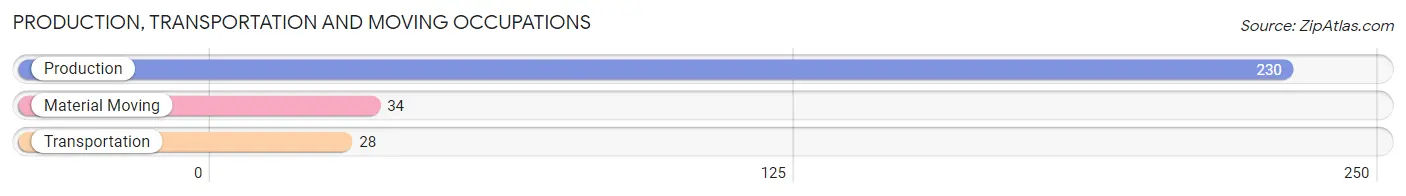
Production, Transportation and Moving Occupations
The most common Production, Transportation and Moving occupations in Garland are Production (230 | 21.6%), Material Moving (34 | 3.2%), and Transportation (28 | 2.6%).
Production, Transportation and Moving Occupations by Sex
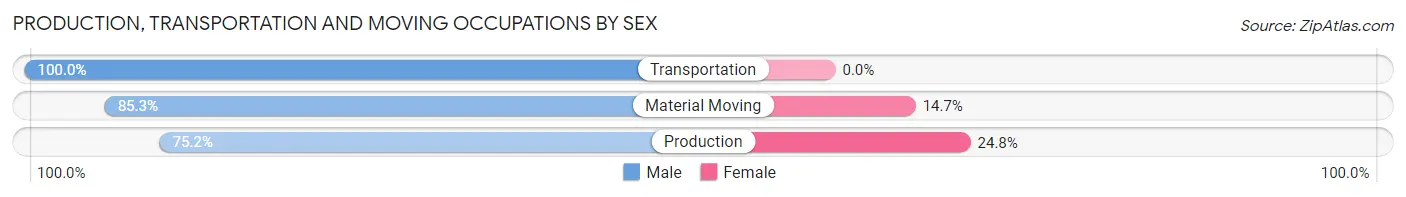
| Occupation | Male | Female |
| Production | 173 (75.2%) | 57 (24.8%) |
| Transportation | 28 (100.0%) | 0 (0.0%) |
| Material Moving | 29 (85.3%) | 5 (14.7%) |
| Total (Category) | 230 (78.8%) | 62 (21.2%) |
| Total (Overall) | 615 (57.6%) | 452 (42.4%) |
Employment Industries by Sex in Garland
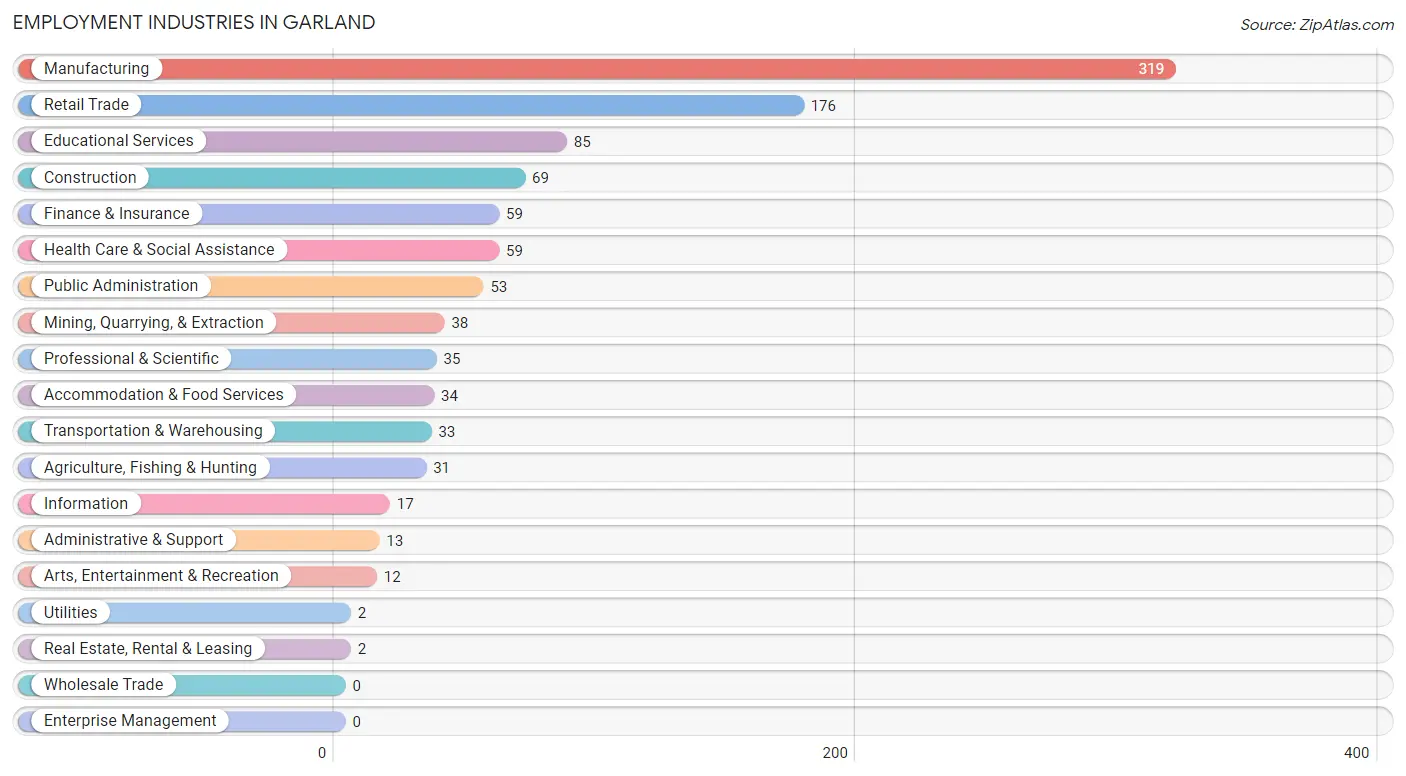
Employment Industries in Garland
The major employment industries in Garland include Manufacturing (319 | 29.9%), Retail Trade (176 | 16.5%), Educational Services (85 | 8.0%), Construction (69 | 6.5%), and Finance & Insurance (59 | 5.5%).
Employment Industries by Sex in Garland
The Garland industries that see more men than women are Mining, Quarrying, & Extraction (100.0%), Construction (100.0%), and Utilities (100.0%), whereas the industries that tend to have a higher number of women are Real Estate, Rental & Leasing (100.0%), Finance & Insurance (94.9%), and Health Care & Social Assistance (86.4%).
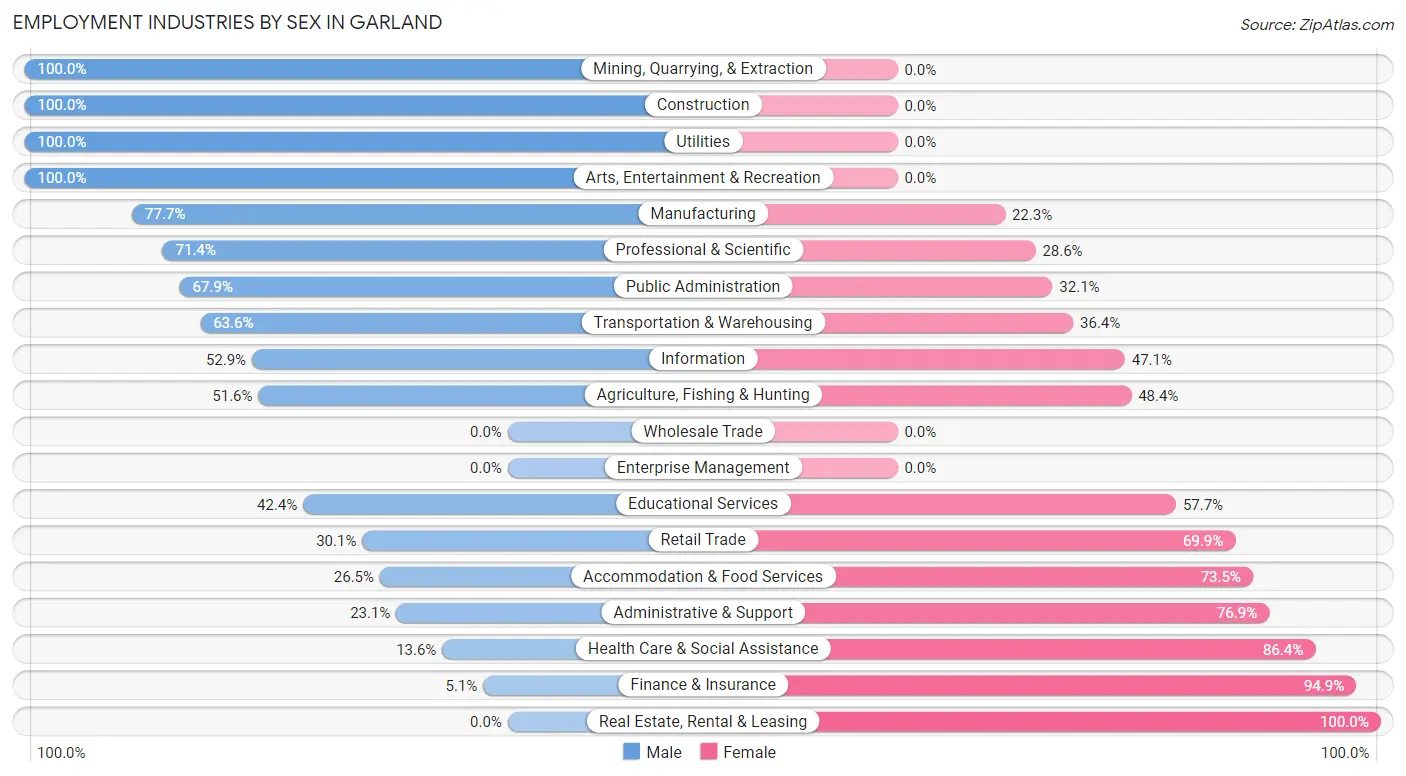
| Industry | Male | Female |
| Agriculture, Fishing & Hunting | 16 (51.6%) | 15 (48.4%) |
| Mining, Quarrying, & Extraction | 38 (100.0%) | 0 (0.0%) |
| Construction | 69 (100.0%) | 0 (0.0%) |
| Manufacturing | 248 (77.7%) | 71 (22.3%) |
| Wholesale Trade | 0 (0.0%) | 0 (0.0%) |
| Retail Trade | 53 (30.1%) | 123 (69.9%) |
| Transportation & Warehousing | 21 (63.6%) | 12 (36.4%) |
| Utilities | 2 (100.0%) | 0 (0.0%) |
| Information | 9 (52.9%) | 8 (47.1%) |
| Finance & Insurance | 3 (5.1%) | 56 (94.9%) |
| Real Estate, Rental & Leasing | 0 (0.0%) | 2 (100.0%) |
| Professional & Scientific | 25 (71.4%) | 10 (28.6%) |
| Enterprise Management | 0 (0.0%) | 0 (0.0%) |
| Administrative & Support | 3 (23.1%) | 10 (76.9%) |
| Educational Services | 36 (42.3%) | 49 (57.7%) |
| Health Care & Social Assistance | 8 (13.6%) | 51 (86.4%) |
| Arts, Entertainment & Recreation | 12 (100.0%) | 0 (0.0%) |
| Accommodation & Food Services | 9 (26.5%) | 25 (73.5%) |
| Public Administration | 36 (67.9%) | 17 (32.1%) |
| Total | 615 (57.6%) | 452 (42.4%) |
Education in Garland
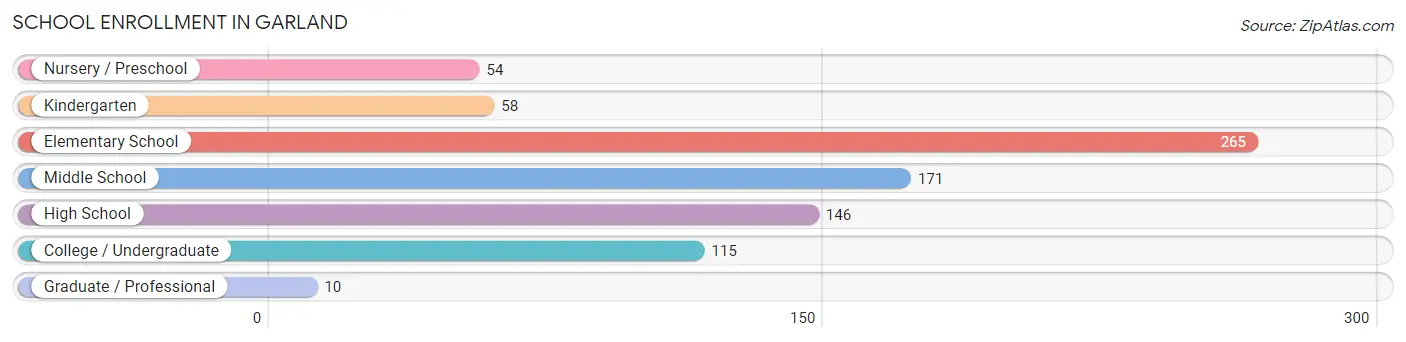
School Enrollment in Garland
The most common levels of schooling among the 819 students in Garland are elementary school (265 | 32.4%), middle school (171 | 20.9%), and high school (146 | 17.8%).
| School Level | # Students | % Students |
| Nursery / Preschool | 54 | 6.6% |
| Kindergarten | 58 | 7.1% |
| Elementary School | 265 | 32.4% |
| Middle School | 171 | 20.9% |
| High School | 146 | 17.8% |
| College / Undergraduate | 115 | 14.0% |
| Graduate / Professional | 10 | 1.2% |
| Total | 819 | 100.0% |
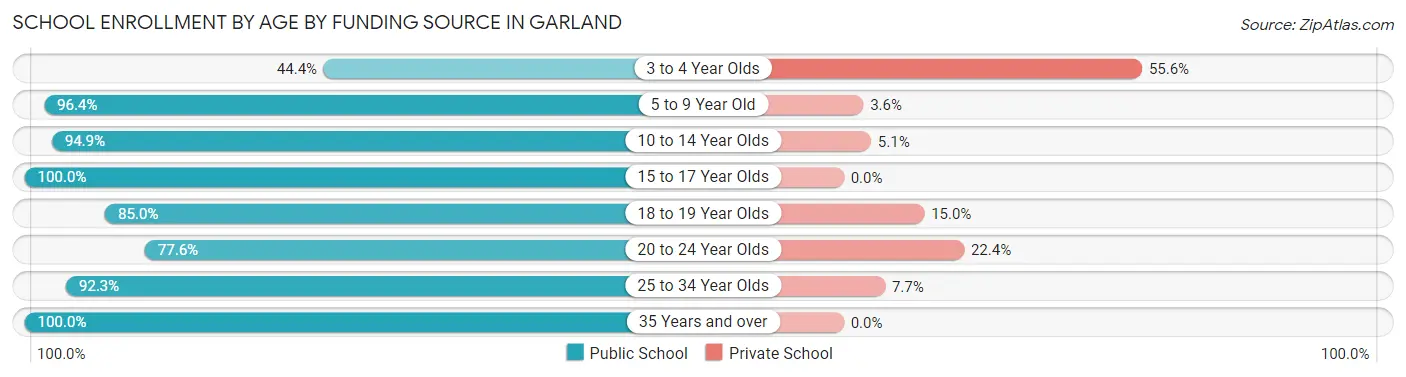
School Enrollment by Age by Funding Source in Garland
Out of a total of 819 students who are enrolled in schools in Garland, 62 (7.6%) attend a private institution, while the remaining 757 (92.4%) are enrolled in public schools. The age group of 3 to 4 year olds has the highest likelihood of being enrolled in private schools, with 20 (55.6% in the age bracket) enrolled. Conversely, the age group of 15 to 17 year olds has the lowest likelihood of being enrolled in a private school, with 89 (100.0% in the age bracket) attending a public institution.
| Age Bracket | Public School | Private School |
| 3 to 4 Year Olds | 16 (44.4%) | 20 (55.6%) |
| 5 to 9 Year Old | 318 (96.4%) | 12 (3.6%) |
| 10 to 14 Year Olds | 206 (94.9%) | 11 (5.1%) |
| 15 to 17 Year Olds | 89 (100.0%) | 0 (0.0%) |
| 18 to 19 Year Olds | 17 (85.0%) | 3 (15.0%) |
| 20 to 24 Year Olds | 45 (77.6%) | 13 (22.4%) |
| 25 to 34 Year Olds | 36 (92.3%) | 3 (7.7%) |
| 35 Years and over | 30 (100.0%) | 0 (0.0%) |
| Total | 757 (92.4%) | 62 (7.6%) |
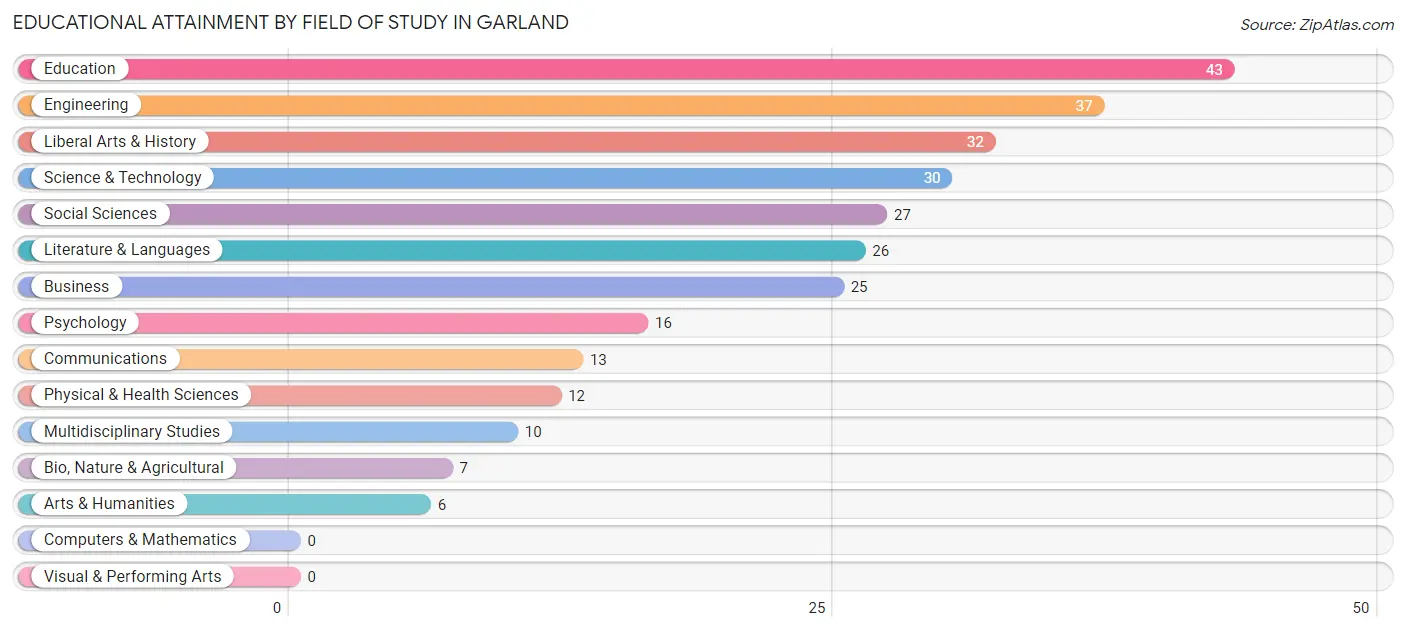
Educational Attainment by Field of Study in Garland
Education (43 | 15.1%), engineering (37 | 13.0%), liberal arts & history (32 | 11.3%), science & technology (30 | 10.6%), and social sciences (27 | 9.5%) are the most common fields of study among 284 individuals in Garland who have obtained a bachelor's degree or higher.
| Field of Study | # Graduates | % Graduates |
| Computers & Mathematics | 0 | 0.0% |
| Bio, Nature & Agricultural | 7 | 2.5% |
| Physical & Health Sciences | 12 | 4.2% |
| Psychology | 16 | 5.6% |
| Social Sciences | 27 | 9.5% |
| Engineering | 37 | 13.0% |
| Multidisciplinary Studies | 10 | 3.5% |
| Science & Technology | 30 | 10.6% |
| Business | 25 | 8.8% |
| Education | 43 | 15.1% |
| Literature & Languages | 26 | 9.1% |
| Liberal Arts & History | 32 | 11.3% |
| Visual & Performing Arts | 0 | 0.0% |
| Communications | 13 | 4.6% |
| Arts & Humanities | 6 | 2.1% |
| Total | 284 | 100.0% |
Transportation & Commute in Garland
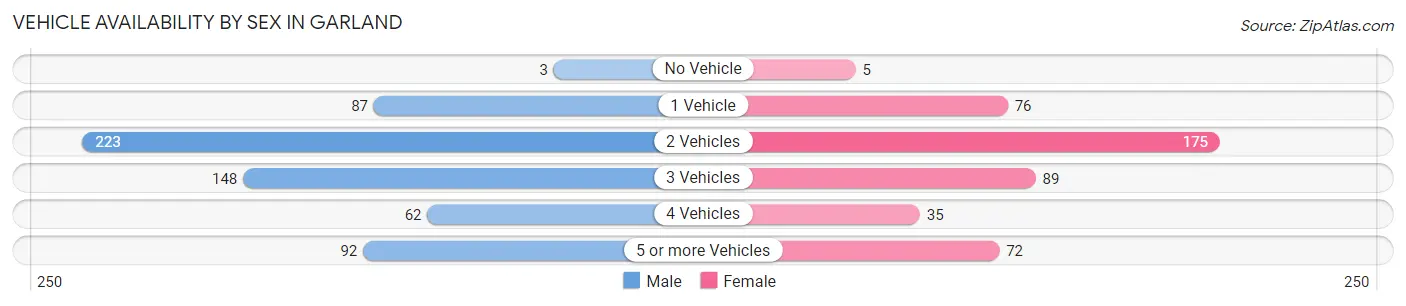
Vehicle Availability by Sex in Garland
The most prevalent vehicle ownership categories in Garland are males with 2 vehicles (223, accounting for 36.3%) and females with 2 vehicles (175, making up 49.3%).
| Vehicles Available | Male | Female |
| No Vehicle | 3 (0.5%) | 5 (1.1%) |
| 1 Vehicle | 87 (14.1%) | 76 (16.8%) |
| 2 Vehicles | 223 (36.3%) | 175 (38.7%) |
| 3 Vehicles | 148 (24.1%) | 89 (19.7%) |
| 4 Vehicles | 62 (10.1%) | 35 (7.7%) |
| 5 or more Vehicles | 92 (15.0%) | 72 (15.9%) |
| Total | 615 (100.0%) | 452 (100.0%) |
Commute Time in Garland
The most frequently occuring commute durations in Garland are 5 to 9 minutes (226 commuters, 22.0%), 30 to 34 minutes (148 commuters, 14.4%), and 45 to 59 minutes (109 commuters, 10.6%).
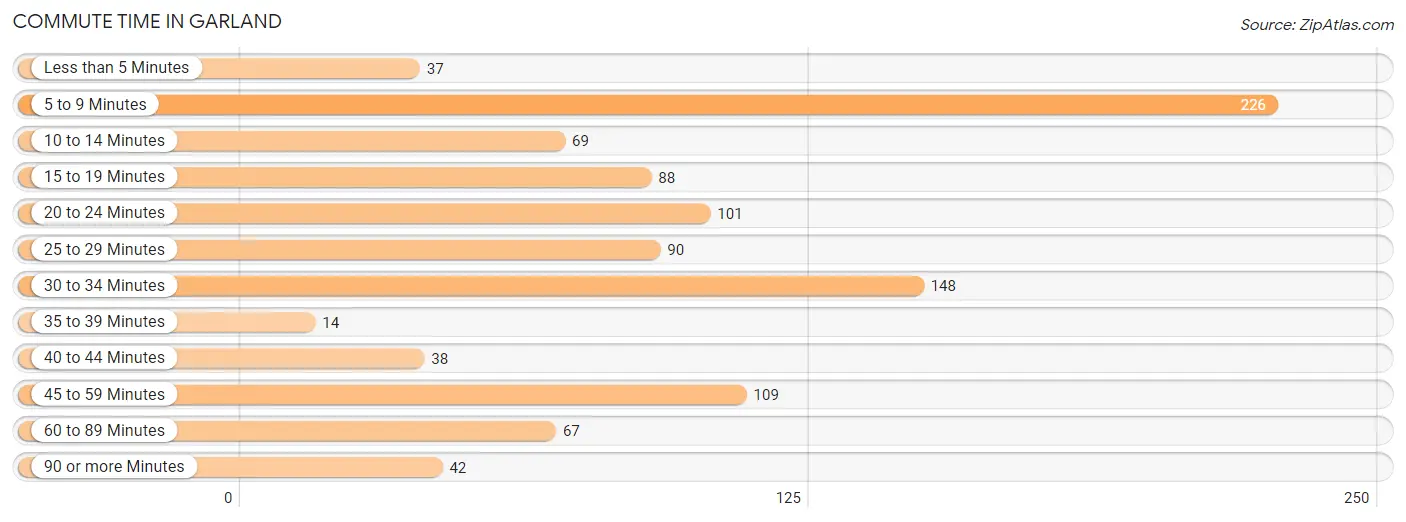
| Commute Time | # Commuters | % Commuters |
| Less than 5 Minutes | 37 | 3.6% |
| 5 to 9 Minutes | 226 | 22.0% |
| 10 to 14 Minutes | 69 | 6.7% |
| 15 to 19 Minutes | 88 | 8.6% |
| 20 to 24 Minutes | 101 | 9.8% |
| 25 to 29 Minutes | 90 | 8.7% |
| 30 to 34 Minutes | 148 | 14.4% |
| 35 to 39 Minutes | 14 | 1.4% |
| 40 to 44 Minutes | 38 | 3.7% |
| 45 to 59 Minutes | 109 | 10.6% |
| 60 to 89 Minutes | 67 | 6.5% |
| 90 or more Minutes | 42 | 4.1% |
Commute Time by Sex in Garland
The most common commute times in Garland are 5 to 9 minutes (111 commuters, 18.2%) for males and 5 to 9 minutes (115 commuters, 27.5%) for females.
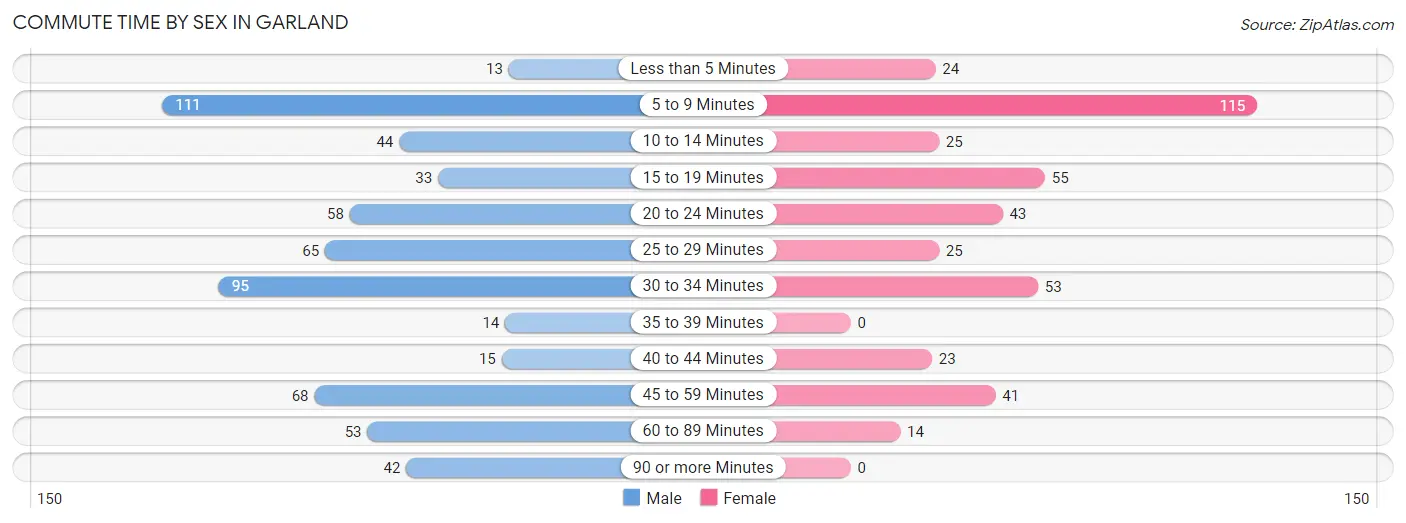
| Commute Time | Male | Female |
| Less than 5 Minutes | 13 (2.1%) | 24 (5.7%) |
| 5 to 9 Minutes | 111 (18.2%) | 115 (27.5%) |
| 10 to 14 Minutes | 44 (7.2%) | 25 (6.0%) |
| 15 to 19 Minutes | 33 (5.4%) | 55 (13.2%) |
| 20 to 24 Minutes | 58 (9.5%) | 43 (10.3%) |
| 25 to 29 Minutes | 65 (10.6%) | 25 (6.0%) |
| 30 to 34 Minutes | 95 (15.5%) | 53 (12.7%) |
| 35 to 39 Minutes | 14 (2.3%) | 0 (0.0%) |
| 40 to 44 Minutes | 15 (2.5%) | 23 (5.5%) |
| 45 to 59 Minutes | 68 (11.1%) | 41 (9.8%) |
| 60 to 89 Minutes | 53 (8.7%) | 14 (3.4%) |
| 90 or more Minutes | 42 (6.9%) | 0 (0.0%) |
Time of Departure to Work by Sex in Garland
The most frequent times of departure to work in Garland are 6:30 AM to 6:59 AM (86, 14.1%) for males and 12:00 AM to 4:59 AM (60, 14.3%) for females.
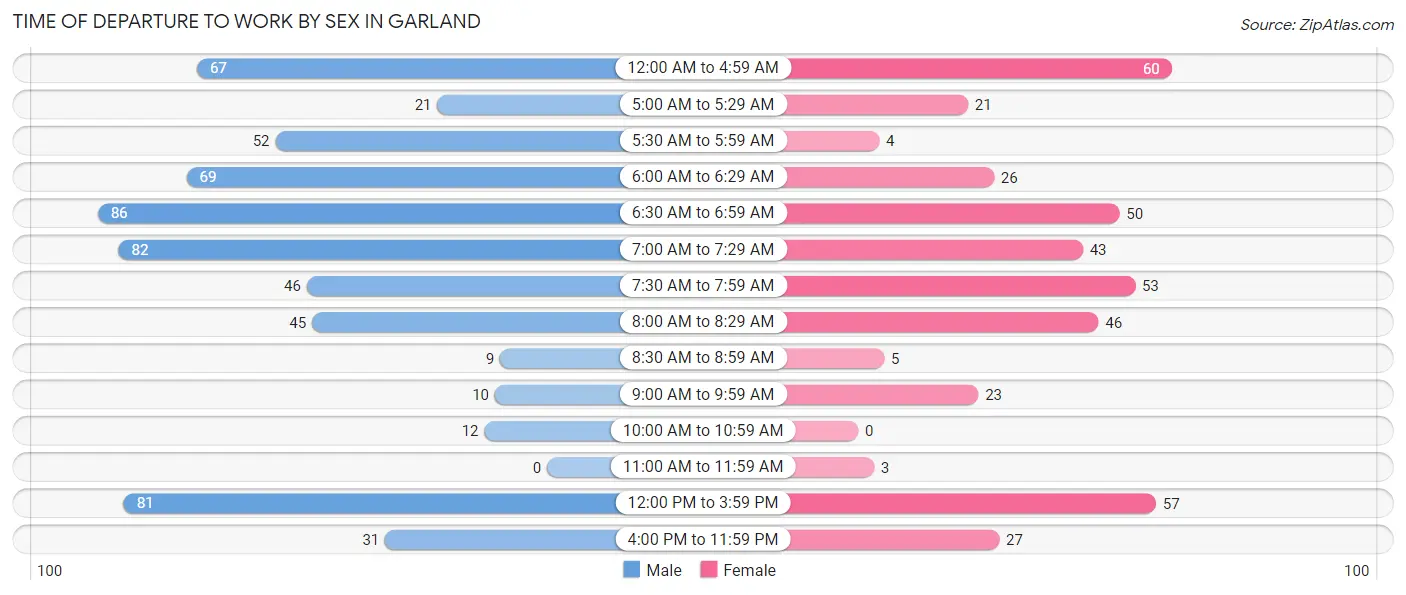
| Time of Departure | Male | Female |
| 12:00 AM to 4:59 AM | 67 (11.0%) | 60 (14.3%) |
| 5:00 AM to 5:29 AM | 21 (3.4%) | 21 (5.0%) |
| 5:30 AM to 5:59 AM | 52 (8.5%) | 4 (1.0%) |
| 6:00 AM to 6:29 AM | 69 (11.3%) | 26 (6.2%) |
| 6:30 AM to 6:59 AM | 86 (14.1%) | 50 (12.0%) |
| 7:00 AM to 7:29 AM | 82 (13.4%) | 43 (10.3%) |
| 7:30 AM to 7:59 AM | 46 (7.5%) | 53 (12.7%) |
| 8:00 AM to 8:29 AM | 45 (7.4%) | 46 (11.0%) |
| 8:30 AM to 8:59 AM | 9 (1.5%) | 5 (1.2%) |
| 9:00 AM to 9:59 AM | 10 (1.6%) | 23 (5.5%) |
| 10:00 AM to 10:59 AM | 12 (2.0%) | 0 (0.0%) |
| 11:00 AM to 11:59 AM | 0 (0.0%) | 3 (0.7%) |
| 12:00 PM to 3:59 PM | 81 (13.3%) | 57 (13.6%) |
| 4:00 PM to 11:59 PM | 31 (5.1%) | 27 (6.5%) |
| Total | 611 (100.0%) | 418 (100.0%) |
Housing Occupancy in Garland
Occupancy by Ownership in Garland
Of the total 865 dwellings in Garland, owner-occupied units account for 590 (68.2%), while renter-occupied units make up 275 (31.8%).
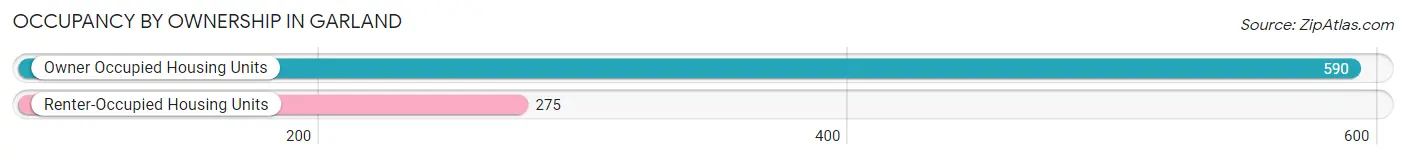
| Occupancy | # Housing Units | % Housing Units |
| Owner Occupied Housing Units | 590 | 68.2% |
| Renter-Occupied Housing Units | 275 | 31.8% |
| Total Occupied Housing Units | 865 | 100.0% |
Occupancy by Household Size in Garland
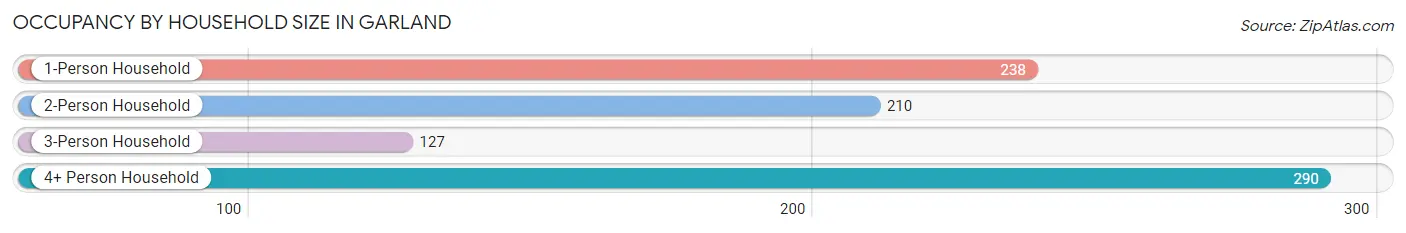
| Household Size | # Housing Units | % Housing Units |
| 1-Person Household | 238 | 27.5% |
| 2-Person Household | 210 | 24.3% |
| 3-Person Household | 127 | 14.7% |
| 4+ Person Household | 290 | 33.5% |
| Total Housing Units | 865 | 100.0% |
Occupancy by Ownership by Household Size in Garland
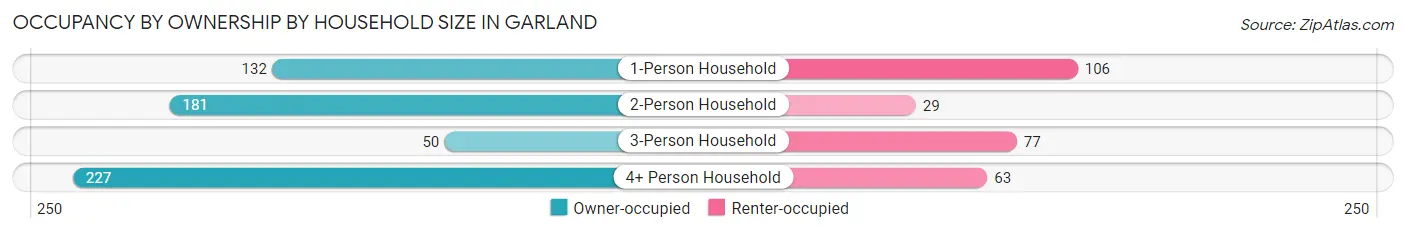
| Household Size | Owner-occupied | Renter-occupied |
| 1-Person Household | 132 (55.5%) | 106 (44.5%) |
| 2-Person Household | 181 (86.2%) | 29 (13.8%) |
| 3-Person Household | 50 (39.4%) | 77 (60.6%) |
| 4+ Person Household | 227 (78.3%) | 63 (21.7%) |
| Total Housing Units | 590 (68.2%) | 275 (31.8%) |
Occupancy by Educational Attainment in Garland
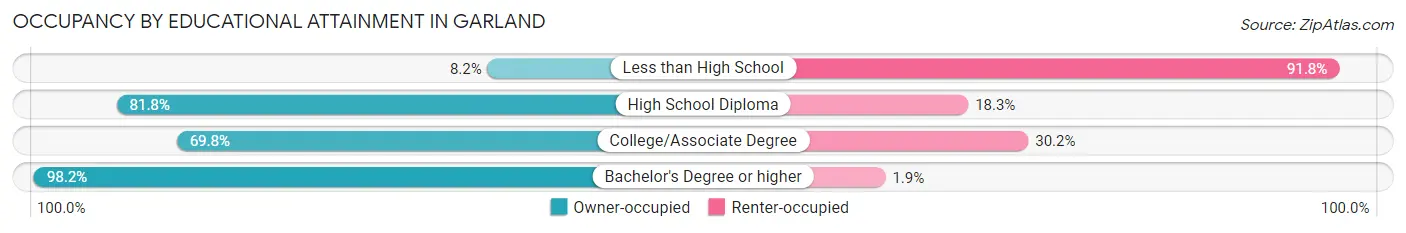
| Household Size | Owner-occupied | Renter-occupied |
| Less than High School | 12 (8.2%) | 134 (91.8%) |
| High School Diploma | 206 (81.8%) | 46 (18.2%) |
| College/Associate Degree | 213 (69.8%) | 92 (30.2%) |
| Bachelor's Degree or higher | 159 (98.2%) | 3 (1.8%) |
Occupancy by Age of Householder in Garland
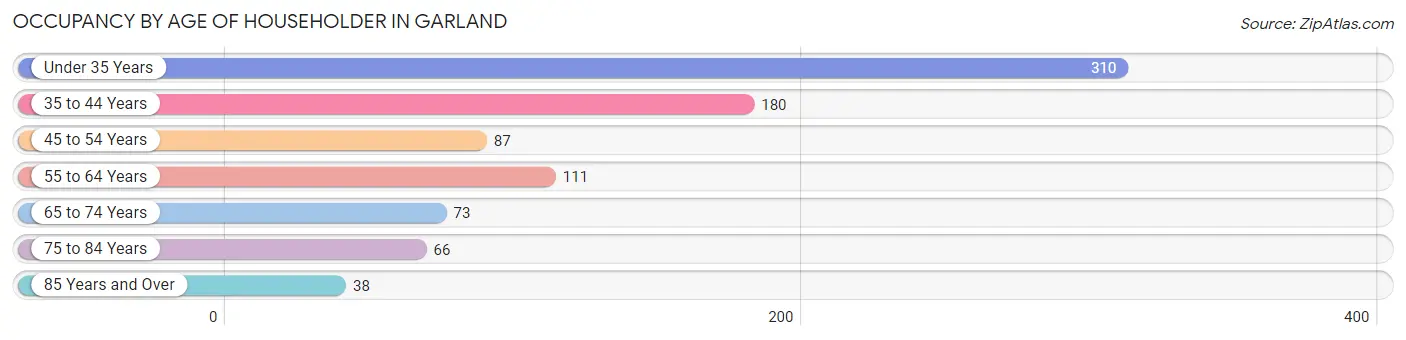
| Age Bracket | # Households | % Households |
| Under 35 Years | 310 | 35.8% |
| 35 to 44 Years | 180 | 20.8% |
| 45 to 54 Years | 87 | 10.1% |
| 55 to 64 Years | 111 | 12.8% |
| 65 to 74 Years | 73 | 8.4% |
| 75 to 84 Years | 66 | 7.6% |
| 85 Years and Over | 38 | 4.4% |
| Total | 865 | 100.0% |
Housing Finances in Garland
Median Income by Occupancy in Garland
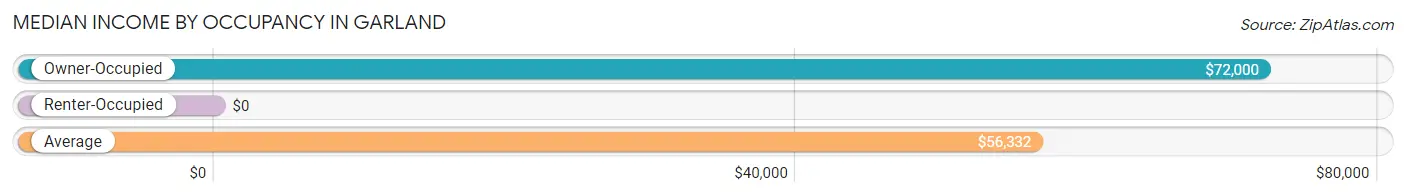
| Occupancy Type | # Households | Median Income |
| Owner-Occupied | 590 (68.2%) | $72,000 |
| Renter-Occupied | 275 (31.8%) | $0 |
| Average | 865 (100.0%) | $56,332 |
Occupancy by Householder Income Bracket in Garland
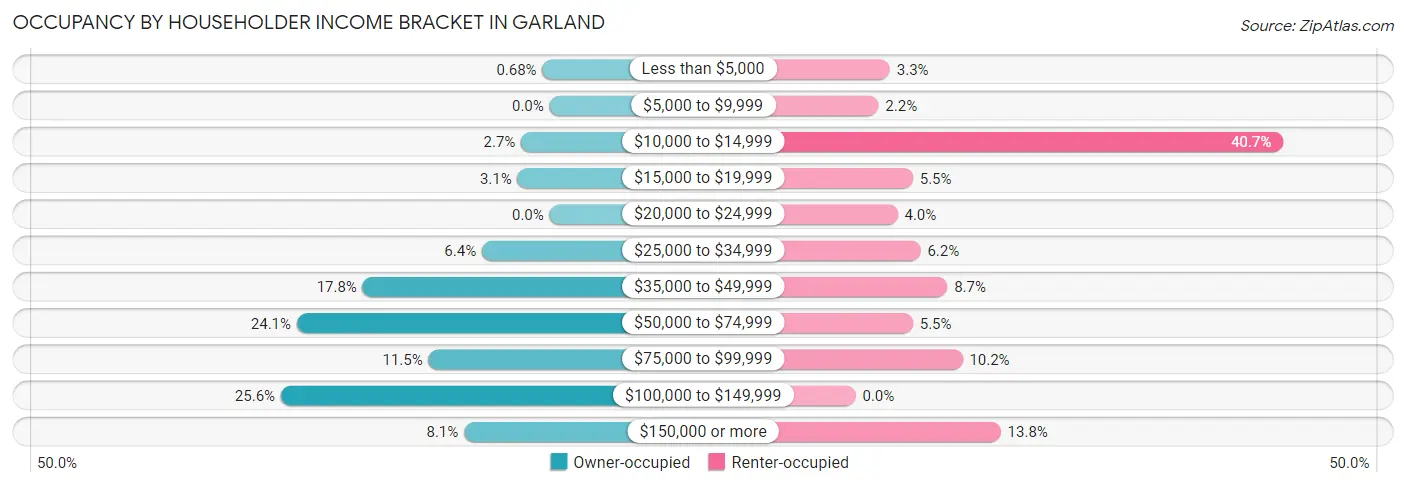
| Income Bracket | Owner-occupied | Renter-occupied |
| Less than $5,000 | 4 (0.7%) | 9 (3.3%) |
| $5,000 to $9,999 | 0 (0.0%) | 6 (2.2%) |
| $10,000 to $14,999 | 16 (2.7%) | 112 (40.7%) |
| $15,000 to $19,999 | 18 (3.0%) | 15 (5.4%) |
| $20,000 to $24,999 | 0 (0.0%) | 11 (4.0%) |
| $25,000 to $34,999 | 38 (6.4%) | 17 (6.2%) |
| $35,000 to $49,999 | 105 (17.8%) | 24 (8.7%) |
| $50,000 to $74,999 | 142 (24.1%) | 15 (5.4%) |
| $75,000 to $99,999 | 68 (11.5%) | 28 (10.2%) |
| $100,000 to $149,999 | 151 (25.6%) | 0 (0.0%) |
| $150,000 or more | 48 (8.1%) | 38 (13.8%) |
| Total | 590 (100.0%) | 275 (100.0%) |
Monthly Housing Cost Tiers in Garland
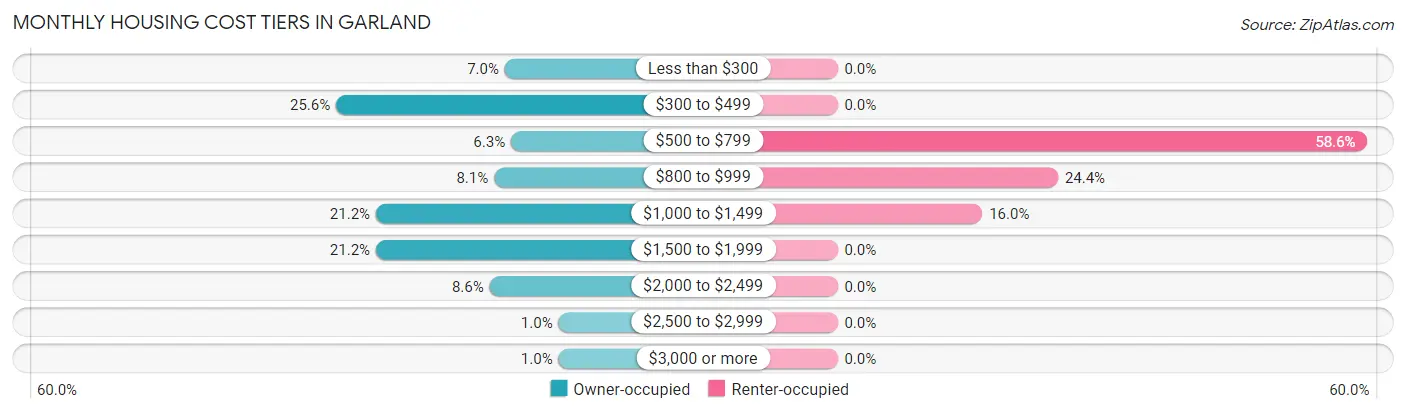
| Monthly Cost | Owner-occupied | Renter-occupied |
| Less than $300 | 41 (7.0%) | 0 (0.0%) |
| $300 to $499 | 151 (25.6%) | 0 (0.0%) |
| $500 to $799 | 37 (6.3%) | 161 (58.6%) |
| $800 to $999 | 48 (8.1%) | 67 (24.4%) |
| $1,000 to $1,499 | 125 (21.2%) | 44 (16.0%) |
| $1,500 to $1,999 | 125 (21.2%) | 0 (0.0%) |
| $2,000 to $2,499 | 51 (8.6%) | 0 (0.0%) |
| $2,500 to $2,999 | 6 (1.0%) | 0 (0.0%) |
| $3,000 or more | 6 (1.0%) | 0 (0.0%) |
| Total | 590 (100.0%) | 275 (100.0%) |
Physical Housing Characteristics in Garland
Housing Structures in Garland
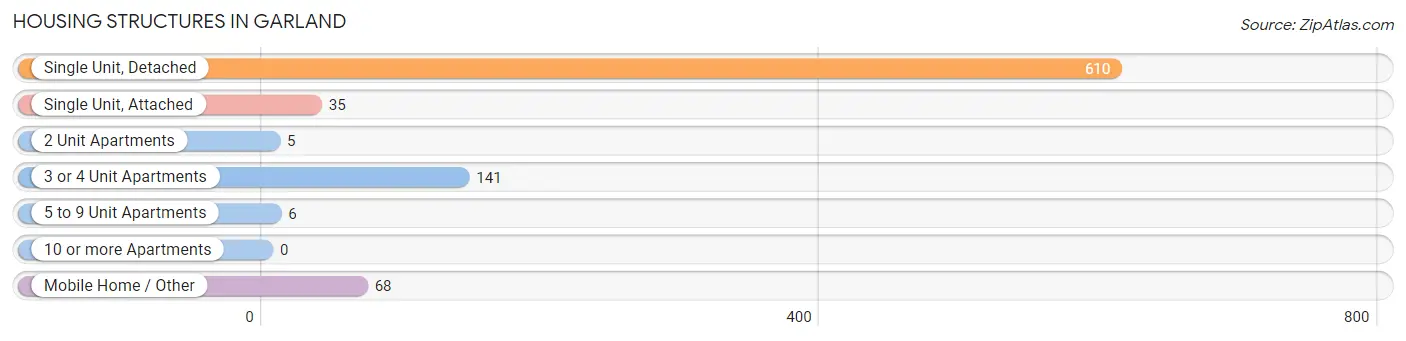
| Structure Type | # Housing Units | % Housing Units |
| Single Unit, Detached | 610 | 70.5% |
| Single Unit, Attached | 35 | 4.1% |
| 2 Unit Apartments | 5 | 0.6% |
| 3 or 4 Unit Apartments | 141 | 16.3% |
| 5 to 9 Unit Apartments | 6 | 0.7% |
| 10 or more Apartments | 0 | 0.0% |
| Mobile Home / Other | 68 | 7.9% |
| Total | 865 | 100.0% |
Housing Structures by Occupancy in Garland
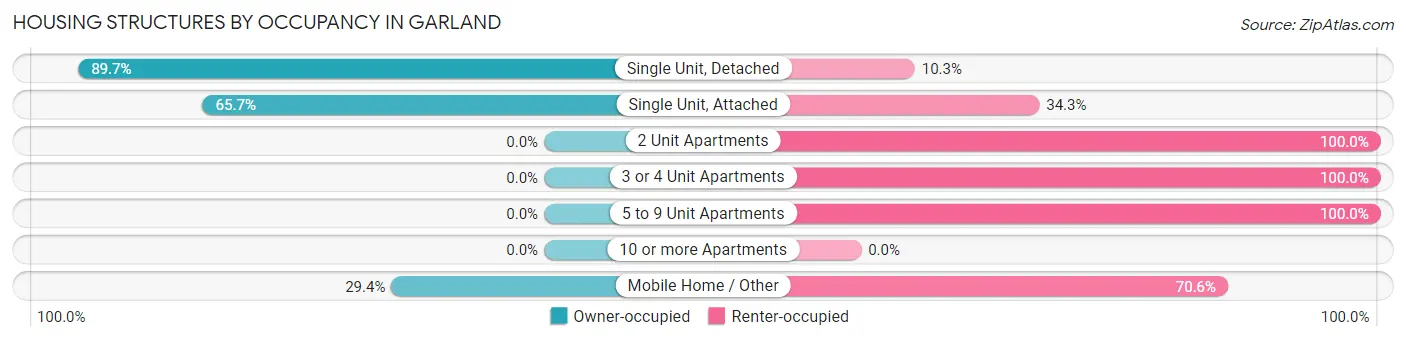
| Structure Type | Owner-occupied | Renter-occupied |
| Single Unit, Detached | 547 (89.7%) | 63 (10.3%) |
| Single Unit, Attached | 23 (65.7%) | 12 (34.3%) |
| 2 Unit Apartments | 0 (0.0%) | 5 (100.0%) |
| 3 or 4 Unit Apartments | 0 (0.0%) | 141 (100.0%) |
| 5 to 9 Unit Apartments | 0 (0.0%) | 6 (100.0%) |
| 10 or more Apartments | 0 (0.0%) | 0 (0.0%) |
| Mobile Home / Other | 20 (29.4%) | 48 (70.6%) |
| Total | 590 (68.2%) | 275 (31.8%) |
Housing Structures by Number of Rooms in Garland
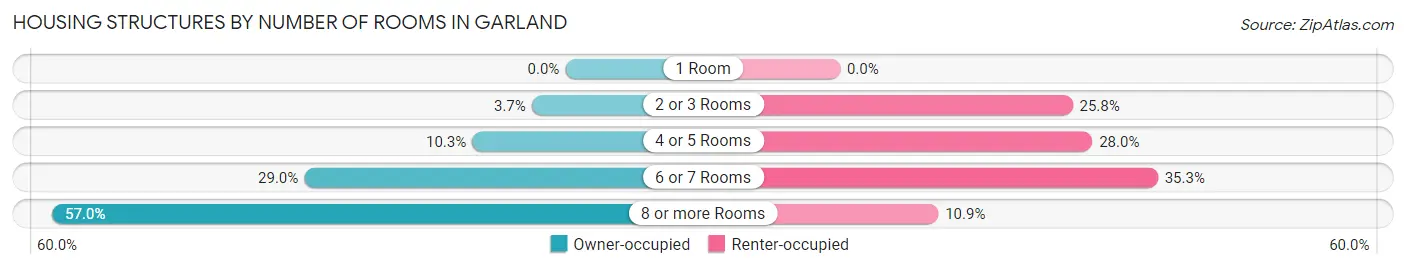
| Number of Rooms | Owner-occupied | Renter-occupied |
| 1 Room | 0 (0.0%) | 0 (0.0%) |
| 2 or 3 Rooms | 22 (3.7%) | 71 (25.8%) |
| 4 or 5 Rooms | 61 (10.3%) | 77 (28.0%) |
| 6 or 7 Rooms | 171 (29.0%) | 97 (35.3%) |
| 8 or more Rooms | 336 (57.0%) | 30 (10.9%) |
| Total | 590 (100.0%) | 275 (100.0%) |
Housing Structure by Heating Type in Garland
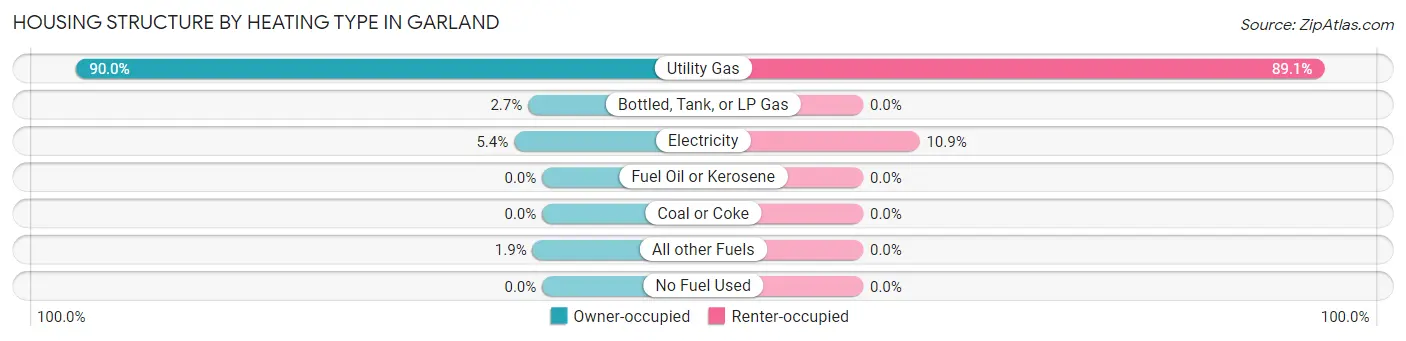
| Heating Type | Owner-occupied | Renter-occupied |
| Utility Gas | 531 (90.0%) | 245 (89.1%) |
| Bottled, Tank, or LP Gas | 16 (2.7%) | 0 (0.0%) |
| Electricity | 32 (5.4%) | 30 (10.9%) |
| Fuel Oil or Kerosene | 0 (0.0%) | 0 (0.0%) |
| Coal or Coke | 0 (0.0%) | 0 (0.0%) |
| All other Fuels | 11 (1.9%) | 0 (0.0%) |
| No Fuel Used | 0 (0.0%) | 0 (0.0%) |
| Total | 590 (100.0%) | 275 (100.0%) |
Household Vehicle Usage in Garland
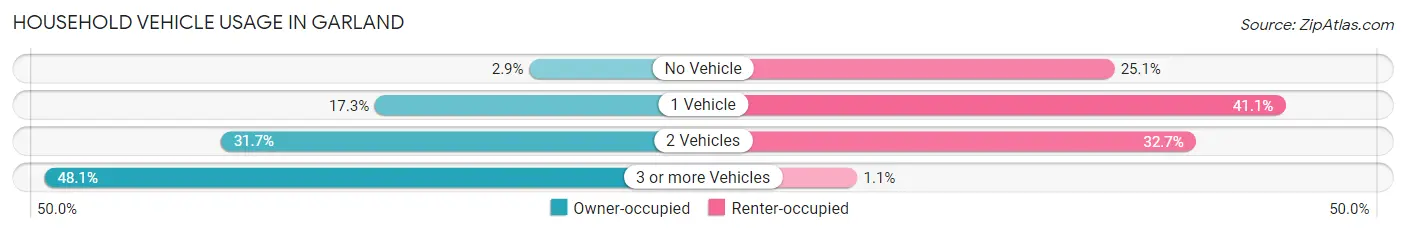
| Vehicles per Household | Owner-occupied | Renter-occupied |
| No Vehicle | 17 (2.9%) | 69 (25.1%) |
| 1 Vehicle | 102 (17.3%) | 113 (41.1%) |
| 2 Vehicles | 187 (31.7%) | 90 (32.7%) |
| 3 or more Vehicles | 284 (48.1%) | 3 (1.1%) |
| Total | 590 (100.0%) | 275 (100.0%) |
Real Estate & Mortgages in Garland
Real Estate and Mortgage Overview in Garland
| Characteristic | Without Mortgage | With Mortgage |
| Housing Units | 204 | 386 |
| Median Property Value | $201,000 | $307,400 |
| Median Household Income | $55,061 | $39 |
| Monthly Housing Costs | $365 | $6 |
| Real Estate Taxes | $1,258 | $19 |
Property Value by Mortgage Status in Garland
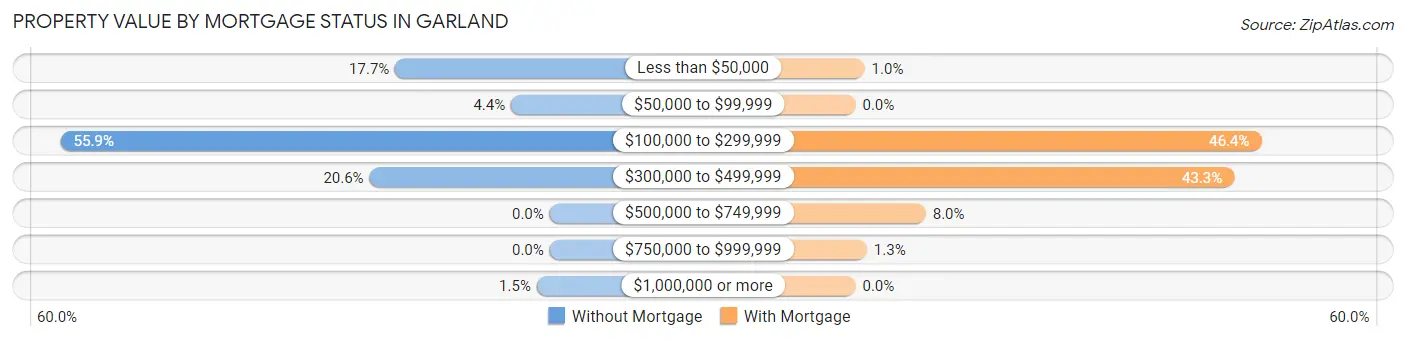
| Property Value | Without Mortgage | With Mortgage |
| Less than $50,000 | 36 (17.6%) | 4 (1.0%) |
| $50,000 to $99,999 | 9 (4.4%) | 0 (0.0%) |
| $100,000 to $299,999 | 114 (55.9%) | 179 (46.4%) |
| $300,000 to $499,999 | 42 (20.6%) | 167 (43.3%) |
| $500,000 to $749,999 | 0 (0.0%) | 31 (8.0%) |
| $750,000 to $999,999 | 0 (0.0%) | 5 (1.3%) |
| $1,000,000 or more | 3 (1.5%) | 0 (0.0%) |
| Total | 204 (100.0%) | 386 (100.0%) |
Household Income by Mortgage Status in Garland
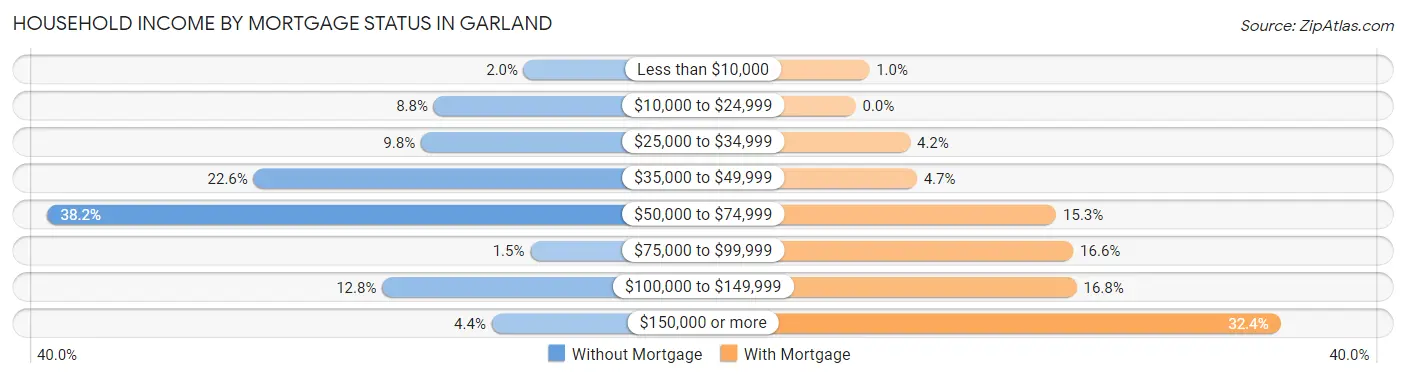
| Household Income | Without Mortgage | With Mortgage |
| Less than $10,000 | 4 (2.0%) | 4 (1.0%) |
| $10,000 to $24,999 | 18 (8.8%) | 0 (0.0%) |
| $25,000 to $34,999 | 20 (9.8%) | 16 (4.2%) |
| $35,000 to $49,999 | 46 (22.6%) | 18 (4.7%) |
| $50,000 to $74,999 | 78 (38.2%) | 59 (15.3%) |
| $75,000 to $99,999 | 3 (1.5%) | 64 (16.6%) |
| $100,000 to $149,999 | 26 (12.8%) | 65 (16.8%) |
| $150,000 or more | 9 (4.4%) | 125 (32.4%) |
| Total | 204 (100.0%) | 386 (100.0%) |
Property Value to Household Income Ratio in Garland
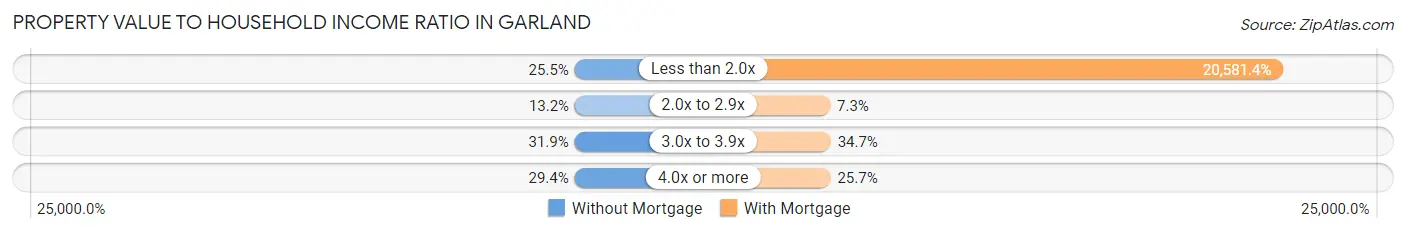
| Value-to-Income Ratio | Without Mortgage | With Mortgage |
| Less than 2.0x | 52 (25.5%) | 79,444 (20,581.4%) |
| 2.0x to 2.9x | 27 (13.2%) | 28 (7.2%) |
| 3.0x to 3.9x | 65 (31.9%) | 134 (34.7%) |
| 4.0x or more | 60 (29.4%) | 99 (25.7%) |
| Total | 204 (100.0%) | 386 (100.0%) |
Real Estate Taxes by Mortgage Status in Garland
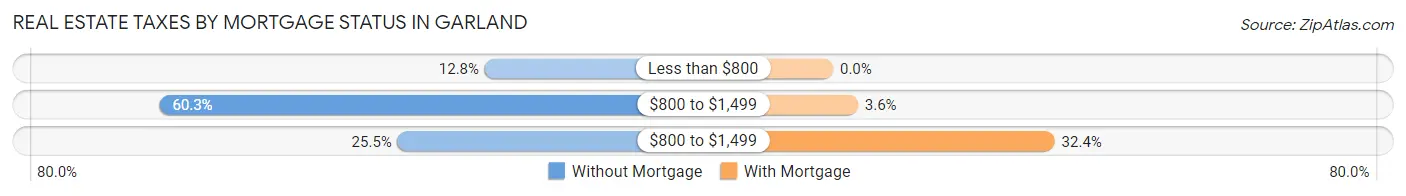
| Property Taxes | Without Mortgage | With Mortgage |
| Less than $800 | 26 (12.8%) | 0 (0.0%) |
| $800 to $1,499 | 123 (60.3%) | 14 (3.6%) |
| $800 to $1,499 | 52 (25.5%) | 125 (32.4%) |
| Total | 204 (100.0%) | 386 (100.0%) |
Health & Disability in Garland
Health Insurance Coverage by Age in Garland
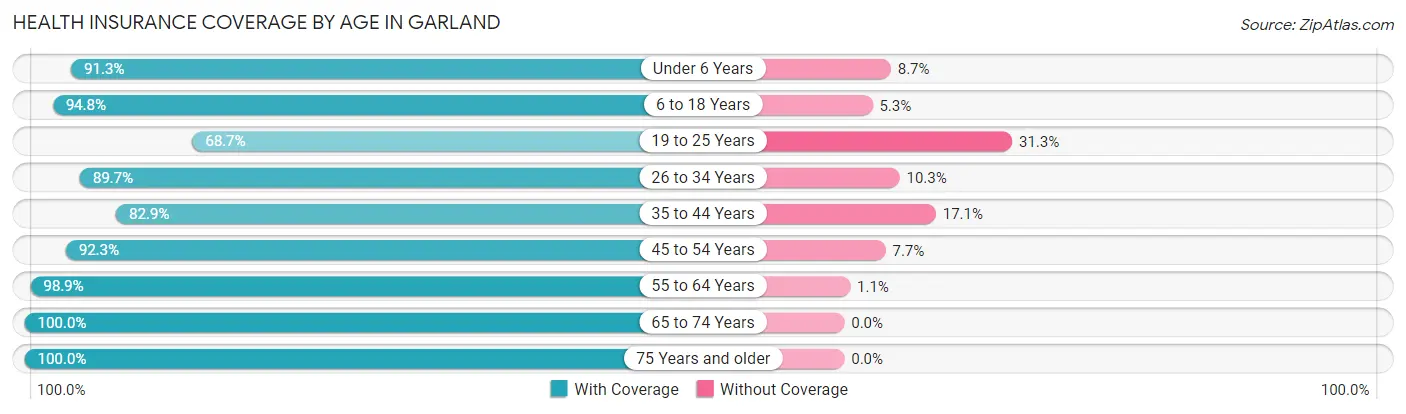
| Age Bracket | With Coverage | Without Coverage |
| Under 6 Years | 316 (91.3%) | 30 (8.7%) |
| 6 to 18 Years | 578 (94.8%) | 32 (5.2%) |
| 19 to 25 Years | 156 (68.7%) | 71 (31.3%) |
| 26 to 34 Years | 331 (89.7%) | 38 (10.3%) |
| 35 to 44 Years | 350 (82.9%) | 72 (17.1%) |
| 45 to 54 Years | 144 (92.3%) | 12 (7.7%) |
| 55 to 64 Years | 184 (98.9%) | 2 (1.1%) |
| 65 to 74 Years | 127 (100.0%) | 0 (0.0%) |
| 75 Years and older | 136 (100.0%) | 0 (0.0%) |
| Total | 2,322 (90.0%) | 257 (10.0%) |
Health Insurance Coverage by Citizenship Status in Garland
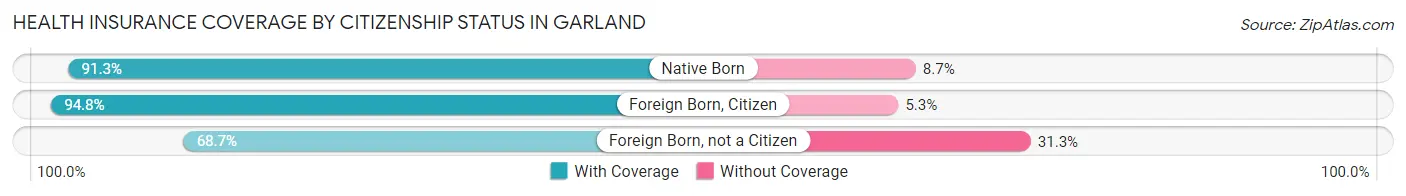
| Citizenship Status | With Coverage | Without Coverage |
| Native Born | 316 (91.3%) | 30 (8.7%) |
| Foreign Born, Citizen | 578 (94.8%) | 32 (5.2%) |
| Foreign Born, not a Citizen | 156 (68.7%) | 71 (31.3%) |
Health Insurance Coverage by Household Income in Garland
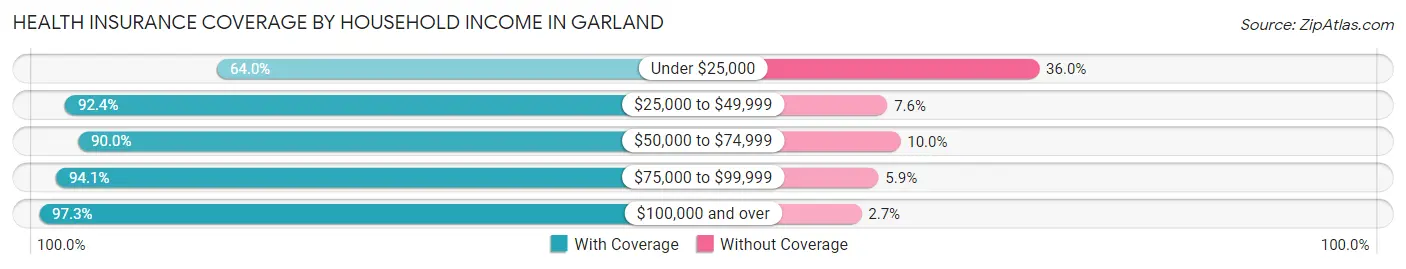
| Household Income | With Coverage | Without Coverage |
| Under $25,000 | 236 (64.0%) | 133 (36.0%) |
| $25,000 to $49,999 | 390 (92.4%) | 32 (7.6%) |
| $50,000 to $74,999 | 413 (90.0%) | 46 (10.0%) |
| $75,000 to $99,999 | 286 (94.1%) | 18 (5.9%) |
| $100,000 and over | 997 (97.3%) | 28 (2.7%) |
Public vs Private Health Insurance Coverage by Age in Garland
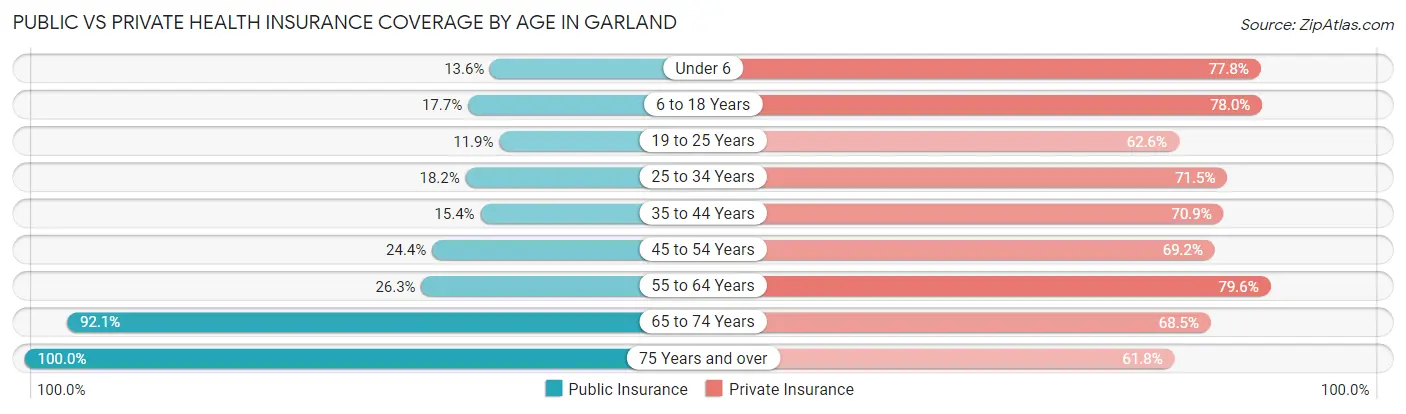
| Age Bracket | Public Insurance | Private Insurance |
| Under 6 | 47 (13.6%) | 269 (77.7%) |
| 6 to 18 Years | 108 (17.7%) | 476 (78.0%) |
| 19 to 25 Years | 27 (11.9%) | 142 (62.6%) |
| 25 to 34 Years | 67 (18.2%) | 264 (71.5%) |
| 35 to 44 Years | 65 (15.4%) | 299 (70.9%) |
| 45 to 54 Years | 38 (24.4%) | 108 (69.2%) |
| 55 to 64 Years | 49 (26.3%) | 148 (79.6%) |
| 65 to 74 Years | 117 (92.1%) | 87 (68.5%) |
| 75 Years and over | 136 (100.0%) | 84 (61.8%) |
| Total | 654 (25.4%) | 1,877 (72.8%) |
Disability Status by Sex by Age in Garland
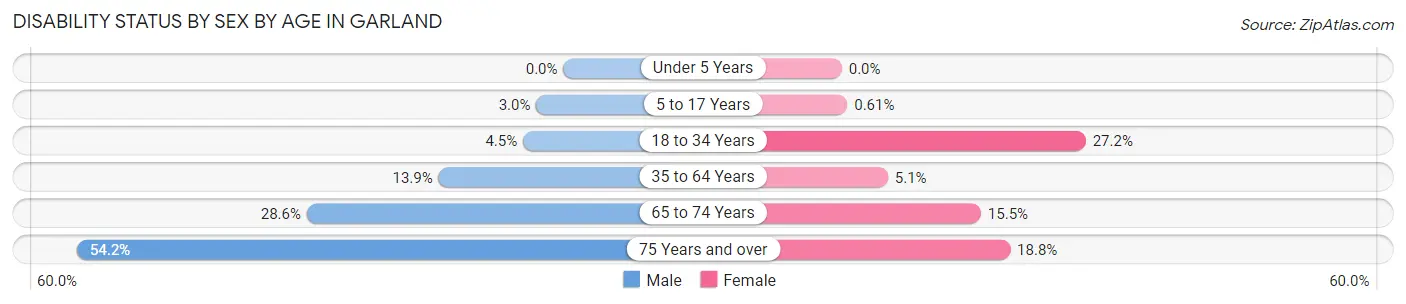
| Age Bracket | Male | Female |
| Under 5 Years | 0 (0.0%) | 0 (0.0%) |
| 5 to 17 Years | 10 (3.0%) | 2 (0.6%) |
| 18 to 34 Years | 12 (4.5%) | 94 (27.2%) |
| 35 to 64 Years | 52 (13.9%) | 20 (5.1%) |
| 65 to 74 Years | 16 (28.6%) | 11 (15.5%) |
| 75 Years and over | 13 (54.2%) | 21 (18.8%) |
Disability Class by Sex by Age in Garland
Disability Class: Hearing Difficulty
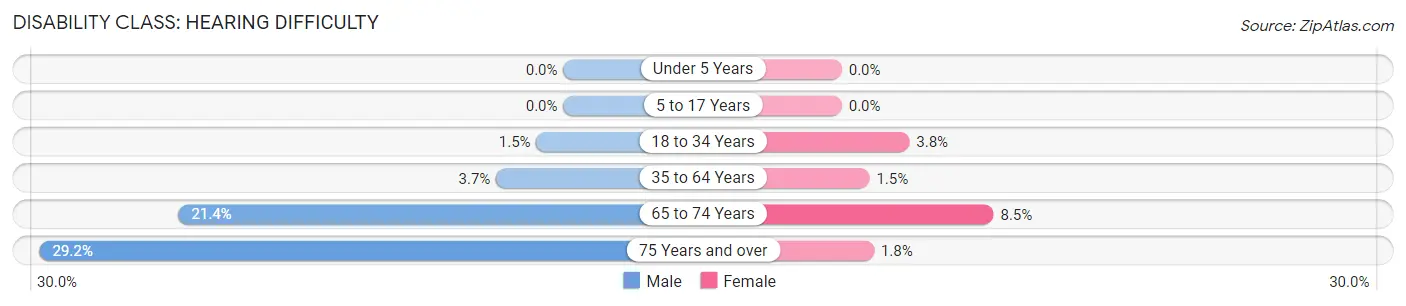
| Age Bracket | Male | Female |
| Under 5 Years | 0 (0.0%) | 0 (0.0%) |
| 5 to 17 Years | 0 (0.0%) | 0 (0.0%) |
| 18 to 34 Years | 4 (1.5%) | 13 (3.8%) |
| 35 to 64 Years | 14 (3.7%) | 6 (1.5%) |
| 65 to 74 Years | 12 (21.4%) | 6 (8.5%) |
| 75 Years and over | 7 (29.2%) | 2 (1.8%) |
Disability Class: Vision Difficulty
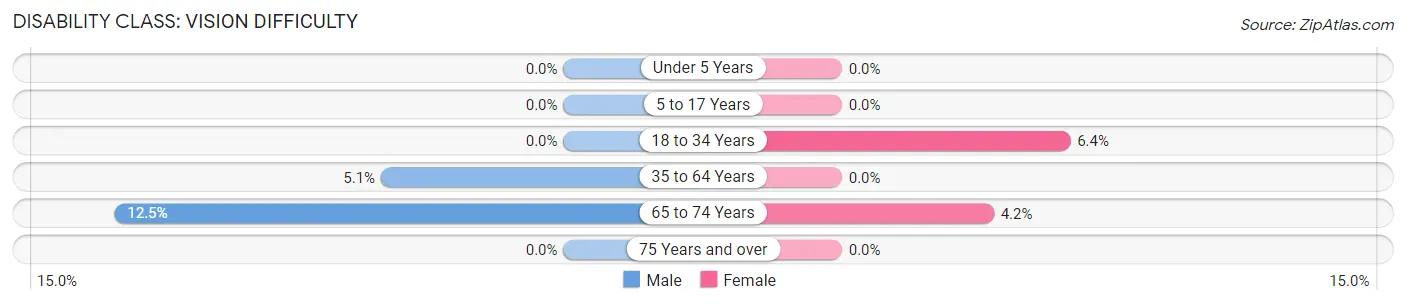
| Age Bracket | Male | Female |
| Under 5 Years | 0 (0.0%) | 0 (0.0%) |
| 5 to 17 Years | 0 (0.0%) | 0 (0.0%) |
| 18 to 34 Years | 0 (0.0%) | 22 (6.4%) |
| 35 to 64 Years | 19 (5.1%) | 0 (0.0%) |
| 65 to 74 Years | 7 (12.5%) | 3 (4.2%) |
| 75 Years and over | 0 (0.0%) | 0 (0.0%) |
Disability Class: Cognitive Difficulty
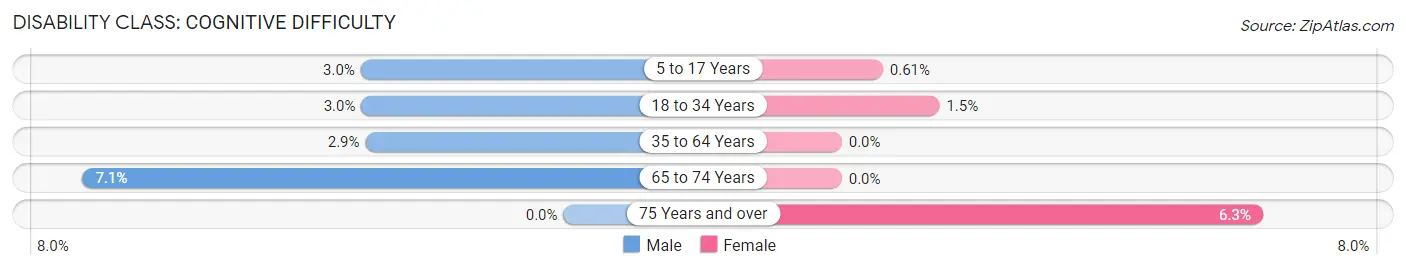
| Age Bracket | Male | Female |
| 5 to 17 Years | 10 (3.0%) | 2 (0.6%) |
| 18 to 34 Years | 8 (3.0%) | 5 (1.5%) |
| 35 to 64 Years | 11 (2.9%) | 0 (0.0%) |
| 65 to 74 Years | 4 (7.1%) | 0 (0.0%) |
| 75 Years and over | 0 (0.0%) | 7 (6.2%) |
Disability Class: Ambulatory Difficulty
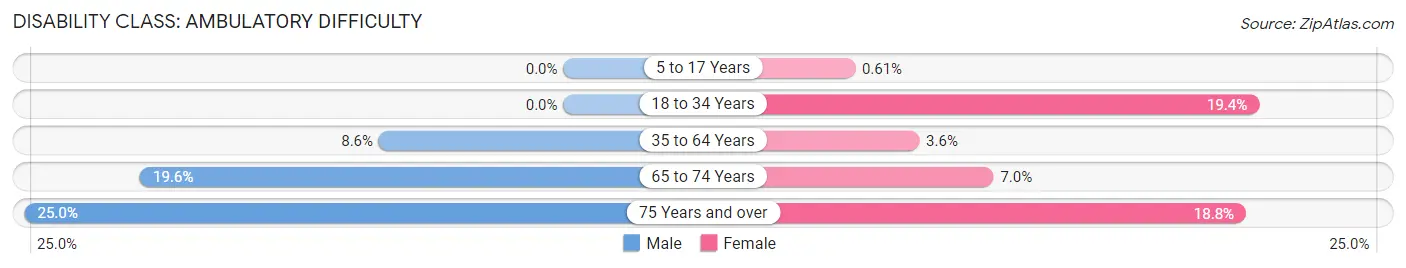
| Age Bracket | Male | Female |
| 5 to 17 Years | 0 (0.0%) | 2 (0.6%) |
| 18 to 34 Years | 0 (0.0%) | 67 (19.4%) |
| 35 to 64 Years | 32 (8.6%) | 14 (3.6%) |
| 65 to 74 Years | 11 (19.6%) | 5 (7.0%) |
| 75 Years and over | 6 (25.0%) | 21 (18.8%) |
Disability Class: Self-Care Difficulty
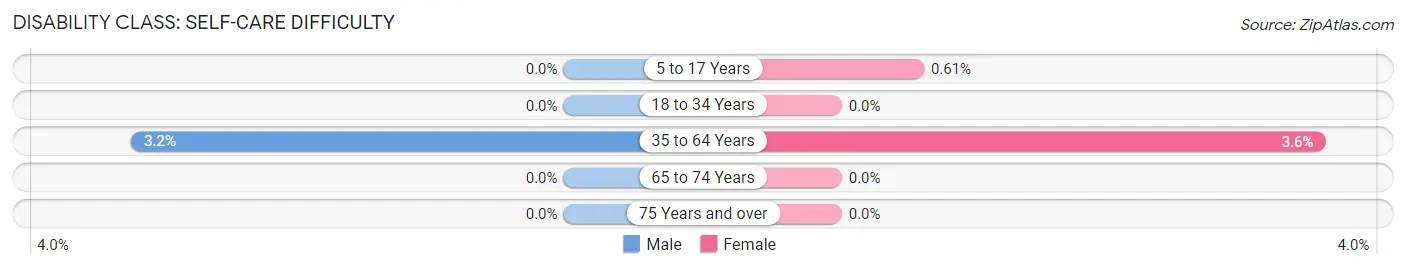
| Age Bracket | Male | Female |
| 5 to 17 Years | 0 (0.0%) | 2 (0.6%) |
| 18 to 34 Years | 0 (0.0%) | 0 (0.0%) |
| 35 to 64 Years | 12 (3.2%) | 14 (3.6%) |
| 65 to 74 Years | 0 (0.0%) | 0 (0.0%) |
| 75 Years and over | 0 (0.0%) | 0 (0.0%) |
Technology Access in Garland
Computing Device Access in Garland
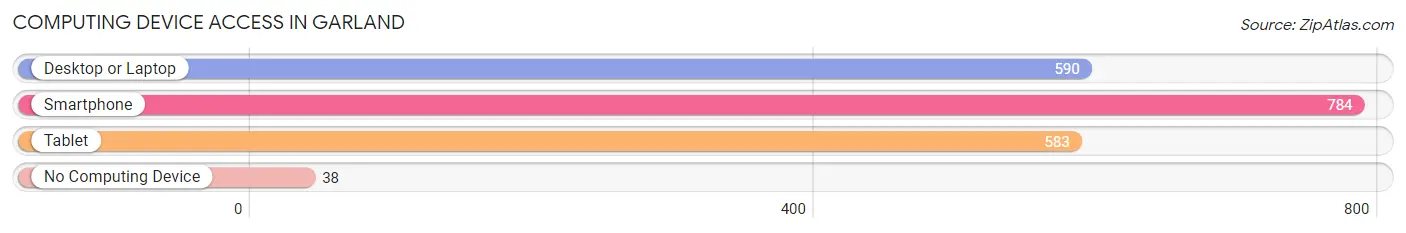
| Device Type | # Households | % Households |
| Desktop or Laptop | 590 | 68.2% |
| Smartphone | 784 | 90.6% |
| Tablet | 583 | 67.4% |
| No Computing Device | 38 | 4.4% |
| Total | 865 | 100.0% |
Internet Access in Garland
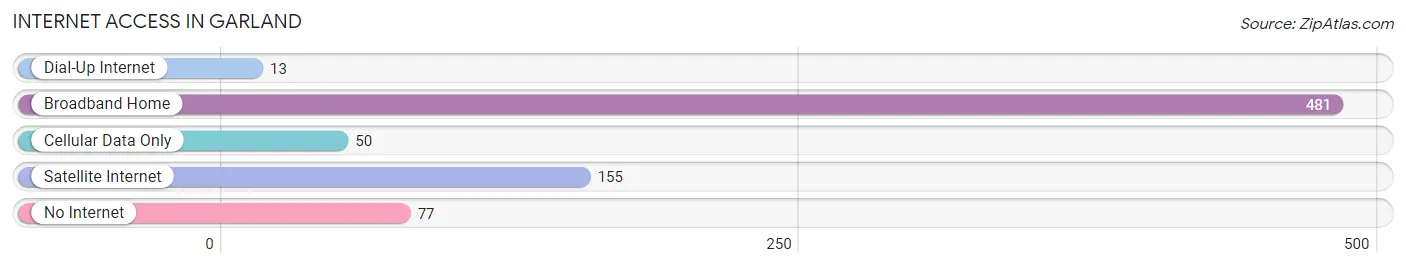
| Internet Type | # Households | % Households |
| Dial-Up Internet | 13 | 1.5% |
| Broadband Home | 481 | 55.6% |
| Cellular Data Only | 50 | 5.8% |
| Satellite Internet | 155 | 17.9% |
| No Internet | 77 | 8.9% |
| Total | 865 | 100.0% |
Garland Summary
Garland, Utah is a small city located in Box Elder County in the northern part of the state. It is situated on the western edge of the Great Salt Lake, about 20 miles north of the city of Brigham City. The city was founded in 1877 by a group of Mormon settlers led by John R. Park. The city was named after the nearby Garland Hot Springs, which were discovered by the settlers.
Geography
Garland is located in the northern part of Utah, in Box Elder County. It is situated on the western edge of the Great Salt Lake, about 20 miles north of the city of Brigham City. The city is located at an elevation of 4,717 feet above sea level. The city covers an area of 4.2 square miles, with a population of 2,845 people as of the 2010 census.
The city is surrounded by a variety of natural features, including the Great Salt Lake, the Bear River Mountains, and the Wasatch Range. The city is also located near the Golden Spike National Historic Site, which commemorates the completion of the first transcontinental railroad in 1869.
Economy
Garland is a small city with a limited economy. The city’s main industries are agriculture and tourism. The city is home to several farms, which produce a variety of crops, including corn, wheat, and hay. The city is also home to several tourist attractions, including the Great Salt Lake, the Bear River Mountains, and the Golden Spike National Historic Site.
The city is also home to several small businesses, including restaurants, retail stores, and service providers. The city is also home to several manufacturing companies, including a plastics factory and a metal fabrication plant.
Demographics
As of the 2010 census, the population of Garland was 2,845 people. The racial makeup of the city was 95.3% White, 0.7% African American, 0.3% Native American, 0.3% Asian, 0.1% Pacific Islander, 1.2% from other races, and 2.3% from two or more races. Hispanic or Latino of any race were 4.2% of the population.
The median income for a household in the city was $41,250, and the median income for a family was $45,938. The per capita income for the city was $17,845. About 8.3% of families and 10.2% of the population were below the poverty line, including 13.2% of those under age 18 and 8.2% of those age 65 or over.
Garland is a small city with a limited economy and a diverse population. The city is home to several farms, tourist attractions, and small businesses. The city is also home to several manufacturing companies, which provide employment opportunities for the city’s residents. The city’s population is diverse, with a mix of races and ethnicities. The city’s median income is slightly below the state average, but the city’s poverty rate is slightly higher than the state average.
Common Questions
What is Per Capita Income in Garland?
Per Capita income in Garland is $27,692.
What is the Median Family Income in Garland?
Median Family Income in Garland is $68,750.
What is the Median Household income in Garland?
Median Household Income in Garland is $56,332.
What is Income or Wage Gap in Garland?
Income or Wage Gap in Garland is 40.7%.
Women in Garland earn 59.3 cents for every dollar earned by a man.
What is Inequality or Gini Index in Garland?
Inequality or Gini Index in Garland is 0.46.
What is the Total Population of Garland?
Total Population of Garland is 2,579.
What is the Total Male Population of Garland?
Total Male Population of Garland is 1,156.
What is the Total Female Population of Garland?
Total Female Population of Garland is 1,423.
What is the Ratio of Males per 100 Females in Garland?
There are 81.24 Males per 100 Females in Garland.
What is the Ratio of Females per 100 Males in Garland?
There are 123.10 Females per 100 Males in Garland.
What is the Median Population Age in Garland?
Median Population Age in Garland is 28.8 Years.
What is the Average Family Size in Garland
Average Family Size in Garland is 3.7 People.
What is the Average Household Size in Garland
Average Household Size in Garland is 3.0 People.
How Large is the Labor Force in Garland?
There are 1,103 People in the Labor Forcein in Garland.
What is the Percentage of People in the Labor Force in Garland?
64.0% of People are in the Labor Force in Garland.
What is the Unemployment Rate in Garland?
Unemployment Rate in Garland is 3.2%.