Myton, UT Map & Demographics
Myton Map
Myton Overview
$23,158
PER CAPITA INCOME
$51,528
AVG FAMILY INCOME
$52,083
AVG HOUSEHOLD INCOME
69.6%
WAGE / INCOME GAP [ % ]
30.4¢/ $1
WAGE / INCOME GAP [ $ ]
0.41
INEQUALITY / GINI INDEX
616
TOTAL POPULATION
293
MALE POPULATION
323
FEMALE POPULATION
90.71
MALES / 100 FEMALES
110.24
FEMALES / 100 MALES
36.3
MEDIAN AGE
3.8
AVG FAMILY SIZE
2.9
AVG HOUSEHOLD SIZE
242
LABOR FORCE [ PEOPLE ]
54.0%
PERCENT IN LABOR FORCE
13.2%
UNEMPLOYMENT RATE
Myton Zip Codes
Myton Area Codes
Income in Myton
Income Overview in Myton
Per Capita Income in Myton is $23,158, while median incomes of families and households are $51,528 and $52,083 respectively.
| Characteristic | Number | Measure |
| Per Capita Income | 616 | $23,158 |
| Median Family Income | 133 | $51,528 |
| Mean Family Income | 133 | $65,500 |
| Median Household Income | 211 | $52,083 |
| Mean Household Income | 211 | $63,612 |
| Income Deficit | 133 | $0 |
| Wage / Income Gap (%) | 616 | 69.56% |
| Wage / Income Gap ($) | 616 | 30.44¢ per $1 |
| Gini / Inequality Index | 616 | 0.41 |
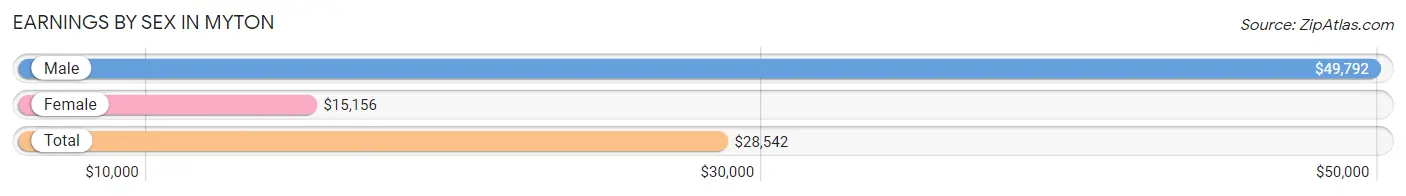
Earnings by Sex in Myton
Average Earnings in Myton are $28,542, $49,792 for men and $15,156 for women, a difference of 69.6%.
| Sex | Number | Average Earnings |
| Male | 148 (56.3%) | $49,792 |
| Female | 115 (43.7%) | $15,156 |
| Total | 263 (100.0%) | $28,542 |
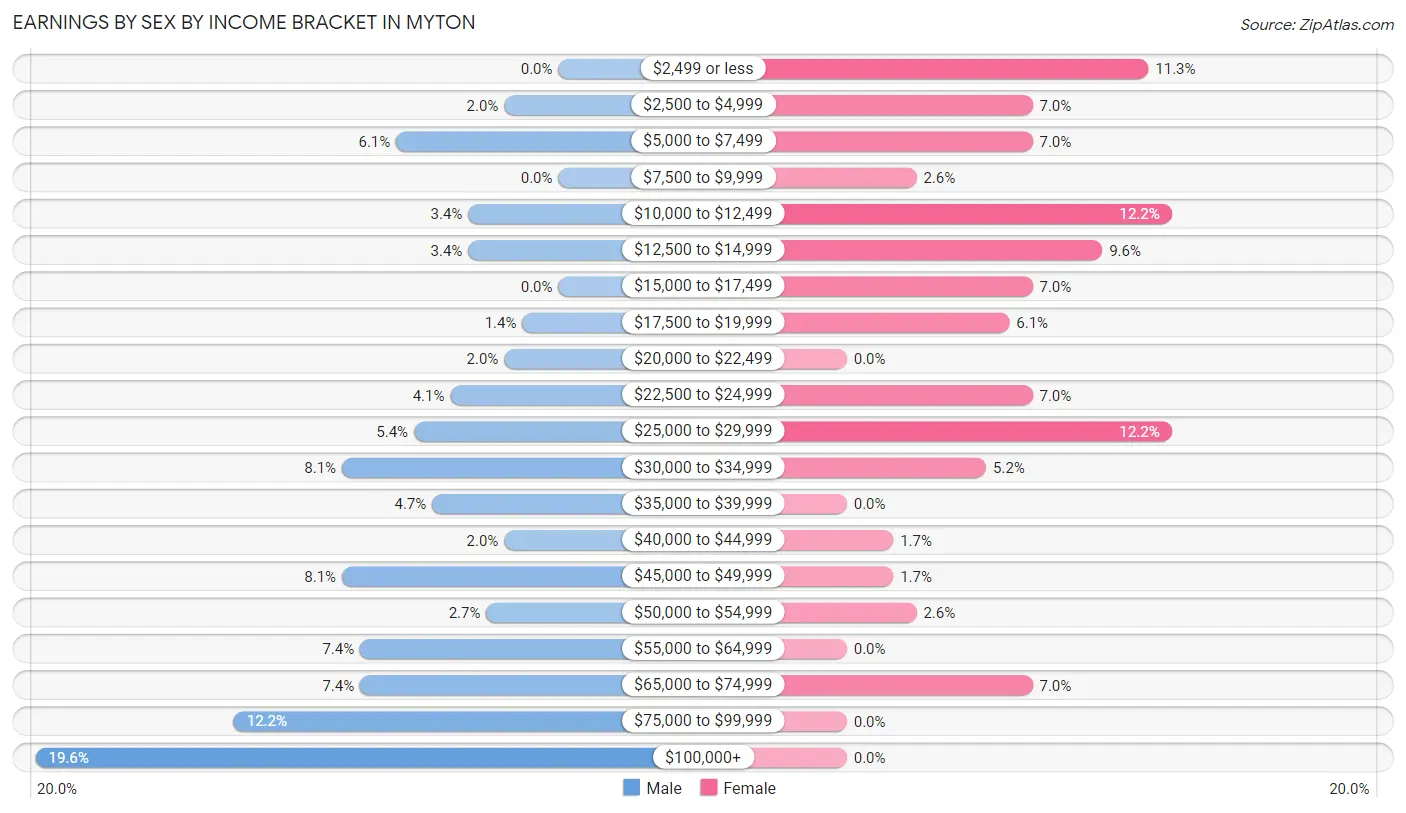
Earnings by Sex by Income Bracket in Myton
The most common earnings brackets in Myton are $100,000+ for men (29 | 19.6%) and $10,000 to $12,499 for women (14 | 12.2%).
| Income | Male | Female |
| $2,499 or less | 0 (0.0%) | 13 (11.3%) |
| $2,500 to $4,999 | 3 (2.0%) | 8 (7.0%) |
| $5,000 to $7,499 | 9 (6.1%) | 8 (7.0%) |
| $7,500 to $9,999 | 0 (0.0%) | 3 (2.6%) |
| $10,000 to $12,499 | 5 (3.4%) | 14 (12.2%) |
| $12,500 to $14,999 | 5 (3.4%) | 11 (9.6%) |
| $15,000 to $17,499 | 0 (0.0%) | 8 (7.0%) |
| $17,500 to $19,999 | 2 (1.3%) | 7 (6.1%) |
| $20,000 to $22,499 | 3 (2.0%) | 0 (0.0%) |
| $22,500 to $24,999 | 6 (4.1%) | 8 (7.0%) |
| $25,000 to $29,999 | 8 (5.4%) | 14 (12.2%) |
| $30,000 to $34,999 | 12 (8.1%) | 6 (5.2%) |
| $35,000 to $39,999 | 7 (4.7%) | 0 (0.0%) |
| $40,000 to $44,999 | 3 (2.0%) | 2 (1.7%) |
| $45,000 to $49,999 | 12 (8.1%) | 2 (1.7%) |
| $50,000 to $54,999 | 4 (2.7%) | 3 (2.6%) |
| $55,000 to $64,999 | 11 (7.4%) | 0 (0.0%) |
| $65,000 to $74,999 | 11 (7.4%) | 8 (7.0%) |
| $75,000 to $99,999 | 18 (12.2%) | 0 (0.0%) |
| $100,000+ | 29 (19.6%) | 0 (0.0%) |
| Total | 148 (100.0%) | 115 (100.0%) |
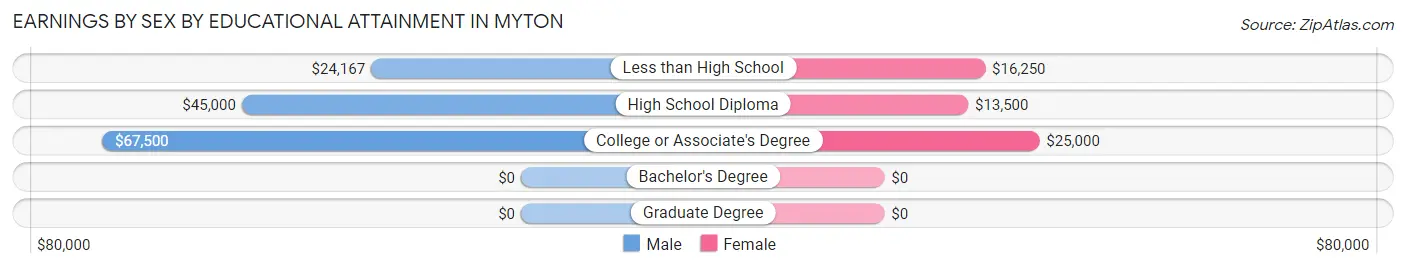
Earnings by Sex by Educational Attainment in Myton
Average earnings in Myton are $49,792 for men and $16,406 for women, a difference of 67.0%. Men with an educational attainment of college or associate's degree enjoy the highest average annual earnings of $67,500, while those with less than high school education earn the least with $24,167. Women with an educational attainment of college or associate's degree earn the most with the average annual earnings of $25,000, while those with high school diploma education have the smallest earnings of $13,500.
| Educational Attainment | Male Income | Female Income |
| Less than High School | $24,167 | $16,250 |
| High School Diploma | $45,000 | $13,500 |
| College or Associate's Degree | $67,500 | $25,000 |
| Bachelor's Degree | - | - |
| Graduate Degree | - | - |
| Total | $49,792 | $16,406 |
Family Income in Myton
Family Income Brackets in Myton
According to the Myton family income data, there are 25 families falling into the $50,000 to $74,999 income range, which is the most common income bracket and makes up 18.8% of all families. Conversely, the $200,000+ income bracket is the least frequent group with only 2 families (1.5%) belonging to this category.
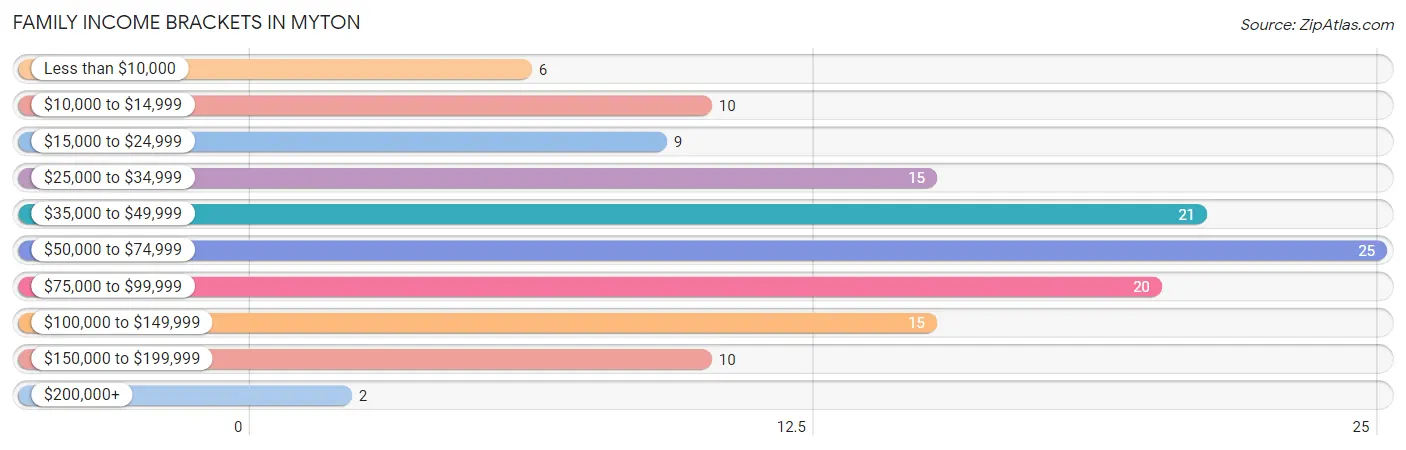
| Income Bracket | # Families | % Families |
| Less than $10,000 | 6 | 4.5% |
| $10,000 to $14,999 | 10 | 7.5% |
| $15,000 to $24,999 | 9 | 6.8% |
| $25,000 to $34,999 | 15 | 11.3% |
| $35,000 to $49,999 | 21 | 15.8% |
| $50,000 to $74,999 | 25 | 18.8% |
| $75,000 to $99,999 | 20 | 15.0% |
| $100,000 to $149,999 | 15 | 11.3% |
| $150,000 to $199,999 | 10 | 7.5% |
| $200,000+ | 2 | 1.5% |
Family Income by Famaliy Size in Myton
7+ person families (10 | 7.5%) account for the highest median family income in Myton with $99,167 per family, while 2-person families (49 | 36.8%) have the highest median income of $21,562 per family member.
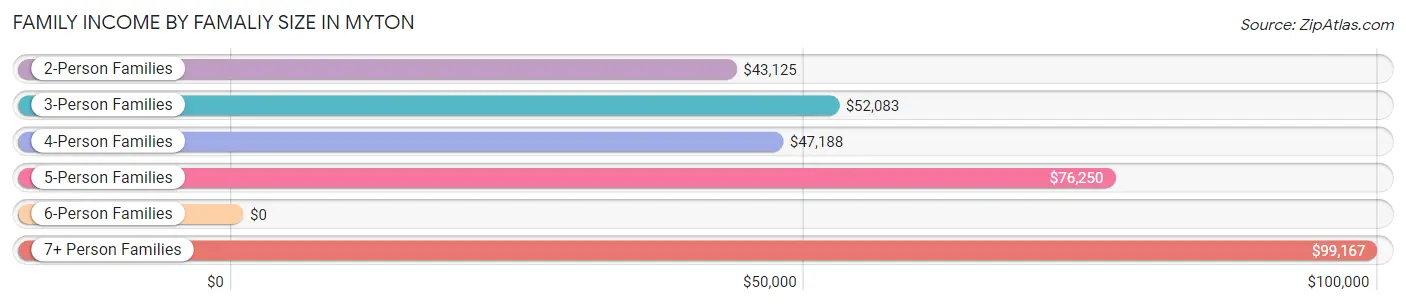
| Income Bracket | # Families | Median Income |
| 2-Person Families | 49 (36.8%) | $43,125 |
| 3-Person Families | 23 (17.3%) | $52,083 |
| 4-Person Families | 21 (15.8%) | $47,188 |
| 5-Person Families | 24 (18.0%) | $76,250 |
| 6-Person Families | 6 (4.5%) | $0 |
| 7+ Person Families | 10 (7.5%) | $99,167 |
| Total | 133 (100.0%) | $51,528 |
Family Income by Number of Earners in Myton
The median family income in Myton is $51,528, with families comprising 3+ earners (10) having the highest median family income of $148,750, while families with no earners (21) have the lowest median family income of $38,750, accounting for 7.5% and 15.8% of families, respectively.
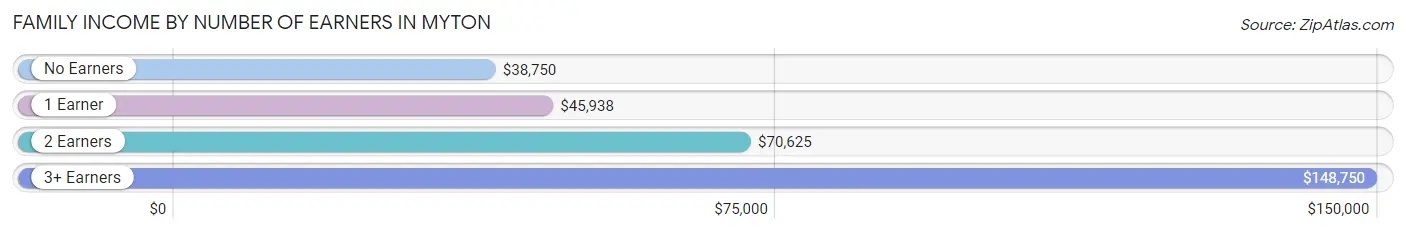
| Number of Earners | # Families | Median Income |
| No Earners | 21 (15.8%) | $38,750 |
| 1 Earner | 61 (45.9%) | $45,938 |
| 2 Earners | 41 (30.8%) | $70,625 |
| 3+ Earners | 10 (7.5%) | $148,750 |
| Total | 133 (100.0%) | $51,528 |
Household Income in Myton
Household Income Brackets in Myton
With 43 households falling in the category, the $50,000 to $74,999 income range is the most frequent in Myton, accounting for 20.4% of all households. In contrast, only 3 households (1.4%) fall into the less than $10,000 income bracket, making it the least populous group.
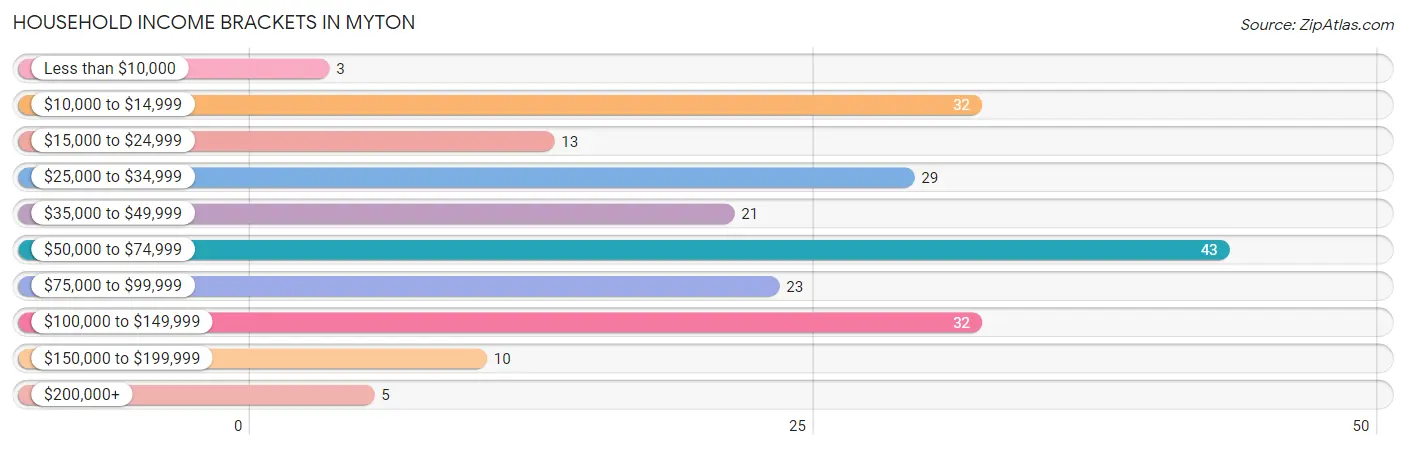
| Income Bracket | # Households | % Households |
| Less than $10,000 | 3 | 1.4% |
| $10,000 to $14,999 | 32 | 15.2% |
| $15,000 to $24,999 | 13 | 6.2% |
| $25,000 to $34,999 | 29 | 13.7% |
| $35,000 to $49,999 | 21 | 10.0% |
| $50,000 to $74,999 | 43 | 20.4% |
| $75,000 to $99,999 | 23 | 10.9% |
| $100,000 to $149,999 | 32 | 15.2% |
| $150,000 to $199,999 | 10 | 4.7% |
| $200,000+ | 5 | 2.4% |
Household Income by Householder Age in Myton
The median household income in Myton is $52,083, with the highest median household income of $84,375 found in the 45 to 64 years age bracket for the primary householder. A total of 73 households (34.6%) fall into this category.
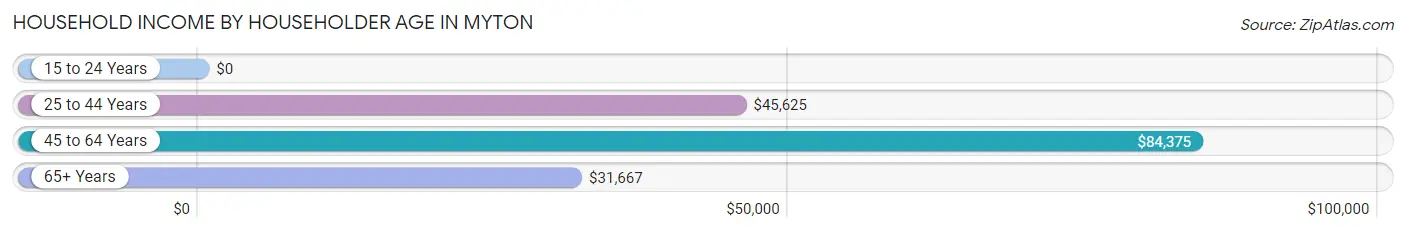
| Income Bracket | # Households | Median Income |
| 15 to 24 Years | 0 (0.0%) | $0 |
| 25 to 44 Years | 88 (41.7%) | $45,625 |
| 45 to 64 Years | 73 (34.6%) | $84,375 |
| 65+ Years | 50 (23.7%) | $31,667 |
| Total | 211 (100.0%) | $52,083 |
Poverty in Myton
Income Below Poverty by Sex and Age in Myton
With 20.7% poverty level for males and 25.9% for females among the residents of Myton, 5 year old males and 16 and 17 year old females are the most vulnerable to poverty, with 5 males (100.0%) and 6 females (100.0%) in their respective age groups living below the poverty level.
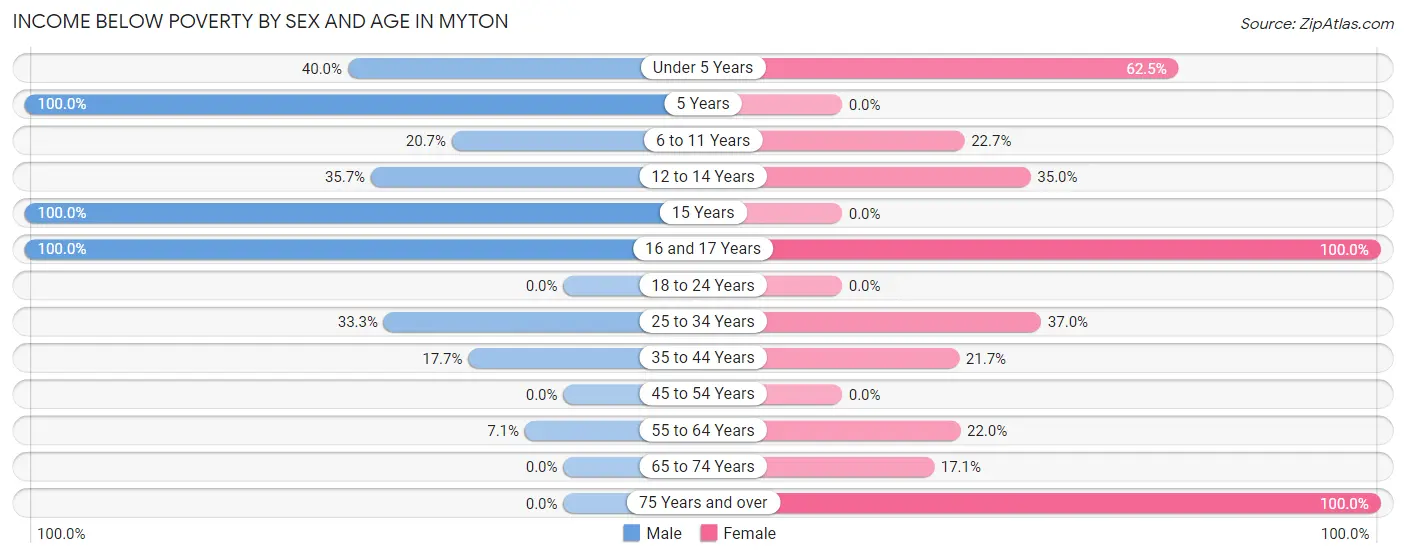
| Age Bracket | Male | Female |
| Under 5 Years | 12 (40.0%) | 20 (62.5%) |
| 5 Years | 5 (100.0%) | 0 (0.0%) |
| 6 to 11 Years | 6 (20.7%) | 5 (22.7%) |
| 12 to 14 Years | 5 (35.7%) | 7 (35.0%) |
| 15 Years | 3 (100.0%) | 0 (0.0%) |
| 16 and 17 Years | 4 (100.0%) | 6 (100.0%) |
| 18 to 24 Years | 0 (0.0%) | 0 (0.0%) |
| 25 to 34 Years | 14 (33.3%) | 17 (37.0%) |
| 35 to 44 Years | 9 (17.6%) | 10 (21.7%) |
| 45 to 54 Years | 0 (0.0%) | 0 (0.0%) |
| 55 to 64 Years | 2 (7.1%) | 9 (22.0%) |
| 65 to 74 Years | 0 (0.0%) | 7 (17.1%) |
| 75 Years and over | 0 (0.0%) | 2 (100.0%) |
| Total | 60 (20.7%) | 83 (25.9%) |
Income Above Poverty by Sex and Age in Myton
According to the poverty statistics in Myton, males aged 18 to 24 years and females aged 5 years are the age groups that are most secure financially, with 100.0% of males and 100.0% of females in these age groups living above the poverty line.
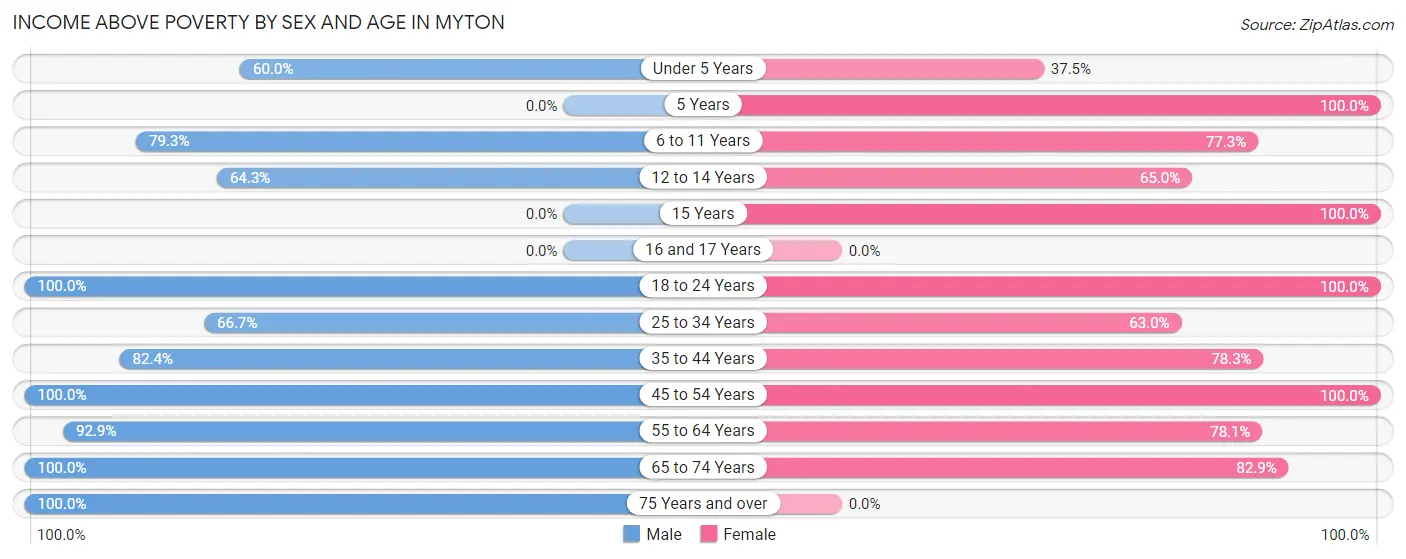
| Age Bracket | Male | Female |
| Under 5 Years | 18 (60.0%) | 12 (37.5%) |
| 5 Years | 0 (0.0%) | 3 (100.0%) |
| 6 to 11 Years | 23 (79.3%) | 17 (77.3%) |
| 12 to 14 Years | 9 (64.3%) | 13 (65.0%) |
| 15 Years | 0 (0.0%) | 4 (100.0%) |
| 16 and 17 Years | 0 (0.0%) | 0 (0.0%) |
| 18 to 24 Years | 21 (100.0%) | 13 (100.0%) |
| 25 to 34 Years | 28 (66.7%) | 29 (63.0%) |
| 35 to 44 Years | 42 (82.4%) | 36 (78.3%) |
| 45 to 54 Years | 30 (100.0%) | 44 (100.0%) |
| 55 to 64 Years | 26 (92.9%) | 32 (78.0%) |
| 65 to 74 Years | 28 (100.0%) | 34 (82.9%) |
| 75 Years and over | 5 (100.0%) | 0 (0.0%) |
| Total | 230 (79.3%) | 237 (74.1%) |
Income Below Poverty Among Married-Couple Families in Myton
The poverty statistics for married-couple families in Myton show that 12.8% or 12 of the total 94 families live below the poverty line. Families with 5 or more children have the highest poverty rate of 50.0%, comprising of 3 families. On the other hand, families with no children have the lowest poverty rate of 0.0%, which includes 0 families.
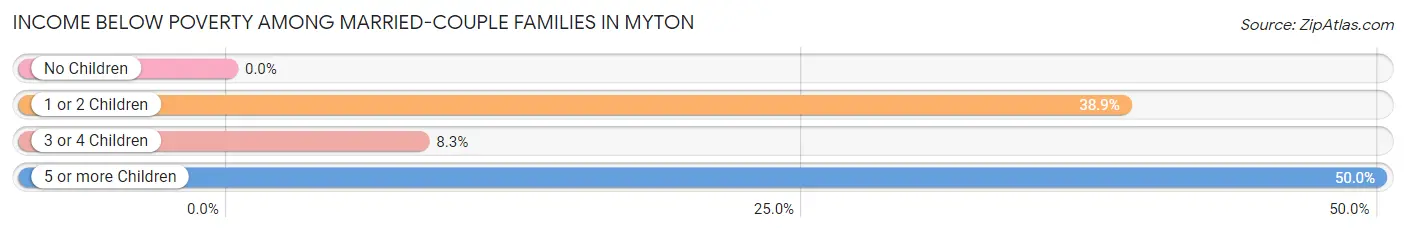
| Children | Above Poverty | Below Poverty |
| No Children | 46 (100.0%) | 0 (0.0%) |
| 1 or 2 Children | 11 (61.1%) | 7 (38.9%) |
| 3 or 4 Children | 22 (91.7%) | 2 (8.3%) |
| 5 or more Children | 3 (50.0%) | 3 (50.0%) |
| Total | 82 (87.2%) | 12 (12.8%) |
Income Below Poverty Among Single-Parent Households in Myton
According to the poverty data in Myton, 50.0% or 6 single-father households and 33.3% or 9 single-mother households are living below the poverty line. Among single-father households, those with 3 or 4 children have the highest poverty rate, with 6 households (100.0%) experiencing poverty. Likewise, among single-mother households, those with 1 or 2 children have the highest poverty rate, with 9 households (52.9%) falling below the poverty line.
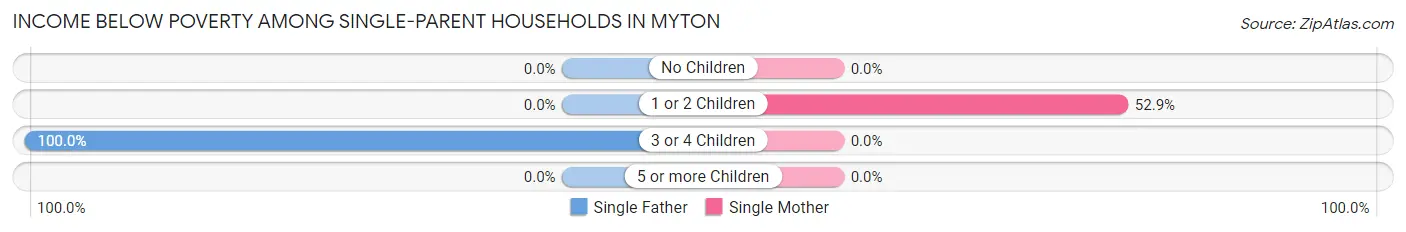
| Children | Single Father | Single Mother |
| No Children | 0 (0.0%) | 0 (0.0%) |
| 1 or 2 Children | 0 (0.0%) | 9 (52.9%) |
| 3 or 4 Children | 6 (100.0%) | 0 (0.0%) |
| 5 or more Children | 0 (0.0%) | 0 (0.0%) |
| Total | 6 (50.0%) | 9 (33.3%) |
Income Below Poverty Among Married-Couple vs Single-Parent Households in Myton
The poverty data for Myton shows that 12 of the married-couple family households (12.8%) and 15 of the single-parent households (38.5%) are living below the poverty level. Within the married-couple family households, those with 5 or more children have the highest poverty rate, with 3 households (50.0%) falling below the poverty line. Among the single-parent households, those with 3 or 4 children have the highest poverty rate, with 6 household (100.0%) living below poverty.
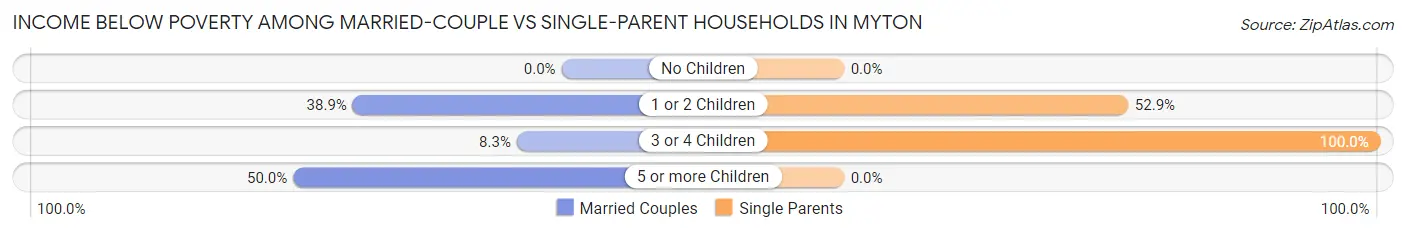
| Children | Married-Couple Families | Single-Parent Households |
| No Children | 0 (0.0%) | 0 (0.0%) |
| 1 or 2 Children | 7 (38.9%) | 9 (52.9%) |
| 3 or 4 Children | 2 (8.3%) | 6 (100.0%) |
| 5 or more Children | 3 (50.0%) | 0 (0.0%) |
| Total | 12 (12.8%) | 15 (38.5%) |
Race in Myton
The most populous races in Myton are White / Caucasian (444 | 72.1%), Native / Alaskan (89 | 14.4%), and Hispanic or Latino (71 | 11.5%).
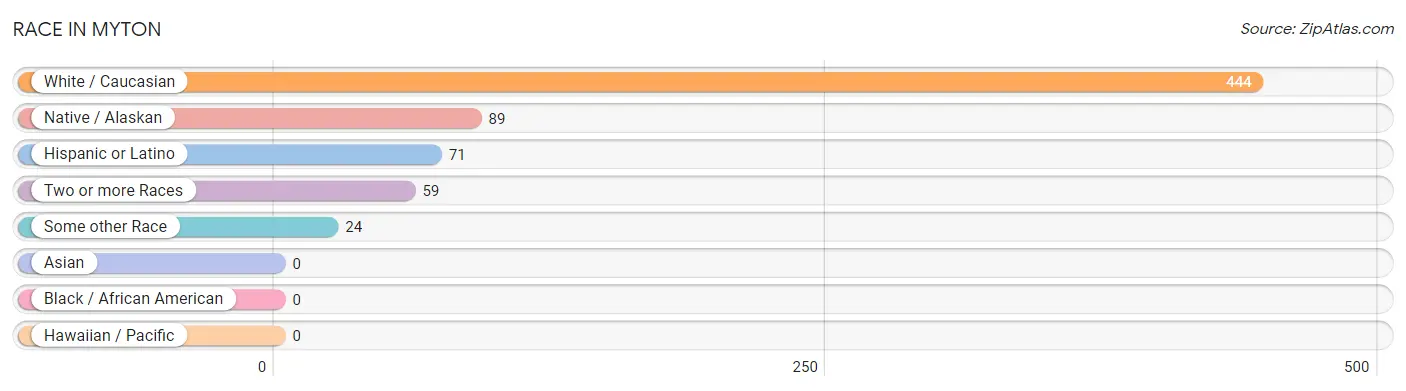
| Race | # Population | % Population |
| Asian | 0 | 0.0% |
| Black / African American | 0 | 0.0% |
| Hawaiian / Pacific | 0 | 0.0% |
| Hispanic or Latino | 71 | 11.5% |
| Native / Alaskan | 89 | 14.4% |
| White / Caucasian | 444 | 72.1% |
| Two or more Races | 59 | 9.6% |
| Some other Race | 24 | 3.9% |
| Total | 616 | 100.0% |
Ancestry in Myton
The most populous ancestries reported in Myton are English (130 | 21.1%), Ute (99 | 16.1%), Mexican (59 | 9.6%), German (51 | 8.3%), and Irish (46 | 7.5%), together accounting for 62.5% of all Myton residents.
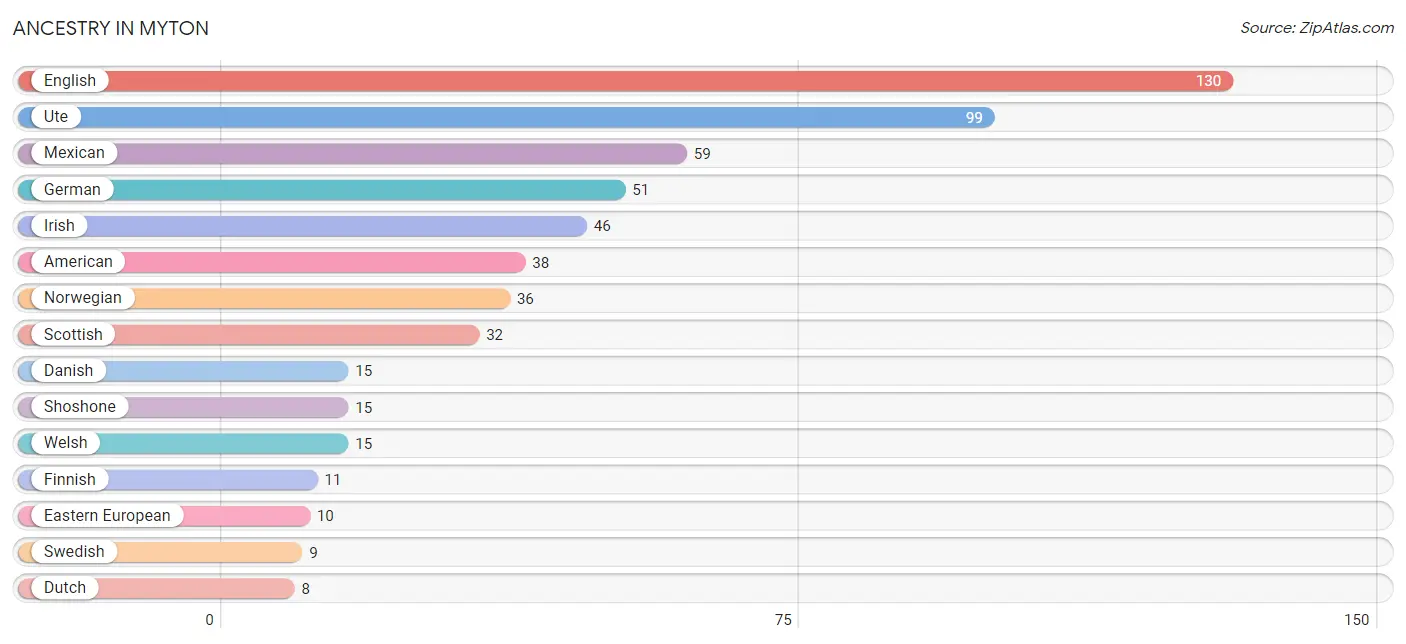
| Ancestry | # Population | % Population |
| American | 38 | 6.2% |
| Danish | 15 | 2.4% |
| Dutch | 8 | 1.3% |
| Eastern European | 10 | 1.6% |
| English | 130 | 21.1% |
| European | 8 | 1.3% |
| Finnish | 11 | 1.8% |
| French | 6 | 1.0% |
| German | 51 | 8.3% |
| Irish | 46 | 7.5% |
| Italian | 6 | 1.0% |
| Mexican | 59 | 9.6% |
| Norwegian | 36 | 5.8% |
| Peruvian | 2 | 0.3% |
| Polish | 5 | 0.8% |
| Scottish | 32 | 5.2% |
| Shoshone | 15 | 2.4% |
| South American | 2 | 0.3% |
| Spaniard | 5 | 0.8% |
| Swedish | 9 | 1.5% |
| Ute | 99 | 16.1% |
| Welsh | 15 | 2.4% | View All 22 Rows |
Immigrants in Myton
The most numerous immigrant groups reported in Myton came from Latin America (14 | 2.3%), Central America (12 | 1.9%), Mexico (12 | 1.9%), England (3 | 0.5%), and Europe (3 | 0.5%), together accounting for 7.2% of all Myton residents.
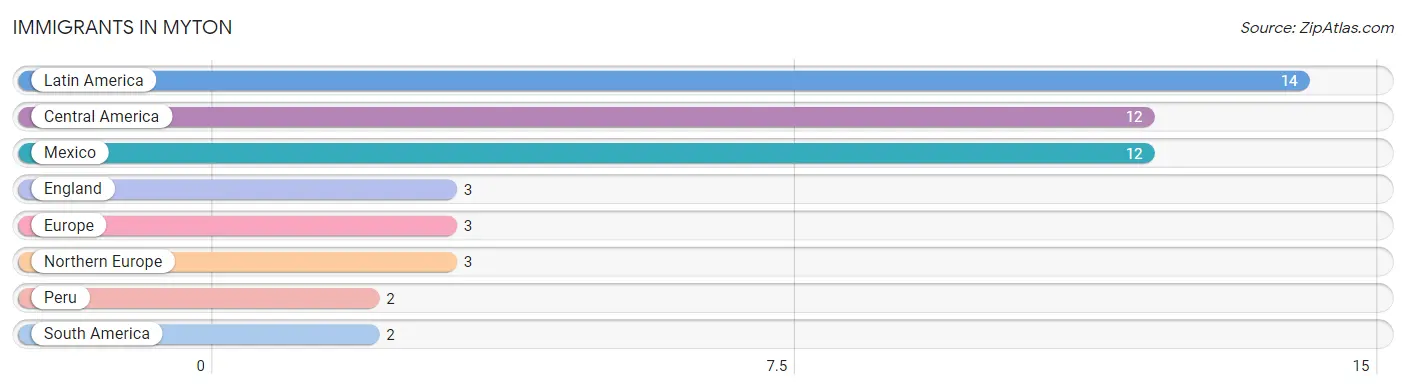
| Immigration Origin | # Population | % Population |
| Central America | 12 | 1.9% |
| England | 3 | 0.5% |
| Europe | 3 | 0.5% |
| Latin America | 14 | 2.3% |
| Mexico | 12 | 1.9% |
| Northern Europe | 3 | 0.5% |
| Peru | 2 | 0.3% |
| South America | 2 | 0.3% | View All 8 Rows |
Sex and Age in Myton
Sex and Age in Myton
The most populous age groups in Myton are Under 5 Years (33 | 11.3%) for men and 45 to 49 Years (36 | 11.2%) for women.
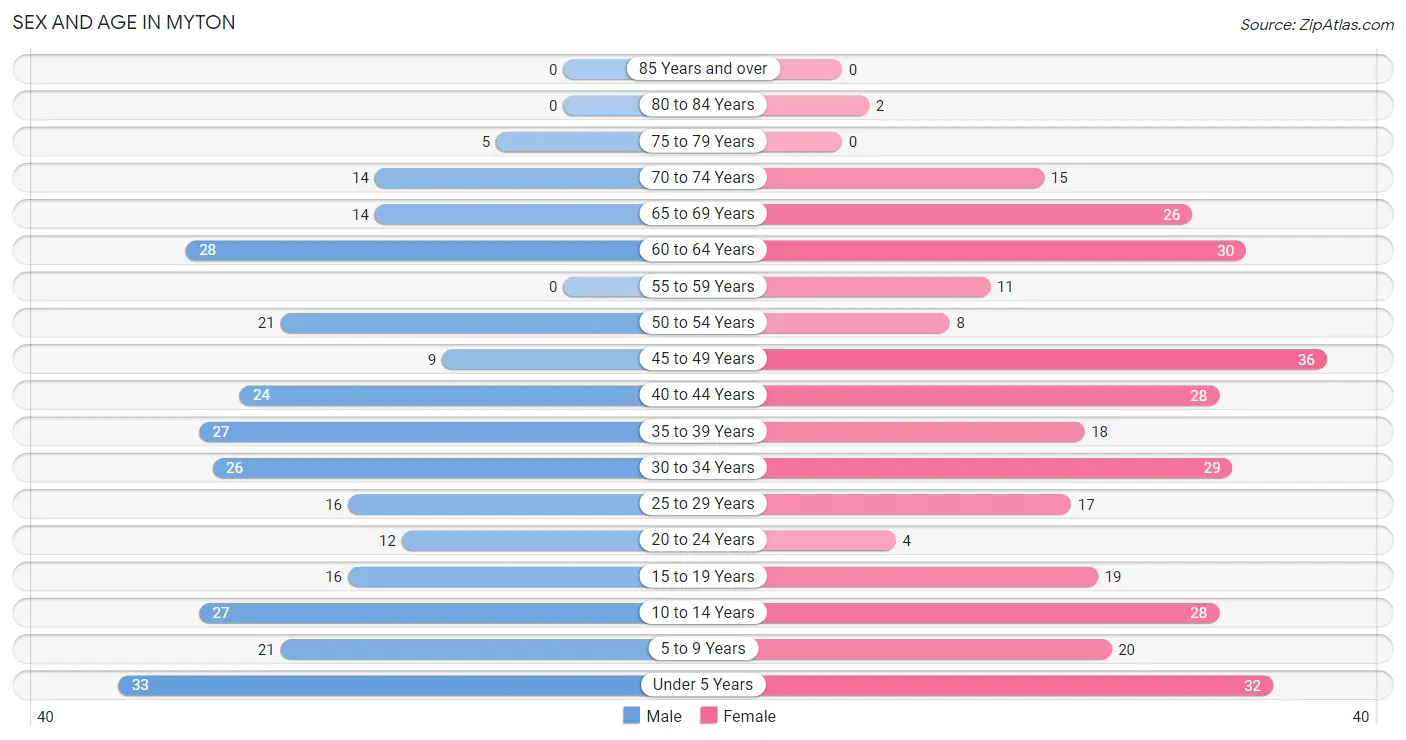
| Age Bracket | Male | Female |
| Under 5 Years | 33 (11.3%) | 32 (9.9%) |
| 5 to 9 Years | 21 (7.2%) | 20 (6.2%) |
| 10 to 14 Years | 27 (9.2%) | 28 (8.7%) |
| 15 to 19 Years | 16 (5.5%) | 19 (5.9%) |
| 20 to 24 Years | 12 (4.1%) | 4 (1.2%) |
| 25 to 29 Years | 16 (5.5%) | 17 (5.3%) |
| 30 to 34 Years | 26 (8.9%) | 29 (9.0%) |
| 35 to 39 Years | 27 (9.2%) | 18 (5.6%) |
| 40 to 44 Years | 24 (8.2%) | 28 (8.7%) |
| 45 to 49 Years | 9 (3.1%) | 36 (11.2%) |
| 50 to 54 Years | 21 (7.2%) | 8 (2.5%) |
| 55 to 59 Years | 0 (0.0%) | 11 (3.4%) |
| 60 to 64 Years | 28 (9.6%) | 30 (9.3%) |
| 65 to 69 Years | 14 (4.8%) | 26 (8.1%) |
| 70 to 74 Years | 14 (4.8%) | 15 (4.6%) |
| 75 to 79 Years | 5 (1.7%) | 0 (0.0%) |
| 80 to 84 Years | 0 (0.0%) | 2 (0.6%) |
| 85 Years and over | 0 (0.0%) | 0 (0.0%) |
| Total | 293 (100.0%) | 323 (100.0%) |
Families and Households in Myton
Median Family Size in Myton
The median family size in Myton is 3.83 persons per family, with married-couple families (94 | 70.7%) accounting for the largest median family size of 4.3 persons per family. On the other hand, single female/mother families (27 | 20.3%) represent the smallest median family size with 2.37 persons per family.
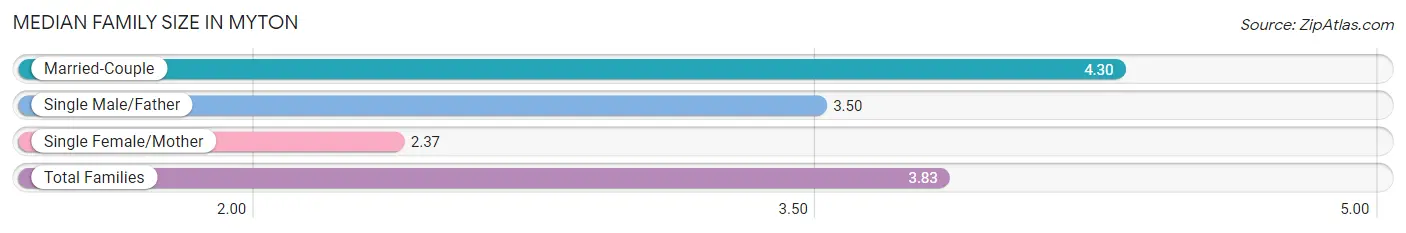
| Family Type | # Families | Family Size |
| Married-Couple | 94 (70.7%) | 4.30 |
| Single Male/Father | 12 (9.0%) | 3.50 |
| Single Female/Mother | 27 (20.3%) | 2.37 |
| Total Families | 133 (100.0%) | 3.83 |
Median Household Size in Myton
The median household size in Myton is 2.92 persons per household, with single male/father households (12 | 5.7%) accounting for the largest median household size of 4.42 persons per household. non-family households (78 | 37.0%) represent the smallest median household size with 1.17 persons per household.
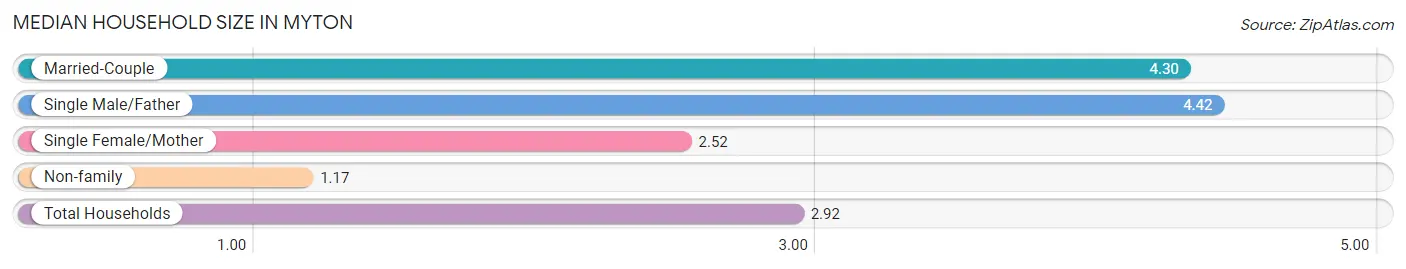
| Household Type | # Households | Household Size |
| Married-Couple | 94 (44.6%) | 4.30 |
| Single Male/Father | 12 (5.7%) | 4.42 |
| Single Female/Mother | 27 (12.8%) | 2.52 |
| Non-family | 78 (37.0%) | 1.17 |
| Total Households | 211 (100.0%) | 2.92 |
Household Size by Marriage Status in Myton
Out of a total of 211 households in Myton, 133 (63.0%) are family households, while 78 (37.0%) are nonfamily households. The most numerous type of family households are 2-person households, comprising 40, and the most common type of nonfamily households are 1-person households, comprising 75.
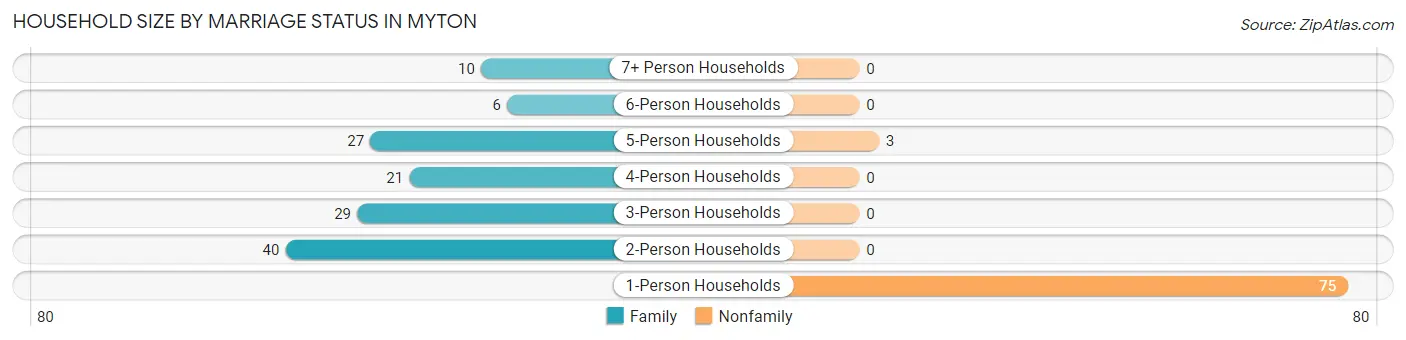
| Household Size | Family Households | Nonfamily Households |
| 1-Person Households | - | 75 (35.5%) |
| 2-Person Households | 40 (19.0%) | 0 (0.0%) |
| 3-Person Households | 29 (13.7%) | 0 (0.0%) |
| 4-Person Households | 21 (10.0%) | 0 (0.0%) |
| 5-Person Households | 27 (12.8%) | 3 (1.4%) |
| 6-Person Households | 6 (2.8%) | 0 (0.0%) |
| 7+ Person Households | 10 (4.7%) | 0 (0.0%) |
| Total | 133 (63.0%) | 78 (37.0%) |
Female Fertility in Myton
Fertility by Age in Myton
Average fertility rate in Myton is 116.0 births per 1,000 women. Women in the age bracket of 20 to 34 years have the highest fertility rate with 360.0 births per 1,000 women. Women in the age bracket of 20 to 34 years acount for 100.0% of all women with births.
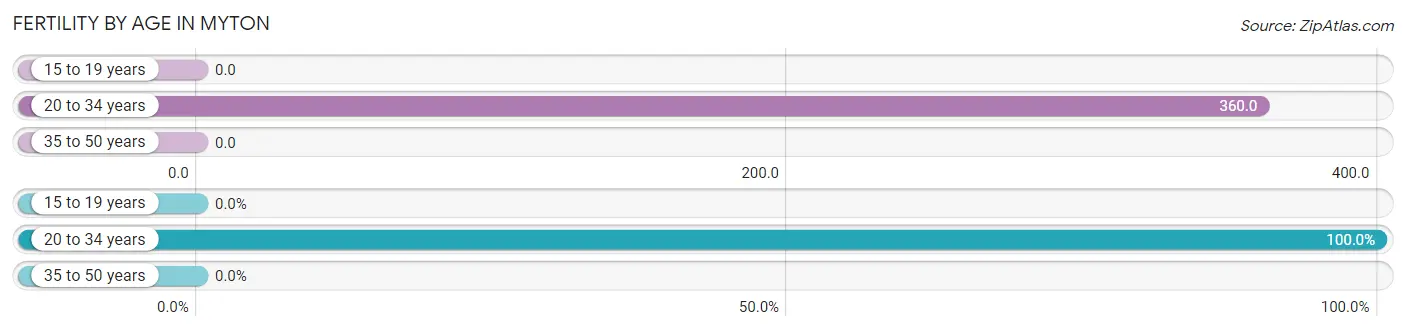
| Age Bracket | Women with Births | Births / 1,000 Women |
| 15 to 19 years | 0 (0.0%) | 0.0 |
| 20 to 34 years | 18 (100.0%) | 360.0 |
| 35 to 50 years | 0 (0.0%) | 0.0 |
| Total | 18 (100.0%) | 116.0 |
Fertility by Age by Marriage Status in Myton
83.3% of women with births (18) in Myton are married. The highest percentage of unmarried women with births falls into 20 to 34 years age bracket with 16.7% of them unmarried at the time of birth, while the lowest percentage of unmarried women with births belong to 20 to 34 years age bracket with 16.7% of them unmarried.
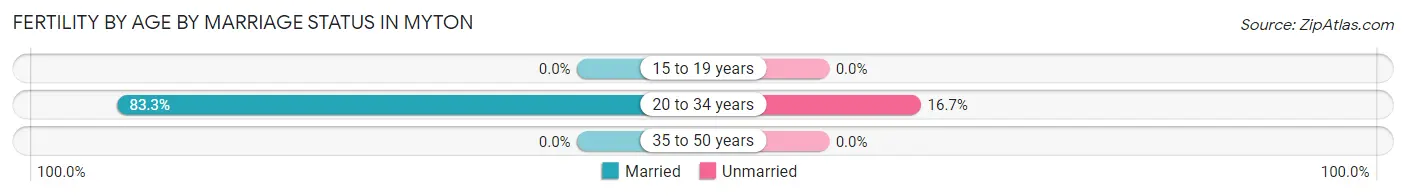
| Age Bracket | Married | Unmarried |
| 15 to 19 years | 0 (0.0%) | 0 (0.0%) |
| 20 to 34 years | 15 (83.3%) | 3 (16.7%) |
| 35 to 50 years | 0 (0.0%) | 0 (0.0%) |
| Total | 15 (83.3%) | 3 (16.7%) |
Fertility by Education in Myton
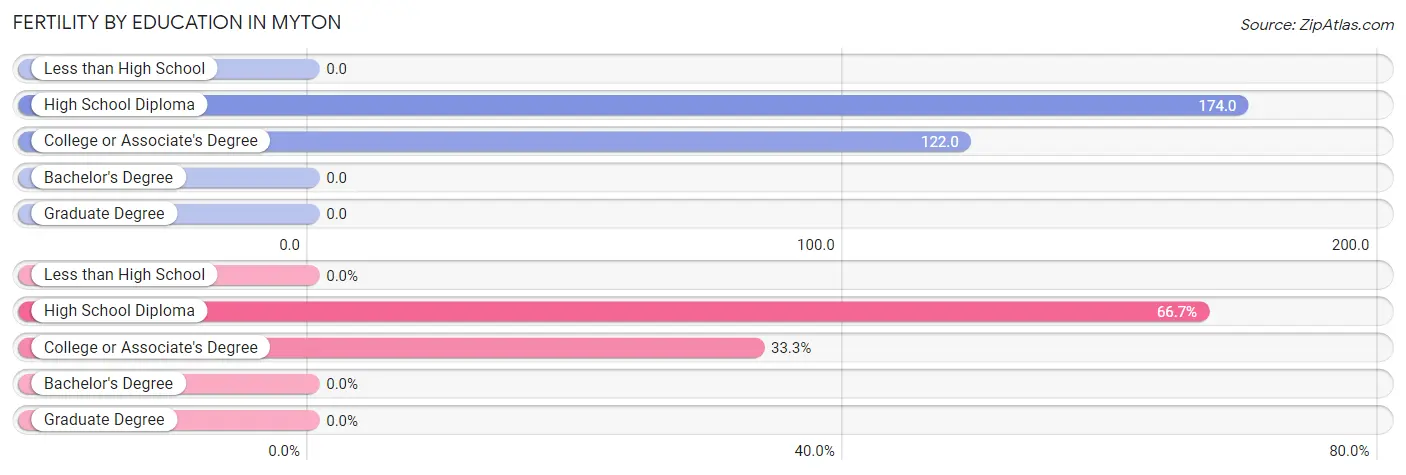
| Educational Attainment | Women with Births | Births / 1,000 Women |
| Less than High School | 0 (0.0%) | 0.0 |
| High School Diploma | 12 (66.7%) | 174.0 |
| College or Associate's Degree | 6 (33.3%) | 122.0 |
| Bachelor's Degree | 0 (0.0%) | 0.0 |
| Graduate Degree | 0 (0.0%) | 0.0 |
| Total | 18 (100.0%) | 116.0 |
Fertility by Education by Marriage Status in Myton
16.7% of women with births in Myton are unmarried. Women with the educational attainment of college or associate's degree are most likely to be married with 100.0% of them married at childbirth, while women with the educational attainment of high school diploma are least likely to be married with 25.0% of them unmarried at childbirth.
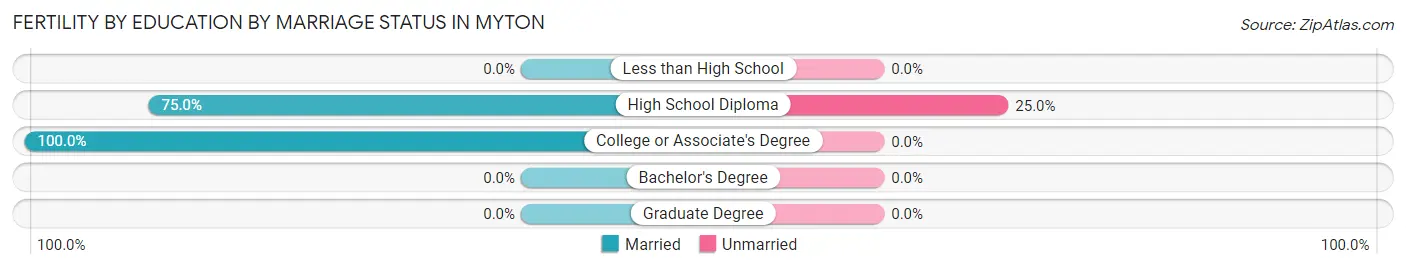
| Educational Attainment | Married | Unmarried |
| Less than High School | 0 (0.0%) | 0 (0.0%) |
| High School Diploma | 9 (75.0%) | 3 (25.0%) |
| College or Associate's Degree | 6 (100.0%) | 0 (0.0%) |
| Bachelor's Degree | 0 (0.0%) | 0 (0.0%) |
| Graduate Degree | 0 (0.0%) | 0 (0.0%) |
| Total | 15 (83.3%) | 3 (16.7%) |
Employment Characteristics in Myton
Employment by Class of Employer in Myton
Among the 210 employed individuals in Myton, private company employees (149 | 71.0%), local government employees (22 | 10.5%), and self-employed (incorporated) (16 | 7.6%) make up the most common classes of employment.
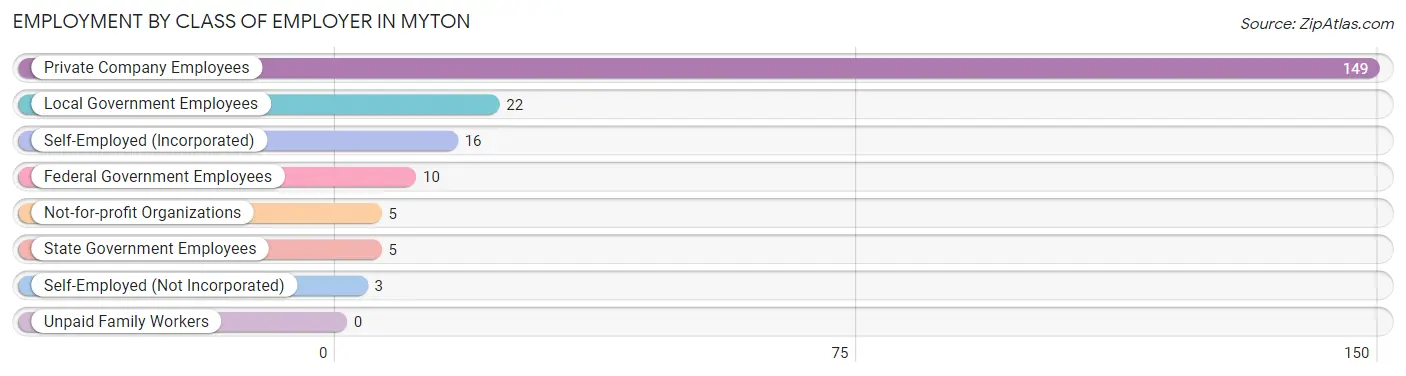
| Employer Class | # Employees | % Employees |
| Private Company Employees | 149 | 71.0% |
| Self-Employed (Incorporated) | 16 | 7.6% |
| Self-Employed (Not Incorporated) | 3 | 1.4% |
| Not-for-profit Organizations | 5 | 2.4% |
| Local Government Employees | 22 | 10.5% |
| State Government Employees | 5 | 2.4% |
| Federal Government Employees | 10 | 4.8% |
| Unpaid Family Workers | 0 | 0.0% |
| Total | 210 | 100.0% |
Employment Status by Age in Myton
According to the labor force statistics for Myton, out of the total population over 16 years of age (448), 54.0% or 242 individuals are in the labor force, with 13.2% or 32 of them unemployed. The age group with the highest labor force participation rate is 30 to 34 years, with 76.4% or 42 individuals in the labor force. Within the labor force, the 25 to 29 years age range has the highest percentage of unemployed individuals, with 32.0% or 8 of them being unemployed.
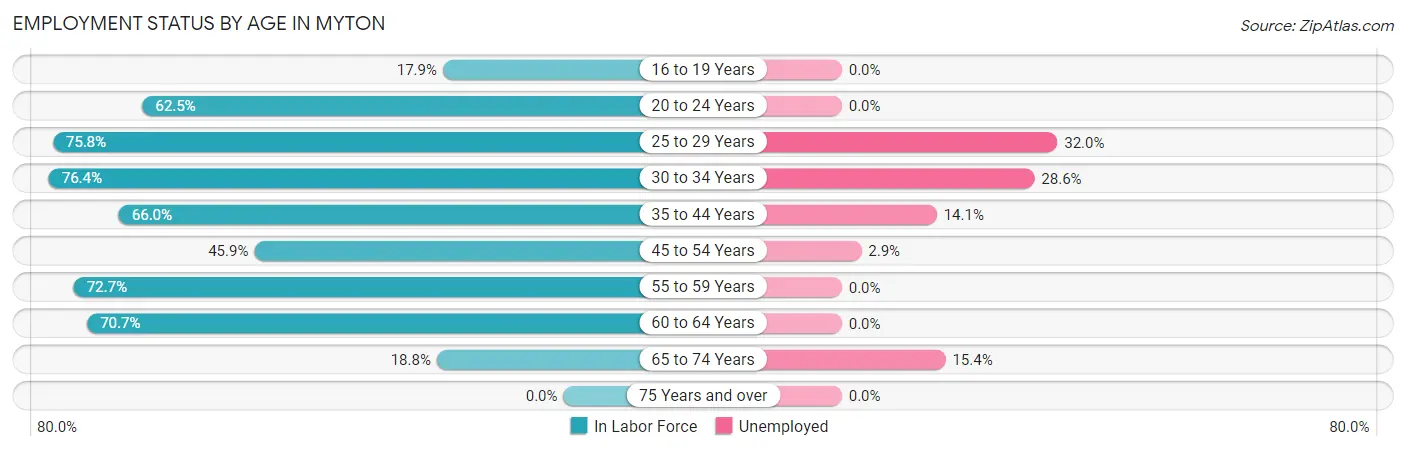
| Age Bracket | In Labor Force | Unemployed |
| 16 to 19 Years | 5 (17.9%) | 0 (0.0%) |
| 20 to 24 Years | 10 (62.5%) | 0 (0.0%) |
| 25 to 29 Years | 25 (75.8%) | 8 (32.0%) |
| 30 to 34 Years | 42 (76.4%) | 12 (28.6%) |
| 35 to 44 Years | 64 (66.0%) | 9 (14.1%) |
| 45 to 54 Years | 34 (45.9%) | 1 (2.9%) |
| 55 to 59 Years | 8 (72.7%) | 0 (0.0%) |
| 60 to 64 Years | 41 (70.7%) | 0 (0.0%) |
| 65 to 74 Years | 13 (18.8%) | 2 (15.4%) |
| 75 Years and over | 0 (0.0%) | 0 (0.0%) |
| Total | 242 (54.0%) | 32 (13.2%) |
Employment Status by Educational Attainment in Myton
According to labor force statistics for Myton, 65.2% of individuals (214) out of the total population between 25 and 64 years of age (328) are in the labor force, with 14.0% or 30 of them being unemployed. The group with the highest labor force participation rate are those with the educational attainment of less than high school, with 83.9% or 47 individuals in the labor force. Within the labor force, individuals with less than high school education have the highest percentage of unemployment, with 19.1% or 9 of them being unemployed.
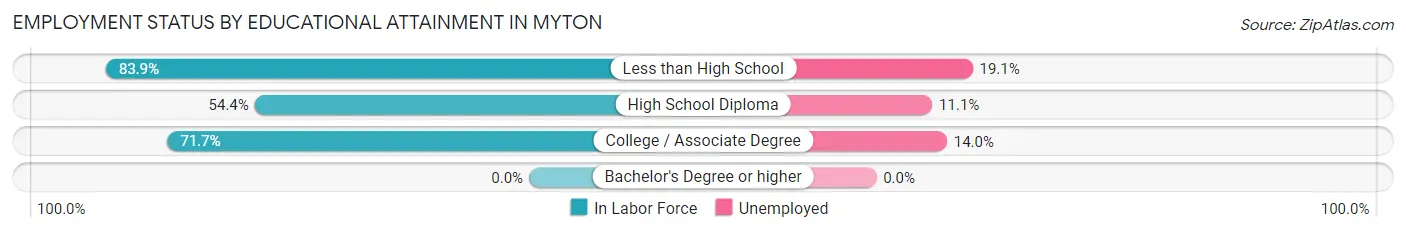
| Educational Attainment | In Labor Force | Unemployed |
| Less than High School | 47 (83.9%) | 11 (19.1%) |
| High School Diploma | 81 (54.4%) | 17 (11.1%) |
| College / Associate Degree | 86 (71.7%) | 17 (14.0%) |
| Bachelor's Degree or higher | 0 (0.0%) | 0 (0.0%) |
| Total | 214 (65.2%) | 46 (14.0%) |
Employment Occupations by Sex in Myton
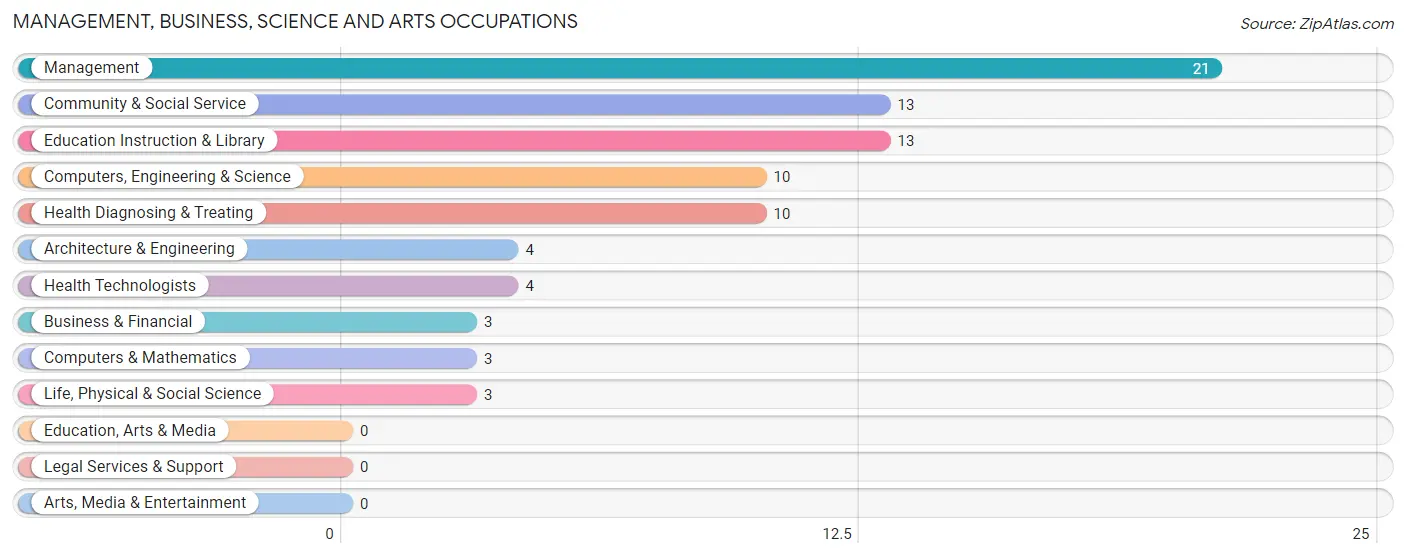
Management, Business, Science and Arts Occupations
The most common Management, Business, Science and Arts occupations in Myton are Management (21 | 10.0%), Community & Social Service (13 | 6.2%), Education Instruction & Library (13 | 6.2%), Computers, Engineering & Science (10 | 4.8%), and Health Diagnosing & Treating (10 | 4.8%).
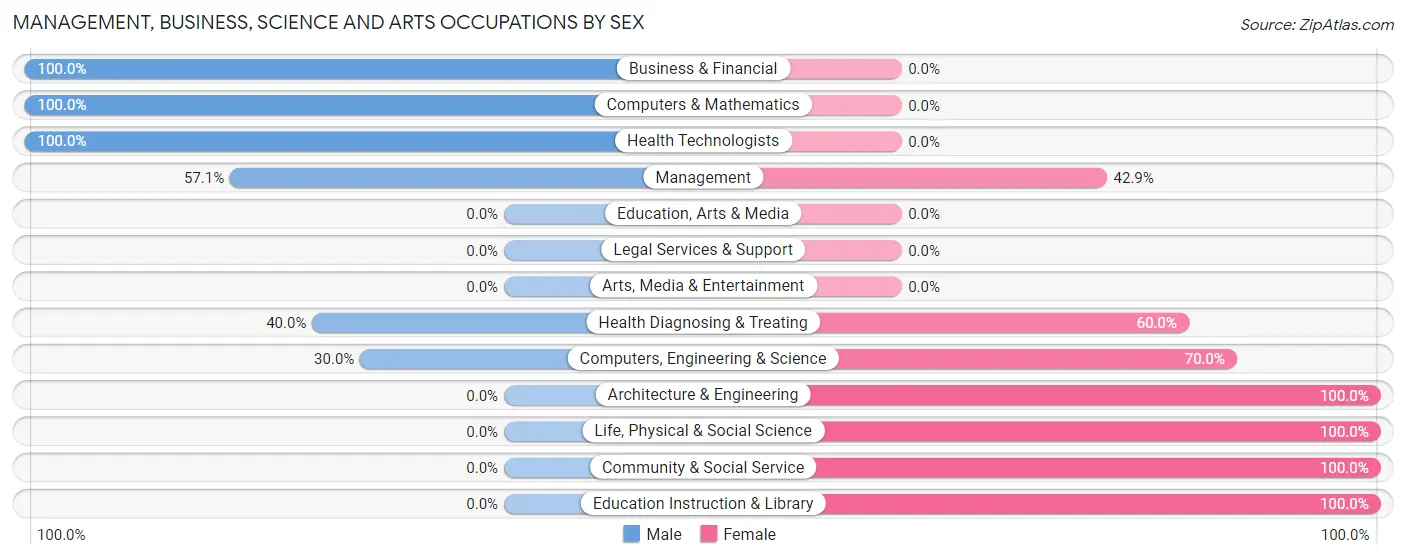
Management, Business, Science and Arts Occupations by Sex
Within the Management, Business, Science and Arts occupations in Myton, the most male-oriented occupations are Business & Financial (100.0%), Computers & Mathematics (100.0%), and Health Technologists (100.0%), while the most female-oriented occupations are Architecture & Engineering (100.0%), Life, Physical & Social Science (100.0%), and Community & Social Service (100.0%).
| Occupation | Male | Female |
| Management | 12 (57.1%) | 9 (42.9%) |
| Business & Financial | 3 (100.0%) | 0 (0.0%) |
| Computers, Engineering & Science | 3 (30.0%) | 7 (70.0%) |
| Computers & Mathematics | 3 (100.0%) | 0 (0.0%) |
| Architecture & Engineering | 0 (0.0%) | 4 (100.0%) |
| Life, Physical & Social Science | 0 (0.0%) | 3 (100.0%) |
| Community & Social Service | 0 (0.0%) | 13 (100.0%) |
| Education, Arts & Media | 0 (0.0%) | 0 (0.0%) |
| Legal Services & Support | 0 (0.0%) | 0 (0.0%) |
| Education Instruction & Library | 0 (0.0%) | 13 (100.0%) |
| Arts, Media & Entertainment | 0 (0.0%) | 0 (0.0%) |
| Health Diagnosing & Treating | 4 (40.0%) | 6 (60.0%) |
| Health Technologists | 4 (100.0%) | 0 (0.0%) |
| Total (Category) | 22 (38.6%) | 35 (61.4%) |
| Total (Overall) | 126 (60.0%) | 84 (40.0%) |
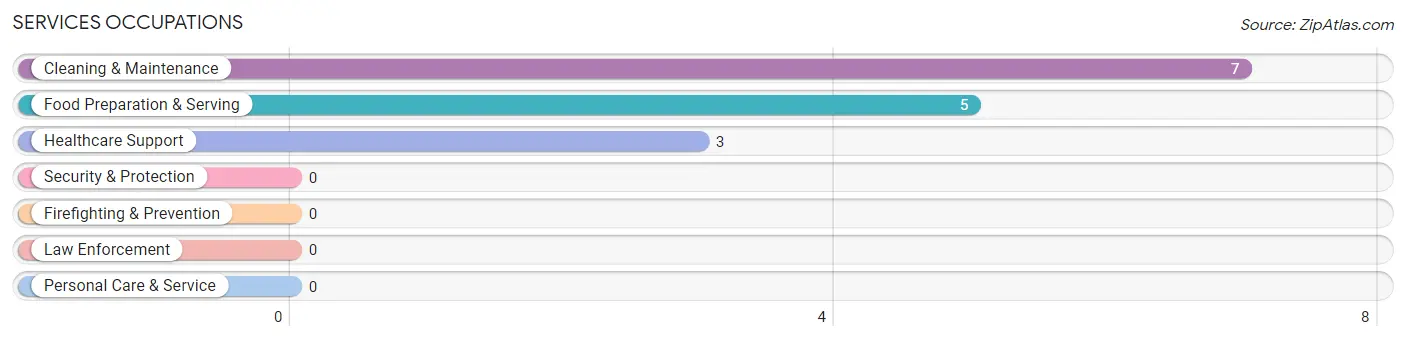
Services Occupations
The most common Services occupations in Myton are Cleaning & Maintenance (7 | 3.3%), Food Preparation & Serving (5 | 2.4%), and Healthcare Support (3 | 1.4%).
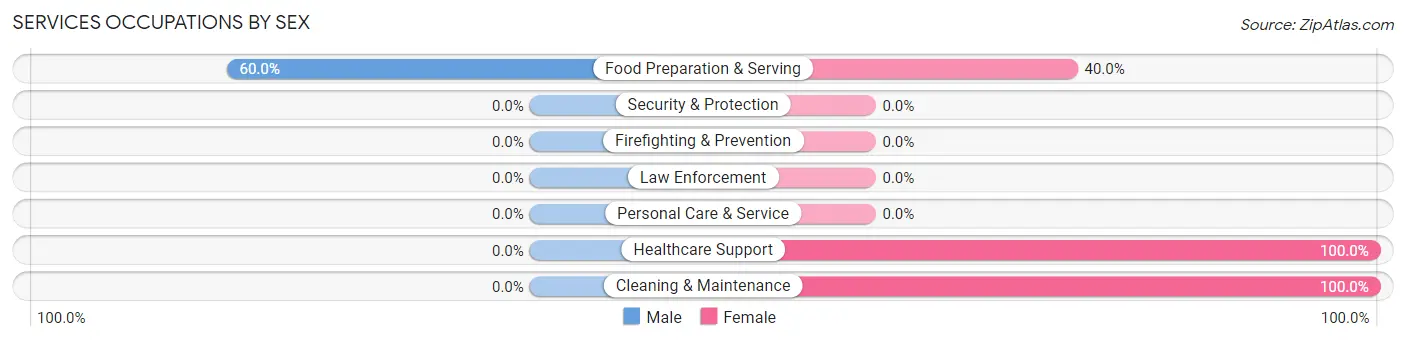
Services Occupations by Sex
| Occupation | Male | Female |
| Healthcare Support | 0 (0.0%) | 3 (100.0%) |
| Security & Protection | 0 (0.0%) | 0 (0.0%) |
| Firefighting & Prevention | 0 (0.0%) | 0 (0.0%) |
| Law Enforcement | 0 (0.0%) | 0 (0.0%) |
| Food Preparation & Serving | 3 (60.0%) | 2 (40.0%) |
| Cleaning & Maintenance | 0 (0.0%) | 7 (100.0%) |
| Personal Care & Service | 0 (0.0%) | 0 (0.0%) |
| Total (Category) | 3 (20.0%) | 12 (80.0%) |
| Total (Overall) | 126 (60.0%) | 84 (40.0%) |
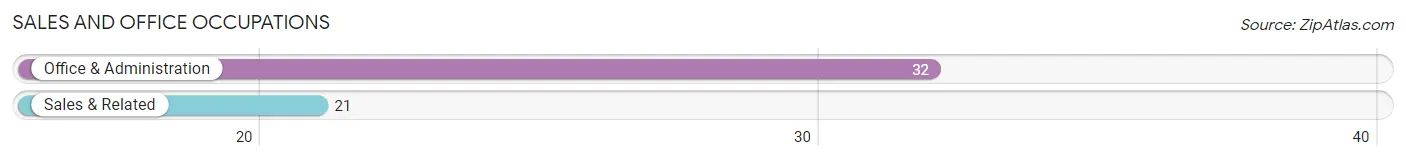
Sales and Office Occupations
The most common Sales and Office occupations in Myton are Office & Administration (32 | 15.2%), and Sales & Related (21 | 10.0%).
Sales and Office Occupations by Sex
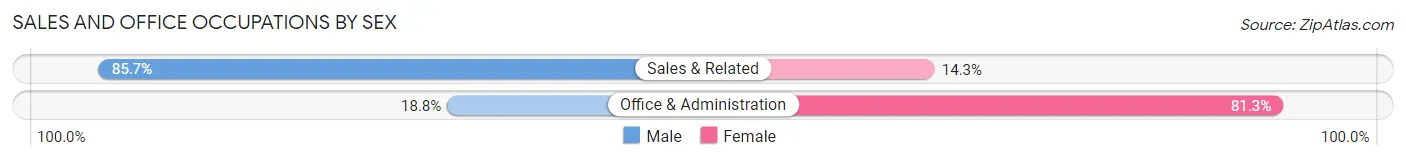
| Occupation | Male | Female |
| Sales & Related | 18 (85.7%) | 3 (14.3%) |
| Office & Administration | 6 (18.8%) | 26 (81.2%) |
| Total (Category) | 24 (45.3%) | 29 (54.7%) |
| Total (Overall) | 126 (60.0%) | 84 (40.0%) |
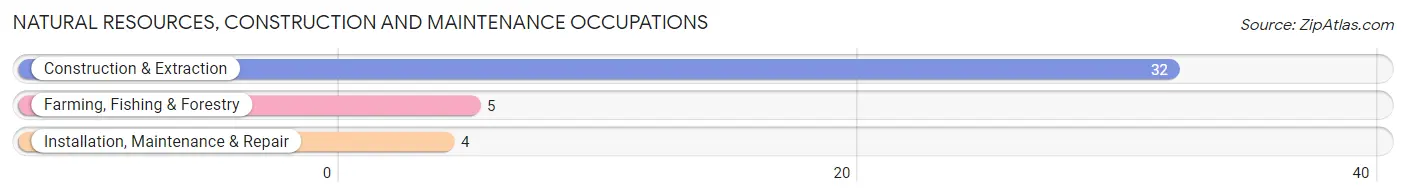
Natural Resources, Construction and Maintenance Occupations
The most common Natural Resources, Construction and Maintenance occupations in Myton are Construction & Extraction (32 | 15.2%), Farming, Fishing & Forestry (5 | 2.4%), and Installation, Maintenance & Repair (4 | 1.9%).
Natural Resources, Construction and Maintenance Occupations by Sex
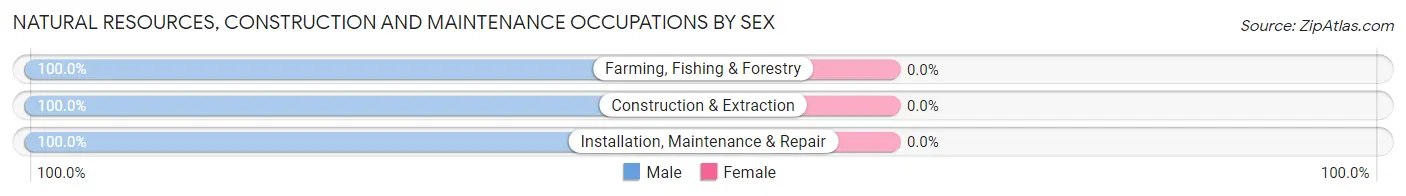
| Occupation | Male | Female |
| Farming, Fishing & Forestry | 5 (100.0%) | 0 (0.0%) |
| Construction & Extraction | 32 (100.0%) | 0 (0.0%) |
| Installation, Maintenance & Repair | 4 (100.0%) | 0 (0.0%) |
| Total (Category) | 41 (100.0%) | 0 (0.0%) |
| Total (Overall) | 126 (60.0%) | 84 (40.0%) |
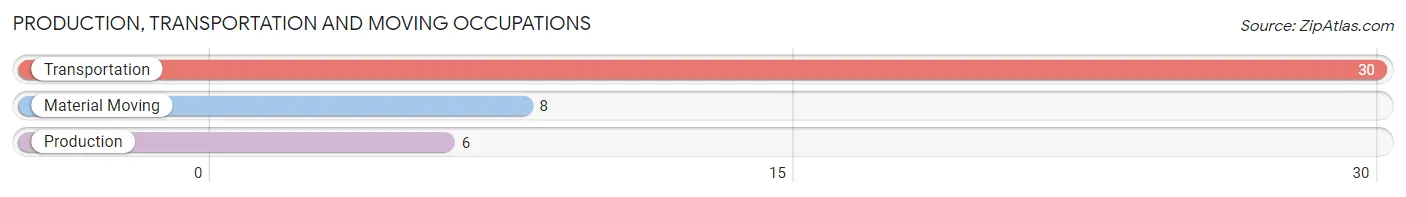
Production, Transportation and Moving Occupations
The most common Production, Transportation and Moving occupations in Myton are Transportation (30 | 14.3%), Material Moving (8 | 3.8%), and Production (6 | 2.9%).
Production, Transportation and Moving Occupations by Sex
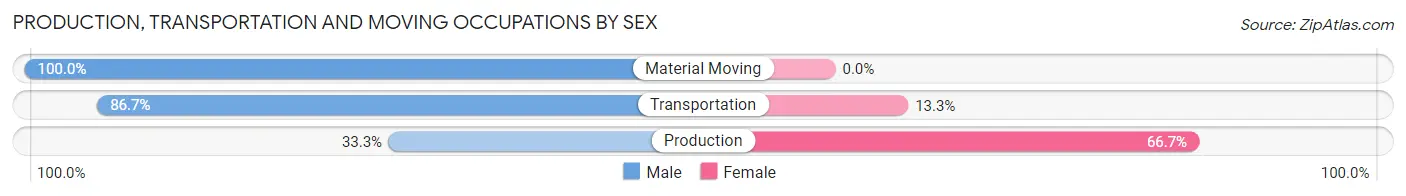
| Occupation | Male | Female |
| Production | 2 (33.3%) | 4 (66.7%) |
| Transportation | 26 (86.7%) | 4 (13.3%) |
| Material Moving | 8 (100.0%) | 0 (0.0%) |
| Total (Category) | 36 (81.8%) | 8 (18.2%) |
| Total (Overall) | 126 (60.0%) | 84 (40.0%) |
Employment Industries by Sex in Myton
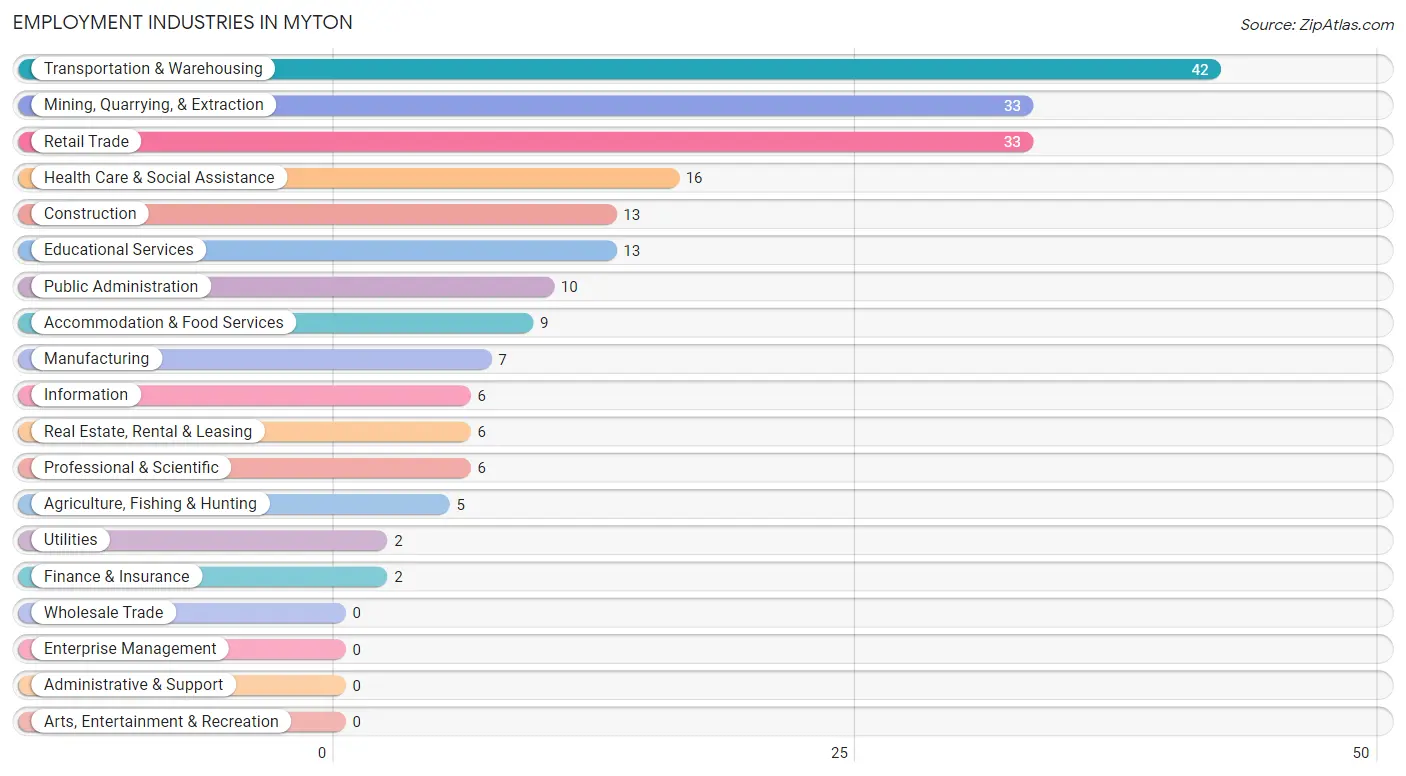
Employment Industries in Myton
The major employment industries in Myton include Transportation & Warehousing (42 | 20.0%), Mining, Quarrying, & Extraction (33 | 15.7%), Retail Trade (33 | 15.7%), Health Care & Social Assistance (16 | 7.6%), and Construction (13 | 6.2%).
Employment Industries by Sex in Myton
The Myton industries that see more men than women are Agriculture, Fishing & Hunting (100.0%), Construction (100.0%), and Utilities (100.0%), whereas the industries that tend to have a higher number of women are Information (100.0%), Finance & Insurance (100.0%), and Public Administration (100.0%).
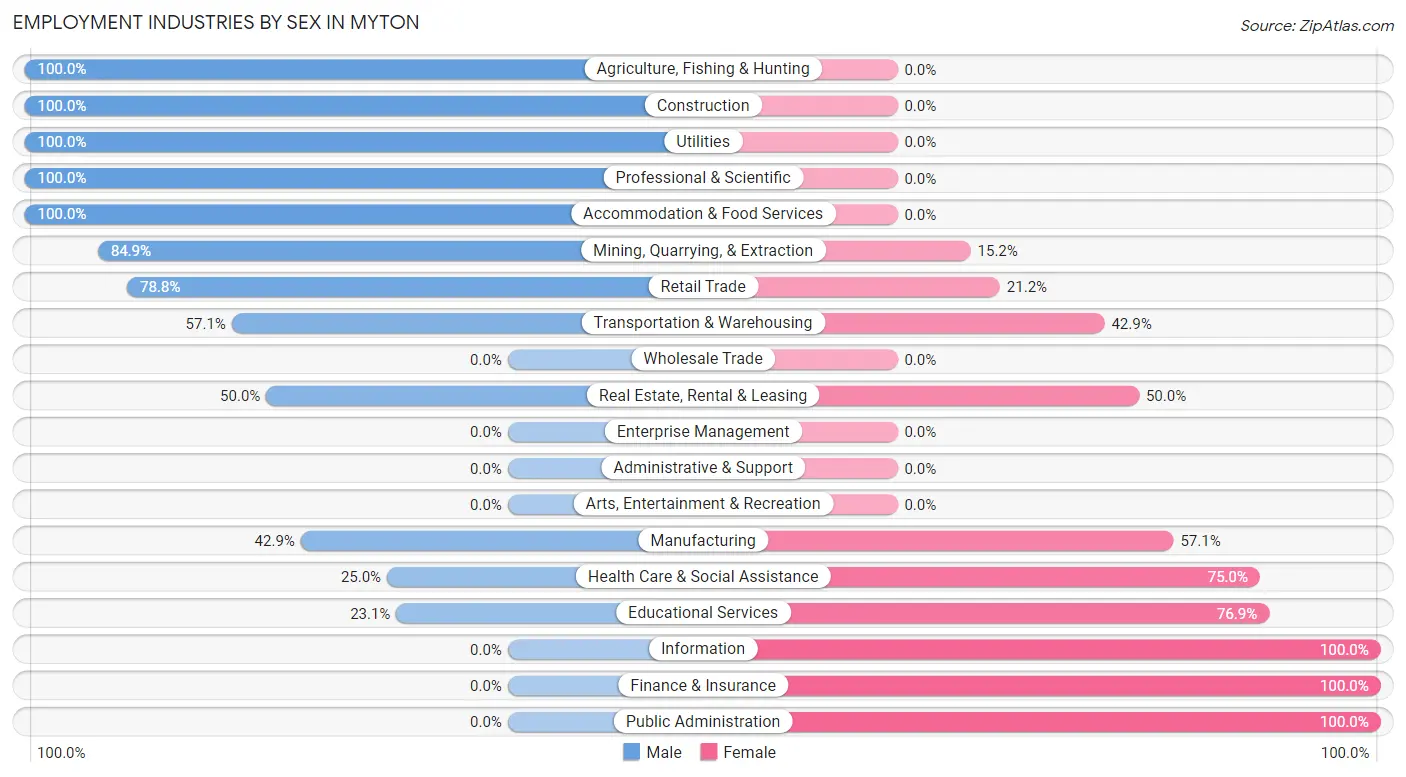
| Industry | Male | Female |
| Agriculture, Fishing & Hunting | 5 (100.0%) | 0 (0.0%) |
| Mining, Quarrying, & Extraction | 28 (84.9%) | 5 (15.1%) |
| Construction | 13 (100.0%) | 0 (0.0%) |
| Manufacturing | 3 (42.9%) | 4 (57.1%) |
| Wholesale Trade | 0 (0.0%) | 0 (0.0%) |
| Retail Trade | 26 (78.8%) | 7 (21.2%) |
| Transportation & Warehousing | 24 (57.1%) | 18 (42.9%) |
| Utilities | 2 (100.0%) | 0 (0.0%) |
| Information | 0 (0.0%) | 6 (100.0%) |
| Finance & Insurance | 0 (0.0%) | 2 (100.0%) |
| Real Estate, Rental & Leasing | 3 (50.0%) | 3 (50.0%) |
| Professional & Scientific | 6 (100.0%) | 0 (0.0%) |
| Enterprise Management | 0 (0.0%) | 0 (0.0%) |
| Administrative & Support | 0 (0.0%) | 0 (0.0%) |
| Educational Services | 3 (23.1%) | 10 (76.9%) |
| Health Care & Social Assistance | 4 (25.0%) | 12 (75.0%) |
| Arts, Entertainment & Recreation | 0 (0.0%) | 0 (0.0%) |
| Accommodation & Food Services | 9 (100.0%) | 0 (0.0%) |
| Public Administration | 0 (0.0%) | 10 (100.0%) |
| Total | 126 (60.0%) | 84 (40.0%) |
Education in Myton
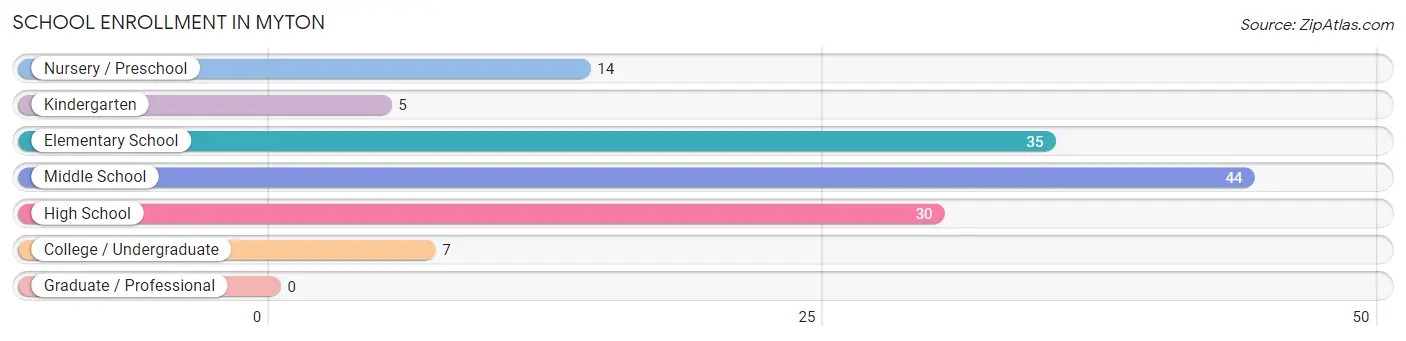
School Enrollment in Myton
The most common levels of schooling among the 135 students in Myton are middle school (44 | 32.6%), elementary school (35 | 25.9%), and high school (30 | 22.2%).
| School Level | # Students | % Students |
| Nursery / Preschool | 14 | 10.4% |
| Kindergarten | 5 | 3.7% |
| Elementary School | 35 | 25.9% |
| Middle School | 44 | 32.6% |
| High School | 30 | 22.2% |
| College / Undergraduate | 7 | 5.2% |
| Graduate / Professional | 0 | 0.0% |
| Total | 135 | 100.0% |
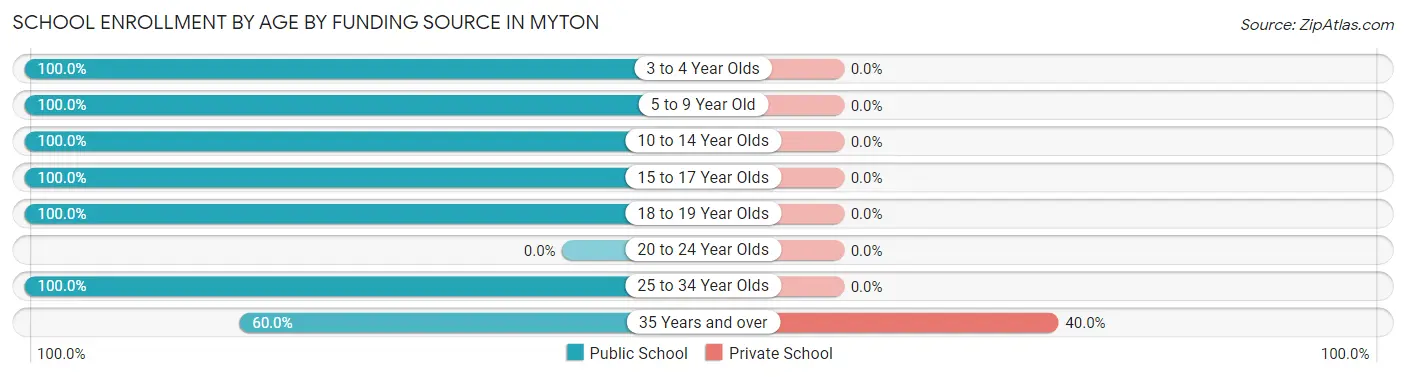
School Enrollment by Age by Funding Source in Myton
Out of a total of 135 students who are enrolled in schools in Myton, 2 (1.5%) attend a private institution, while the remaining 133 (98.5%) are enrolled in public schools. The age group of 35 years and over has the highest likelihood of being enrolled in private schools, with 2 (40.0% in the age bracket) enrolled. Conversely, the age group of 3 to 4 year olds has the lowest likelihood of being enrolled in a private school, with 14 (100.0% in the age bracket) attending a public institution.
| Age Bracket | Public School | Private School |
| 3 to 4 Year Olds | 14 (100.0%) | 0 (0.0%) |
| 5 to 9 Year Old | 31 (100.0%) | 0 (0.0%) |
| 10 to 14 Year Olds | 55 (100.0%) | 0 (0.0%) |
| 15 to 17 Year Olds | 17 (100.0%) | 0 (0.0%) |
| 18 to 19 Year Olds | 5 (100.0%) | 0 (0.0%) |
| 20 to 24 Year Olds | 0 (0.0%) | 0 (0.0%) |
| 25 to 34 Year Olds | 8 (100.0%) | 0 (0.0%) |
| 35 Years and over | 3 (60.0%) | 2 (40.0%) |
| Total | 133 (98.5%) | 2 (1.5%) |
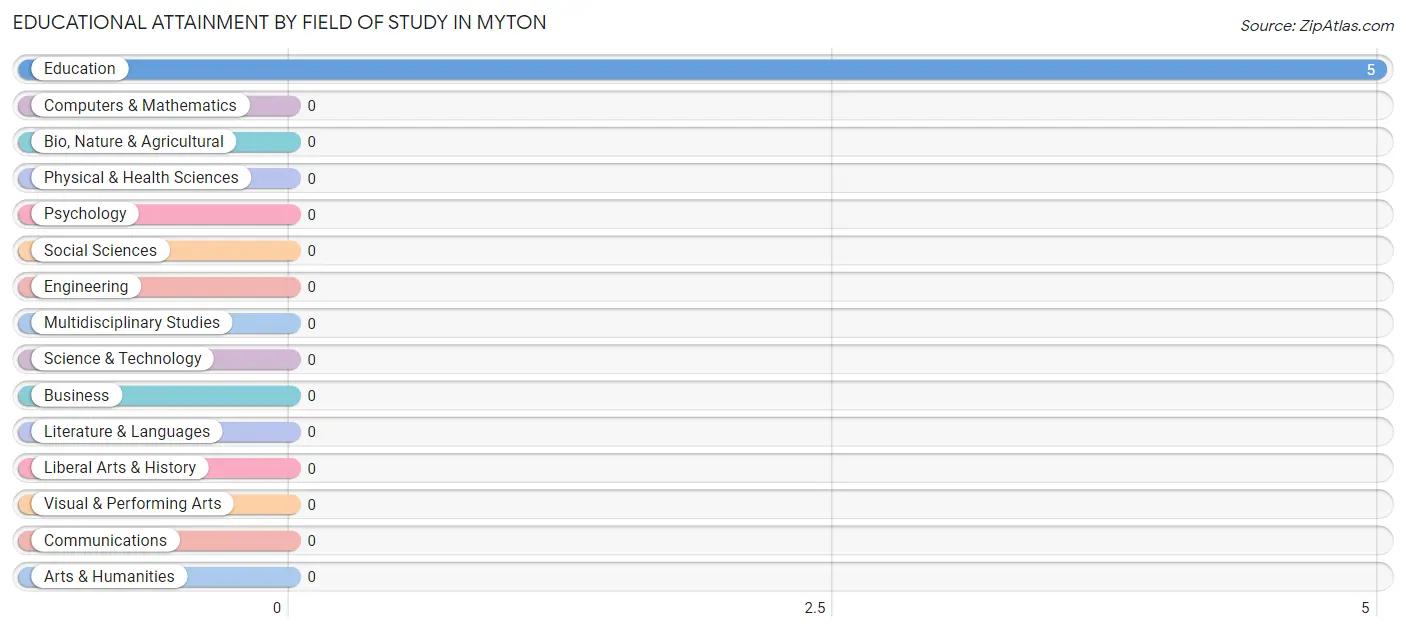
Educational Attainment by Field of Study in Myton
, and education (5 | 100.0%) are the most common fields of study among 5 individuals in Myton who have obtained a bachelor's degree or higher.
| Field of Study | # Graduates | % Graduates |
| Computers & Mathematics | 0 | 0.0% |
| Bio, Nature & Agricultural | 0 | 0.0% |
| Physical & Health Sciences | 0 | 0.0% |
| Psychology | 0 | 0.0% |
| Social Sciences | 0 | 0.0% |
| Engineering | 0 | 0.0% |
| Multidisciplinary Studies | 0 | 0.0% |
| Science & Technology | 0 | 0.0% |
| Business | 0 | 0.0% |
| Education | 5 | 100.0% |
| Literature & Languages | 0 | 0.0% |
| Liberal Arts & History | 0 | 0.0% |
| Visual & Performing Arts | 0 | 0.0% |
| Communications | 0 | 0.0% |
| Arts & Humanities | 0 | 0.0% |
| Total | 5 | 100.0% |
Transportation & Commute in Myton
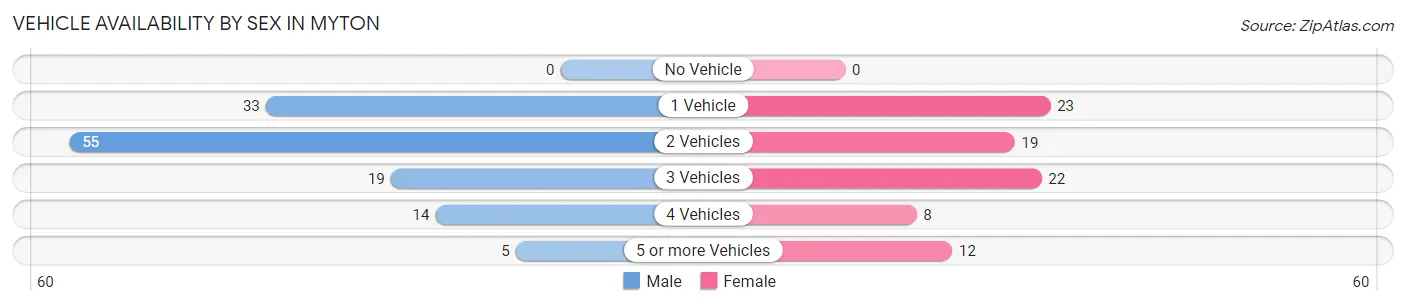
Vehicle Availability by Sex in Myton
The most prevalent vehicle ownership categories in Myton are males with 2 vehicles (55, accounting for 43.6%) and females with 2 vehicles (19, making up 65.5%).
| Vehicles Available | Male | Female |
| No Vehicle | 0 (0.0%) | 0 (0.0%) |
| 1 Vehicle | 33 (26.2%) | 23 (27.4%) |
| 2 Vehicles | 55 (43.6%) | 19 (22.6%) |
| 3 Vehicles | 19 (15.1%) | 22 (26.2%) |
| 4 Vehicles | 14 (11.1%) | 8 (9.5%) |
| 5 or more Vehicles | 5 (4.0%) | 12 (14.3%) |
| Total | 126 (100.0%) | 84 (100.0%) |
Commute Time in Myton
The most frequently occuring commute durations in Myton are 15 to 19 minutes (75 commuters, 36.2%), 10 to 14 minutes (47 commuters, 22.7%), and less than 5 minutes (24 commuters, 11.6%).
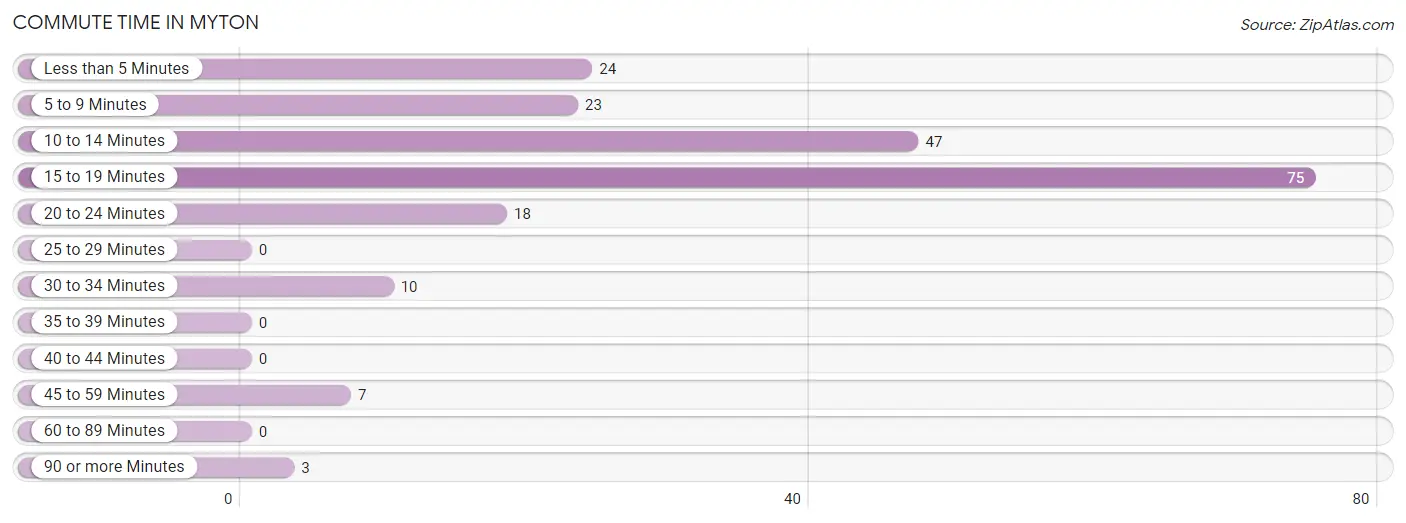
| Commute Time | # Commuters | % Commuters |
| Less than 5 Minutes | 24 | 11.6% |
| 5 to 9 Minutes | 23 | 11.1% |
| 10 to 14 Minutes | 47 | 22.7% |
| 15 to 19 Minutes | 75 | 36.2% |
| 20 to 24 Minutes | 18 | 8.7% |
| 25 to 29 Minutes | 0 | 0.0% |
| 30 to 34 Minutes | 10 | 4.8% |
| 35 to 39 Minutes | 0 | 0.0% |
| 40 to 44 Minutes | 0 | 0.0% |
| 45 to 59 Minutes | 7 | 3.4% |
| 60 to 89 Minutes | 0 | 0.0% |
| 90 or more Minutes | 3 | 1.5% |
Commute Time by Sex in Myton
The most common commute times in Myton are 15 to 19 minutes (43 commuters, 34.1%) for males and 15 to 19 minutes (32 commuters, 39.5%) for females.
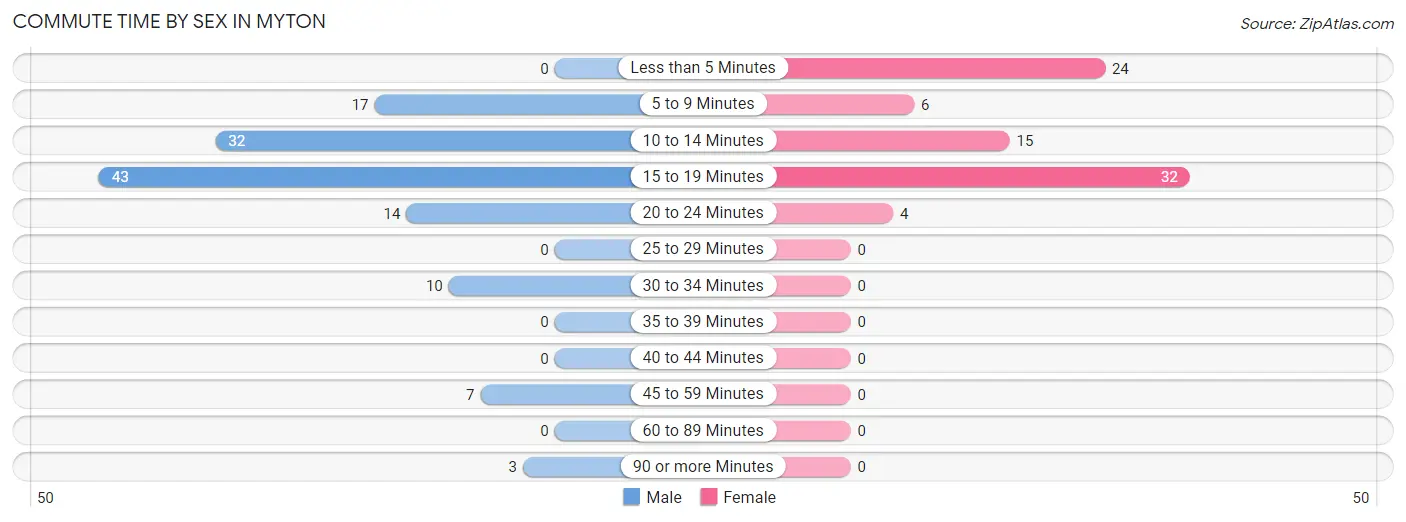
| Commute Time | Male | Female |
| Less than 5 Minutes | 0 (0.0%) | 24 (29.6%) |
| 5 to 9 Minutes | 17 (13.5%) | 6 (7.4%) |
| 10 to 14 Minutes | 32 (25.4%) | 15 (18.5%) |
| 15 to 19 Minutes | 43 (34.1%) | 32 (39.5%) |
| 20 to 24 Minutes | 14 (11.1%) | 4 (4.9%) |
| 25 to 29 Minutes | 0 (0.0%) | 0 (0.0%) |
| 30 to 34 Minutes | 10 (7.9%) | 0 (0.0%) |
| 35 to 39 Minutes | 0 (0.0%) | 0 (0.0%) |
| 40 to 44 Minutes | 0 (0.0%) | 0 (0.0%) |
| 45 to 59 Minutes | 7 (5.6%) | 0 (0.0%) |
| 60 to 89 Minutes | 0 (0.0%) | 0 (0.0%) |
| 90 or more Minutes | 3 (2.4%) | 0 (0.0%) |
Time of Departure to Work by Sex in Myton
The most frequent times of departure to work in Myton are 6:00 AM to 6:29 AM (26, 20.6%) for males and 12:00 PM to 3:59 PM (18, 22.2%) for females.
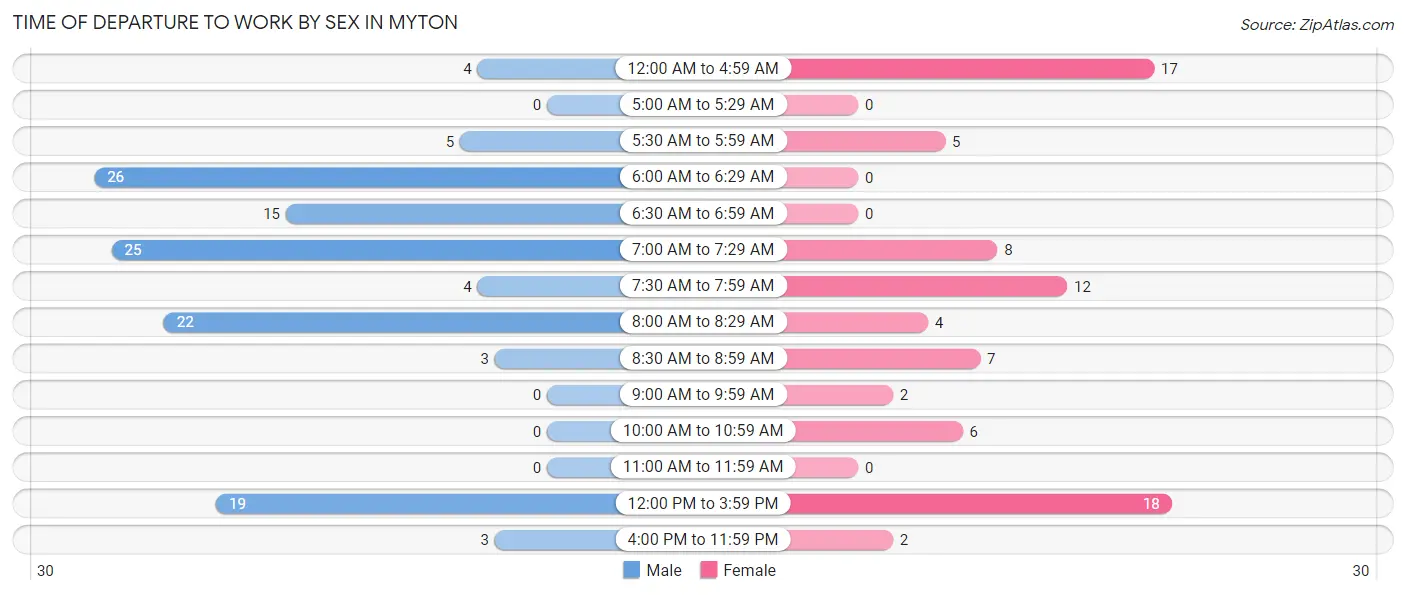
| Time of Departure | Male | Female |
| 12:00 AM to 4:59 AM | 4 (3.2%) | 17 (21.0%) |
| 5:00 AM to 5:29 AM | 0 (0.0%) | 0 (0.0%) |
| 5:30 AM to 5:59 AM | 5 (4.0%) | 5 (6.2%) |
| 6:00 AM to 6:29 AM | 26 (20.6%) | 0 (0.0%) |
| 6:30 AM to 6:59 AM | 15 (11.9%) | 0 (0.0%) |
| 7:00 AM to 7:29 AM | 25 (19.8%) | 8 (9.9%) |
| 7:30 AM to 7:59 AM | 4 (3.2%) | 12 (14.8%) |
| 8:00 AM to 8:29 AM | 22 (17.5%) | 4 (4.9%) |
| 8:30 AM to 8:59 AM | 3 (2.4%) | 7 (8.6%) |
| 9:00 AM to 9:59 AM | 0 (0.0%) | 2 (2.5%) |
| 10:00 AM to 10:59 AM | 0 (0.0%) | 6 (7.4%) |
| 11:00 AM to 11:59 AM | 0 (0.0%) | 0 (0.0%) |
| 12:00 PM to 3:59 PM | 19 (15.1%) | 18 (22.2%) |
| 4:00 PM to 11:59 PM | 3 (2.4%) | 2 (2.5%) |
| Total | 126 (100.0%) | 81 (100.0%) |
Housing Occupancy in Myton
Occupancy by Ownership in Myton
Of the total 211 dwellings in Myton, owner-occupied units account for 149 (70.6%), while renter-occupied units make up 62 (29.4%).
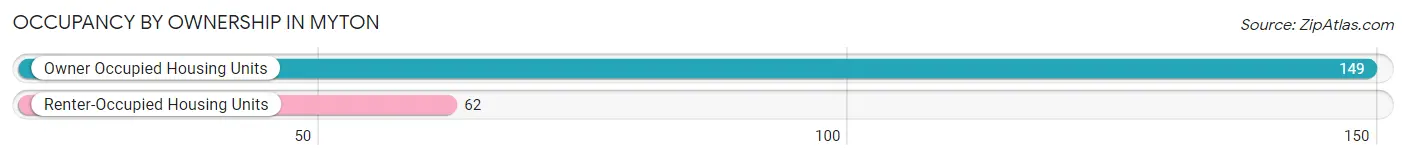
| Occupancy | # Housing Units | % Housing Units |
| Owner Occupied Housing Units | 149 | 70.6% |
| Renter-Occupied Housing Units | 62 | 29.4% |
| Total Occupied Housing Units | 211 | 100.0% |
Occupancy by Household Size in Myton
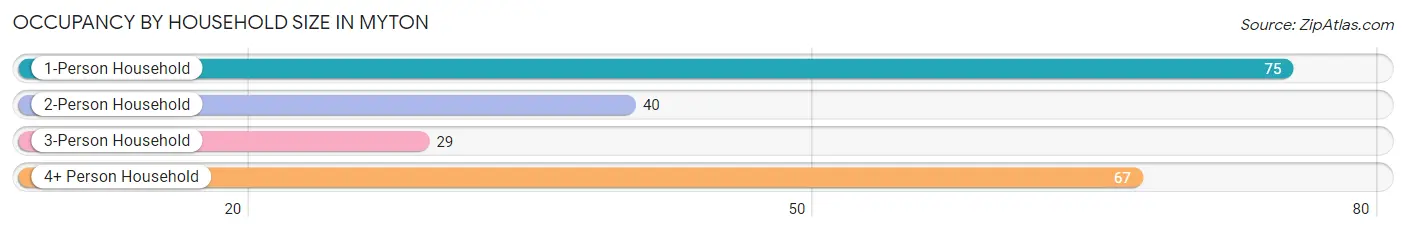
| Household Size | # Housing Units | % Housing Units |
| 1-Person Household | 75 | 35.5% |
| 2-Person Household | 40 | 19.0% |
| 3-Person Household | 29 | 13.7% |
| 4+ Person Household | 67 | 31.8% |
| Total Housing Units | 211 | 100.0% |
Occupancy by Ownership by Household Size in Myton
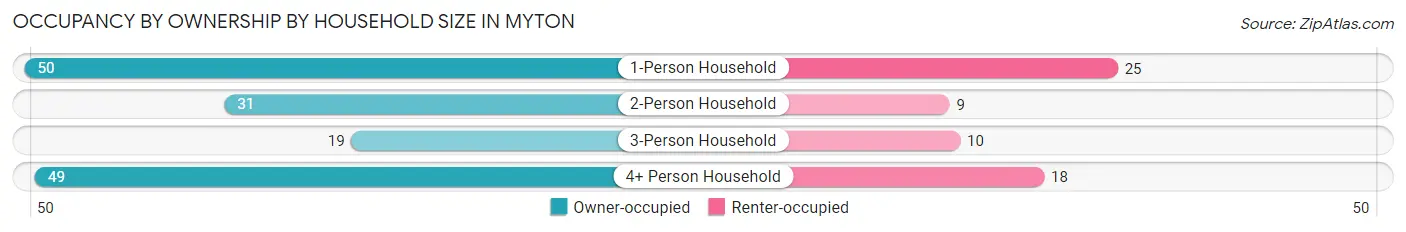
| Household Size | Owner-occupied | Renter-occupied |
| 1-Person Household | 50 (66.7%) | 25 (33.3%) |
| 2-Person Household | 31 (77.5%) | 9 (22.5%) |
| 3-Person Household | 19 (65.5%) | 10 (34.5%) |
| 4+ Person Household | 49 (73.1%) | 18 (26.9%) |
| Total Housing Units | 149 (70.6%) | 62 (29.4%) |
Occupancy by Educational Attainment in Myton
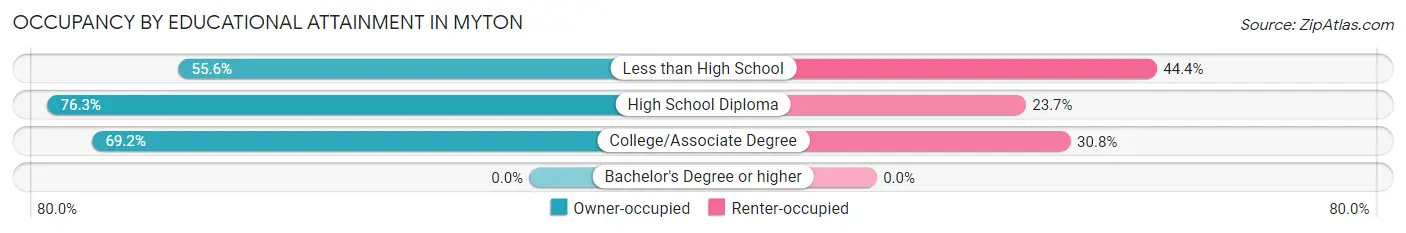
| Household Size | Owner-occupied | Renter-occupied |
| Less than High School | 15 (55.6%) | 12 (44.4%) |
| High School Diploma | 71 (76.3%) | 22 (23.7%) |
| College/Associate Degree | 63 (69.2%) | 28 (30.8%) |
| Bachelor's Degree or higher | 0 (0.0%) | 0 (0.0%) |
Occupancy by Age of Householder in Myton
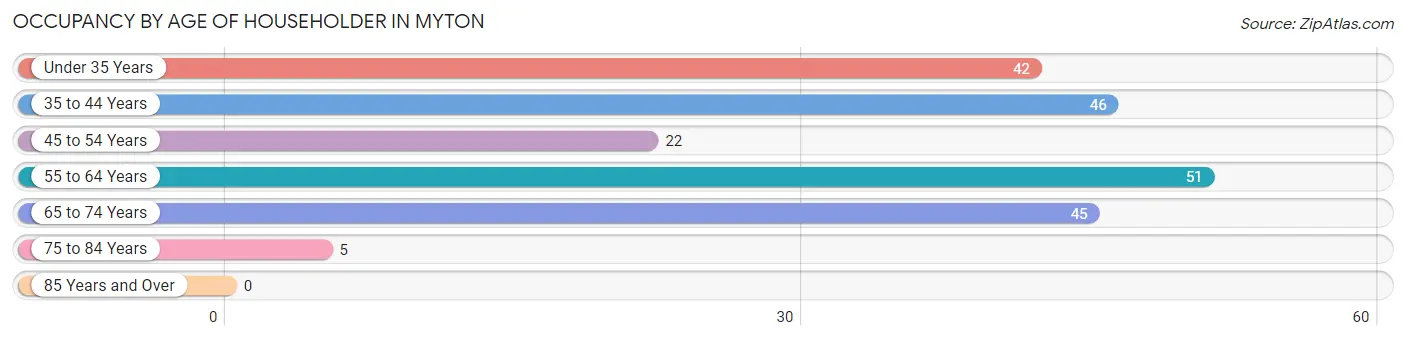
| Age Bracket | # Households | % Households |
| Under 35 Years | 42 | 19.9% |
| 35 to 44 Years | 46 | 21.8% |
| 45 to 54 Years | 22 | 10.4% |
| 55 to 64 Years | 51 | 24.2% |
| 65 to 74 Years | 45 | 21.3% |
| 75 to 84 Years | 5 | 2.4% |
| 85 Years and Over | 0 | 0.0% |
| Total | 211 | 100.0% |
Housing Finances in Myton
Median Income by Occupancy in Myton
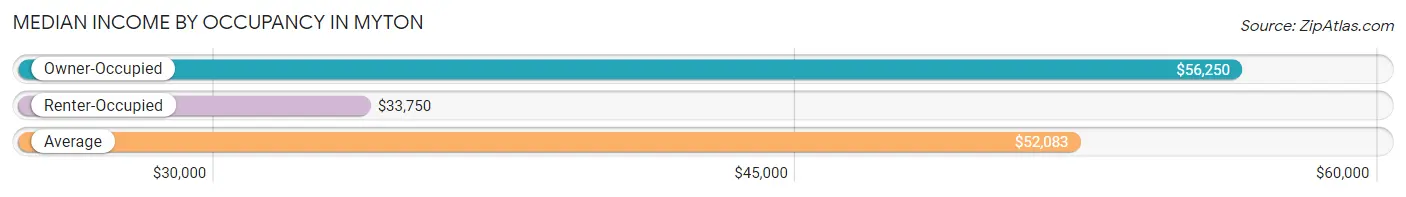
| Occupancy Type | # Households | Median Income |
| Owner-Occupied | 149 (70.6%) | $56,250 |
| Renter-Occupied | 62 (29.4%) | $33,750 |
| Average | 211 (100.0%) | $52,083 |
Occupancy by Householder Income Bracket in Myton
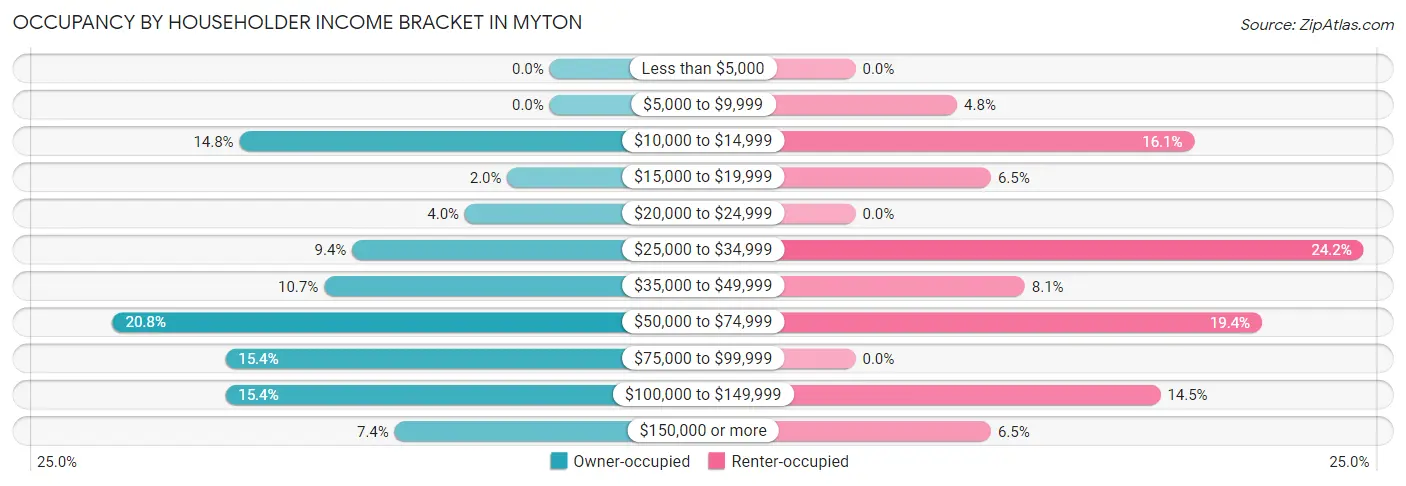
| Income Bracket | Owner-occupied | Renter-occupied |
| Less than $5,000 | 0 (0.0%) | 0 (0.0%) |
| $5,000 to $9,999 | 0 (0.0%) | 3 (4.8%) |
| $10,000 to $14,999 | 22 (14.8%) | 10 (16.1%) |
| $15,000 to $19,999 | 3 (2.0%) | 4 (6.5%) |
| $20,000 to $24,999 | 6 (4.0%) | 0 (0.0%) |
| $25,000 to $34,999 | 14 (9.4%) | 15 (24.2%) |
| $35,000 to $49,999 | 16 (10.7%) | 5 (8.1%) |
| $50,000 to $74,999 | 31 (20.8%) | 12 (19.4%) |
| $75,000 to $99,999 | 23 (15.4%) | 0 (0.0%) |
| $100,000 to $149,999 | 23 (15.4%) | 9 (14.5%) |
| $150,000 or more | 11 (7.4%) | 4 (6.5%) |
| Total | 149 (100.0%) | 62 (100.0%) |
Monthly Housing Cost Tiers in Myton
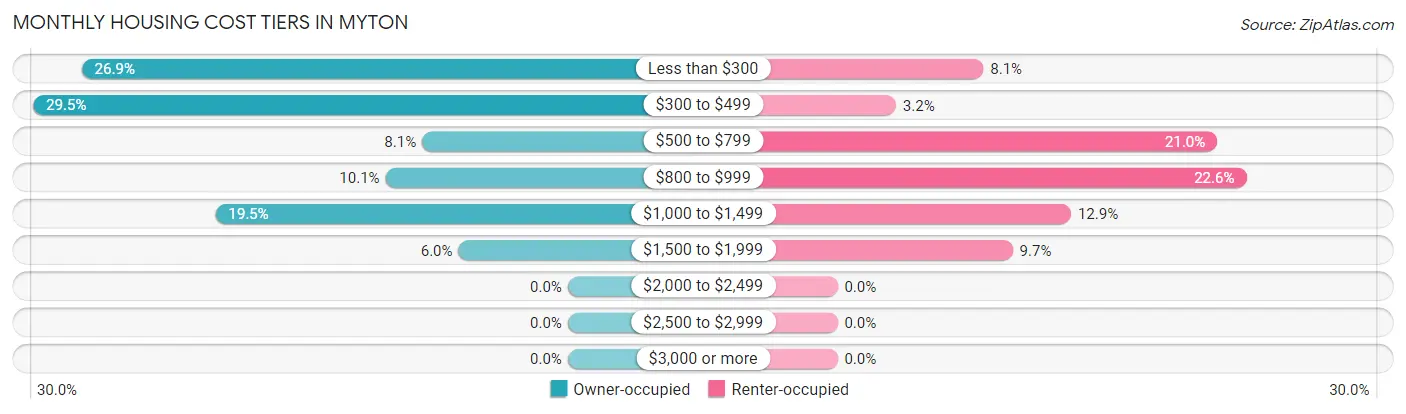
| Monthly Cost | Owner-occupied | Renter-occupied |
| Less than $300 | 40 (26.9%) | 5 (8.1%) |
| $300 to $499 | 44 (29.5%) | 2 (3.2%) |
| $500 to $799 | 12 (8.1%) | 13 (21.0%) |
| $800 to $999 | 15 (10.1%) | 14 (22.6%) |
| $1,000 to $1,499 | 29 (19.5%) | 8 (12.9%) |
| $1,500 to $1,999 | 9 (6.0%) | 6 (9.7%) |
| $2,000 to $2,499 | 0 (0.0%) | 0 (0.0%) |
| $2,500 to $2,999 | 0 (0.0%) | 0 (0.0%) |
| $3,000 or more | 0 (0.0%) | 0 (0.0%) |
| Total | 149 (100.0%) | 62 (100.0%) |
Physical Housing Characteristics in Myton
Housing Structures in Myton
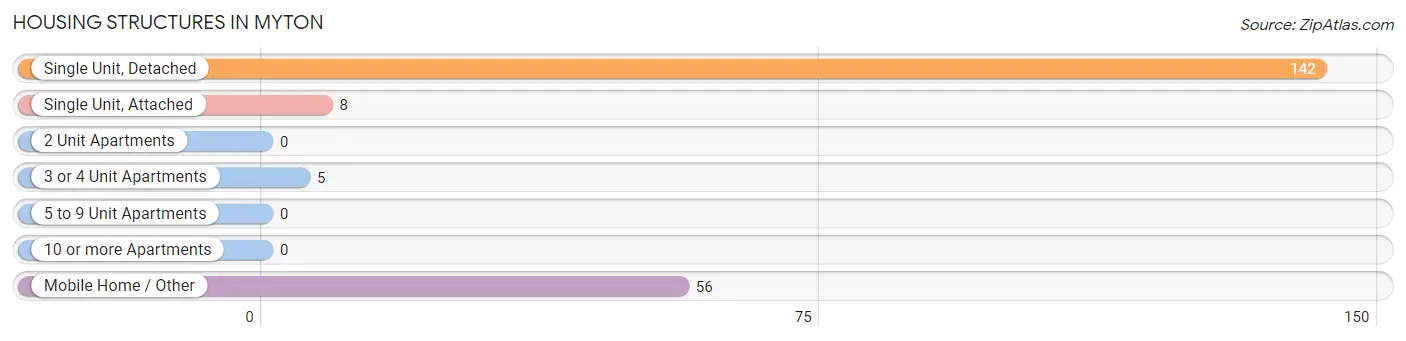
| Structure Type | # Housing Units | % Housing Units |
| Single Unit, Detached | 142 | 67.3% |
| Single Unit, Attached | 8 | 3.8% |
| 2 Unit Apartments | 0 | 0.0% |
| 3 or 4 Unit Apartments | 5 | 2.4% |
| 5 to 9 Unit Apartments | 0 | 0.0% |
| 10 or more Apartments | 0 | 0.0% |
| Mobile Home / Other | 56 | 26.5% |
| Total | 211 | 100.0% |
Housing Structures by Occupancy in Myton
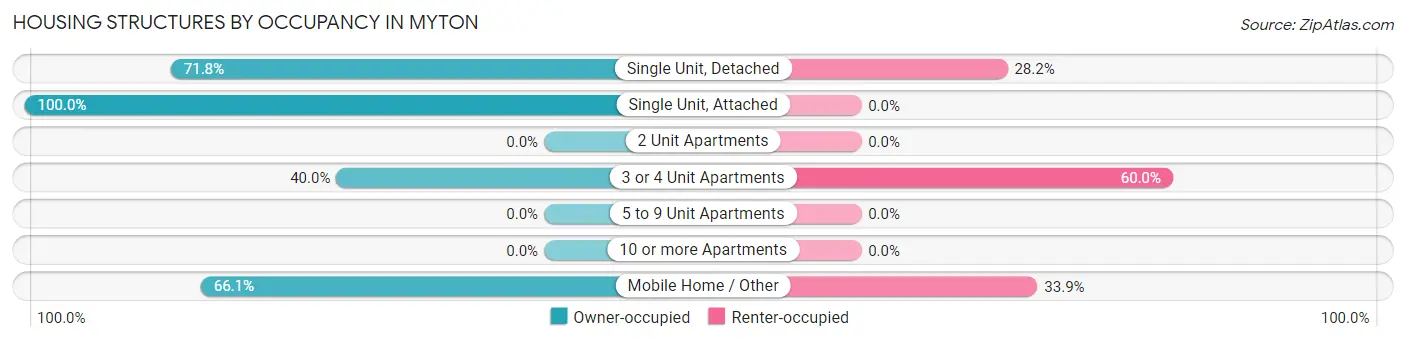
| Structure Type | Owner-occupied | Renter-occupied |
| Single Unit, Detached | 102 (71.8%) | 40 (28.2%) |
| Single Unit, Attached | 8 (100.0%) | 0 (0.0%) |
| 2 Unit Apartments | 0 (0.0%) | 0 (0.0%) |
| 3 or 4 Unit Apartments | 2 (40.0%) | 3 (60.0%) |
| 5 to 9 Unit Apartments | 0 (0.0%) | 0 (0.0%) |
| 10 or more Apartments | 0 (0.0%) | 0 (0.0%) |
| Mobile Home / Other | 37 (66.1%) | 19 (33.9%) |
| Total | 149 (70.6%) | 62 (29.4%) |
Housing Structures by Number of Rooms in Myton
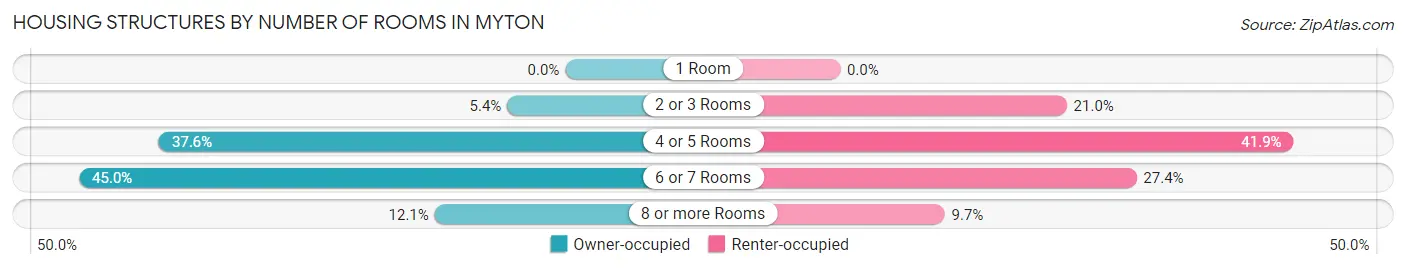
| Number of Rooms | Owner-occupied | Renter-occupied |
| 1 Room | 0 (0.0%) | 0 (0.0%) |
| 2 or 3 Rooms | 8 (5.4%) | 13 (21.0%) |
| 4 or 5 Rooms | 56 (37.6%) | 26 (41.9%) |
| 6 or 7 Rooms | 67 (45.0%) | 17 (27.4%) |
| 8 or more Rooms | 18 (12.1%) | 6 (9.7%) |
| Total | 149 (100.0%) | 62 (100.0%) |
Housing Structure by Heating Type in Myton
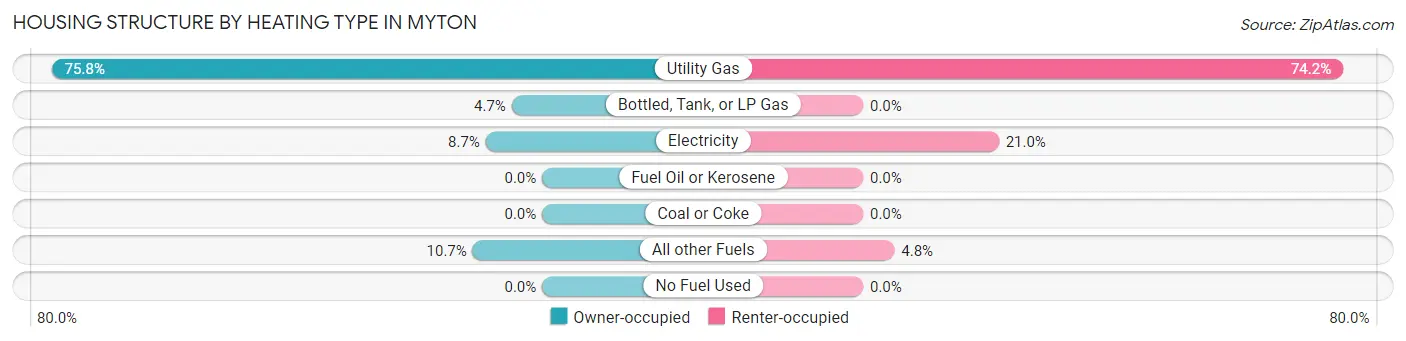
| Heating Type | Owner-occupied | Renter-occupied |
| Utility Gas | 113 (75.8%) | 46 (74.2%) |
| Bottled, Tank, or LP Gas | 7 (4.7%) | 0 (0.0%) |
| Electricity | 13 (8.7%) | 13 (21.0%) |
| Fuel Oil or Kerosene | 0 (0.0%) | 0 (0.0%) |
| Coal or Coke | 0 (0.0%) | 0 (0.0%) |
| All other Fuels | 16 (10.7%) | 3 (4.8%) |
| No Fuel Used | 0 (0.0%) | 0 (0.0%) |
| Total | 149 (100.0%) | 62 (100.0%) |
Household Vehicle Usage in Myton
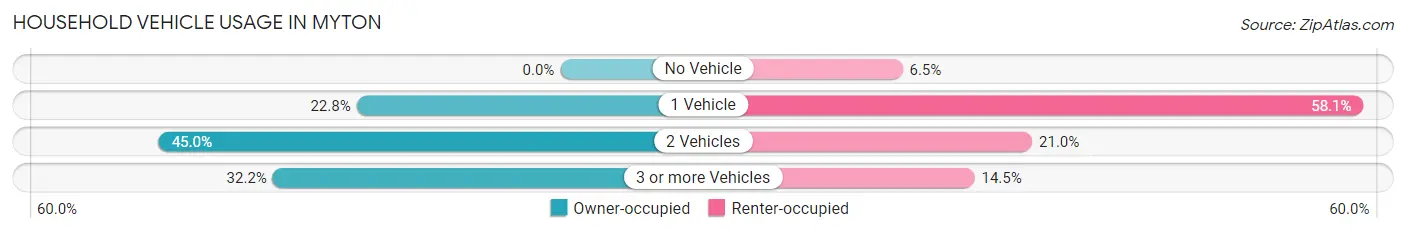
| Vehicles per Household | Owner-occupied | Renter-occupied |
| No Vehicle | 0 (0.0%) | 4 (6.5%) |
| 1 Vehicle | 34 (22.8%) | 36 (58.1%) |
| 2 Vehicles | 67 (45.0%) | 13 (21.0%) |
| 3 or more Vehicles | 48 (32.2%) | 9 (14.5%) |
| Total | 149 (100.0%) | 62 (100.0%) |
Real Estate & Mortgages in Myton
Real Estate and Mortgage Overview in Myton
| Characteristic | Without Mortgage | With Mortgage |
| Housing Units | 91 | 58 |
| Median Property Value | $120,200 | $163,600 |
| Median Household Income | $63,750 | $3 |
| Monthly Housing Costs | $312 | $0 |
| Real Estate Taxes | $658 | $0 |
Property Value by Mortgage Status in Myton
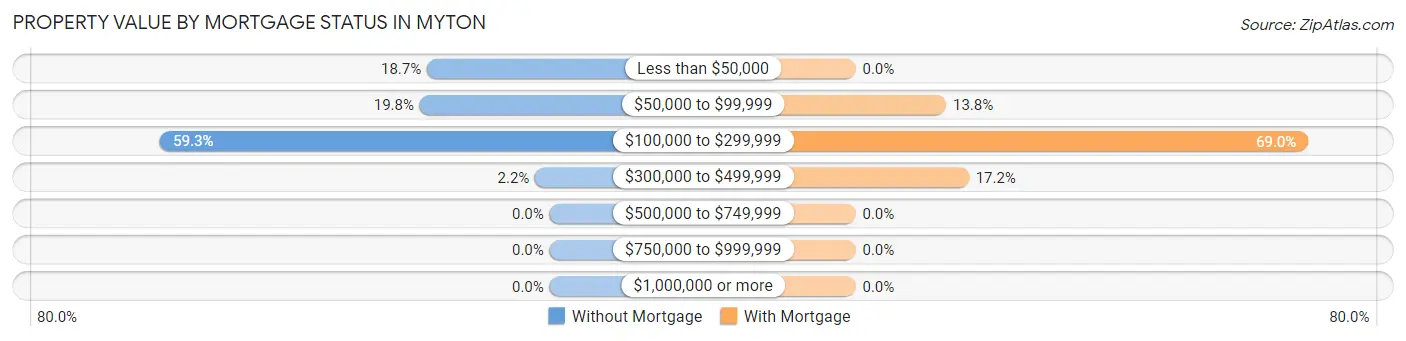
| Property Value | Without Mortgage | With Mortgage |
| Less than $50,000 | 17 (18.7%) | 0 (0.0%) |
| $50,000 to $99,999 | 18 (19.8%) | 8 (13.8%) |
| $100,000 to $299,999 | 54 (59.3%) | 40 (69.0%) |
| $300,000 to $499,999 | 2 (2.2%) | 10 (17.2%) |
| $500,000 to $749,999 | 0 (0.0%) | 0 (0.0%) |
| $750,000 to $999,999 | 0 (0.0%) | 0 (0.0%) |
| $1,000,000 or more | 0 (0.0%) | 0 (0.0%) |
| Total | 91 (100.0%) | 58 (100.0%) |
Household Income by Mortgage Status in Myton
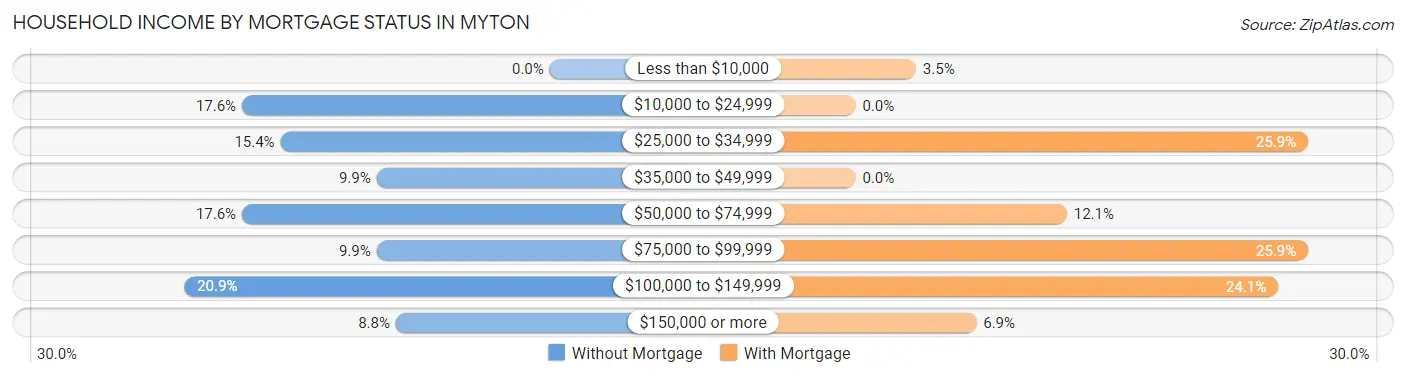
| Household Income | Without Mortgage | With Mortgage |
| Less than $10,000 | 0 (0.0%) | 2 (3.5%) |
| $10,000 to $24,999 | 16 (17.6%) | 0 (0.0%) |
| $25,000 to $34,999 | 14 (15.4%) | 15 (25.9%) |
| $35,000 to $49,999 | 9 (9.9%) | 0 (0.0%) |
| $50,000 to $74,999 | 16 (17.6%) | 7 (12.1%) |
| $75,000 to $99,999 | 9 (9.9%) | 15 (25.9%) |
| $100,000 to $149,999 | 19 (20.9%) | 14 (24.1%) |
| $150,000 or more | 8 (8.8%) | 4 (6.9%) |
| Total | 91 (100.0%) | 58 (100.0%) |
Property Value to Household Income Ratio in Myton
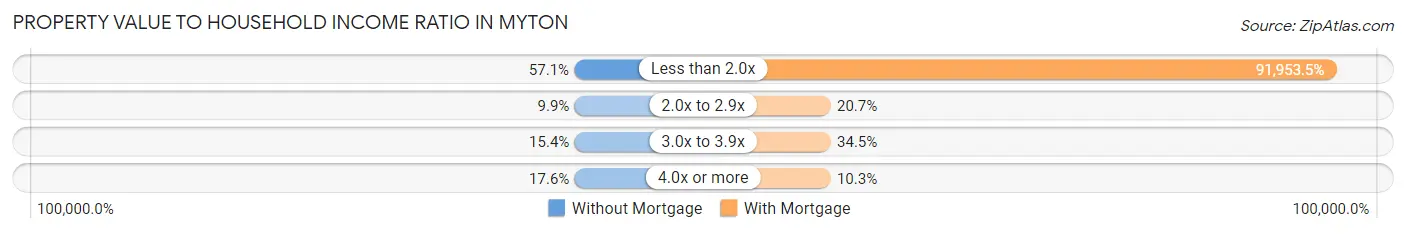
| Value-to-Income Ratio | Without Mortgage | With Mortgage |
| Less than 2.0x | 52 (57.1%) | 53,333 (91,953.4%) |
| 2.0x to 2.9x | 9 (9.9%) | 12 (20.7%) |
| 3.0x to 3.9x | 14 (15.4%) | 20 (34.5%) |
| 4.0x or more | 16 (17.6%) | 6 (10.3%) |
| Total | 91 (100.0%) | 58 (100.0%) |
Real Estate Taxes by Mortgage Status in Myton
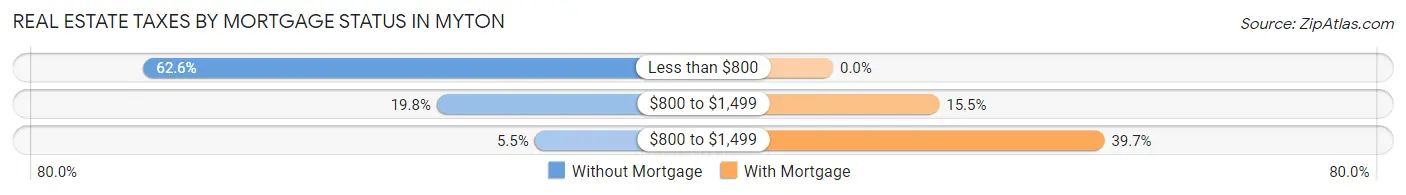
| Property Taxes | Without Mortgage | With Mortgage |
| Less than $800 | 57 (62.6%) | 0 (0.0%) |
| $800 to $1,499 | 18 (19.8%) | 9 (15.5%) |
| $800 to $1,499 | 5 (5.5%) | 23 (39.7%) |
| Total | 91 (100.0%) | 58 (100.0%) |
Health & Disability in Myton
Health Insurance Coverage by Age in Myton
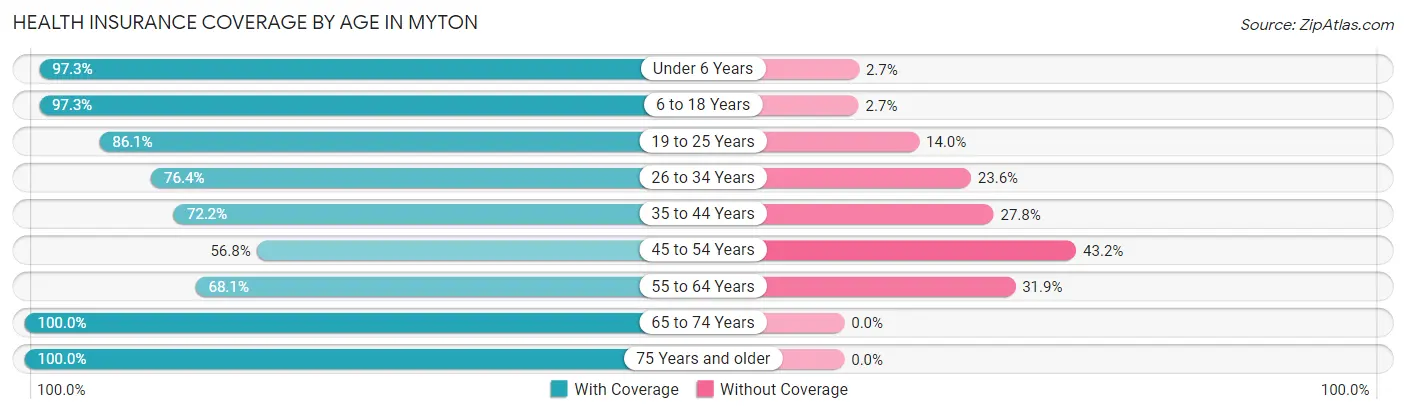
| Age Bracket | With Coverage | Without Coverage |
| Under 6 Years | 71 (97.3%) | 2 (2.7%) |
| 6 to 18 Years | 109 (97.3%) | 3 (2.7%) |
| 19 to 25 Years | 37 (86.1%) | 6 (14.0%) |
| 26 to 34 Years | 55 (76.4%) | 17 (23.6%) |
| 35 to 44 Years | 70 (72.2%) | 27 (27.8%) |
| 45 to 54 Years | 42 (56.8%) | 32 (43.2%) |
| 55 to 64 Years | 47 (68.1%) | 22 (31.9%) |
| 65 to 74 Years | 69 (100.0%) | 0 (0.0%) |
| 75 Years and older | 7 (100.0%) | 0 (0.0%) |
| Total | 507 (82.3%) | 109 (17.7%) |
Health Insurance Coverage by Citizenship Status in Myton
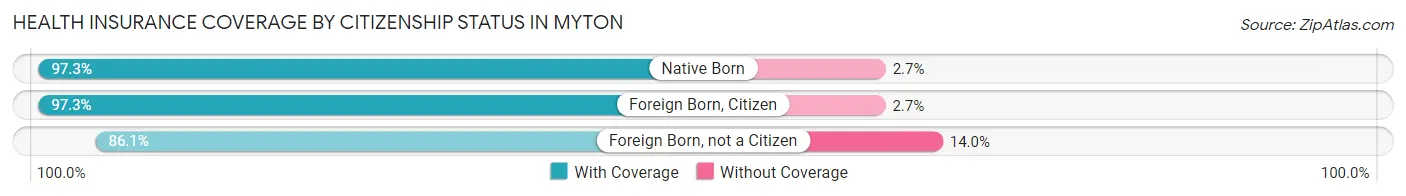
| Citizenship Status | With Coverage | Without Coverage |
| Native Born | 71 (97.3%) | 2 (2.7%) |
| Foreign Born, Citizen | 109 (97.3%) | 3 (2.7%) |
| Foreign Born, not a Citizen | 37 (86.1%) | 6 (14.0%) |
Health Insurance Coverage by Household Income in Myton
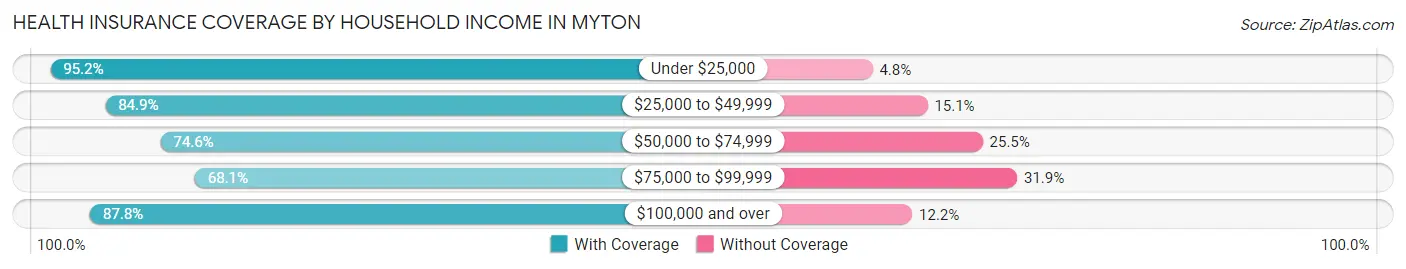
| Household Income | With Coverage | Without Coverage |
| Under $25,000 | 99 (95.2%) | 5 (4.8%) |
| $25,000 to $49,999 | 118 (84.9%) | 21 (15.1%) |
| $50,000 to $74,999 | 82 (74.6%) | 28 (25.5%) |
| $75,000 to $99,999 | 79 (68.1%) | 37 (31.9%) |
| $100,000 and over | 129 (87.8%) | 18 (12.2%) |
Public vs Private Health Insurance Coverage by Age in Myton
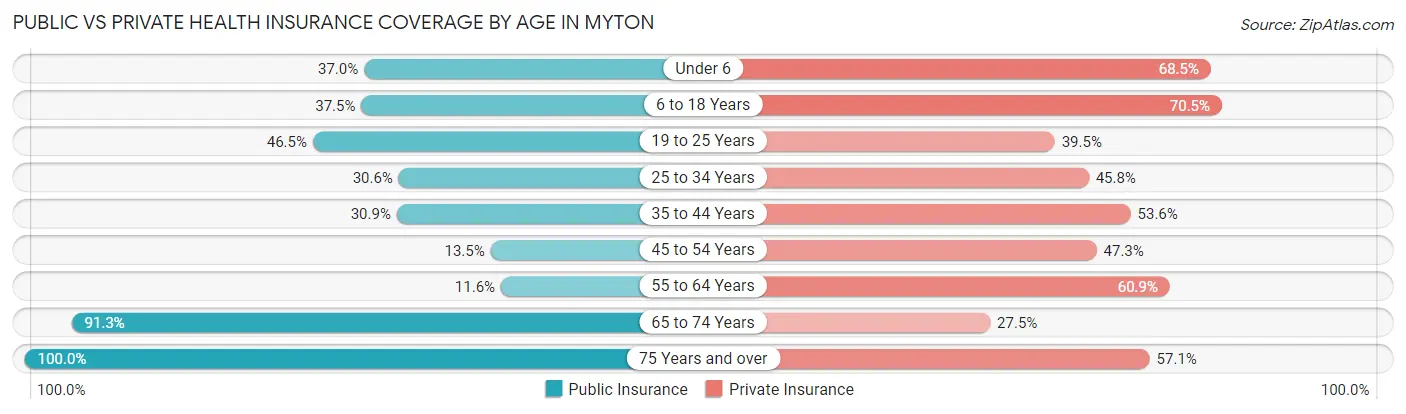
| Age Bracket | Public Insurance | Private Insurance |
| Under 6 | 27 (37.0%) | 50 (68.5%) |
| 6 to 18 Years | 42 (37.5%) | 79 (70.5%) |
| 19 to 25 Years | 20 (46.5%) | 17 (39.5%) |
| 25 to 34 Years | 22 (30.6%) | 33 (45.8%) |
| 35 to 44 Years | 30 (30.9%) | 52 (53.6%) |
| 45 to 54 Years | 10 (13.5%) | 35 (47.3%) |
| 55 to 64 Years | 8 (11.6%) | 42 (60.9%) |
| 65 to 74 Years | 63 (91.3%) | 19 (27.5%) |
| 75 Years and over | 7 (100.0%) | 4 (57.1%) |
| Total | 229 (37.2%) | 331 (53.7%) |
Disability Status by Sex by Age in Myton
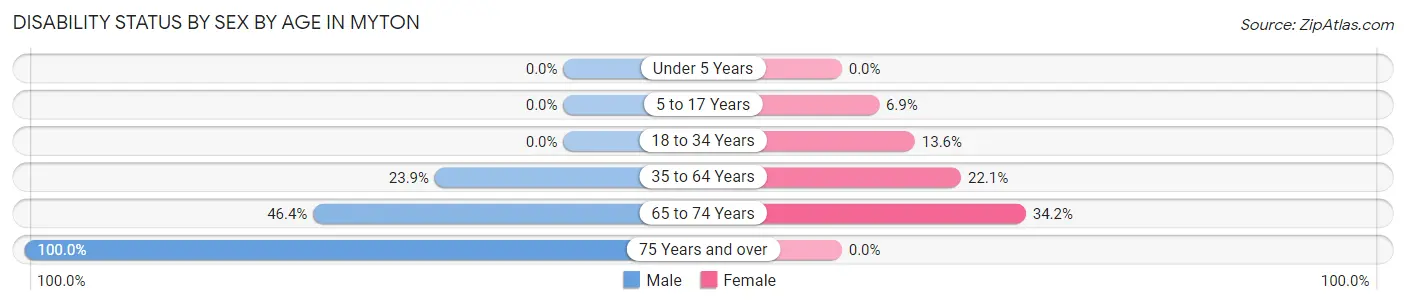
| Age Bracket | Male | Female |
| Under 5 Years | 0 (0.0%) | 0 (0.0%) |
| 5 to 17 Years | 0 (0.0%) | 4 (6.9%) |
| 18 to 34 Years | 0 (0.0%) | 8 (13.6%) |
| 35 to 64 Years | 26 (23.8%) | 29 (22.1%) |
| 65 to 74 Years | 13 (46.4%) | 14 (34.2%) |
| 75 Years and over | 5 (100.0%) | 0 (0.0%) |
Disability Class by Sex by Age in Myton
Disability Class: Hearing Difficulty
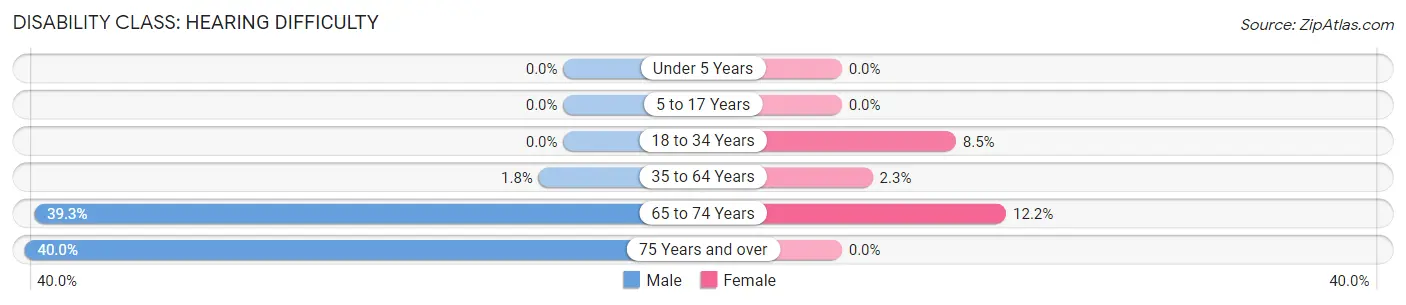
| Age Bracket | Male | Female |
| Under 5 Years | 0 (0.0%) | 0 (0.0%) |
| 5 to 17 Years | 0 (0.0%) | 0 (0.0%) |
| 18 to 34 Years | 0 (0.0%) | 5 (8.5%) |
| 35 to 64 Years | 2 (1.8%) | 3 (2.3%) |
| 65 to 74 Years | 11 (39.3%) | 5 (12.2%) |
| 75 Years and over | 2 (40.0%) | 0 (0.0%) |
Disability Class: Vision Difficulty
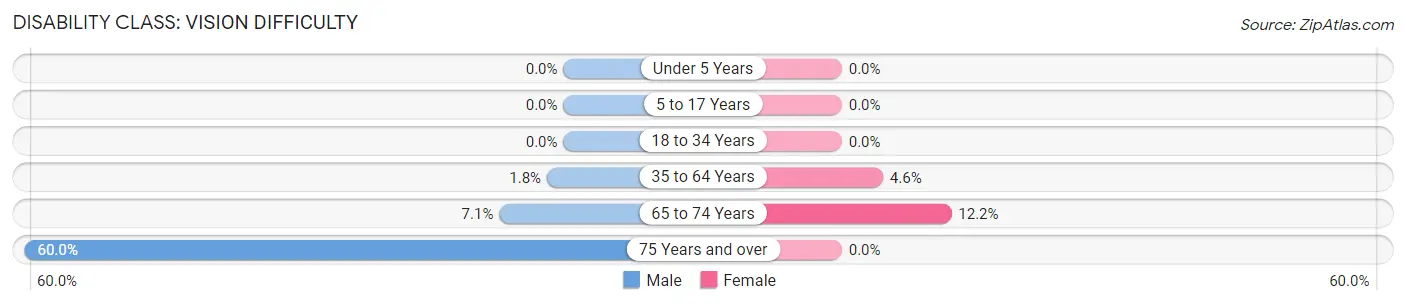
| Age Bracket | Male | Female |
| Under 5 Years | 0 (0.0%) | 0 (0.0%) |
| 5 to 17 Years | 0 (0.0%) | 0 (0.0%) |
| 18 to 34 Years | 0 (0.0%) | 0 (0.0%) |
| 35 to 64 Years | 2 (1.8%) | 6 (4.6%) |
| 65 to 74 Years | 2 (7.1%) | 5 (12.2%) |
| 75 Years and over | 3 (60.0%) | 0 (0.0%) |
Disability Class: Cognitive Difficulty
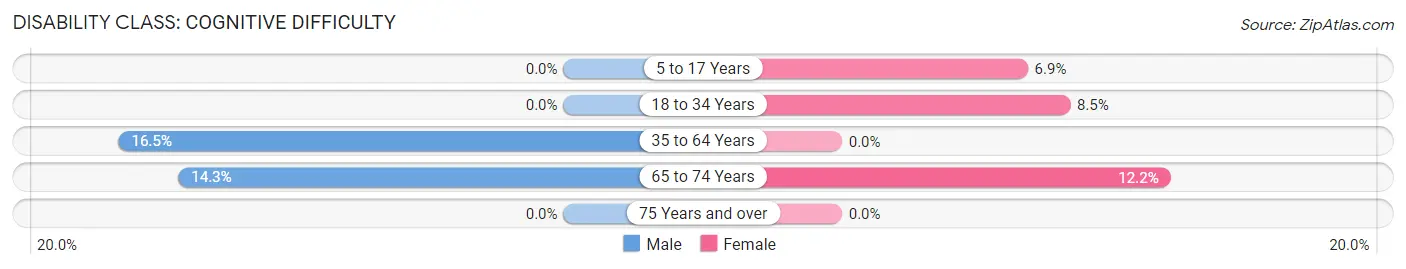
| Age Bracket | Male | Female |
| 5 to 17 Years | 0 (0.0%) | 4 (6.9%) |
| 18 to 34 Years | 0 (0.0%) | 5 (8.5%) |
| 35 to 64 Years | 18 (16.5%) | 0 (0.0%) |
| 65 to 74 Years | 4 (14.3%) | 5 (12.2%) |
| 75 Years and over | 0 (0.0%) | 0 (0.0%) |
Disability Class: Ambulatory Difficulty
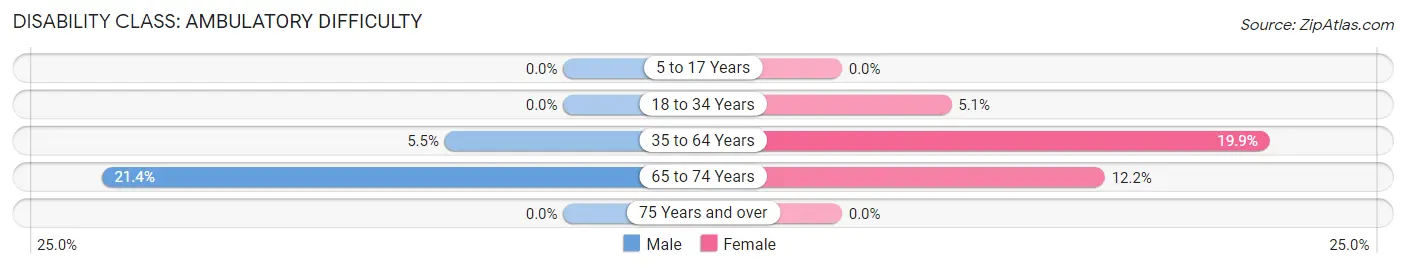
| Age Bracket | Male | Female |
| 5 to 17 Years | 0 (0.0%) | 0 (0.0%) |
| 18 to 34 Years | 0 (0.0%) | 3 (5.1%) |
| 35 to 64 Years | 6 (5.5%) | 26 (19.9%) |
| 65 to 74 Years | 6 (21.4%) | 5 (12.2%) |
| 75 Years and over | 0 (0.0%) | 0 (0.0%) |
Disability Class: Self-Care Difficulty
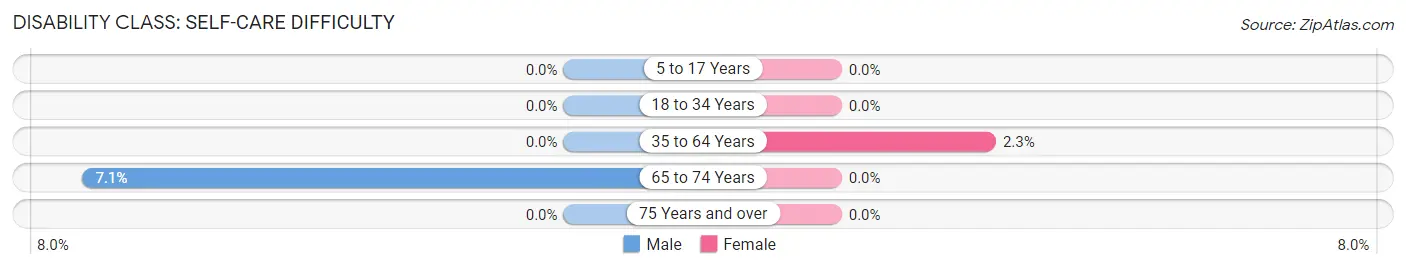
| Age Bracket | Male | Female |
| 5 to 17 Years | 0 (0.0%) | 0 (0.0%) |
| 18 to 34 Years | 0 (0.0%) | 0 (0.0%) |
| 35 to 64 Years | 0 (0.0%) | 3 (2.3%) |
| 65 to 74 Years | 2 (7.1%) | 0 (0.0%) |
| 75 Years and over | 0 (0.0%) | 0 (0.0%) |
Technology Access in Myton
Computing Device Access in Myton
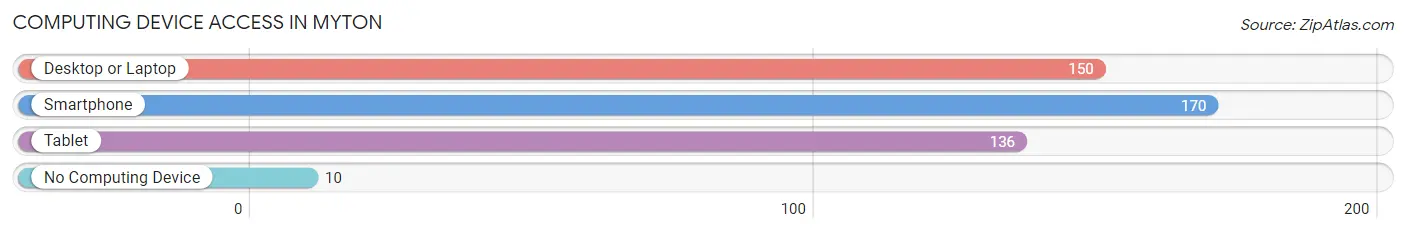
| Device Type | # Households | % Households |
| Desktop or Laptop | 150 | 71.1% |
| Smartphone | 170 | 80.6% |
| Tablet | 136 | 64.4% |
| No Computing Device | 10 | 4.7% |
| Total | 211 | 100.0% |
Internet Access in Myton
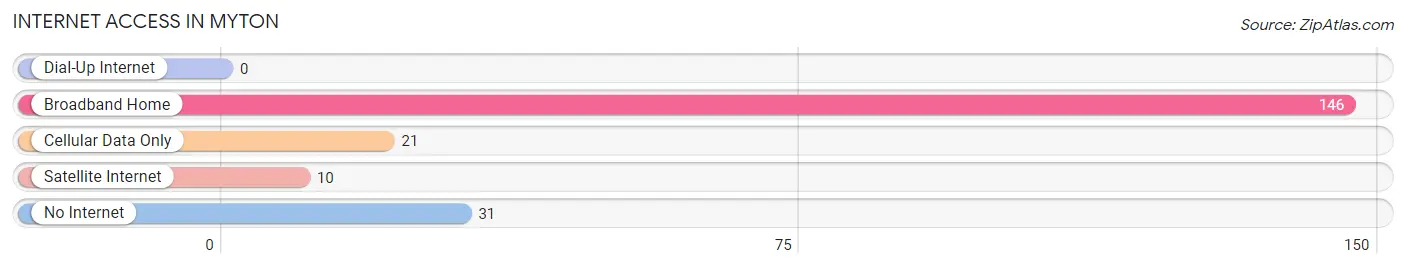
| Internet Type | # Households | % Households |
| Dial-Up Internet | 0 | 0.0% |
| Broadband Home | 146 | 69.2% |
| Cellular Data Only | 21 | 10.0% |
| Satellite Internet | 10 | 4.7% |
| No Internet | 31 | 14.7% |
| Total | 211 | 100.0% |
Myton Summary
Myton, Utah is a small town located in Duchesne County, Utah. It is situated in the Uintah Basin, a large basin in the eastern part of the state. The town is located on the banks of the Duchesne River, and is surrounded by the Uinta Mountains. The population of Myton was 1,845 in the 2010 census.
History
Myton was first settled in 1876 by a group of Mormon pioneers led by John Myton. The town was originally called Mytonville, but the name was changed to Myton in 1883. The town was incorporated in 1891.
Myton was an important stop on the Union Pacific Railroad, which ran through the town from 1883 to 1941. The railroad brought many new settlers to the area, and the town grew rapidly. By the early 1900s, Myton had become a thriving agricultural and commercial center.
Geography
Myton is located in the Uintah Basin, a large basin in the eastern part of Utah. The town is situated on the banks of the Duchesne River, and is surrounded by the Uinta Mountains. The town is located at an elevation of 4,890 feet.
The climate in Myton is semi-arid, with hot summers and cold winters. The average annual temperature is 48°F, and the average annual precipitation is 11.5 inches.
Economy
Myton’s economy is largely based on agriculture and tourism. The town is home to several farms and ranches, which produce hay, wheat, corn, and other crops. The town is also a popular destination for outdoor recreation, and is home to several campgrounds, fishing spots, and hiking trails.
The town is also home to several businesses, including a grocery store, a hardware store, and a restaurant. The town is served by the Myton Post Office, and is home to a branch of the Duchesne County Library.
Demographics
As of the 2010 census, the population of Myton was 1,845. The racial makeup of the town was 94.3% White, 0.3% African American, 0.7% Native American, 0.2% Asian, 0.1% Pacific Islander, 2.2% from other races, and 2.4% from two or more races. Hispanic or Latino of any race were 4.7% of the population.
The median income for a household in Myton was $37,500, and the median income for a family was $41,250. The per capita income for the town was $17,845. About 11.2% of families and 13.2% of the population were below the poverty line, including 16.2% of those under age 18 and 8.3% of those age 65 or over.
Common Questions
What is Per Capita Income in Myton?
Per Capita income in Myton is $23,158.
What is the Median Family Income in Myton?
Median Family Income in Myton is $51,528.
What is the Median Household income in Myton?
Median Household Income in Myton is $52,083.
What is Income or Wage Gap in Myton?
Income or Wage Gap in Myton is 69.6%.
Women in Myton earn 30.4 cents for every dollar earned by a man.
What is Inequality or Gini Index in Myton?
Inequality or Gini Index in Myton is 0.41.
What is the Total Population of Myton?
Total Population of Myton is 616.
What is the Total Male Population of Myton?
Total Male Population of Myton is 293.
What is the Total Female Population of Myton?
Total Female Population of Myton is 323.
What is the Ratio of Males per 100 Females in Myton?
There are 90.71 Males per 100 Females in Myton.
What is the Ratio of Females per 100 Males in Myton?
There are 110.24 Females per 100 Males in Myton.
What is the Median Population Age in Myton?
Median Population Age in Myton is 36.3 Years.
What is the Average Family Size in Myton
Average Family Size in Myton is 3.8 People.
What is the Average Household Size in Myton
Average Household Size in Myton is 2.9 People.
How Large is the Labor Force in Myton?
There are 242 People in the Labor Forcein in Myton.
What is the Percentage of People in the Labor Force in Myton?
54.0% of People are in the Labor Force in Myton.
What is the Unemployment Rate in Myton?
Unemployment Rate in Myton is 13.2%.