Marysvale, UT Map & Demographics
Marysvale Map
Marysvale Overview
$20,303
PER CAPITA INCOME
$44,250
AVG FAMILY INCOME
$39,167
AVG HOUSEHOLD INCOME
4.1%
WAGE / INCOME GAP [ % ]
95.9¢/ $1
WAGE / INCOME GAP [ $ ]
0.47
INEQUALITY / GINI INDEX
524
TOTAL POPULATION
222
MALE POPULATION
302
FEMALE POPULATION
73.51
MALES / 100 FEMALES
136.04
FEMALES / 100 MALES
55.4
MEDIAN AGE
4.3
AVG FAMILY SIZE
3.0
AVG HOUSEHOLD SIZE
202
LABOR FORCE [ PEOPLE ]
48.3%
PERCENT IN LABOR FORCE
Marysvale Zip Codes
Marysvale Area Codes
Income in Marysvale
Income Overview in Marysvale
Per Capita Income in Marysvale is $20,303, while median incomes of families and households are $44,250 and $39,167 respectively.
| Characteristic | Number | Measure |
| Per Capita Income | 524 | $20,303 |
| Median Family Income | 104 | $44,250 |
| Mean Family Income | 104 | $61,926 |
| Median Household Income | 176 | $39,167 |
| Mean Household Income | 176 | $45,649 |
| Income Deficit | 104 | $0 |
| Wage / Income Gap (%) | 524 | 4.12% |
| Wage / Income Gap ($) | 524 | 95.88¢ per $1 |
| Gini / Inequality Index | 524 | 0.47 |
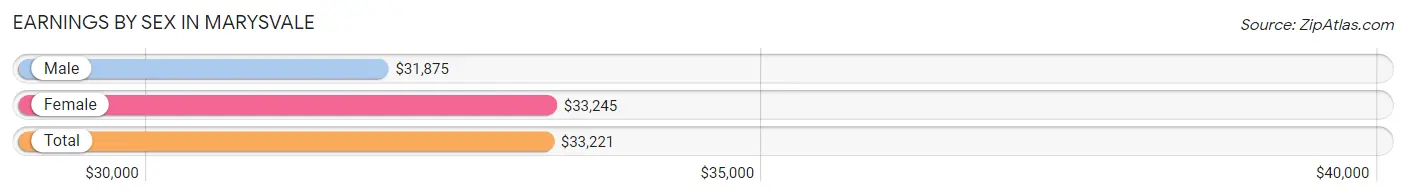
Earnings by Sex in Marysvale
Average Earnings in Marysvale are $33,221, $31,875 for men and $33,245 for women, a difference of 4.1%.
| Sex | Number | Average Earnings |
| Male | 75 (36.1%) | $31,875 |
| Female | 133 (63.9%) | $33,245 |
| Total | 208 (100.0%) | $33,221 |
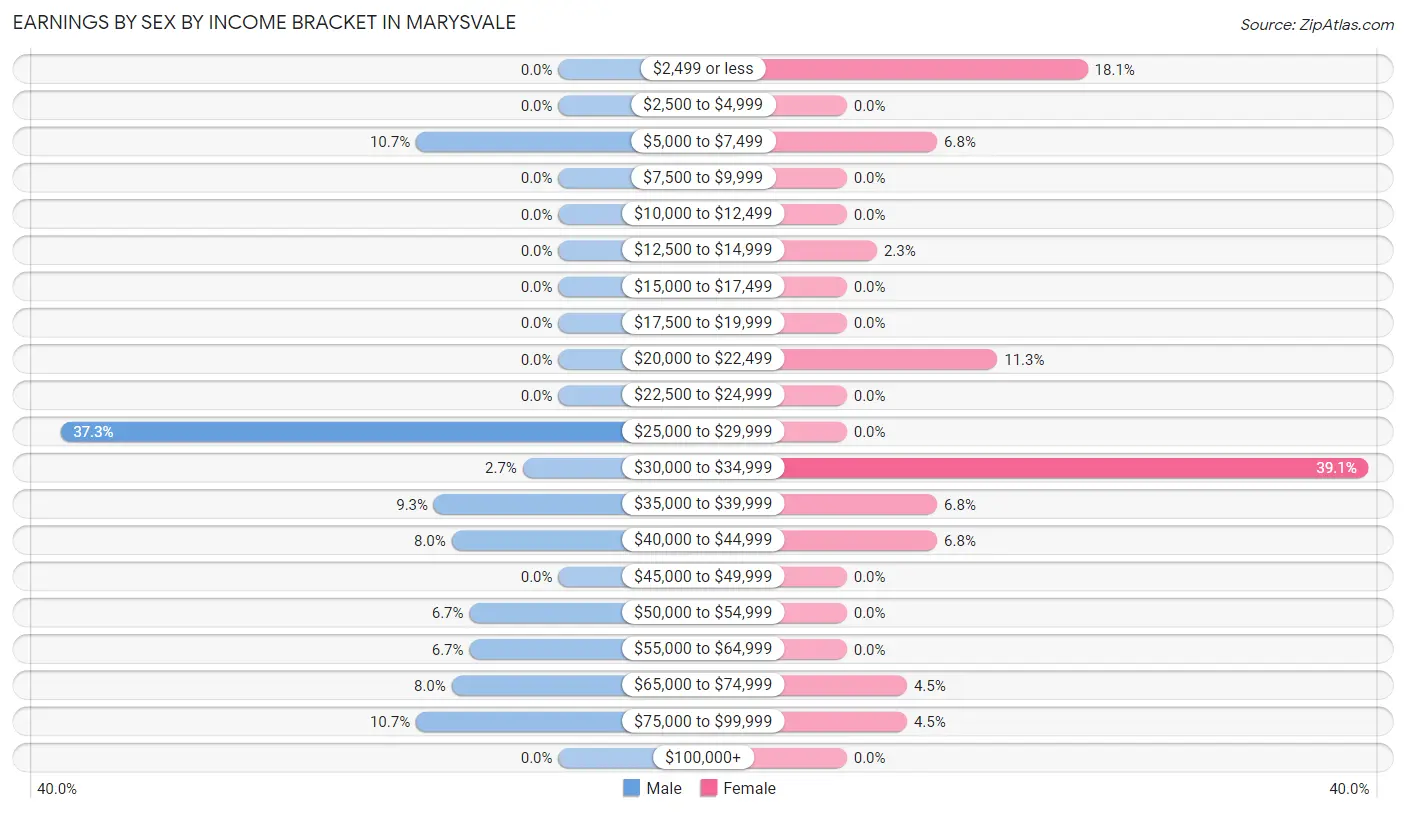
Earnings by Sex by Income Bracket in Marysvale
The most common earnings brackets in Marysvale are $25,000 to $29,999 for men (28 | 37.3%) and $30,000 to $34,999 for women (52 | 39.1%).
| Income | Male | Female |
| $2,499 or less | 0 (0.0%) | 24 (18.0%) |
| $2,500 to $4,999 | 0 (0.0%) | 0 (0.0%) |
| $5,000 to $7,499 | 8 (10.7%) | 9 (6.8%) |
| $7,500 to $9,999 | 0 (0.0%) | 0 (0.0%) |
| $10,000 to $12,499 | 0 (0.0%) | 0 (0.0%) |
| $12,500 to $14,999 | 0 (0.0%) | 3 (2.3%) |
| $15,000 to $17,499 | 0 (0.0%) | 0 (0.0%) |
| $17,500 to $19,999 | 0 (0.0%) | 0 (0.0%) |
| $20,000 to $22,499 | 0 (0.0%) | 15 (11.3%) |
| $22,500 to $24,999 | 0 (0.0%) | 0 (0.0%) |
| $25,000 to $29,999 | 28 (37.3%) | 0 (0.0%) |
| $30,000 to $34,999 | 2 (2.7%) | 52 (39.1%) |
| $35,000 to $39,999 | 7 (9.3%) | 9 (6.8%) |
| $40,000 to $44,999 | 6 (8.0%) | 9 (6.8%) |
| $45,000 to $49,999 | 0 (0.0%) | 0 (0.0%) |
| $50,000 to $54,999 | 5 (6.7%) | 0 (0.0%) |
| $55,000 to $64,999 | 5 (6.7%) | 0 (0.0%) |
| $65,000 to $74,999 | 6 (8.0%) | 6 (4.5%) |
| $75,000 to $99,999 | 8 (10.7%) | 6 (4.5%) |
| $100,000+ | 0 (0.0%) | 0 (0.0%) |
| Total | 75 (100.0%) | 133 (100.0%) |
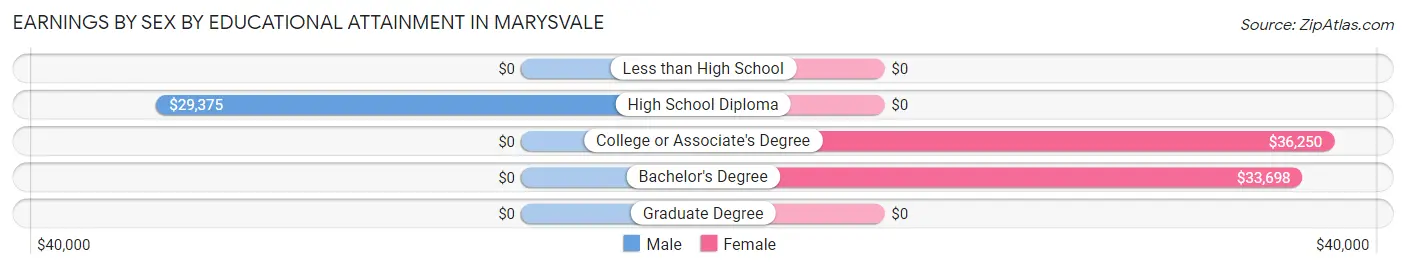
Earnings by Sex by Educational Attainment in Marysvale
Average earnings in Marysvale are $36,250 for men and $33,606 for women, a difference of 7.3%. Men with an educational attainment of high school diploma enjoy the highest average annual earnings of $29,375, while those with high school diploma education earn the least with $29,375. Women with an educational attainment of college or associate's degree earn the most with the average annual earnings of $36,250, while those with bachelor's degree education have the smallest earnings of $33,698.
| Educational Attainment | Male Income | Female Income |
| Less than High School | - | - |
| High School Diploma | $29,375 | $0 |
| College or Associate's Degree | - | - |
| Bachelor's Degree | - | - |
| Graduate Degree | - | - |
| Total | $36,250 | $33,606 |
Family Income in Marysvale
Family Income Brackets in Marysvale
According to the Marysvale family income data, there are 24 families falling into the $35,000 to $49,999 income range, which is the most common income bracket and makes up 23.1% of all families.
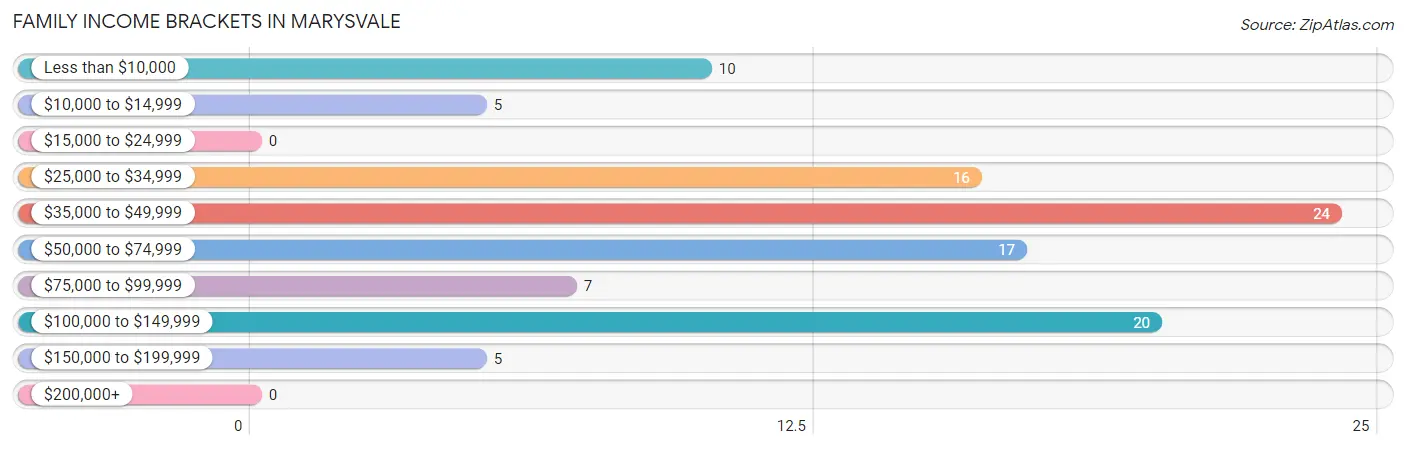
| Income Bracket | # Families | % Families |
| Less than $10,000 | 10 | 9.6% |
| $10,000 to $14,999 | 5 | 4.8% |
| $15,000 to $24,999 | 0 | 0.0% |
| $25,000 to $34,999 | 16 | 15.4% |
| $35,000 to $49,999 | 24 | 23.1% |
| $50,000 to $74,999 | 17 | 16.3% |
| $75,000 to $99,999 | 7 | 6.7% |
| $100,000 to $149,999 | 20 | 19.2% |
| $150,000 to $199,999 | 5 | 4.8% |
| $200,000+ | 0 | 0.0% |
Family Income by Famaliy Size in Marysvale
2-person families (54 | 51.9%) account for the highest median family income in Marysvale with $61,071 per family, while 2-person families (54 | 51.9%) have the highest median income of $30,536 per family member.
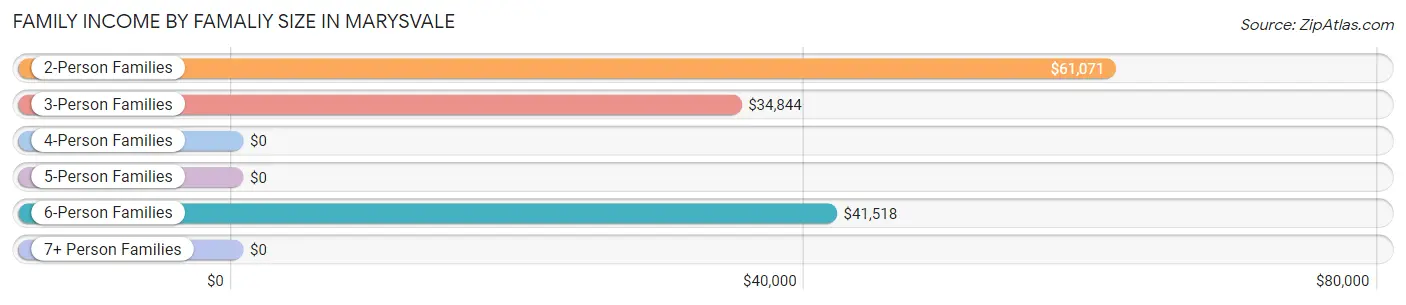
| Income Bracket | # Families | Median Income |
| 2-Person Families | 54 (51.9%) | $61,071 |
| 3-Person Families | 25 (24.0%) | $34,844 |
| 4-Person Families | 8 (7.7%) | $0 |
| 5-Person Families | 0 (0.0%) | $0 |
| 6-Person Families | 17 (16.4%) | $41,518 |
| 7+ Person Families | 0 (0.0%) | $0 |
| Total | 104 (100.0%) | $44,250 |
Family Income by Number of Earners in Marysvale
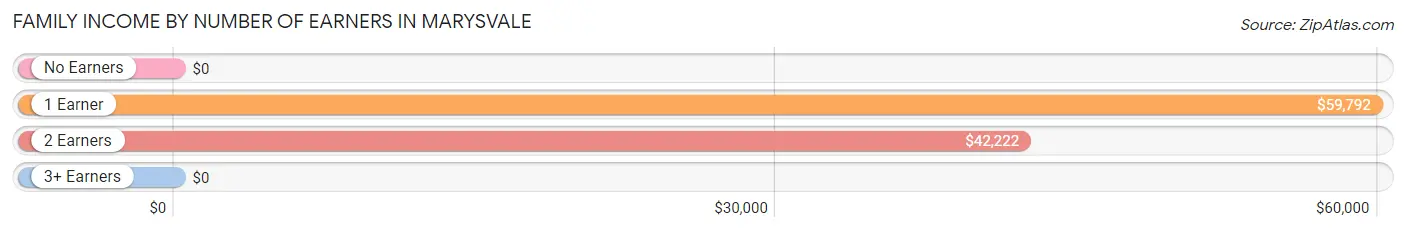
| Number of Earners | # Families | Median Income |
| No Earners | 32 (30.8%) | $0 |
| 1 Earner | 35 (33.7%) | $59,792 |
| 2 Earners | 32 (30.8%) | $42,222 |
| 3+ Earners | 5 (4.8%) | $0 |
| Total | 104 (100.0%) | $44,250 |
Household Income in Marysvale
Household Income Brackets in Marysvale
With 38 households falling in the category, the $10,000 to $14,999 income range is the most frequent in Marysvale, accounting for 21.6% of all households.
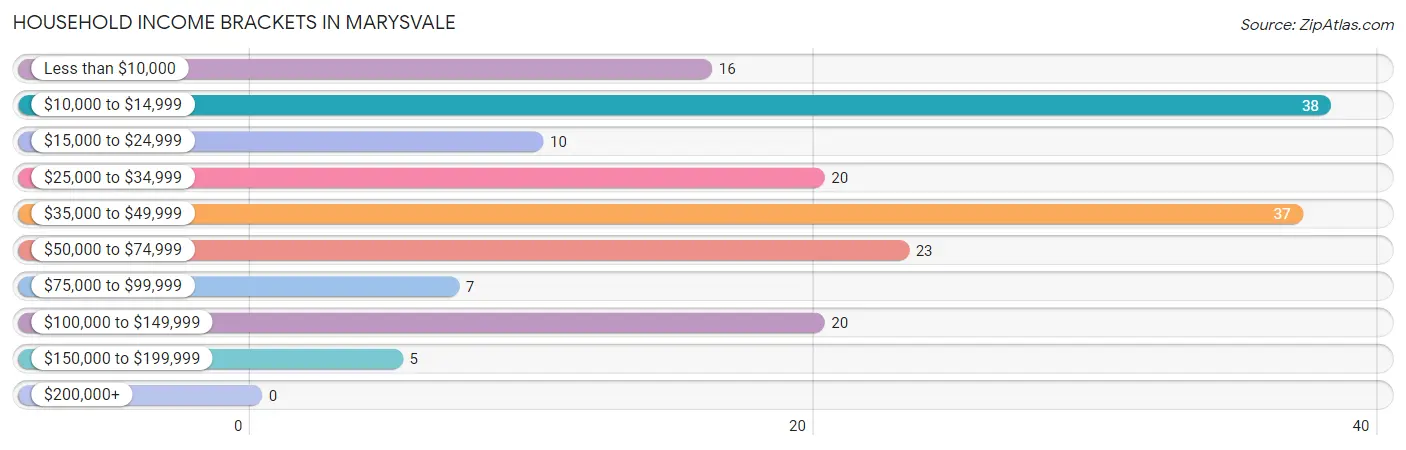
| Income Bracket | # Households | % Households |
| Less than $10,000 | 16 | 9.1% |
| $10,000 to $14,999 | 38 | 21.6% |
| $15,000 to $24,999 | 10 | 5.7% |
| $25,000 to $34,999 | 20 | 11.4% |
| $35,000 to $49,999 | 37 | 21.0% |
| $50,000 to $74,999 | 23 | 13.1% |
| $75,000 to $99,999 | 7 | 4.0% |
| $100,000 to $149,999 | 20 | 11.4% |
| $150,000 to $199,999 | 5 | 2.8% |
| $200,000+ | 0 | 0.0% |
Household Income by Householder Age in Marysvale
The median household income in Marysvale is $39,167, with the highest median household income of $41,518 found in the 25 to 44 years age bracket for the primary householder. A total of 33 households (18.8%) fall into this category.
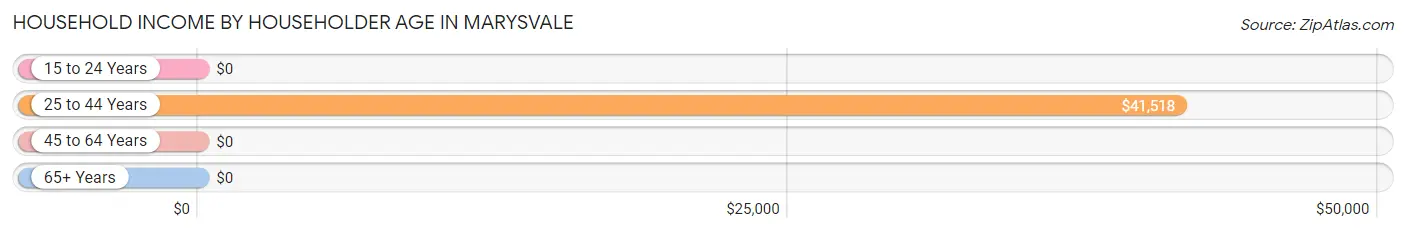
| Income Bracket | # Households | Median Income |
| 15 to 24 Years | 0 (0.0%) | $0 |
| 25 to 44 Years | 33 (18.8%) | $41,518 |
| 45 to 64 Years | 19 (10.8%) | $0 |
| 65+ Years | 124 (70.5%) | $0 |
| Total | 176 (100.0%) | $39,167 |
Poverty in Marysvale
Income Below Poverty by Sex and Age in Marysvale
With 19.8% poverty level for males and 16.2% for females among the residents of Marysvale, 75 year old and over males and 75 year old and over females are the most vulnerable to poverty, with 10 males (52.6%) and 17 females (50.0%) in their respective age groups living below the poverty level.
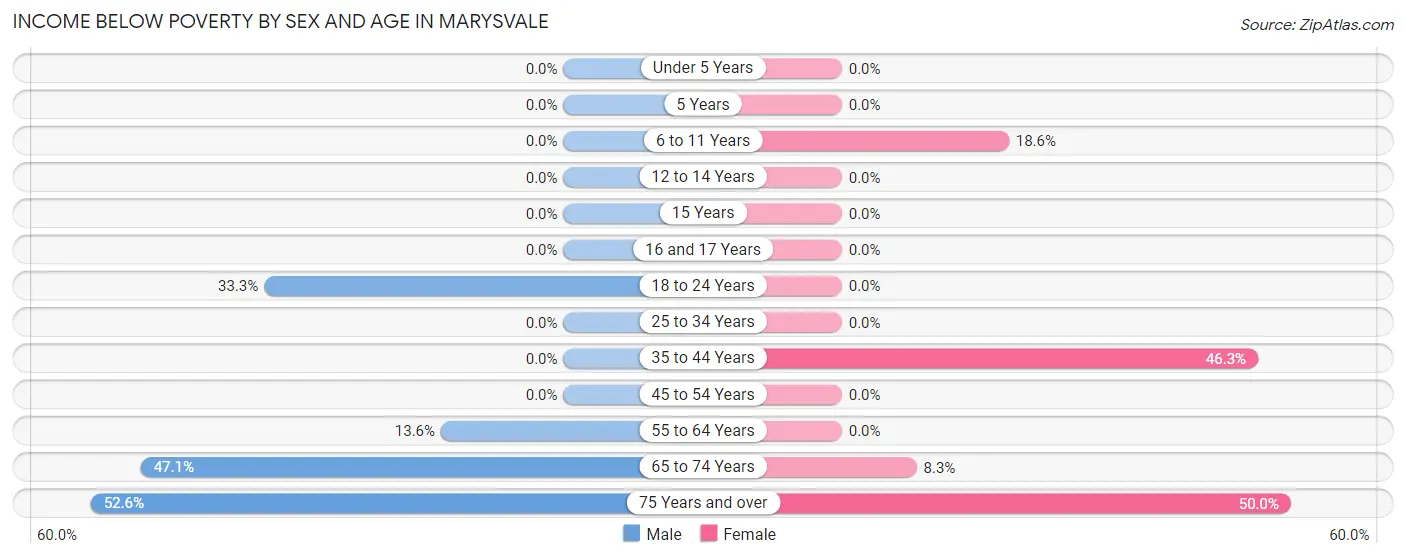
| Age Bracket | Male | Female |
| Under 5 Years | 0 (0.0%) | 0 (0.0%) |
| 5 Years | 0 (0.0%) | 0 (0.0%) |
| 6 to 11 Years | 0 (0.0%) | 8 (18.6%) |
| 12 to 14 Years | 0 (0.0%) | 0 (0.0%) |
| 15 Years | 0 (0.0%) | 0 (0.0%) |
| 16 and 17 Years | 0 (0.0%) | 0 (0.0%) |
| 18 to 24 Years | 4 (33.3%) | 0 (0.0%) |
| 25 to 34 Years | 0 (0.0%) | 0 (0.0%) |
| 35 to 44 Years | 0 (0.0%) | 19 (46.3%) |
| 45 to 54 Years | 0 (0.0%) | 0 (0.0%) |
| 55 to 64 Years | 6 (13.6%) | 0 (0.0%) |
| 65 to 74 Years | 24 (47.1%) | 5 (8.3%) |
| 75 Years and over | 10 (52.6%) | 17 (50.0%) |
| Total | 44 (19.8%) | 49 (16.2%) |
Income Above Poverty by Sex and Age in Marysvale
According to the poverty statistics in Marysvale, males aged under 5 years and females aged under 5 years are the age groups that are most secure financially, with 100.0% of males and 100.0% of females in these age groups living above the poverty line.
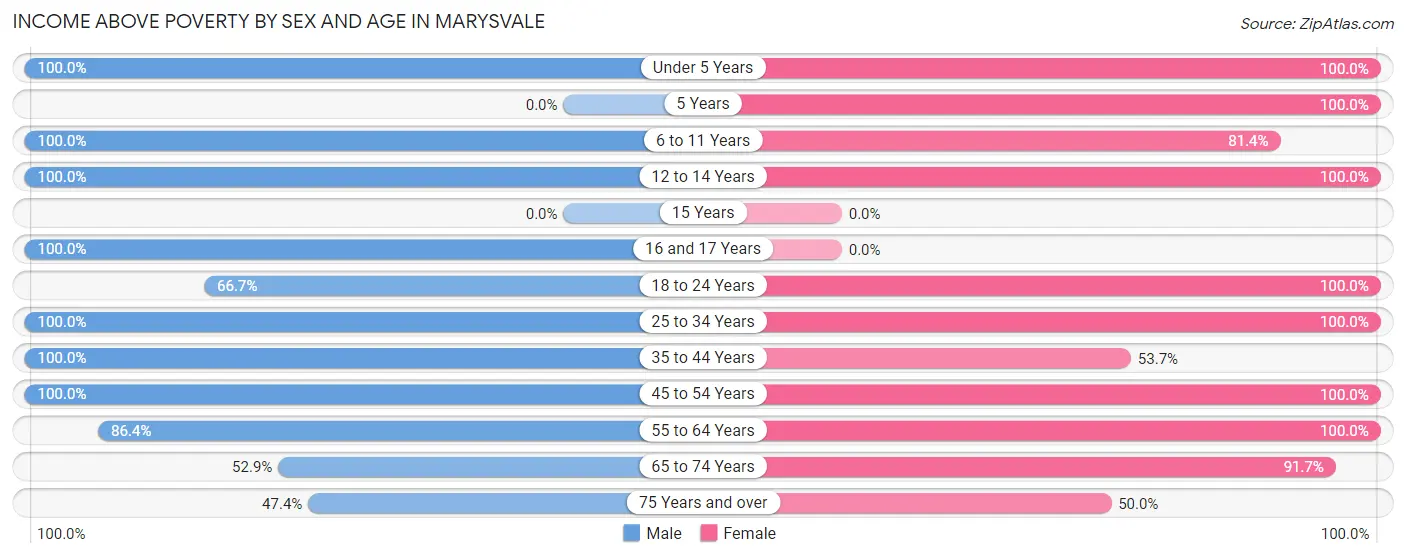
| Age Bracket | Male | Female |
| Under 5 Years | 8 (100.0%) | 21 (100.0%) |
| 5 Years | 0 (0.0%) | 5 (100.0%) |
| 6 to 11 Years | 16 (100.0%) | 35 (81.4%) |
| 12 to 14 Years | 3 (100.0%) | 10 (100.0%) |
| 15 Years | 0 (0.0%) | 0 (0.0%) |
| 16 and 17 Years | 11 (100.0%) | 0 (0.0%) |
| 18 to 24 Years | 8 (66.7%) | 15 (100.0%) |
| 25 to 34 Years | 2 (100.0%) | 11 (100.0%) |
| 35 to 44 Years | 51 (100.0%) | 22 (53.7%) |
| 45 to 54 Years | 5 (100.0%) | 6 (100.0%) |
| 55 to 64 Years | 38 (86.4%) | 56 (100.0%) |
| 65 to 74 Years | 27 (52.9%) | 55 (91.7%) |
| 75 Years and over | 9 (47.4%) | 17 (50.0%) |
| Total | 178 (80.2%) | 253 (83.8%) |
Income Below Poverty Among Married-Couple Families in Marysvale
The poverty statistics for married-couple families in Marysvale show that 13.0% or 10 of the total 77 families live below the poverty line. Families with no children have the highest poverty rate of 18.9%, comprising of 10 families. On the other hand, families with 1 or 2 children have the lowest poverty rate of 0.0%, which includes 0 families.
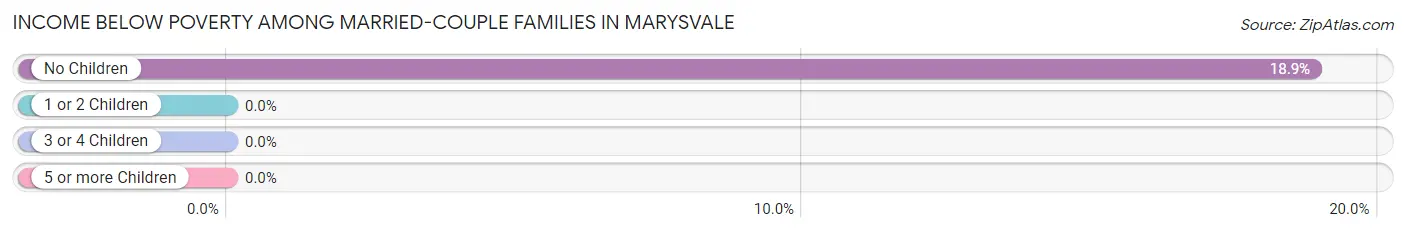
| Children | Above Poverty | Below Poverty |
| No Children | 43 (81.1%) | 10 (18.9%) |
| 1 or 2 Children | 16 (100.0%) | 0 (0.0%) |
| 3 or 4 Children | 8 (100.0%) | 0 (0.0%) |
| 5 or more Children | 0 (0.0%) | 0 (0.0%) |
| Total | 67 (87.0%) | 10 (13.0%) |
Income Below Poverty Among Single-Parent Households in Marysvale
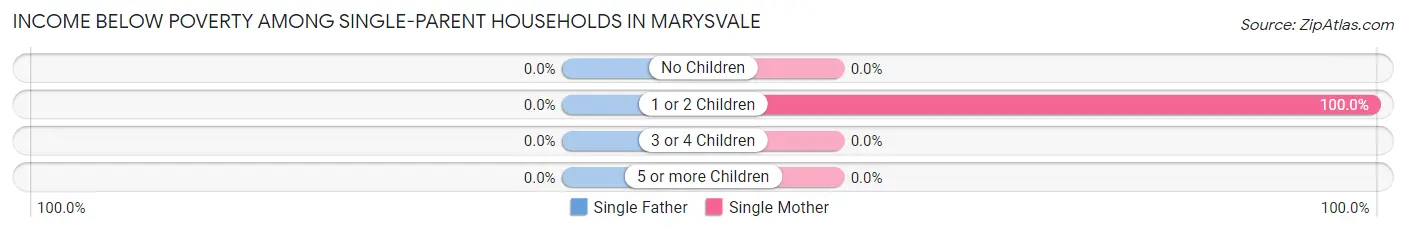
| Children | Single Father | Single Mother |
| No Children | 0 (0.0%) | 0 (0.0%) |
| 1 or 2 Children | 0 (0.0%) | 5 (100.0%) |
| 3 or 4 Children | 0 (0.0%) | 0 (0.0%) |
| 5 or more Children | 0 (0.0%) | 0 (0.0%) |
| Total | 0 (0.0%) | 5 (23.8%) |
Income Below Poverty Among Married-Couple vs Single-Parent Households in Marysvale
The poverty data for Marysvale shows that 10 of the married-couple family households (13.0%) and 5 of the single-parent households (18.5%) are living below the poverty level. Within the married-couple family households, those with no children have the highest poverty rate, with 10 households (18.9%) falling below the poverty line. Among the single-parent households, those with 1 or 2 children have the highest poverty rate, with 5 household (100.0%) living below poverty.
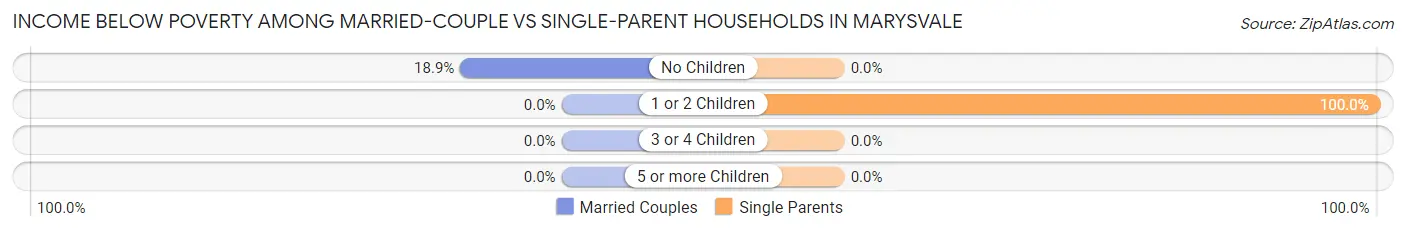
| Children | Married-Couple Families | Single-Parent Households |
| No Children | 10 (18.9%) | 0 (0.0%) |
| 1 or 2 Children | 0 (0.0%) | 5 (100.0%) |
| 3 or 4 Children | 0 (0.0%) | 0 (0.0%) |
| 5 or more Children | 0 (0.0%) | 0 (0.0%) |
| Total | 10 (13.0%) | 5 (18.5%) |
Race in Marysvale
The most populous races in Marysvale are White / Caucasian (500 | 95.4%), Hispanic or Latino (24 | 4.6%), and Two or more Races (24 | 4.6%).
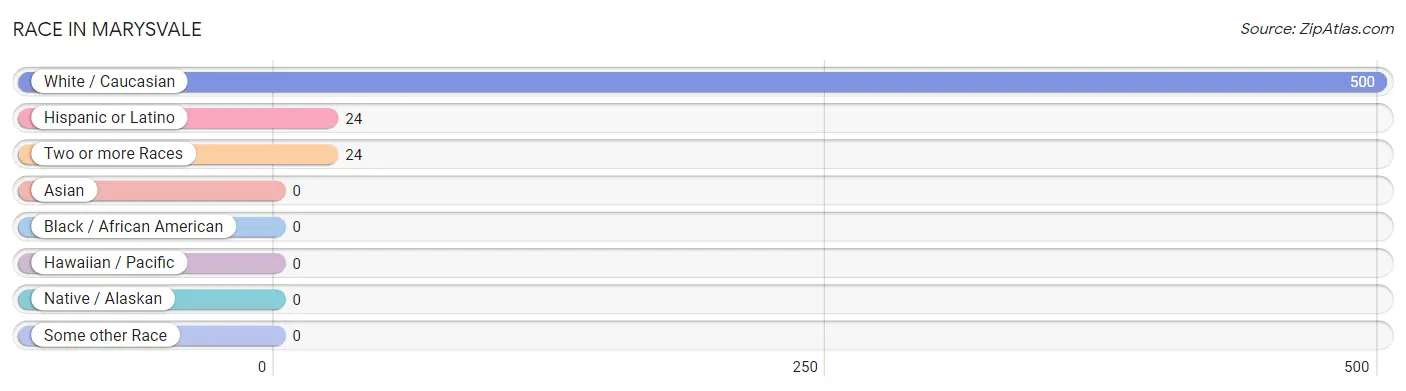
| Race | # Population | % Population |
| Asian | 0 | 0.0% |
| Black / African American | 0 | 0.0% |
| Hawaiian / Pacific | 0 | 0.0% |
| Hispanic or Latino | 24 | 4.6% |
| Native / Alaskan | 0 | 0.0% |
| White / Caucasian | 500 | 95.4% |
| Two or more Races | 24 | 4.6% |
| Some other Race | 0 | 0.0% |
| Total | 524 | 100.0% |
Ancestry in Marysvale
The most populous ancestries reported in Marysvale are English (183 | 34.9%), Danish (155 | 29.6%), German (121 | 23.1%), Irish (81 | 15.5%), and European (49 | 9.3%), together accounting for 112.4% of all Marysvale residents.
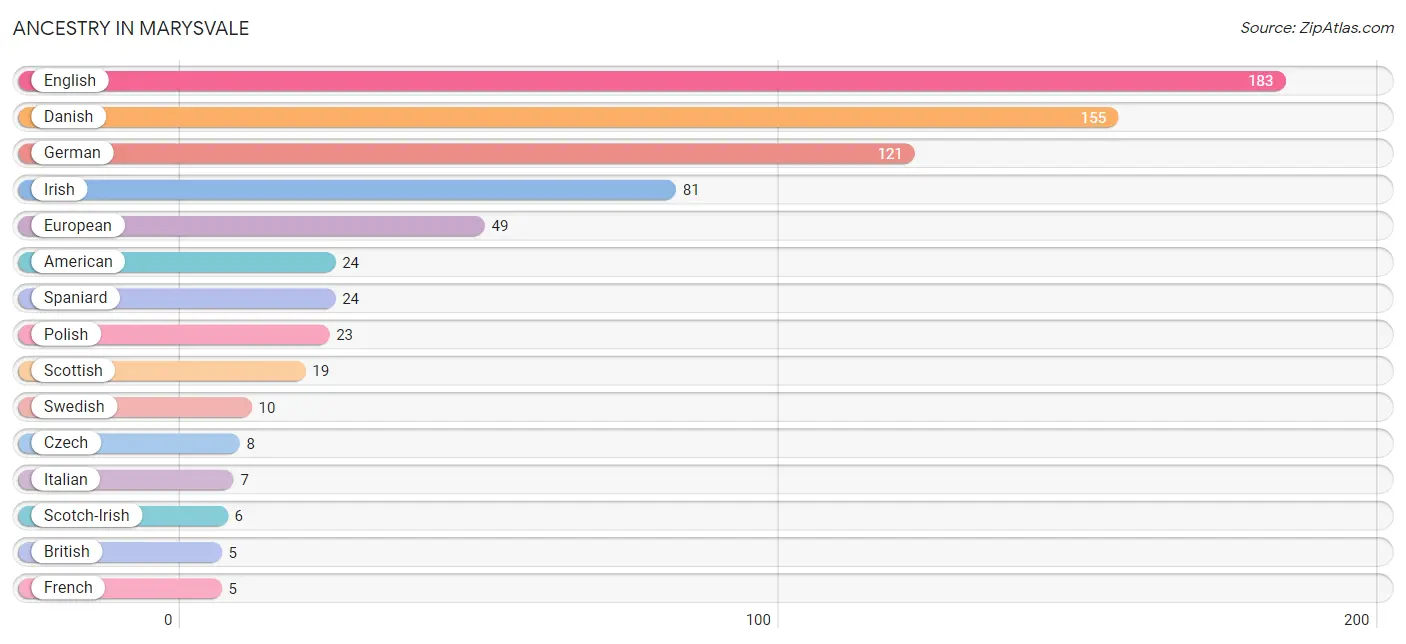
| Ancestry | # Population | % Population |
| American | 24 | 4.6% |
| British | 5 | 0.9% |
| Czech | 8 | 1.5% |
| Danish | 155 | 29.6% |
| English | 183 | 34.9% |
| European | 49 | 9.3% |
| French | 5 | 0.9% |
| German | 121 | 23.1% |
| Irish | 81 | 15.5% |
| Italian | 7 | 1.3% |
| Polish | 23 | 4.4% |
| Scotch-Irish | 6 | 1.1% |
| Scottish | 19 | 3.6% |
| South African | 5 | 0.9% |
| Spaniard | 24 | 4.6% |
| Subsaharan African | 5 | 0.9% |
| Swedish | 10 | 1.9% | View All 17 Rows |
Immigrants in Marysvale

| Immigration Origin | # Population | % Population | View All 0 Rows |
Sex and Age in Marysvale
Sex and Age in Marysvale
The most populous age groups in Marysvale are 60 to 64 Years (35 | 15.8%) for men and 55 to 59 Years (52 | 17.2%) for women.
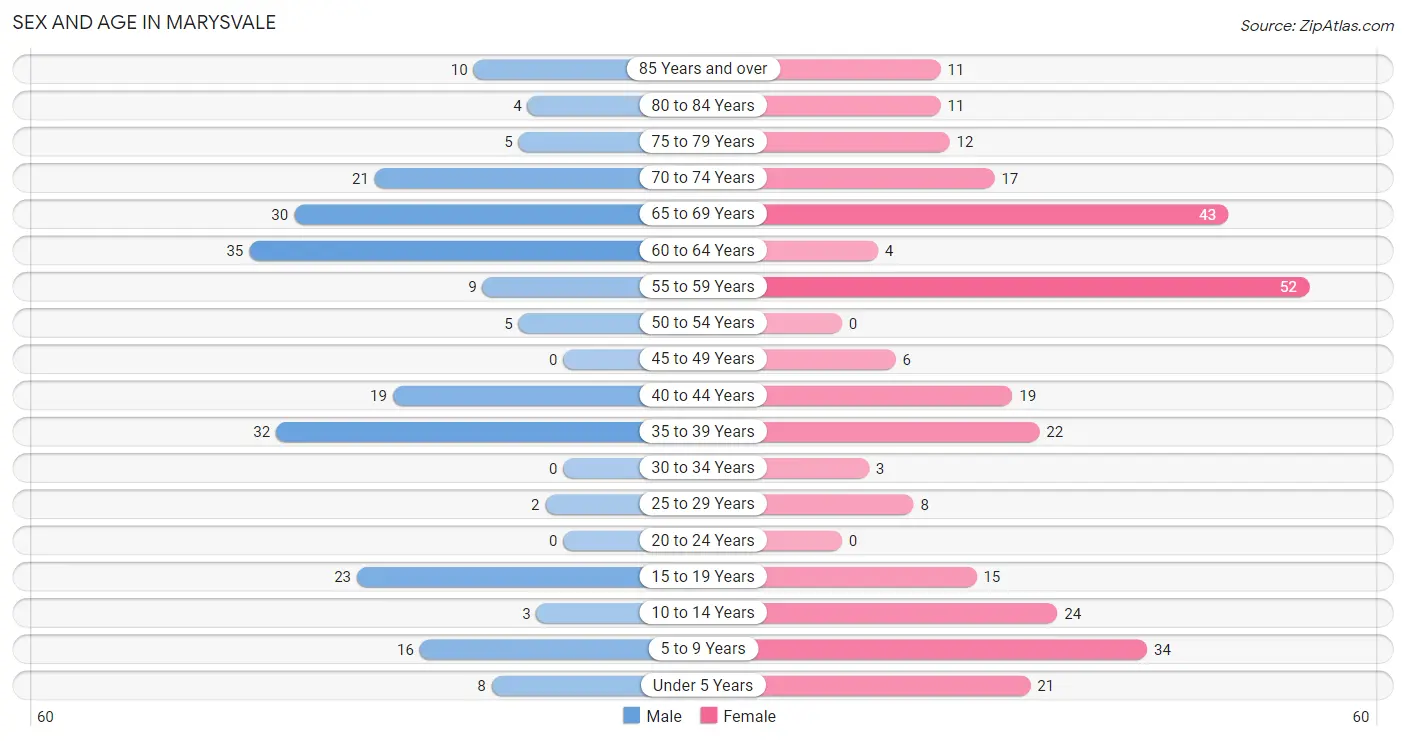
| Age Bracket | Male | Female |
| Under 5 Years | 8 (3.6%) | 21 (7.0%) |
| 5 to 9 Years | 16 (7.2%) | 34 (11.3%) |
| 10 to 14 Years | 3 (1.3%) | 24 (8.0%) |
| 15 to 19 Years | 23 (10.4%) | 15 (5.0%) |
| 20 to 24 Years | 0 (0.0%) | 0 (0.0%) |
| 25 to 29 Years | 2 (0.9%) | 8 (2.6%) |
| 30 to 34 Years | 0 (0.0%) | 3 (1.0%) |
| 35 to 39 Years | 32 (14.4%) | 22 (7.3%) |
| 40 to 44 Years | 19 (8.6%) | 19 (6.3%) |
| 45 to 49 Years | 0 (0.0%) | 6 (2.0%) |
| 50 to 54 Years | 5 (2.2%) | 0 (0.0%) |
| 55 to 59 Years | 9 (4.1%) | 52 (17.2%) |
| 60 to 64 Years | 35 (15.8%) | 4 (1.3%) |
| 65 to 69 Years | 30 (13.5%) | 43 (14.2%) |
| 70 to 74 Years | 21 (9.5%) | 17 (5.6%) |
| 75 to 79 Years | 5 (2.2%) | 12 (4.0%) |
| 80 to 84 Years | 4 (1.8%) | 11 (3.6%) |
| 85 Years and over | 10 (4.5%) | 11 (3.6%) |
| Total | 222 (100.0%) | 302 (100.0%) |
Families and Households in Marysvale
Median Family Size in Marysvale
The median family size in Marysvale is 4.31 persons per family, with single female/mother families (21 | 20.2%) accounting for the largest median family size of 8.24 persons per family. On the other hand, married-couple families (77 | 74.0%) represent the smallest median family size with 3.13 persons per family.
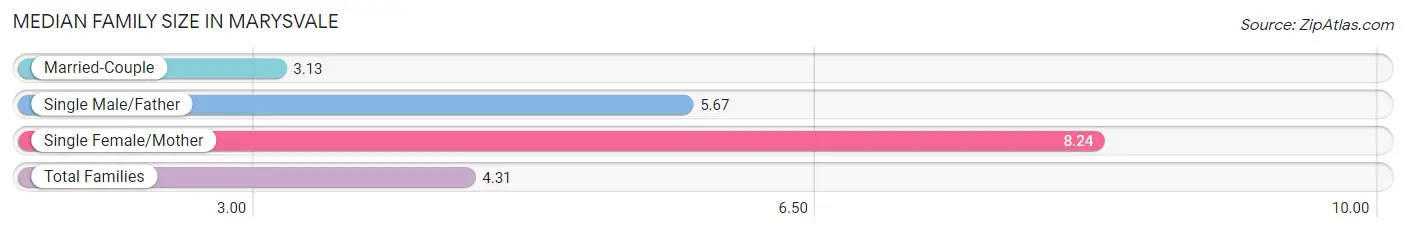
| Family Type | # Families | Family Size |
| Married-Couple | 77 (74.0%) | 3.13 |
| Single Male/Father | 6 (5.8%) | 5.67 |
| Single Female/Mother | 21 (20.2%) | 8.24 |
| Total Families | 104 (100.0%) | 4.31 |
Median Household Size in Marysvale
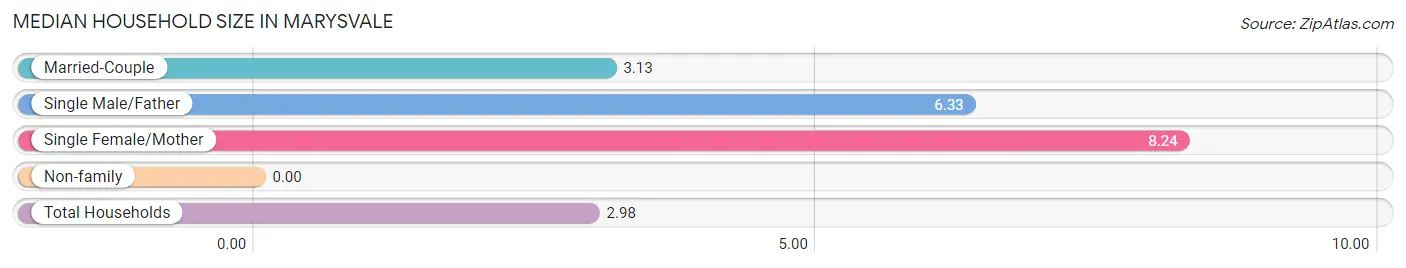
| Household Type | # Households | Household Size |
| Married-Couple | 77 (43.8%) | 3.13 |
| Single Male/Father | 6 (3.4%) | 6.33 |
| Single Female/Mother | 21 (11.9%) | 8.24 |
| Non-family | 72 (40.9%) | - |
| Total Households | 176 (100.0%) | 2.98 |
Household Size by Marriage Status in Marysvale
Out of a total of 176 households in Marysvale, 104 (59.1%) are family households, while 72 (40.9%) are nonfamily households. The most numerous type of family households are 2-person households, comprising 48, and the most common type of nonfamily households are 1-person households, comprising 72.
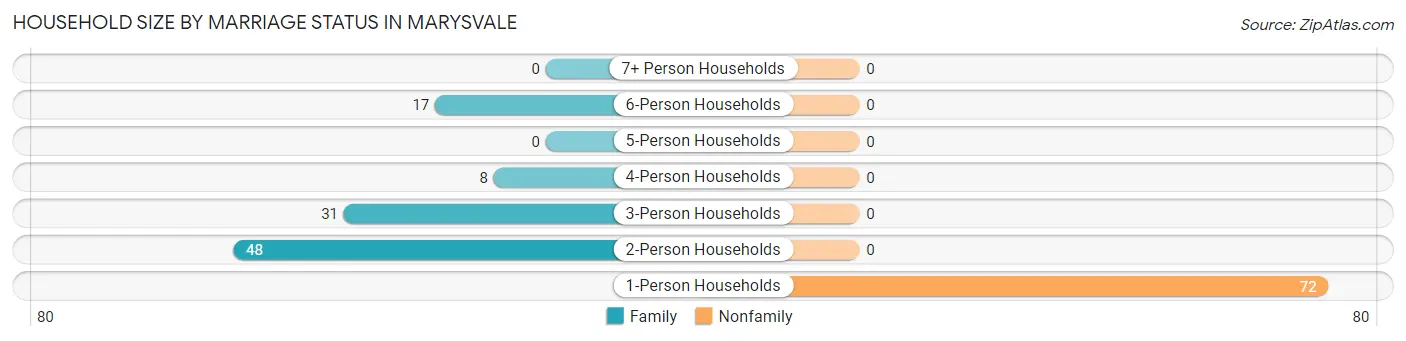
| Household Size | Family Households | Nonfamily Households |
| 1-Person Households | - | 72 (40.9%) |
| 2-Person Households | 48 (27.3%) | 0 (0.0%) |
| 3-Person Households | 31 (17.6%) | 0 (0.0%) |
| 4-Person Households | 8 (4.5%) | 0 (0.0%) |
| 5-Person Households | 0 (0.0%) | 0 (0.0%) |
| 6-Person Households | 17 (9.7%) | 0 (0.0%) |
| 7+ Person Households | 0 (0.0%) | 0 (0.0%) |
| Total | 104 (59.1%) | 72 (40.9%) |
Female Fertility in Marysvale
Fertility by Age in Marysvale
Average fertility rate in Marysvale is 110.0 births per 1,000 women. Women in the age bracket of 20 to 34 years have the highest fertility rate with 727.0 births per 1,000 women. Women in the age bracket of 20 to 34 years acount for 100.0% of all women with births.

| Age Bracket | Women with Births | Births / 1,000 Women |
| 15 to 19 years | 0 (0.0%) | 0.0 |
| 20 to 34 years | 8 (100.0%) | 727.0 |
| 35 to 50 years | 0 (0.0%) | 0.0 |
| Total | 8 (100.0%) | 110.0 |
Fertility by Age by Marriage Status in Marysvale
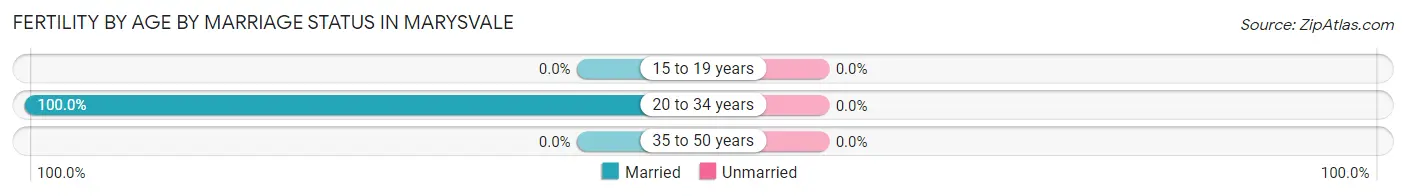
| Age Bracket | Married | Unmarried |
| 15 to 19 years | 0 (0.0%) | 0 (0.0%) |
| 20 to 34 years | 8 (100.0%) | 0 (0.0%) |
| 35 to 50 years | 0 (0.0%) | 0 (0.0%) |
| Total | 8 (100.0%) | 0 (0.0%) |
Fertility by Education in Marysvale
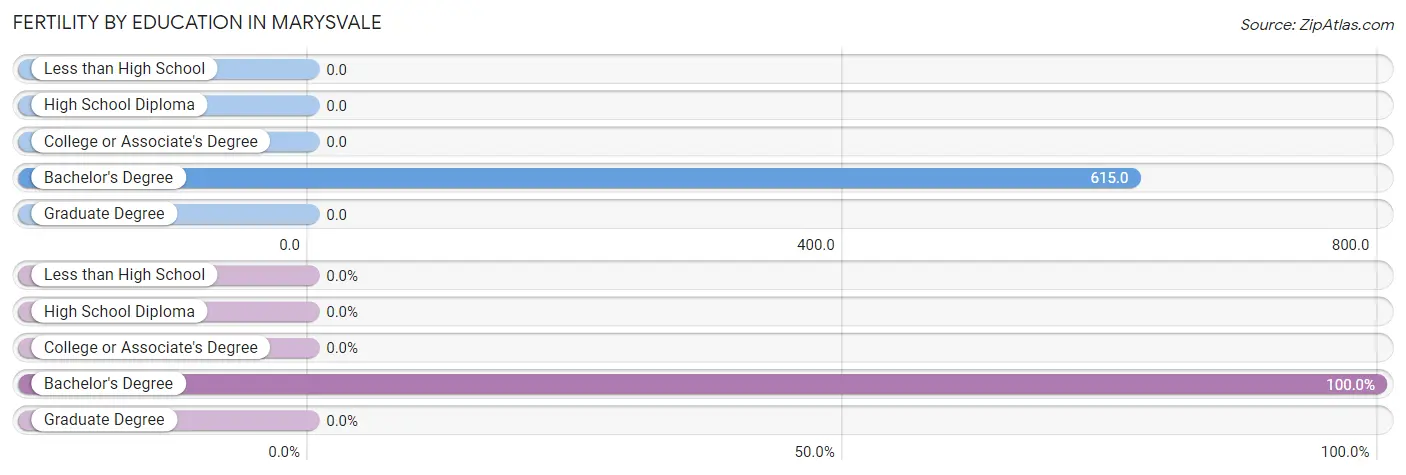
| Educational Attainment | Women with Births | Births / 1,000 Women |
| Less than High School | 0 (0.0%) | 0.0 |
| High School Diploma | 0 (0.0%) | 0.0 |
| College or Associate's Degree | 0 (0.0%) | 0.0 |
| Bachelor's Degree | 8 (100.0%) | 615.0 |
| Graduate Degree | 0 (0.0%) | 0.0 |
| Total | 8 (100.0%) | 110.0 |
Fertility by Education by Marriage Status in Marysvale
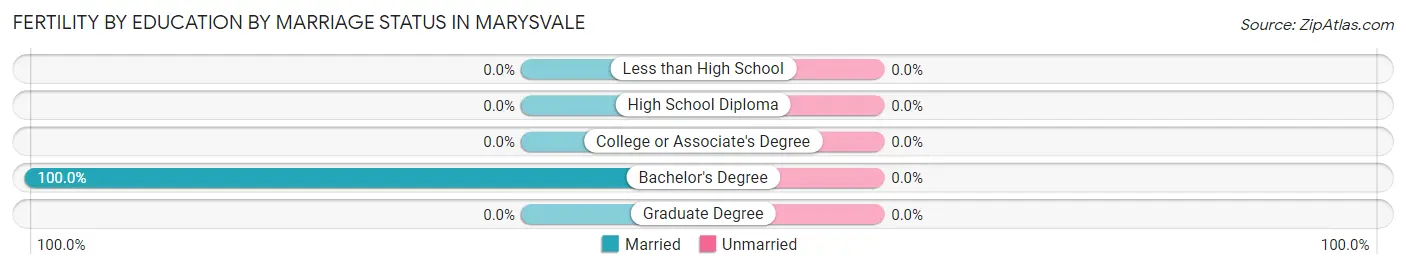
| Educational Attainment | Married | Unmarried |
| Less than High School | 0 (0.0%) | 0 (0.0%) |
| High School Diploma | 0 (0.0%) | 0 (0.0%) |
| College or Associate's Degree | 0 (0.0%) | 0 (0.0%) |
| Bachelor's Degree | 8 (100.0%) | 0 (0.0%) |
| Graduate Degree | 0 (0.0%) | 0 (0.0%) |
| Total | 8 (100.0%) | 0 (0.0%) |
Employment Characteristics in Marysvale
Employment by Class of Employer in Marysvale
Among the 197 employed individuals in Marysvale, private company employees (138 | 70.1%), self-employed (not incorporated) (23 | 11.7%), and local government employees (11 | 5.6%) make up the most common classes of employment.
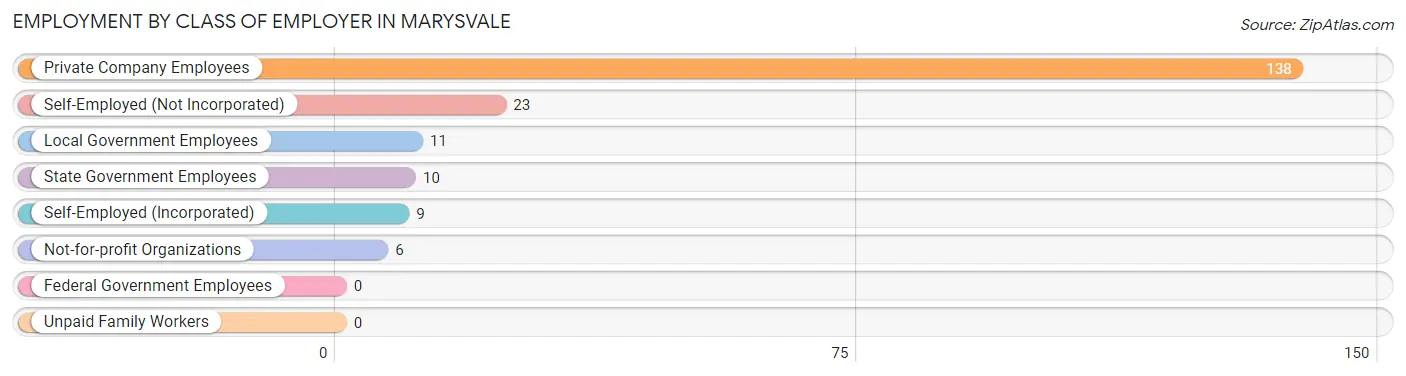
| Employer Class | # Employees | % Employees |
| Private Company Employees | 138 | 70.1% |
| Self-Employed (Incorporated) | 9 | 4.6% |
| Self-Employed (Not Incorporated) | 23 | 11.7% |
| Not-for-profit Organizations | 6 | 3.0% |
| Local Government Employees | 11 | 5.6% |
| State Government Employees | 10 | 5.1% |
| Federal Government Employees | 0 | 0.0% |
| Unpaid Family Workers | 0 | 0.0% |
| Total | 197 | 100.0% |
Employment Status by Age in Marysvale
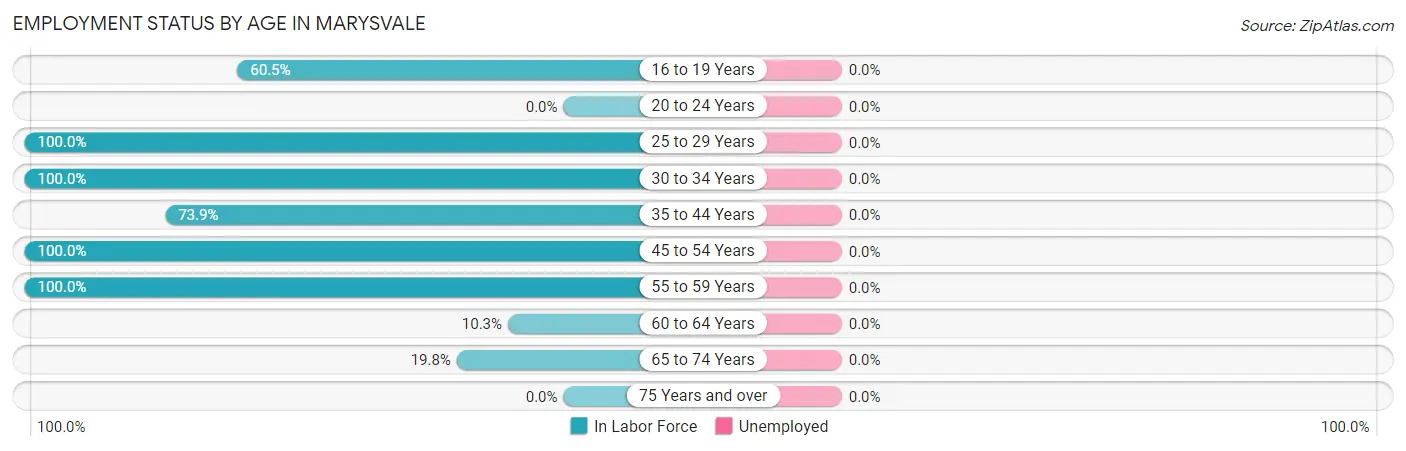
| Age Bracket | In Labor Force | Unemployed |
| 16 to 19 Years | 23 (60.5%) | 0 (0.0%) |
| 20 to 24 Years | 0 (0.0%) | 0 (0.0%) |
| 25 to 29 Years | 10 (100.0%) | 0 (0.0%) |
| 30 to 34 Years | 3 (100.0%) | 0 (0.0%) |
| 35 to 44 Years | 68 (73.9%) | 0 (0.0%) |
| 45 to 54 Years | 11 (100.0%) | 0 (0.0%) |
| 55 to 59 Years | 61 (100.0%) | 0 (0.0%) |
| 60 to 64 Years | 4 (10.3%) | 0 (0.0%) |
| 65 to 74 Years | 22 (19.8%) | 0 (0.0%) |
| 75 Years and over | 0 (0.0%) | 0 (0.0%) |
| Total | 202 (48.3%) | 0 (0.0%) |
Employment Status by Educational Attainment in Marysvale
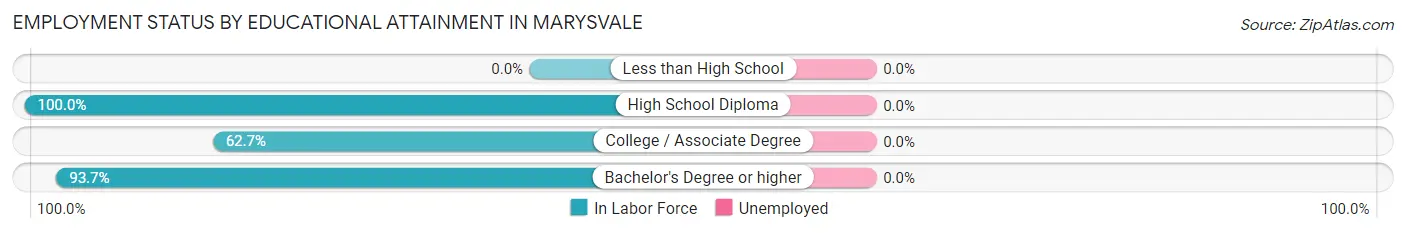
| Educational Attainment | In Labor Force | Unemployed |
| Less than High School | 0 (0.0%) | 0 (0.0%) |
| High School Diploma | 51 (100.0%) | 0 (0.0%) |
| College / Associate Degree | 32 (62.7%) | 0 (0.0%) |
| Bachelor's Degree or higher | 74 (93.7%) | 0 (0.0%) |
| Total | 157 (72.7%) | 0 (0.0%) |
Employment Occupations by Sex in Marysvale
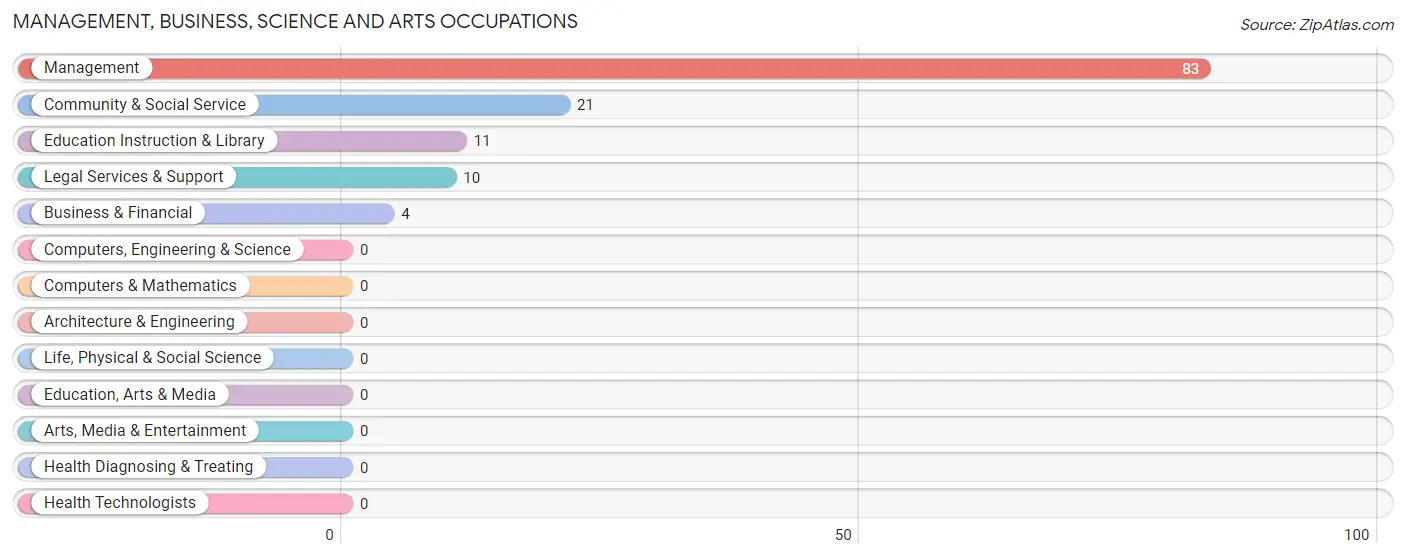
Management, Business, Science and Arts Occupations
The most common Management, Business, Science and Arts occupations in Marysvale are Management (83 | 41.1%), Community & Social Service (21 | 10.4%), Education Instruction & Library (11 | 5.4%), Legal Services & Support (10 | 5.0%), and Business & Financial (4 | 2.0%).
Management, Business, Science and Arts Occupations by Sex
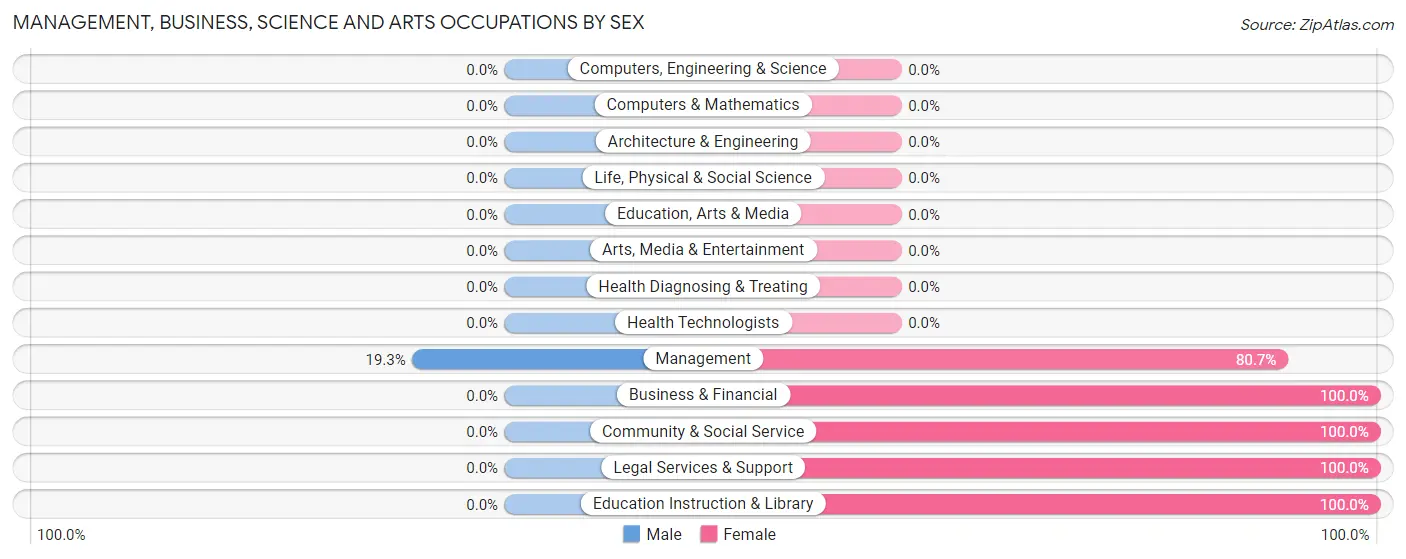
| Occupation | Male | Female |
| Management | 16 (19.3%) | 67 (80.7%) |
| Business & Financial | 0 (0.0%) | 4 (100.0%) |
| Computers, Engineering & Science | 0 (0.0%) | 0 (0.0%) |
| Computers & Mathematics | 0 (0.0%) | 0 (0.0%) |
| Architecture & Engineering | 0 (0.0%) | 0 (0.0%) |
| Life, Physical & Social Science | 0 (0.0%) | 0 (0.0%) |
| Community & Social Service | 0 (0.0%) | 21 (100.0%) |
| Education, Arts & Media | 0 (0.0%) | 0 (0.0%) |
| Legal Services & Support | 0 (0.0%) | 10 (100.0%) |
| Education Instruction & Library | 0 (0.0%) | 11 (100.0%) |
| Arts, Media & Entertainment | 0 (0.0%) | 0 (0.0%) |
| Health Diagnosing & Treating | 0 (0.0%) | 0 (0.0%) |
| Health Technologists | 0 (0.0%) | 0 (0.0%) |
| Total (Category) | 16 (14.8%) | 92 (85.2%) |
| Total (Overall) | 75 (37.1%) | 127 (62.9%) |
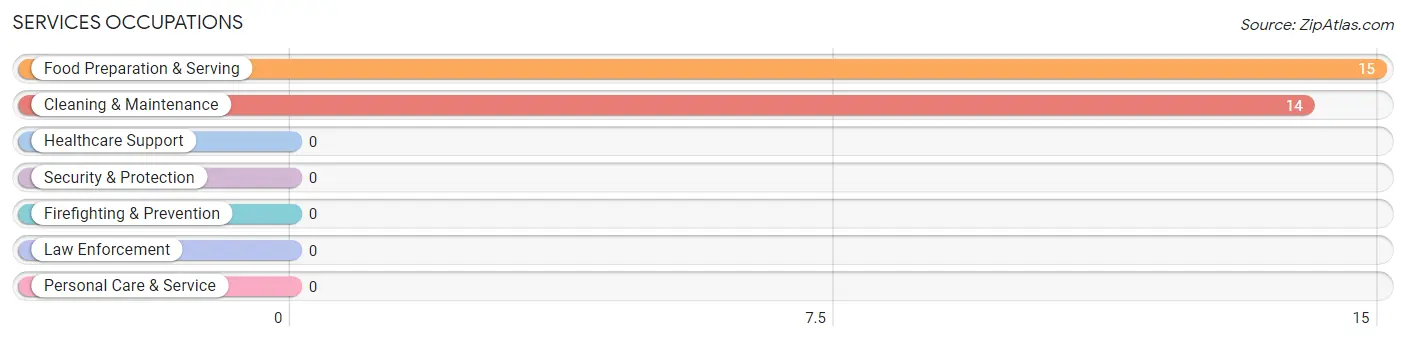
Services Occupations
The most common Services occupations in Marysvale are Food Preparation & Serving (15 | 7.4%), and Cleaning & Maintenance (14 | 6.9%).
Services Occupations by Sex
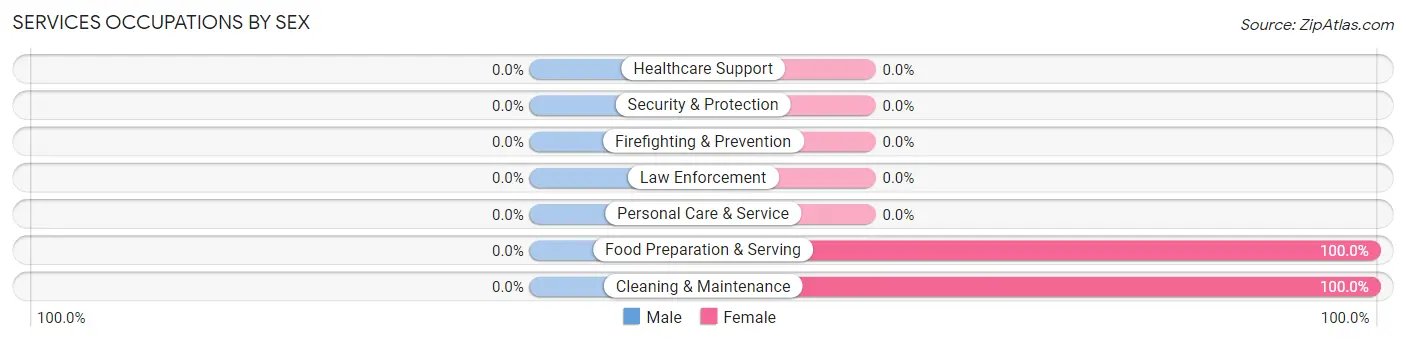
| Occupation | Male | Female |
| Healthcare Support | 0 (0.0%) | 0 (0.0%) |
| Security & Protection | 0 (0.0%) | 0 (0.0%) |
| Firefighting & Prevention | 0 (0.0%) | 0 (0.0%) |
| Law Enforcement | 0 (0.0%) | 0 (0.0%) |
| Food Preparation & Serving | 0 (0.0%) | 15 (100.0%) |
| Cleaning & Maintenance | 0 (0.0%) | 14 (100.0%) |
| Personal Care & Service | 0 (0.0%) | 0 (0.0%) |
| Total (Category) | 0 (0.0%) | 29 (100.0%) |
| Total (Overall) | 75 (37.1%) | 127 (62.9%) |
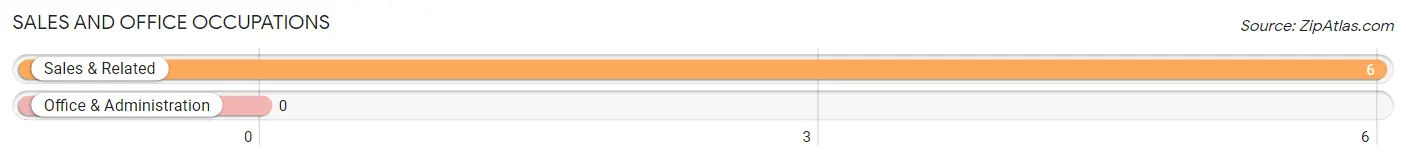
Sales and Office Occupations
The most common Sales and Office occupations in Marysvale are , and Sales & Related (6 | 3.0%).
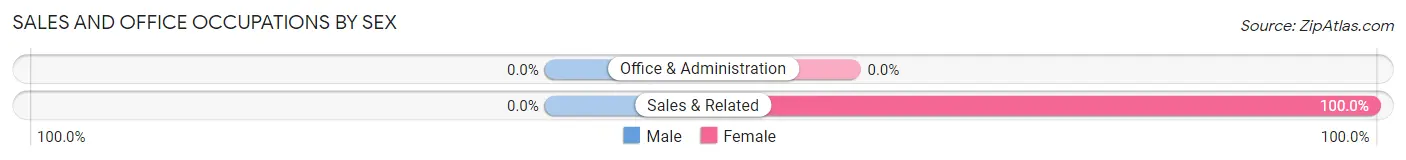
Sales and Office Occupations by Sex
| Occupation | Male | Female |
| Sales & Related | 0 (0.0%) | 6 (100.0%) |
| Office & Administration | 0 (0.0%) | 0 (0.0%) |
| Total (Category) | 0 (0.0%) | 6 (100.0%) |
| Total (Overall) | 75 (37.1%) | 127 (62.9%) |
Natural Resources, Construction and Maintenance Occupations
The most common Natural Resources, Construction and Maintenance occupations in Marysvale are , and Construction & Extraction (47 | 23.3%).
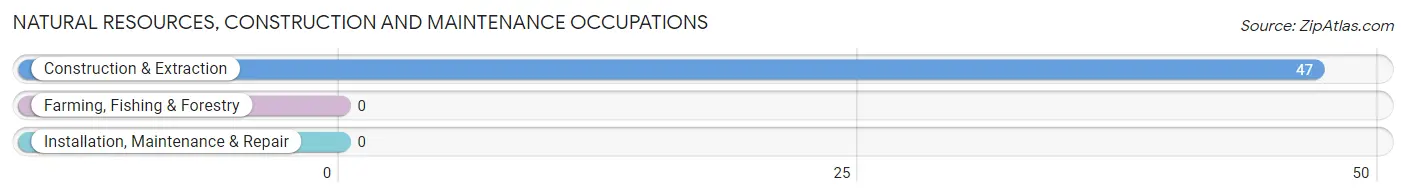
Natural Resources, Construction and Maintenance Occupations by Sex
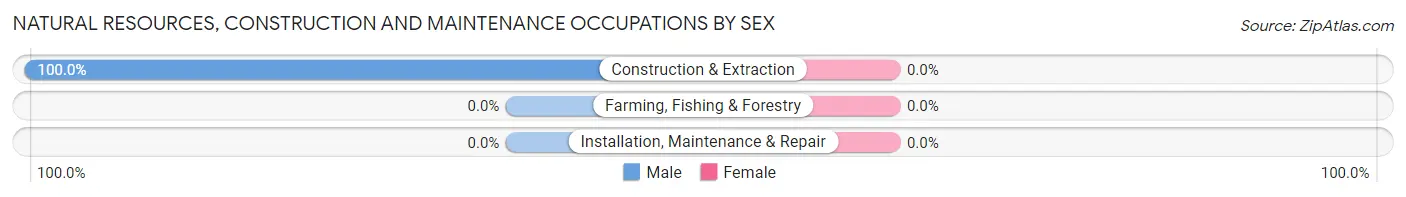
| Occupation | Male | Female |
| Farming, Fishing & Forestry | 0 (0.0%) | 0 (0.0%) |
| Construction & Extraction | 47 (100.0%) | 0 (0.0%) |
| Installation, Maintenance & Repair | 0 (0.0%) | 0 (0.0%) |
| Total (Category) | 47 (100.0%) | 0 (0.0%) |
| Total (Overall) | 75 (37.1%) | 127 (62.9%) |
Production, Transportation and Moving Occupations
The most common Production, Transportation and Moving occupations in Marysvale are , and Production (12 | 5.9%).
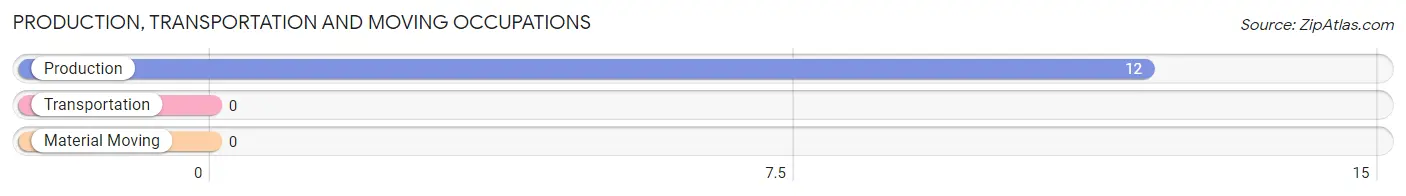
Production, Transportation and Moving Occupations by Sex
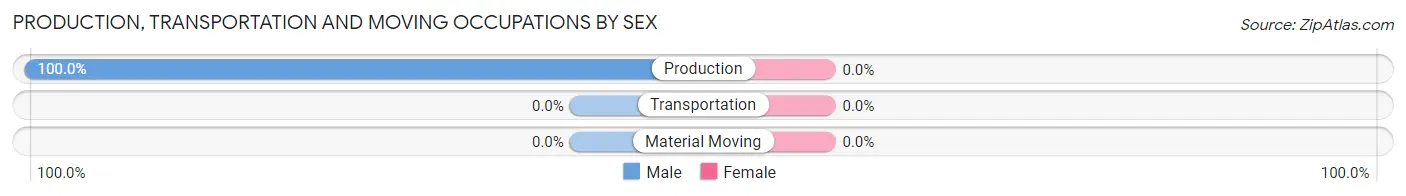
| Occupation | Male | Female |
| Production | 12 (100.0%) | 0 (0.0%) |
| Transportation | 0 (0.0%) | 0 (0.0%) |
| Material Moving | 0 (0.0%) | 0 (0.0%) |
| Total (Category) | 12 (100.0%) | 0 (0.0%) |
| Total (Overall) | 75 (37.1%) | 127 (62.9%) |
Employment Industries by Sex in Marysvale
Employment Industries in Marysvale
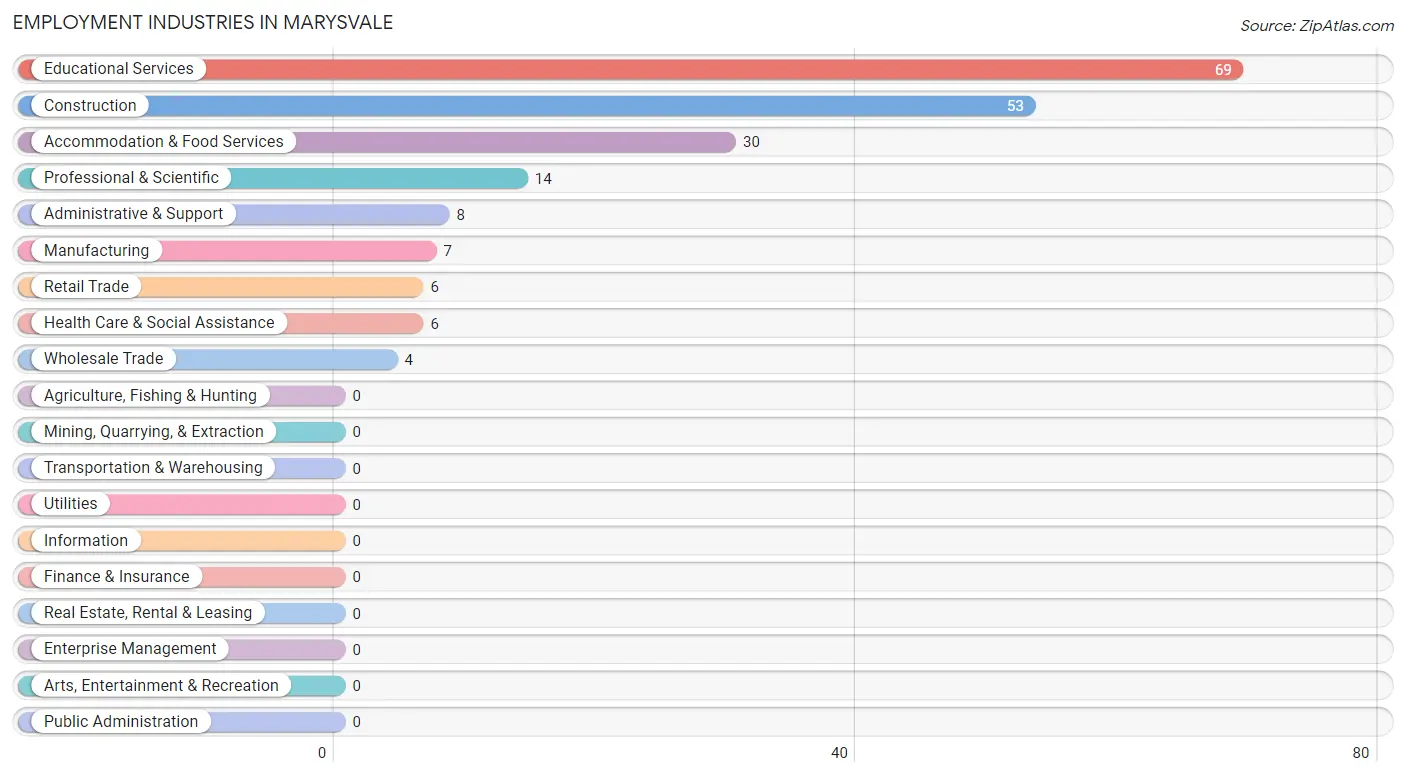
The major employment industries in Marysvale include Educational Services (69 | 34.2%), Construction (53 | 26.2%), Accommodation & Food Services (30 | 14.8%), Professional & Scientific (14 | 6.9%), and Administrative & Support (8 | 4.0%).
Employment Industries by Sex in Marysvale
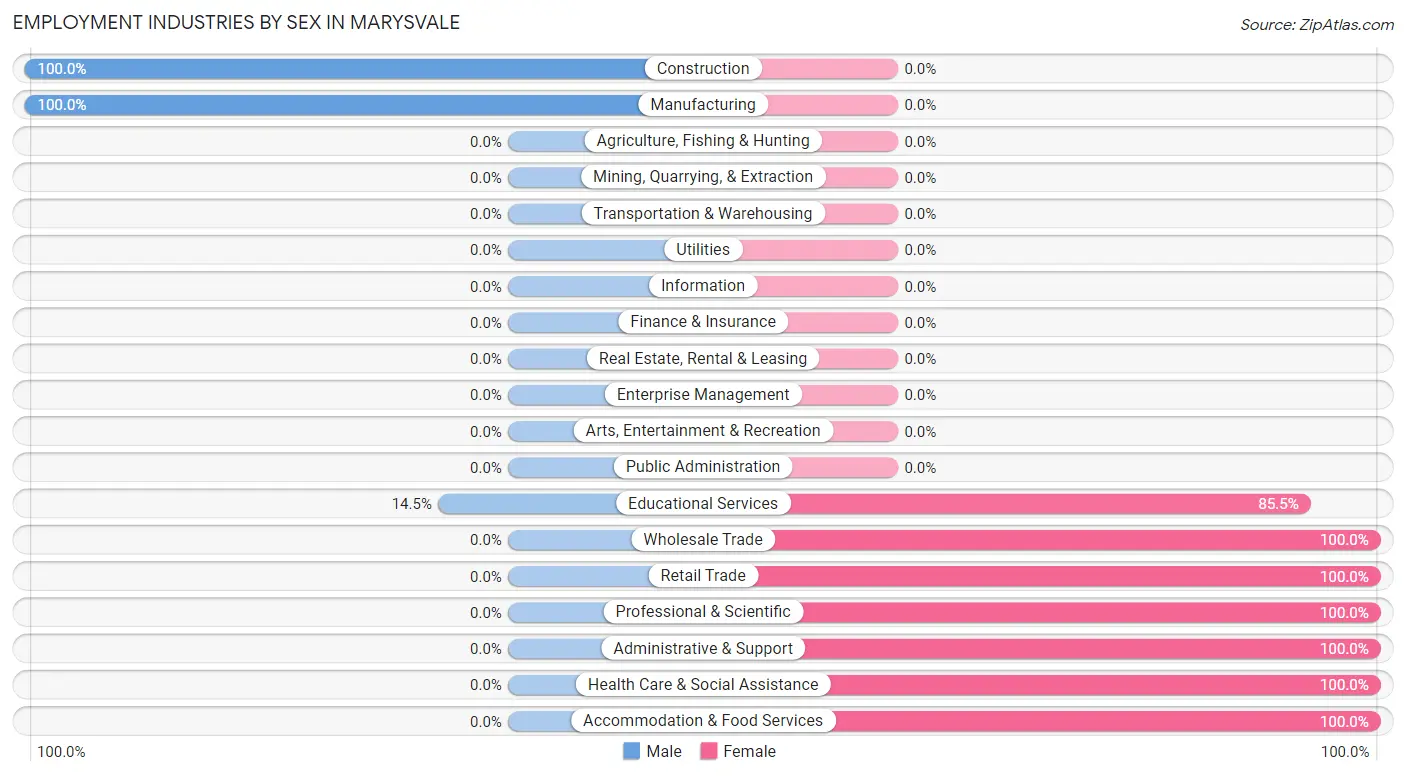
The Marysvale industries that see more men than women are Construction (100.0%), Manufacturing (100.0%), and Educational Services (14.5%), whereas the industries that tend to have a higher number of women are Wholesale Trade (100.0%), Retail Trade (100.0%), and Professional & Scientific (100.0%).
| Industry | Male | Female |
| Agriculture, Fishing & Hunting | 0 (0.0%) | 0 (0.0%) |
| Mining, Quarrying, & Extraction | 0 (0.0%) | 0 (0.0%) |
| Construction | 53 (100.0%) | 0 (0.0%) |
| Manufacturing | 7 (100.0%) | 0 (0.0%) |
| Wholesale Trade | 0 (0.0%) | 4 (100.0%) |
| Retail Trade | 0 (0.0%) | 6 (100.0%) |
| Transportation & Warehousing | 0 (0.0%) | 0 (0.0%) |
| Utilities | 0 (0.0%) | 0 (0.0%) |
| Information | 0 (0.0%) | 0 (0.0%) |
| Finance & Insurance | 0 (0.0%) | 0 (0.0%) |
| Real Estate, Rental & Leasing | 0 (0.0%) | 0 (0.0%) |
| Professional & Scientific | 0 (0.0%) | 14 (100.0%) |
| Enterprise Management | 0 (0.0%) | 0 (0.0%) |
| Administrative & Support | 0 (0.0%) | 8 (100.0%) |
| Educational Services | 10 (14.5%) | 59 (85.5%) |
| Health Care & Social Assistance | 0 (0.0%) | 6 (100.0%) |
| Arts, Entertainment & Recreation | 0 (0.0%) | 0 (0.0%) |
| Accommodation & Food Services | 0 (0.0%) | 30 (100.0%) |
| Public Administration | 0 (0.0%) | 0 (0.0%) |
| Total | 75 (37.1%) | 127 (62.9%) |
Education in Marysvale
School Enrollment in Marysvale
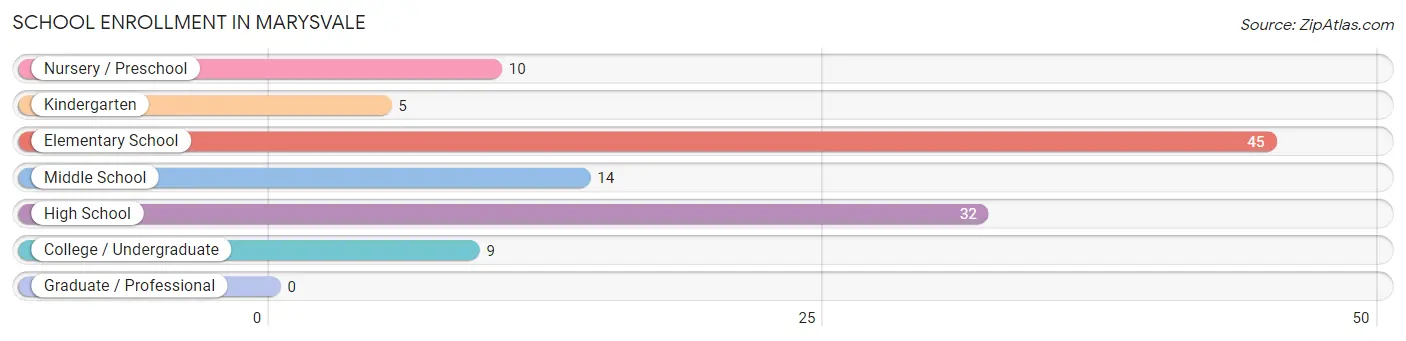
The most common levels of schooling among the 115 students in Marysvale are elementary school (45 | 39.1%), high school (32 | 27.8%), and middle school (14 | 12.2%).
| School Level | # Students | % Students |
| Nursery / Preschool | 10 | 8.7% |
| Kindergarten | 5 | 4.3% |
| Elementary School | 45 | 39.1% |
| Middle School | 14 | 12.2% |
| High School | 32 | 27.8% |
| College / Undergraduate | 9 | 7.8% |
| Graduate / Professional | 0 | 0.0% |
| Total | 115 | 100.0% |
School Enrollment by Age by Funding Source in Marysvale
| Age Bracket | Public School | Private School |
| 3 to 4 Year Olds | 10 (100.0%) | 0 (0.0%) |
| 5 to 9 Year Old | 50 (100.0%) | 0 (0.0%) |
| 10 to 14 Year Olds | 27 (100.0%) | 0 (0.0%) |
| 15 to 17 Year Olds | 11 (100.0%) | 0 (0.0%) |
| 18 to 19 Year Olds | 8 (100.0%) | 0 (0.0%) |
| 20 to 24 Year Olds | 0 (0.0%) | 0 (0.0%) |
| 25 to 34 Year Olds | 0 (0.0%) | 0 (0.0%) |
| 35 Years and over | 9 (100.0%) | 0 (0.0%) |
| Total | 115 (100.0%) | 0 (0.0%) |
Educational Attainment by Field of Study in Marysvale
Science & technology (61 | 57.6%), education (21 | 19.8%), social sciences (10 | 9.4%), liberal arts & history (8 | 7.5%), and computers & mathematics (6 | 5.7%) are the most common fields of study among 106 individuals in Marysvale who have obtained a bachelor's degree or higher.
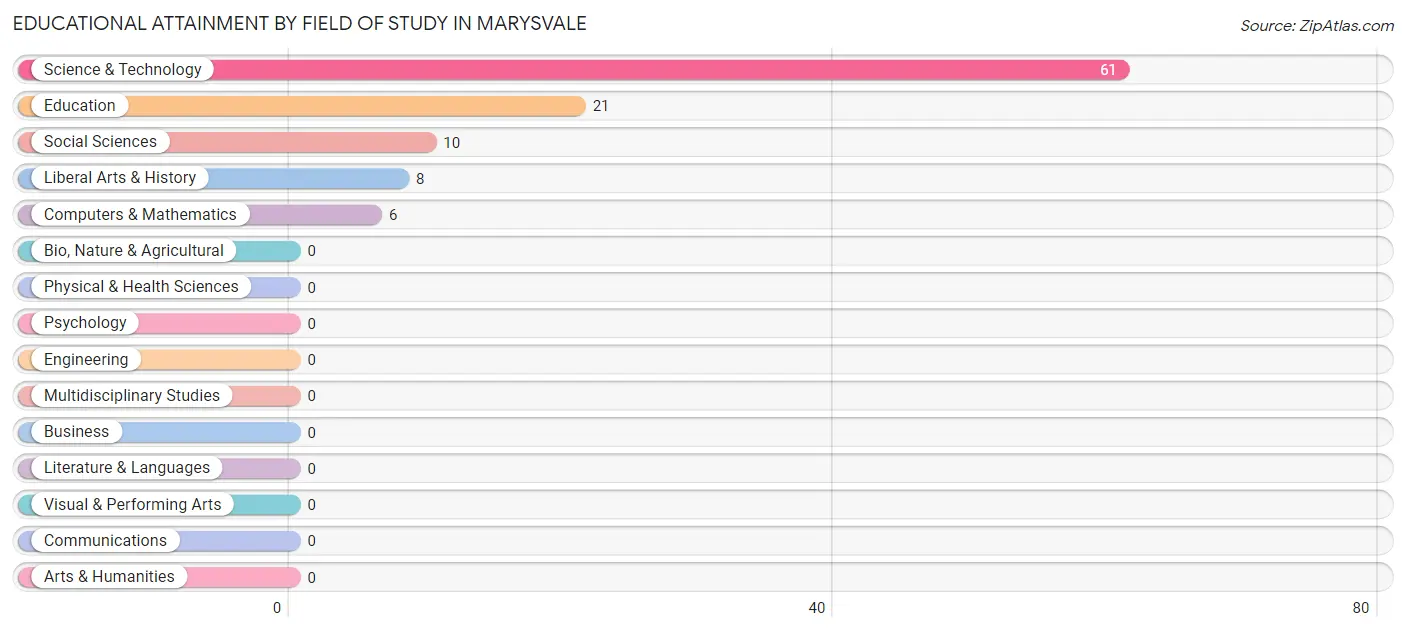
| Field of Study | # Graduates | % Graduates |
| Computers & Mathematics | 6 | 5.7% |
| Bio, Nature & Agricultural | 0 | 0.0% |
| Physical & Health Sciences | 0 | 0.0% |
| Psychology | 0 | 0.0% |
| Social Sciences | 10 | 9.4% |
| Engineering | 0 | 0.0% |
| Multidisciplinary Studies | 0 | 0.0% |
| Science & Technology | 61 | 57.6% |
| Business | 0 | 0.0% |
| Education | 21 | 19.8% |
| Literature & Languages | 0 | 0.0% |
| Liberal Arts & History | 8 | 7.5% |
| Visual & Performing Arts | 0 | 0.0% |
| Communications | 0 | 0.0% |
| Arts & Humanities | 0 | 0.0% |
| Total | 106 | 100.0% |
Transportation & Commute in Marysvale
Vehicle Availability by Sex in Marysvale
The most prevalent vehicle ownership categories in Marysvale are males with 1 vehicle (38, accounting for 54.3%) and females with 1 vehicle (27, making up 29.9%).
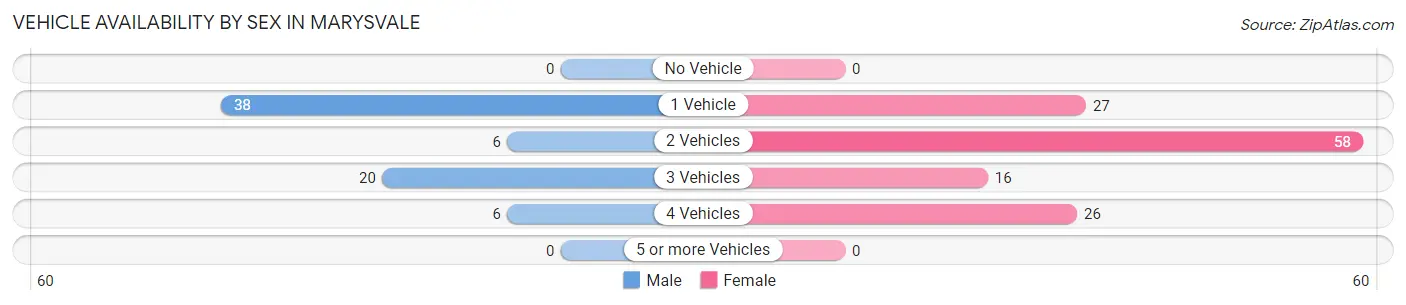
| Vehicles Available | Male | Female |
| No Vehicle | 0 (0.0%) | 0 (0.0%) |
| 1 Vehicle | 38 (54.3%) | 27 (21.3%) |
| 2 Vehicles | 6 (8.6%) | 58 (45.7%) |
| 3 Vehicles | 20 (28.6%) | 16 (12.6%) |
| 4 Vehicles | 6 (8.6%) | 26 (20.5%) |
| 5 or more Vehicles | 0 (0.0%) | 0 (0.0%) |
| Total | 70 (100.0%) | 127 (100.0%) |
Commute Time in Marysvale
The most frequently occuring commute durations in Marysvale are 30 to 34 minutes (64 commuters, 38.6%), 15 to 19 minutes (38 commuters, 22.9%), and less than 5 minutes (37 commuters, 22.3%).
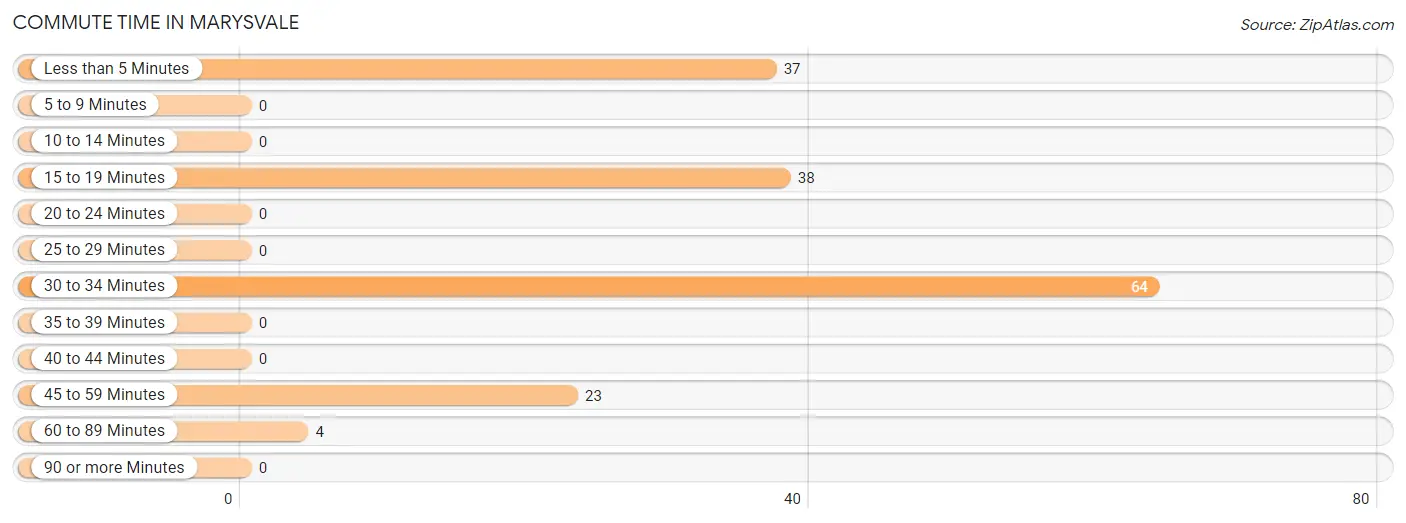
| Commute Time | # Commuters | % Commuters |
| Less than 5 Minutes | 37 | 22.3% |
| 5 to 9 Minutes | 0 | 0.0% |
| 10 to 14 Minutes | 0 | 0.0% |
| 15 to 19 Minutes | 38 | 22.9% |
| 20 to 24 Minutes | 0 | 0.0% |
| 25 to 29 Minutes | 0 | 0.0% |
| 30 to 34 Minutes | 64 | 38.6% |
| 35 to 39 Minutes | 0 | 0.0% |
| 40 to 44 Minutes | 0 | 0.0% |
| 45 to 59 Minutes | 23 | 13.9% |
| 60 to 89 Minutes | 4 | 2.4% |
| 90 or more Minutes | 0 | 0.0% |
Commute Time by Sex in Marysvale
The most common commute times in Marysvale are 15 to 19 minutes (35 commuters, 53.8%) for males and 30 to 34 minutes (54 commuters, 53.5%) for females.
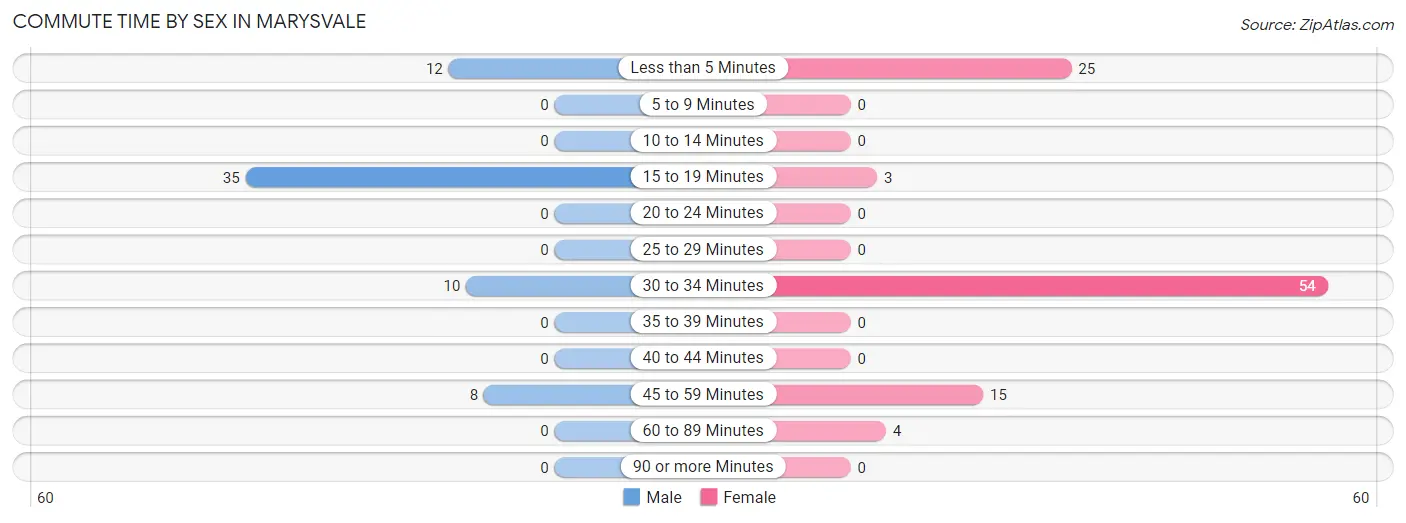
| Commute Time | Male | Female |
| Less than 5 Minutes | 12 (18.5%) | 25 (24.7%) |
| 5 to 9 Minutes | 0 (0.0%) | 0 (0.0%) |
| 10 to 14 Minutes | 0 (0.0%) | 0 (0.0%) |
| 15 to 19 Minutes | 35 (53.8%) | 3 (3.0%) |
| 20 to 24 Minutes | 0 (0.0%) | 0 (0.0%) |
| 25 to 29 Minutes | 0 (0.0%) | 0 (0.0%) |
| 30 to 34 Minutes | 10 (15.4%) | 54 (53.5%) |
| 35 to 39 Minutes | 0 (0.0%) | 0 (0.0%) |
| 40 to 44 Minutes | 0 (0.0%) | 0 (0.0%) |
| 45 to 59 Minutes | 8 (12.3%) | 15 (14.8%) |
| 60 to 89 Minutes | 0 (0.0%) | 4 (4.0%) |
| 90 or more Minutes | 0 (0.0%) | 0 (0.0%) |
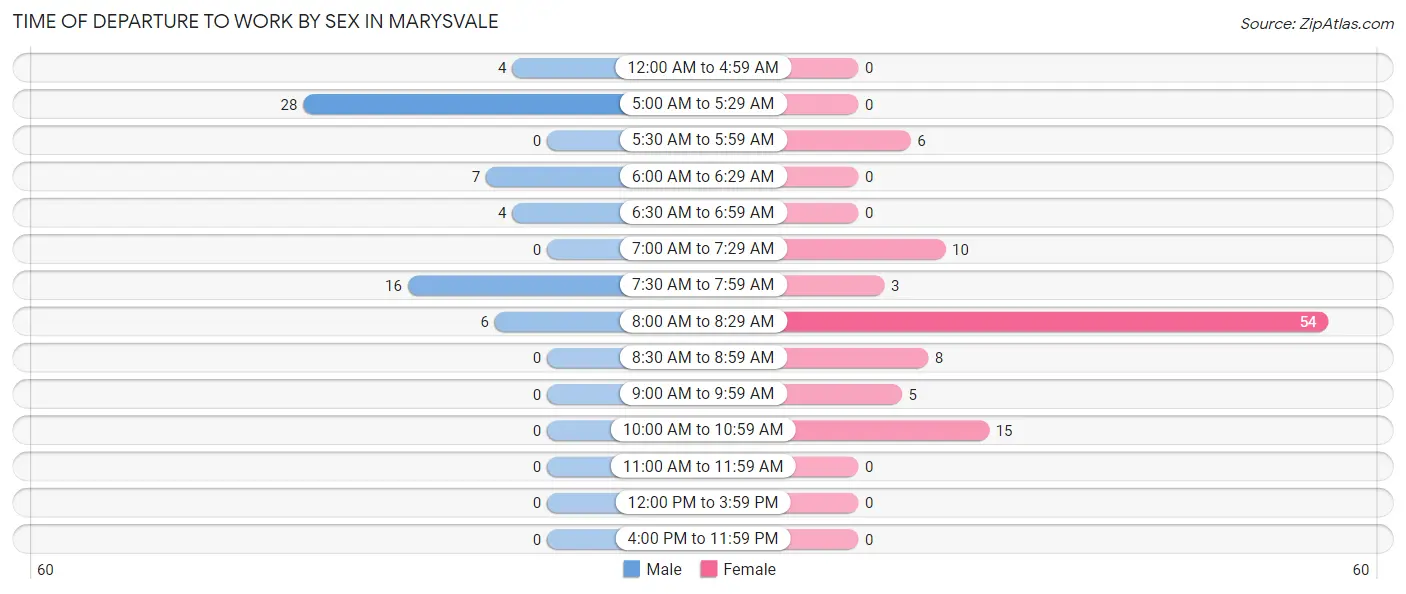
Time of Departure to Work by Sex in Marysvale
The most frequent times of departure to work in Marysvale are 5:00 AM to 5:29 AM (28, 43.1%) for males and 8:00 AM to 8:29 AM (54, 53.5%) for females.
| Time of Departure | Male | Female |
| 12:00 AM to 4:59 AM | 4 (6.1%) | 0 (0.0%) |
| 5:00 AM to 5:29 AM | 28 (43.1%) | 0 (0.0%) |
| 5:30 AM to 5:59 AM | 0 (0.0%) | 6 (5.9%) |
| 6:00 AM to 6:29 AM | 7 (10.8%) | 0 (0.0%) |
| 6:30 AM to 6:59 AM | 4 (6.1%) | 0 (0.0%) |
| 7:00 AM to 7:29 AM | 0 (0.0%) | 10 (9.9%) |
| 7:30 AM to 7:59 AM | 16 (24.6%) | 3 (3.0%) |
| 8:00 AM to 8:29 AM | 6 (9.2%) | 54 (53.5%) |
| 8:30 AM to 8:59 AM | 0 (0.0%) | 8 (7.9%) |
| 9:00 AM to 9:59 AM | 0 (0.0%) | 5 (5.0%) |
| 10:00 AM to 10:59 AM | 0 (0.0%) | 15 (14.8%) |
| 11:00 AM to 11:59 AM | 0 (0.0%) | 0 (0.0%) |
| 12:00 PM to 3:59 PM | 0 (0.0%) | 0 (0.0%) |
| 4:00 PM to 11:59 PM | 0 (0.0%) | 0 (0.0%) |
| Total | 65 (100.0%) | 101 (100.0%) |
Housing Occupancy in Marysvale
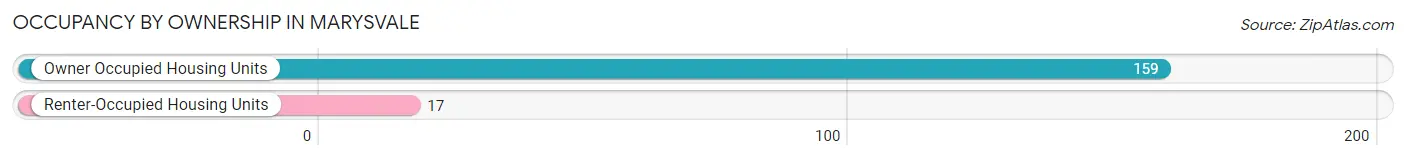
Occupancy by Ownership in Marysvale
Of the total 176 dwellings in Marysvale, owner-occupied units account for 159 (90.3%), while renter-occupied units make up 17 (9.7%).
| Occupancy | # Housing Units | % Housing Units |
| Owner Occupied Housing Units | 159 | 90.3% |
| Renter-Occupied Housing Units | 17 | 9.7% |
| Total Occupied Housing Units | 176 | 100.0% |
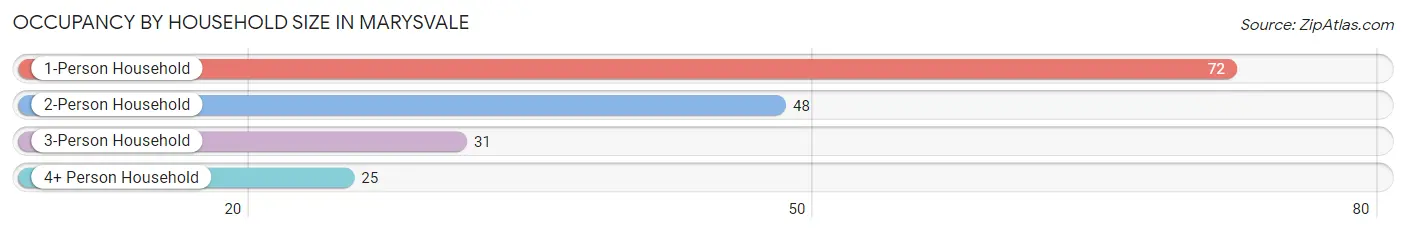
Occupancy by Household Size in Marysvale
| Household Size | # Housing Units | % Housing Units |
| 1-Person Household | 72 | 40.9% |
| 2-Person Household | 48 | 27.3% |
| 3-Person Household | 31 | 17.6% |
| 4+ Person Household | 25 | 14.2% |
| Total Housing Units | 176 | 100.0% |
Occupancy by Ownership by Household Size in Marysvale
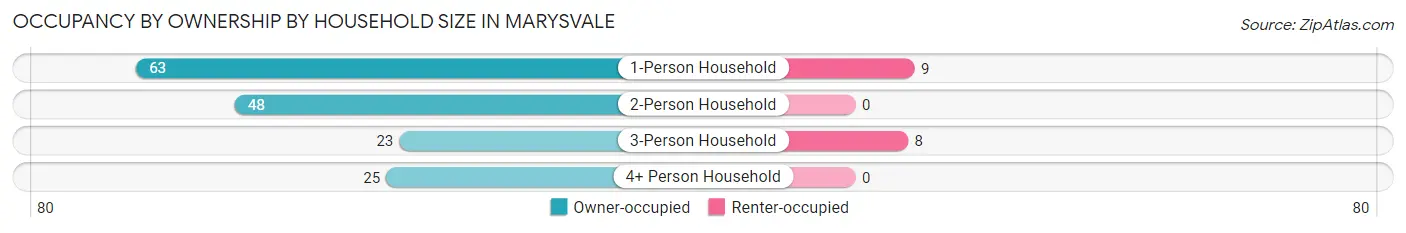
| Household Size | Owner-occupied | Renter-occupied |
| 1-Person Household | 63 (87.5%) | 9 (12.5%) |
| 2-Person Household | 48 (100.0%) | 0 (0.0%) |
| 3-Person Household | 23 (74.2%) | 8 (25.8%) |
| 4+ Person Household | 25 (100.0%) | 0 (0.0%) |
| Total Housing Units | 159 (90.3%) | 17 (9.7%) |
Occupancy by Educational Attainment in Marysvale
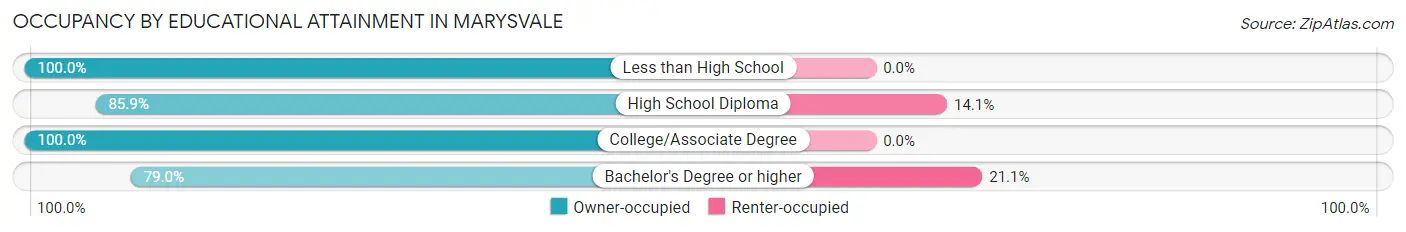
| Household Size | Owner-occupied | Renter-occupied |
| Less than High School | 42 (100.0%) | 0 (0.0%) |
| High School Diploma | 55 (85.9%) | 9 (14.1%) |
| College/Associate Degree | 32 (100.0%) | 0 (0.0%) |
| Bachelor's Degree or higher | 30 (78.9%) | 8 (21.0%) |
Occupancy by Age of Householder in Marysvale
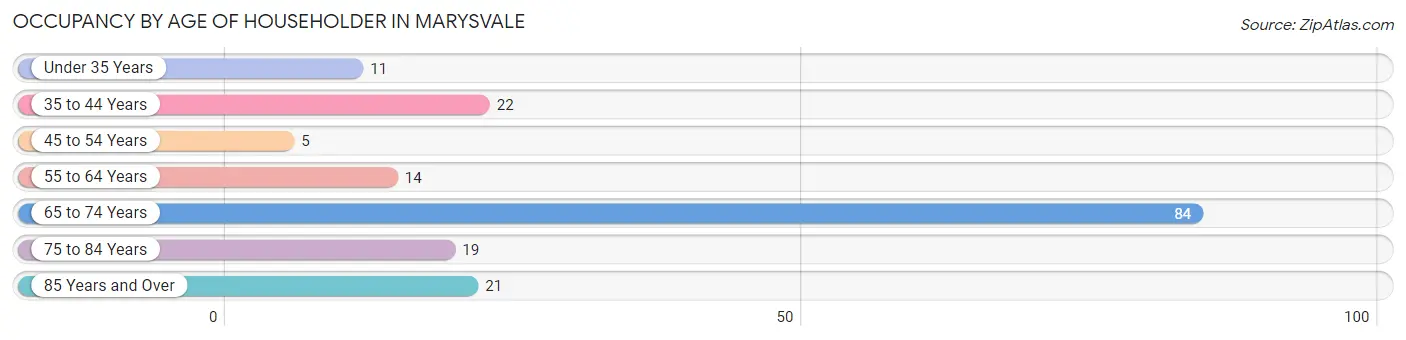
| Age Bracket | # Households | % Households |
| Under 35 Years | 11 | 6.2% |
| 35 to 44 Years | 22 | 12.5% |
| 45 to 54 Years | 5 | 2.8% |
| 55 to 64 Years | 14 | 8.0% |
| 65 to 74 Years | 84 | 47.7% |
| 75 to 84 Years | 19 | 10.8% |
| 85 Years and Over | 21 | 11.9% |
| Total | 176 | 100.0% |
Housing Finances in Marysvale
Median Income by Occupancy in Marysvale
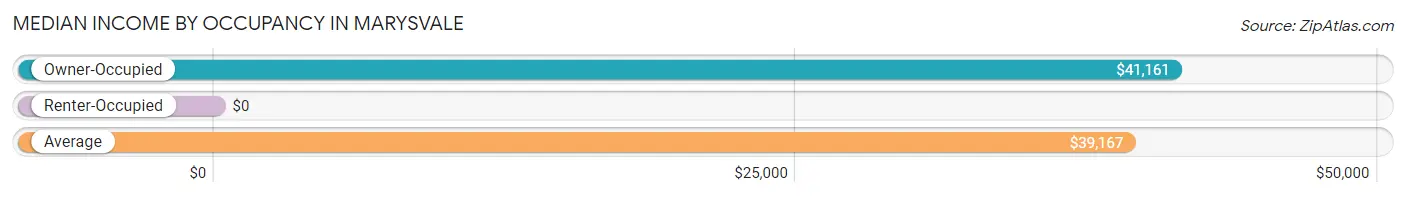
| Occupancy Type | # Households | Median Income |
| Owner-Occupied | 159 (90.3%) | $41,161 |
| Renter-Occupied | 17 (9.7%) | $0 |
| Average | 176 (100.0%) | $39,167 |
Occupancy by Householder Income Bracket in Marysvale
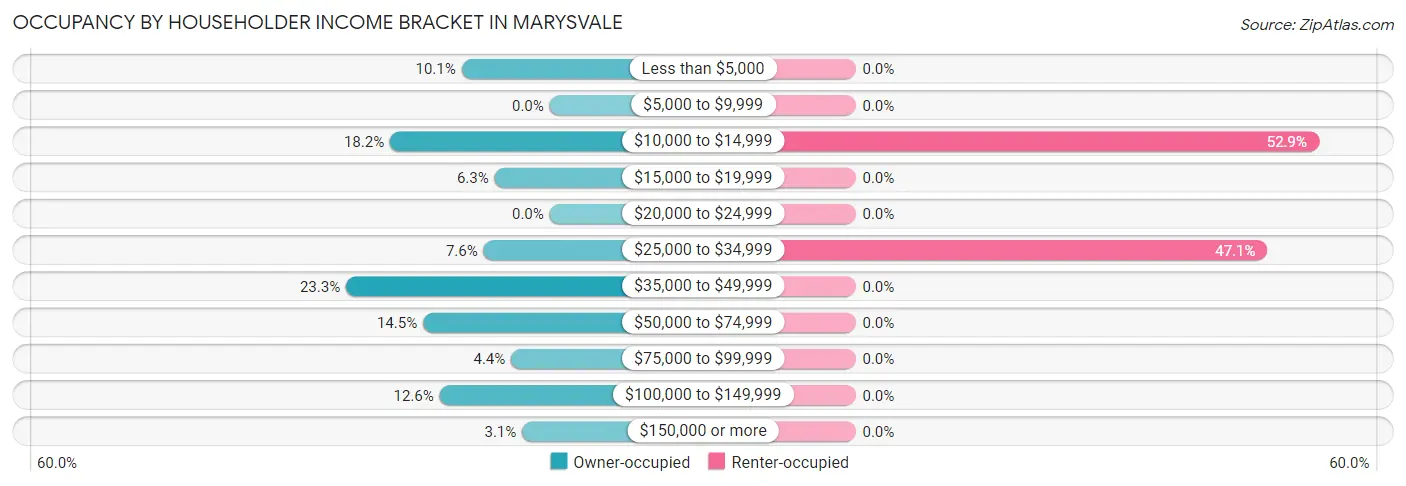
| Income Bracket | Owner-occupied | Renter-occupied |
| Less than $5,000 | 16 (10.1%) | 0 (0.0%) |
| $5,000 to $9,999 | 0 (0.0%) | 0 (0.0%) |
| $10,000 to $14,999 | 29 (18.2%) | 9 (52.9%) |
| $15,000 to $19,999 | 10 (6.3%) | 0 (0.0%) |
| $20,000 to $24,999 | 0 (0.0%) | 0 (0.0%) |
| $25,000 to $34,999 | 12 (7.5%) | 8 (47.1%) |
| $35,000 to $49,999 | 37 (23.3%) | 0 (0.0%) |
| $50,000 to $74,999 | 23 (14.5%) | 0 (0.0%) |
| $75,000 to $99,999 | 7 (4.4%) | 0 (0.0%) |
| $100,000 to $149,999 | 20 (12.6%) | 0 (0.0%) |
| $150,000 or more | 5 (3.1%) | 0 (0.0%) |
| Total | 159 (100.0%) | 17 (100.0%) |
Monthly Housing Cost Tiers in Marysvale
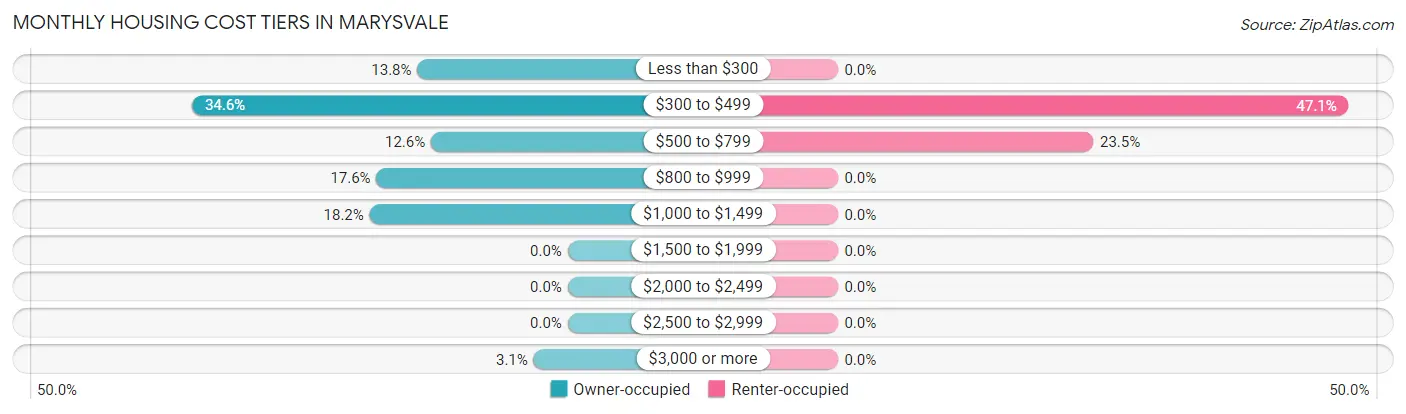
| Monthly Cost | Owner-occupied | Renter-occupied |
| Less than $300 | 22 (13.8%) | 0 (0.0%) |
| $300 to $499 | 55 (34.6%) | 8 (47.1%) |
| $500 to $799 | 20 (12.6%) | 4 (23.5%) |
| $800 to $999 | 28 (17.6%) | 0 (0.0%) |
| $1,000 to $1,499 | 29 (18.2%) | 0 (0.0%) |
| $1,500 to $1,999 | 0 (0.0%) | 0 (0.0%) |
| $2,000 to $2,499 | 0 (0.0%) | 0 (0.0%) |
| $2,500 to $2,999 | 0 (0.0%) | 0 (0.0%) |
| $3,000 or more | 5 (3.1%) | 0 (0.0%) |
| Total | 159 (100.0%) | 17 (100.0%) |
Physical Housing Characteristics in Marysvale
Housing Structures in Marysvale
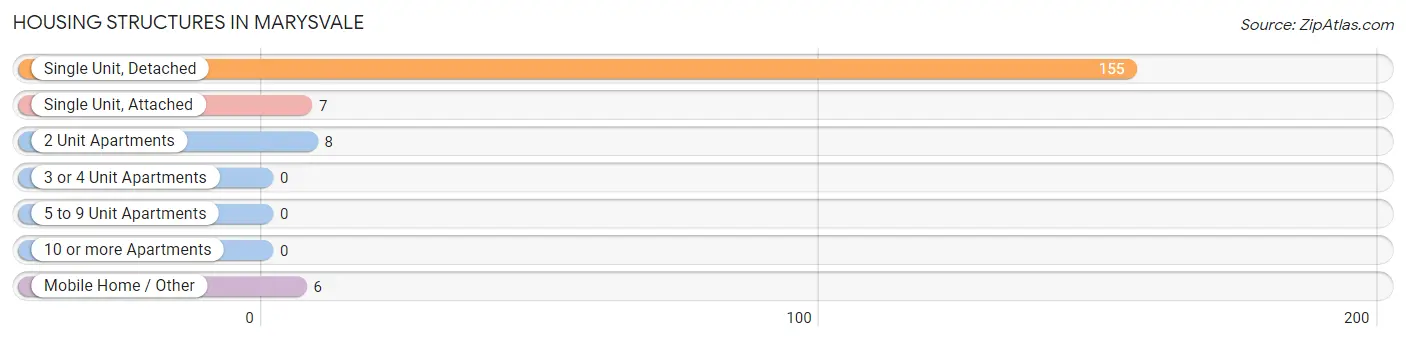
| Structure Type | # Housing Units | % Housing Units |
| Single Unit, Detached | 155 | 88.1% |
| Single Unit, Attached | 7 | 4.0% |
| 2 Unit Apartments | 8 | 4.5% |
| 3 or 4 Unit Apartments | 0 | 0.0% |
| 5 to 9 Unit Apartments | 0 | 0.0% |
| 10 or more Apartments | 0 | 0.0% |
| Mobile Home / Other | 6 | 3.4% |
| Total | 176 | 100.0% |
Housing Structures by Occupancy in Marysvale
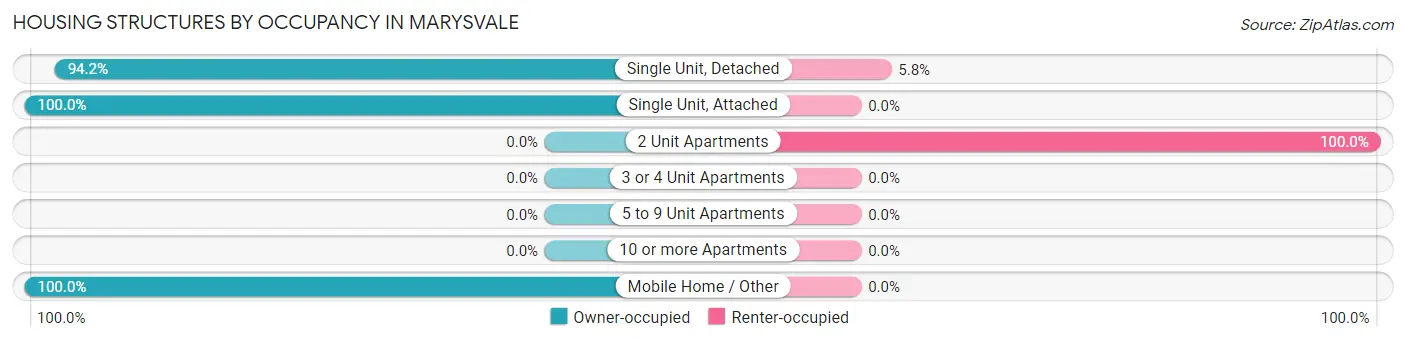
| Structure Type | Owner-occupied | Renter-occupied |
| Single Unit, Detached | 146 (94.2%) | 9 (5.8%) |
| Single Unit, Attached | 7 (100.0%) | 0 (0.0%) |
| 2 Unit Apartments | 0 (0.0%) | 8 (100.0%) |
| 3 or 4 Unit Apartments | 0 (0.0%) | 0 (0.0%) |
| 5 to 9 Unit Apartments | 0 (0.0%) | 0 (0.0%) |
| 10 or more Apartments | 0 (0.0%) | 0 (0.0%) |
| Mobile Home / Other | 6 (100.0%) | 0 (0.0%) |
| Total | 159 (90.3%) | 17 (9.7%) |
Housing Structures by Number of Rooms in Marysvale
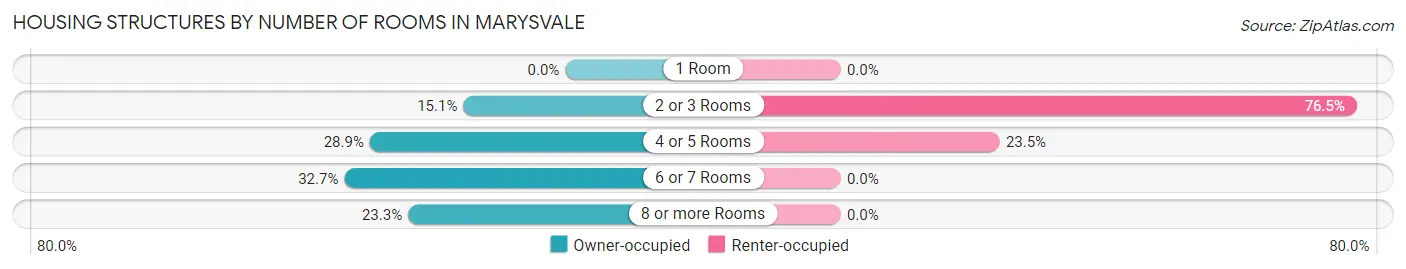
| Number of Rooms | Owner-occupied | Renter-occupied |
| 1 Room | 0 (0.0%) | 0 (0.0%) |
| 2 or 3 Rooms | 24 (15.1%) | 13 (76.5%) |
| 4 or 5 Rooms | 46 (28.9%) | 4 (23.5%) |
| 6 or 7 Rooms | 52 (32.7%) | 0 (0.0%) |
| 8 or more Rooms | 37 (23.3%) | 0 (0.0%) |
| Total | 159 (100.0%) | 17 (100.0%) |
Housing Structure by Heating Type in Marysvale
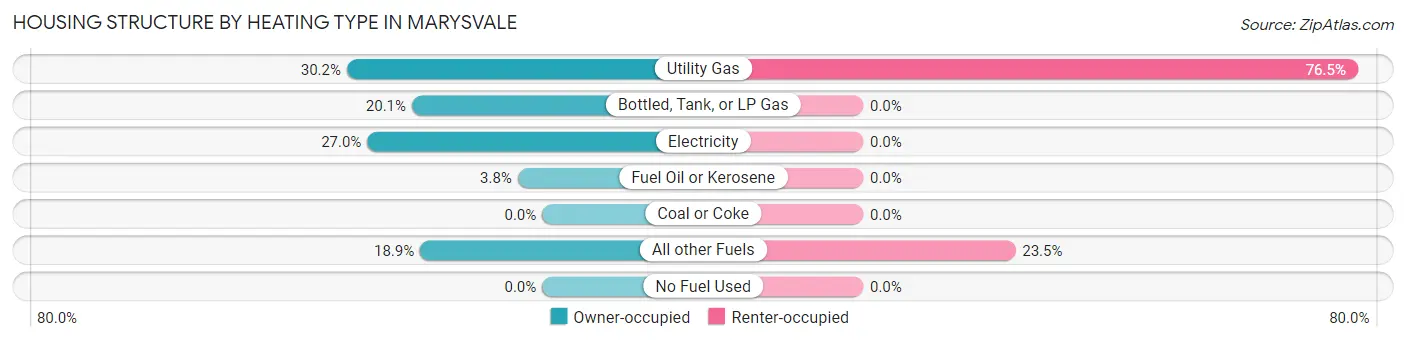
| Heating Type | Owner-occupied | Renter-occupied |
| Utility Gas | 48 (30.2%) | 13 (76.5%) |
| Bottled, Tank, or LP Gas | 32 (20.1%) | 0 (0.0%) |
| Electricity | 43 (27.0%) | 0 (0.0%) |
| Fuel Oil or Kerosene | 6 (3.8%) | 0 (0.0%) |
| Coal or Coke | 0 (0.0%) | 0 (0.0%) |
| All other Fuels | 30 (18.9%) | 4 (23.5%) |
| No Fuel Used | 0 (0.0%) | 0 (0.0%) |
| Total | 159 (100.0%) | 17 (100.0%) |
Household Vehicle Usage in Marysvale
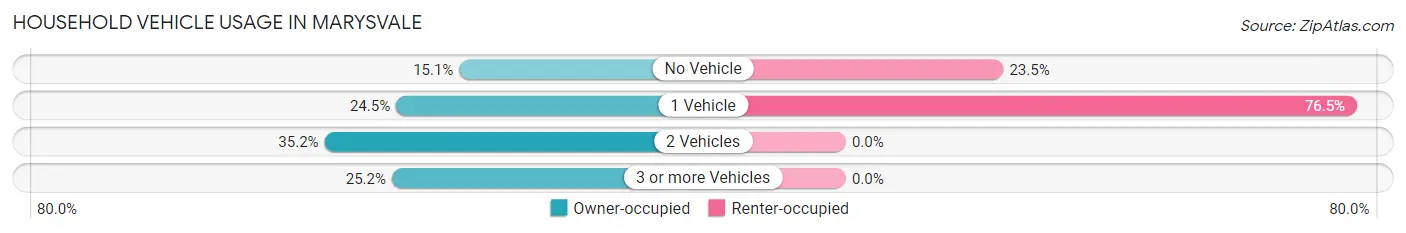
| Vehicles per Household | Owner-occupied | Renter-occupied |
| No Vehicle | 24 (15.1%) | 4 (23.5%) |
| 1 Vehicle | 39 (24.5%) | 13 (76.5%) |
| 2 Vehicles | 56 (35.2%) | 0 (0.0%) |
| 3 or more Vehicles | 40 (25.2%) | 0 (0.0%) |
| Total | 159 (100.0%) | 17 (100.0%) |
Real Estate & Mortgages in Marysvale
Real Estate and Mortgage Overview in Marysvale
| Characteristic | Without Mortgage | With Mortgage |
| Housing Units | 97 | 62 |
| Median Property Value | $272,100 | $280,000 |
| Median Household Income | - | - |
| Monthly Housing Costs | $387 | $5 |
| Real Estate Taxes | $1,440 | $0 |
Property Value by Mortgage Status in Marysvale
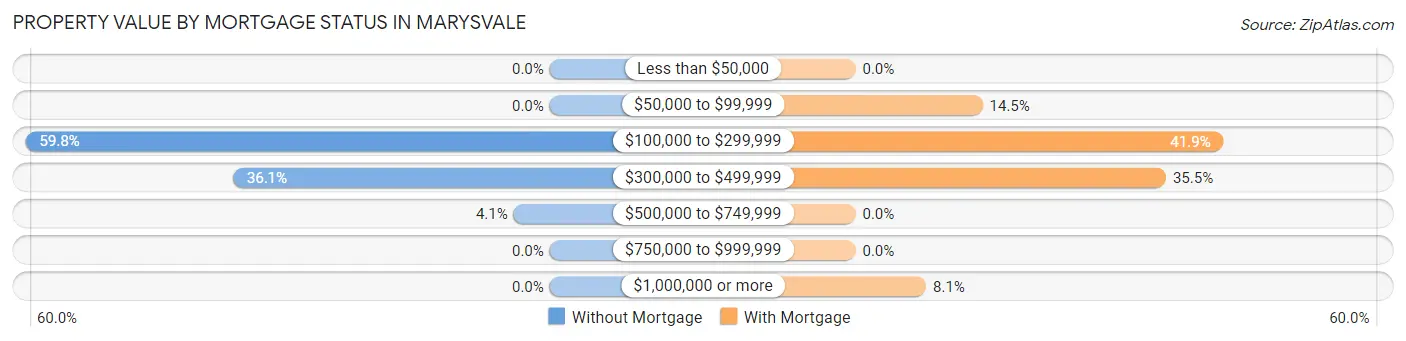
| Property Value | Without Mortgage | With Mortgage |
| Less than $50,000 | 0 (0.0%) | 0 (0.0%) |
| $50,000 to $99,999 | 0 (0.0%) | 9 (14.5%) |
| $100,000 to $299,999 | 58 (59.8%) | 26 (41.9%) |
| $300,000 to $499,999 | 35 (36.1%) | 22 (35.5%) |
| $500,000 to $749,999 | 4 (4.1%) | 0 (0.0%) |
| $750,000 to $999,999 | 0 (0.0%) | 0 (0.0%) |
| $1,000,000 or more | 0 (0.0%) | 5 (8.1%) |
| Total | 97 (100.0%) | 62 (100.0%) |
Household Income by Mortgage Status in Marysvale
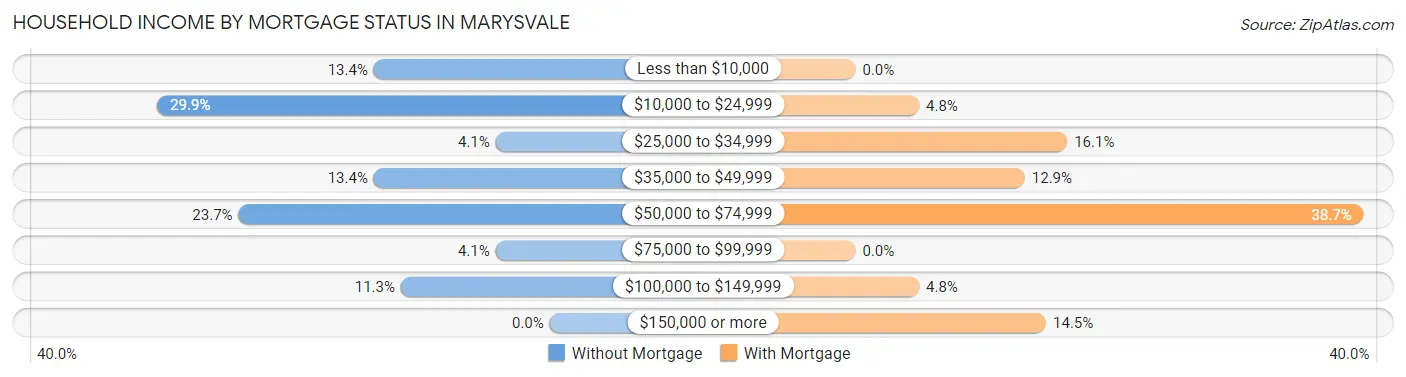
| Household Income | Without Mortgage | With Mortgage |
| Less than $10,000 | 13 (13.4%) | 0 (0.0%) |
| $10,000 to $24,999 | 29 (29.9%) | 3 (4.8%) |
| $25,000 to $34,999 | 4 (4.1%) | 10 (16.1%) |
| $35,000 to $49,999 | 13 (13.4%) | 8 (12.9%) |
| $50,000 to $74,999 | 23 (23.7%) | 24 (38.7%) |
| $75,000 to $99,999 | 4 (4.1%) | 0 (0.0%) |
| $100,000 to $149,999 | 11 (11.3%) | 3 (4.8%) |
| $150,000 or more | 0 (0.0%) | 9 (14.5%) |
| Total | 97 (100.0%) | 62 (100.0%) |
Property Value to Household Income Ratio in Marysvale
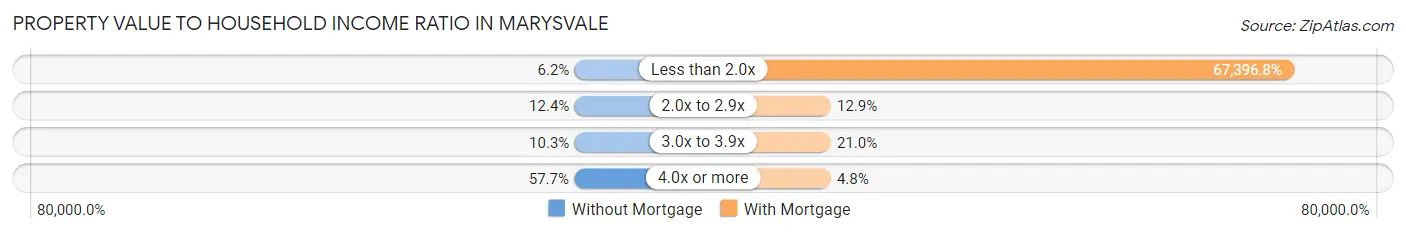
| Value-to-Income Ratio | Without Mortgage | With Mortgage |
| Less than 2.0x | 6 (6.2%) | 41,786 (67,396.8%) |
| 2.0x to 2.9x | 12 (12.4%) | 8 (12.9%) |
| 3.0x to 3.9x | 10 (10.3%) | 13 (21.0%) |
| 4.0x or more | 56 (57.7%) | 3 (4.8%) |
| Total | 97 (100.0%) | 62 (100.0%) |
Real Estate Taxes by Mortgage Status in Marysvale
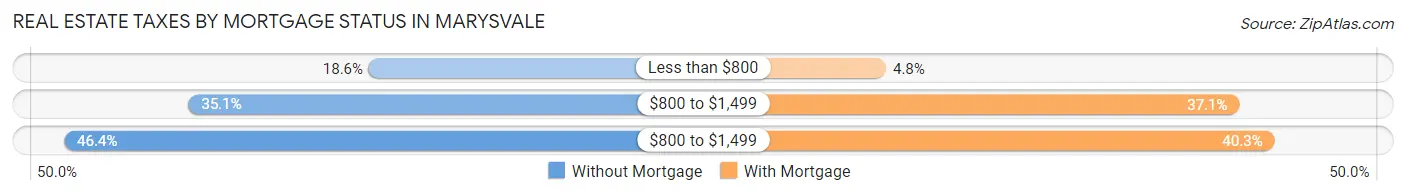
| Property Taxes | Without Mortgage | With Mortgage |
| Less than $800 | 18 (18.6%) | 3 (4.8%) |
| $800 to $1,499 | 34 (35.0%) | 23 (37.1%) |
| $800 to $1,499 | 45 (46.4%) | 25 (40.3%) |
| Total | 97 (100.0%) | 62 (100.0%) |
Health & Disability in Marysvale
Health Insurance Coverage by Age in Marysvale
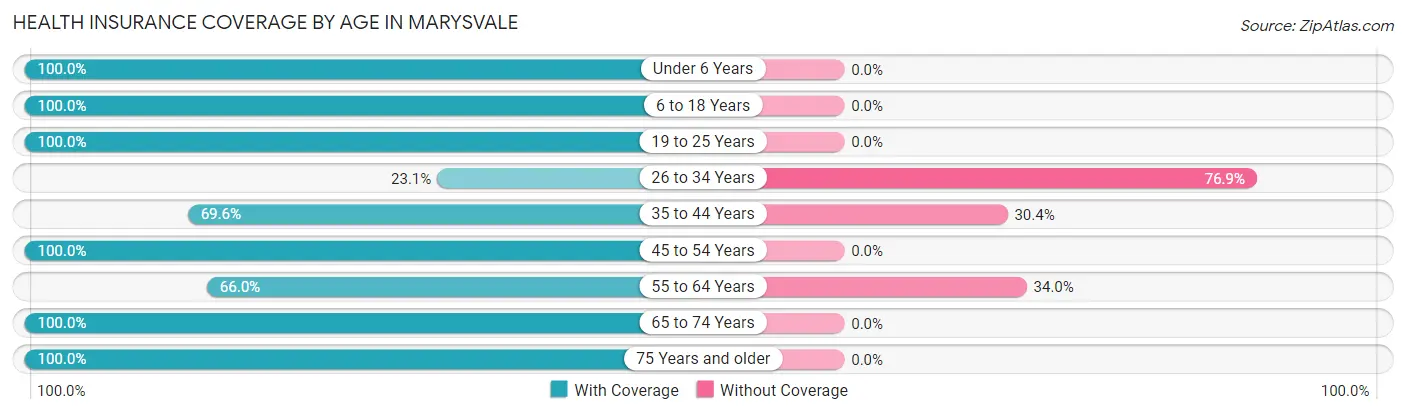
| Age Bracket | With Coverage | Without Coverage |
| Under 6 Years | 34 (100.0%) | 0 (0.0%) |
| 6 to 18 Years | 91 (100.0%) | 0 (0.0%) |
| 19 to 25 Years | 19 (100.0%) | 0 (0.0%) |
| 26 to 34 Years | 3 (23.1%) | 10 (76.9%) |
| 35 to 44 Years | 64 (69.6%) | 28 (30.4%) |
| 45 to 54 Years | 11 (100.0%) | 0 (0.0%) |
| 55 to 64 Years | 66 (66.0%) | 34 (34.0%) |
| 65 to 74 Years | 111 (100.0%) | 0 (0.0%) |
| 75 Years and older | 53 (100.0%) | 0 (0.0%) |
| Total | 452 (86.3%) | 72 (13.7%) |
Health Insurance Coverage by Citizenship Status in Marysvale
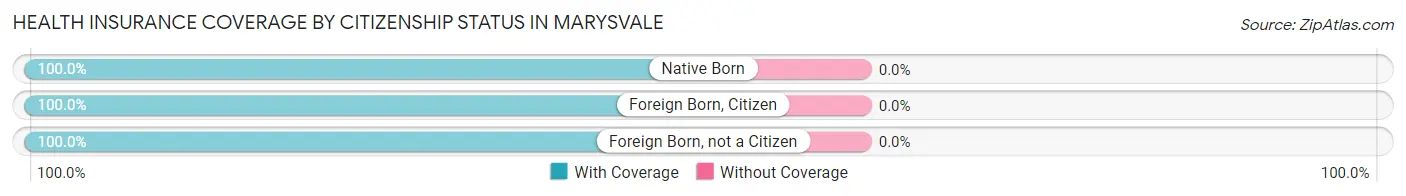
| Citizenship Status | With Coverage | Without Coverage |
| Native Born | 34 (100.0%) | 0 (0.0%) |
| Foreign Born, Citizen | 91 (100.0%) | 0 (0.0%) |
| Foreign Born, not a Citizen | 19 (100.0%) | 0 (0.0%) |
Health Insurance Coverage by Household Income in Marysvale
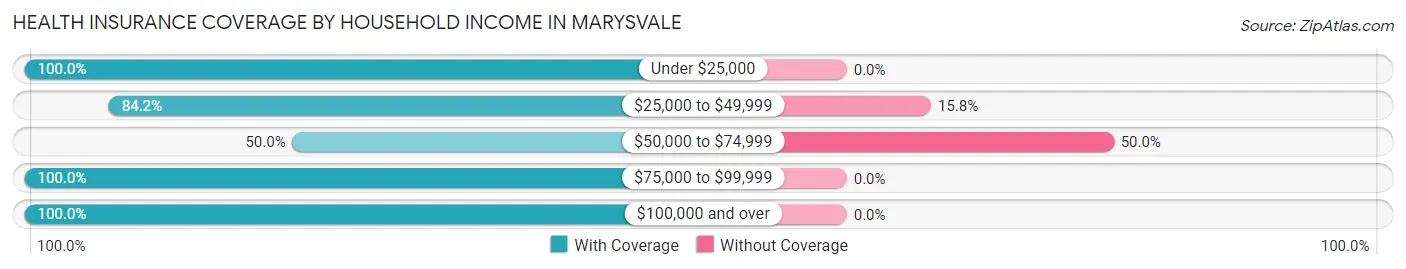
| Household Income | With Coverage | Without Coverage |
| Under $25,000 | 99 (100.0%) | 0 (0.0%) |
| $25,000 to $49,999 | 208 (84.2%) | 39 (15.8%) |
| $50,000 to $74,999 | 33 (50.0%) | 33 (50.0%) |
| $75,000 to $99,999 | 32 (100.0%) | 0 (0.0%) |
| $100,000 and over | 80 (100.0%) | 0 (0.0%) |
Public vs Private Health Insurance Coverage by Age in Marysvale
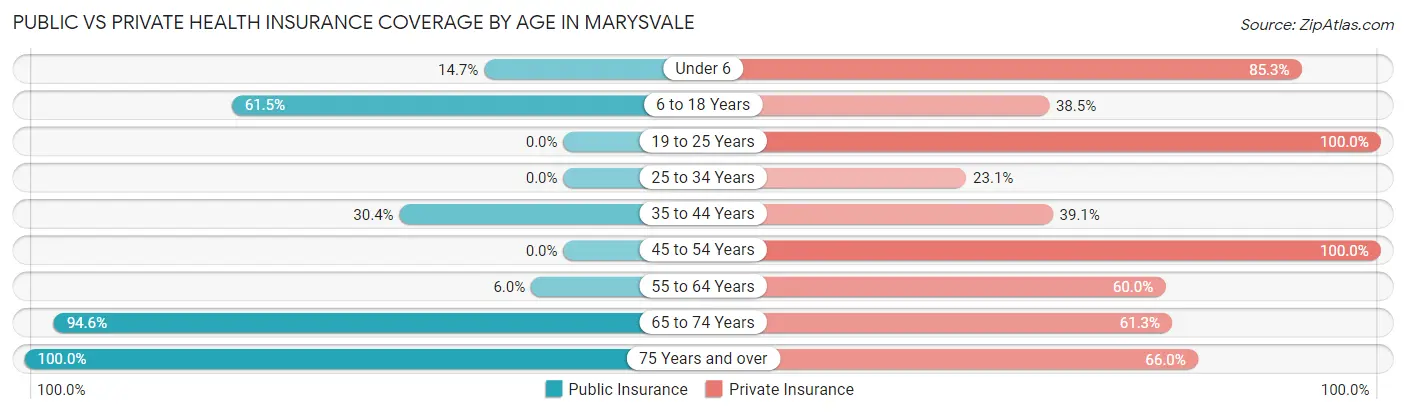
| Age Bracket | Public Insurance | Private Insurance |
| Under 6 | 5 (14.7%) | 29 (85.3%) |
| 6 to 18 Years | 56 (61.5%) | 35 (38.5%) |
| 19 to 25 Years | 0 (0.0%) | 19 (100.0%) |
| 25 to 34 Years | 0 (0.0%) | 3 (23.1%) |
| 35 to 44 Years | 28 (30.4%) | 36 (39.1%) |
| 45 to 54 Years | 0 (0.0%) | 11 (100.0%) |
| 55 to 64 Years | 6 (6.0%) | 60 (60.0%) |
| 65 to 74 Years | 105 (94.6%) | 68 (61.3%) |
| 75 Years and over | 53 (100.0%) | 35 (66.0%) |
| Total | 253 (48.3%) | 296 (56.5%) |
Disability Status by Sex by Age in Marysvale
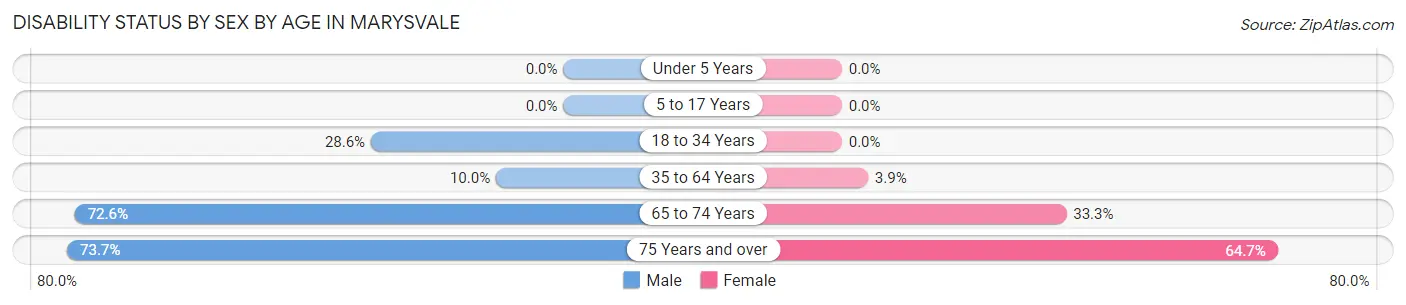
| Age Bracket | Male | Female |
| Under 5 Years | 0 (0.0%) | 0 (0.0%) |
| 5 to 17 Years | 0 (0.0%) | 0 (0.0%) |
| 18 to 34 Years | 4 (28.6%) | 0 (0.0%) |
| 35 to 64 Years | 10 (10.0%) | 4 (3.9%) |
| 65 to 74 Years | 37 (72.6%) | 20 (33.3%) |
| 75 Years and over | 14 (73.7%) | 22 (64.7%) |
Disability Class by Sex by Age in Marysvale
Disability Class: Hearing Difficulty
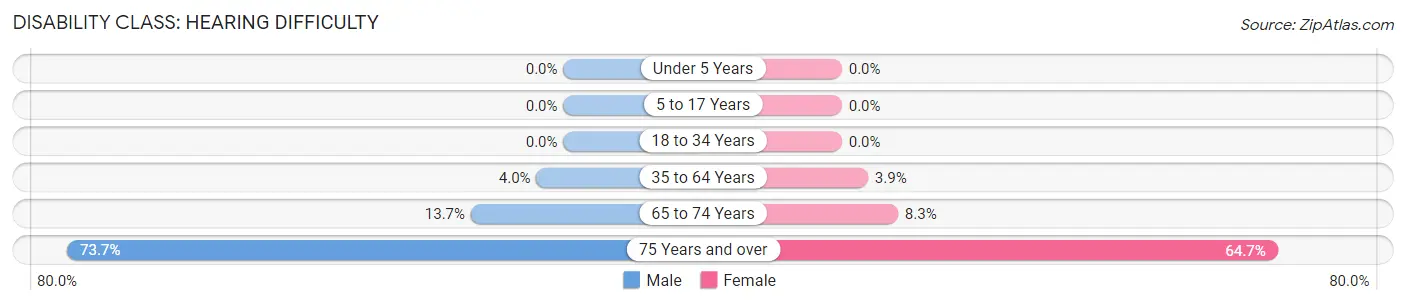
| Age Bracket | Male | Female |
| Under 5 Years | 0 (0.0%) | 0 (0.0%) |
| 5 to 17 Years | 0 (0.0%) | 0 (0.0%) |
| 18 to 34 Years | 0 (0.0%) | 0 (0.0%) |
| 35 to 64 Years | 4 (4.0%) | 4 (3.9%) |
| 65 to 74 Years | 7 (13.7%) | 5 (8.3%) |
| 75 Years and over | 14 (73.7%) | 22 (64.7%) |
Disability Class: Vision Difficulty
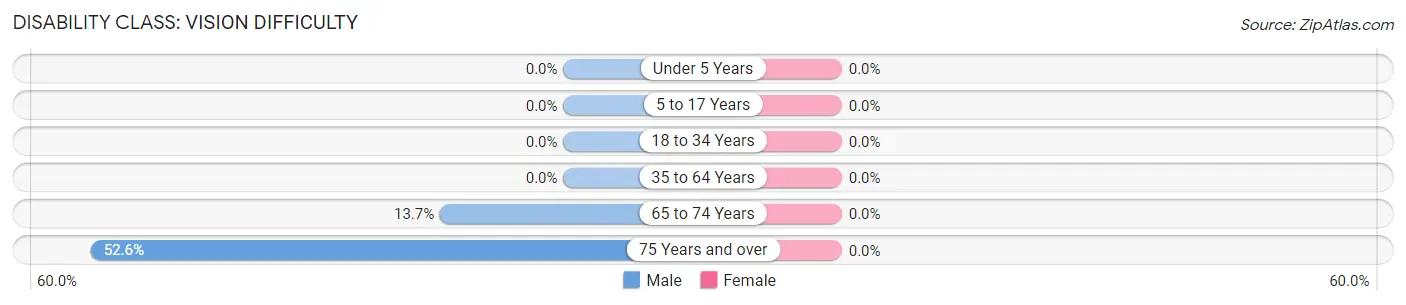
| Age Bracket | Male | Female |
| Under 5 Years | 0 (0.0%) | 0 (0.0%) |
| 5 to 17 Years | 0 (0.0%) | 0 (0.0%) |
| 18 to 34 Years | 0 (0.0%) | 0 (0.0%) |
| 35 to 64 Years | 0 (0.0%) | 0 (0.0%) |
| 65 to 74 Years | 7 (13.7%) | 0 (0.0%) |
| 75 Years and over | 10 (52.6%) | 0 (0.0%) |
Disability Class: Cognitive Difficulty
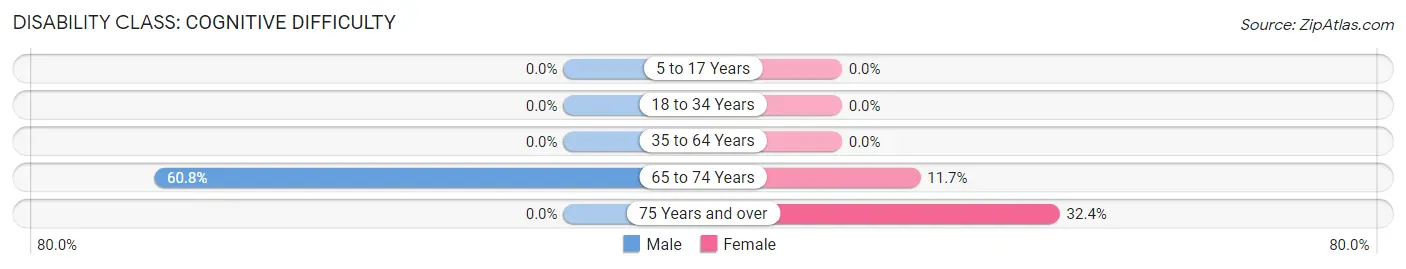
| Age Bracket | Male | Female |
| 5 to 17 Years | 0 (0.0%) | 0 (0.0%) |
| 18 to 34 Years | 0 (0.0%) | 0 (0.0%) |
| 35 to 64 Years | 0 (0.0%) | 0 (0.0%) |
| 65 to 74 Years | 31 (60.8%) | 7 (11.7%) |
| 75 Years and over | 0 (0.0%) | 11 (32.4%) |
Disability Class: Ambulatory Difficulty
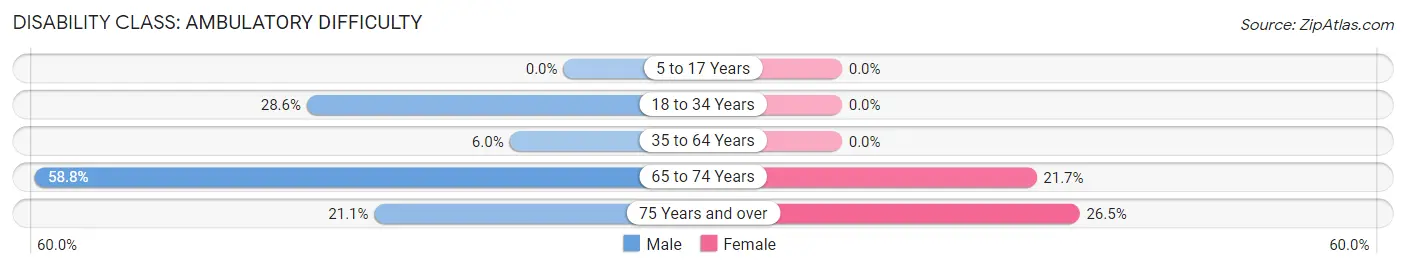
| Age Bracket | Male | Female |
| 5 to 17 Years | 0 (0.0%) | 0 (0.0%) |
| 18 to 34 Years | 4 (28.6%) | 0 (0.0%) |
| 35 to 64 Years | 6 (6.0%) | 0 (0.0%) |
| 65 to 74 Years | 30 (58.8%) | 13 (21.7%) |
| 75 Years and over | 4 (21.0%) | 9 (26.5%) |
Disability Class: Self-Care Difficulty
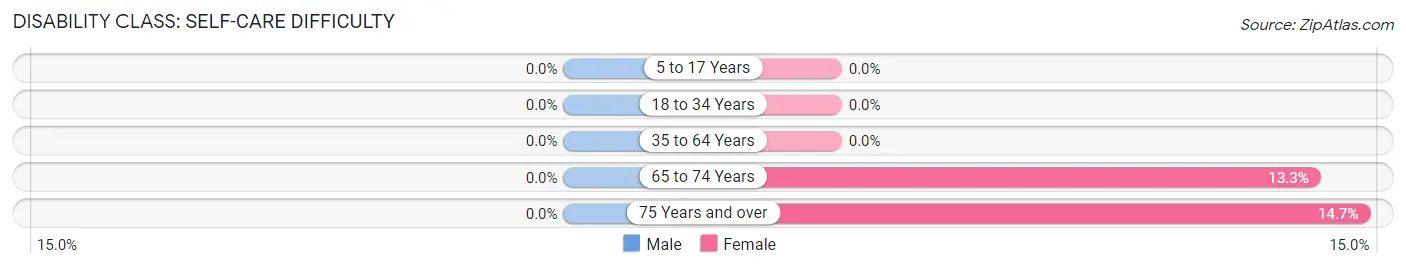
| Age Bracket | Male | Female |
| 5 to 17 Years | 0 (0.0%) | 0 (0.0%) |
| 18 to 34 Years | 0 (0.0%) | 0 (0.0%) |
| 35 to 64 Years | 0 (0.0%) | 0 (0.0%) |
| 65 to 74 Years | 0 (0.0%) | 8 (13.3%) |
| 75 Years and over | 0 (0.0%) | 5 (14.7%) |
Technology Access in Marysvale
Computing Device Access in Marysvale
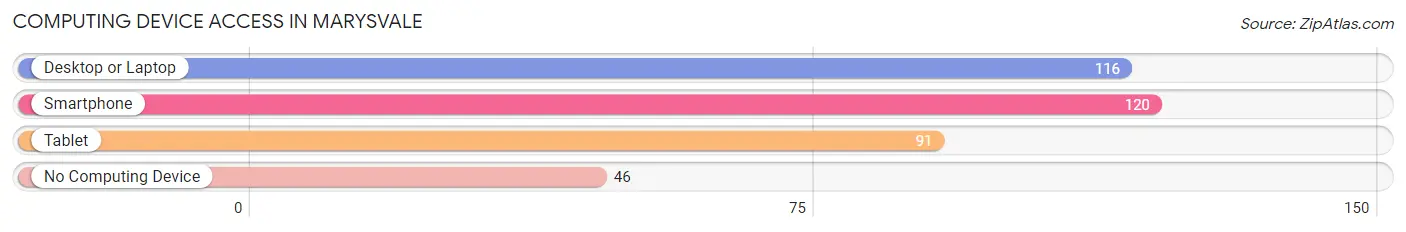
| Device Type | # Households | % Households |
| Desktop or Laptop | 116 | 65.9% |
| Smartphone | 120 | 68.2% |
| Tablet | 91 | 51.7% |
| No Computing Device | 46 | 26.1% |
| Total | 176 | 100.0% |
Internet Access in Marysvale
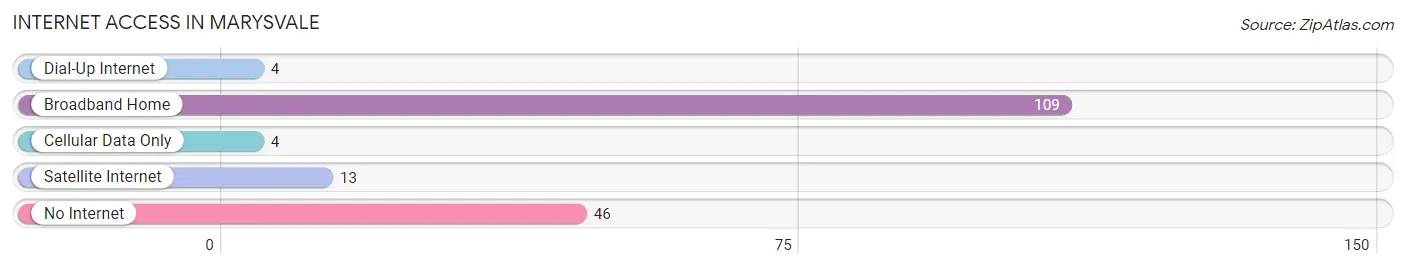
| Internet Type | # Households | % Households |
| Dial-Up Internet | 4 | 2.3% |
| Broadband Home | 109 | 61.9% |
| Cellular Data Only | 4 | 2.3% |
| Satellite Internet | 13 | 7.4% |
| No Internet | 46 | 26.1% |
| Total | 176 | 100.0% |
Marysvale Summary
History
Marysvale, Utah is a small town located in Piute County in the south-central part of the state. It is situated in the Sevier River Valley, at the base of the Tushar Mountains. The town was founded in 1864 by Mormon pioneers, who named it after Mary Ann Smith, the wife of one of the original settlers. The town was originally a farming community, but it soon became a mining center as well.
The first major mining operation in Marysvale was the Marysvale Mining Company, which was established in 1872. The company mined lead, silver, and zinc, and it was the first major employer in the area. The company also built a smelter in Marysvale, which was used to process the ore. The smelter was in operation until the early 1900s, when it was closed due to a lack of ore.
In the late 1800s, Marysvale became a popular tourist destination. The town was known for its hot springs, which were believed to have healing properties. The hot springs were also used to power a hydroelectric plant, which provided electricity to the town.
In the early 1900s, Marysvale became a center for the timber industry. The town was home to several sawmills, which provided lumber for the surrounding area. The timber industry was the main source of employment in Marysvale until the 1950s, when the sawmills began to close due to a lack of timber.
In the late 1950s, Marysvale began to experience a resurgence in tourism. The town was home to several ski resorts, which attracted visitors from all over the country. The resorts also provided employment for many of the town’s residents.
Today, Marysvale is still a popular tourist destination. The town is home to several ski resorts, as well as a variety of outdoor activities. The town is also home to several historic sites, including the Marysvale Mining Company and the Marysvale Hot Springs.
Geography
Marysvale is located in the south-central part of Utah, in the Sevier River Valley. The town is situated at the base of the Tushar Mountains, which are part of the Wasatch Range. The town is located at an elevation of 5,400 feet, and it has a total area of 1.2 square miles.
The climate in Marysvale is semi-arid, with hot summers and cold winters. The average high temperature in the summer is 90 degrees Fahrenheit, and the average low temperature in the winter is 20 degrees Fahrenheit. The town receives an average of 12 inches of precipitation per year.
Economy
The economy of Marysvale is largely based on tourism. The town is home to several ski resorts, which attract visitors from all over the country. The resorts also provide employment for many of the town’s residents.
In addition to tourism, Marysvale is also home to several small businesses. These businesses include restaurants, retail stores, and other services. The town is also home to several historic sites, which attract visitors from all over the world.
Demographics
As of the 2010 census, the population of Marysvale was 1,072. The town has a median age of 37.7 years, and the median household income is $37,917. The town is predominantly white, with 92.3% of the population identifying as such. The town also has a small Hispanic population, with 4.3% of the population identifying as Hispanic or Latino.
Common Questions
What is Per Capita Income in Marysvale?
Per Capita income in Marysvale is $20,303.
What is the Median Family Income in Marysvale?
Median Family Income in Marysvale is $44,250.
What is the Median Household income in Marysvale?
Median Household Income in Marysvale is $39,167.
What is Income or Wage Gap in Marysvale?
Income or Wage Gap in Marysvale is 4.1%.
Women in Marysvale earn 95.9 cents for every dollar earned by a man.
What is Inequality or Gini Index in Marysvale?
Inequality or Gini Index in Marysvale is 0.47.
What is the Total Population of Marysvale?
Total Population of Marysvale is 524.
What is the Total Male Population of Marysvale?
Total Male Population of Marysvale is 222.
What is the Total Female Population of Marysvale?
Total Female Population of Marysvale is 302.
What is the Ratio of Males per 100 Females in Marysvale?
There are 73.51 Males per 100 Females in Marysvale.
What is the Ratio of Females per 100 Males in Marysvale?
There are 136.04 Females per 100 Males in Marysvale.
What is the Median Population Age in Marysvale?
Median Population Age in Marysvale is 55.4 Years.
What is the Average Family Size in Marysvale
Average Family Size in Marysvale is 4.3 People.
What is the Average Household Size in Marysvale
Average Household Size in Marysvale is 3.0 People.
How Large is the Labor Force in Marysvale?
There are 202 People in the Labor Forcein in Marysvale.
What is the Percentage of People in the Labor Force in Marysvale?
48.3% of People are in the Labor Force in Marysvale.