Kanab, UT Map & Demographics
Kanab Map
Kanab Overview
$34,222
PER CAPITA INCOME
$98,529
AVG FAMILY INCOME
$70,737
AVG HOUSEHOLD INCOME
1.5%
WAGE / INCOME GAP [ % ]
98.5¢/ $1
WAGE / INCOME GAP [ $ ]
0.43
INEQUALITY / GINI INDEX
4,817
TOTAL POPULATION
2,386
MALE POPULATION
2,431
FEMALE POPULATION
98.15
MALES / 100 FEMALES
101.89
FEMALES / 100 MALES
43.0
MEDIAN AGE
2.9
AVG FAMILY SIZE
2.2
AVG HOUSEHOLD SIZE
2,476
LABOR FORCE [ PEOPLE ]
60.9%
PERCENT IN LABOR FORCE
2.6%
UNEMPLOYMENT RATE
Kanab Zip Codes
Kanab Area Codes
Income in Kanab
Income Overview in Kanab
Per Capita Income in Kanab is $34,222, while median incomes of families and households are $98,529 and $70,737 respectively.
| Characteristic | Number | Measure |
| Per Capita Income | 4,817 | $34,222 |
| Median Family Income | 1,210 | $98,529 |
| Mean Family Income | 1,210 | $101,610 |
| Median Household Income | 2,063 | $70,737 |
| Mean Household Income | 2,063 | $79,614 |
| Income Deficit | 1,210 | $0 |
| Wage / Income Gap (%) | 4,817 | 1.50% |
| Wage / Income Gap ($) | 4,817 | 98.50¢ per $1 |
| Gini / Inequality Index | 4,817 | 0.43 |
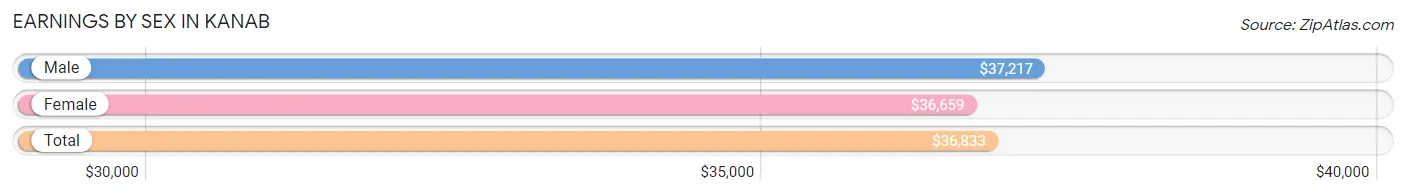
Earnings by Sex in Kanab
Average Earnings in Kanab are $36,833, $37,217 for men and $36,659 for women, a difference of 1.5%.
| Sex | Number | Average Earnings |
| Male | 1,285 (48.8%) | $37,217 |
| Female | 1,347 (51.2%) | $36,659 |
| Total | 2,632 (100.0%) | $36,833 |
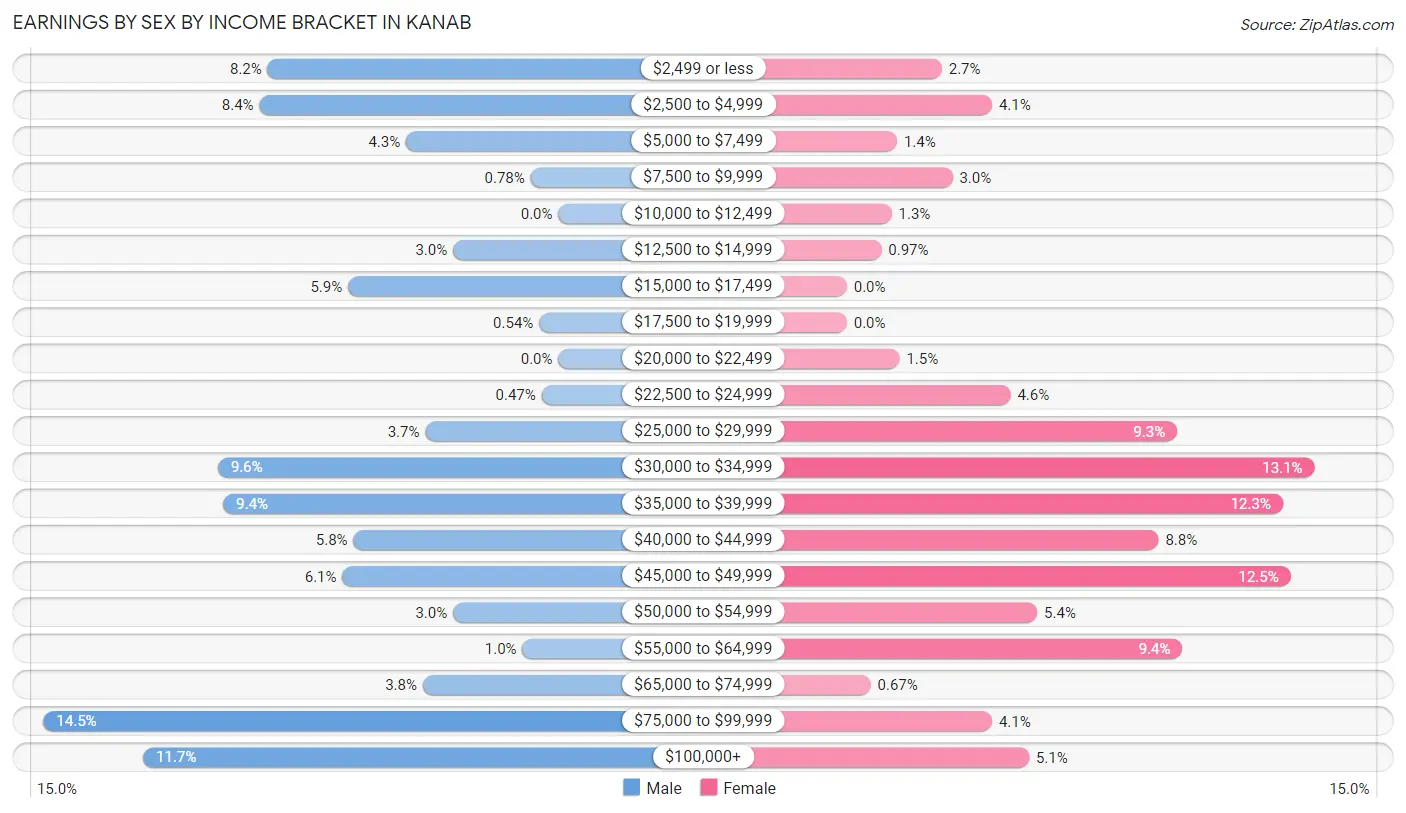
Earnings by Sex by Income Bracket in Kanab
The most common earnings brackets in Kanab are $75,000 to $99,999 for men (186 | 14.5%) and $30,000 to $34,999 for women (177 | 13.1%).
| Income | Male | Female |
| $2,499 or less | 105 (8.2%) | 36 (2.7%) |
| $2,500 to $4,999 | 108 (8.4%) | 55 (4.1%) |
| $5,000 to $7,499 | 55 (4.3%) | 19 (1.4%) |
| $7,500 to $9,999 | 10 (0.8%) | 40 (3.0%) |
| $10,000 to $12,499 | 0 (0.0%) | 17 (1.3%) |
| $12,500 to $14,999 | 38 (3.0%) | 13 (1.0%) |
| $15,000 to $17,499 | 76 (5.9%) | 0 (0.0%) |
| $17,500 to $19,999 | 7 (0.5%) | 0 (0.0%) |
| $20,000 to $22,499 | 0 (0.0%) | 20 (1.5%) |
| $22,500 to $24,999 | 6 (0.5%) | 62 (4.6%) |
| $25,000 to $29,999 | 48 (3.7%) | 125 (9.3%) |
| $30,000 to $34,999 | 123 (9.6%) | 177 (13.1%) |
| $35,000 to $39,999 | 121 (9.4%) | 165 (12.2%) |
| $40,000 to $44,999 | 74 (5.8%) | 118 (8.8%) |
| $45,000 to $49,999 | 78 (6.1%) | 168 (12.5%) |
| $50,000 to $54,999 | 38 (3.0%) | 72 (5.3%) |
| $55,000 to $64,999 | 13 (1.0%) | 127 (9.4%) |
| $65,000 to $74,999 | 49 (3.8%) | 9 (0.7%) |
| $75,000 to $99,999 | 186 (14.5%) | 55 (4.1%) |
| $100,000+ | 150 (11.7%) | 69 (5.1%) |
| Total | 1,285 (100.0%) | 1,347 (100.0%) |
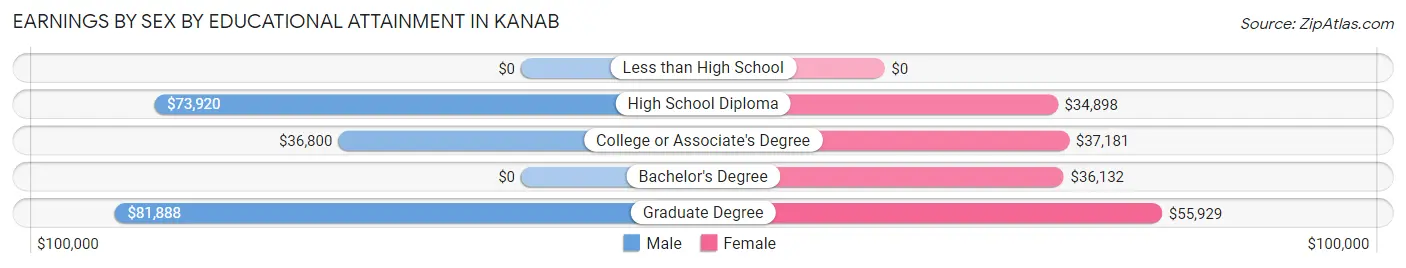
Earnings by Sex by Educational Attainment in Kanab
Average earnings in Kanab are $41,757 for men and $37,235 for women, a difference of 10.8%. Men with an educational attainment of graduate degree enjoy the highest average annual earnings of $81,888, while those with college or associate's degree education earn the least with $36,800. Women with an educational attainment of graduate degree earn the most with the average annual earnings of $55,929, while those with high school diploma education have the smallest earnings of $34,898.
| Educational Attainment | Male Income | Female Income |
| Less than High School | - | - |
| High School Diploma | $73,920 | $34,898 |
| College or Associate's Degree | $36,800 | $37,181 |
| Bachelor's Degree | - | - |
| Graduate Degree | $81,888 | $55,929 |
| Total | $41,757 | $37,235 |
Family Income in Kanab
Family Income Brackets in Kanab
According to the Kanab family income data, there are 378 families falling into the $100,000 to $149,999 income range, which is the most common income bracket and makes up 31.2% of all families. Conversely, the $25,000 to $34,999 income bracket is the least frequent group with only 12 families (1.0%) belonging to this category.
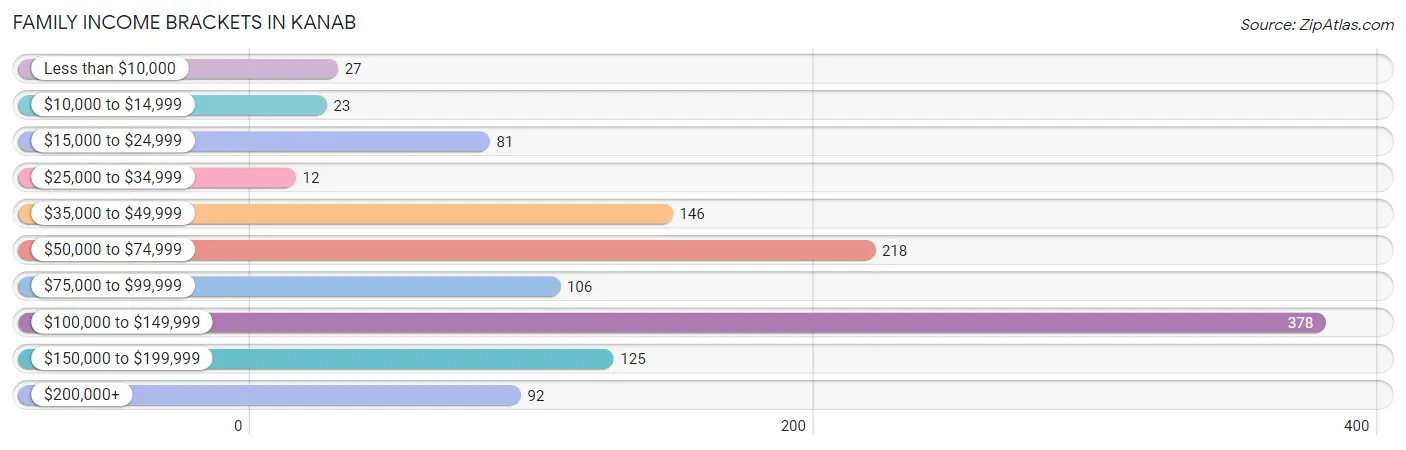
| Income Bracket | # Families | % Families |
| Less than $10,000 | 27 | 2.2% |
| $10,000 to $14,999 | 23 | 1.9% |
| $15,000 to $24,999 | 81 | 6.7% |
| $25,000 to $34,999 | 12 | 1.0% |
| $35,000 to $49,999 | 146 | 12.1% |
| $50,000 to $74,999 | 218 | 18.0% |
| $75,000 to $99,999 | 106 | 8.8% |
| $100,000 to $149,999 | 378 | 31.2% |
| $150,000 to $199,999 | 125 | 10.3% |
| $200,000+ | 92 | 7.6% |
Family Income by Famaliy Size in Kanab
5-person families (128 | 10.6%) account for the highest median family income in Kanab with $178,548 per family, while 3-person families (225 | 18.6%) have the highest median income of $44,424 per family member.
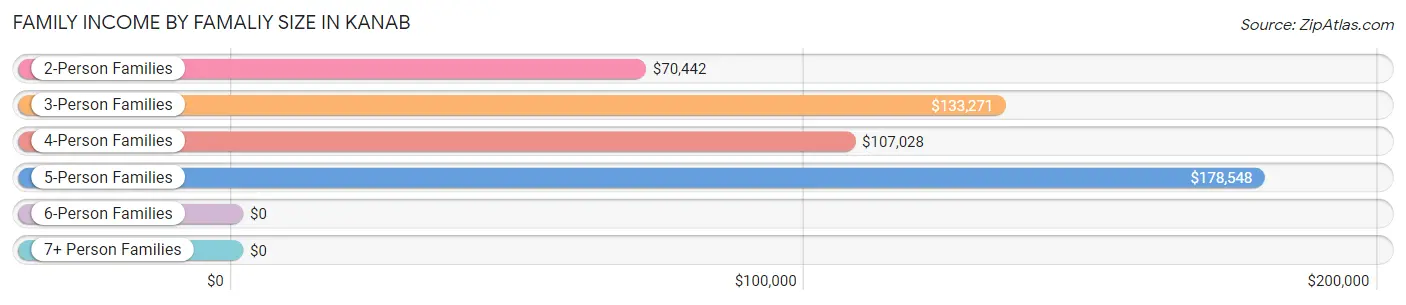
| Income Bracket | # Families | Median Income |
| 2-Person Families | 719 (59.4%) | $70,442 |
| 3-Person Families | 225 (18.6%) | $133,271 |
| 4-Person Families | 93 (7.7%) | $107,028 |
| 5-Person Families | 128 (10.6%) | $178,548 |
| 6-Person Families | 25 (2.1%) | $0 |
| 7+ Person Families | 20 (1.7%) | $0 |
| Total | 1,210 (100.0%) | $98,529 |
Family Income by Number of Earners in Kanab
The median family income in Kanab is $98,529, with families comprising 3+ earners (201) having the highest median family income of $133,750, while families with no earners (276) have the lowest median family income of $50,000, accounting for 16.6% and 22.8% of families, respectively.
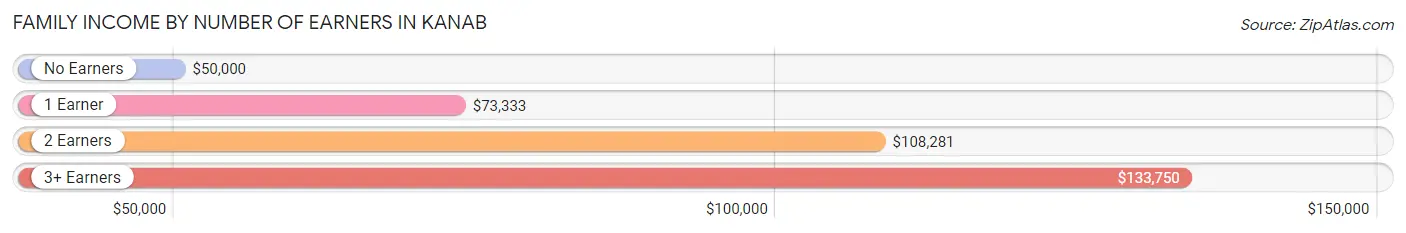
| Number of Earners | # Families | Median Income |
| No Earners | 276 (22.8%) | $50,000 |
| 1 Earner | 246 (20.3%) | $73,333 |
| 2 Earners | 487 (40.3%) | $108,281 |
| 3+ Earners | 201 (16.6%) | $133,750 |
| Total | 1,210 (100.0%) | $98,529 |
Household Income in Kanab
Household Income Brackets in Kanab
With 450 households falling in the category, the $100,000 to $149,999 income range is the most frequent in Kanab, accounting for 21.8% of all households. In contrast, only 93 households (4.5%) fall into the $15,000 to $24,999 income bracket, making it the least populous group.
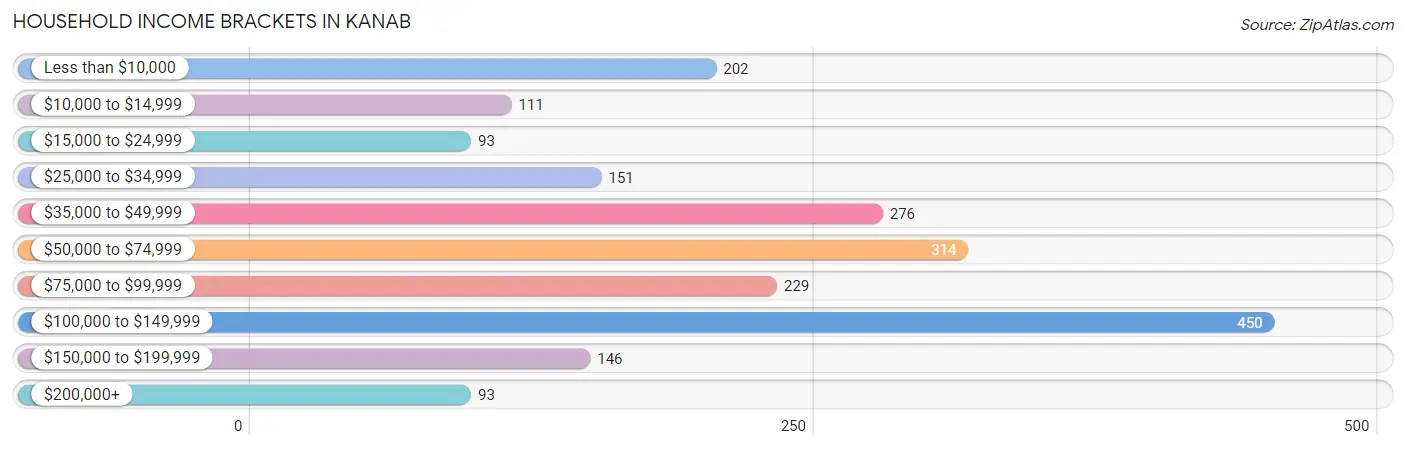
| Income Bracket | # Households | % Households |
| Less than $10,000 | 202 | 9.8% |
| $10,000 to $14,999 | 111 | 5.4% |
| $15,000 to $24,999 | 93 | 4.5% |
| $25,000 to $34,999 | 151 | 7.3% |
| $35,000 to $49,999 | 276 | 13.4% |
| $50,000 to $74,999 | 314 | 15.2% |
| $75,000 to $99,999 | 229 | 11.1% |
| $100,000 to $149,999 | 450 | 21.8% |
| $150,000 to $199,999 | 146 | 7.1% |
| $200,000+ | 93 | 4.5% |
Household Income by Householder Age in Kanab
The median household income in Kanab is $70,737, with the highest median household income of $92,750 found in the 45 to 64 years age bracket for the primary householder. A total of 689 households (33.4%) fall into this category. Meanwhile, the 65+ years age bracket for the primary householder has the lowest median household income of $46,731, with 572 households (27.7%) in this group.
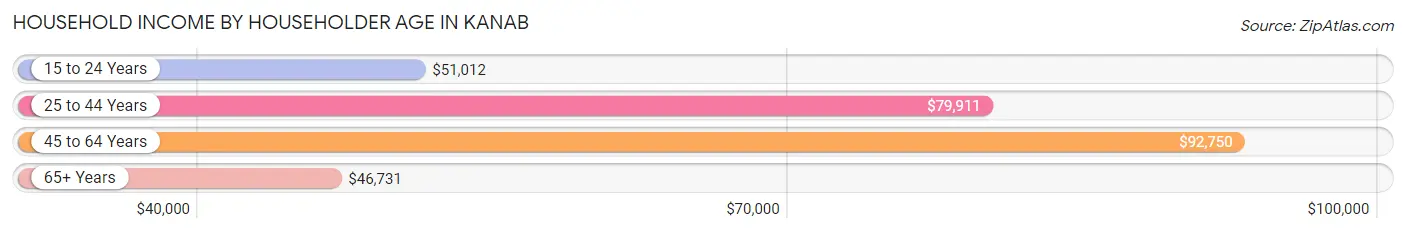
| Income Bracket | # Households | Median Income |
| 15 to 24 Years | 55 (2.7%) | $51,012 |
| 25 to 44 Years | 747 (36.2%) | $79,911 |
| 45 to 64 Years | 689 (33.4%) | $92,750 |
| 65+ Years | 572 (27.7%) | $46,731 |
| Total | 2,063 (100.0%) | $70,737 |
Poverty in Kanab
Income Below Poverty by Sex and Age in Kanab
With 11.9% poverty level for males and 10.4% for females among the residents of Kanab, 55 to 64 year old males and 55 to 64 year old females are the most vulnerable to poverty, with 135 males (38.4%) and 81 females (20.7%) in their respective age groups living below the poverty level.
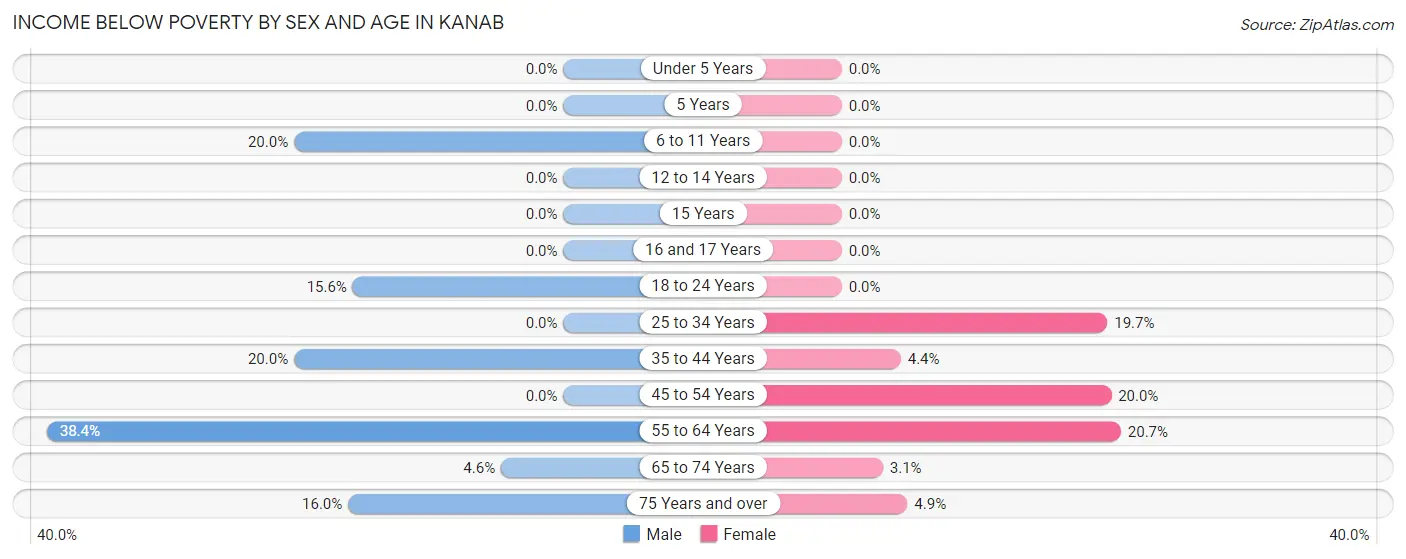
| Age Bracket | Male | Female |
| Under 5 Years | 0 (0.0%) | 0 (0.0%) |
| 5 Years | 0 (0.0%) | 0 (0.0%) |
| 6 to 11 Years | 18 (20.0%) | 0 (0.0%) |
| 12 to 14 Years | 0 (0.0%) | 0 (0.0%) |
| 15 Years | 0 (0.0%) | 0 (0.0%) |
| 16 and 17 Years | 0 (0.0%) | 0 (0.0%) |
| 18 to 24 Years | 28 (15.6%) | 0 (0.0%) |
| 25 to 34 Years | 0 (0.0%) | 94 (19.7%) |
| 35 to 44 Years | 38 (20.0%) | 13 (4.4%) |
| 45 to 54 Years | 0 (0.0%) | 39 (20.0%) |
| 55 to 64 Years | 135 (38.4%) | 81 (20.7%) |
| 65 to 74 Years | 12 (4.6%) | 10 (3.0%) |
| 75 Years and over | 35 (16.0%) | 11 (4.9%) |
| Total | 266 (11.9%) | 248 (10.4%) |
Income Above Poverty by Sex and Age in Kanab
According to the poverty statistics in Kanab, males aged under 5 years and females aged under 5 years are the age groups that are most secure financially, with 100.0% of males and 100.0% of females in these age groups living above the poverty line.
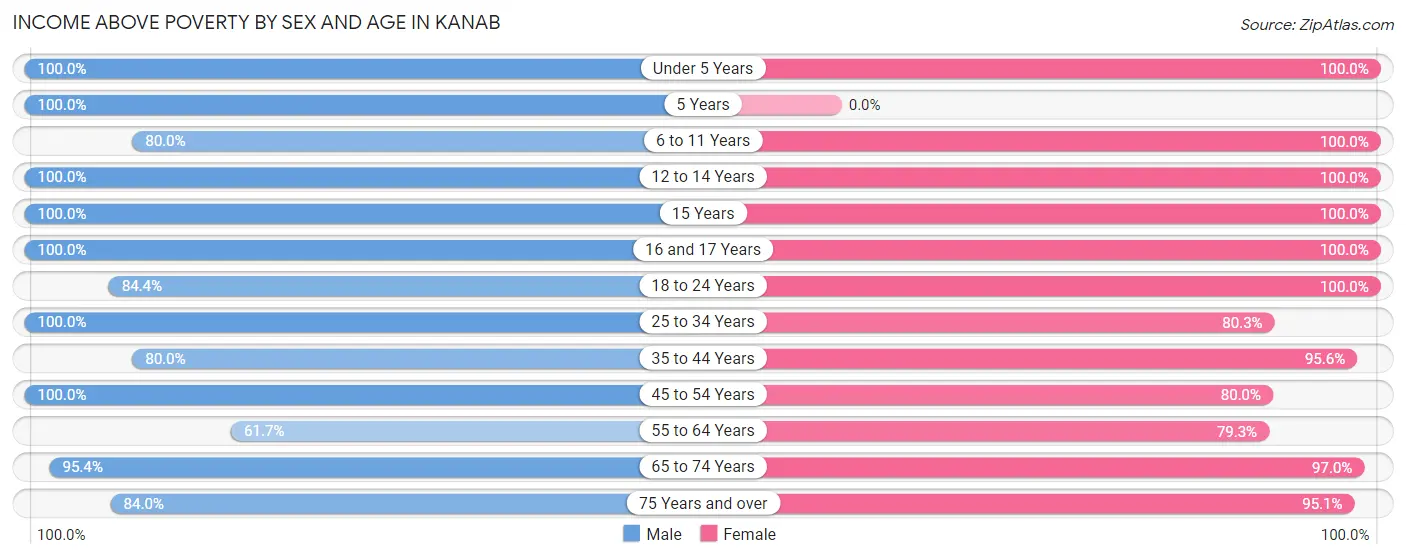
| Age Bracket | Male | Female |
| Under 5 Years | 134 (100.0%) | 117 (100.0%) |
| 5 Years | 17 (100.0%) | 0 (0.0%) |
| 6 to 11 Years | 72 (80.0%) | 74 (100.0%) |
| 12 to 14 Years | 149 (100.0%) | 70 (100.0%) |
| 15 Years | 10 (100.0%) | 90 (100.0%) |
| 16 and 17 Years | 132 (100.0%) | 11 (100.0%) |
| 18 to 24 Years | 151 (84.4%) | 116 (100.0%) |
| 25 to 34 Years | 312 (100.0%) | 383 (80.3%) |
| 35 to 44 Years | 152 (80.0%) | 284 (95.6%) |
| 45 to 54 Years | 197 (100.0%) | 156 (80.0%) |
| 55 to 64 Years | 217 (61.7%) | 310 (79.3%) |
| 65 to 74 Years | 247 (95.4%) | 318 (97.0%) |
| 75 Years and over | 184 (84.0%) | 215 (95.1%) |
| Total | 1,974 (88.1%) | 2,144 (89.6%) |
Income Below Poverty Among Married-Couple Families in Kanab
The poverty statistics for married-couple families in Kanab show that 7.1% or 76 of the total 1,063 families live below the poverty line. Families with no children have the highest poverty rate of 10.4%, comprising of 76 families. On the other hand, families with 1 or 2 children have the lowest poverty rate of 0.0%, which includes 0 families.
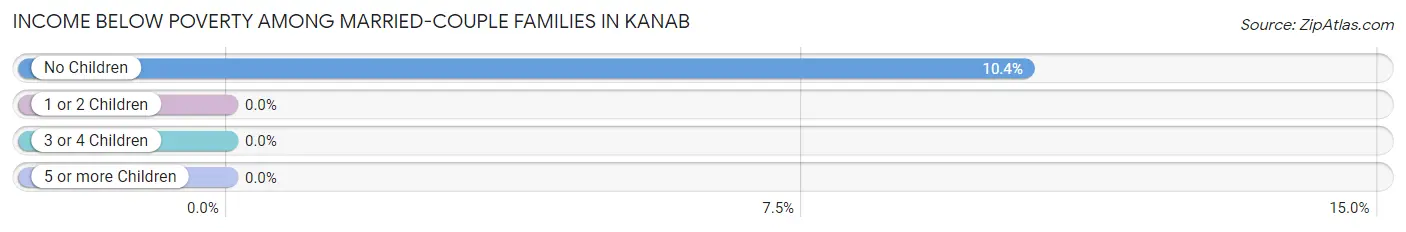
| Children | Above Poverty | Below Poverty |
| No Children | 655 (89.6%) | 76 (10.4%) |
| 1 or 2 Children | 225 (100.0%) | 0 (0.0%) |
| 3 or 4 Children | 107 (100.0%) | 0 (0.0%) |
| 5 or more Children | 0 (0.0%) | 0 (0.0%) |
| Total | 987 (92.8%) | 76 (7.1%) |
Income Below Poverty Among Single-Parent Households in Kanab
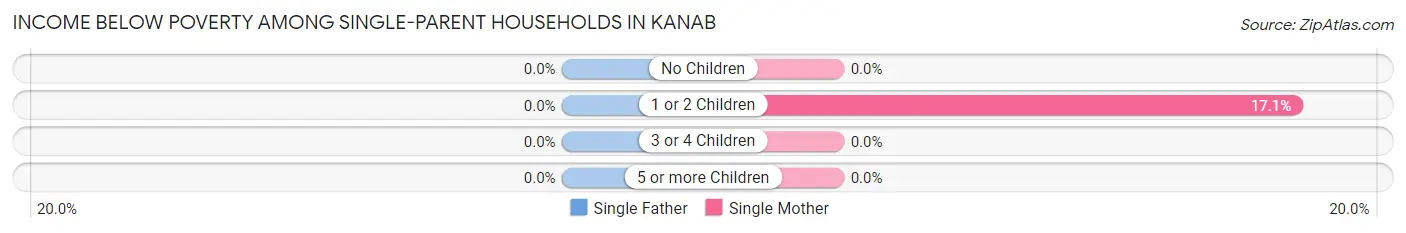
| Children | Single Father | Single Mother |
| No Children | 0 (0.0%) | 0 (0.0%) |
| 1 or 2 Children | 0 (0.0%) | 13 (17.1%) |
| 3 or 4 Children | 0 (0.0%) | 0 (0.0%) |
| 5 or more Children | 0 (0.0%) | 0 (0.0%) |
| Total | 0 (0.0%) | 13 (10.8%) |
Income Below Poverty Among Married-Couple vs Single-Parent Households in Kanab
The poverty data for Kanab shows that 76 of the married-couple family households (7.1%) and 13 of the single-parent households (8.8%) are living below the poverty level. Within the married-couple family households, those with no children have the highest poverty rate, with 76 households (10.4%) falling below the poverty line. Among the single-parent households, those with 1 or 2 children have the highest poverty rate, with 13 household (17.1%) living below poverty.
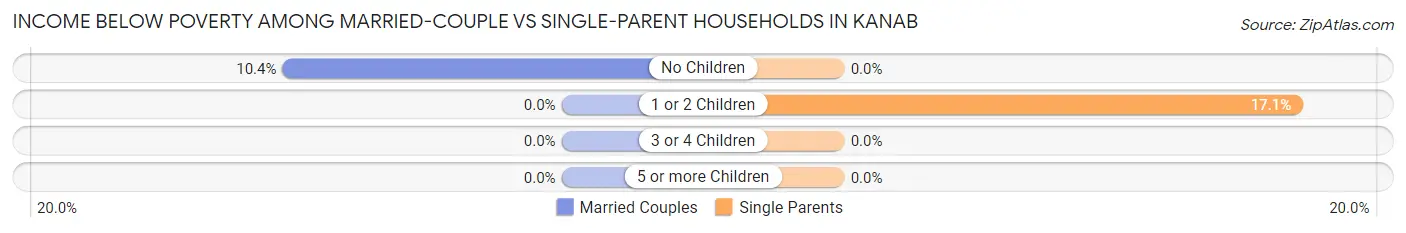
| Children | Married-Couple Families | Single-Parent Households |
| No Children | 76 (10.4%) | 0 (0.0%) |
| 1 or 2 Children | 0 (0.0%) | 13 (17.1%) |
| 3 or 4 Children | 0 (0.0%) | 0 (0.0%) |
| 5 or more Children | 0 (0.0%) | 0 (0.0%) |
| Total | 76 (7.1%) | 13 (8.8%) |
Race in Kanab
The most populous races in Kanab are White / Caucasian (4,574 | 95.0%), Hispanic or Latino (326 | 6.8%), and Two or more Races (114 | 2.4%).
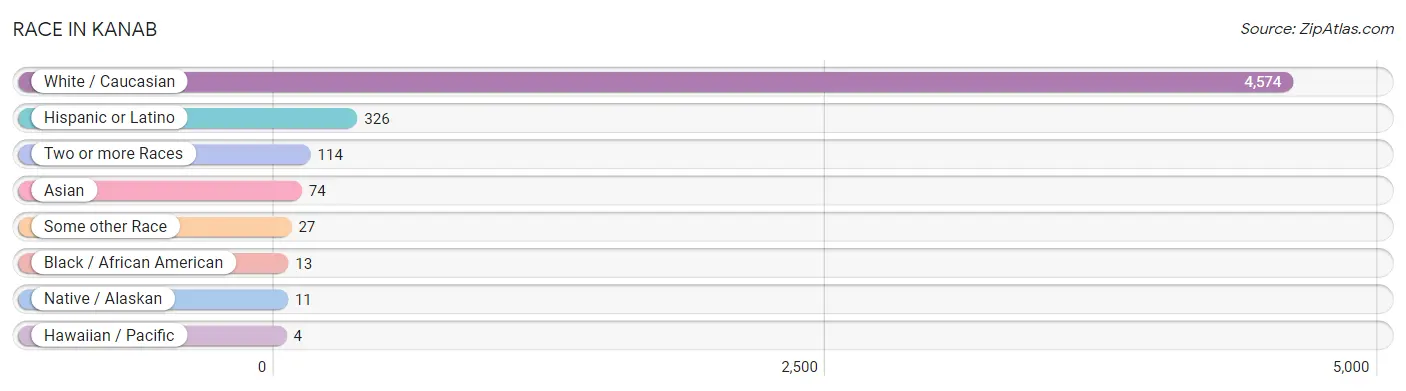
| Race | # Population | % Population |
| Asian | 74 | 1.5% |
| Black / African American | 13 | 0.3% |
| Hawaiian / Pacific | 4 | 0.1% |
| Hispanic or Latino | 326 | 6.8% |
| Native / Alaskan | 11 | 0.2% |
| White / Caucasian | 4,574 | 95.0% |
| Two or more Races | 114 | 2.4% |
| Some other Race | 27 | 0.6% |
| Total | 4,817 | 100.0% |
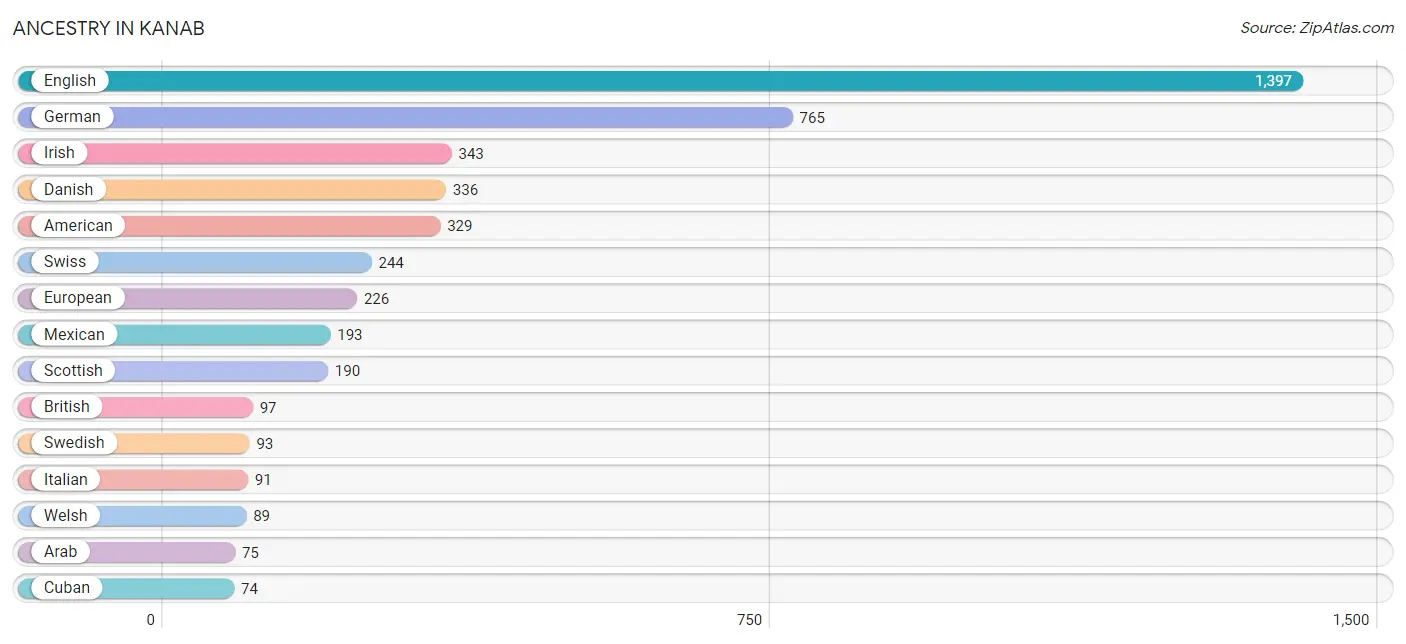
Ancestry in Kanab
The most populous ancestries reported in Kanab are English (1,397 | 29.0%), German (765 | 15.9%), Irish (343 | 7.1%), Danish (336 | 7.0%), and American (329 | 6.8%), together accounting for 65.8% of all Kanab residents.
| Ancestry | # Population | % Population |
| American | 329 | 6.8% |
| Arab | 75 | 1.6% |
| Armenian | 13 | 0.3% |
| Bhutanese | 13 | 0.3% |
| Brazilian | 39 | 0.8% |
| British | 97 | 2.0% |
| Canadian | 31 | 0.6% |
| Central American | 12 | 0.3% |
| Cuban | 74 | 1.5% |
| Danish | 336 | 7.0% |
| Dutch | 62 | 1.3% |
| English | 1,397 | 29.0% |
| European | 226 | 4.7% |
| French | 61 | 1.3% |
| French Canadian | 25 | 0.5% |
| German | 765 | 15.9% |
| Greek | 35 | 0.7% |
| Irish | 343 | 7.1% |
| Italian | 91 | 1.9% |
| Jordanian | 1 | 0.0% |
| Lebanese | 74 | 1.5% |
| Lithuanian | 14 | 0.3% |
| Luxembourger | 12 | 0.3% |
| Mexican | 193 | 4.0% |
| Navajo | 6 | 0.1% |
| Norwegian | 73 | 1.5% |
| Paiute | 5 | 0.1% |
| Peruvian | 31 | 0.6% |
| Polish | 25 | 0.5% |
| Puerto Rican | 9 | 0.2% |
| Russian | 15 | 0.3% |
| Salvadoran | 12 | 0.3% |
| Samoan | 4 | 0.1% |
| Scandinavian | 55 | 1.1% |
| Scotch-Irish | 28 | 0.6% |
| Scottish | 190 | 3.9% |
| Slovak | 23 | 0.5% |
| South American | 31 | 0.6% |
| Spaniard | 7 | 0.2% |
| Sri Lankan | 74 | 1.5% |
| Swedish | 93 | 1.9% |
| Swiss | 244 | 5.1% |
| Tongan | 4 | 0.1% |
| Ukrainian | 14 | 0.3% |
| Welsh | 89 | 1.8% | View All 45 Rows |
Immigrants in Kanab
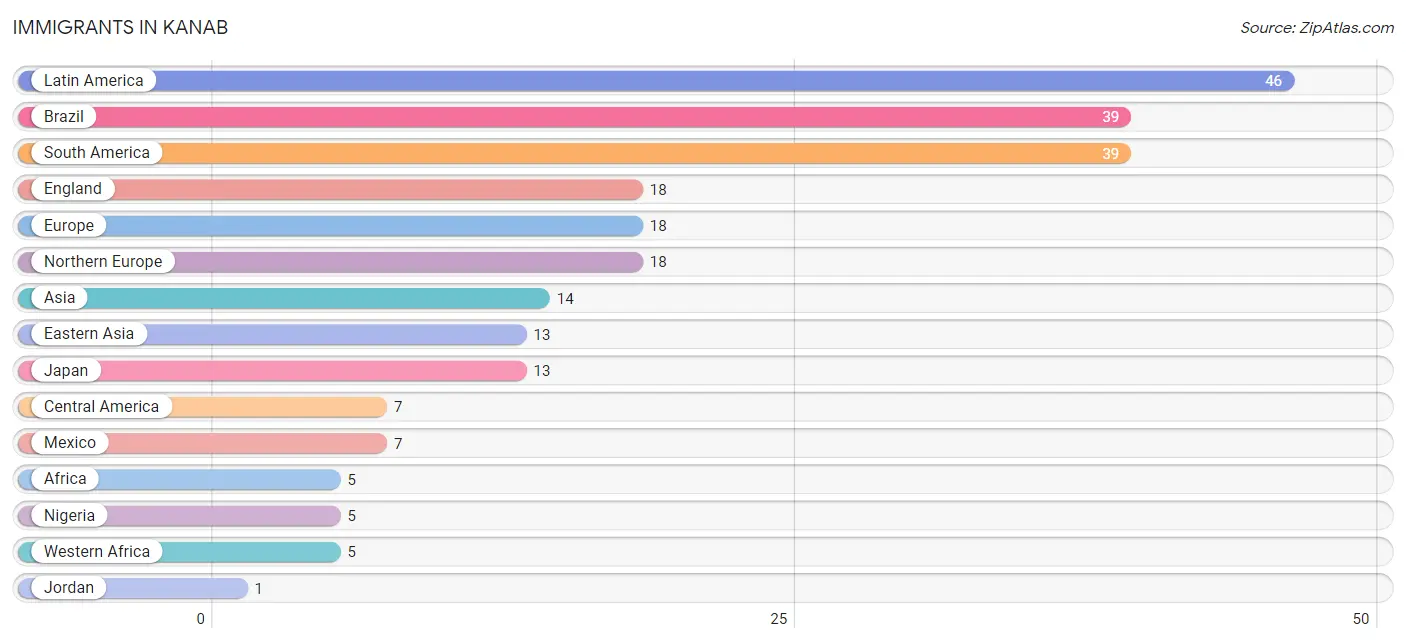
The most numerous immigrant groups reported in Kanab came from Latin America (46 | 0.9%), Brazil (39 | 0.8%), South America (39 | 0.8%), England (18 | 0.4%), and Europe (18 | 0.4%), together accounting for 3.3% of all Kanab residents.
| Immigration Origin | # Population | % Population |
| Africa | 5 | 0.1% |
| Asia | 14 | 0.3% |
| Brazil | 39 | 0.8% |
| Central America | 7 | 0.2% |
| Eastern Asia | 13 | 0.3% |
| England | 18 | 0.4% |
| Europe | 18 | 0.4% |
| Japan | 13 | 0.3% |
| Jordan | 1 | 0.0% |
| Latin America | 46 | 0.9% |
| Mexico | 7 | 0.2% |
| Nigeria | 5 | 0.1% |
| Northern Europe | 18 | 0.4% |
| South America | 39 | 0.8% |
| Western Africa | 5 | 0.1% |
| Western Asia | 1 | 0.0% | View All 16 Rows |
Sex and Age in Kanab
Sex and Age in Kanab
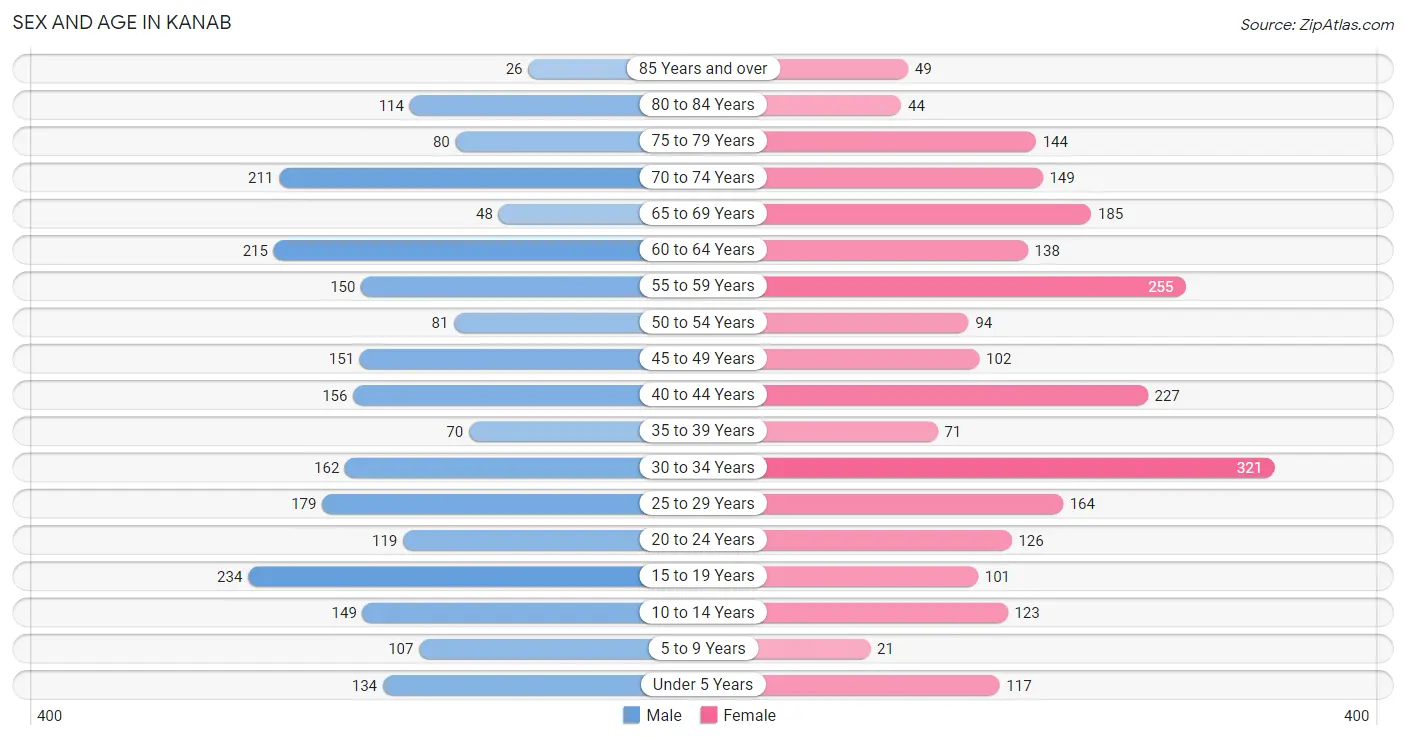
The most populous age groups in Kanab are 15 to 19 Years (234 | 9.8%) for men and 30 to 34 Years (321 | 13.2%) for women.
| Age Bracket | Male | Female |
| Under 5 Years | 134 (5.6%) | 117 (4.8%) |
| 5 to 9 Years | 107 (4.5%) | 21 (0.9%) |
| 10 to 14 Years | 149 (6.2%) | 123 (5.1%) |
| 15 to 19 Years | 234 (9.8%) | 101 (4.2%) |
| 20 to 24 Years | 119 (5.0%) | 126 (5.2%) |
| 25 to 29 Years | 179 (7.5%) | 164 (6.8%) |
| 30 to 34 Years | 162 (6.8%) | 321 (13.2%) |
| 35 to 39 Years | 70 (2.9%) | 71 (2.9%) |
| 40 to 44 Years | 156 (6.5%) | 227 (9.3%) |
| 45 to 49 Years | 151 (6.3%) | 102 (4.2%) |
| 50 to 54 Years | 81 (3.4%) | 94 (3.9%) |
| 55 to 59 Years | 150 (6.3%) | 255 (10.5%) |
| 60 to 64 Years | 215 (9.0%) | 138 (5.7%) |
| 65 to 69 Years | 48 (2.0%) | 185 (7.6%) |
| 70 to 74 Years | 211 (8.8%) | 149 (6.1%) |
| 75 to 79 Years | 80 (3.4%) | 144 (5.9%) |
| 80 to 84 Years | 114 (4.8%) | 44 (1.8%) |
| 85 Years and over | 26 (1.1%) | 49 (2.0%) |
| Total | 2,386 (100.0%) | 2,431 (100.0%) |
Families and Households in Kanab
Median Family Size in Kanab
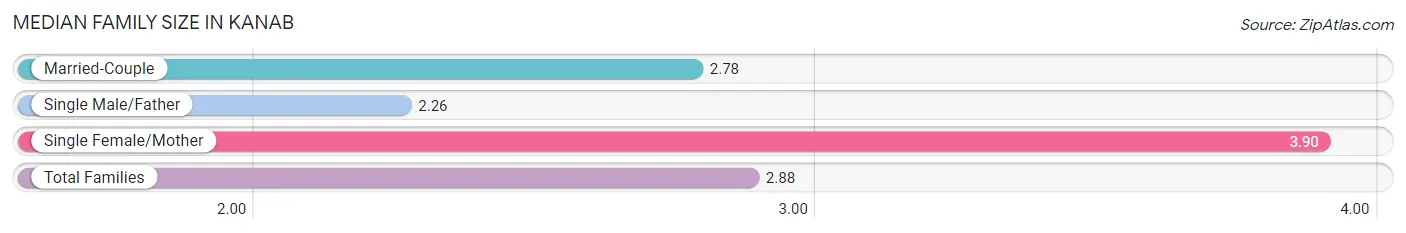
The median family size in Kanab is 2.88 persons per family, with single female/mother families (120 | 9.9%) accounting for the largest median family size of 3.9 persons per family. On the other hand, single male/father families (27 | 2.2%) represent the smallest median family size with 2.26 persons per family.
| Family Type | # Families | Family Size |
| Married-Couple | 1,063 (87.8%) | 2.78 |
| Single Male/Father | 27 (2.2%) | 2.26 |
| Single Female/Mother | 120 (9.9%) | 3.90 |
| Total Families | 1,210 (100.0%) | 2.88 |
Median Household Size in Kanab
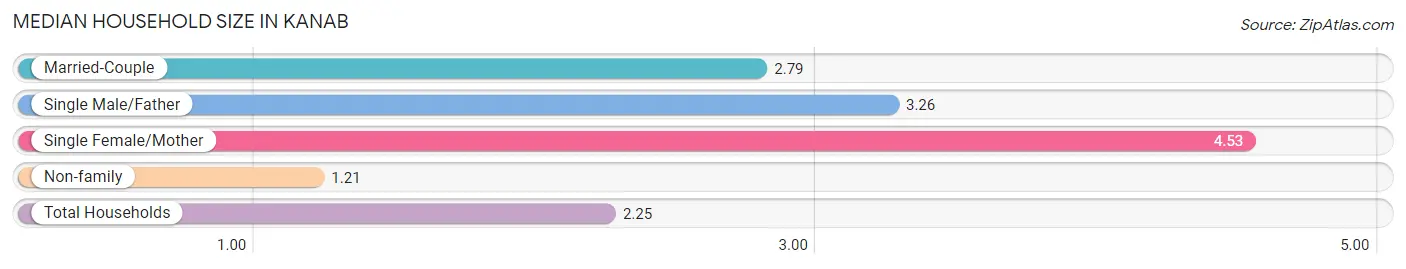
The median household size in Kanab is 2.25 persons per household, with single female/mother households (120 | 5.8%) accounting for the largest median household size of 4.53 persons per household. non-family households (853 | 41.3%) represent the smallest median household size with 1.21 persons per household.
| Household Type | # Households | Household Size |
| Married-Couple | 1,063 (51.5%) | 2.79 |
| Single Male/Father | 27 (1.3%) | 3.26 |
| Single Female/Mother | 120 (5.8%) | 4.53 |
| Non-family | 853 (41.3%) | 1.21 |
| Total Households | 2,063 (100.0%) | 2.25 |
Household Size by Marriage Status in Kanab
Out of a total of 2,063 households in Kanab, 1,210 (58.7%) are family households, while 853 (41.3%) are nonfamily households. The most numerous type of family households are 2-person households, comprising 667, and the most common type of nonfamily households are 1-person households, comprising 728.
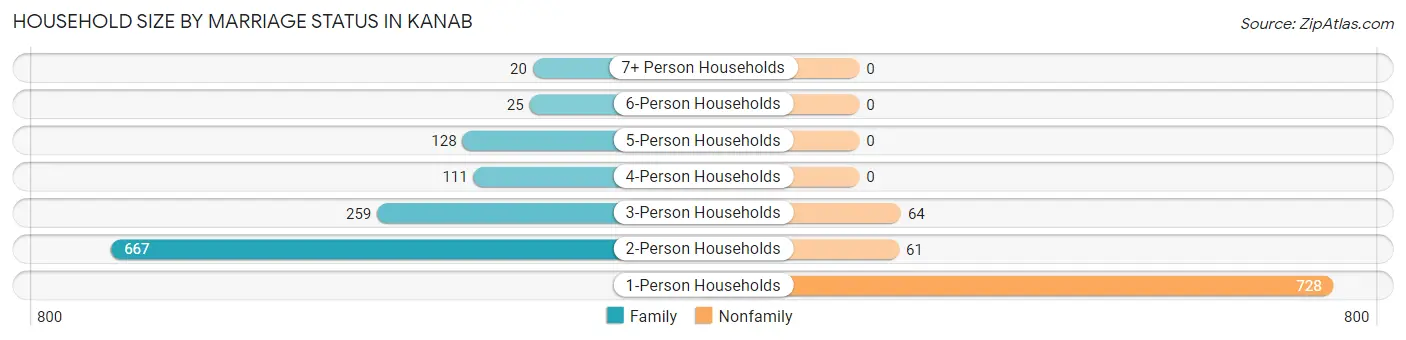
| Household Size | Family Households | Nonfamily Households |
| 1-Person Households | - | 728 (35.3%) |
| 2-Person Households | 667 (32.3%) | 61 (3.0%) |
| 3-Person Households | 259 (12.6%) | 64 (3.1%) |
| 4-Person Households | 111 (5.4%) | 0 (0.0%) |
| 5-Person Households | 128 (6.2%) | 0 (0.0%) |
| 6-Person Households | 25 (1.2%) | 0 (0.0%) |
| 7+ Person Households | 20 (1.0%) | 0 (0.0%) |
| Total | 1,210 (58.7%) | 853 (41.3%) |
Female Fertility in Kanab
Fertility by Age in Kanab
Average fertility rate in Kanab is 33.0 births per 1,000 women. Women in the age bracket of 20 to 34 years have the highest fertility rate with 61.0 births per 1,000 women. Women in the age bracket of 20 to 34 years acount for 100.0% of all women with births.
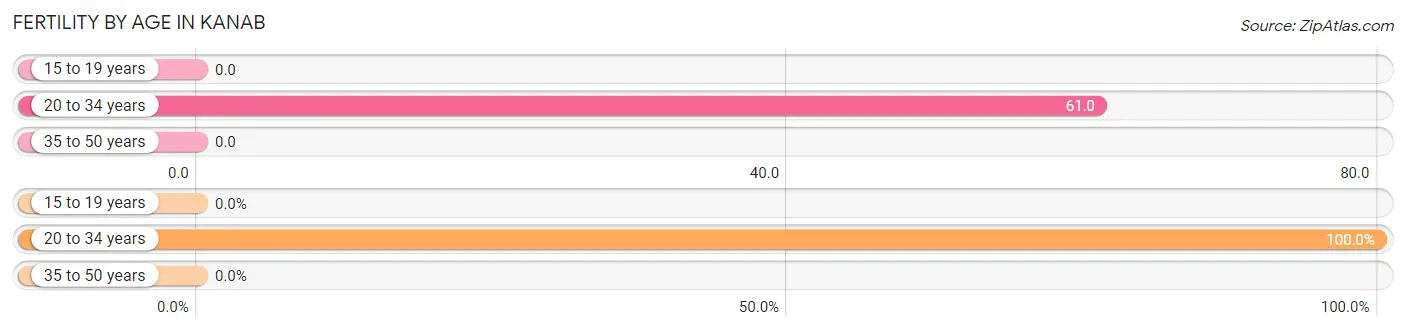
| Age Bracket | Women with Births | Births / 1,000 Women |
| 15 to 19 years | 0 (0.0%) | 0.0 |
| 20 to 34 years | 37 (100.0%) | 61.0 |
| 35 to 50 years | 0 (0.0%) | 0.0 |
| Total | 37 (100.0%) | 33.0 |
Fertility by Age by Marriage Status in Kanab
83.8% of women with births (37) in Kanab are married. The highest percentage of unmarried women with births falls into 20 to 34 years age bracket with 16.2% of them unmarried at the time of birth, while the lowest percentage of unmarried women with births belong to 20 to 34 years age bracket with 16.2% of them unmarried.
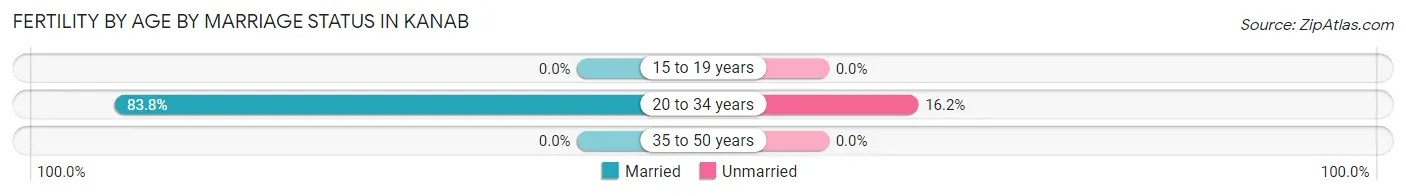
| Age Bracket | Married | Unmarried |
| 15 to 19 years | 0 (0.0%) | 0 (0.0%) |
| 20 to 34 years | 31 (83.8%) | 6 (16.2%) |
| 35 to 50 years | 0 (0.0%) | 0 (0.0%) |
| Total | 31 (83.8%) | 6 (16.2%) |
Fertility by Education in Kanab
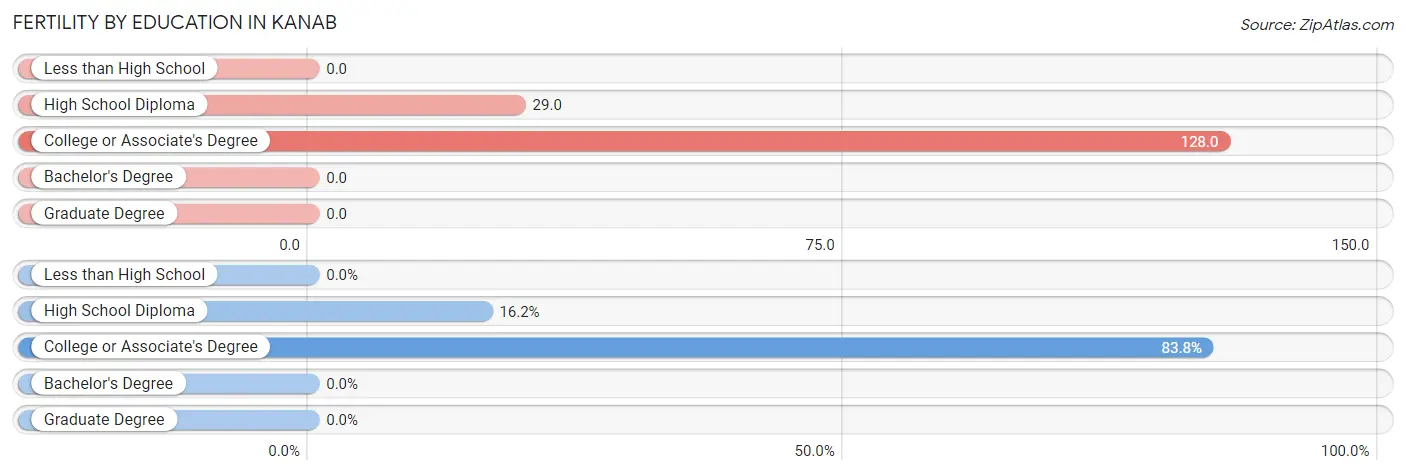
| Educational Attainment | Women with Births | Births / 1,000 Women |
| Less than High School | 0 (0.0%) | 0.0 |
| High School Diploma | 6 (16.2%) | 29.0 |
| College or Associate's Degree | 31 (83.8%) | 128.0 |
| Bachelor's Degree | 0 (0.0%) | 0.0 |
| Graduate Degree | 0 (0.0%) | 0.0 |
| Total | 37 (100.0%) | 33.0 |
Fertility by Education by Marriage Status in Kanab
16.2% of women with births in Kanab are unmarried. Women with the educational attainment of college or associate's degree are most likely to be married with 100.0% of them married at childbirth, while women with the educational attainment of high school diploma are least likely to be married with 100.0% of them unmarried at childbirth.
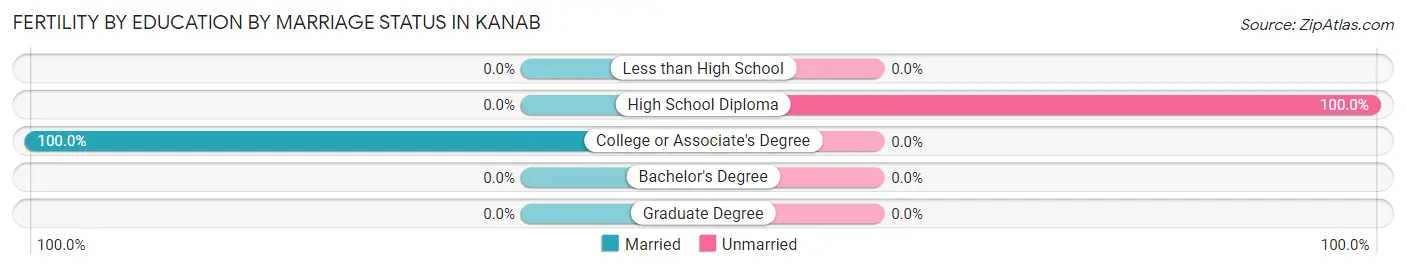
| Educational Attainment | Married | Unmarried |
| Less than High School | 0 (0.0%) | 0 (0.0%) |
| High School Diploma | 0 (0.0%) | 6 (100.0%) |
| College or Associate's Degree | 31 (100.0%) | 0 (0.0%) |
| Bachelor's Degree | 0 (0.0%) | 0 (0.0%) |
| Graduate Degree | 0 (0.0%) | 0 (0.0%) |
| Total | 31 (83.8%) | 6 (16.2%) |
Employment Characteristics in Kanab
Employment by Class of Employer in Kanab
Among the 2,379 employed individuals in Kanab, private company employees (1,257 | 52.8%), not-for-profit organizations (636 | 26.7%), and local government employees (222 | 9.3%) make up the most common classes of employment.
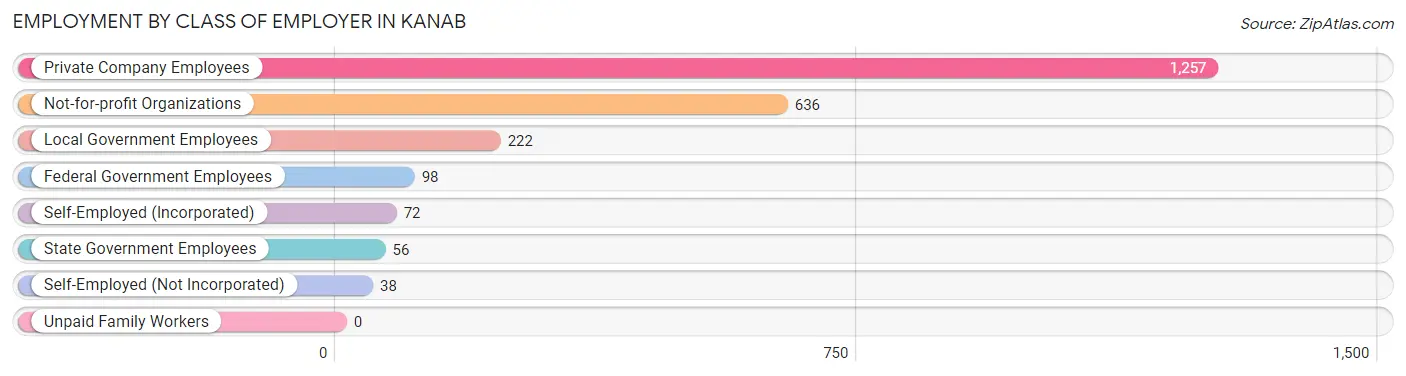
| Employer Class | # Employees | % Employees |
| Private Company Employees | 1,257 | 52.8% |
| Self-Employed (Incorporated) | 72 | 3.0% |
| Self-Employed (Not Incorporated) | 38 | 1.6% |
| Not-for-profit Organizations | 636 | 26.7% |
| Local Government Employees | 222 | 9.3% |
| State Government Employees | 56 | 2.4% |
| Federal Government Employees | 98 | 4.1% |
| Unpaid Family Workers | 0 | 0.0% |
| Total | 2,379 | 100.0% |
Employment Status by Age in Kanab
According to the labor force statistics for Kanab, out of the total population over 16 years of age (4,066), 60.9% or 2,476 individuals are in the labor force, with 2.6% or 64 of them unemployed. The age group with the highest labor force participation rate is 35 to 44 years, with 86.3% or 452 individuals in the labor force. Within the labor force, the 55 to 59 years age range has the highest percentage of unemployed individuals, with 13.6% or 43 of them being unemployed.
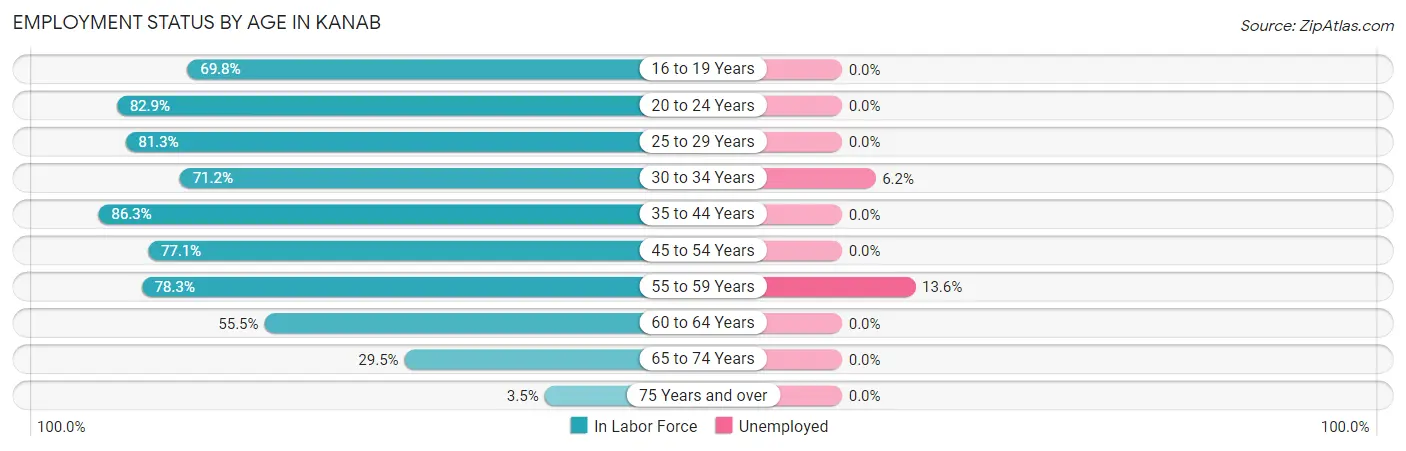
| Age Bracket | In Labor Force | Unemployed |
| 16 to 19 Years | 164 (69.8%) | 0 (0.0%) |
| 20 to 24 Years | 203 (82.9%) | 0 (0.0%) |
| 25 to 29 Years | 279 (81.3%) | 0 (0.0%) |
| 30 to 34 Years | 344 (71.2%) | 21 (6.2%) |
| 35 to 44 Years | 452 (86.3%) | 0 (0.0%) |
| 45 to 54 Years | 330 (77.1%) | 0 (0.0%) |
| 55 to 59 Years | 317 (78.3%) | 43 (13.6%) |
| 60 to 64 Years | 196 (55.5%) | 0 (0.0%) |
| 65 to 74 Years | 175 (29.5%) | 0 (0.0%) |
| 75 Years and over | 16 (3.5%) | 0 (0.0%) |
| Total | 2,476 (60.9%) | 64 (2.6%) |
Employment Status by Educational Attainment in Kanab
According to labor force statistics for Kanab, 75.6% of individuals (1,917) out of the total population between 25 and 64 years of age (2,536) are in the labor force, with 3.3% or 63 of them being unemployed. The group with the highest labor force participation rate are those with the educational attainment of bachelor's degree or higher, with 88.9% or 759 individuals in the labor force. Within the labor force, individuals with college / associate degree education have the highest percentage of unemployment, with 5.4% or 40 of them being unemployed.
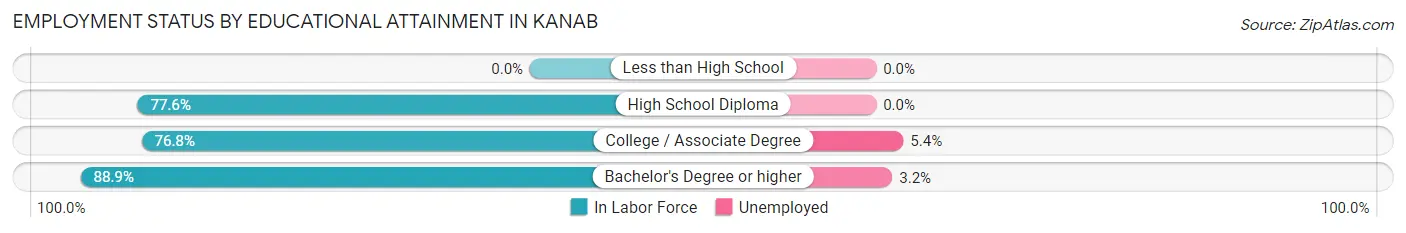
| Educational Attainment | In Labor Force | Unemployed |
| Less than High School | 0 (0.0%) | 0 (0.0%) |
| High School Diploma | 415 (77.6%) | 0 (0.0%) |
| College / Associate Degree | 744 (76.8%) | 52 (5.4%) |
| Bachelor's Degree or higher | 759 (88.9%) | 27 (3.2%) |
| Total | 1,917 (75.6%) | 84 (3.3%) |
Employment Occupations by Sex in Kanab
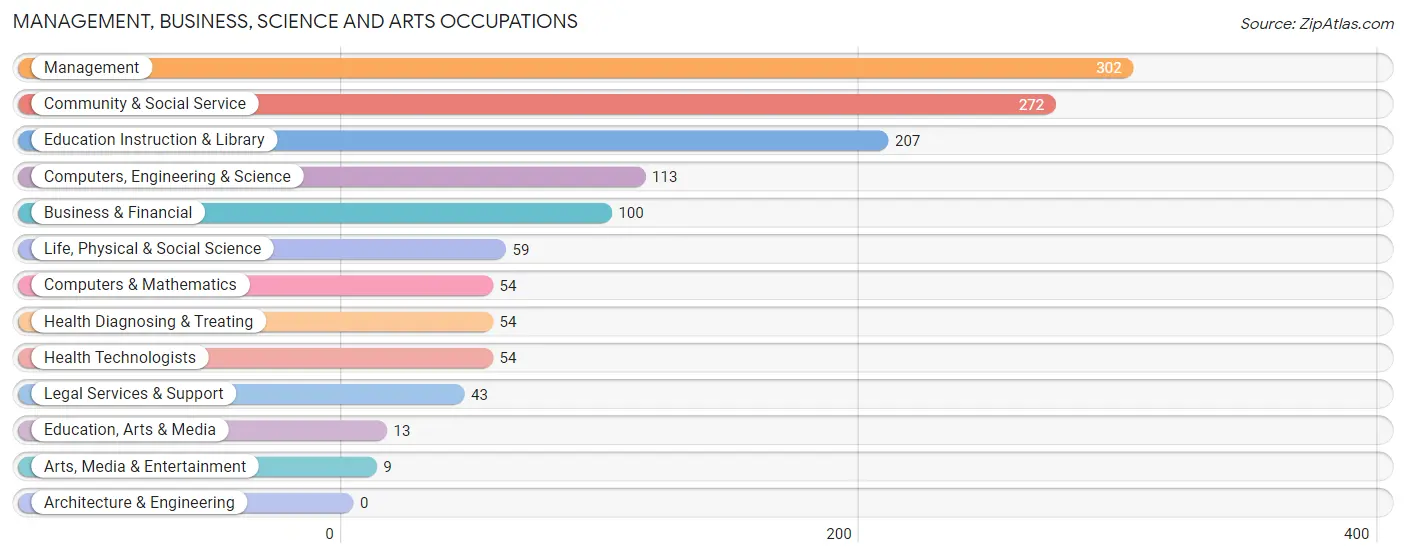
Management, Business, Science and Arts Occupations
The most common Management, Business, Science and Arts occupations in Kanab are Management (302 | 12.6%), Community & Social Service (272 | 11.4%), Education Instruction & Library (207 | 8.6%), Computers, Engineering & Science (113 | 4.7%), and Business & Financial (100 | 4.2%).
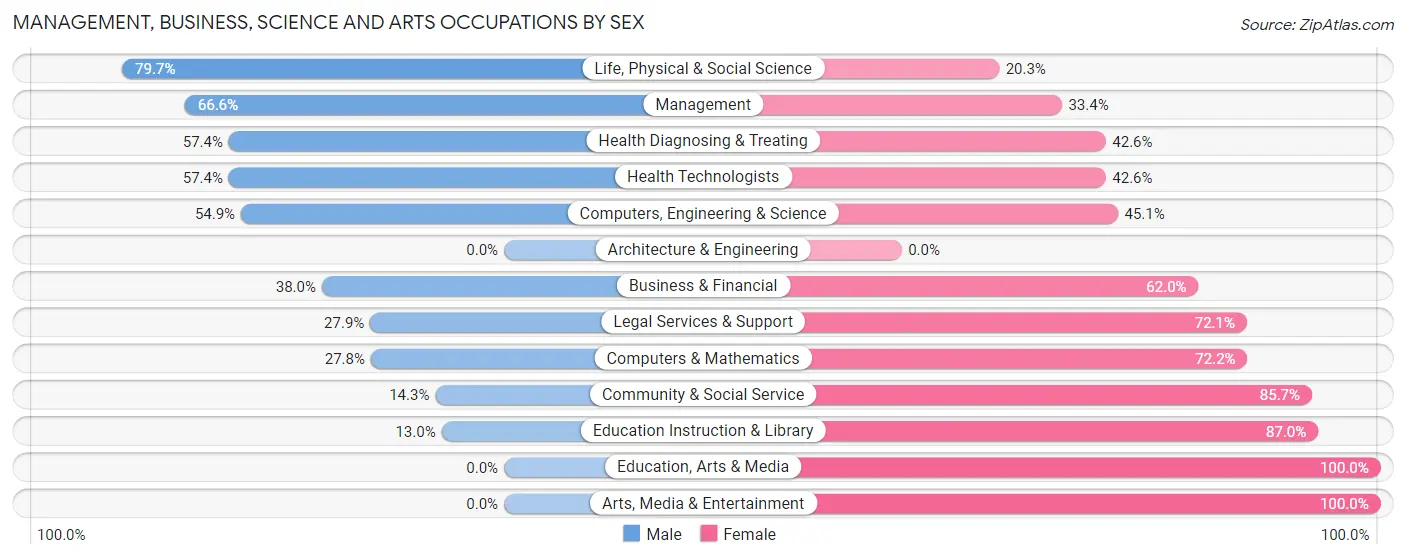
Management, Business, Science and Arts Occupations by Sex
Within the Management, Business, Science and Arts occupations in Kanab, the most male-oriented occupations are Life, Physical & Social Science (79.7%), Management (66.6%), and Health Diagnosing & Treating (57.4%), while the most female-oriented occupations are Education, Arts & Media (100.0%), Arts, Media & Entertainment (100.0%), and Education Instruction & Library (87.0%).
| Occupation | Male | Female |
| Management | 201 (66.6%) | 101 (33.4%) |
| Business & Financial | 38 (38.0%) | 62 (62.0%) |
| Computers, Engineering & Science | 62 (54.9%) | 51 (45.1%) |
| Computers & Mathematics | 15 (27.8%) | 39 (72.2%) |
| Architecture & Engineering | 0 (0.0%) | 0 (0.0%) |
| Life, Physical & Social Science | 47 (79.7%) | 12 (20.3%) |
| Community & Social Service | 39 (14.3%) | 233 (85.7%) |
| Education, Arts & Media | 0 (0.0%) | 13 (100.0%) |
| Legal Services & Support | 12 (27.9%) | 31 (72.1%) |
| Education Instruction & Library | 27 (13.0%) | 180 (87.0%) |
| Arts, Media & Entertainment | 0 (0.0%) | 9 (100.0%) |
| Health Diagnosing & Treating | 31 (57.4%) | 23 (42.6%) |
| Health Technologists | 31 (57.4%) | 23 (42.6%) |
| Total (Category) | 371 (44.1%) | 470 (55.9%) |
| Total (Overall) | 1,130 (47.2%) | 1,263 (52.8%) |
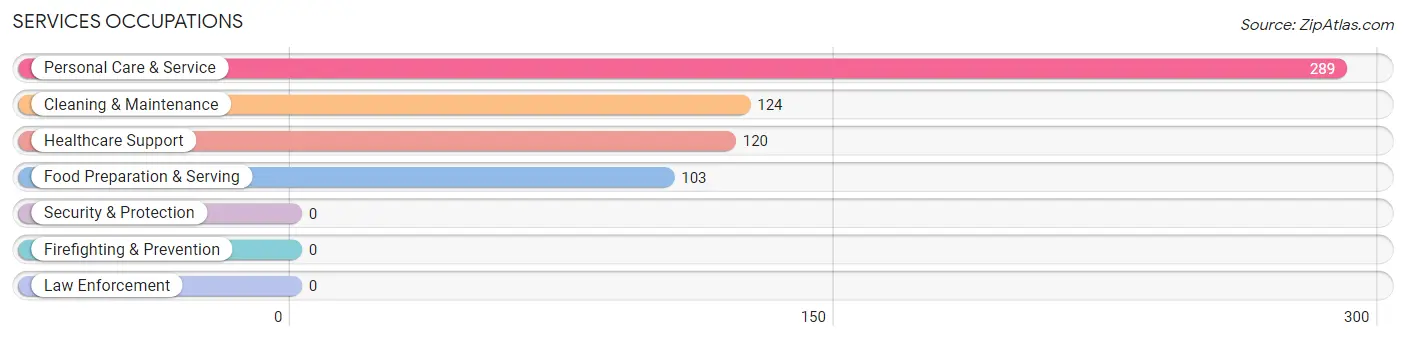
Services Occupations
The most common Services occupations in Kanab are Personal Care & Service (289 | 12.1%), Cleaning & Maintenance (124 | 5.2%), Healthcare Support (120 | 5.0%), and Food Preparation & Serving (103 | 4.3%).
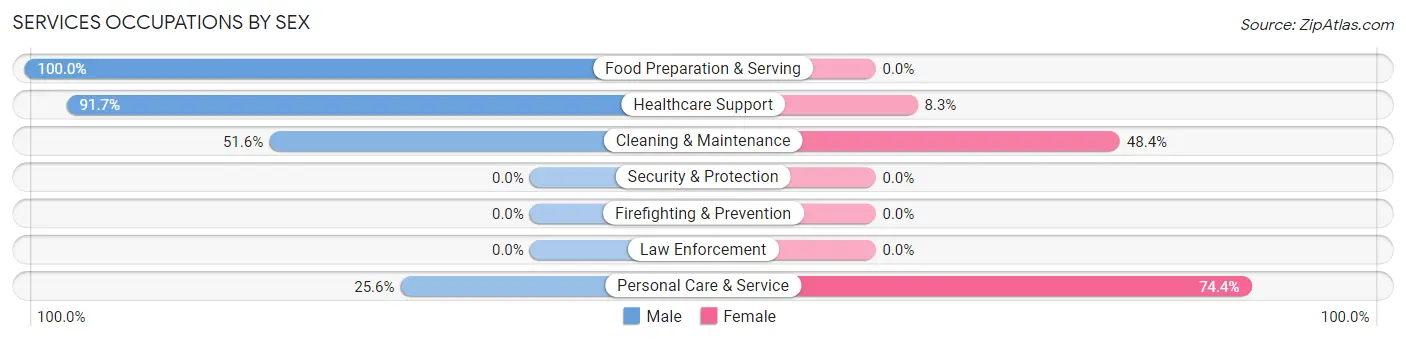
Services Occupations by Sex
Within the Services occupations in Kanab, the most male-oriented occupations are Food Preparation & Serving (100.0%), Healthcare Support (91.7%), and Cleaning & Maintenance (51.6%), while the most female-oriented occupations are Personal Care & Service (74.4%), Cleaning & Maintenance (48.4%), and Healthcare Support (8.3%).
| Occupation | Male | Female |
| Healthcare Support | 110 (91.7%) | 10 (8.3%) |
| Security & Protection | 0 (0.0%) | 0 (0.0%) |
| Firefighting & Prevention | 0 (0.0%) | 0 (0.0%) |
| Law Enforcement | 0 (0.0%) | 0 (0.0%) |
| Food Preparation & Serving | 103 (100.0%) | 0 (0.0%) |
| Cleaning & Maintenance | 64 (51.6%) | 60 (48.4%) |
| Personal Care & Service | 74 (25.6%) | 215 (74.4%) |
| Total (Category) | 351 (55.2%) | 285 (44.8%) |
| Total (Overall) | 1,130 (47.2%) | 1,263 (52.8%) |
Sales and Office Occupations
The most common Sales and Office occupations in Kanab are Office & Administration (493 | 20.6%), and Sales & Related (162 | 6.8%).
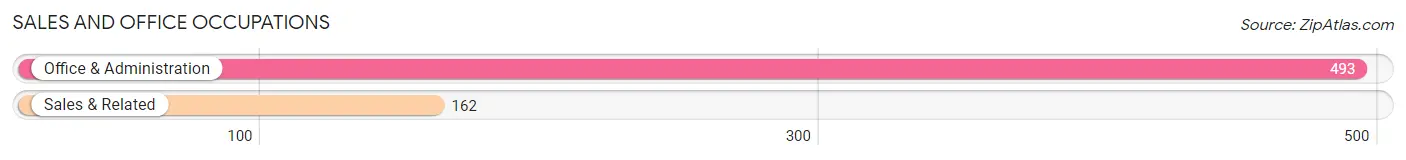
Sales and Office Occupations by Sex
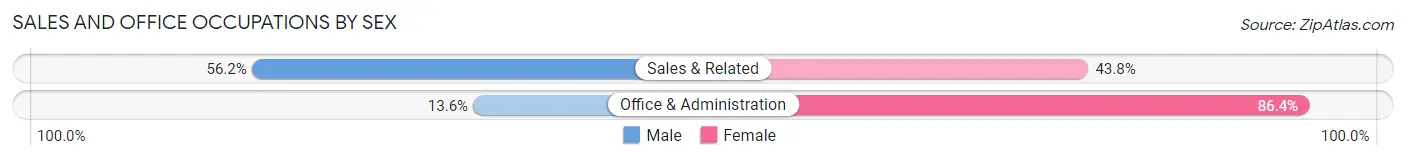
| Occupation | Male | Female |
| Sales & Related | 91 (56.2%) | 71 (43.8%) |
| Office & Administration | 67 (13.6%) | 426 (86.4%) |
| Total (Category) | 158 (24.1%) | 497 (75.9%) |
| Total (Overall) | 1,130 (47.2%) | 1,263 (52.8%) |
Natural Resources, Construction and Maintenance Occupations
The most common Natural Resources, Construction and Maintenance occupations in Kanab are Installation, Maintenance & Repair (66 | 2.8%), and Farming, Fishing & Forestry (11 | 0.5%).
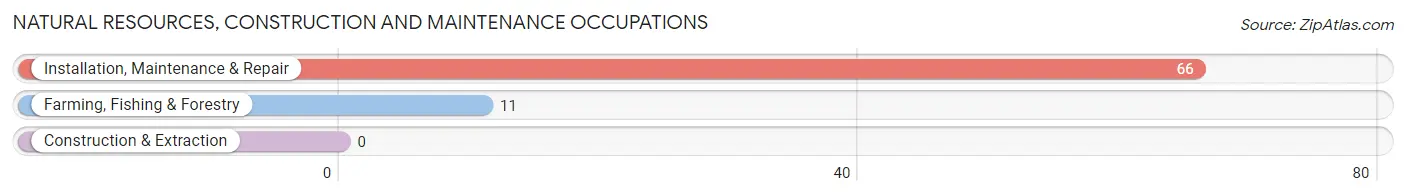
Natural Resources, Construction and Maintenance Occupations by Sex
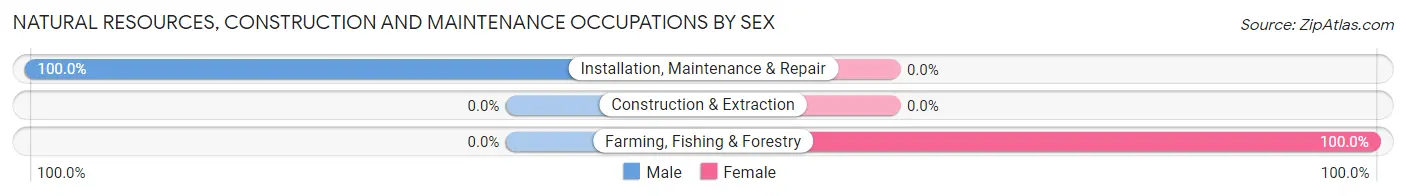
| Occupation | Male | Female |
| Farming, Fishing & Forestry | 0 (0.0%) | 11 (100.0%) |
| Construction & Extraction | 0 (0.0%) | 0 (0.0%) |
| Installation, Maintenance & Repair | 66 (100.0%) | 0 (0.0%) |
| Total (Category) | 66 (85.7%) | 11 (14.3%) |
| Total (Overall) | 1,130 (47.2%) | 1,263 (52.8%) |
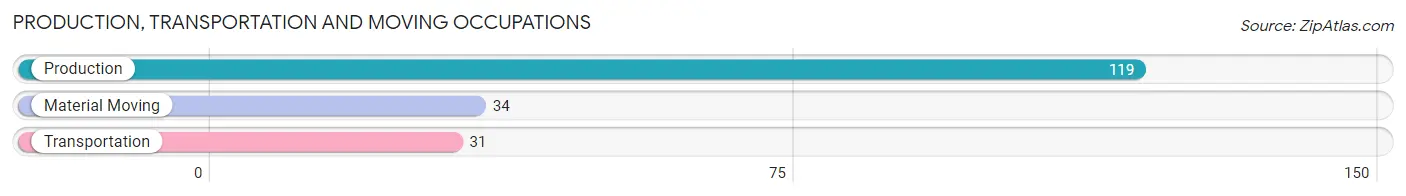
Production, Transportation and Moving Occupations
The most common Production, Transportation and Moving occupations in Kanab are Production (119 | 5.0%), Material Moving (34 | 1.4%), and Transportation (31 | 1.3%).
Production, Transportation and Moving Occupations by Sex
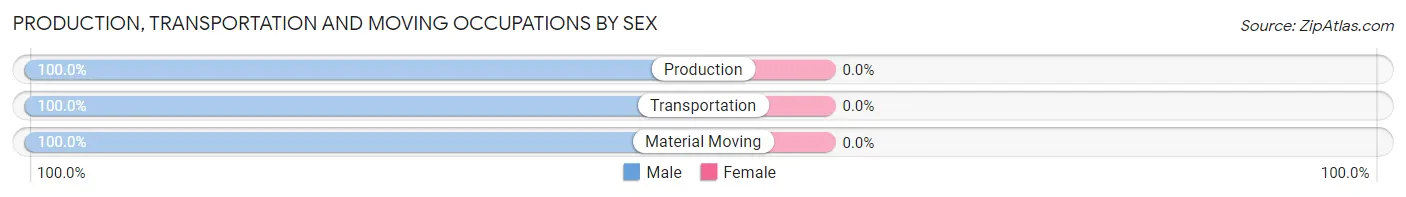
| Occupation | Male | Female |
| Production | 119 (100.0%) | 0 (0.0%) |
| Transportation | 31 (100.0%) | 0 (0.0%) |
| Material Moving | 34 (100.0%) | 0 (0.0%) |
| Total (Category) | 184 (100.0%) | 0 (0.0%) |
| Total (Overall) | 1,130 (47.2%) | 1,263 (52.8%) |
Employment Industries by Sex in Kanab
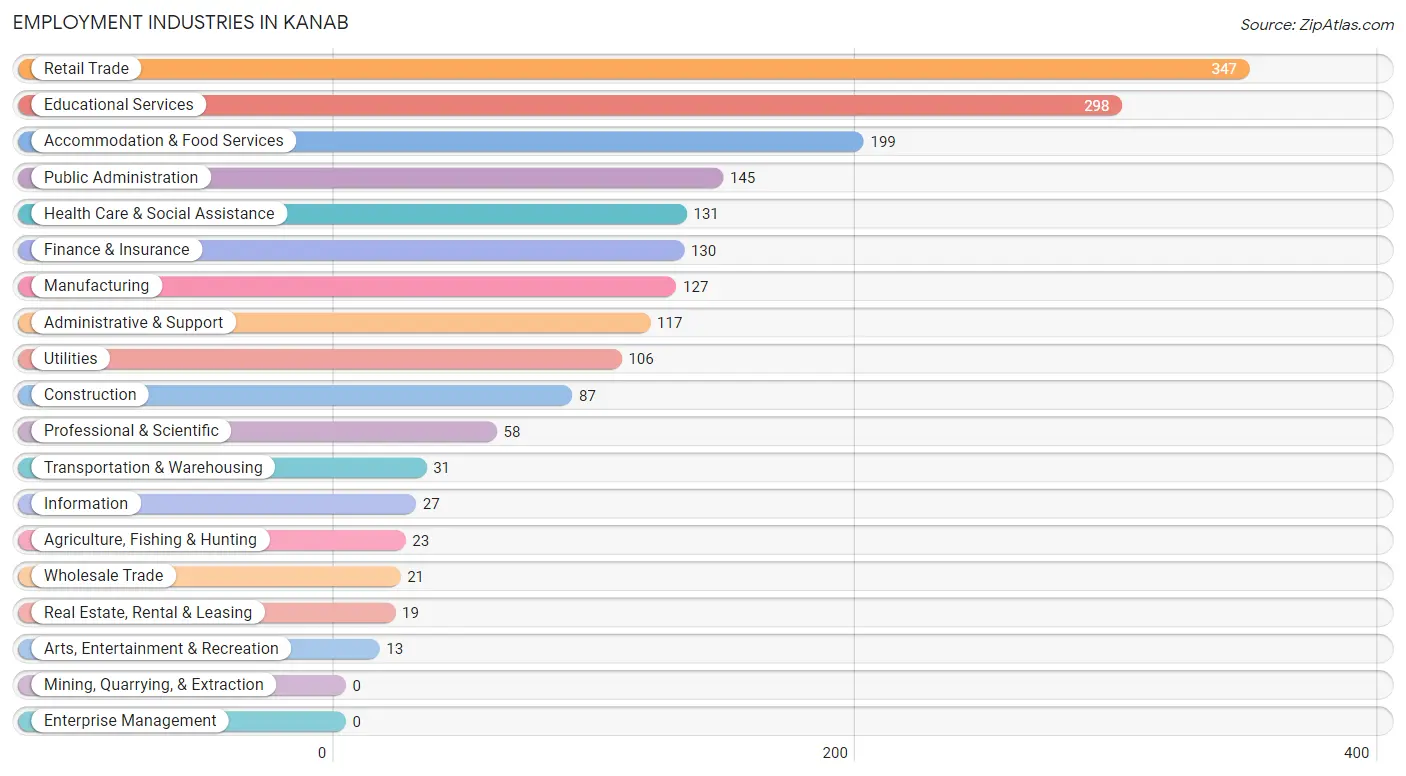
Employment Industries in Kanab
The major employment industries in Kanab include Retail Trade (347 | 14.5%), Educational Services (298 | 12.4%), Accommodation & Food Services (199 | 8.3%), Public Administration (145 | 6.1%), and Health Care & Social Assistance (131 | 5.5%).
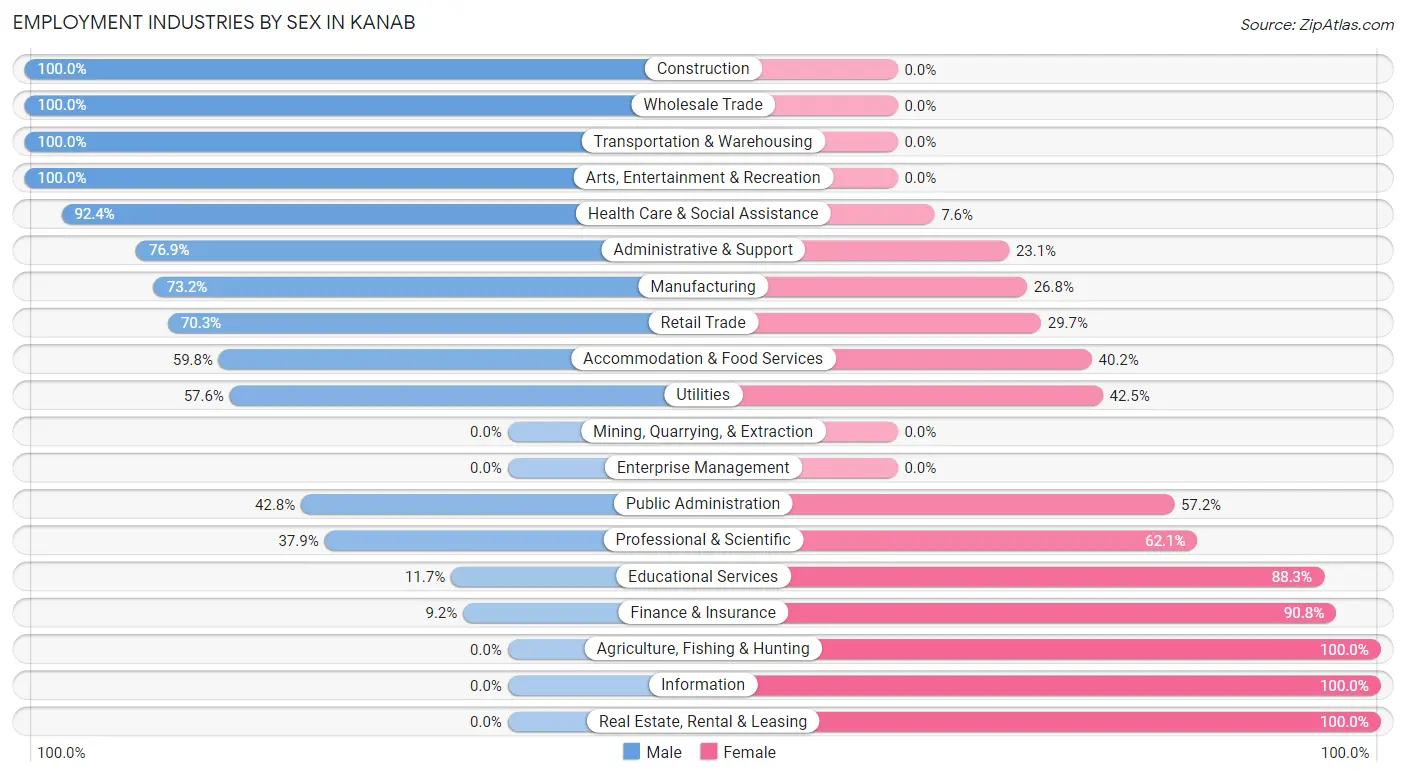
Employment Industries by Sex in Kanab
The Kanab industries that see more men than women are Construction (100.0%), Wholesale Trade (100.0%), and Transportation & Warehousing (100.0%), whereas the industries that tend to have a higher number of women are Agriculture, Fishing & Hunting (100.0%), Information (100.0%), and Real Estate, Rental & Leasing (100.0%).
| Industry | Male | Female |
| Agriculture, Fishing & Hunting | 0 (0.0%) | 23 (100.0%) |
| Mining, Quarrying, & Extraction | 0 (0.0%) | 0 (0.0%) |
| Construction | 87 (100.0%) | 0 (0.0%) |
| Manufacturing | 93 (73.2%) | 34 (26.8%) |
| Wholesale Trade | 21 (100.0%) | 0 (0.0%) |
| Retail Trade | 244 (70.3%) | 103 (29.7%) |
| Transportation & Warehousing | 31 (100.0%) | 0 (0.0%) |
| Utilities | 61 (57.6%) | 45 (42.4%) |
| Information | 0 (0.0%) | 27 (100.0%) |
| Finance & Insurance | 12 (9.2%) | 118 (90.8%) |
| Real Estate, Rental & Leasing | 0 (0.0%) | 19 (100.0%) |
| Professional & Scientific | 22 (37.9%) | 36 (62.1%) |
| Enterprise Management | 0 (0.0%) | 0 (0.0%) |
| Administrative & Support | 90 (76.9%) | 27 (23.1%) |
| Educational Services | 35 (11.7%) | 263 (88.3%) |
| Health Care & Social Assistance | 121 (92.4%) | 10 (7.6%) |
| Arts, Entertainment & Recreation | 13 (100.0%) | 0 (0.0%) |
| Accommodation & Food Services | 119 (59.8%) | 80 (40.2%) |
| Public Administration | 62 (42.8%) | 83 (57.2%) |
| Total | 1,130 (47.2%) | 1,263 (52.8%) |
Education in Kanab
School Enrollment in Kanab
The most common levels of schooling among the 815 students in Kanab are high school (238 | 29.2%), middle school (202 | 24.8%), and college / undergraduate (133 | 16.3%).
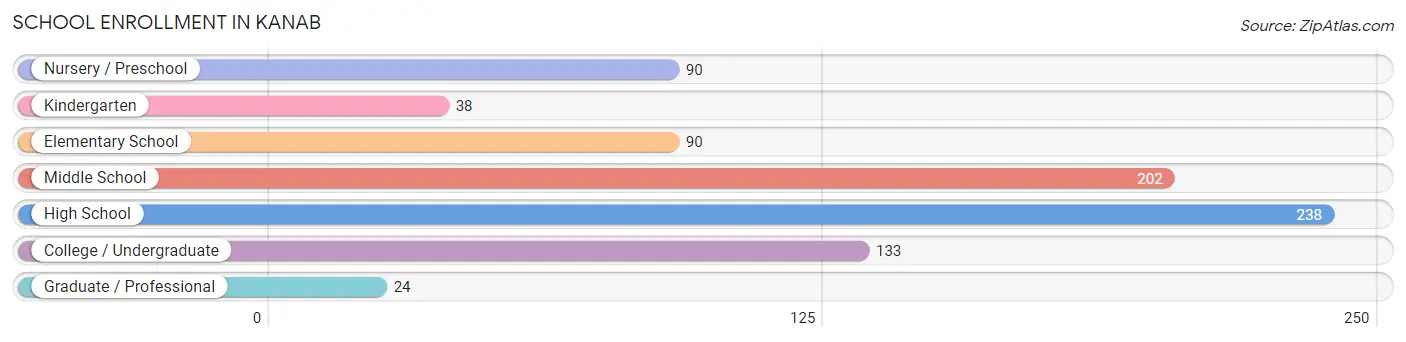
| School Level | # Students | % Students |
| Nursery / Preschool | 90 | 11.0% |
| Kindergarten | 38 | 4.7% |
| Elementary School | 90 | 11.0% |
| Middle School | 202 | 24.8% |
| High School | 238 | 29.2% |
| College / Undergraduate | 133 | 16.3% |
| Graduate / Professional | 24 | 2.9% |
| Total | 815 | 100.0% |
School Enrollment by Age by Funding Source in Kanab
Out of a total of 815 students who are enrolled in schools in Kanab, 142 (17.4%) attend a private institution, while the remaining 673 (82.6%) are enrolled in public schools. The age group of 25 to 34 year olds has the highest likelihood of being enrolled in private schools, with 79 (73.8% in the age bracket) enrolled. Conversely, the age group of 5 to 9 year old has the lowest likelihood of being enrolled in a private school, with 128 (100.0% in the age bracket) attending a public institution.
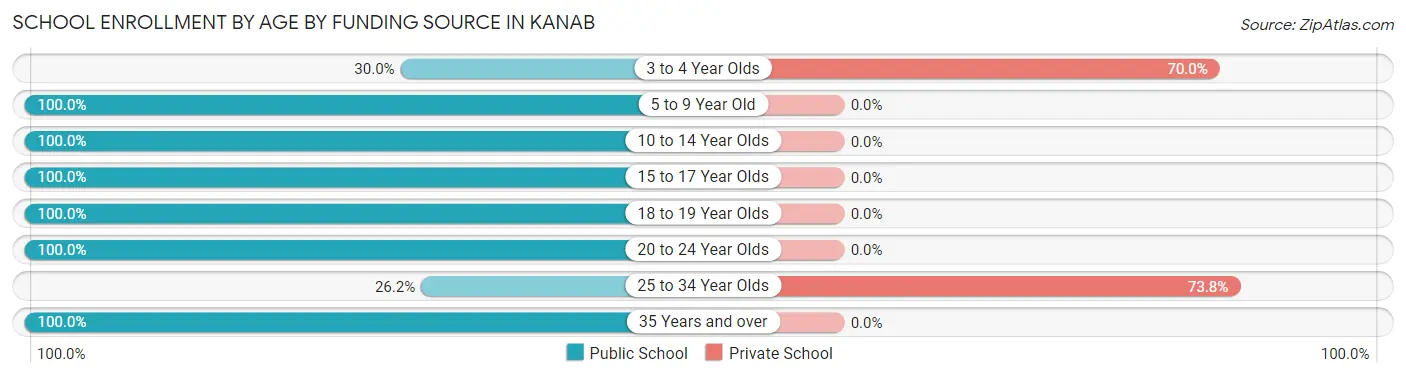
| Age Bracket | Public School | Private School |
| 3 to 4 Year Olds | 27 (30.0%) | 63 (70.0%) |
| 5 to 9 Year Old | 128 (100.0%) | 0 (0.0%) |
| 10 to 14 Year Olds | 202 (100.0%) | 0 (0.0%) |
| 15 to 17 Year Olds | 192 (100.0%) | 0 (0.0%) |
| 18 to 19 Year Olds | 37 (100.0%) | 0 (0.0%) |
| 20 to 24 Year Olds | 30 (100.0%) | 0 (0.0%) |
| 25 to 34 Year Olds | 28 (26.2%) | 79 (73.8%) |
| 35 Years and over | 29 (100.0%) | 0 (0.0%) |
| Total | 673 (82.6%) | 142 (17.4%) |
Educational Attainment by Field of Study in Kanab
Education (281 | 22.2%), business (194 | 15.3%), bio, nature & agricultural (129 | 10.2%), engineering (125 | 9.9%), and social sciences (118 | 9.3%) are the most common fields of study among 1,264 individuals in Kanab who have obtained a bachelor's degree or higher.
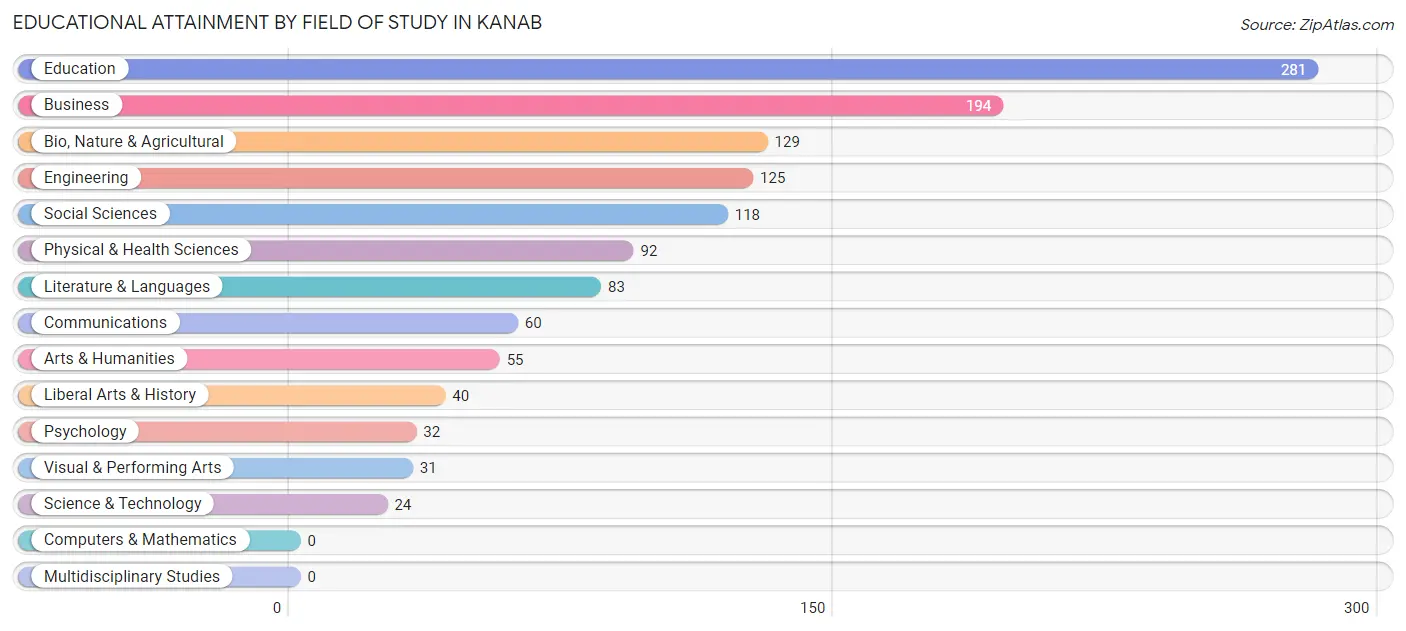
| Field of Study | # Graduates | % Graduates |
| Computers & Mathematics | 0 | 0.0% |
| Bio, Nature & Agricultural | 129 | 10.2% |
| Physical & Health Sciences | 92 | 7.3% |
| Psychology | 32 | 2.5% |
| Social Sciences | 118 | 9.3% |
| Engineering | 125 | 9.9% |
| Multidisciplinary Studies | 0 | 0.0% |
| Science & Technology | 24 | 1.9% |
| Business | 194 | 15.3% |
| Education | 281 | 22.2% |
| Literature & Languages | 83 | 6.6% |
| Liberal Arts & History | 40 | 3.2% |
| Visual & Performing Arts | 31 | 2.5% |
| Communications | 60 | 4.8% |
| Arts & Humanities | 55 | 4.3% |
| Total | 1,264 | 100.0% |
Transportation & Commute in Kanab
Vehicle Availability by Sex in Kanab
The most prevalent vehicle ownership categories in Kanab are males with 2 vehicles (488, accounting for 43.1%) and females with 2 vehicles (379, making up 39.2%).
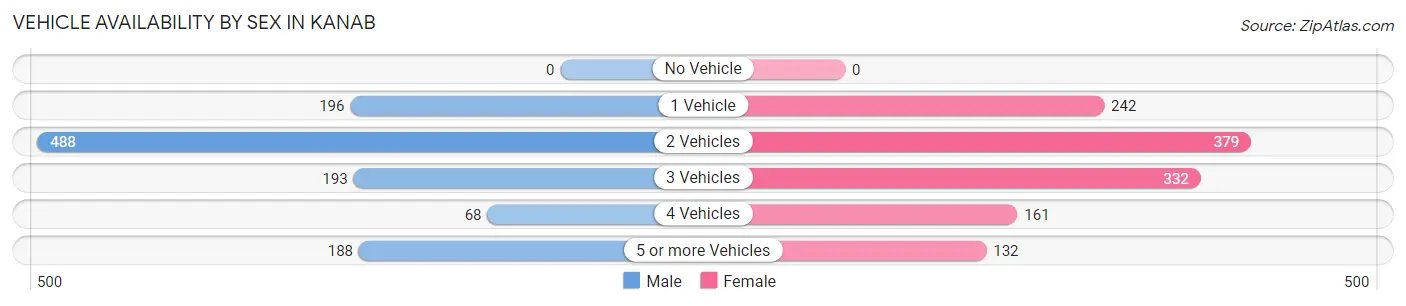
| Vehicles Available | Male | Female |
| No Vehicle | 0 (0.0%) | 0 (0.0%) |
| 1 Vehicle | 196 (17.3%) | 242 (19.4%) |
| 2 Vehicles | 488 (43.1%) | 379 (30.4%) |
| 3 Vehicles | 193 (17.0%) | 332 (26.7%) |
| 4 Vehicles | 68 (6.0%) | 161 (12.9%) |
| 5 or more Vehicles | 188 (16.6%) | 132 (10.6%) |
| Total | 1,133 (100.0%) | 1,246 (100.0%) |
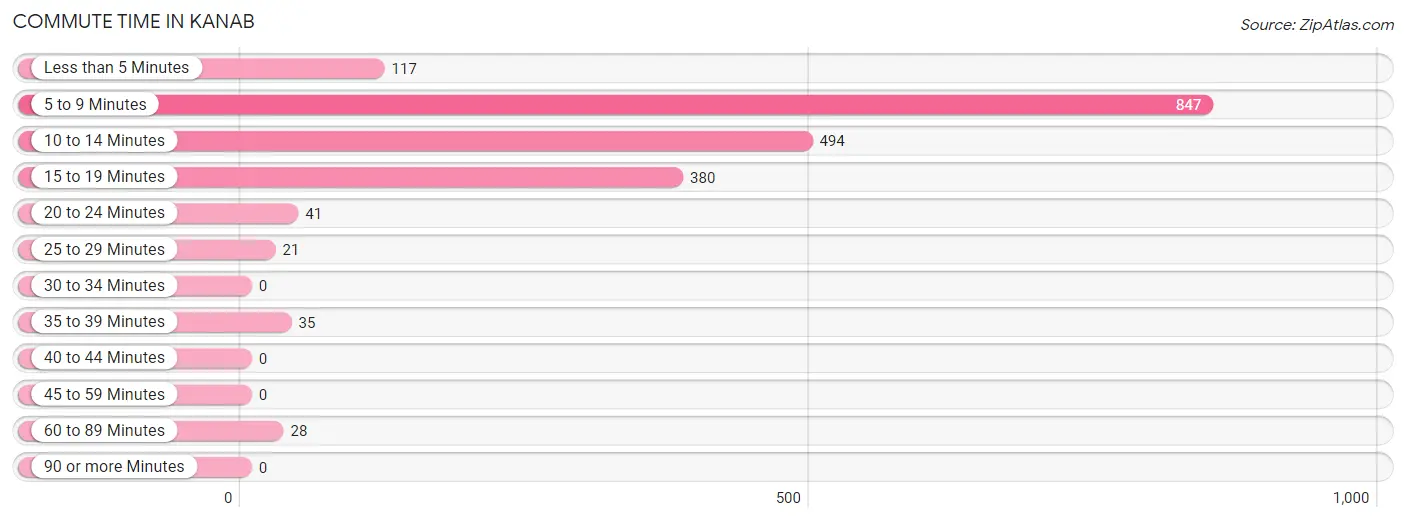
Commute Time in Kanab
The most frequently occuring commute durations in Kanab are 5 to 9 minutes (847 commuters, 43.1%), 10 to 14 minutes (494 commuters, 25.2%), and 15 to 19 minutes (380 commuters, 19.4%).
| Commute Time | # Commuters | % Commuters |
| Less than 5 Minutes | 117 | 6.0% |
| 5 to 9 Minutes | 847 | 43.1% |
| 10 to 14 Minutes | 494 | 25.2% |
| 15 to 19 Minutes | 380 | 19.4% |
| 20 to 24 Minutes | 41 | 2.1% |
| 25 to 29 Minutes | 21 | 1.1% |
| 30 to 34 Minutes | 0 | 0.0% |
| 35 to 39 Minutes | 35 | 1.8% |
| 40 to 44 Minutes | 0 | 0.0% |
| 45 to 59 Minutes | 0 | 0.0% |
| 60 to 89 Minutes | 28 | 1.4% |
| 90 or more Minutes | 0 | 0.0% |
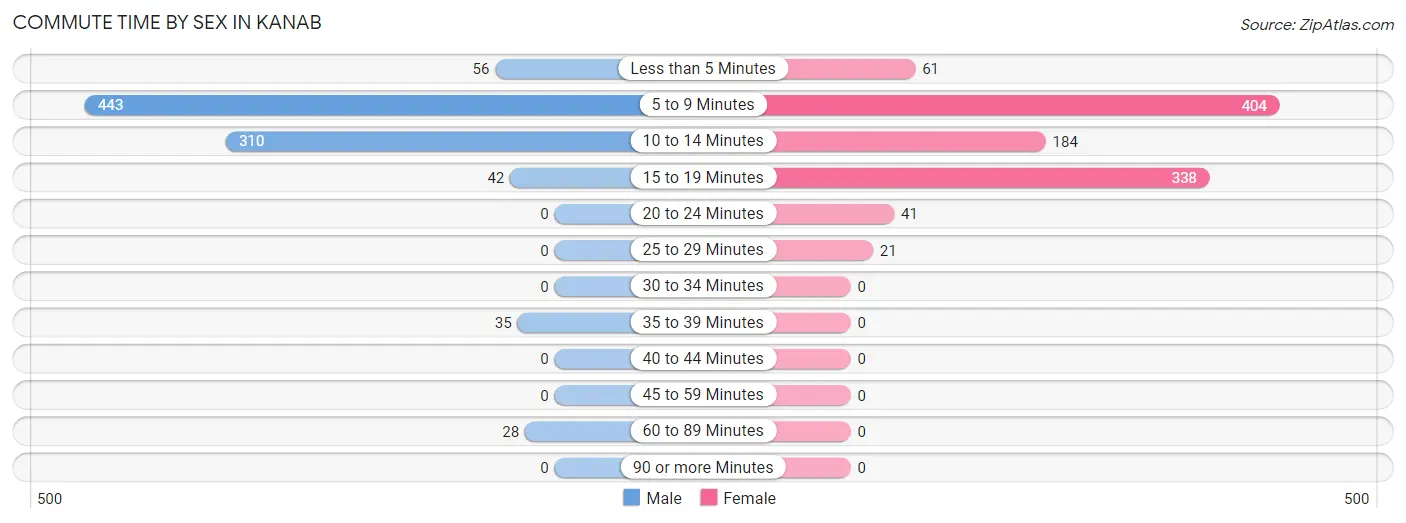
Commute Time by Sex in Kanab
The most common commute times in Kanab are 5 to 9 minutes (443 commuters, 48.5%) for males and 5 to 9 minutes (404 commuters, 38.5%) for females.
| Commute Time | Male | Female |
| Less than 5 Minutes | 56 (6.1%) | 61 (5.8%) |
| 5 to 9 Minutes | 443 (48.5%) | 404 (38.5%) |
| 10 to 14 Minutes | 310 (33.9%) | 184 (17.5%) |
| 15 to 19 Minutes | 42 (4.6%) | 338 (32.2%) |
| 20 to 24 Minutes | 0 (0.0%) | 41 (3.9%) |
| 25 to 29 Minutes | 0 (0.0%) | 21 (2.0%) |
| 30 to 34 Minutes | 0 (0.0%) | 0 (0.0%) |
| 35 to 39 Minutes | 35 (3.8%) | 0 (0.0%) |
| 40 to 44 Minutes | 0 (0.0%) | 0 (0.0%) |
| 45 to 59 Minutes | 0 (0.0%) | 0 (0.0%) |
| 60 to 89 Minutes | 28 (3.1%) | 0 (0.0%) |
| 90 or more Minutes | 0 (0.0%) | 0 (0.0%) |
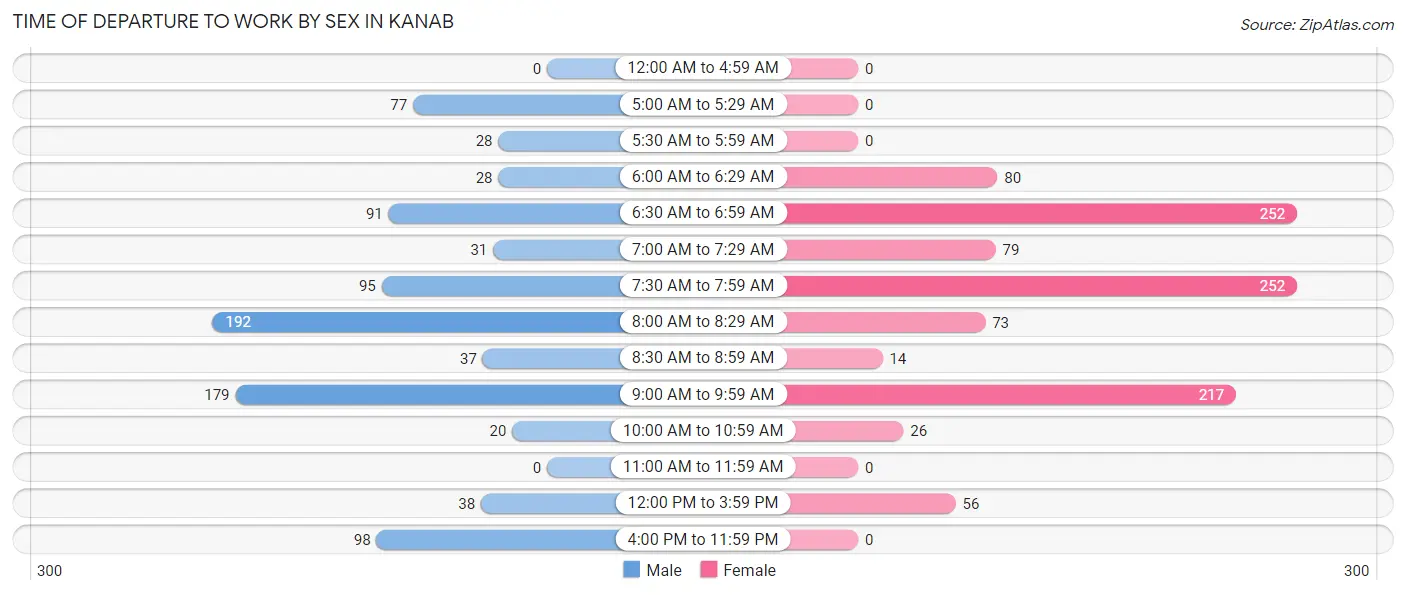
Time of Departure to Work by Sex in Kanab
The most frequent times of departure to work in Kanab are 8:00 AM to 8:29 AM (192, 21.0%) for males and 6:30 AM to 6:59 AM (252, 24.0%) for females.
| Time of Departure | Male | Female |
| 12:00 AM to 4:59 AM | 0 (0.0%) | 0 (0.0%) |
| 5:00 AM to 5:29 AM | 77 (8.4%) | 0 (0.0%) |
| 5:30 AM to 5:59 AM | 28 (3.1%) | 0 (0.0%) |
| 6:00 AM to 6:29 AM | 28 (3.1%) | 80 (7.6%) |
| 6:30 AM to 6:59 AM | 91 (10.0%) | 252 (24.0%) |
| 7:00 AM to 7:29 AM | 31 (3.4%) | 79 (7.5%) |
| 7:30 AM to 7:59 AM | 95 (10.4%) | 252 (24.0%) |
| 8:00 AM to 8:29 AM | 192 (21.0%) | 73 (7.0%) |
| 8:30 AM to 8:59 AM | 37 (4.1%) | 14 (1.3%) |
| 9:00 AM to 9:59 AM | 179 (19.6%) | 217 (20.7%) |
| 10:00 AM to 10:59 AM | 20 (2.2%) | 26 (2.5%) |
| 11:00 AM to 11:59 AM | 0 (0.0%) | 0 (0.0%) |
| 12:00 PM to 3:59 PM | 38 (4.2%) | 56 (5.3%) |
| 4:00 PM to 11:59 PM | 98 (10.7%) | 0 (0.0%) |
| Total | 914 (100.0%) | 1,049 (100.0%) |
Housing Occupancy in Kanab
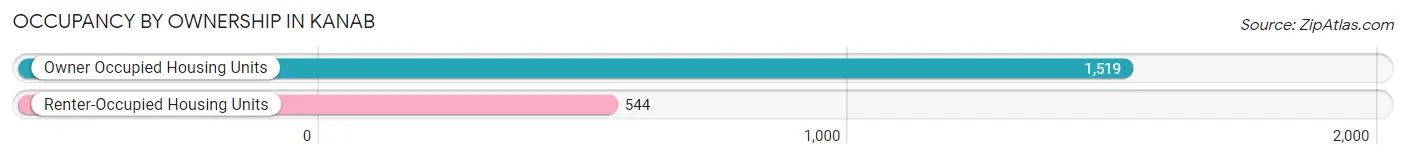
Occupancy by Ownership in Kanab
Of the total 2,063 dwellings in Kanab, owner-occupied units account for 1,519 (73.6%), while renter-occupied units make up 544 (26.4%).
| Occupancy | # Housing Units | % Housing Units |
| Owner Occupied Housing Units | 1,519 | 73.6% |
| Renter-Occupied Housing Units | 544 | 26.4% |
| Total Occupied Housing Units | 2,063 | 100.0% |
Occupancy by Household Size in Kanab
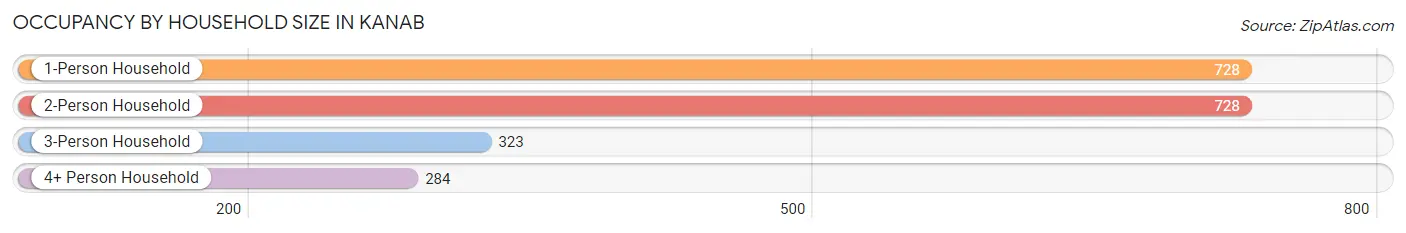
| Household Size | # Housing Units | % Housing Units |
| 1-Person Household | 728 | 35.3% |
| 2-Person Household | 728 | 35.3% |
| 3-Person Household | 323 | 15.7% |
| 4+ Person Household | 284 | 13.8% |
| Total Housing Units | 2,063 | 100.0% |
Occupancy by Ownership by Household Size in Kanab
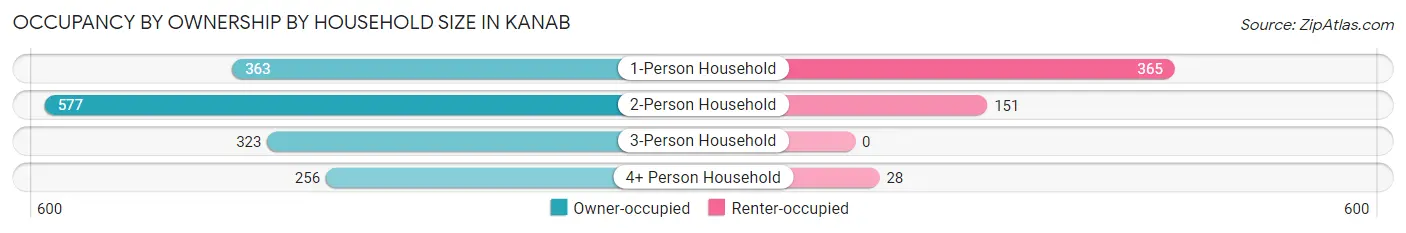
| Household Size | Owner-occupied | Renter-occupied |
| 1-Person Household | 363 (49.9%) | 365 (50.1%) |
| 2-Person Household | 577 (79.3%) | 151 (20.7%) |
| 3-Person Household | 323 (100.0%) | 0 (0.0%) |
| 4+ Person Household | 256 (90.1%) | 28 (9.9%) |
| Total Housing Units | 1,519 (73.6%) | 544 (26.4%) |
Occupancy by Educational Attainment in Kanab
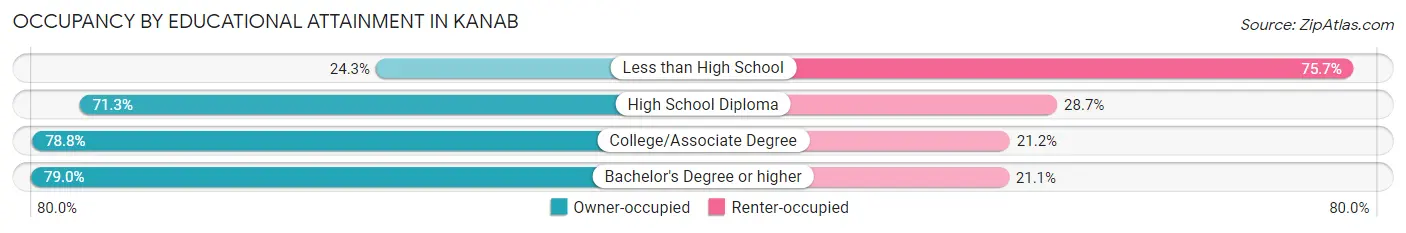
| Household Size | Owner-occupied | Renter-occupied |
| Less than High School | 34 (24.3%) | 106 (75.7%) |
| High School Diploma | 298 (71.3%) | 120 (28.7%) |
| College/Associate Degree | 587 (78.8%) | 158 (21.2%) |
| Bachelor's Degree or higher | 600 (78.9%) | 160 (21.0%) |
Occupancy by Age of Householder in Kanab
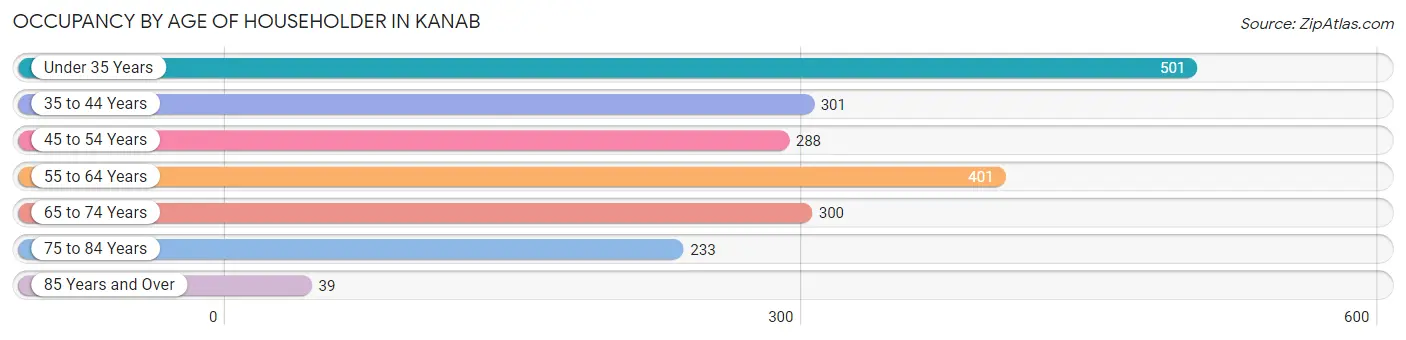
| Age Bracket | # Households | % Households |
| Under 35 Years | 501 | 24.3% |
| 35 to 44 Years | 301 | 14.6% |
| 45 to 54 Years | 288 | 14.0% |
| 55 to 64 Years | 401 | 19.4% |
| 65 to 74 Years | 300 | 14.5% |
| 75 to 84 Years | 233 | 11.3% |
| 85 Years and Over | 39 | 1.9% |
| Total | 2,063 | 100.0% |
Housing Finances in Kanab
Median Income by Occupancy in Kanab
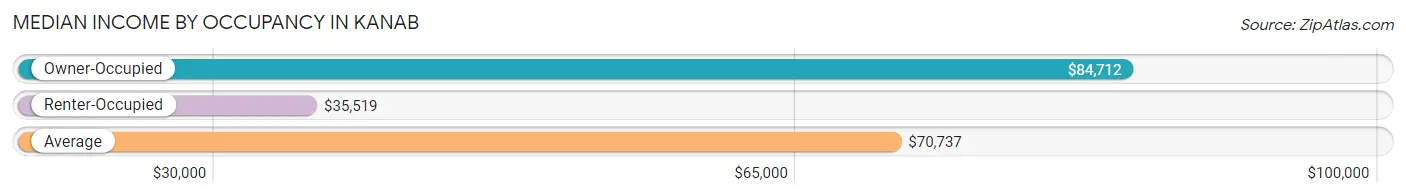
| Occupancy Type | # Households | Median Income |
| Owner-Occupied | 1,519 (73.6%) | $84,712 |
| Renter-Occupied | 544 (26.4%) | $35,519 |
| Average | 2,063 (100.0%) | $70,737 |
Occupancy by Householder Income Bracket in Kanab
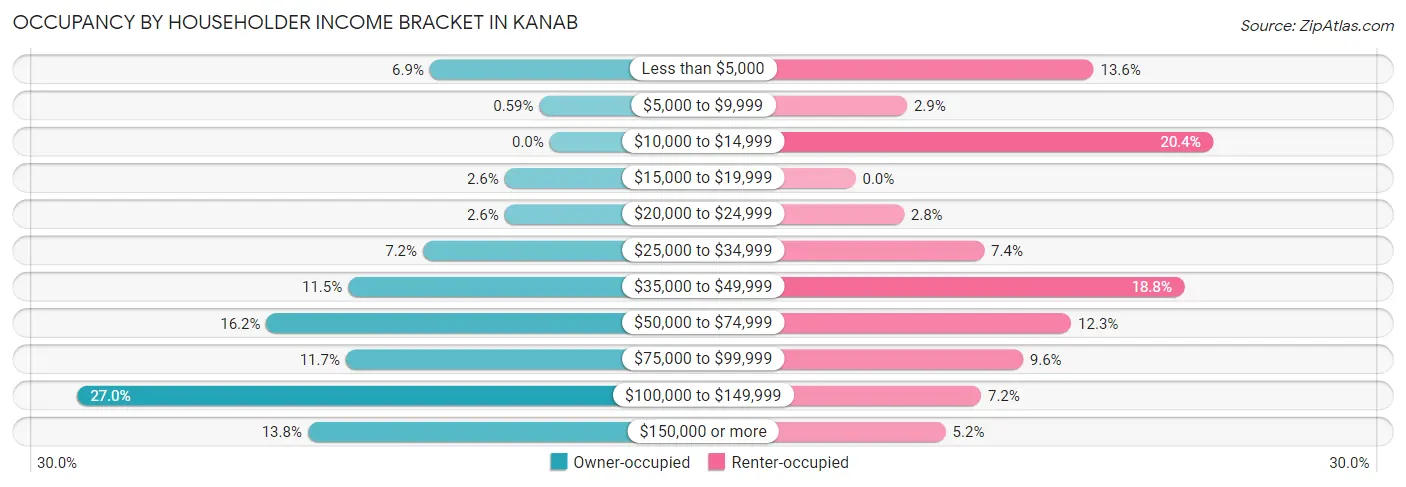
| Income Bracket | Owner-occupied | Renter-occupied |
| Less than $5,000 | 104 (6.9%) | 74 (13.6%) |
| $5,000 to $9,999 | 9 (0.6%) | 16 (2.9%) |
| $10,000 to $14,999 | 0 (0.0%) | 111 (20.4%) |
| $15,000 to $19,999 | 39 (2.6%) | 0 (0.0%) |
| $20,000 to $24,999 | 39 (2.6%) | 15 (2.8%) |
| $25,000 to $34,999 | 110 (7.2%) | 40 (7.3%) |
| $35,000 to $49,999 | 175 (11.5%) | 102 (18.8%) |
| $50,000 to $74,999 | 246 (16.2%) | 67 (12.3%) |
| $75,000 to $99,999 | 177 (11.7%) | 52 (9.6%) |
| $100,000 to $149,999 | 410 (27.0%) | 39 (7.2%) |
| $150,000 or more | 210 (13.8%) | 28 (5.1%) |
| Total | 1,519 (100.0%) | 544 (100.0%) |
Monthly Housing Cost Tiers in Kanab
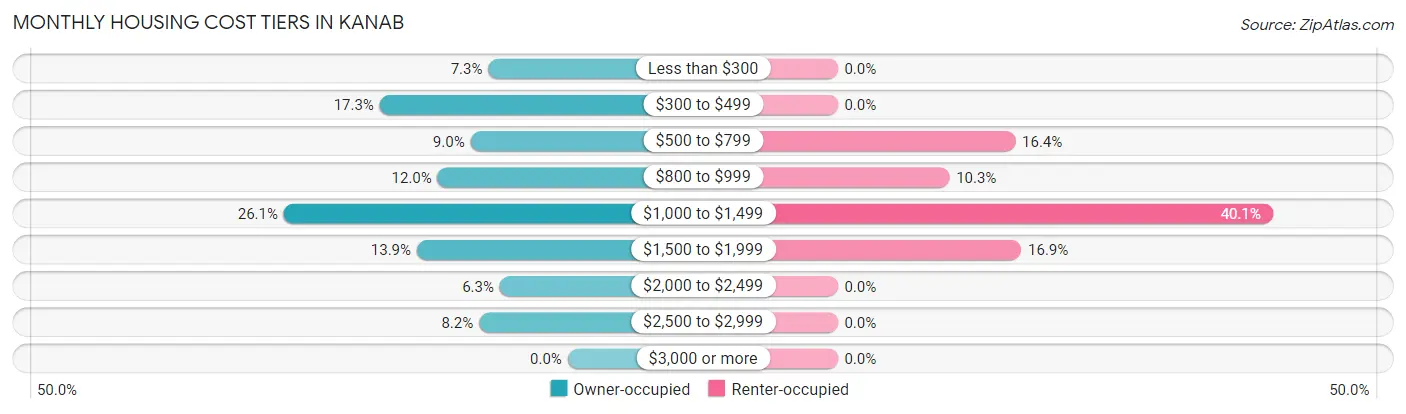
| Monthly Cost | Owner-occupied | Renter-occupied |
| Less than $300 | 111 (7.3%) | 0 (0.0%) |
| $300 to $499 | 263 (17.3%) | 0 (0.0%) |
| $500 to $799 | 136 (8.9%) | 89 (16.4%) |
| $800 to $999 | 182 (12.0%) | 56 (10.3%) |
| $1,000 to $1,499 | 397 (26.1%) | 218 (40.1%) |
| $1,500 to $1,999 | 211 (13.9%) | 92 (16.9%) |
| $2,000 to $2,499 | 95 (6.2%) | 0 (0.0%) |
| $2,500 to $2,999 | 124 (8.2%) | 0 (0.0%) |
| $3,000 or more | 0 (0.0%) | 0 (0.0%) |
| Total | 1,519 (100.0%) | 544 (100.0%) |
Physical Housing Characteristics in Kanab
Housing Structures in Kanab
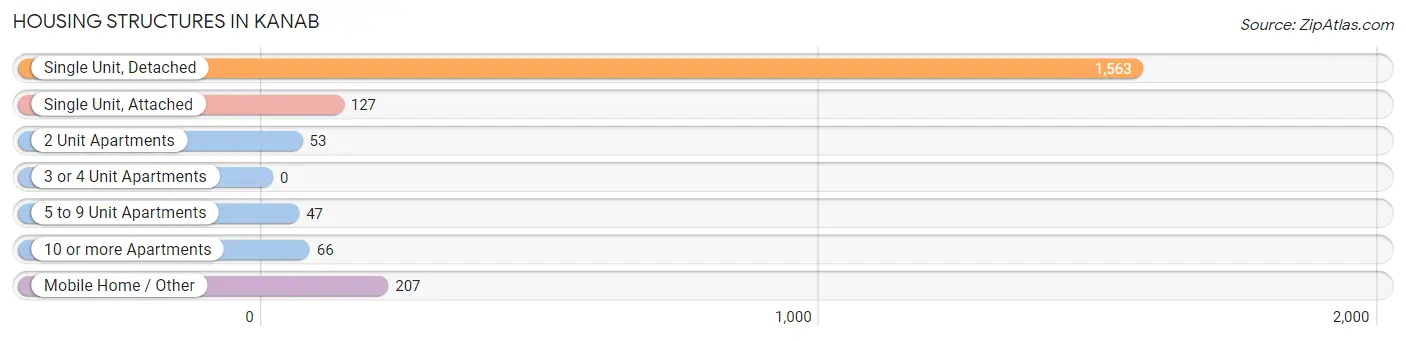
| Structure Type | # Housing Units | % Housing Units |
| Single Unit, Detached | 1,563 | 75.8% |
| Single Unit, Attached | 127 | 6.2% |
| 2 Unit Apartments | 53 | 2.6% |
| 3 or 4 Unit Apartments | 0 | 0.0% |
| 5 to 9 Unit Apartments | 47 | 2.3% |
| 10 or more Apartments | 66 | 3.2% |
| Mobile Home / Other | 207 | 10.0% |
| Total | 2,063 | 100.0% |
Housing Structures by Occupancy in Kanab
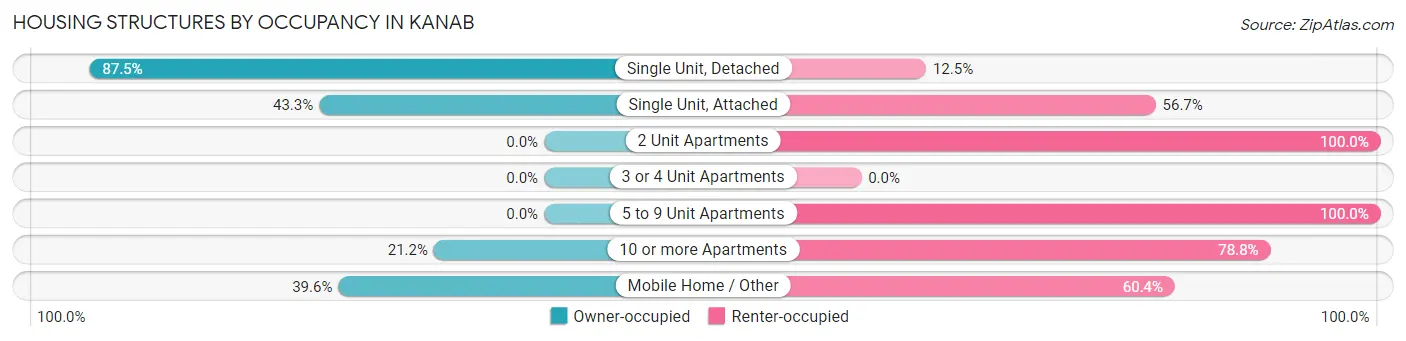
| Structure Type | Owner-occupied | Renter-occupied |
| Single Unit, Detached | 1,368 (87.5%) | 195 (12.5%) |
| Single Unit, Attached | 55 (43.3%) | 72 (56.7%) |
| 2 Unit Apartments | 0 (0.0%) | 53 (100.0%) |
| 3 or 4 Unit Apartments | 0 (0.0%) | 0 (0.0%) |
| 5 to 9 Unit Apartments | 0 (0.0%) | 47 (100.0%) |
| 10 or more Apartments | 14 (21.2%) | 52 (78.8%) |
| Mobile Home / Other | 82 (39.6%) | 125 (60.4%) |
| Total | 1,519 (73.6%) | 544 (26.4%) |
Housing Structures by Number of Rooms in Kanab
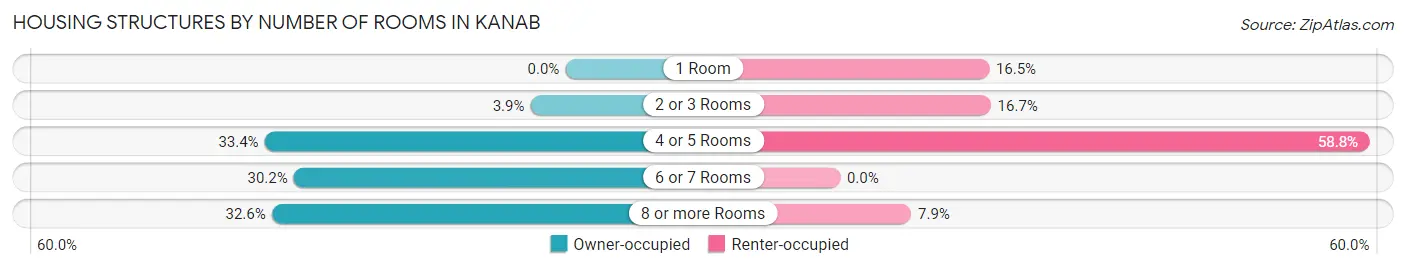
| Number of Rooms | Owner-occupied | Renter-occupied |
| 1 Room | 0 (0.0%) | 90 (16.5%) |
| 2 or 3 Rooms | 59 (3.9%) | 91 (16.7%) |
| 4 or 5 Rooms | 507 (33.4%) | 320 (58.8%) |
| 6 or 7 Rooms | 458 (30.1%) | 0 (0.0%) |
| 8 or more Rooms | 495 (32.6%) | 43 (7.9%) |
| Total | 1,519 (100.0%) | 544 (100.0%) |
Housing Structure by Heating Type in Kanab
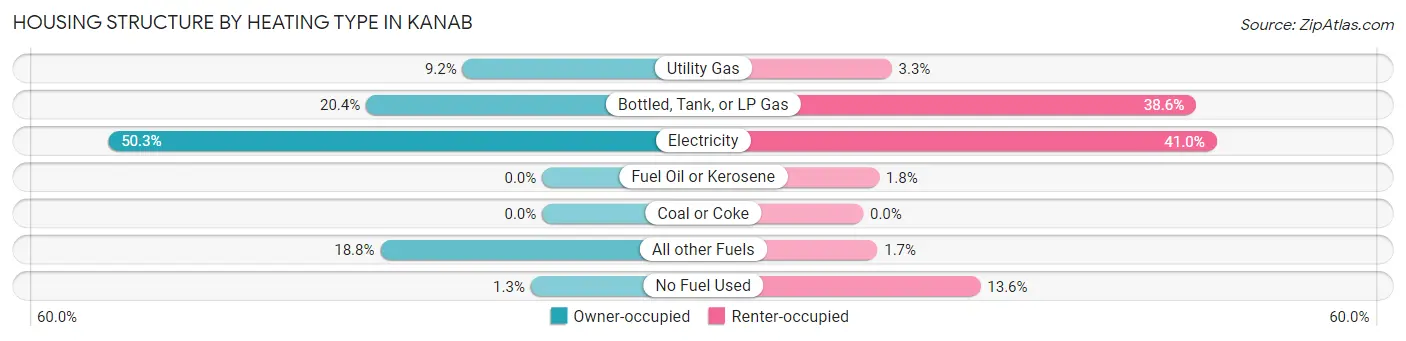
| Heating Type | Owner-occupied | Renter-occupied |
| Utility Gas | 140 (9.2%) | 18 (3.3%) |
| Bottled, Tank, or LP Gas | 310 (20.4%) | 210 (38.6%) |
| Electricity | 764 (50.3%) | 223 (41.0%) |
| Fuel Oil or Kerosene | 0 (0.0%) | 10 (1.8%) |
| Coal or Coke | 0 (0.0%) | 0 (0.0%) |
| All other Fuels | 285 (18.8%) | 9 (1.7%) |
| No Fuel Used | 20 (1.3%) | 74 (13.6%) |
| Total | 1,519 (100.0%) | 544 (100.0%) |
Household Vehicle Usage in Kanab
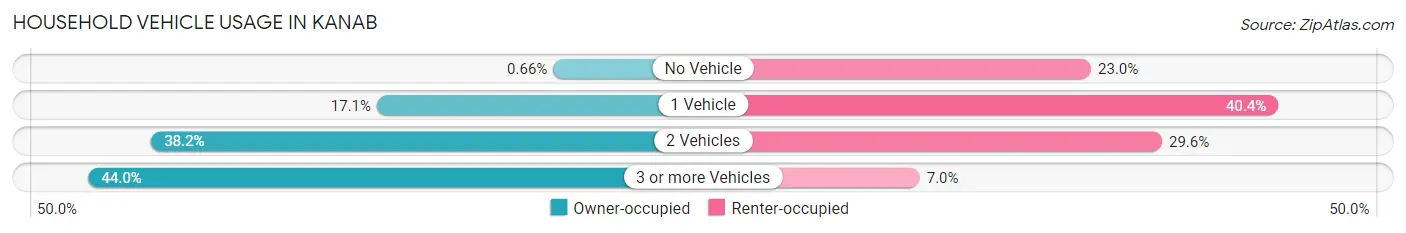
| Vehicles per Household | Owner-occupied | Renter-occupied |
| No Vehicle | 10 (0.7%) | 125 (23.0%) |
| 1 Vehicle | 260 (17.1%) | 220 (40.4%) |
| 2 Vehicles | 580 (38.2%) | 161 (29.6%) |
| 3 or more Vehicles | 669 (44.0%) | 38 (7.0%) |
| Total | 1,519 (100.0%) | 544 (100.0%) |
Real Estate & Mortgages in Kanab
Real Estate and Mortgage Overview in Kanab
| Characteristic | Without Mortgage | With Mortgage |
| Housing Units | 526 | 993 |
| Median Property Value | $355,600 | $311,500 |
| Median Household Income | $60,682 | $182 |
| Monthly Housing Costs | $407 | $0 |
| Real Estate Taxes | $1,870 | $39 |
Property Value by Mortgage Status in Kanab

| Property Value | Without Mortgage | With Mortgage |
| Less than $50,000 | 10 (1.9%) | 39 (3.9%) |
| $50,000 to $99,999 | 0 (0.0%) | 28 (2.8%) |
| $100,000 to $299,999 | 188 (35.7%) | 398 (40.1%) |
| $300,000 to $499,999 | 131 (24.9%) | 424 (42.7%) |
| $500,000 to $749,999 | 157 (29.8%) | 104 (10.5%) |
| $750,000 to $999,999 | 21 (4.0%) | 0 (0.0%) |
| $1,000,000 or more | 19 (3.6%) | 0 (0.0%) |
| Total | 526 (100.0%) | 993 (100.0%) |
Household Income by Mortgage Status in Kanab
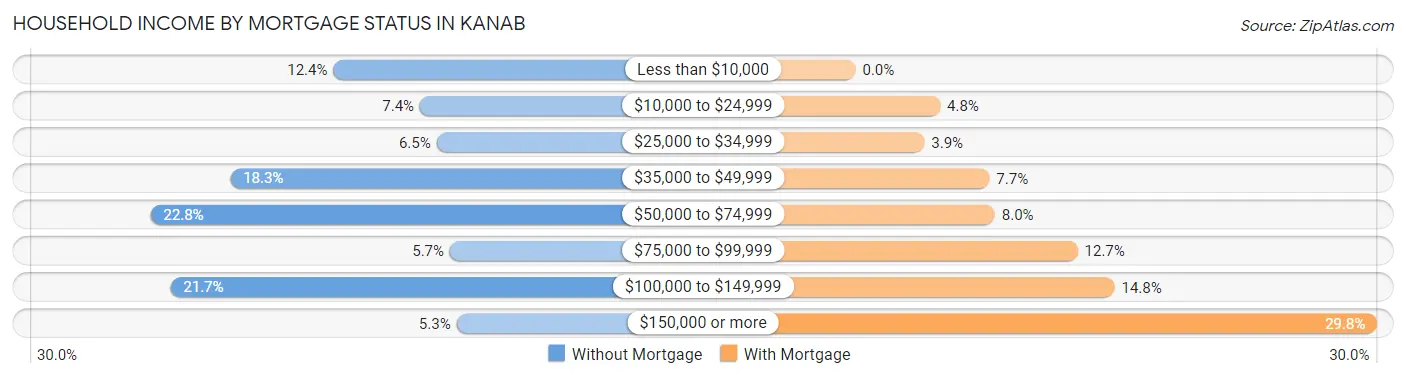
| Household Income | Without Mortgage | With Mortgage |
| Less than $10,000 | 65 (12.4%) | 0 (0.0%) |
| $10,000 to $24,999 | 39 (7.4%) | 48 (4.8%) |
| $25,000 to $34,999 | 34 (6.5%) | 39 (3.9%) |
| $35,000 to $49,999 | 96 (18.2%) | 76 (7.6%) |
| $50,000 to $74,999 | 120 (22.8%) | 79 (8.0%) |
| $75,000 to $99,999 | 30 (5.7%) | 126 (12.7%) |
| $100,000 to $149,999 | 114 (21.7%) | 147 (14.8%) |
| $150,000 or more | 28 (5.3%) | 296 (29.8%) |
| Total | 526 (100.0%) | 993 (100.0%) |
Property Value to Household Income Ratio in Kanab
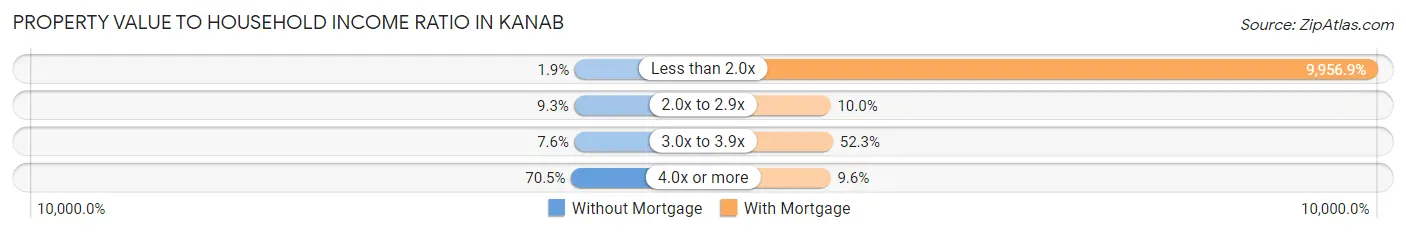
| Value-to-Income Ratio | Without Mortgage | With Mortgage |
| Less than 2.0x | 10 (1.9%) | 98,872 (9,956.9%) |
| 2.0x to 2.9x | 49 (9.3%) | 99 (10.0%) |
| 3.0x to 3.9x | 40 (7.6%) | 519 (52.3%) |
| 4.0x or more | 371 (70.5%) | 95 (9.6%) |
| Total | 526 (100.0%) | 993 (100.0%) |
Real Estate Taxes by Mortgage Status in Kanab
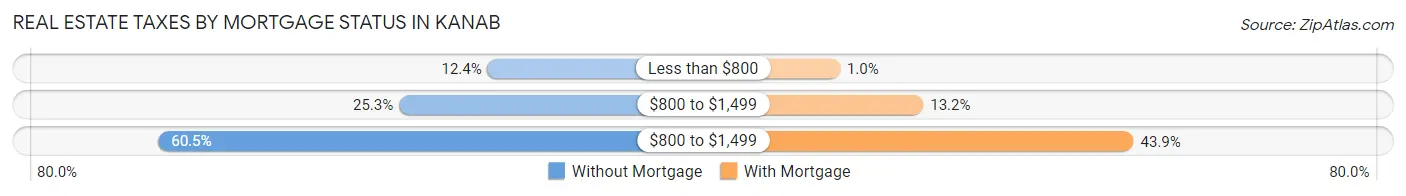
| Property Taxes | Without Mortgage | With Mortgage |
| Less than $800 | 65 (12.4%) | 10 (1.0%) |
| $800 to $1,499 | 133 (25.3%) | 131 (13.2%) |
| $800 to $1,499 | 318 (60.5%) | 436 (43.9%) |
| Total | 526 (100.0%) | 993 (100.0%) |
Health & Disability in Kanab
Health Insurance Coverage by Age in Kanab
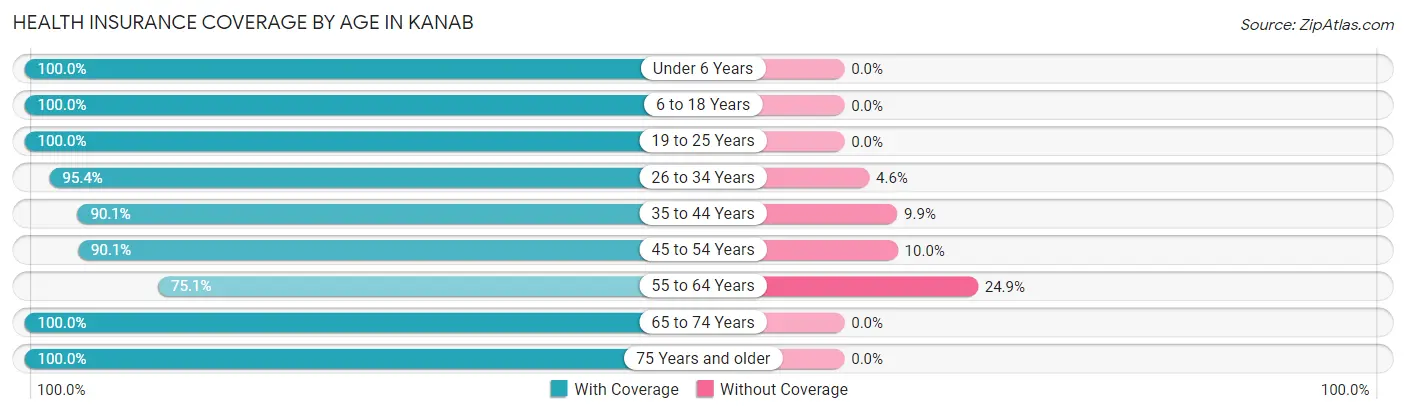
| Age Bracket | With Coverage | Without Coverage |
| Under 6 Years | 268 (100.0%) | 0 (0.0%) |
| 6 to 18 Years | 663 (100.0%) | 0 (0.0%) |
| 19 to 25 Years | 293 (100.0%) | 0 (0.0%) |
| 26 to 34 Years | 700 (95.4%) | 34 (4.6%) |
| 35 to 44 Years | 439 (90.1%) | 48 (9.9%) |
| 45 to 54 Years | 353 (90.0%) | 39 (10.0%) |
| 55 to 64 Years | 558 (75.1%) | 185 (24.9%) |
| 65 to 74 Years | 587 (100.0%) | 0 (0.0%) |
| 75 Years and older | 445 (100.0%) | 0 (0.0%) |
| Total | 4,306 (93.4%) | 306 (6.6%) |
Health Insurance Coverage by Citizenship Status in Kanab
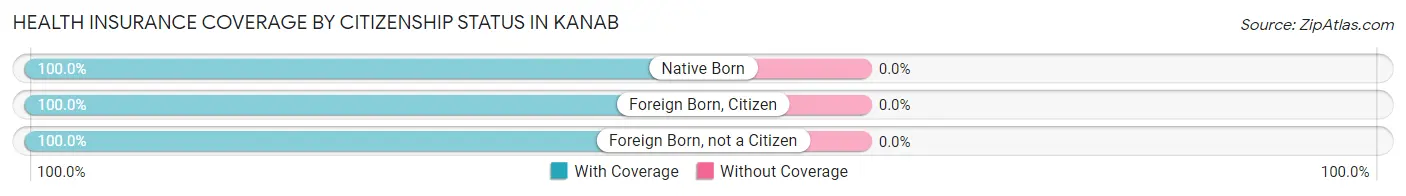
| Citizenship Status | With Coverage | Without Coverage |
| Native Born | 268 (100.0%) | 0 (0.0%) |
| Foreign Born, Citizen | 663 (100.0%) | 0 (0.0%) |
| Foreign Born, not a Citizen | 293 (100.0%) | 0 (0.0%) |
Health Insurance Coverage by Household Income in Kanab
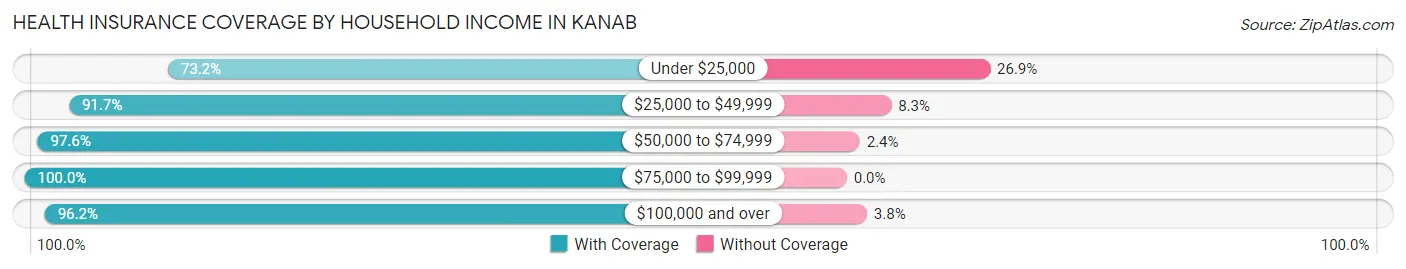
| Household Income | With Coverage | Without Coverage |
| Under $25,000 | 406 (73.2%) | 149 (26.9%) |
| $25,000 to $49,999 | 683 (91.7%) | 62 (8.3%) |
| $50,000 to $74,999 | 803 (97.6%) | 20 (2.4%) |
| $75,000 to $99,999 | 497 (100.0%) | 0 (0.0%) |
| $100,000 and over | 1,917 (96.2%) | 75 (3.8%) |
Public vs Private Health Insurance Coverage by Age in Kanab
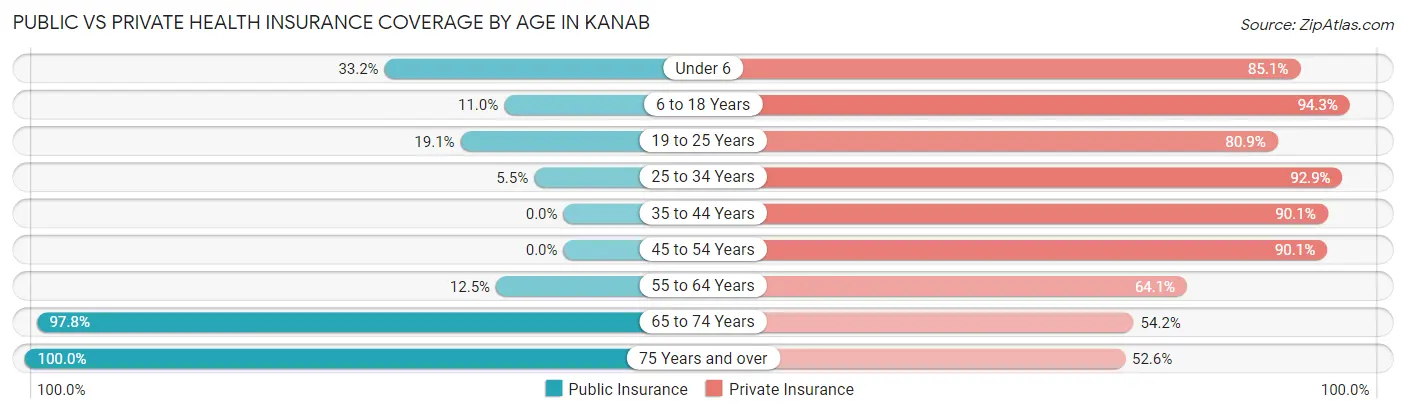
| Age Bracket | Public Insurance | Private Insurance |
| Under 6 | 89 (33.2%) | 228 (85.1%) |
| 6 to 18 Years | 73 (11.0%) | 625 (94.3%) |
| 19 to 25 Years | 56 (19.1%) | 237 (80.9%) |
| 25 to 34 Years | 40 (5.4%) | 682 (92.9%) |
| 35 to 44 Years | 0 (0.0%) | 439 (90.1%) |
| 45 to 54 Years | 0 (0.0%) | 353 (90.0%) |
| 55 to 64 Years | 93 (12.5%) | 476 (64.1%) |
| 65 to 74 Years | 574 (97.8%) | 318 (54.2%) |
| 75 Years and over | 445 (100.0%) | 234 (52.6%) |
| Total | 1,370 (29.7%) | 3,592 (77.9%) |
Disability Status by Sex by Age in Kanab
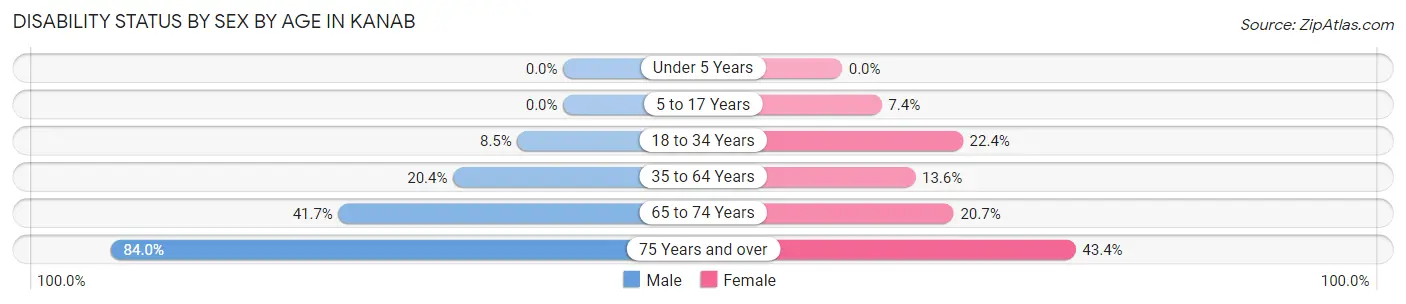
| Age Bracket | Male | Female |
| Under 5 Years | 0 (0.0%) | 0 (0.0%) |
| 5 to 17 Years | 0 (0.0%) | 18 (7.3%) |
| 18 to 34 Years | 40 (8.5%) | 133 (22.4%) |
| 35 to 64 Years | 151 (20.4%) | 120 (13.6%) |
| 65 to 74 Years | 108 (41.7%) | 68 (20.7%) |
| 75 Years and over | 184 (84.0%) | 98 (43.4%) |
Disability Class by Sex by Age in Kanab
Disability Class: Hearing Difficulty
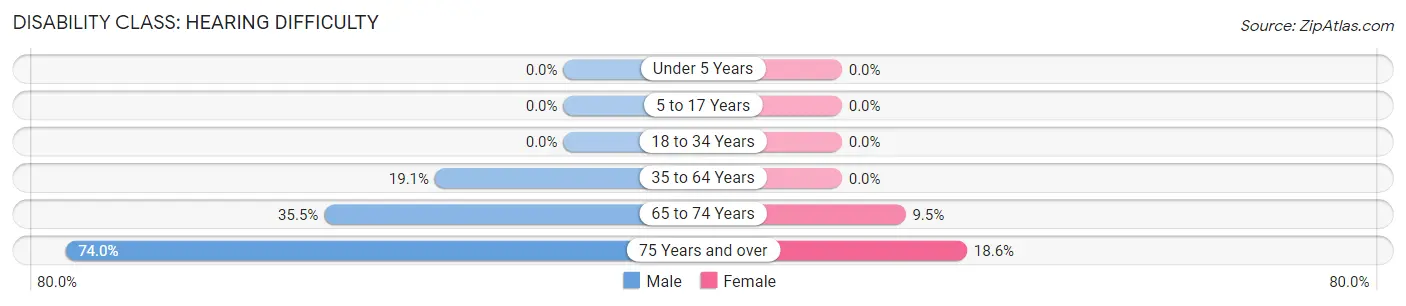
| Age Bracket | Male | Female |
| Under 5 Years | 0 (0.0%) | 0 (0.0%) |
| 5 to 17 Years | 0 (0.0%) | 0 (0.0%) |
| 18 to 34 Years | 0 (0.0%) | 0 (0.0%) |
| 35 to 64 Years | 141 (19.1%) | 0 (0.0%) |
| 65 to 74 Years | 92 (35.5%) | 31 (9.5%) |
| 75 Years and over | 162 (74.0%) | 42 (18.6%) |
Disability Class: Vision Difficulty
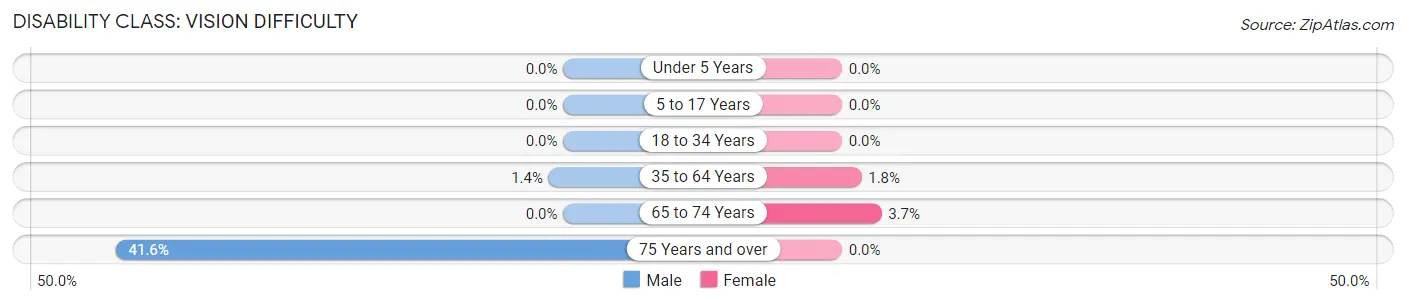
| Age Bracket | Male | Female |
| Under 5 Years | 0 (0.0%) | 0 (0.0%) |
| 5 to 17 Years | 0 (0.0%) | 0 (0.0%) |
| 18 to 34 Years | 0 (0.0%) | 0 (0.0%) |
| 35 to 64 Years | 10 (1.3%) | 16 (1.8%) |
| 65 to 74 Years | 0 (0.0%) | 12 (3.7%) |
| 75 Years and over | 91 (41.5%) | 0 (0.0%) |
Disability Class: Cognitive Difficulty
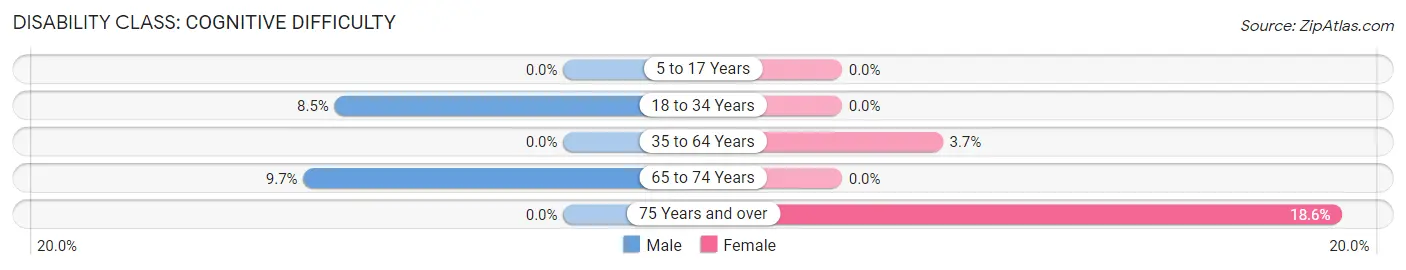
| Age Bracket | Male | Female |
| 5 to 17 Years | 0 (0.0%) | 0 (0.0%) |
| 18 to 34 Years | 40 (8.5%) | 0 (0.0%) |
| 35 to 64 Years | 0 (0.0%) | 33 (3.7%) |
| 65 to 74 Years | 25 (9.7%) | 0 (0.0%) |
| 75 Years and over | 0 (0.0%) | 42 (18.6%) |
Disability Class: Ambulatory Difficulty
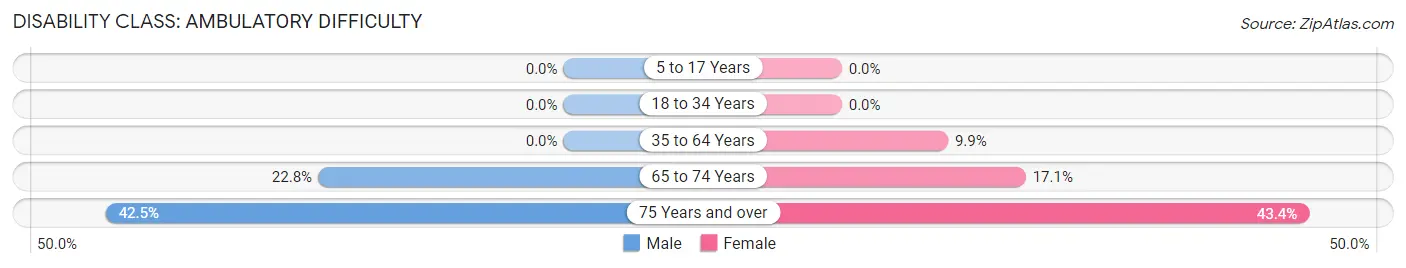
| Age Bracket | Male | Female |
| 5 to 17 Years | 0 (0.0%) | 0 (0.0%) |
| 18 to 34 Years | 0 (0.0%) | 0 (0.0%) |
| 35 to 64 Years | 0 (0.0%) | 87 (9.9%) |
| 65 to 74 Years | 59 (22.8%) | 56 (17.1%) |
| 75 Years and over | 93 (42.5%) | 98 (43.4%) |
Disability Class: Self-Care Difficulty
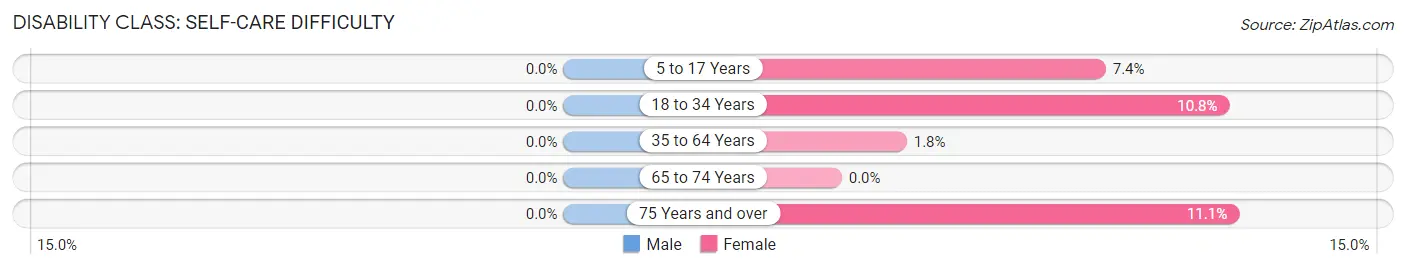
| Age Bracket | Male | Female |
| 5 to 17 Years | 0 (0.0%) | 18 (7.3%) |
| 18 to 34 Years | 0 (0.0%) | 64 (10.8%) |
| 35 to 64 Years | 0 (0.0%) | 16 (1.8%) |
| 65 to 74 Years | 0 (0.0%) | 0 (0.0%) |
| 75 Years and over | 0 (0.0%) | 25 (11.1%) |
Technology Access in Kanab
Computing Device Access in Kanab
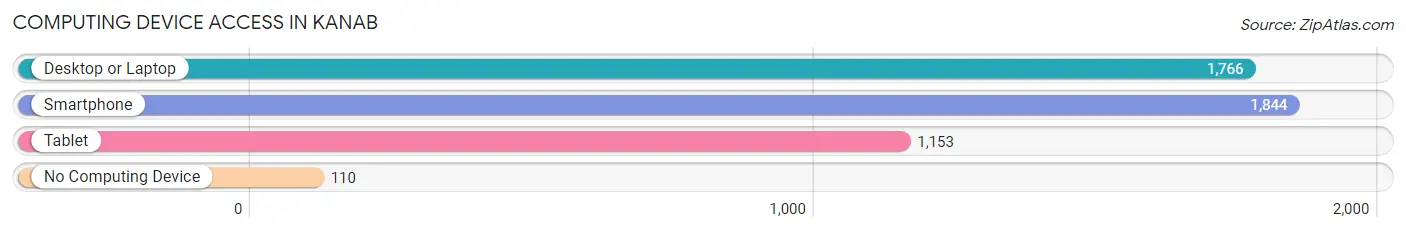
| Device Type | # Households | % Households |
| Desktop or Laptop | 1,766 | 85.6% |
| Smartphone | 1,844 | 89.4% |
| Tablet | 1,153 | 55.9% |
| No Computing Device | 110 | 5.3% |
| Total | 2,063 | 100.0% |
Internet Access in Kanab
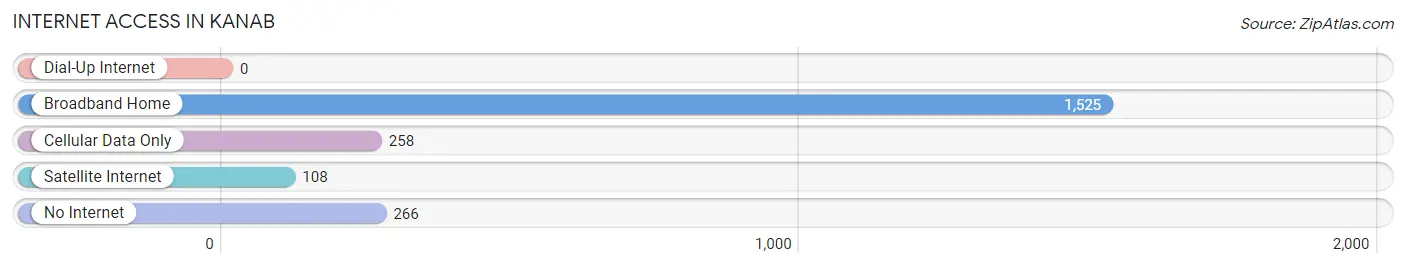
| Internet Type | # Households | % Households |
| Dial-Up Internet | 0 | 0.0% |
| Broadband Home | 1,525 | 73.9% |
| Cellular Data Only | 258 | 12.5% |
| Satellite Internet | 108 | 5.2% |
| No Internet | 266 | 12.9% |
| Total | 2,063 | 100.0% |
Kanab Summary
Kanab is a small city located in Kane County, Utah, United States. It is situated in the southwestern corner of the state, near the Arizona border. The city is located in the heart of the Grand Staircase-Escalante National Monument, and is surrounded by stunning red rock formations and canyons. The city is known for its rich history, stunning scenery, and its vibrant economy.
History
Kanab was first settled in 1864 by Mormon pioneers, who named the area after the nearby Kanab Creek. The settlers were attracted to the area due to its fertile soil and abundant water supply. The town quickly grew and became an important trading center for the surrounding area. In 1871, the town was incorporated and the first mayor was elected.
In the early 1900s, Kanab became a popular tourist destination due to its proximity to the Grand Canyon and other nearby attractions. The town was also home to several movie and television productions, including the classic westerns Gunsmoke and The Lone Ranger.
Geography
Kanab is located in the southwestern corner of Utah, near the Arizona border. The city is situated in the heart of the Grand Staircase-Escalante National Monument, and is surrounded by stunning red rock formations and canyons. The city is located at an elevation of 4,845 feet above sea level.
The climate in Kanab is semi-arid, with hot summers and mild winters. The average annual temperature is 57°F, and the average annual precipitation is 8.5 inches.
Economy
Kanab’s economy is largely based on tourism, as the city is a popular destination for outdoor enthusiasts. The city is home to several national parks and monuments, including the Grand Staircase-Escalante National Monument, Zion National Park, and Bryce Canyon National Park. The city is also home to several movie and television production companies, which have filmed in the area for decades.
In addition to tourism, Kanab’s economy is also supported by agriculture, ranching, and mining. The city is home to several large cattle ranches, and the nearby Kaibab National Forest is home to several timber operations.
Demographics
As of the 2010 census, Kanab had a population of 4,312. The racial makeup of the city was 91.3% White, 0.3% African American, 0.7% Native American, 0.3% Asian, 0.1% Pacific Islander, 5.2% from other races, and 2.3% from two or more races. Hispanic or Latino of any race were 11.2% of the population.
Kanab is a small city with a rich history, stunning scenery, and a vibrant economy. The city is home to several national parks and monuments, and is a popular destination for outdoor enthusiasts. The city is also home to several movie and television production companies, which have filmed in the area for decades. Kanab is a great place to live, work, and play.
Common Questions
What is Per Capita Income in Kanab?
Per Capita income in Kanab is $34,222.
What is the Median Family Income in Kanab?
Median Family Income in Kanab is $98,529.
What is the Median Household income in Kanab?
Median Household Income in Kanab is $70,737.
What is Income or Wage Gap in Kanab?
Income or Wage Gap in Kanab is 1.5%.
Women in Kanab earn 98.5 cents for every dollar earned by a man.
What is Inequality or Gini Index in Kanab?
Inequality or Gini Index in Kanab is 0.43.
What is the Total Population of Kanab?
Total Population of Kanab is 4,817.
What is the Total Male Population of Kanab?
Total Male Population of Kanab is 2,386.
What is the Total Female Population of Kanab?
Total Female Population of Kanab is 2,431.
What is the Ratio of Males per 100 Females in Kanab?
There are 98.15 Males per 100 Females in Kanab.
What is the Ratio of Females per 100 Males in Kanab?
There are 101.89 Females per 100 Males in Kanab.
What is the Median Population Age in Kanab?
Median Population Age in Kanab is 43.0 Years.
What is the Average Family Size in Kanab
Average Family Size in Kanab is 2.9 People.
What is the Average Household Size in Kanab
Average Household Size in Kanab is 2.2 People.
How Large is the Labor Force in Kanab?
There are 2,476 People in the Labor Forcein in Kanab.
What is the Percentage of People in the Labor Force in Kanab?
60.9% of People are in the Labor Force in Kanab.
What is the Unemployment Rate in Kanab?
Unemployment Rate in Kanab is 2.6%.