Thatcher, UT Map & Demographics
Thatcher Map
Thatcher Overview
$39,190
PER CAPITA INCOME
$131,181
AVG FAMILY INCOME
$74,500
AVG HOUSEHOLD INCOME
60.0%
WAGE / INCOME GAP [ % ]
40.0¢/ $1
WAGE / INCOME GAP [ $ ]
0.60
INEQUALITY / GINI INDEX
1,056
TOTAL POPULATION
567
MALE POPULATION
489
FEMALE POPULATION
115.95
MALES / 100 FEMALES
86.24
FEMALES / 100 MALES
37.0
MEDIAN AGE
4.2
AVG FAMILY SIZE
3.1
AVG HOUSEHOLD SIZE
476
LABOR FORCE [ PEOPLE ]
66.3%
PERCENT IN LABOR FORCE
Thatcher Area Codes
Income in Thatcher
Income Overview in Thatcher
Per Capita Income in Thatcher is $39,190, while median incomes of families and households are $131,181 and $74,500 respectively.
| Characteristic | Number | Measure |
| Per Capita Income | 1,056 | $39,190 |
| Median Family Income | 223 | $131,181 |
| Mean Family Income | 223 | $159,090 |
| Median Household Income | 340 | $74,500 |
| Mean Household Income | 340 | $108,455 |
| Income Deficit | 223 | $0 |
| Wage / Income Gap (%) | 1,056 | 59.97% |
| Wage / Income Gap ($) | 1,056 | 40.03¢ per $1 |
| Gini / Inequality Index | 1,056 | 0.60 |
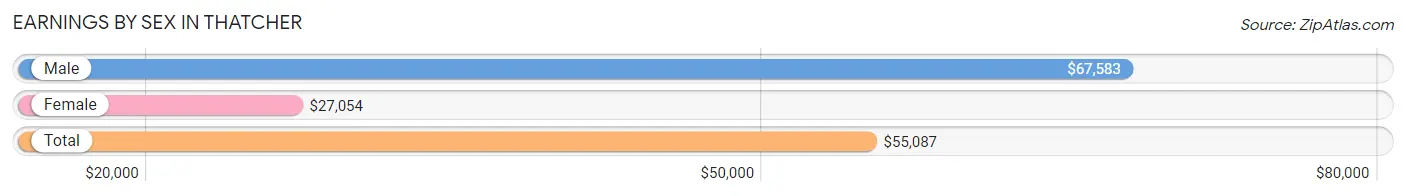
Earnings by Sex in Thatcher
Average Earnings in Thatcher are $55,087, $67,583 for men and $27,054 for women, a difference of 60.0%.
| Sex | Number | Average Earnings |
| Male | 299 (61.7%) | $67,583 |
| Female | 186 (38.4%) | $27,054 |
| Total | 485 (100.0%) | $55,087 |
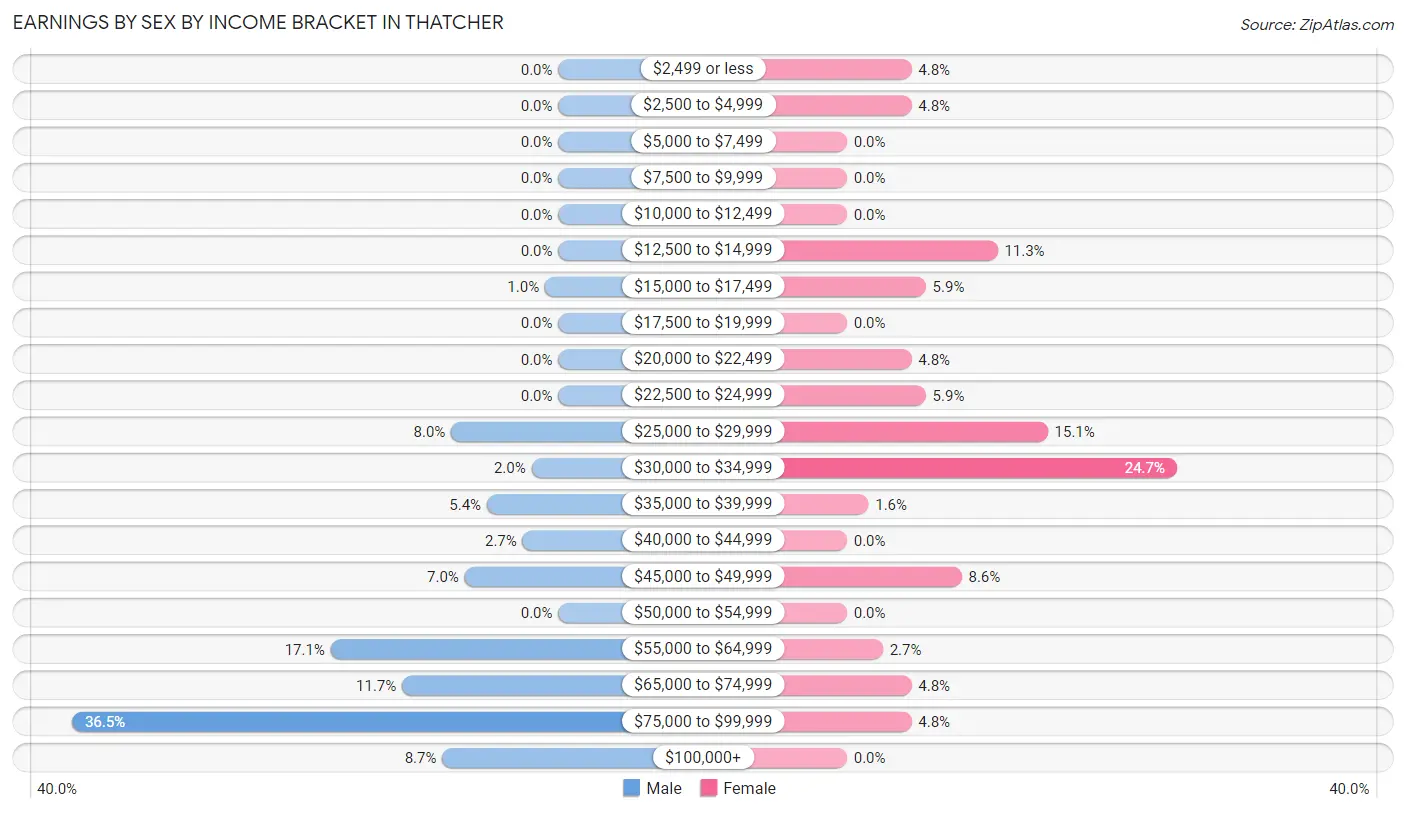
Earnings by Sex by Income Bracket in Thatcher
The most common earnings brackets in Thatcher are $75,000 to $99,999 for men (109 | 36.4%) and $30,000 to $34,999 for women (46 | 24.7%).
| Income | Male | Female |
| $2,499 or less | 0 (0.0%) | 9 (4.8%) |
| $2,500 to $4,999 | 0 (0.0%) | 9 (4.8%) |
| $5,000 to $7,499 | 0 (0.0%) | 0 (0.0%) |
| $7,500 to $9,999 | 0 (0.0%) | 0 (0.0%) |
| $10,000 to $12,499 | 0 (0.0%) | 0 (0.0%) |
| $12,500 to $14,999 | 0 (0.0%) | 21 (11.3%) |
| $15,000 to $17,499 | 3 (1.0%) | 11 (5.9%) |
| $17,500 to $19,999 | 0 (0.0%) | 0 (0.0%) |
| $20,000 to $22,499 | 0 (0.0%) | 9 (4.8%) |
| $22,500 to $24,999 | 0 (0.0%) | 11 (5.9%) |
| $25,000 to $29,999 | 24 (8.0%) | 28 (15.0%) |
| $30,000 to $34,999 | 6 (2.0%) | 46 (24.7%) |
| $35,000 to $39,999 | 16 (5.3%) | 3 (1.6%) |
| $40,000 to $44,999 | 8 (2.7%) | 0 (0.0%) |
| $45,000 to $49,999 | 21 (7.0%) | 16 (8.6%) |
| $50,000 to $54,999 | 0 (0.0%) | 0 (0.0%) |
| $55,000 to $64,999 | 51 (17.1%) | 5 (2.7%) |
| $65,000 to $74,999 | 35 (11.7%) | 9 (4.8%) |
| $75,000 to $99,999 | 109 (36.4%) | 9 (4.8%) |
| $100,000+ | 26 (8.7%) | 0 (0.0%) |
| Total | 299 (100.0%) | 186 (100.0%) |
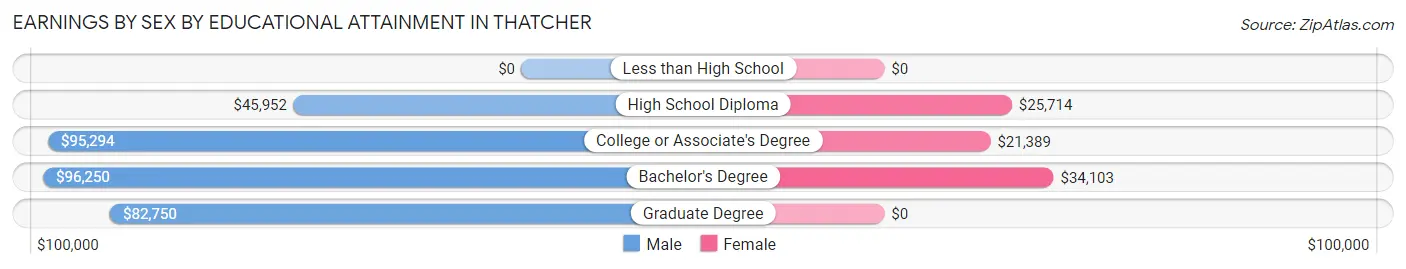
Earnings by Sex by Educational Attainment in Thatcher
Average earnings in Thatcher are $68,750 for men and $31,429 for women, a difference of 54.3%. Men with an educational attainment of bachelor's degree enjoy the highest average annual earnings of $96,250, while those with high school diploma education earn the least with $45,952. Women with an educational attainment of bachelor's degree earn the most with the average annual earnings of $34,103, while those with college or associate's degree education have the smallest earnings of $21,389.
| Educational Attainment | Male Income | Female Income |
| Less than High School | - | - |
| High School Diploma | $45,952 | $25,714 |
| College or Associate's Degree | $95,294 | $21,389 |
| Bachelor's Degree | $96,250 | $34,103 |
| Graduate Degree | $82,750 | $0 |
| Total | $68,750 | $31,429 |
Family Income in Thatcher
Family Income Brackets in Thatcher
According to the Thatcher family income data, there are 71 families falling into the $100,000 to $149,999 income range, which is the most common income bracket and makes up 31.8% of all families.
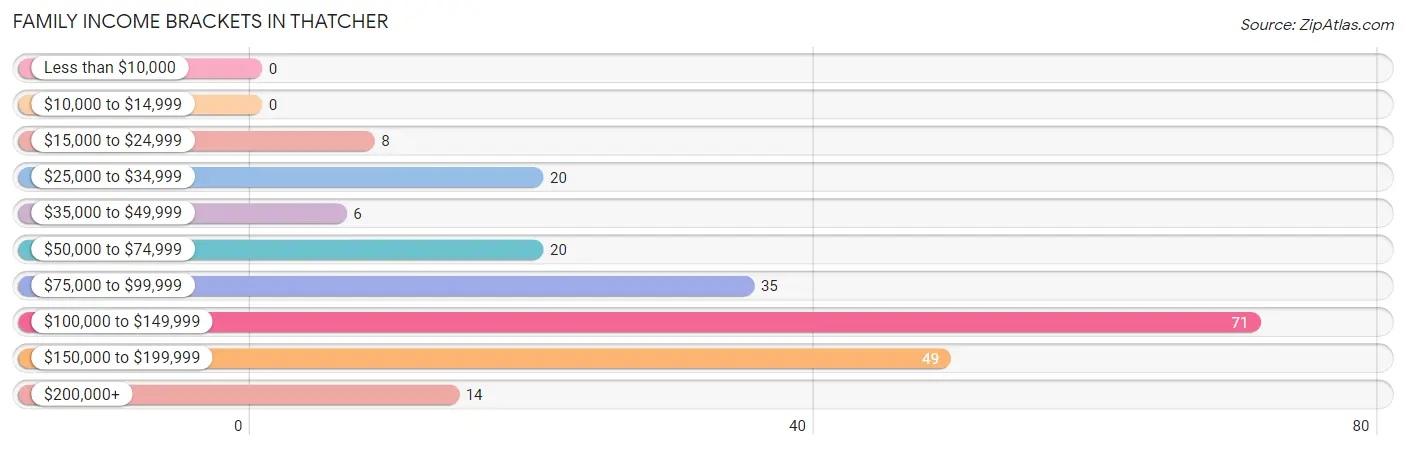
| Income Bracket | # Families | % Families |
| Less than $10,000 | 0 | 0.0% |
| $10,000 to $14,999 | 0 | 0.0% |
| $15,000 to $24,999 | 8 | 3.6% |
| $25,000 to $34,999 | 20 | 9.0% |
| $35,000 to $49,999 | 6 | 2.7% |
| $50,000 to $74,999 | 20 | 9.0% |
| $75,000 to $99,999 | 35 | 15.7% |
| $100,000 to $149,999 | 71 | 31.8% |
| $150,000 to $199,999 | 49 | 22.0% |
| $200,000+ | 14 | 6.3% |
Family Income by Famaliy Size in Thatcher
3-person families (88 | 39.5%) account for the highest median family income in Thatcher with $141,731 per family, while 3-person families (88 | 39.5%) have the highest median income of $47,244 per family member.
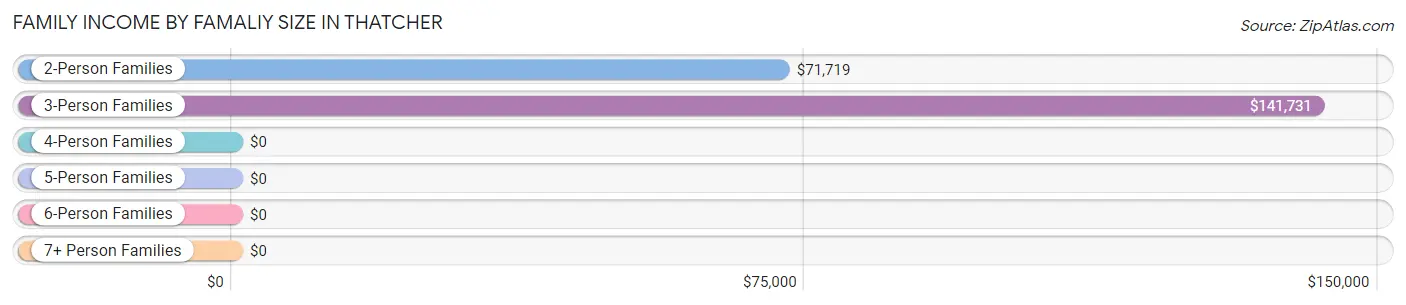
| Income Bracket | # Families | Median Income |
| 2-Person Families | 39 (17.5%) | $71,719 |
| 3-Person Families | 88 (39.5%) | $141,731 |
| 4-Person Families | 26 (11.7%) | $0 |
| 5-Person Families | 37 (16.6%) | $0 |
| 6-Person Families | 28 (12.6%) | $0 |
| 7+ Person Families | 5 (2.2%) | $0 |
| Total | 223 (100.0%) | $131,181 |
Family Income by Number of Earners in Thatcher
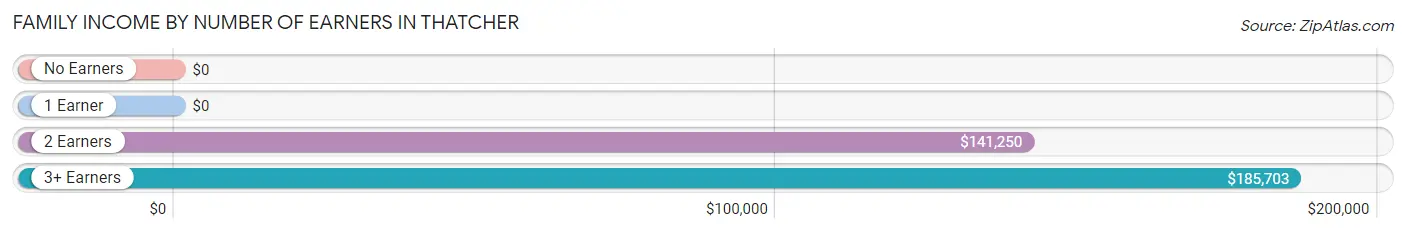
| Number of Earners | # Families | Median Income |
| No Earners | 13 (5.8%) | $0 |
| 1 Earner | 54 (24.2%) | $0 |
| 2 Earners | 123 (55.2%) | $141,250 |
| 3+ Earners | 33 (14.8%) | $185,703 |
| Total | 223 (100.0%) | $131,181 |
Household Income in Thatcher
Household Income Brackets in Thatcher
With 94 households falling in the category, the less than $10,000 income range is the most frequent in Thatcher, accounting for 27.7% of all households.
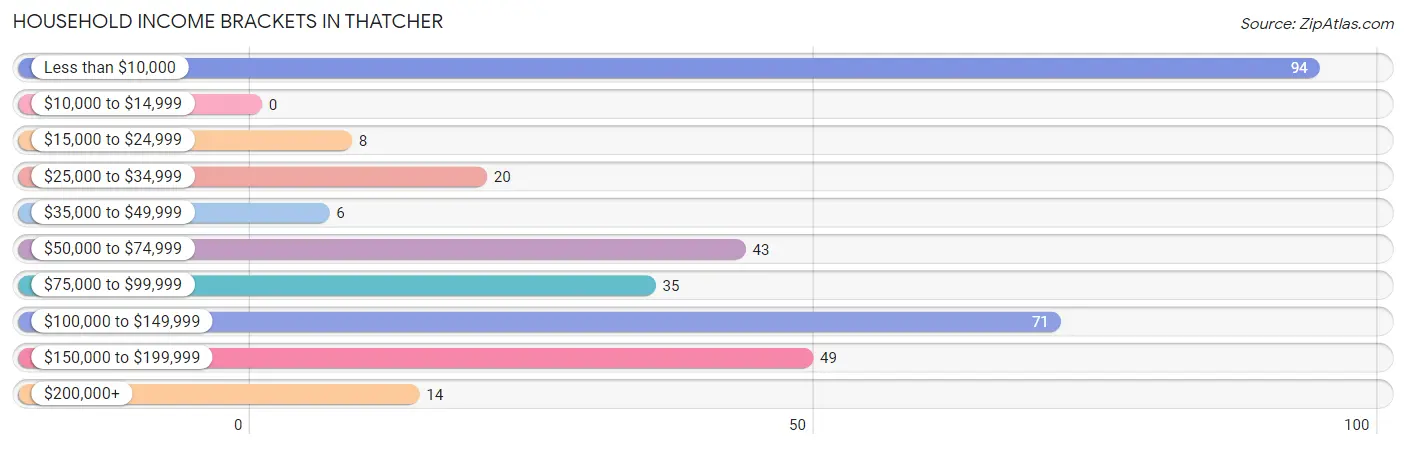
| Income Bracket | # Households | % Households |
| Less than $10,000 | 94 | 27.6% |
| $10,000 to $14,999 | 0 | 0.0% |
| $15,000 to $24,999 | 8 | 2.4% |
| $25,000 to $34,999 | 20 | 5.9% |
| $35,000 to $49,999 | 6 | 1.8% |
| $50,000 to $74,999 | 43 | 12.6% |
| $75,000 to $99,999 | 35 | 10.3% |
| $100,000 to $149,999 | 71 | 20.9% |
| $150,000 to $199,999 | 49 | 14.4% |
| $200,000+ | 14 | 4.1% |
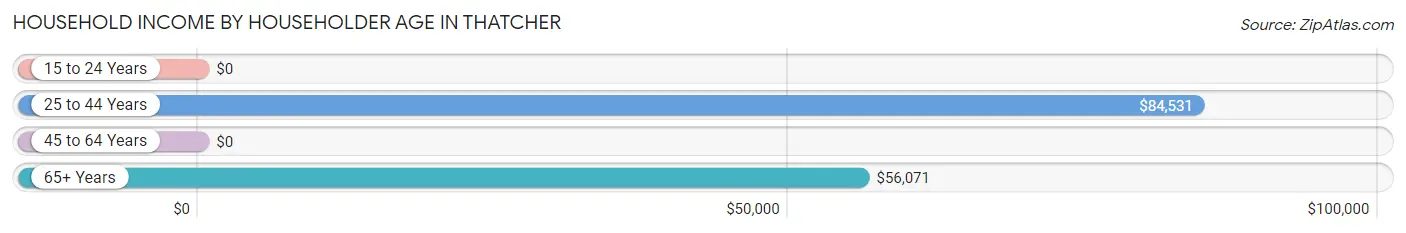
Household Income by Householder Age in Thatcher
The median household income in Thatcher is $74,500, with the highest median household income of $84,531 found in the 25 to 44 years age bracket for the primary householder. A total of 77 households (22.7%) fall into this category.
| Income Bracket | # Households | Median Income |
| 15 to 24 Years | 0 (0.0%) | $0 |
| 25 to 44 Years | 77 (22.7%) | $84,531 |
| 45 to 64 Years | 207 (60.9%) | $0 |
| 65+ Years | 56 (16.5%) | $56,071 |
| Total | 340 (100.0%) | $74,500 |
Poverty in Thatcher
Income Below Poverty by Sex and Age in Thatcher
With 24.7% poverty level for males and 11.7% for females among the residents of Thatcher, 55 to 64 year old males and 25 to 34 year old females are the most vulnerable to poverty, with 82 males (84.5%) and 20 females (43.5%) in their respective age groups living below the poverty level.
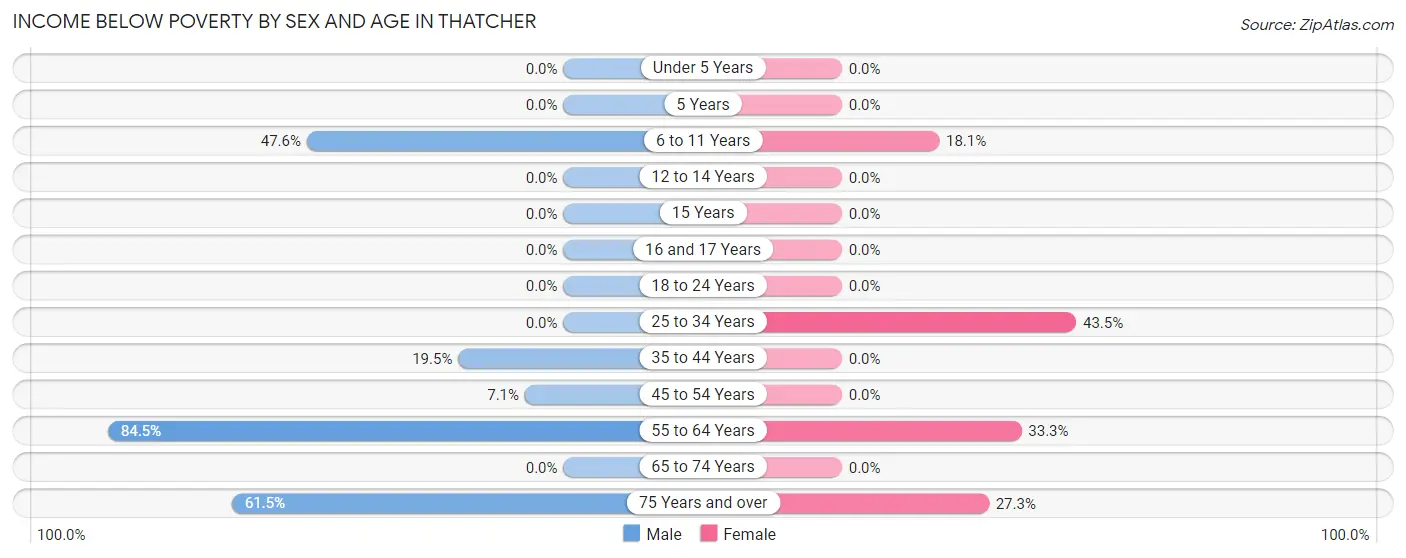
| Age Bracket | Male | Female |
| Under 5 Years | 0 (0.0%) | 0 (0.0%) |
| 5 Years | 0 (0.0%) | 0 (0.0%) |
| 6 to 11 Years | 20 (47.6%) | 24 (18.0%) |
| 12 to 14 Years | 0 (0.0%) | 0 (0.0%) |
| 15 Years | 0 (0.0%) | 0 (0.0%) |
| 16 and 17 Years | 0 (0.0%) | 0 (0.0%) |
| 18 to 24 Years | 0 (0.0%) | 0 (0.0%) |
| 25 to 34 Years | 0 (0.0%) | 20 (43.5%) |
| 35 to 44 Years | 24 (19.5%) | 0 (0.0%) |
| 45 to 54 Years | 6 (7.1%) | 0 (0.0%) |
| 55 to 64 Years | 82 (84.5%) | 7 (33.3%) |
| 65 to 74 Years | 0 (0.0%) | 0 (0.0%) |
| 75 Years and over | 8 (61.5%) | 6 (27.3%) |
| Total | 140 (24.7%) | 57 (11.7%) |
Income Above Poverty by Sex and Age in Thatcher
According to the poverty statistics in Thatcher, males aged under 5 years and females aged under 5 years are the age groups that are most secure financially, with 100.0% of males and 100.0% of females in these age groups living above the poverty line.
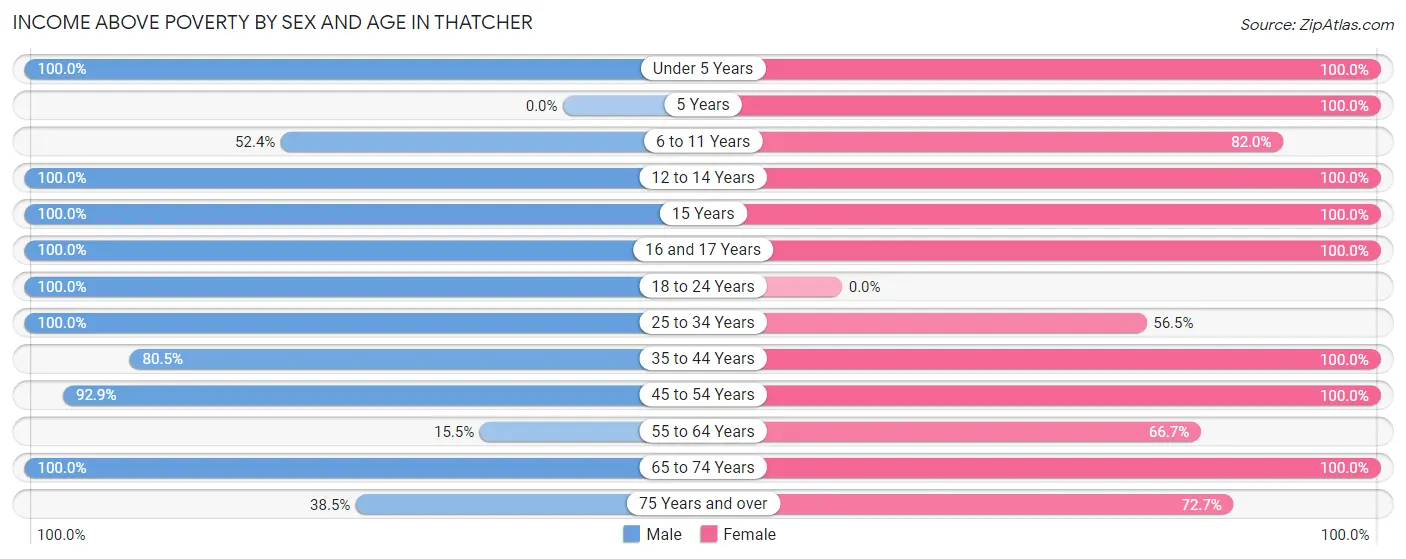
| Age Bracket | Male | Female |
| Under 5 Years | 39 (100.0%) | 5 (100.0%) |
| 5 Years | 0 (0.0%) | 15 (100.0%) |
| 6 to 11 Years | 22 (52.4%) | 109 (82.0%) |
| 12 to 14 Years | 37 (100.0%) | 27 (100.0%) |
| 15 Years | 7 (100.0%) | 33 (100.0%) |
| 16 and 17 Years | 21 (100.0%) | 18 (100.0%) |
| 18 to 24 Years | 14 (100.0%) | 0 (0.0%) |
| 25 to 34 Years | 71 (100.0%) | 26 (56.5%) |
| 35 to 44 Years | 99 (80.5%) | 61 (100.0%) |
| 45 to 54 Years | 78 (92.9%) | 90 (100.0%) |
| 55 to 64 Years | 15 (15.5%) | 14 (66.7%) |
| 65 to 74 Years | 19 (100.0%) | 18 (100.0%) |
| 75 Years and over | 5 (38.5%) | 16 (72.7%) |
| Total | 427 (75.3%) | 432 (88.3%) |
Income Below Poverty Among Married-Couple Families in Thatcher
The poverty statistics for married-couple families in Thatcher show that 13.0% or 28 of the total 215 families live below the poverty line. Families with 1 or 2 children have the highest poverty rate of 20.8%, comprising of 20 families. On the other hand, families with 3 or 4 children have the lowest poverty rate of 0.0%, which includes 0 families.
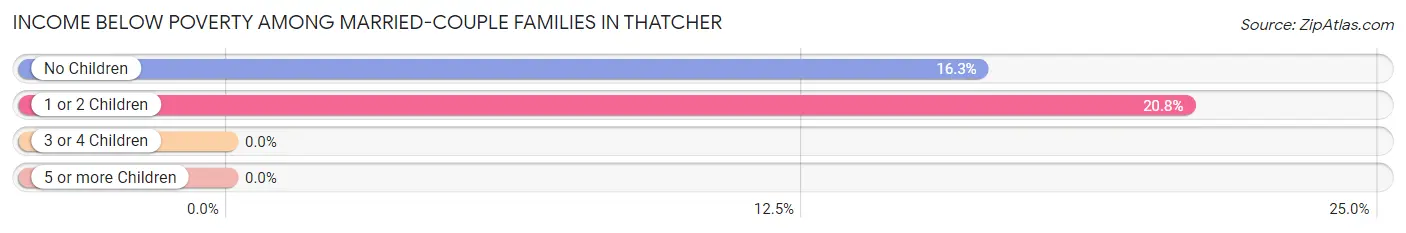
| Children | Above Poverty | Below Poverty |
| No Children | 41 (83.7%) | 8 (16.3%) |
| 1 or 2 Children | 76 (79.2%) | 20 (20.8%) |
| 3 or 4 Children | 65 (100.0%) | 0 (0.0%) |
| 5 or more Children | 5 (100.0%) | 0 (0.0%) |
| Total | 187 (87.0%) | 28 (13.0%) |
Income Below Poverty Among Single-Parent Households in Thatcher
| Children | Single Father | Single Mother |
| No Children | 0 (0.0%) | 0 (0.0%) |
| 1 or 2 Children | 0 (0.0%) | 0 (0.0%) |
| 3 or 4 Children | 0 (0.0%) | 0 (0.0%) |
| 5 or more Children | 0 (0.0%) | 0 (0.0%) |
| Total | 0 (0.0%) | 0 (0.0%) |
Income Below Poverty Among Married-Couple vs Single-Parent Households in Thatcher
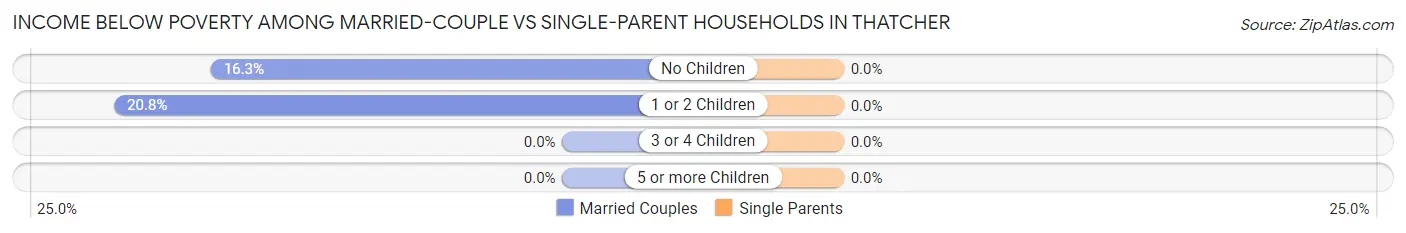
| Children | Married-Couple Families | Single-Parent Households |
| No Children | 8 (16.3%) | 0 (0.0%) |
| 1 or 2 Children | 20 (20.8%) | 0 (0.0%) |
| 3 or 4 Children | 0 (0.0%) | 0 (0.0%) |
| 5 or more Children | 0 (0.0%) | 0 (0.0%) |
| Total | 28 (13.0%) | 0 (0.0%) |
Race in Thatcher
The most populous races in Thatcher are White / Caucasian (800 | 75.8%), Hispanic or Latino (201 | 19.0%), and Asian (113 | 10.7%).
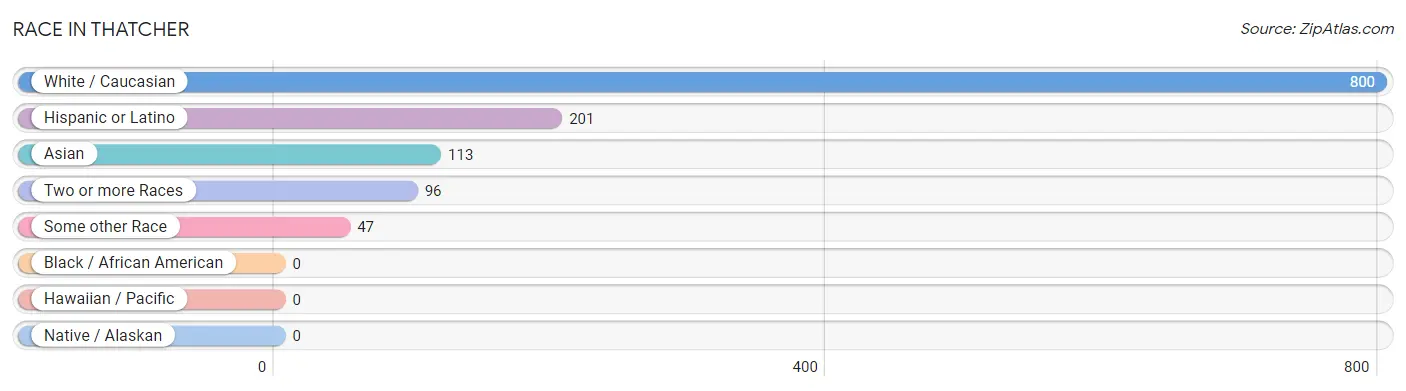
| Race | # Population | % Population |
| Asian | 113 | 10.7% |
| Black / African American | 0 | 0.0% |
| Hawaiian / Pacific | 0 | 0.0% |
| Hispanic or Latino | 201 | 19.0% |
| Native / Alaskan | 0 | 0.0% |
| White / Caucasian | 800 | 75.8% |
| Two or more Races | 96 | 9.1% |
| Some other Race | 47 | 4.4% |
| Total | 1,056 | 100.0% |
Ancestry in Thatcher
The most populous ancestries reported in Thatcher are English (152 | 14.4%), German (144 | 13.6%), Bhutanese (129 | 12.2%), Mexican (127 | 12.0%), and American (109 | 10.3%), together accounting for 62.6% of all Thatcher residents.
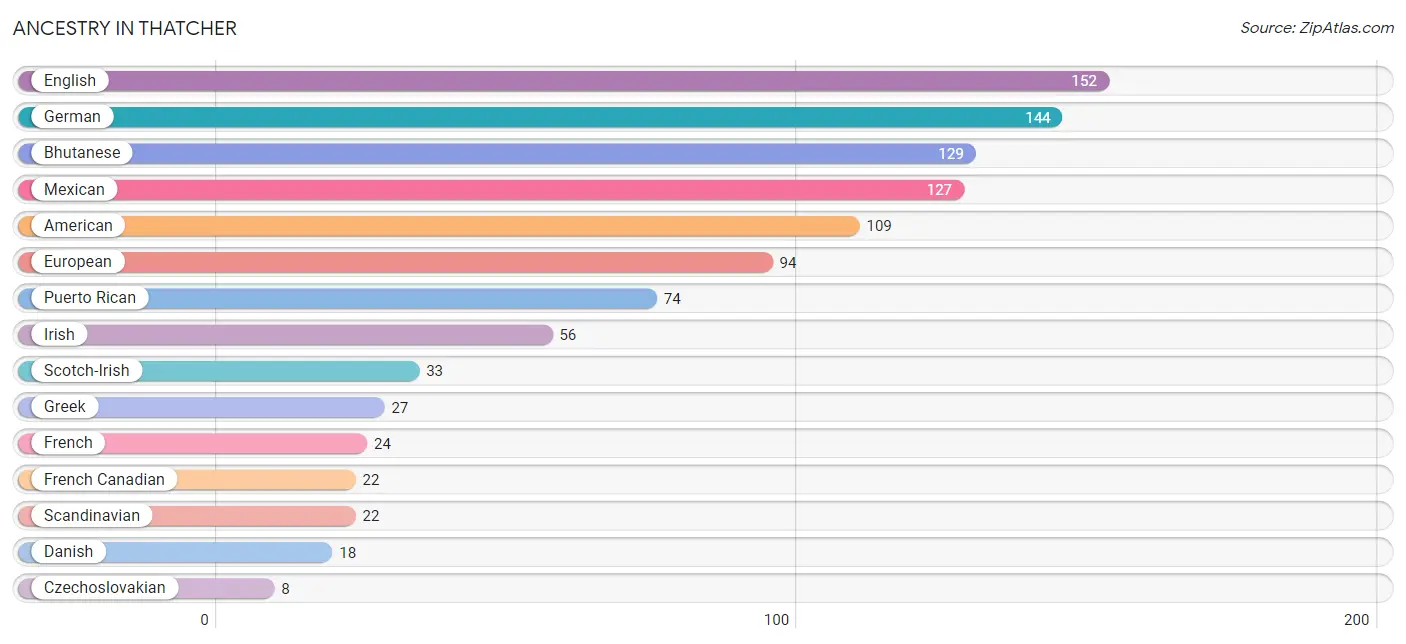
| Ancestry | # Population | % Population |
| American | 109 | 10.3% |
| Bhutanese | 129 | 12.2% |
| British | 3 | 0.3% |
| Czechoslovakian | 8 | 0.8% |
| Danish | 18 | 1.7% |
| English | 152 | 14.4% |
| European | 94 | 8.9% |
| French | 24 | 2.3% |
| French Canadian | 22 | 2.1% |
| German | 144 | 13.6% |
| Greek | 27 | 2.6% |
| Irish | 56 | 5.3% |
| Mexican | 127 | 12.0% |
| Norwegian | 7 | 0.7% |
| Puerto Rican | 74 | 7.0% |
| Scandinavian | 22 | 2.1% |
| Scotch-Irish | 33 | 3.1% |
| Swiss | 3 | 0.3% |
| Welsh | 5 | 0.5% | View All 19 Rows |
Immigrants in Thatcher
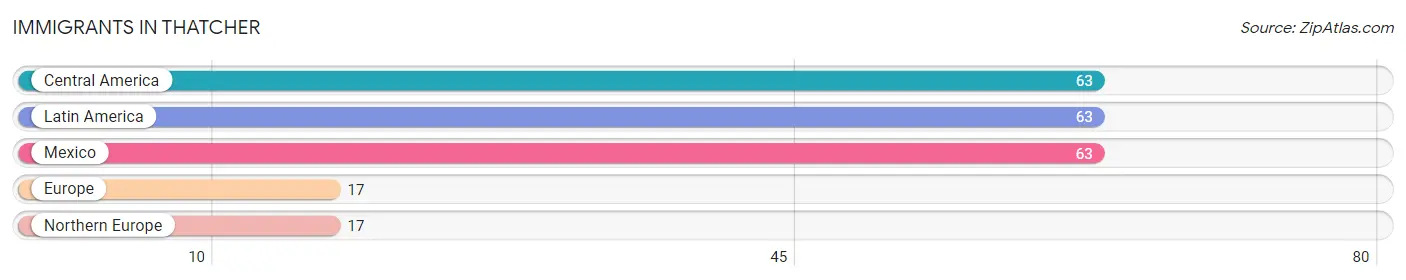
The most numerous immigrant groups reported in Thatcher came from Central America (63 | 6.0%), Latin America (63 | 6.0%), Mexico (63 | 6.0%), Europe (17 | 1.6%), and Northern Europe (17 | 1.6%), together accounting for 21.1% of all Thatcher residents.
| Immigration Origin | # Population | % Population |
| Central America | 63 | 6.0% |
| Europe | 17 | 1.6% |
| Latin America | 63 | 6.0% |
| Mexico | 63 | 6.0% |
| Northern Europe | 17 | 1.6% | View All 5 Rows |
Sex and Age in Thatcher
Sex and Age in Thatcher
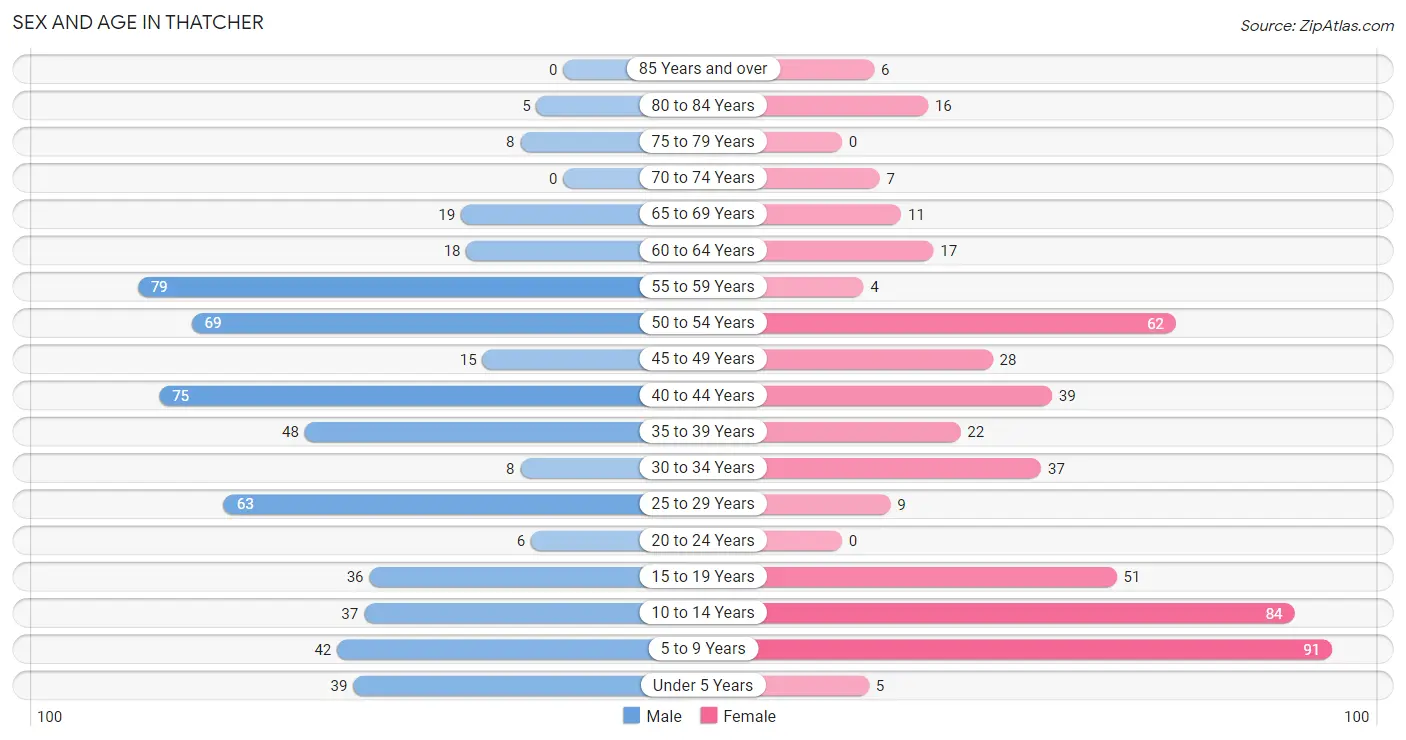
The most populous age groups in Thatcher are 55 to 59 Years (79 | 13.9%) for men and 5 to 9 Years (91 | 18.6%) for women.
| Age Bracket | Male | Female |
| Under 5 Years | 39 (6.9%) | 5 (1.0%) |
| 5 to 9 Years | 42 (7.4%) | 91 (18.6%) |
| 10 to 14 Years | 37 (6.5%) | 84 (17.2%) |
| 15 to 19 Years | 36 (6.4%) | 51 (10.4%) |
| 20 to 24 Years | 6 (1.1%) | 0 (0.0%) |
| 25 to 29 Years | 63 (11.1%) | 9 (1.8%) |
| 30 to 34 Years | 8 (1.4%) | 37 (7.6%) |
| 35 to 39 Years | 48 (8.5%) | 22 (4.5%) |
| 40 to 44 Years | 75 (13.2%) | 39 (8.0%) |
| 45 to 49 Years | 15 (2.6%) | 28 (5.7%) |
| 50 to 54 Years | 69 (12.2%) | 62 (12.7%) |
| 55 to 59 Years | 79 (13.9%) | 4 (0.8%) |
| 60 to 64 Years | 18 (3.2%) | 17 (3.5%) |
| 65 to 69 Years | 19 (3.4%) | 11 (2.2%) |
| 70 to 74 Years | 0 (0.0%) | 7 (1.4%) |
| 75 to 79 Years | 8 (1.4%) | 0 (0.0%) |
| 80 to 84 Years | 5 (0.9%) | 16 (3.3%) |
| 85 Years and over | 0 (0.0%) | 6 (1.2%) |
| Total | 567 (100.0%) | 489 (100.0%) |
Families and Households in Thatcher
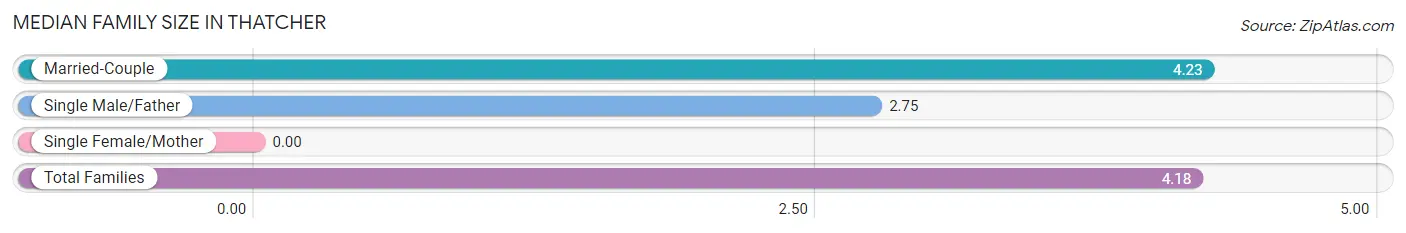
Median Family Size in Thatcher
| Family Type | # Families | Family Size |
| Married-Couple | 215 (96.4%) | 4.23 |
| Single Male/Father | 8 (3.6%) | 2.75 |
| Single Female/Mother | 0 (0.0%) | - |
| Total Families | 223 (100.0%) | 4.18 |
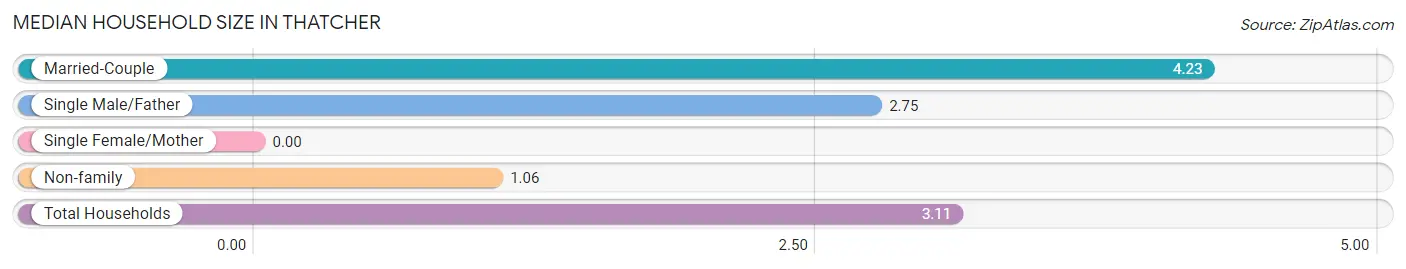
Median Household Size in Thatcher
| Household Type | # Households | Household Size |
| Married-Couple | 215 (63.2%) | 4.23 |
| Single Male/Father | 8 (2.4%) | 2.75 |
| Single Female/Mother | 0 (0.0%) | - |
| Non-family | 117 (34.4%) | 1.06 |
| Total Households | 340 (100.0%) | 3.11 |
Household Size by Marriage Status in Thatcher
Out of a total of 340 households in Thatcher, 223 (65.6%) are family households, while 117 (34.4%) are nonfamily households. The most numerous type of family households are 3-person households, comprising 88, and the most common type of nonfamily households are 1-person households, comprising 112.
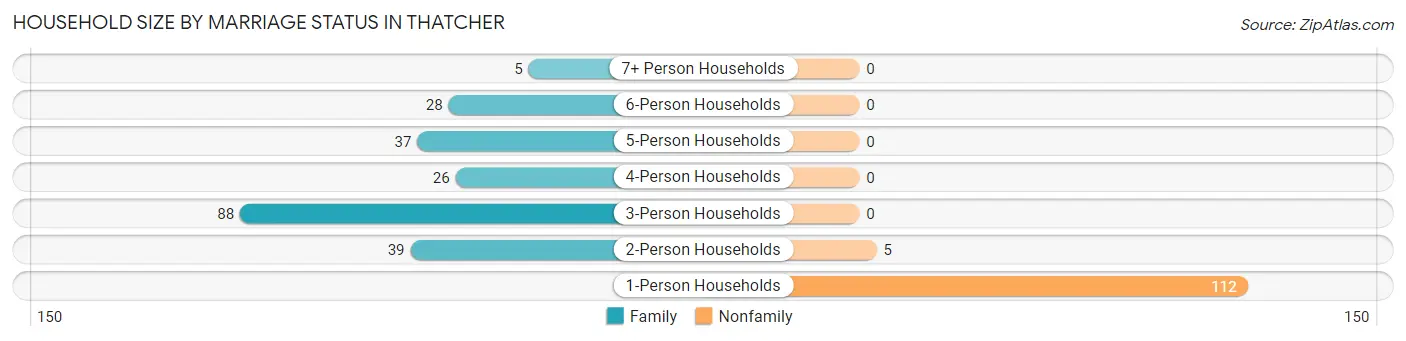
| Household Size | Family Households | Nonfamily Households |
| 1-Person Households | - | 112 (32.9%) |
| 2-Person Households | 39 (11.5%) | 5 (1.5%) |
| 3-Person Households | 88 (25.9%) | 0 (0.0%) |
| 4-Person Households | 26 (7.6%) | 0 (0.0%) |
| 5-Person Households | 37 (10.9%) | 0 (0.0%) |
| 6-Person Households | 28 (8.2%) | 0 (0.0%) |
| 7+ Person Households | 5 (1.5%) | 0 (0.0%) |
| Total | 223 (65.6%) | 117 (34.4%) |
Female Fertility in Thatcher
Fertility by Age in Thatcher
Average fertility rate in Thatcher is 93.0 births per 1,000 women. Women in the age bracket of 35 to 50 years have the highest fertility rate with 164.0 births per 1,000 women. Women in the age bracket of 35 to 50 years acount for 100.0% of all women with births.
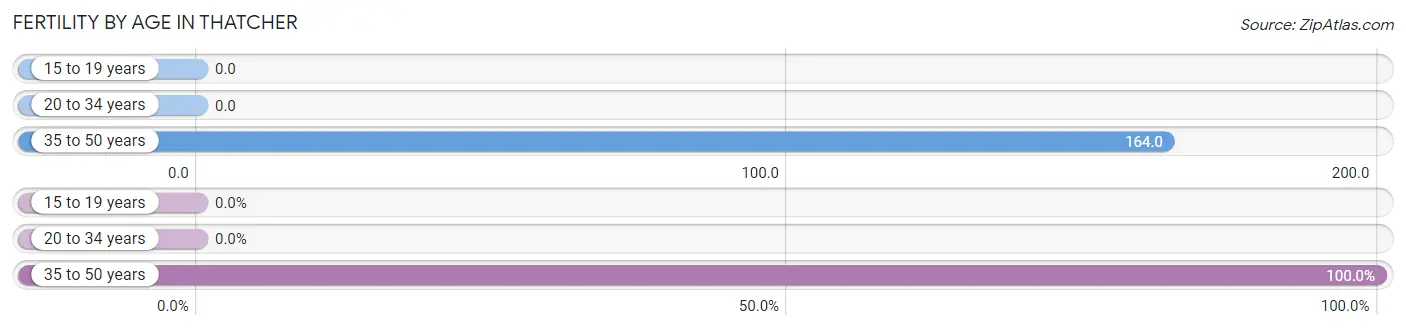
| Age Bracket | Women with Births | Births / 1,000 Women |
| 15 to 19 years | 0 (0.0%) | 0.0 |
| 20 to 34 years | 0 (0.0%) | 0.0 |
| 35 to 50 years | 21 (100.0%) | 164.0 |
| Total | 21 (100.0%) | 93.0 |
Fertility by Age by Marriage Status in Thatcher
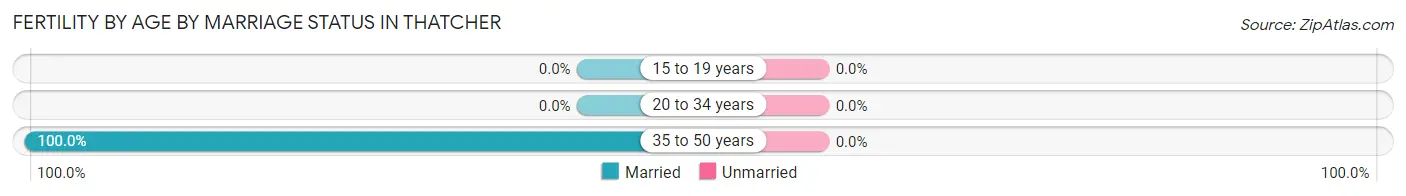
| Age Bracket | Married | Unmarried |
| 15 to 19 years | 0 (0.0%) | 0 (0.0%) |
| 20 to 34 years | 0 (0.0%) | 0 (0.0%) |
| 35 to 50 years | 21 (100.0%) | 0 (0.0%) |
| Total | 21 (100.0%) | 0 (0.0%) |
Fertility by Education in Thatcher
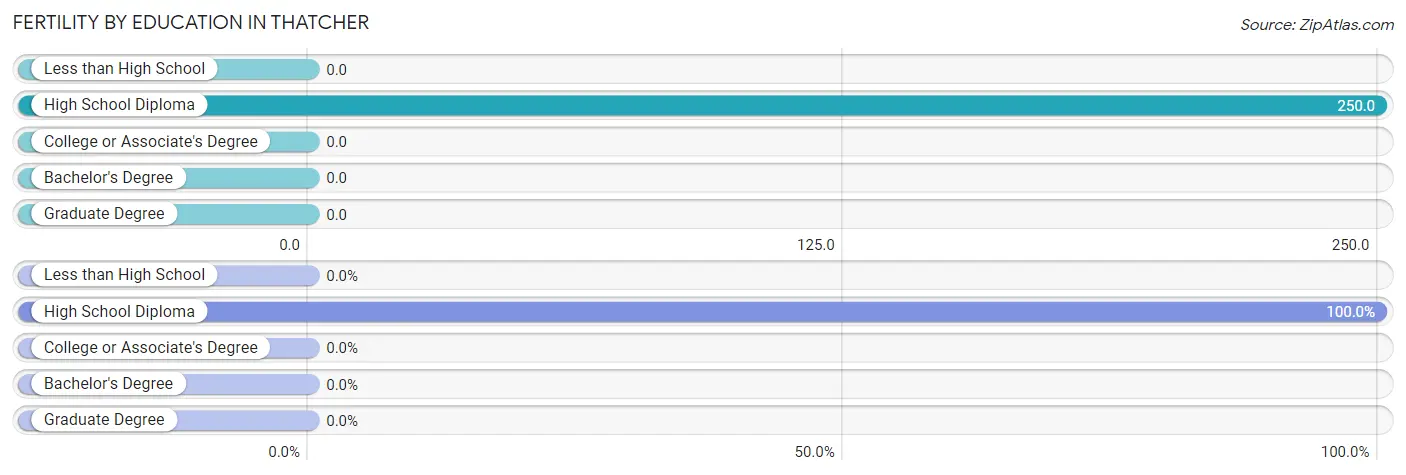
| Educational Attainment | Women with Births | Births / 1,000 Women |
| Less than High School | 0 (0.0%) | 0.0 |
| High School Diploma | 21 (100.0%) | 250.0 |
| College or Associate's Degree | 0 (0.0%) | 0.0 |
| Bachelor's Degree | 0 (0.0%) | 0.0 |
| Graduate Degree | 0 (0.0%) | 0.0 |
| Total | 21 (100.0%) | 93.0 |
Fertility by Education by Marriage Status in Thatcher
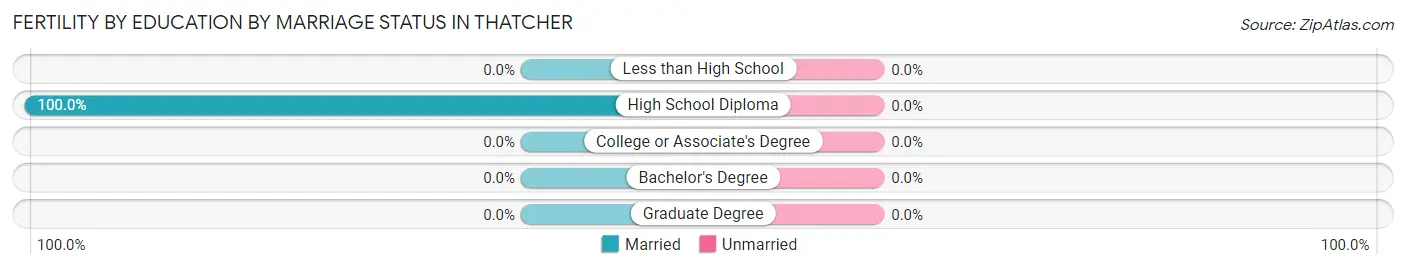
| Educational Attainment | Married | Unmarried |
| Less than High School | 0 (0.0%) | 0 (0.0%) |
| High School Diploma | 21 (100.0%) | 0 (0.0%) |
| College or Associate's Degree | 0 (0.0%) | 0 (0.0%) |
| Bachelor's Degree | 0 (0.0%) | 0 (0.0%) |
| Graduate Degree | 0 (0.0%) | 0 (0.0%) |
| Total | 21 (100.0%) | 0 (0.0%) |
Employment Characteristics in Thatcher
Employment by Class of Employer in Thatcher
Among the 476 employed individuals in Thatcher, private company employees (261 | 54.8%), federal government employees (75 | 15.8%), and self-employed (not incorporated) (52 | 10.9%) make up the most common classes of employment.
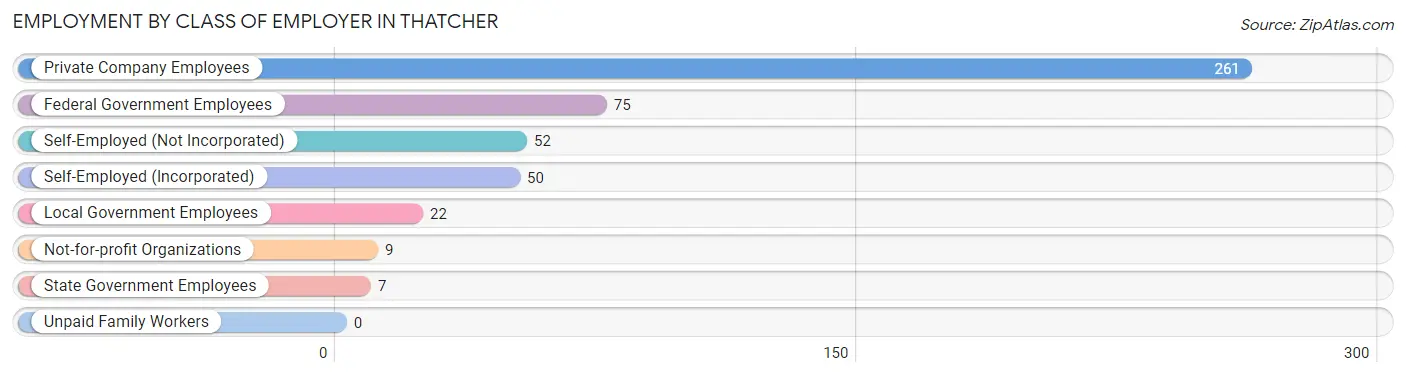
| Employer Class | # Employees | % Employees |
| Private Company Employees | 261 | 54.8% |
| Self-Employed (Incorporated) | 50 | 10.5% |
| Self-Employed (Not Incorporated) | 52 | 10.9% |
| Not-for-profit Organizations | 9 | 1.9% |
| Local Government Employees | 22 | 4.6% |
| State Government Employees | 7 | 1.5% |
| Federal Government Employees | 75 | 15.8% |
| Unpaid Family Workers | 0 | 0.0% |
| Total | 476 | 100.0% |
Employment Status by Age in Thatcher
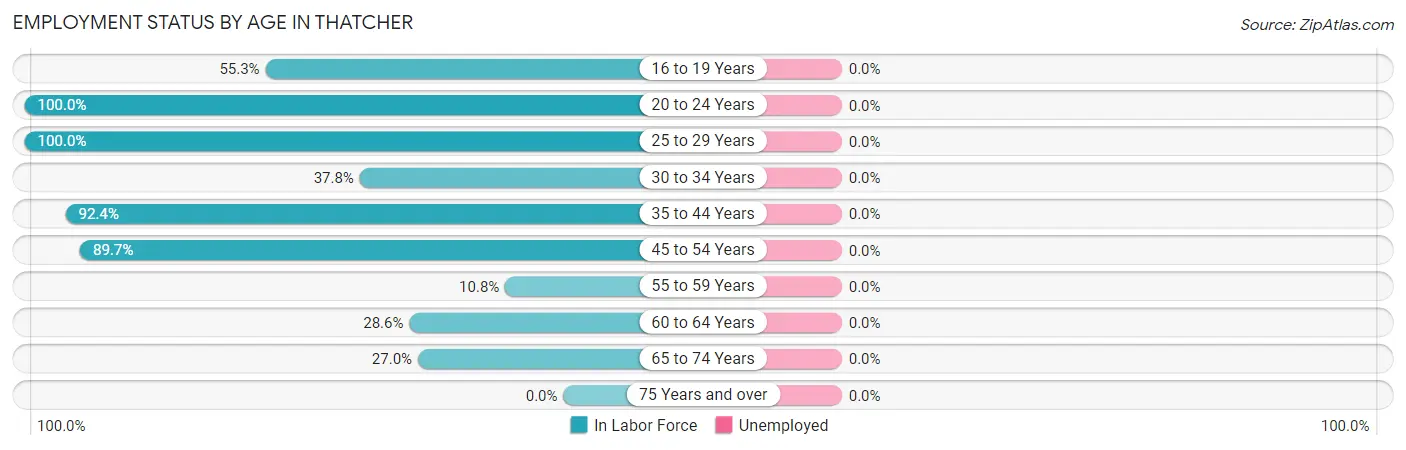
| Age Bracket | In Labor Force | Unemployed |
| 16 to 19 Years | 26 (55.3%) | 0 (0.0%) |
| 20 to 24 Years | 6 (100.0%) | 0 (0.0%) |
| 25 to 29 Years | 72 (100.0%) | 0 (0.0%) |
| 30 to 34 Years | 17 (37.8%) | 0 (0.0%) |
| 35 to 44 Years | 170 (92.4%) | 0 (0.0%) |
| 45 to 54 Years | 156 (89.7%) | 0 (0.0%) |
| 55 to 59 Years | 9 (10.8%) | 0 (0.0%) |
| 60 to 64 Years | 10 (28.6%) | 0 (0.0%) |
| 65 to 74 Years | 10 (27.0%) | 0 (0.0%) |
| 75 Years and over | 0 (0.0%) | 0 (0.0%) |
| Total | 476 (66.3%) | 0 (0.0%) |
Employment Status by Educational Attainment in Thatcher
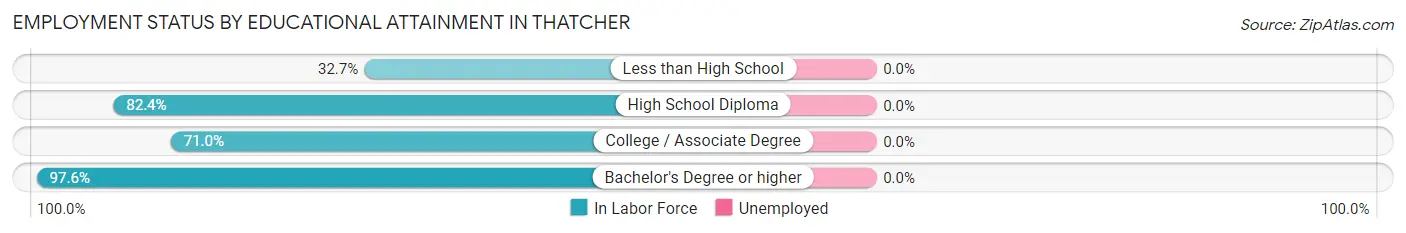
| Educational Attainment | In Labor Force | Unemployed |
| Less than High School | 36 (32.7%) | 0 (0.0%) |
| High School Diploma | 154 (82.4%) | 0 (0.0%) |
| College / Associate Degree | 120 (71.0%) | 0 (0.0%) |
| Bachelor's Degree or higher | 124 (97.6%) | 0 (0.0%) |
| Total | 434 (73.2%) | 0 (0.0%) |
Employment Occupations by Sex in Thatcher
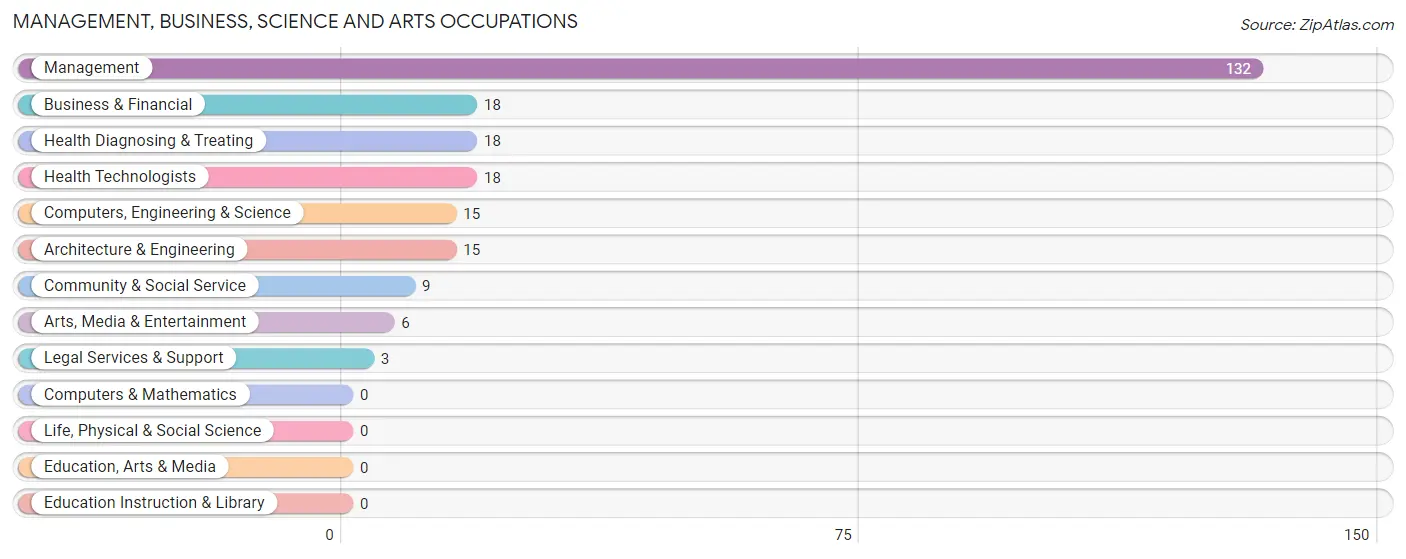
Management, Business, Science and Arts Occupations
The most common Management, Business, Science and Arts occupations in Thatcher are Management (132 | 31.1%), Business & Financial (18 | 4.2%), Health Diagnosing & Treating (18 | 4.2%), Health Technologists (18 | 4.2%), and Computers, Engineering & Science (15 | 3.5%).
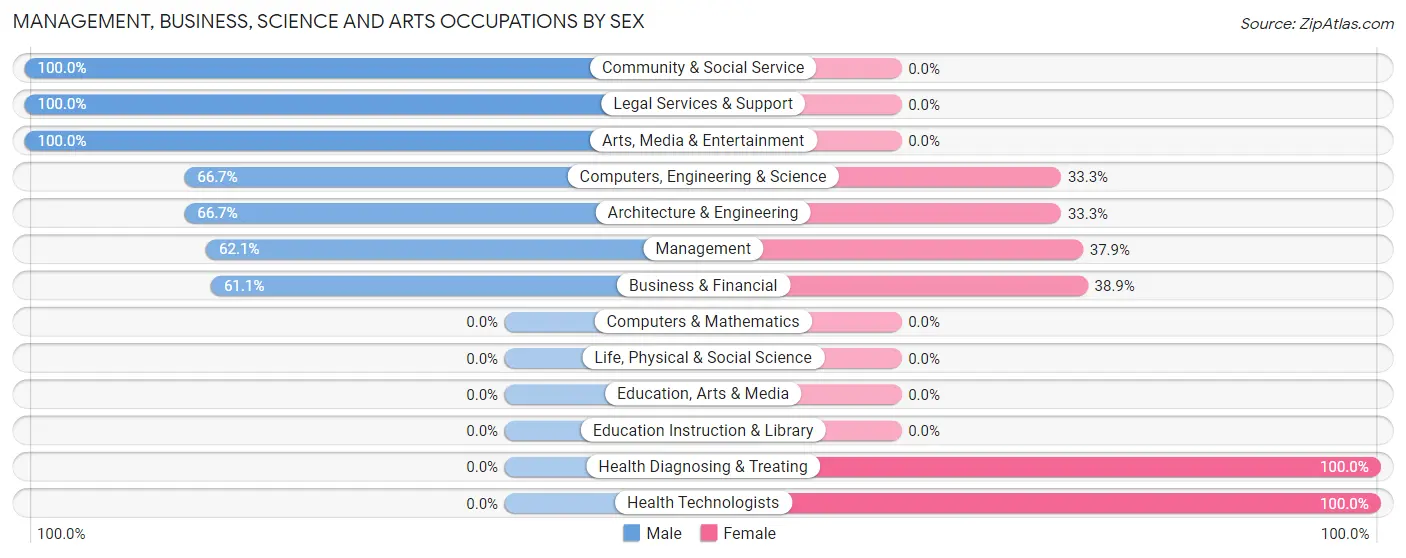
Management, Business, Science and Arts Occupations by Sex
Within the Management, Business, Science and Arts occupations in Thatcher, the most male-oriented occupations are Community & Social Service (100.0%), Legal Services & Support (100.0%), and Arts, Media & Entertainment (100.0%), while the most female-oriented occupations are Health Diagnosing & Treating (100.0%), Health Technologists (100.0%), and Business & Financial (38.9%).
| Occupation | Male | Female |
| Management | 82 (62.1%) | 50 (37.9%) |
| Business & Financial | 11 (61.1%) | 7 (38.9%) |
| Computers, Engineering & Science | 10 (66.7%) | 5 (33.3%) |
| Computers & Mathematics | 0 (0.0%) | 0 (0.0%) |
| Architecture & Engineering | 10 (66.7%) | 5 (33.3%) |
| Life, Physical & Social Science | 0 (0.0%) | 0 (0.0%) |
| Community & Social Service | 9 (100.0%) | 0 (0.0%) |
| Education, Arts & Media | 0 (0.0%) | 0 (0.0%) |
| Legal Services & Support | 3 (100.0%) | 0 (0.0%) |
| Education Instruction & Library | 0 (0.0%) | 0 (0.0%) |
| Arts, Media & Entertainment | 6 (100.0%) | 0 (0.0%) |
| Health Diagnosing & Treating | 0 (0.0%) | 18 (100.0%) |
| Health Technologists | 0 (0.0%) | 18 (100.0%) |
| Total (Category) | 112 (58.3%) | 80 (41.7%) |
| Total (Overall) | 239 (56.2%) | 186 (43.8%) |
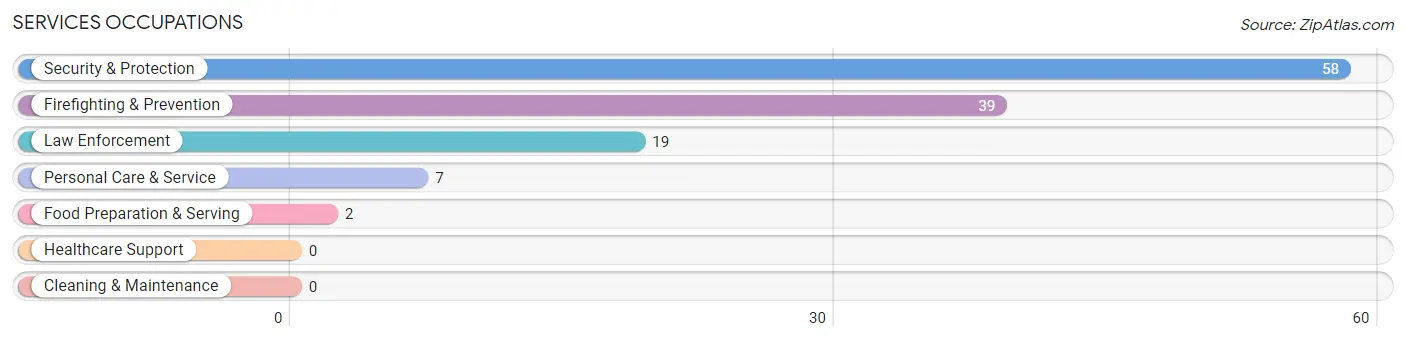
Services Occupations
The most common Services occupations in Thatcher are Security & Protection (58 | 13.7%), Firefighting & Prevention (39 | 9.2%), Law Enforcement (19 | 4.5%), Personal Care & Service (7 | 1.7%), and Food Preparation & Serving (2 | 0.5%).
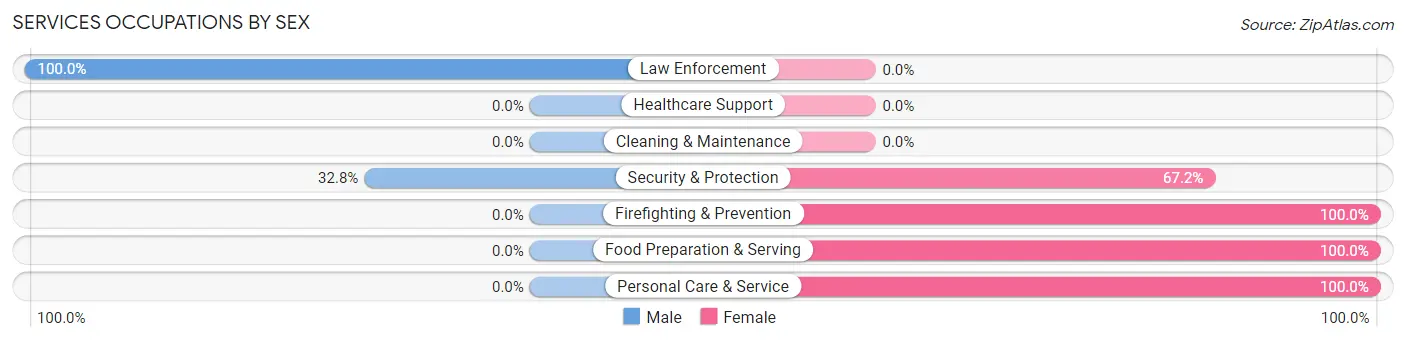
Services Occupations by Sex
Within the Services occupations in Thatcher, the most male-oriented occupations are Law Enforcement (100.0%), and Security & Protection (32.8%), while the most female-oriented occupations are Firefighting & Prevention (100.0%), Food Preparation & Serving (100.0%), and Personal Care & Service (100.0%).
| Occupation | Male | Female |
| Healthcare Support | 0 (0.0%) | 0 (0.0%) |
| Security & Protection | 19 (32.8%) | 39 (67.2%) |
| Firefighting & Prevention | 0 (0.0%) | 39 (100.0%) |
| Law Enforcement | 19 (100.0%) | 0 (0.0%) |
| Food Preparation & Serving | 0 (0.0%) | 2 (100.0%) |
| Cleaning & Maintenance | 0 (0.0%) | 0 (0.0%) |
| Personal Care & Service | 0 (0.0%) | 7 (100.0%) |
| Total (Category) | 19 (28.4%) | 48 (71.6%) |
| Total (Overall) | 239 (56.2%) | 186 (43.8%) |
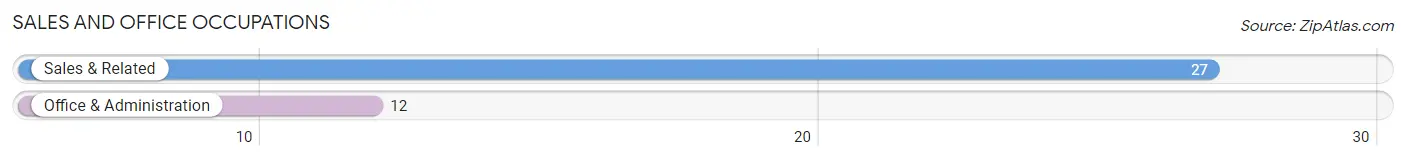
Sales and Office Occupations
The most common Sales and Office occupations in Thatcher are Sales & Related (27 | 6.4%), and Office & Administration (12 | 2.8%).
Sales and Office Occupations by Sex
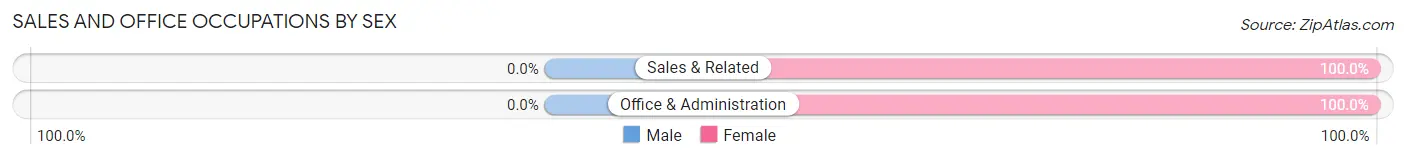
| Occupation | Male | Female |
| Sales & Related | 0 (0.0%) | 27 (100.0%) |
| Office & Administration | 0 (0.0%) | 12 (100.0%) |
| Total (Category) | 0 (0.0%) | 39 (100.0%) |
| Total (Overall) | 239 (56.2%) | 186 (43.8%) |
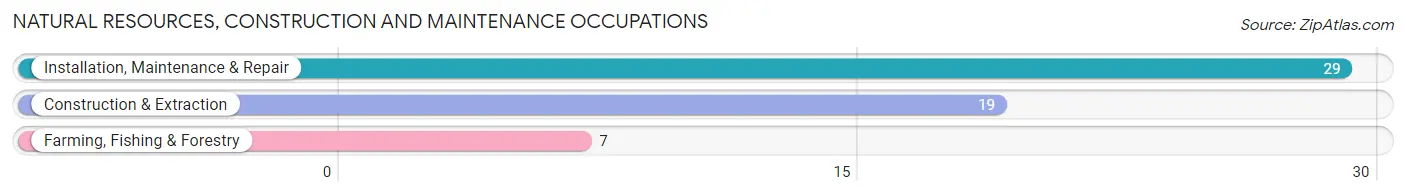
Natural Resources, Construction and Maintenance Occupations
The most common Natural Resources, Construction and Maintenance occupations in Thatcher are Installation, Maintenance & Repair (29 | 6.8%), Construction & Extraction (19 | 4.5%), and Farming, Fishing & Forestry (7 | 1.7%).
Natural Resources, Construction and Maintenance Occupations by Sex
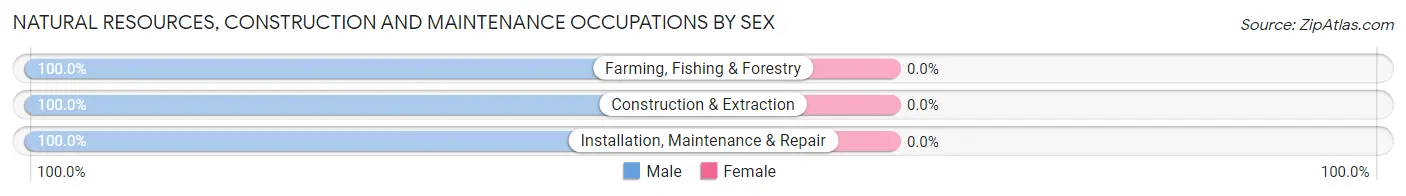
| Occupation | Male | Female |
| Farming, Fishing & Forestry | 7 (100.0%) | 0 (0.0%) |
| Construction & Extraction | 19 (100.0%) | 0 (0.0%) |
| Installation, Maintenance & Repair | 29 (100.0%) | 0 (0.0%) |
| Total (Category) | 55 (100.0%) | 0 (0.0%) |
| Total (Overall) | 239 (56.2%) | 186 (43.8%) |
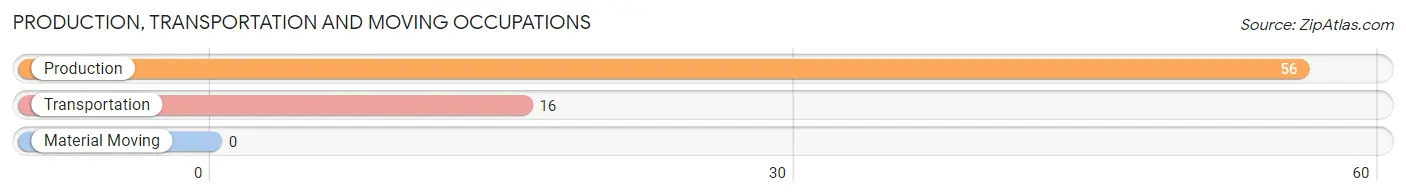
Production, Transportation and Moving Occupations
The most common Production, Transportation and Moving occupations in Thatcher are Production (56 | 13.2%), and Transportation (16 | 3.8%).
Production, Transportation and Moving Occupations by Sex
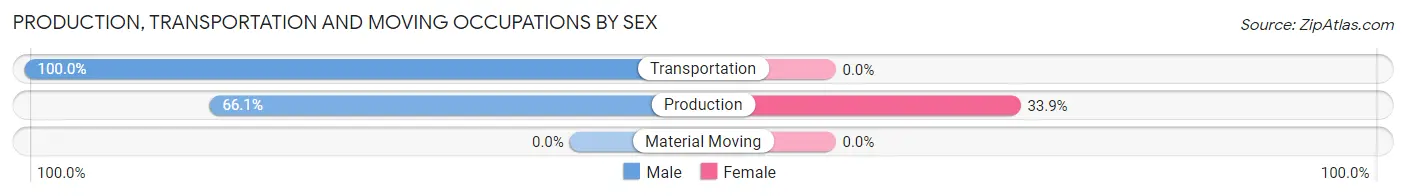
| Occupation | Male | Female |
| Production | 37 (66.1%) | 19 (33.9%) |
| Transportation | 16 (100.0%) | 0 (0.0%) |
| Material Moving | 0 (0.0%) | 0 (0.0%) |
| Total (Category) | 53 (73.6%) | 19 (26.4%) |
| Total (Overall) | 239 (56.2%) | 186 (43.8%) |
Employment Industries by Sex in Thatcher
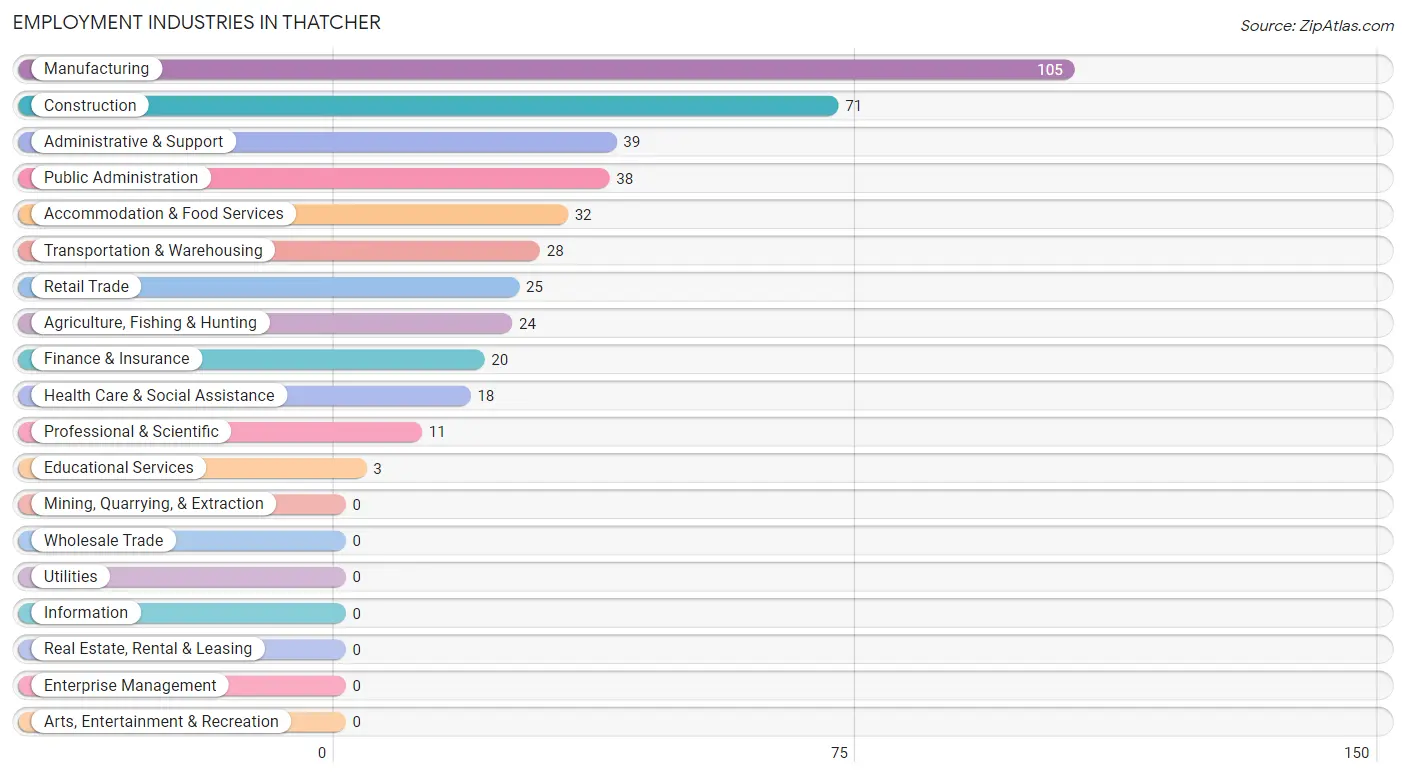
Employment Industries in Thatcher
The major employment industries in Thatcher include Manufacturing (105 | 24.7%), Construction (71 | 16.7%), Administrative & Support (39 | 9.2%), Public Administration (38 | 8.9%), and Accommodation & Food Services (32 | 7.5%).
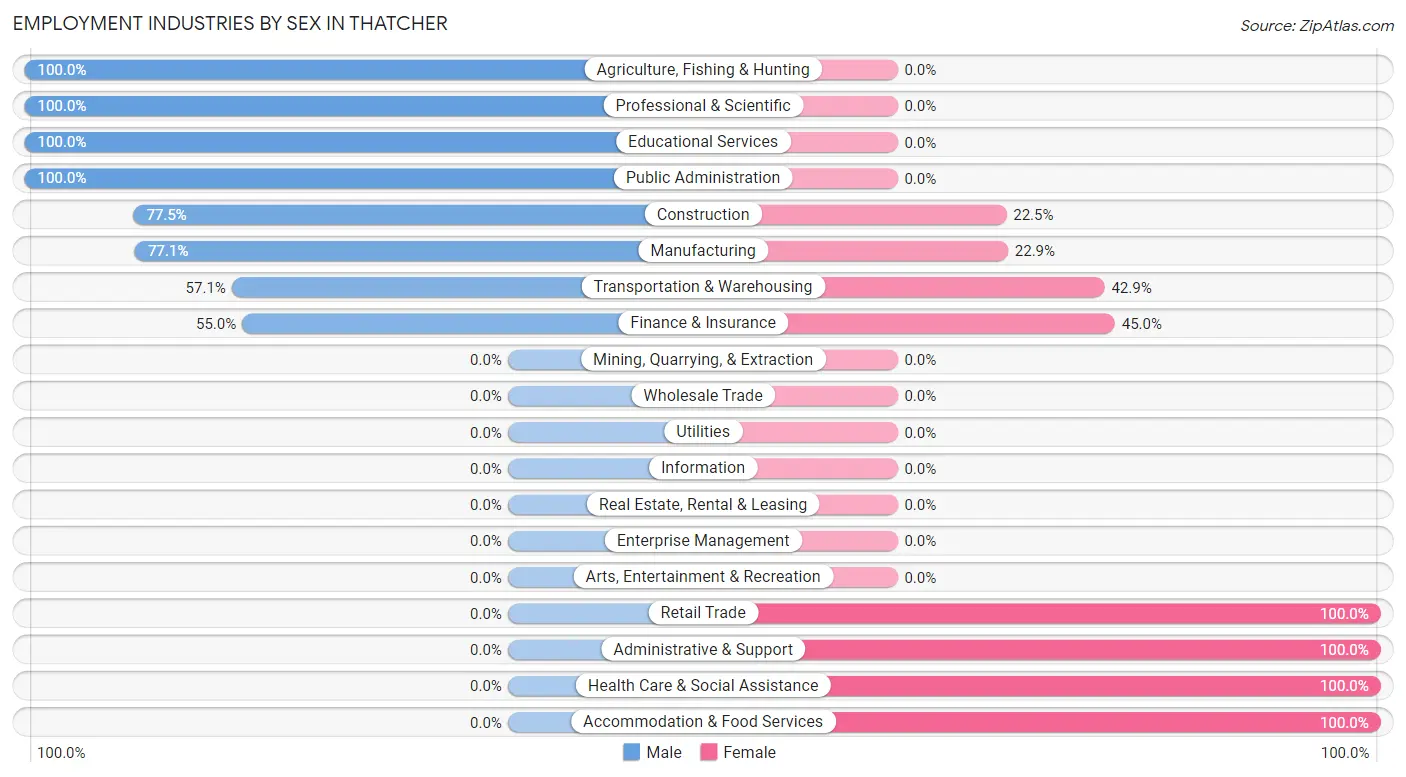
Employment Industries by Sex in Thatcher
The Thatcher industries that see more men than women are Agriculture, Fishing & Hunting (100.0%), Professional & Scientific (100.0%), and Educational Services (100.0%), whereas the industries that tend to have a higher number of women are Retail Trade (100.0%), Administrative & Support (100.0%), and Health Care & Social Assistance (100.0%).
| Industry | Male | Female |
| Agriculture, Fishing & Hunting | 24 (100.0%) | 0 (0.0%) |
| Mining, Quarrying, & Extraction | 0 (0.0%) | 0 (0.0%) |
| Construction | 55 (77.5%) | 16 (22.5%) |
| Manufacturing | 81 (77.1%) | 24 (22.9%) |
| Wholesale Trade | 0 (0.0%) | 0 (0.0%) |
| Retail Trade | 0 (0.0%) | 25 (100.0%) |
| Transportation & Warehousing | 16 (57.1%) | 12 (42.9%) |
| Utilities | 0 (0.0%) | 0 (0.0%) |
| Information | 0 (0.0%) | 0 (0.0%) |
| Finance & Insurance | 11 (55.0%) | 9 (45.0%) |
| Real Estate, Rental & Leasing | 0 (0.0%) | 0 (0.0%) |
| Professional & Scientific | 11 (100.0%) | 0 (0.0%) |
| Enterprise Management | 0 (0.0%) | 0 (0.0%) |
| Administrative & Support | 0 (0.0%) | 39 (100.0%) |
| Educational Services | 3 (100.0%) | 0 (0.0%) |
| Health Care & Social Assistance | 0 (0.0%) | 18 (100.0%) |
| Arts, Entertainment & Recreation | 0 (0.0%) | 0 (0.0%) |
| Accommodation & Food Services | 0 (0.0%) | 32 (100.0%) |
| Public Administration | 38 (100.0%) | 0 (0.0%) |
| Total | 239 (56.2%) | 186 (43.8%) |
Education in Thatcher
School Enrollment in Thatcher
The most common levels of schooling among the 333 students in Thatcher are elementary school (130 | 39.0%), middle school (110 | 33.0%), and high school (69 | 20.7%).
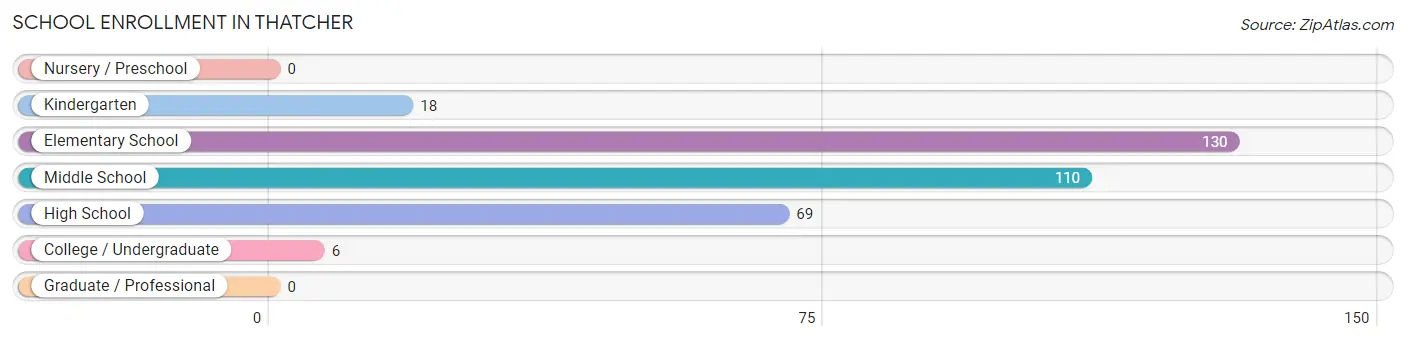
| School Level | # Students | % Students |
| Nursery / Preschool | 0 | 0.0% |
| Kindergarten | 18 | 5.4% |
| Elementary School | 130 | 39.0% |
| Middle School | 110 | 33.0% |
| High School | 69 | 20.7% |
| College / Undergraduate | 6 | 1.8% |
| Graduate / Professional | 0 | 0.0% |
| Total | 333 | 100.0% |
School Enrollment by Age by Funding Source in Thatcher
Out of a total of 333 students who are enrolled in schools in Thatcher, 6 (1.8%) attend a private institution, while the remaining 327 (98.2%) are enrolled in public schools. The age group of 20 to 24 year olds has the highest likelihood of being enrolled in private schools, with 6 (100.0% in the age bracket) enrolled. Conversely, the age group of 5 to 9 year old has the lowest likelihood of being enrolled in a private school, with 127 (100.0% in the age bracket) attending a public institution.
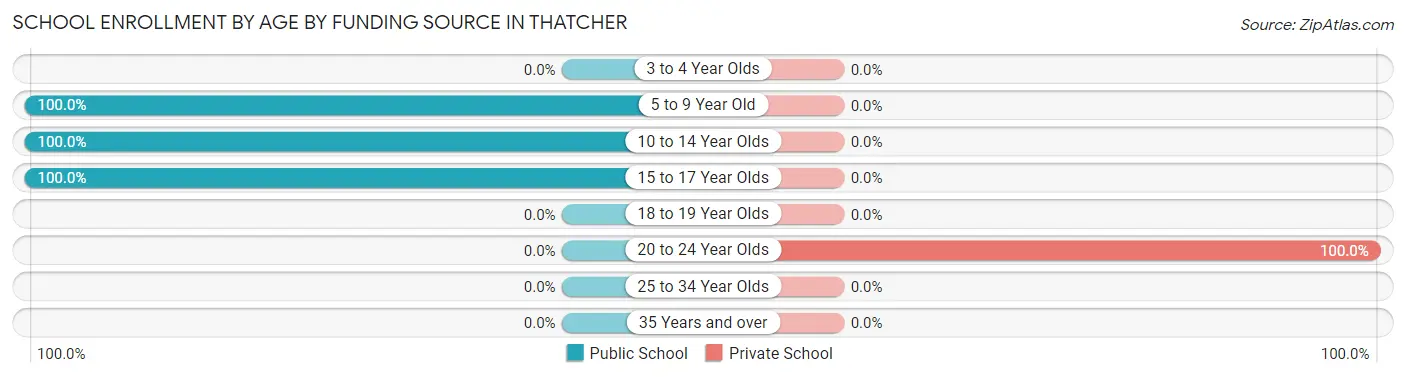
| Age Bracket | Public School | Private School |
| 3 to 4 Year Olds | 0 (0.0%) | 0 (0.0%) |
| 5 to 9 Year Old | 127 (100.0%) | 0 (0.0%) |
| 10 to 14 Year Olds | 121 (100.0%) | 0 (0.0%) |
| 15 to 17 Year Olds | 79 (100.0%) | 0 (0.0%) |
| 18 to 19 Year Olds | 0 (0.0%) | 0 (0.0%) |
| 20 to 24 Year Olds | 0 (0.0%) | 6 (100.0%) |
| 25 to 34 Year Olds | 0 (0.0%) | 0 (0.0%) |
| 35 Years and over | 0 (0.0%) | 0 (0.0%) |
| Total | 327 (98.2%) | 6 (1.8%) |
Educational Attainment by Field of Study in Thatcher
Science & technology (40 | 23.4%), social sciences (39 | 22.8%), engineering (35 | 20.5%), business (19 | 11.1%), and computers & mathematics (11 | 6.4%) are the most common fields of study among 171 individuals in Thatcher who have obtained a bachelor's degree or higher.
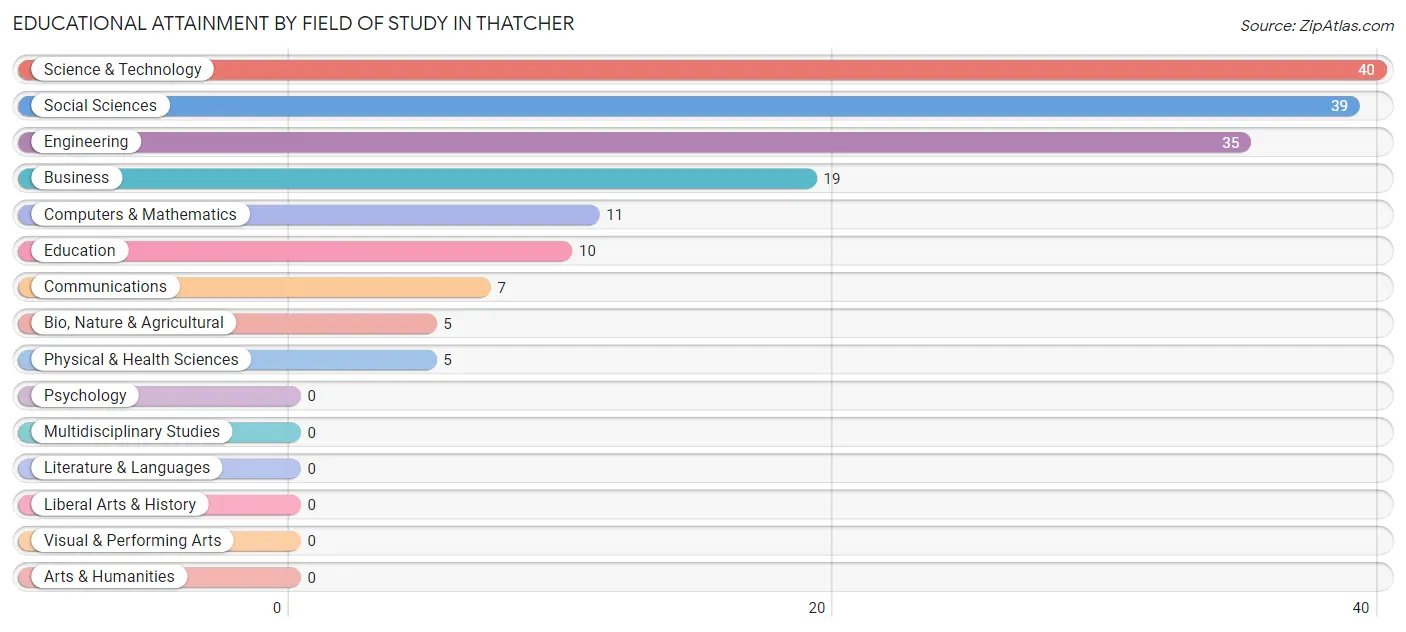
| Field of Study | # Graduates | % Graduates |
| Computers & Mathematics | 11 | 6.4% |
| Bio, Nature & Agricultural | 5 | 2.9% |
| Physical & Health Sciences | 5 | 2.9% |
| Psychology | 0 | 0.0% |
| Social Sciences | 39 | 22.8% |
| Engineering | 35 | 20.5% |
| Multidisciplinary Studies | 0 | 0.0% |
| Science & Technology | 40 | 23.4% |
| Business | 19 | 11.1% |
| Education | 10 | 5.9% |
| Literature & Languages | 0 | 0.0% |
| Liberal Arts & History | 0 | 0.0% |
| Visual & Performing Arts | 0 | 0.0% |
| Communications | 7 | 4.1% |
| Arts & Humanities | 0 | 0.0% |
| Total | 171 | 100.0% |
Transportation & Commute in Thatcher
Vehicle Availability by Sex in Thatcher
The most prevalent vehicle ownership categories in Thatcher are males with 2 vehicles (97, accounting for 33.5%) and females with 2 vehicles (37, making up 52.1%).
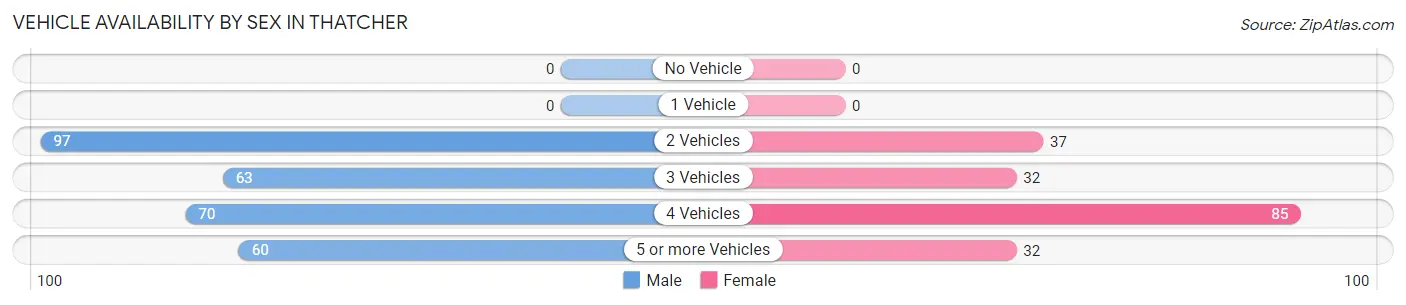
| Vehicles Available | Male | Female |
| No Vehicle | 0 (0.0%) | 0 (0.0%) |
| 1 Vehicle | 0 (0.0%) | 0 (0.0%) |
| 2 Vehicles | 97 (33.5%) | 37 (19.9%) |
| 3 Vehicles | 63 (21.7%) | 32 (17.2%) |
| 4 Vehicles | 70 (24.1%) | 85 (45.7%) |
| 5 or more Vehicles | 60 (20.7%) | 32 (17.2%) |
| Total | 290 (100.0%) | 186 (100.0%) |
Commute Time in Thatcher
The most frequently occuring commute durations in Thatcher are 45 to 59 minutes (131 commuters, 32.2%), 30 to 34 minutes (83 commuters, 20.4%), and 15 to 19 minutes (56 commuters, 13.8%).
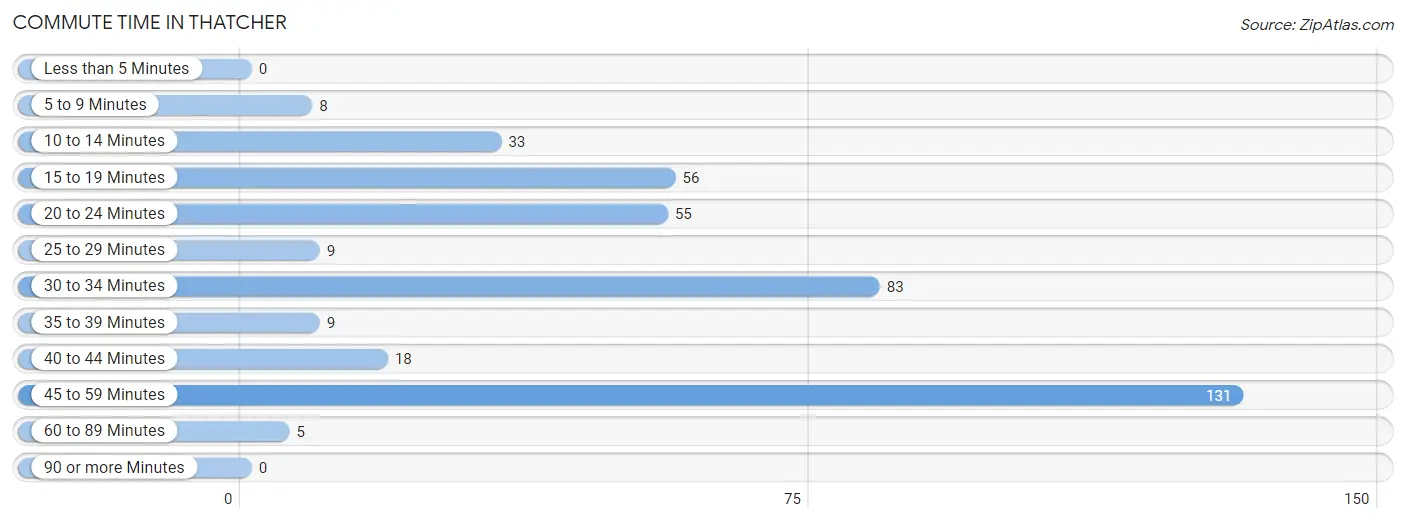
| Commute Time | # Commuters | % Commuters |
| Less than 5 Minutes | 0 | 0.0% |
| 5 to 9 Minutes | 8 | 2.0% |
| 10 to 14 Minutes | 33 | 8.1% |
| 15 to 19 Minutes | 56 | 13.8% |
| 20 to 24 Minutes | 55 | 13.5% |
| 25 to 29 Minutes | 9 | 2.2% |
| 30 to 34 Minutes | 83 | 20.4% |
| 35 to 39 Minutes | 9 | 2.2% |
| 40 to 44 Minutes | 18 | 4.4% |
| 45 to 59 Minutes | 131 | 32.2% |
| 60 to 89 Minutes | 5 | 1.2% |
| 90 or more Minutes | 0 | 0.0% |
Commute Time by Sex in Thatcher
The most common commute times in Thatcher are 30 to 34 minutes (74 commuters, 29.8%) for males and 45 to 59 minutes (69 commuters, 43.4%) for females.
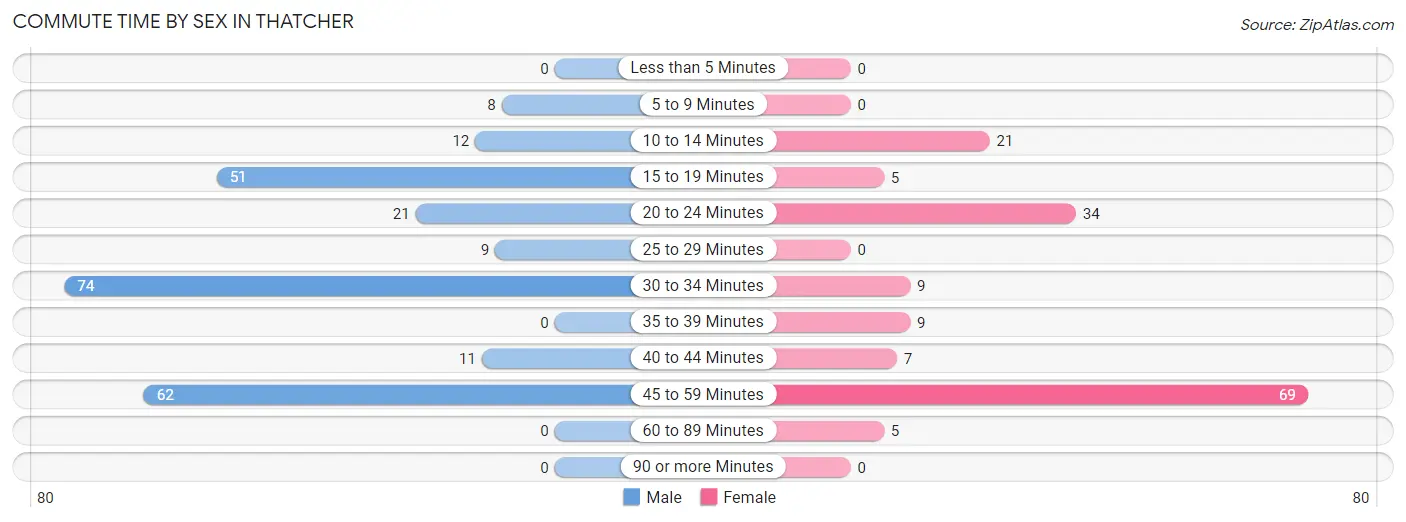
| Commute Time | Male | Female |
| Less than 5 Minutes | 0 (0.0%) | 0 (0.0%) |
| 5 to 9 Minutes | 8 (3.2%) | 0 (0.0%) |
| 10 to 14 Minutes | 12 (4.8%) | 21 (13.2%) |
| 15 to 19 Minutes | 51 (20.6%) | 5 (3.1%) |
| 20 to 24 Minutes | 21 (8.5%) | 34 (21.4%) |
| 25 to 29 Minutes | 9 (3.6%) | 0 (0.0%) |
| 30 to 34 Minutes | 74 (29.8%) | 9 (5.7%) |
| 35 to 39 Minutes | 0 (0.0%) | 9 (5.7%) |
| 40 to 44 Minutes | 11 (4.4%) | 7 (4.4%) |
| 45 to 59 Minutes | 62 (25.0%) | 69 (43.4%) |
| 60 to 89 Minutes | 0 (0.0%) | 5 (3.1%) |
| 90 or more Minutes | 0 (0.0%) | 0 (0.0%) |
Time of Departure to Work by Sex in Thatcher
The most frequent times of departure to work in Thatcher are 12:00 PM to 3:59 PM (93, 37.5%) for males and 7:30 AM to 7:59 AM (72, 45.3%) for females.
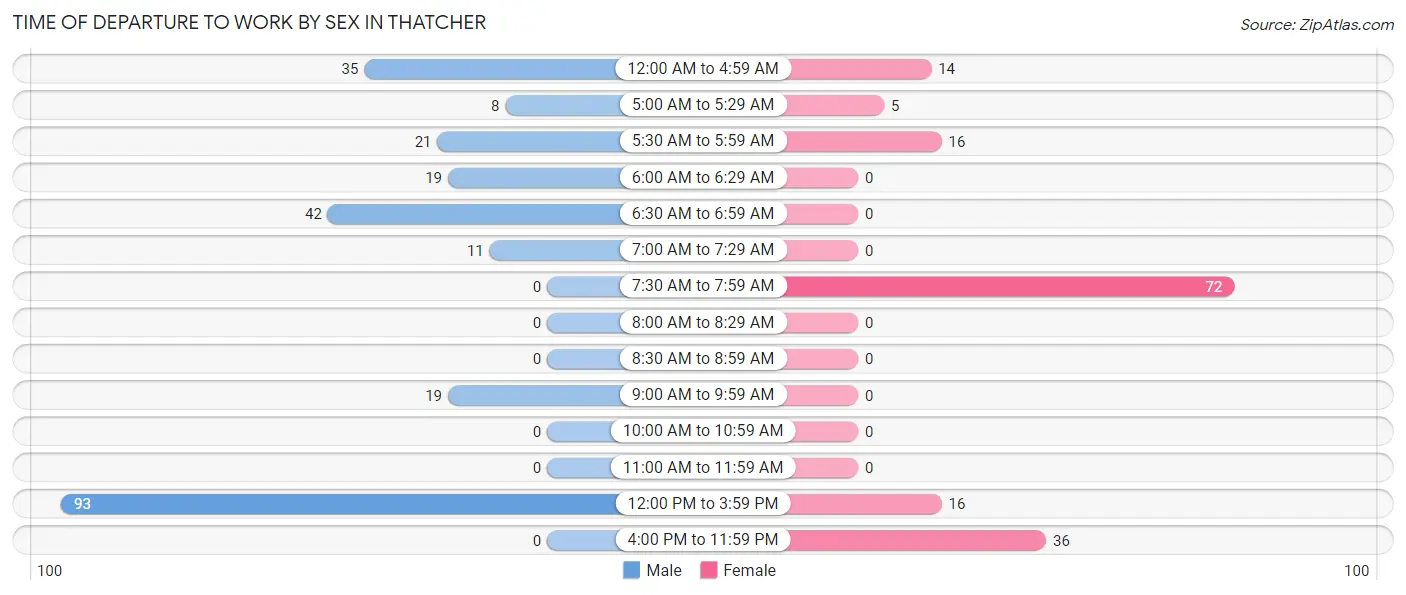
| Time of Departure | Male | Female |
| 12:00 AM to 4:59 AM | 35 (14.1%) | 14 (8.8%) |
| 5:00 AM to 5:29 AM | 8 (3.2%) | 5 (3.1%) |
| 5:30 AM to 5:59 AM | 21 (8.5%) | 16 (10.1%) |
| 6:00 AM to 6:29 AM | 19 (7.7%) | 0 (0.0%) |
| 6:30 AM to 6:59 AM | 42 (16.9%) | 0 (0.0%) |
| 7:00 AM to 7:29 AM | 11 (4.4%) | 0 (0.0%) |
| 7:30 AM to 7:59 AM | 0 (0.0%) | 72 (45.3%) |
| 8:00 AM to 8:29 AM | 0 (0.0%) | 0 (0.0%) |
| 8:30 AM to 8:59 AM | 0 (0.0%) | 0 (0.0%) |
| 9:00 AM to 9:59 AM | 19 (7.7%) | 0 (0.0%) |
| 10:00 AM to 10:59 AM | 0 (0.0%) | 0 (0.0%) |
| 11:00 AM to 11:59 AM | 0 (0.0%) | 0 (0.0%) |
| 12:00 PM to 3:59 PM | 93 (37.5%) | 16 (10.1%) |
| 4:00 PM to 11:59 PM | 0 (0.0%) | 36 (22.6%) |
| Total | 248 (100.0%) | 159 (100.0%) |
Housing Occupancy in Thatcher
Occupancy by Ownership in Thatcher
Of the total 340 dwellings in Thatcher, owner-occupied units account for 335 (98.5%), while renter-occupied units make up 5 (1.5%).
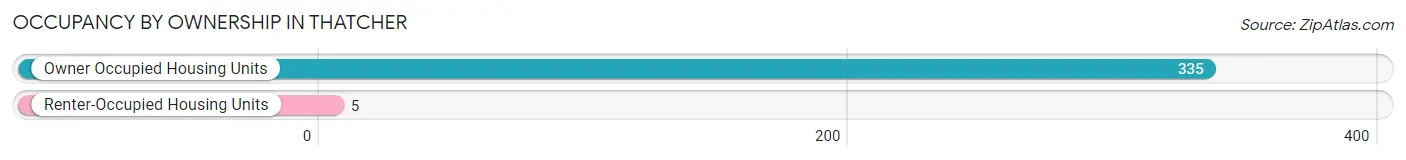
| Occupancy | # Housing Units | % Housing Units |
| Owner Occupied Housing Units | 335 | 98.5% |
| Renter-Occupied Housing Units | 5 | 1.5% |
| Total Occupied Housing Units | 340 | 100.0% |
Occupancy by Household Size in Thatcher
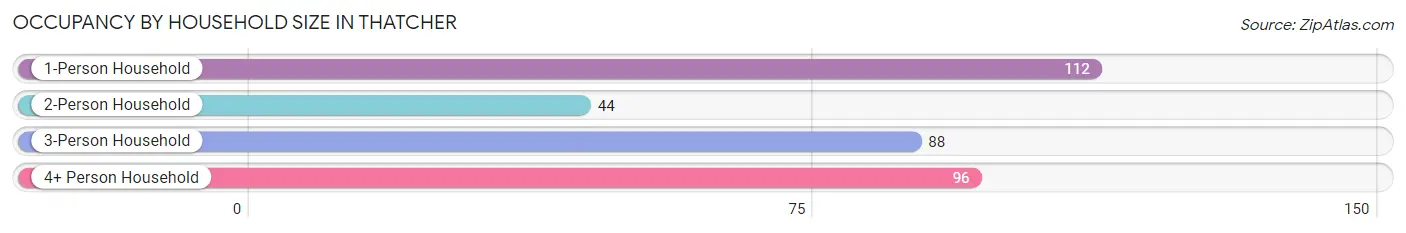
| Household Size | # Housing Units | % Housing Units |
| 1-Person Household | 112 | 32.9% |
| 2-Person Household | 44 | 12.9% |
| 3-Person Household | 88 | 25.9% |
| 4+ Person Household | 96 | 28.2% |
| Total Housing Units | 340 | 100.0% |
Occupancy by Ownership by Household Size in Thatcher
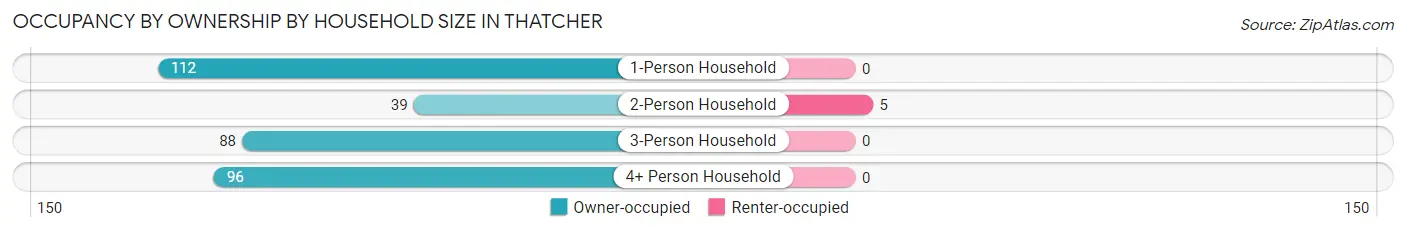
| Household Size | Owner-occupied | Renter-occupied |
| 1-Person Household | 112 (100.0%) | 0 (0.0%) |
| 2-Person Household | 39 (88.6%) | 5 (11.4%) |
| 3-Person Household | 88 (100.0%) | 0 (0.0%) |
| 4+ Person Household | 96 (100.0%) | 0 (0.0%) |
| Total Housing Units | 335 (98.5%) | 5 (1.5%) |
Occupancy by Educational Attainment in Thatcher
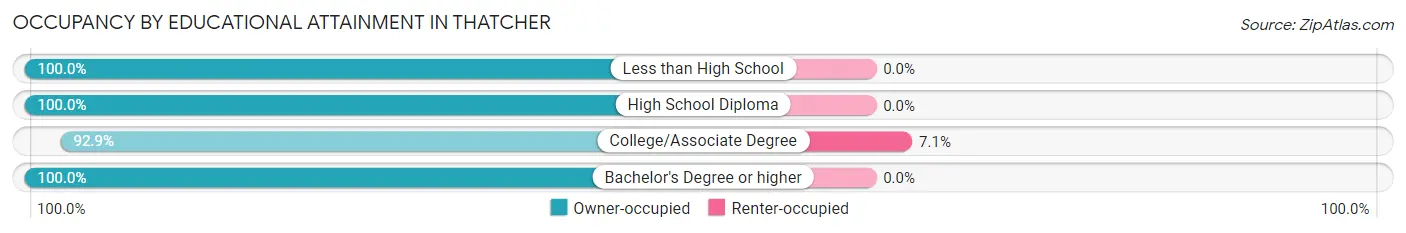
| Household Size | Owner-occupied | Renter-occupied |
| Less than High School | 74 (100.0%) | 0 (0.0%) |
| High School Diploma | 79 (100.0%) | 0 (0.0%) |
| College/Associate Degree | 65 (92.9%) | 5 (7.1%) |
| Bachelor's Degree or higher | 117 (100.0%) | 0 (0.0%) |
Occupancy by Age of Householder in Thatcher
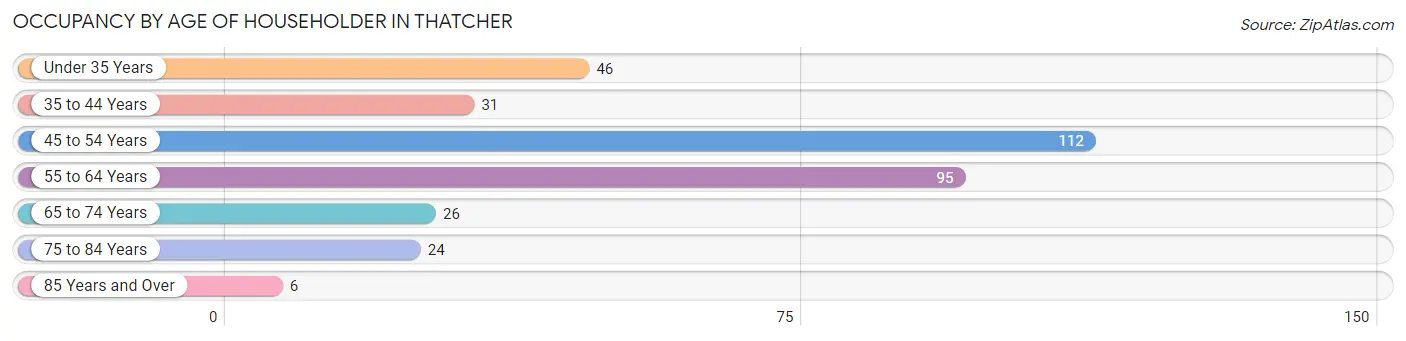
| Age Bracket | # Households | % Households |
| Under 35 Years | 46 | 13.5% |
| 35 to 44 Years | 31 | 9.1% |
| 45 to 54 Years | 112 | 32.9% |
| 55 to 64 Years | 95 | 27.9% |
| 65 to 74 Years | 26 | 7.6% |
| 75 to 84 Years | 24 | 7.1% |
| 85 Years and Over | 6 | 1.8% |
| Total | 340 | 100.0% |
Housing Finances in Thatcher
Median Income by Occupancy in Thatcher
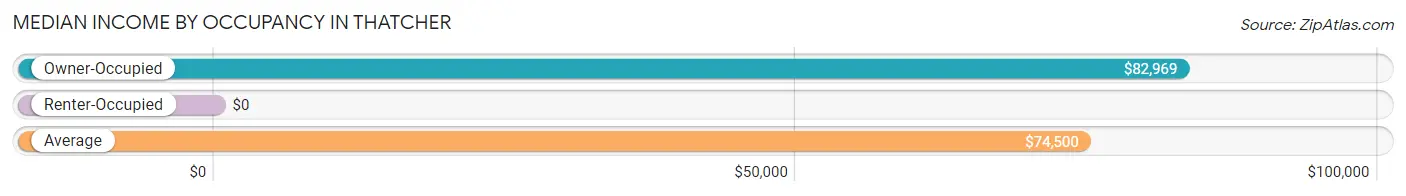
| Occupancy Type | # Households | Median Income |
| Owner-Occupied | 335 (98.5%) | $82,969 |
| Renter-Occupied | 5 (1.5%) | $0 |
| Average | 340 (100.0%) | $74,500 |
Occupancy by Householder Income Bracket in Thatcher
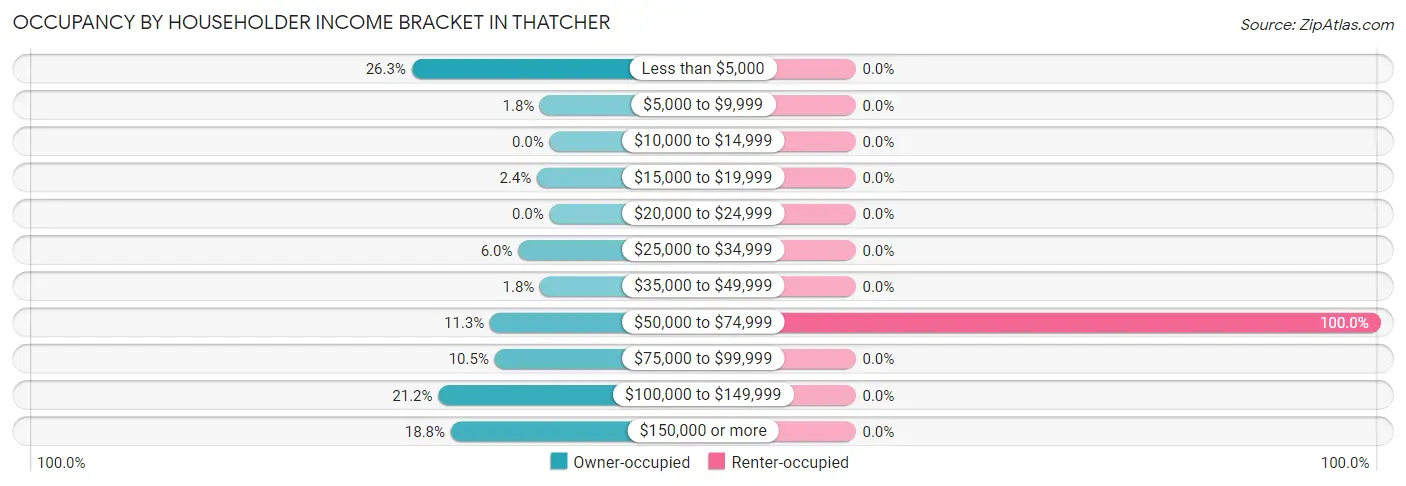
| Income Bracket | Owner-occupied | Renter-occupied |
| Less than $5,000 | 88 (26.3%) | 0 (0.0%) |
| $5,000 to $9,999 | 6 (1.8%) | 0 (0.0%) |
| $10,000 to $14,999 | 0 (0.0%) | 0 (0.0%) |
| $15,000 to $19,999 | 8 (2.4%) | 0 (0.0%) |
| $20,000 to $24,999 | 0 (0.0%) | 0 (0.0%) |
| $25,000 to $34,999 | 20 (6.0%) | 0 (0.0%) |
| $35,000 to $49,999 | 6 (1.8%) | 0 (0.0%) |
| $50,000 to $74,999 | 38 (11.3%) | 5 (100.0%) |
| $75,000 to $99,999 | 35 (10.4%) | 0 (0.0%) |
| $100,000 to $149,999 | 71 (21.2%) | 0 (0.0%) |
| $150,000 or more | 63 (18.8%) | 0 (0.0%) |
| Total | 335 (100.0%) | 5 (100.0%) |
Monthly Housing Cost Tiers in Thatcher
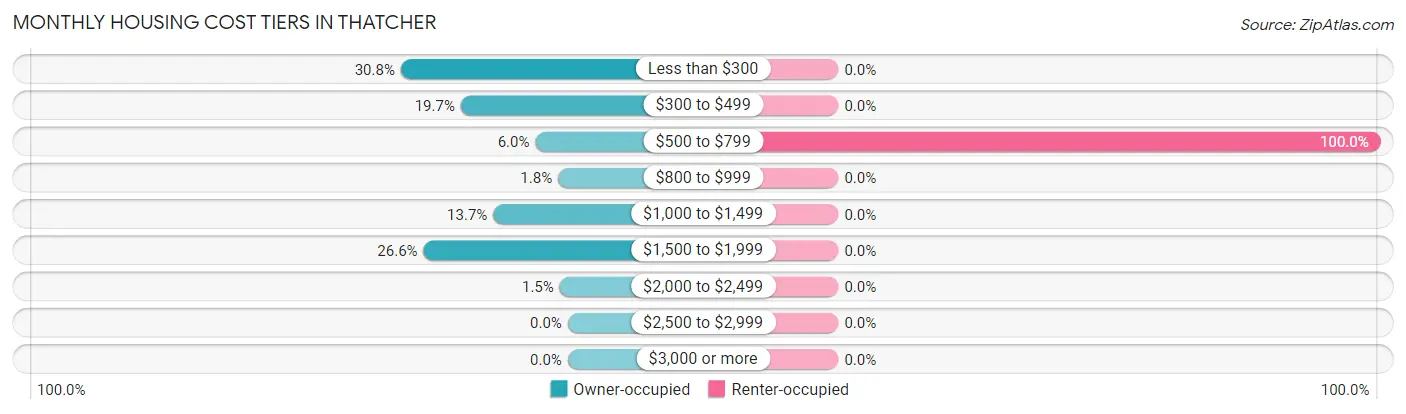
| Monthly Cost | Owner-occupied | Renter-occupied |
| Less than $300 | 103 (30.7%) | 0 (0.0%) |
| $300 to $499 | 66 (19.7%) | 0 (0.0%) |
| $500 to $799 | 20 (6.0%) | 5 (100.0%) |
| $800 to $999 | 6 (1.8%) | 0 (0.0%) |
| $1,000 to $1,499 | 46 (13.7%) | 0 (0.0%) |
| $1,500 to $1,999 | 89 (26.6%) | 0 (0.0%) |
| $2,000 to $2,499 | 5 (1.5%) | 0 (0.0%) |
| $2,500 to $2,999 | 0 (0.0%) | 0 (0.0%) |
| $3,000 or more | 0 (0.0%) | 0 (0.0%) |
| Total | 335 (100.0%) | 5 (100.0%) |
Physical Housing Characteristics in Thatcher
Housing Structures in Thatcher
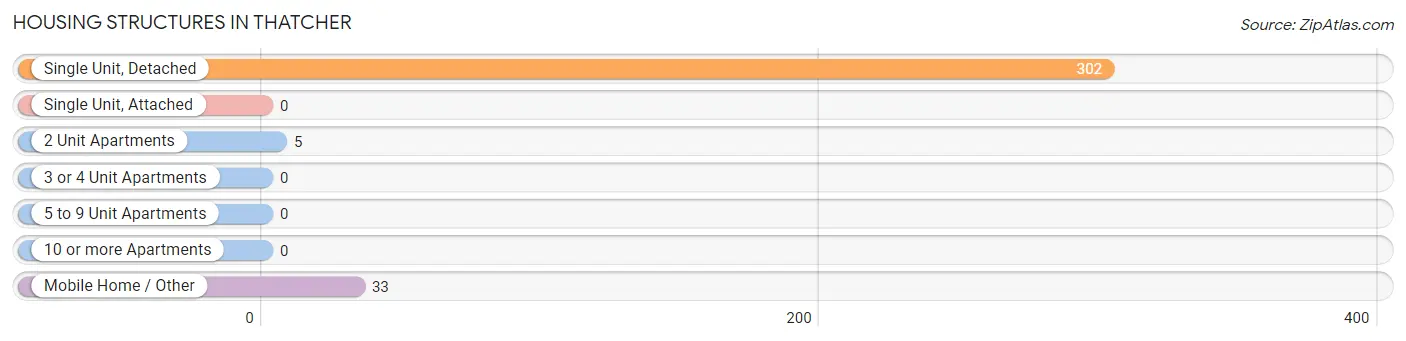
| Structure Type | # Housing Units | % Housing Units |
| Single Unit, Detached | 302 | 88.8% |
| Single Unit, Attached | 0 | 0.0% |
| 2 Unit Apartments | 5 | 1.5% |
| 3 or 4 Unit Apartments | 0 | 0.0% |
| 5 to 9 Unit Apartments | 0 | 0.0% |
| 10 or more Apartments | 0 | 0.0% |
| Mobile Home / Other | 33 | 9.7% |
| Total | 340 | 100.0% |
Housing Structures by Occupancy in Thatcher
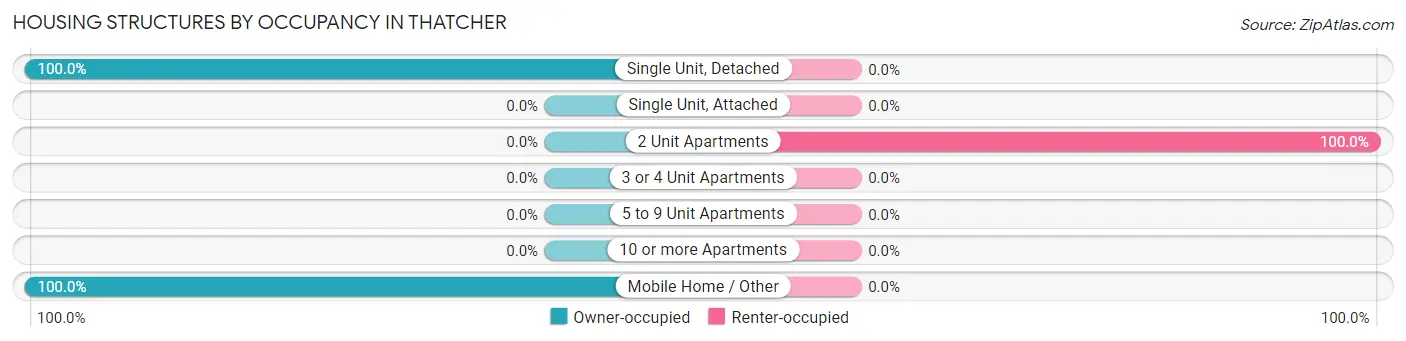
| Structure Type | Owner-occupied | Renter-occupied |
| Single Unit, Detached | 302 (100.0%) | 0 (0.0%) |
| Single Unit, Attached | 0 (0.0%) | 0 (0.0%) |
| 2 Unit Apartments | 0 (0.0%) | 5 (100.0%) |
| 3 or 4 Unit Apartments | 0 (0.0%) | 0 (0.0%) |
| 5 to 9 Unit Apartments | 0 (0.0%) | 0 (0.0%) |
| 10 or more Apartments | 0 (0.0%) | 0 (0.0%) |
| Mobile Home / Other | 33 (100.0%) | 0 (0.0%) |
| Total | 335 (98.5%) | 5 (1.5%) |
Housing Structures by Number of Rooms in Thatcher
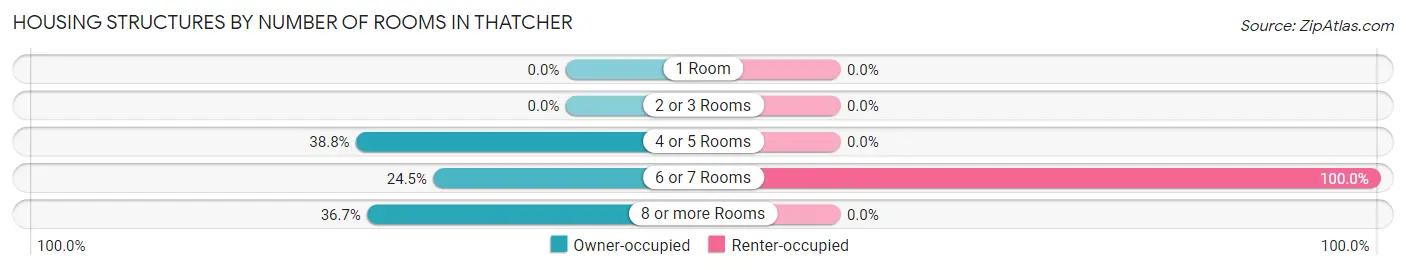
| Number of Rooms | Owner-occupied | Renter-occupied |
| 1 Room | 0 (0.0%) | 0 (0.0%) |
| 2 or 3 Rooms | 0 (0.0%) | 0 (0.0%) |
| 4 or 5 Rooms | 130 (38.8%) | 0 (0.0%) |
| 6 or 7 Rooms | 82 (24.5%) | 5 (100.0%) |
| 8 or more Rooms | 123 (36.7%) | 0 (0.0%) |
| Total | 335 (100.0%) | 5 (100.0%) |
Housing Structure by Heating Type in Thatcher
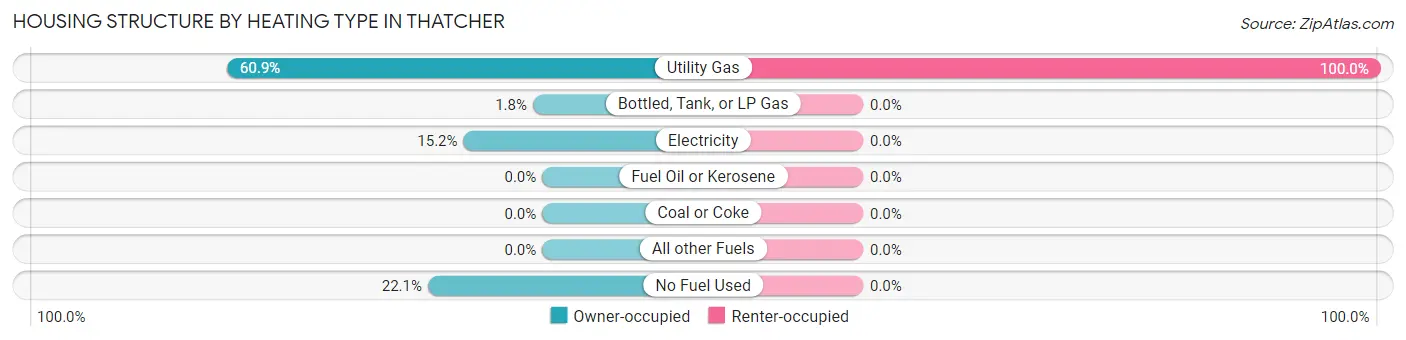
| Heating Type | Owner-occupied | Renter-occupied |
| Utility Gas | 204 (60.9%) | 5 (100.0%) |
| Bottled, Tank, or LP Gas | 6 (1.8%) | 0 (0.0%) |
| Electricity | 51 (15.2%) | 0 (0.0%) |
| Fuel Oil or Kerosene | 0 (0.0%) | 0 (0.0%) |
| Coal or Coke | 0 (0.0%) | 0 (0.0%) |
| All other Fuels | 0 (0.0%) | 0 (0.0%) |
| No Fuel Used | 74 (22.1%) | 0 (0.0%) |
| Total | 335 (100.0%) | 5 (100.0%) |
Household Vehicle Usage in Thatcher
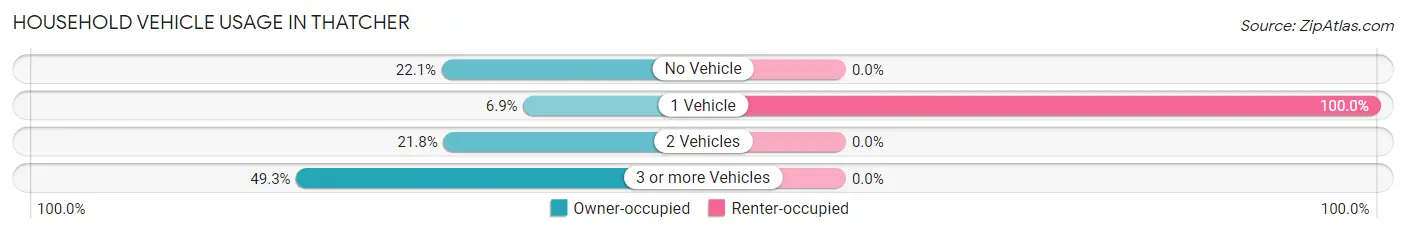
| Vehicles per Household | Owner-occupied | Renter-occupied |
| No Vehicle | 74 (22.1%) | 0 (0.0%) |
| 1 Vehicle | 23 (6.9%) | 5 (100.0%) |
| 2 Vehicles | 73 (21.8%) | 0 (0.0%) |
| 3 or more Vehicles | 165 (49.2%) | 0 (0.0%) |
| Total | 335 (100.0%) | 5 (100.0%) |
Real Estate & Mortgages in Thatcher
Real Estate and Mortgage Overview in Thatcher
| Characteristic | Without Mortgage | With Mortgage |
| Housing Units | 189 | 146 |
| Median Property Value | $208,600 | $347,800 |
| Median Household Income | - | - |
| Monthly Housing Costs | $275 | $0 |
| Real Estate Taxes | - | - |
Property Value by Mortgage Status in Thatcher
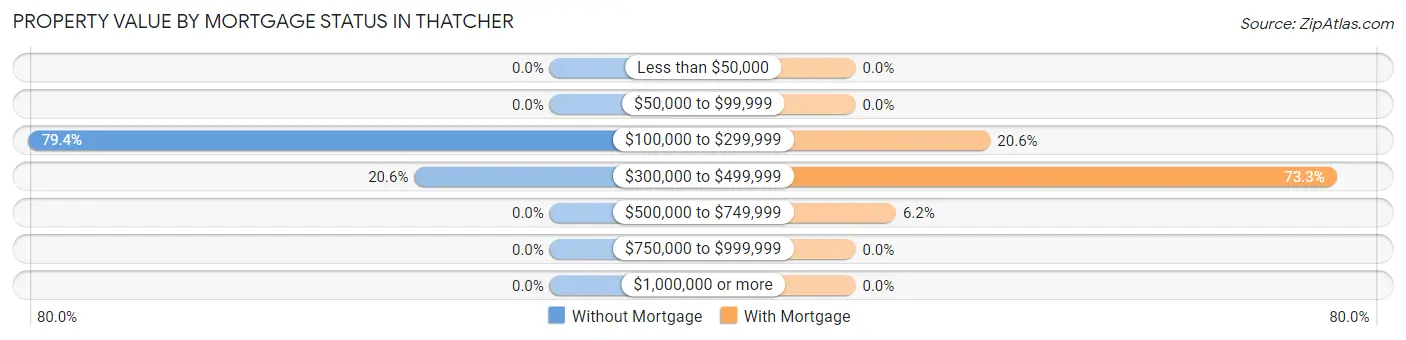
| Property Value | Without Mortgage | With Mortgage |
| Less than $50,000 | 0 (0.0%) | 0 (0.0%) |
| $50,000 to $99,999 | 0 (0.0%) | 0 (0.0%) |
| $100,000 to $299,999 | 150 (79.4%) | 30 (20.5%) |
| $300,000 to $499,999 | 39 (20.6%) | 107 (73.3%) |
| $500,000 to $749,999 | 0 (0.0%) | 9 (6.2%) |
| $750,000 to $999,999 | 0 (0.0%) | 0 (0.0%) |
| $1,000,000 or more | 0 (0.0%) | 0 (0.0%) |
| Total | 189 (100.0%) | 146 (100.0%) |
Household Income by Mortgage Status in Thatcher
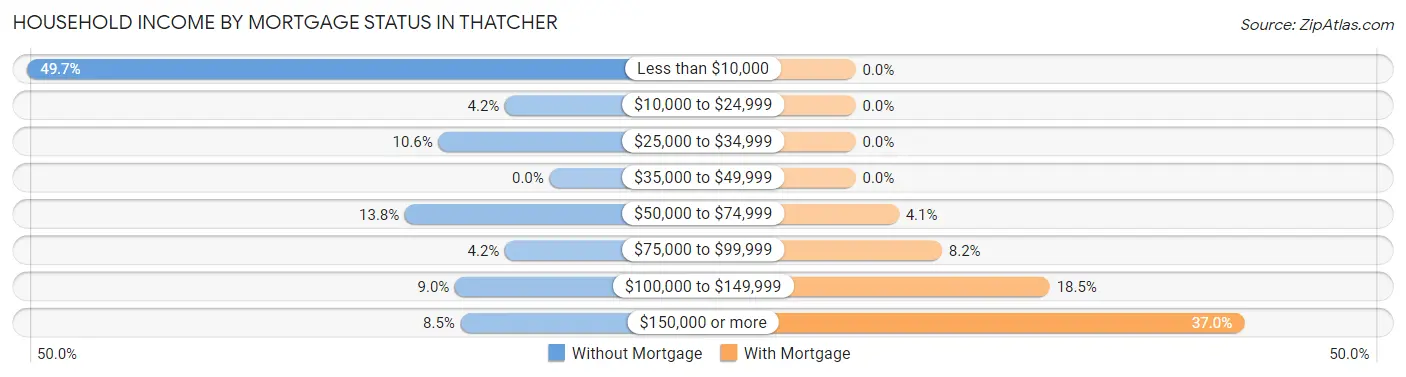
| Household Income | Without Mortgage | With Mortgage |
| Less than $10,000 | 94 (49.7%) | 0 (0.0%) |
| $10,000 to $24,999 | 8 (4.2%) | 0 (0.0%) |
| $25,000 to $34,999 | 20 (10.6%) | 0 (0.0%) |
| $35,000 to $49,999 | 0 (0.0%) | 0 (0.0%) |
| $50,000 to $74,999 | 26 (13.8%) | 6 (4.1%) |
| $75,000 to $99,999 | 8 (4.2%) | 12 (8.2%) |
| $100,000 to $149,999 | 17 (9.0%) | 27 (18.5%) |
| $150,000 or more | 16 (8.5%) | 54 (37.0%) |
| Total | 189 (100.0%) | 146 (100.0%) |
Property Value to Household Income Ratio in Thatcher
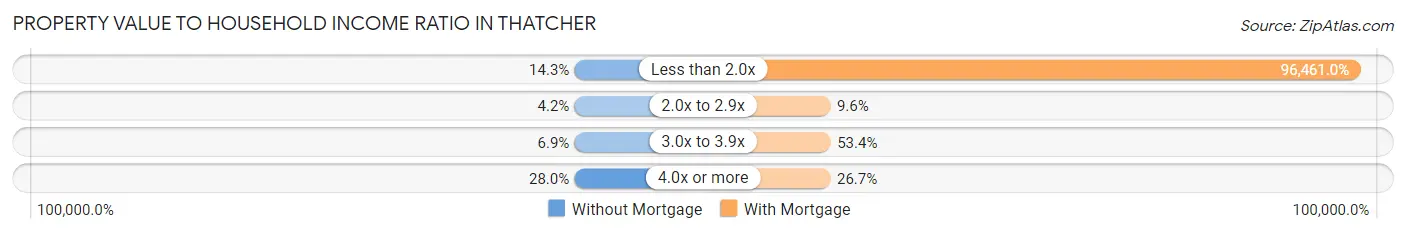
| Value-to-Income Ratio | Without Mortgage | With Mortgage |
| Less than 2.0x | 27 (14.3%) | 140,833 (96,461.0%) |
| 2.0x to 2.9x | 8 (4.2%) | 14 (9.6%) |
| 3.0x to 3.9x | 13 (6.9%) | 78 (53.4%) |
| 4.0x or more | 53 (28.0%) | 39 (26.7%) |
| Total | 189 (100.0%) | 146 (100.0%) |
Real Estate Taxes by Mortgage Status in Thatcher
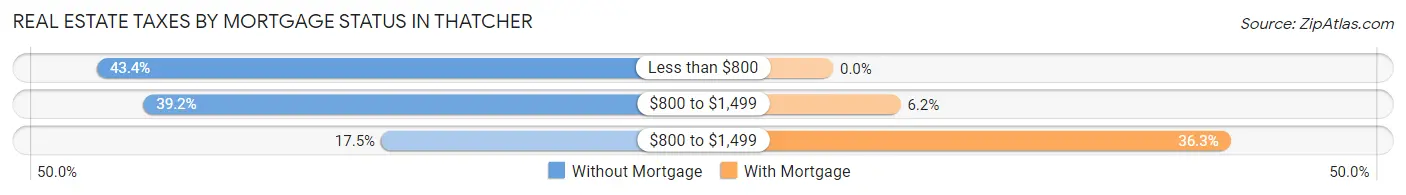
| Property Taxes | Without Mortgage | With Mortgage |
| Less than $800 | 82 (43.4%) | 0 (0.0%) |
| $800 to $1,499 | 74 (39.2%) | 9 (6.2%) |
| $800 to $1,499 | 33 (17.5%) | 53 (36.3%) |
| Total | 189 (100.0%) | 146 (100.0%) |
Health & Disability in Thatcher
Health Insurance Coverage by Age in Thatcher
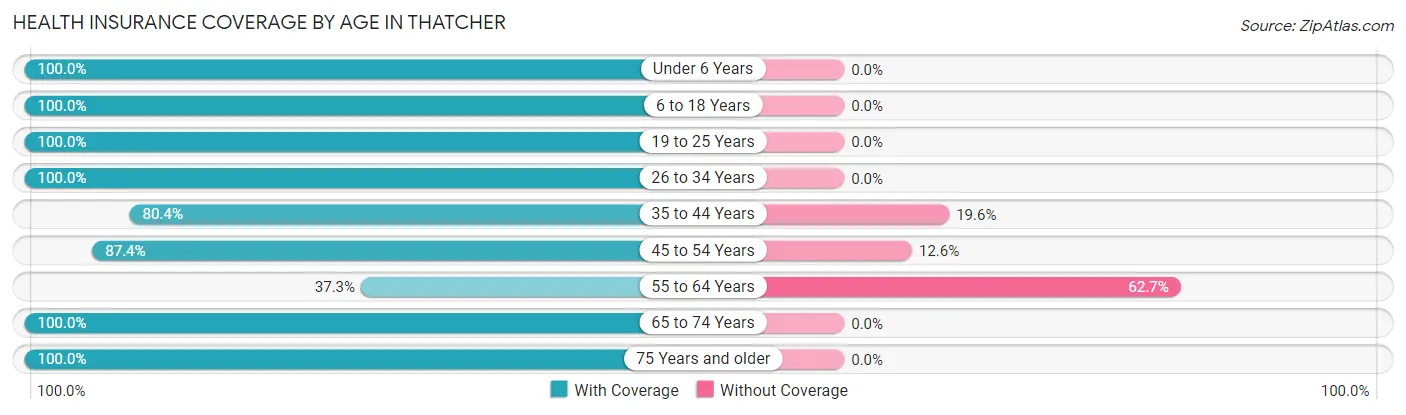
| Age Bracket | With Coverage | Without Coverage |
| Under 6 Years | 59 (100.0%) | 0 (0.0%) |
| 6 to 18 Years | 318 (100.0%) | 0 (0.0%) |
| 19 to 25 Years | 14 (100.0%) | 0 (0.0%) |
| 26 to 34 Years | 66 (100.0%) | 0 (0.0%) |
| 35 to 44 Years | 148 (80.4%) | 36 (19.6%) |
| 45 to 54 Years | 152 (87.4%) | 22 (12.6%) |
| 55 to 64 Years | 44 (37.3%) | 74 (62.7%) |
| 65 to 74 Years | 37 (100.0%) | 0 (0.0%) |
| 75 Years and older | 35 (100.0%) | 0 (0.0%) |
| Total | 873 (86.9%) | 132 (13.1%) |
Health Insurance Coverage by Citizenship Status in Thatcher
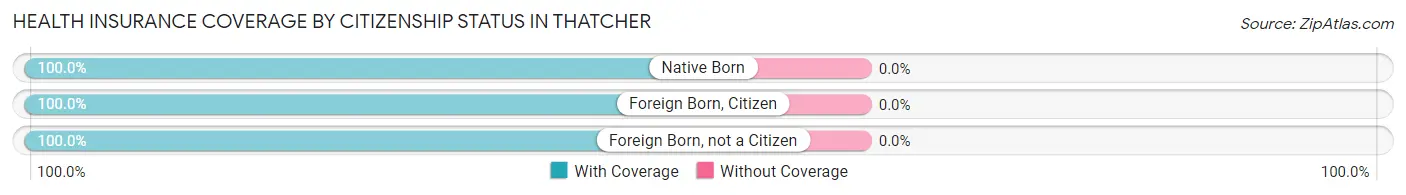
| Citizenship Status | With Coverage | Without Coverage |
| Native Born | 59 (100.0%) | 0 (0.0%) |
| Foreign Born, Citizen | 318 (100.0%) | 0 (0.0%) |
| Foreign Born, not a Citizen | 14 (100.0%) | 0 (0.0%) |
Health Insurance Coverage by Household Income in Thatcher
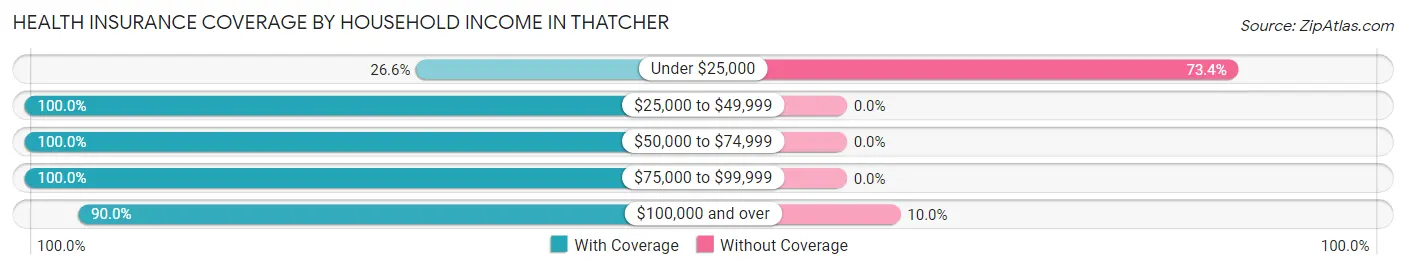
| Household Income | With Coverage | Without Coverage |
| Under $25,000 | 29 (26.6%) | 80 (73.4%) |
| $25,000 to $49,999 | 101 (100.0%) | 0 (0.0%) |
| $50,000 to $74,999 | 102 (100.0%) | 0 (0.0%) |
| $75,000 to $99,999 | 175 (100.0%) | 0 (0.0%) |
| $100,000 and over | 466 (90.0%) | 52 (10.0%) |
Public vs Private Health Insurance Coverage by Age in Thatcher
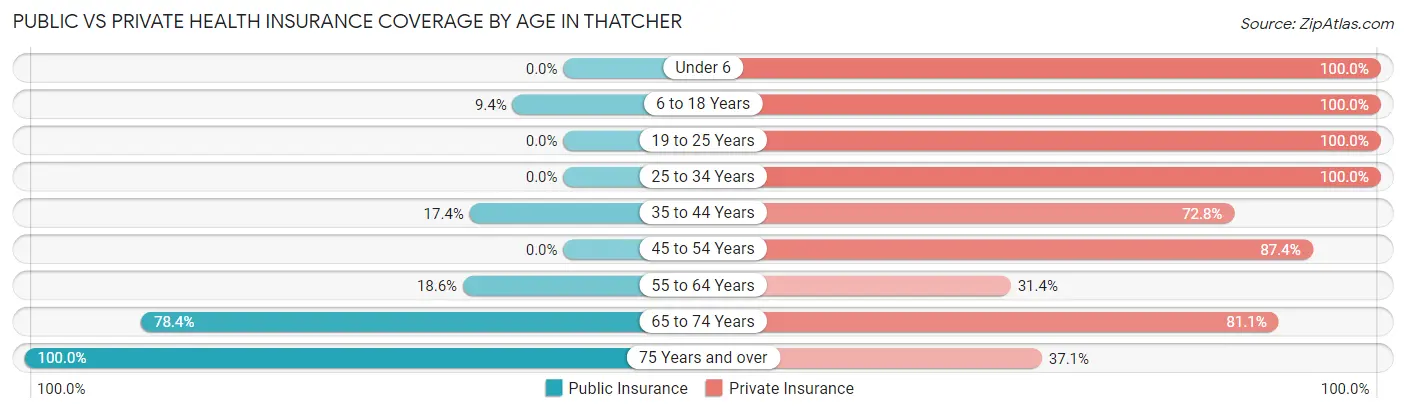
| Age Bracket | Public Insurance | Private Insurance |
| Under 6 | 0 (0.0%) | 59 (100.0%) |
| 6 to 18 Years | 30 (9.4%) | 318 (100.0%) |
| 19 to 25 Years | 0 (0.0%) | 14 (100.0%) |
| 25 to 34 Years | 0 (0.0%) | 66 (100.0%) |
| 35 to 44 Years | 32 (17.4%) | 134 (72.8%) |
| 45 to 54 Years | 0 (0.0%) | 152 (87.4%) |
| 55 to 64 Years | 22 (18.6%) | 37 (31.4%) |
| 65 to 74 Years | 29 (78.4%) | 30 (81.1%) |
| 75 Years and over | 35 (100.0%) | 13 (37.1%) |
| Total | 148 (14.7%) | 823 (81.9%) |
Disability Status by Sex by Age in Thatcher
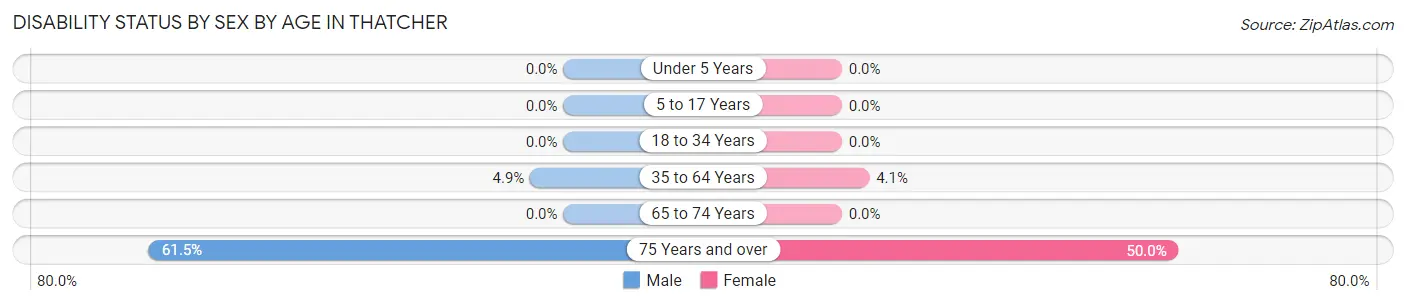
| Age Bracket | Male | Female |
| Under 5 Years | 0 (0.0%) | 0 (0.0%) |
| 5 to 17 Years | 0 (0.0%) | 0 (0.0%) |
| 18 to 34 Years | 0 (0.0%) | 0 (0.0%) |
| 35 to 64 Years | 15 (4.9%) | 7 (4.1%) |
| 65 to 74 Years | 0 (0.0%) | 0 (0.0%) |
| 75 Years and over | 8 (61.5%) | 11 (50.0%) |
Disability Class by Sex by Age in Thatcher
Disability Class: Hearing Difficulty
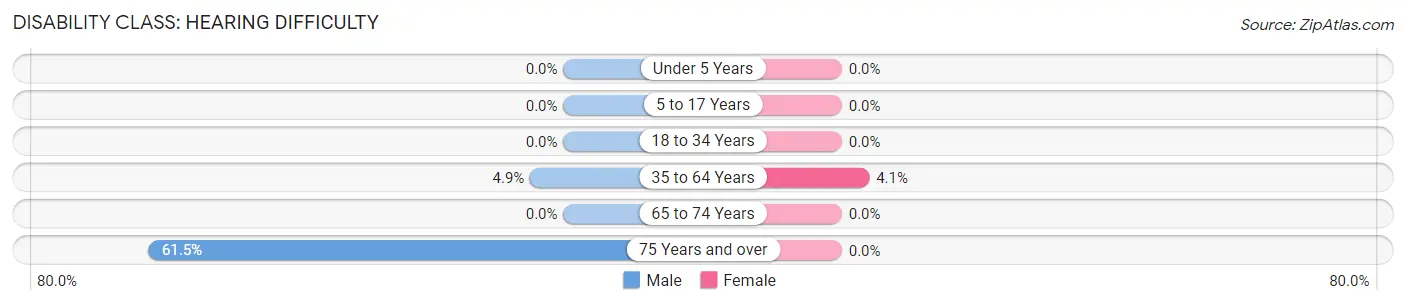
| Age Bracket | Male | Female |
| Under 5 Years | 0 (0.0%) | 0 (0.0%) |
| 5 to 17 Years | 0 (0.0%) | 0 (0.0%) |
| 18 to 34 Years | 0 (0.0%) | 0 (0.0%) |
| 35 to 64 Years | 15 (4.9%) | 7 (4.1%) |
| 65 to 74 Years | 0 (0.0%) | 0 (0.0%) |
| 75 Years and over | 8 (61.5%) | 0 (0.0%) |
Disability Class: Vision Difficulty
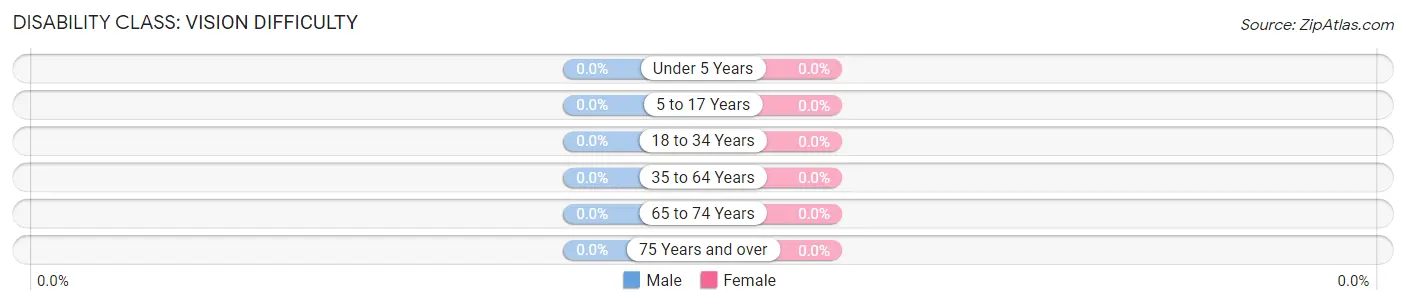
| Age Bracket | Male | Female |
| Under 5 Years | 0 (0.0%) | 0 (0.0%) |
| 5 to 17 Years | 0 (0.0%) | 0 (0.0%) |
| 18 to 34 Years | 0 (0.0%) | 0 (0.0%) |
| 35 to 64 Years | 0 (0.0%) | 0 (0.0%) |
| 65 to 74 Years | 0 (0.0%) | 0 (0.0%) |
| 75 Years and over | 0 (0.0%) | 0 (0.0%) |
Disability Class: Cognitive Difficulty
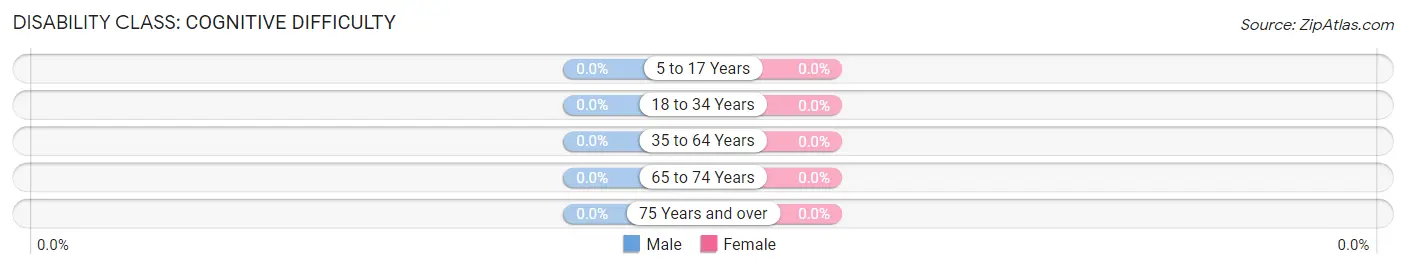
| Age Bracket | Male | Female |
| 5 to 17 Years | 0 (0.0%) | 0 (0.0%) |
| 18 to 34 Years | 0 (0.0%) | 0 (0.0%) |
| 35 to 64 Years | 0 (0.0%) | 0 (0.0%) |
| 65 to 74 Years | 0 (0.0%) | 0 (0.0%) |
| 75 Years and over | 0 (0.0%) | 0 (0.0%) |
Disability Class: Ambulatory Difficulty
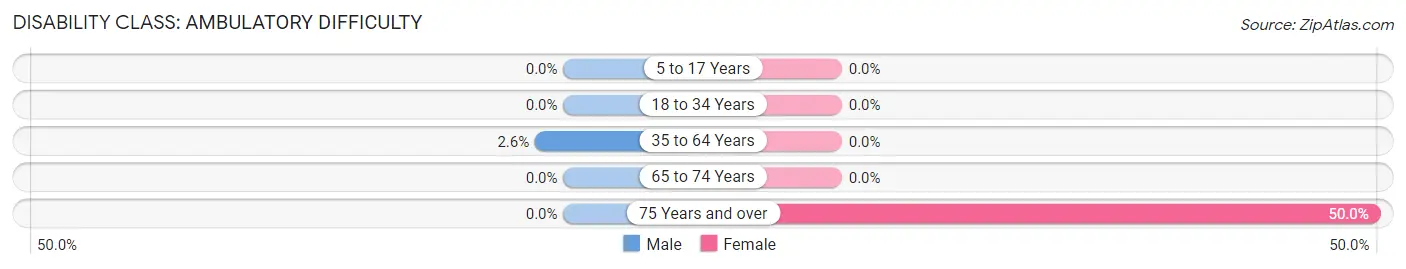
| Age Bracket | Male | Female |
| 5 to 17 Years | 0 (0.0%) | 0 (0.0%) |
| 18 to 34 Years | 0 (0.0%) | 0 (0.0%) |
| 35 to 64 Years | 8 (2.6%) | 0 (0.0%) |
| 65 to 74 Years | 0 (0.0%) | 0 (0.0%) |
| 75 Years and over | 0 (0.0%) | 11 (50.0%) |
Disability Class: Self-Care Difficulty
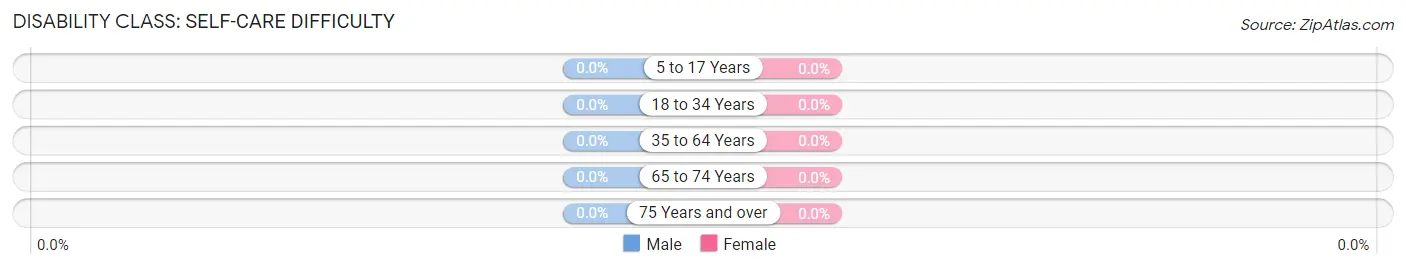
| Age Bracket | Male | Female |
| 5 to 17 Years | 0 (0.0%) | 0 (0.0%) |
| 18 to 34 Years | 0 (0.0%) | 0 (0.0%) |
| 35 to 64 Years | 0 (0.0%) | 0 (0.0%) |
| 65 to 74 Years | 0 (0.0%) | 0 (0.0%) |
| 75 Years and over | 0 (0.0%) | 0 (0.0%) |
Technology Access in Thatcher
Computing Device Access in Thatcher
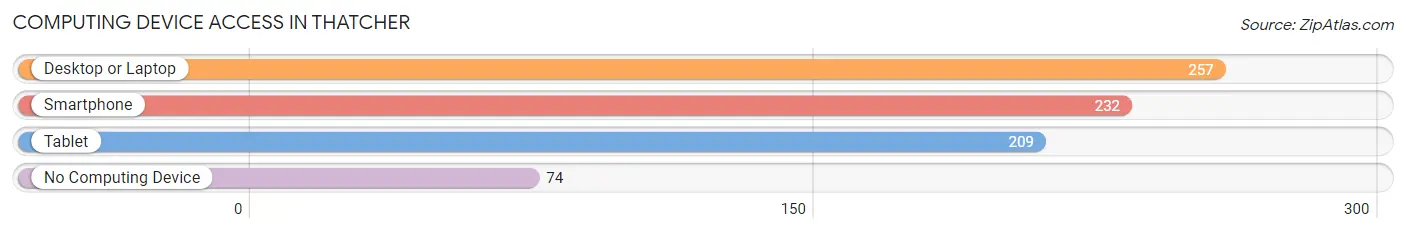
| Device Type | # Households | % Households |
| Desktop or Laptop | 257 | 75.6% |
| Smartphone | 232 | 68.2% |
| Tablet | 209 | 61.5% |
| No Computing Device | 74 | 21.8% |
| Total | 340 | 100.0% |
Internet Access in Thatcher
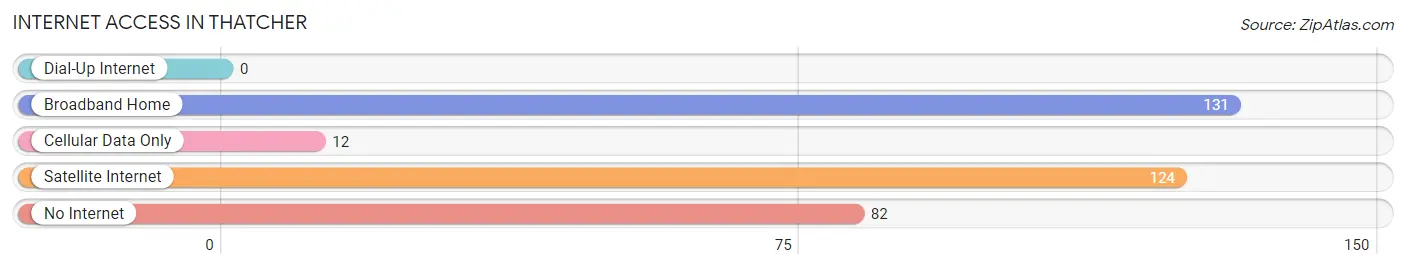
| Internet Type | # Households | % Households |
| Dial-Up Internet | 0 | 0.0% |
| Broadband Home | 131 | 38.5% |
| Cellular Data Only | 12 | 3.5% |
| Satellite Internet | 124 | 36.5% |
| No Internet | 82 | 24.1% |
| Total | 340 | 100.0% |
Thatcher Summary
Thatcher is a small town located in Box Elder County, Utah. It is situated in the northern part of the state, about 20 miles south of the Idaho border. The town was founded in 1891 by a group of Mormon settlers and was named after the first settler, John Thatcher. The population of Thatcher was estimated to be 1,072 in 2000.
Geography
Thatcher is located in the northern part of Box Elder County, Utah. It is situated in the northern part of the state, about 20 miles south of the Idaho border. The town is located in a valley surrounded by mountains and hills. The nearest major city is Ogden, which is about 40 miles away. The climate in Thatcher is semi-arid, with hot summers and cold winters.
Economy
The economy of Thatcher is largely based on agriculture. The town is home to several farms and ranches, which produce a variety of crops and livestock. The town also has a few small businesses, including a grocery store, a hardware store, and a few restaurants.
Demographics
The population of Thatcher was estimated to be 1,072 in 2000. The racial makeup of the town was 97.3% White, 0.3% African American, 0.3% Native American, 0.3% Asian, 0.3% Pacific Islander, 0.3% from other races, and 1.3% from two or more races. Hispanic or Latino of any race were 1.3% of the population.
The median income for a household in Thatcher was $35,625, and the median income for a family was $41,250. Males had a median income of $30,000 versus $20,000 for females. The per capita income for the town was $14,945. About 8.3% of families and 10.3% of the population were below the poverty line, including 11.3% of those under age 18 and 8.3% of those age 65 or over.
History
Thatcher was founded in 1891 by a group of Mormon settlers and was named after the first settler, John Thatcher. The town was originally a farming community, but it soon became a center for the mining industry. The town was home to several mines, including the Thatcher Mine, which was the largest in the area. The town also had a few small businesses, including a grocery store, a hardware store, and a few restaurants.
In the early 1900s, the town experienced a period of growth and prosperity. The population increased and the town was home to several churches, schools, and businesses. However, the Great Depression of the 1930s caused the town to suffer economically. The mines closed and many of the businesses went out of business.
In the 1950s, the town began to experience a period of growth and prosperity once again. The population increased and the town was home to several churches, schools, and businesses. The town also experienced a period of growth in the 1970s and 1980s, when several new businesses opened in the area.
Today, Thatcher is a small town with a population of about 1,072. The town is still largely agricultural, but it also has a few small businesses, including a grocery store, a hardware store, and a few restaurants. The town is also home to several churches, schools, and other organizations.
Common Questions
What is Per Capita Income in Thatcher?
Per Capita income in Thatcher is $39,190.
What is the Median Family Income in Thatcher?
Median Family Income in Thatcher is $131,181.
What is the Median Household income in Thatcher?
Median Household Income in Thatcher is $74,500.
What is Income or Wage Gap in Thatcher?
Income or Wage Gap in Thatcher is 60.0%.
Women in Thatcher earn 40.0 cents for every dollar earned by a man.
What is Inequality or Gini Index in Thatcher?
Inequality or Gini Index in Thatcher is 0.60.
What is the Total Population of Thatcher?
Total Population of Thatcher is 1,056.
What is the Total Male Population of Thatcher?
Total Male Population of Thatcher is 567.
What is the Total Female Population of Thatcher?
Total Female Population of Thatcher is 489.
What is the Ratio of Males per 100 Females in Thatcher?
There are 115.95 Males per 100 Females in Thatcher.
What is the Ratio of Females per 100 Males in Thatcher?
There are 86.24 Females per 100 Males in Thatcher.
What is the Median Population Age in Thatcher?
Median Population Age in Thatcher is 37.0 Years.
What is the Average Family Size in Thatcher
Average Family Size in Thatcher is 4.2 People.
What is the Average Household Size in Thatcher
Average Household Size in Thatcher is 3.1 People.
How Large is the Labor Force in Thatcher?
There are 476 People in the Labor Forcein in Thatcher.
What is the Percentage of People in the Labor Force in Thatcher?
66.3% of People are in the Labor Force in Thatcher.