West Mansfield, OH Map & Demographics
West Mansfield Map
West Mansfield Overview
$36,332
PER CAPITA INCOME
$88,636
AVG FAMILY INCOME
$83,173
AVG HOUSEHOLD INCOME
22.5%
WAGE / INCOME GAP [ % ]
77.5¢/ $1
WAGE / INCOME GAP [ $ ]
0.36
INEQUALITY / GINI INDEX
882
TOTAL POPULATION
447
MALE POPULATION
435
FEMALE POPULATION
102.76
MALES / 100 FEMALES
97.32
FEMALES / 100 MALES
36.1
MEDIAN AGE
2.8
AVG FAMILY SIZE
2.5
AVG HOUSEHOLD SIZE
477
LABOR FORCE [ PEOPLE ]
70.3%
PERCENT IN LABOR FORCE
6.7%
UNEMPLOYMENT RATE
West Mansfield Zip Codes
West Mansfield Area Codes
Income in West Mansfield
Income Overview in West Mansfield
Per Capita Income in West Mansfield is $36,332, while median incomes of families and households are $88,636 and $83,173 respectively.
| Characteristic | Number | Measure |
| Per Capita Income | 882 | $36,332 |
| Median Family Income | 280 | $88,636 |
| Mean Family Income | 280 | $103,723 |
| Median Household Income | 355 | $83,173 |
| Mean Household Income | 355 | $94,106 |
| Income Deficit | 280 | $0 |
| Wage / Income Gap (%) | 882 | 22.45% |
| Wage / Income Gap ($) | 882 | 77.55¢ per $1 |
| Gini / Inequality Index | 882 | 0.36 |
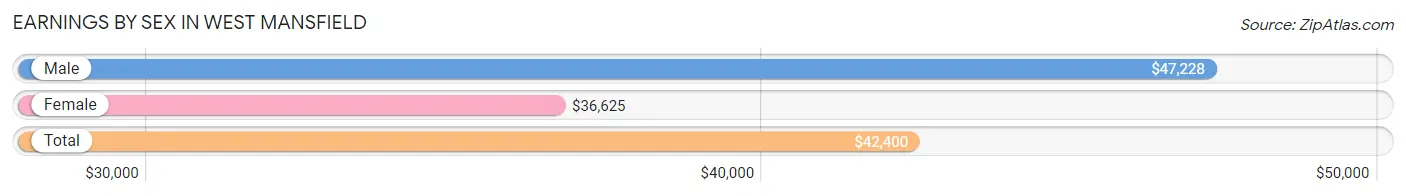
Earnings by Sex in West Mansfield
Average Earnings in West Mansfield are $42,400, $47,228 for men and $36,625 for women, a difference of 22.5%.
| Sex | Number | Average Earnings |
| Male | 289 (59.0%) | $47,228 |
| Female | 201 (41.0%) | $36,625 |
| Total | 490 (100.0%) | $42,400 |
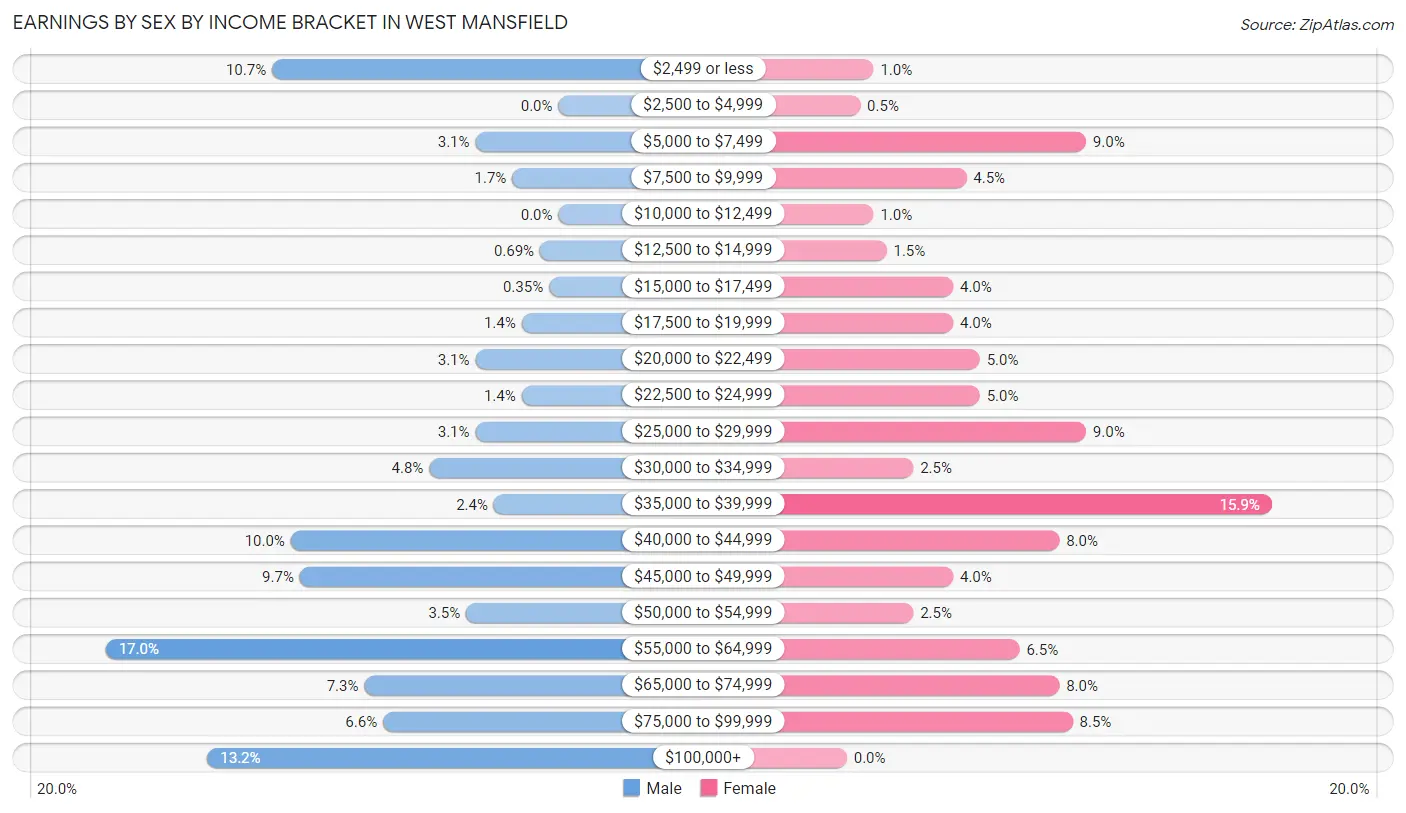
Earnings by Sex by Income Bracket in West Mansfield
The most common earnings brackets in West Mansfield are $55,000 to $64,999 for men (49 | 17.0%) and $35,000 to $39,999 for women (32 | 15.9%).
| Income | Male | Female |
| $2,499 or less | 31 (10.7%) | 2 (1.0%) |
| $2,500 to $4,999 | 0 (0.0%) | 1 (0.5%) |
| $5,000 to $7,499 | 9 (3.1%) | 18 (9.0%) |
| $7,500 to $9,999 | 5 (1.7%) | 9 (4.5%) |
| $10,000 to $12,499 | 0 (0.0%) | 2 (1.0%) |
| $12,500 to $14,999 | 2 (0.7%) | 3 (1.5%) |
| $15,000 to $17,499 | 1 (0.4%) | 8 (4.0%) |
| $17,500 to $19,999 | 4 (1.4%) | 8 (4.0%) |
| $20,000 to $22,499 | 9 (3.1%) | 10 (5.0%) |
| $22,500 to $24,999 | 4 (1.4%) | 10 (5.0%) |
| $25,000 to $29,999 | 9 (3.1%) | 18 (9.0%) |
| $30,000 to $34,999 | 14 (4.8%) | 5 (2.5%) |
| $35,000 to $39,999 | 7 (2.4%) | 32 (15.9%) |
| $40,000 to $44,999 | 29 (10.0%) | 16 (8.0%) |
| $45,000 to $49,999 | 28 (9.7%) | 8 (4.0%) |
| $50,000 to $54,999 | 10 (3.5%) | 5 (2.5%) |
| $55,000 to $64,999 | 49 (17.0%) | 13 (6.5%) |
| $65,000 to $74,999 | 21 (7.3%) | 16 (8.0%) |
| $75,000 to $99,999 | 19 (6.6%) | 17 (8.5%) |
| $100,000+ | 38 (13.2%) | 0 (0.0%) |
| Total | 289 (100.0%) | 201 (100.0%) |
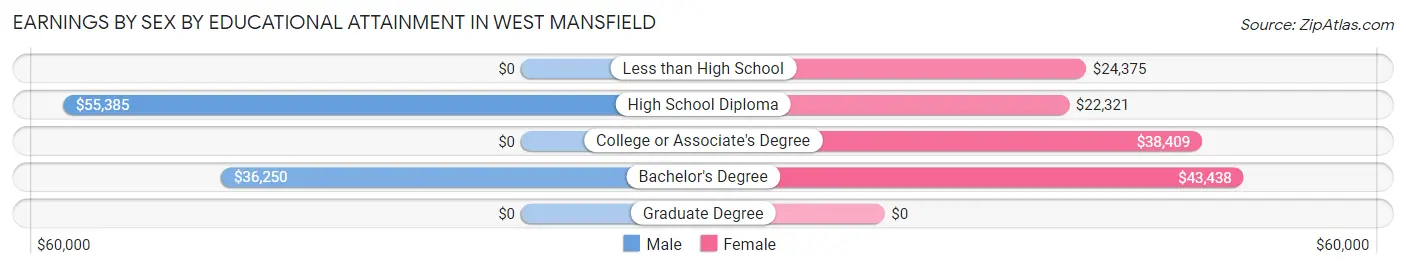
Earnings by Sex by Educational Attainment in West Mansfield
Average earnings in West Mansfield are $56,875 for men and $36,625 for women, a difference of 35.6%. Men with an educational attainment of high school diploma enjoy the highest average annual earnings of $55,385, while those with bachelor's degree education earn the least with $36,250. Women with an educational attainment of bachelor's degree earn the most with the average annual earnings of $43,438, while those with high school diploma education have the smallest earnings of $22,321.
| Educational Attainment | Male Income | Female Income |
| Less than High School | - | - |
| High School Diploma | $55,385 | $22,321 |
| College or Associate's Degree | - | - |
| Bachelor's Degree | $36,250 | $43,438 |
| Graduate Degree | - | - |
| Total | $56,875 | $36,625 |
Family Income in West Mansfield
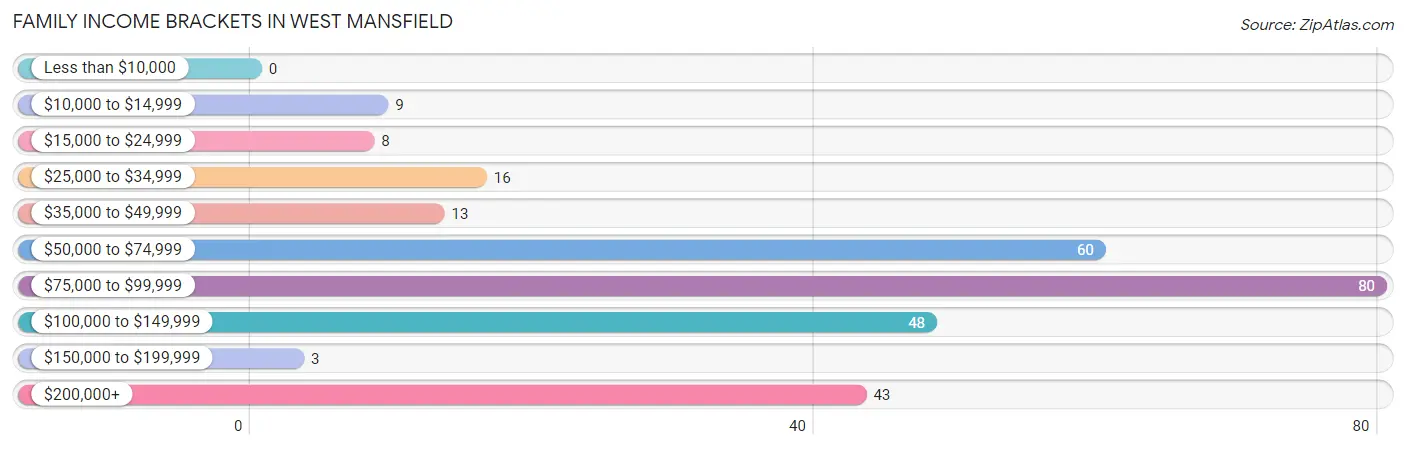
Family Income Brackets in West Mansfield
According to the West Mansfield family income data, there are 80 families falling into the $75,000 to $99,999 income range, which is the most common income bracket and makes up 28.6% of all families.
| Income Bracket | # Families | % Families |
| Less than $10,000 | 0 | 0.0% |
| $10,000 to $14,999 | 9 | 3.2% |
| $15,000 to $24,999 | 8 | 2.9% |
| $25,000 to $34,999 | 16 | 5.7% |
| $35,000 to $49,999 | 13 | 4.6% |
| $50,000 to $74,999 | 60 | 21.4% |
| $75,000 to $99,999 | 80 | 28.6% |
| $100,000 to $149,999 | 48 | 17.1% |
| $150,000 to $199,999 | 3 | 1.1% |
| $200,000+ | 43 | 15.4% |
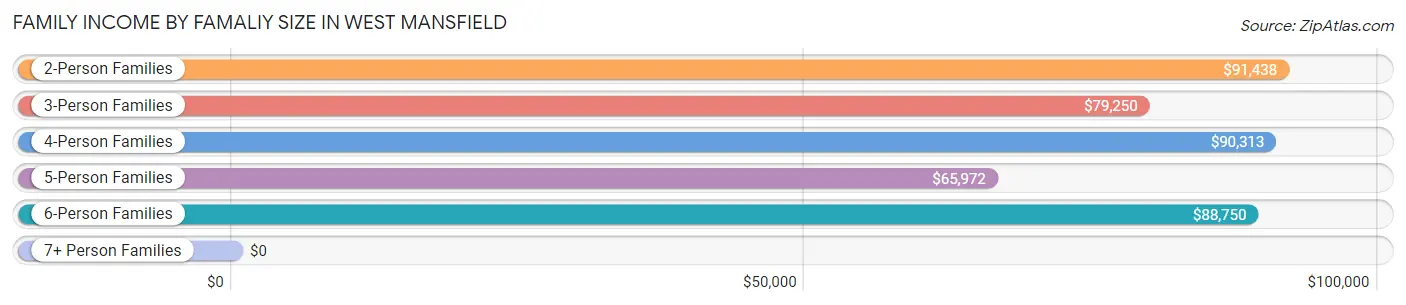
Family Income by Famaliy Size in West Mansfield
2-person families (147 | 52.5%) account for the highest median family income in West Mansfield with $91,438 per family, while 2-person families (147 | 52.5%) have the highest median income of $45,719 per family member.
| Income Bracket | # Families | Median Income |
| 2-Person Families | 147 (52.5%) | $91,438 |
| 3-Person Families | 46 (16.4%) | $79,250 |
| 4-Person Families | 35 (12.5%) | $90,313 |
| 5-Person Families | 17 (6.1%) | $65,972 |
| 6-Person Families | 35 (12.5%) | $88,750 |
| 7+ Person Families | 0 (0.0%) | $0 |
| Total | 280 (100.0%) | $88,636 |
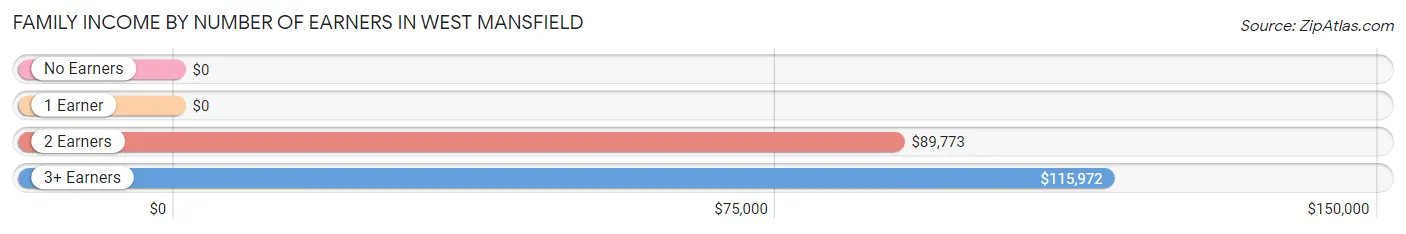
Family Income by Number of Earners in West Mansfield
| Number of Earners | # Families | Median Income |
| No Earners | 25 (8.9%) | $0 |
| 1 Earner | 116 (41.4%) | $0 |
| 2 Earners | 102 (36.4%) | $89,773 |
| 3+ Earners | 37 (13.2%) | $115,972 |
| Total | 280 (100.0%) | $88,636 |
Household Income in West Mansfield
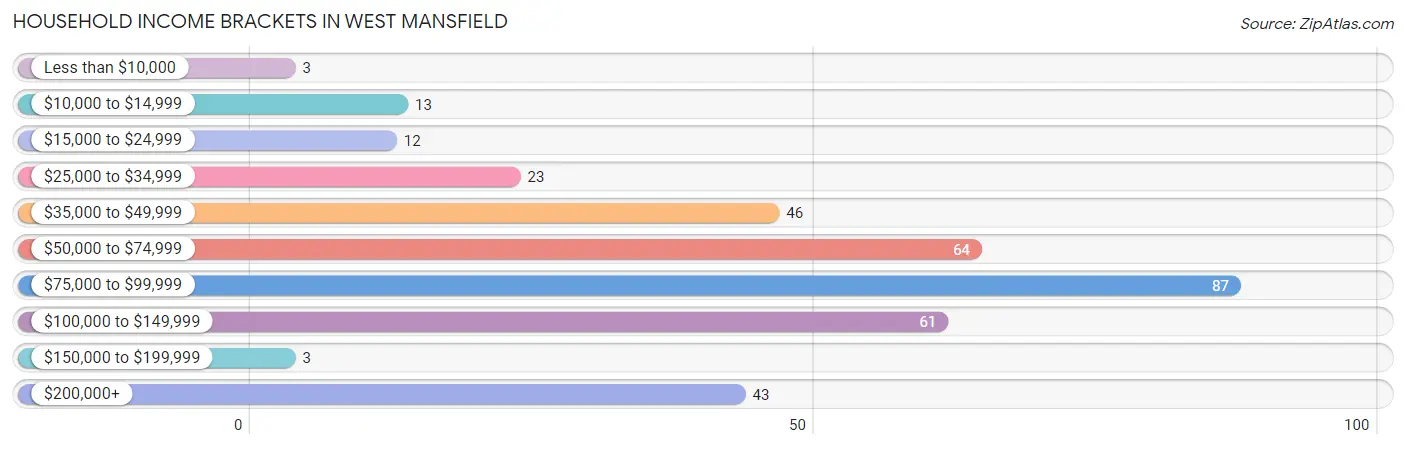
Household Income Brackets in West Mansfield
With 87 households falling in the category, the $75,000 to $99,999 income range is the most frequent in West Mansfield, accounting for 24.5% of all households. In contrast, only 3 households (0.9%) fall into the less than $10,000 income bracket, making it the least populous group.
| Income Bracket | # Households | % Households |
| Less than $10,000 | 3 | 0.8% |
| $10,000 to $14,999 | 13 | 3.7% |
| $15,000 to $24,999 | 12 | 3.4% |
| $25,000 to $34,999 | 23 | 6.5% |
| $35,000 to $49,999 | 46 | 13.0% |
| $50,000 to $74,999 | 64 | 18.0% |
| $75,000 to $99,999 | 87 | 24.5% |
| $100,000 to $149,999 | 61 | 17.2% |
| $150,000 to $199,999 | 3 | 0.8% |
| $200,000+ | 43 | 12.1% |
Household Income by Householder Age in West Mansfield
The median household income in West Mansfield is $83,173, with the highest median household income of $113,269 found in the 45 to 64 years age bracket for the primary householder. A total of 122 households (34.4%) fall into this category. Meanwhile, the 15 to 24 years age bracket for the primary householder has the lowest median household income of $0, with 19 households (5.3%) in this group.
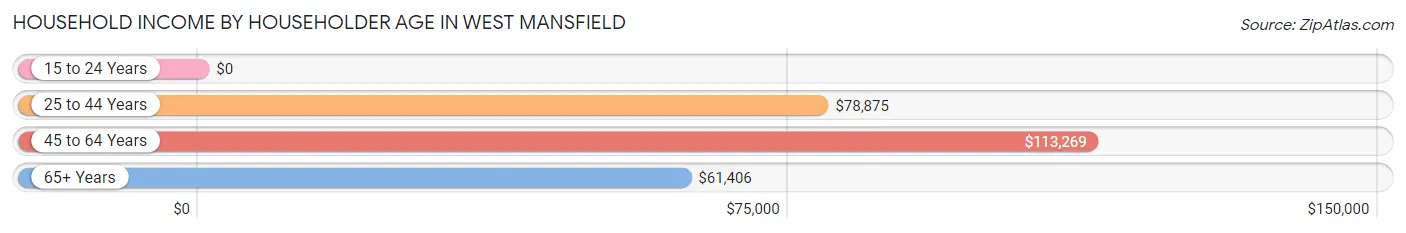
| Income Bracket | # Households | Median Income |
| 15 to 24 Years | 19 (5.3%) | $0 |
| 25 to 44 Years | 127 (35.8%) | $78,875 |
| 45 to 64 Years | 122 (34.4%) | $113,269 |
| 65+ Years | 87 (24.5%) | $61,406 |
| Total | 355 (100.0%) | $83,173 |
Poverty in West Mansfield
Income Below Poverty by Sex and Age in West Mansfield
With 6.9% poverty level for males and 7.4% for females among the residents of West Mansfield, 65 to 74 year old males and 65 to 74 year old females are the most vulnerable to poverty, with 9 males (33.3%) and 14 females (41.2%) in their respective age groups living below the poverty level.
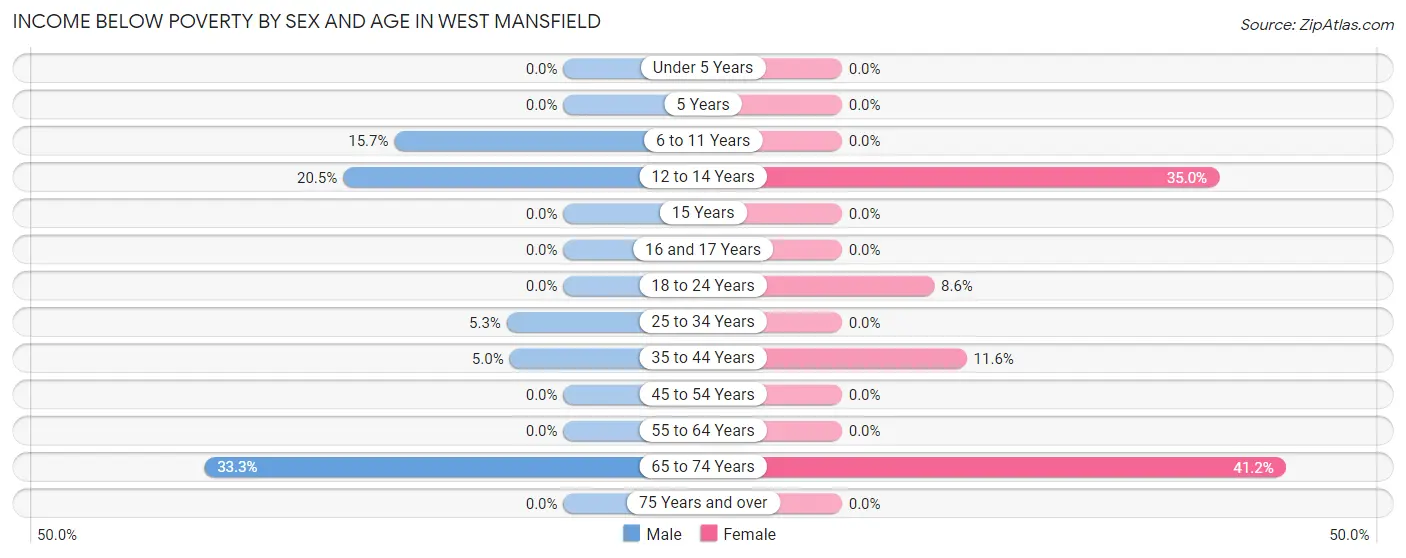
| Age Bracket | Male | Female |
| Under 5 Years | 0 (0.0%) | 0 (0.0%) |
| 5 Years | 0 (0.0%) | 0 (0.0%) |
| 6 to 11 Years | 8 (15.7%) | 0 (0.0%) |
| 12 to 14 Years | 9 (20.4%) | 7 (35.0%) |
| 15 Years | 0 (0.0%) | 0 (0.0%) |
| 16 and 17 Years | 0 (0.0%) | 0 (0.0%) |
| 18 to 24 Years | 0 (0.0%) | 3 (8.6%) |
| 25 to 34 Years | 3 (5.3%) | 0 (0.0%) |
| 35 to 44 Years | 2 (5.0%) | 8 (11.6%) |
| 45 to 54 Years | 0 (0.0%) | 0 (0.0%) |
| 55 to 64 Years | 0 (0.0%) | 0 (0.0%) |
| 65 to 74 Years | 9 (33.3%) | 14 (41.2%) |
| 75 Years and over | 0 (0.0%) | 0 (0.0%) |
| Total | 31 (6.9%) | 32 (7.4%) |
Income Above Poverty by Sex and Age in West Mansfield
According to the poverty statistics in West Mansfield, males aged under 5 years and females aged under 5 years are the age groups that are most secure financially, with 100.0% of males and 100.0% of females in these age groups living above the poverty line.
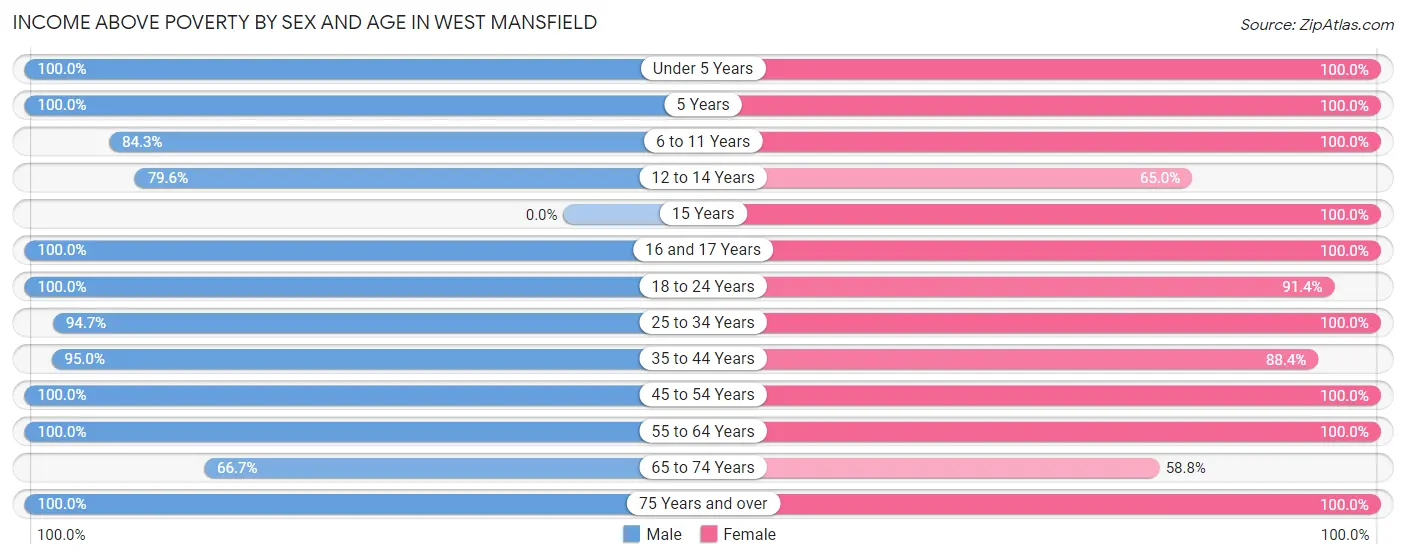
| Age Bracket | Male | Female |
| Under 5 Years | 30 (100.0%) | 10 (100.0%) |
| 5 Years | 2 (100.0%) | 3 (100.0%) |
| 6 to 11 Years | 43 (84.3%) | 30 (100.0%) |
| 12 to 14 Years | 35 (79.5%) | 13 (65.0%) |
| 15 Years | 0 (0.0%) | 10 (100.0%) |
| 16 and 17 Years | 29 (100.0%) | 5 (100.0%) |
| 18 to 24 Years | 34 (100.0%) | 32 (91.4%) |
| 25 to 34 Years | 54 (94.7%) | 62 (100.0%) |
| 35 to 44 Years | 38 (95.0%) | 61 (88.4%) |
| 45 to 54 Years | 49 (100.0%) | 37 (100.0%) |
| 55 to 64 Years | 75 (100.0%) | 63 (100.0%) |
| 65 to 74 Years | 18 (66.7%) | 20 (58.8%) |
| 75 Years and over | 9 (100.0%) | 54 (100.0%) |
| Total | 416 (93.1%) | 400 (92.6%) |
Income Below Poverty Among Married-Couple Families in West Mansfield
The poverty statistics for married-couple families in West Mansfield show that 4.0% or 9 of the total 223 families live below the poverty line. Families with no children have the highest poverty rate of 7.0%, comprising of 9 families. On the other hand, families with 1 or 2 children have the lowest poverty rate of 0.0%, which includes 0 families.
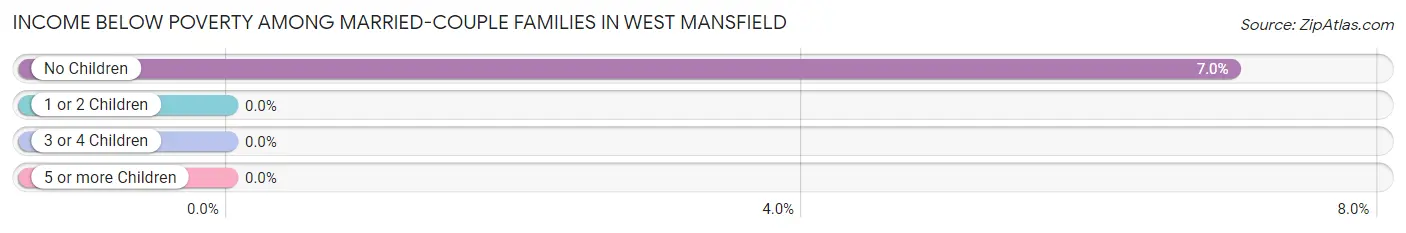
| Children | Above Poverty | Below Poverty |
| No Children | 120 (93.0%) | 9 (7.0%) |
| 1 or 2 Children | 50 (100.0%) | 0 (0.0%) |
| 3 or 4 Children | 44 (100.0%) | 0 (0.0%) |
| 5 or more Children | 0 (0.0%) | 0 (0.0%) |
| Total | 214 (96.0%) | 9 (4.0%) |
Income Below Poverty Among Single-Parent Households in West Mansfield
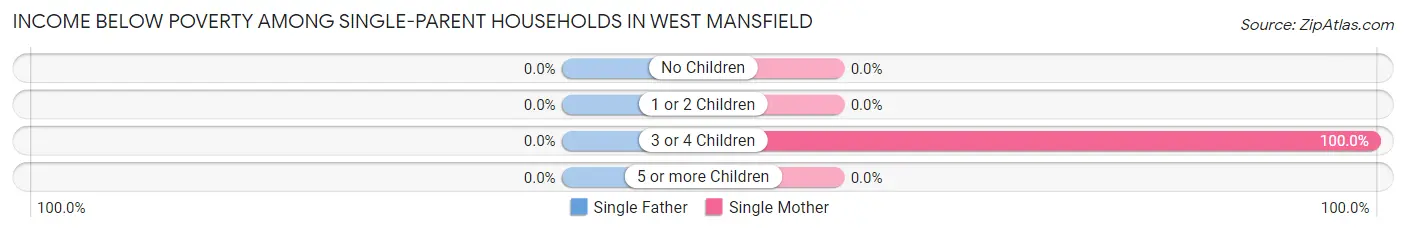
| Children | Single Father | Single Mother |
| No Children | 0 (0.0%) | 0 (0.0%) |
| 1 or 2 Children | 0 (0.0%) | 0 (0.0%) |
| 3 or 4 Children | 0 (0.0%) | 8 (100.0%) |
| 5 or more Children | 0 (0.0%) | 0 (0.0%) |
| Total | 0 (0.0%) | 8 (16.3%) |
Income Below Poverty Among Married-Couple vs Single-Parent Households in West Mansfield
The poverty data for West Mansfield shows that 9 of the married-couple family households (4.0%) and 8 of the single-parent households (14.0%) are living below the poverty level. Within the married-couple family households, those with no children have the highest poverty rate, with 9 households (7.0%) falling below the poverty line. Among the single-parent households, those with 3 or 4 children have the highest poverty rate, with 8 household (100.0%) living below poverty.
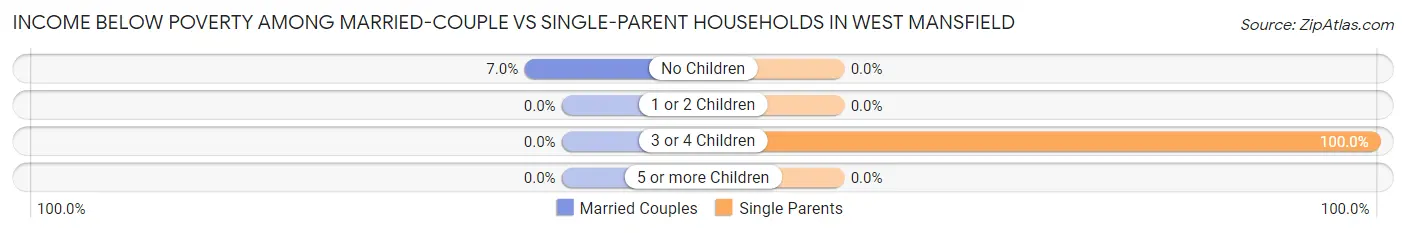
| Children | Married-Couple Families | Single-Parent Households |
| No Children | 9 (7.0%) | 0 (0.0%) |
| 1 or 2 Children | 0 (0.0%) | 0 (0.0%) |
| 3 or 4 Children | 0 (0.0%) | 8 (100.0%) |
| 5 or more Children | 0 (0.0%) | 0 (0.0%) |
| Total | 9 (4.0%) | 8 (14.0%) |
Race in West Mansfield
The most populous races in West Mansfield are White / Caucasian (748 | 84.8%), Two or more Races (109 | 12.4%), and Asian (19 | 2.1%).
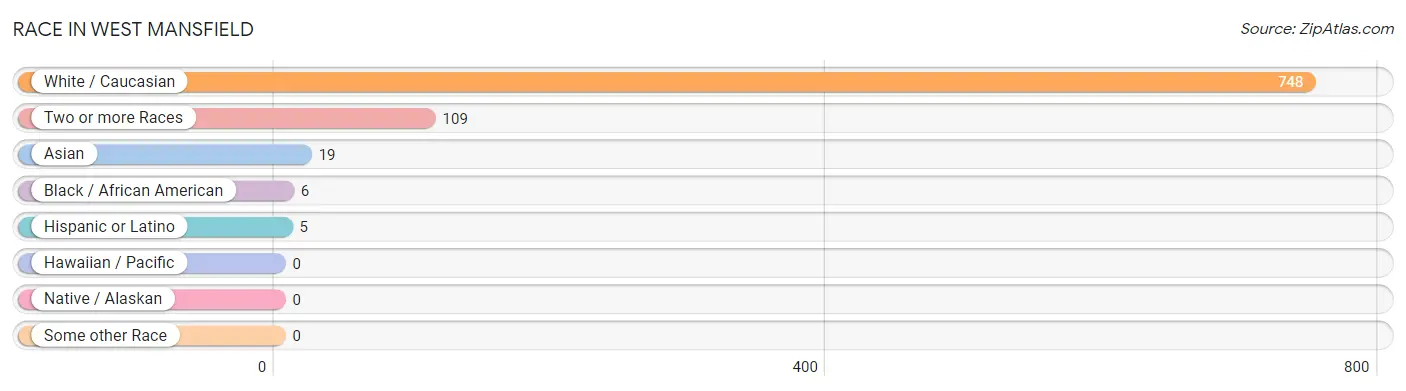
| Race | # Population | % Population |
| Asian | 19 | 2.1% |
| Black / African American | 6 | 0.7% |
| Hawaiian / Pacific | 0 | 0.0% |
| Hispanic or Latino | 5 | 0.6% |
| Native / Alaskan | 0 | 0.0% |
| White / Caucasian | 748 | 84.8% |
| Two or more Races | 109 | 12.4% |
| Some other Race | 0 | 0.0% |
| Total | 882 | 100.0% |
Ancestry in West Mansfield
The most populous ancestries reported in West Mansfield are German (155 | 17.6%), Irish (146 | 16.6%), English (131 | 14.8%), American (101 | 11.5%), and Italian (58 | 6.6%), together accounting for 67.0% of all West Mansfield residents.
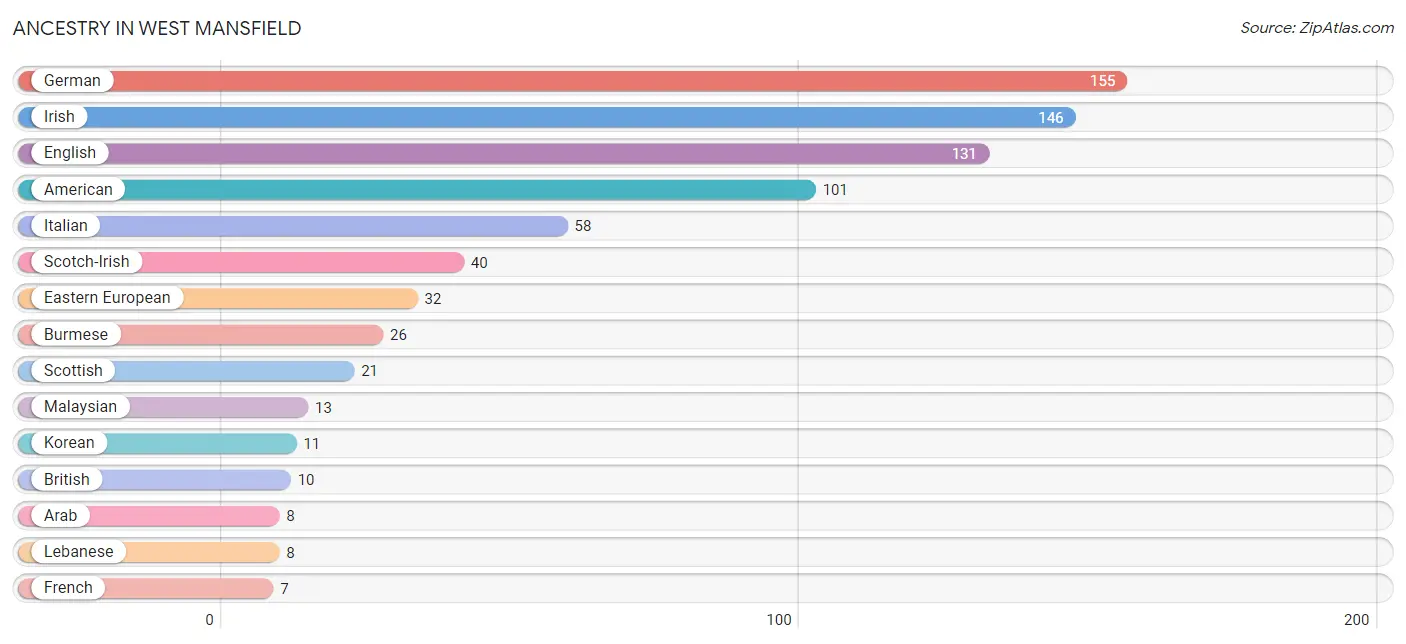
| Ancestry | # Population | % Population |
| American | 101 | 11.5% |
| Arab | 8 | 0.9% |
| Bhutanese | 5 | 0.6% |
| British | 10 | 1.1% |
| Burmese | 26 | 2.9% |
| Celtic | 6 | 0.7% |
| Dutch | 2 | 0.2% |
| Eastern European | 32 | 3.6% |
| English | 131 | 14.8% |
| European | 6 | 0.7% |
| French | 7 | 0.8% |
| German | 155 | 17.6% |
| Irish | 146 | 16.6% |
| Italian | 58 | 6.6% |
| Korean | 11 | 1.3% |
| Lebanese | 8 | 0.9% |
| Malaysian | 13 | 1.5% |
| Mexican | 5 | 0.6% |
| Northern European | 3 | 0.3% |
| Norwegian | 2 | 0.2% |
| Scandinavian | 4 | 0.4% |
| Scotch-Irish | 40 | 4.5% |
| Scottish | 21 | 2.4% |
| Welsh | 5 | 0.6% | View All 24 Rows |
Immigrants in West Mansfield
The most numerous immigrant groups reported in West Mansfield came from Asia (16 | 1.8%), Philippines (11 | 1.3%), South Eastern Asia (11 | 1.3%), Eastern Asia (5 | 0.6%), and Japan (5 | 0.6%), together accounting for 5.4% of all West Mansfield residents.
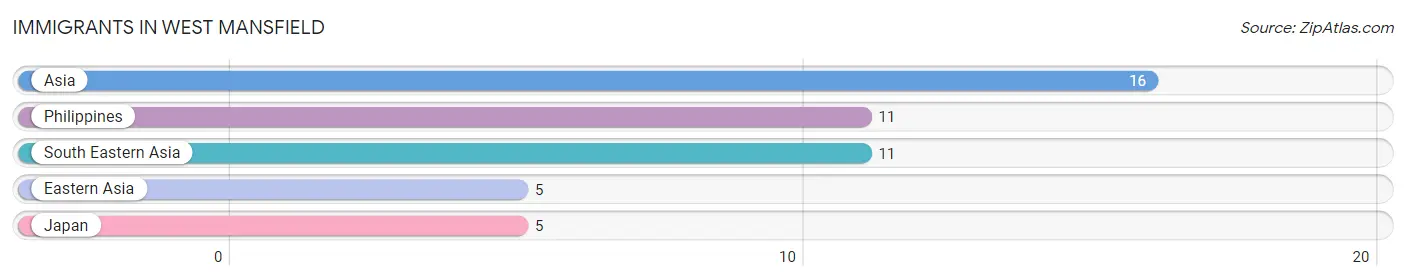
| Immigration Origin | # Population | % Population |
| Asia | 16 | 1.8% |
| Eastern Asia | 5 | 0.6% |
| Japan | 5 | 0.6% |
| Philippines | 11 | 1.3% |
| South Eastern Asia | 11 | 1.3% | View All 5 Rows |
Sex and Age in West Mansfield
Sex and Age in West Mansfield
The most populous age groups in West Mansfield are 10 to 14 Years (68 | 15.2%) for men and 35 to 39 Years (38 | 8.7%) for women.
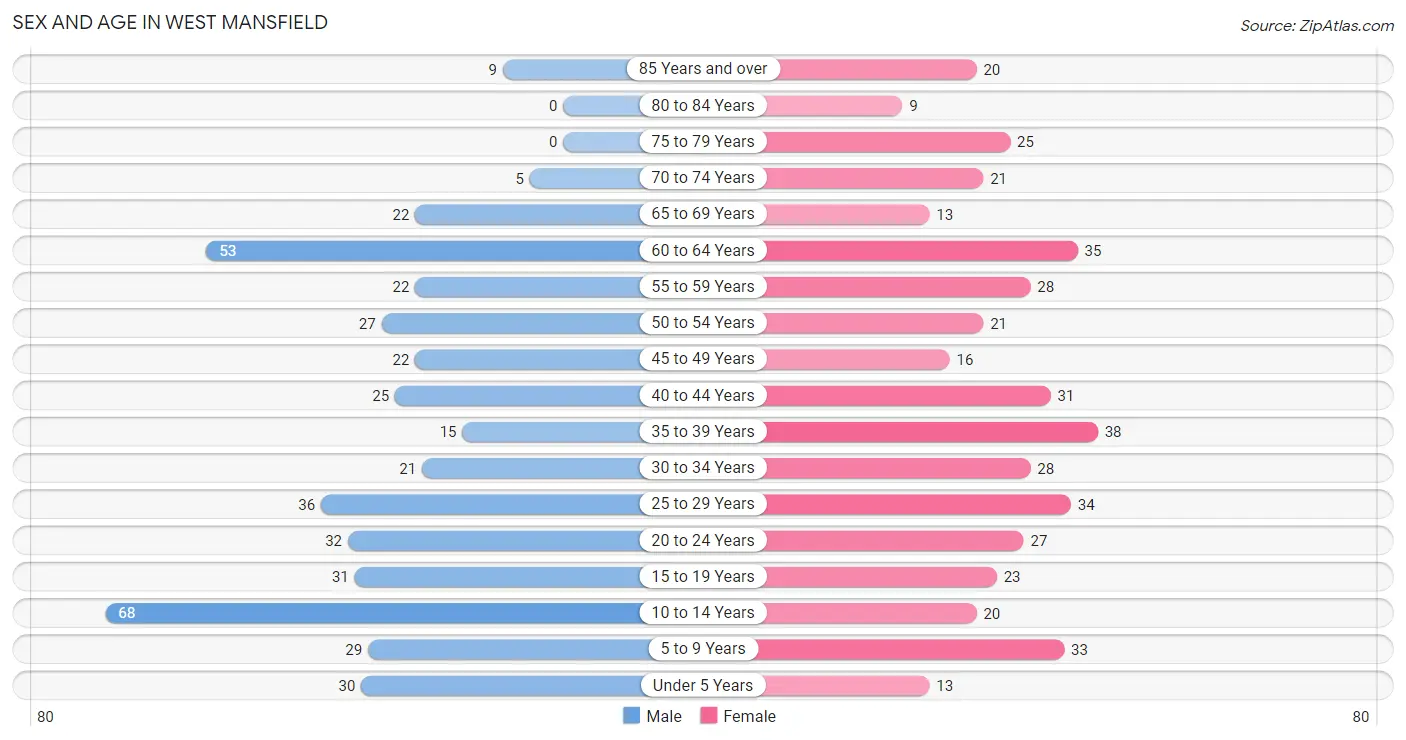
| Age Bracket | Male | Female |
| Under 5 Years | 30 (6.7%) | 13 (3.0%) |
| 5 to 9 Years | 29 (6.5%) | 33 (7.6%) |
| 10 to 14 Years | 68 (15.2%) | 20 (4.6%) |
| 15 to 19 Years | 31 (6.9%) | 23 (5.3%) |
| 20 to 24 Years | 32 (7.2%) | 27 (6.2%) |
| 25 to 29 Years | 36 (8.1%) | 34 (7.8%) |
| 30 to 34 Years | 21 (4.7%) | 28 (6.4%) |
| 35 to 39 Years | 15 (3.4%) | 38 (8.7%) |
| 40 to 44 Years | 25 (5.6%) | 31 (7.1%) |
| 45 to 49 Years | 22 (4.9%) | 16 (3.7%) |
| 50 to 54 Years | 27 (6.0%) | 21 (4.8%) |
| 55 to 59 Years | 22 (4.9%) | 28 (6.4%) |
| 60 to 64 Years | 53 (11.9%) | 35 (8.1%) |
| 65 to 69 Years | 22 (4.9%) | 13 (3.0%) |
| 70 to 74 Years | 5 (1.1%) | 21 (4.8%) |
| 75 to 79 Years | 0 (0.0%) | 25 (5.8%) |
| 80 to 84 Years | 0 (0.0%) | 9 (2.1%) |
| 85 Years and over | 9 (2.0%) | 20 (4.6%) |
| Total | 447 (100.0%) | 435 (100.0%) |
Families and Households in West Mansfield
Median Family Size in West Mansfield
The median family size in West Mansfield is 2.79 persons per family, with married-couple families (223 | 79.6%) accounting for the largest median family size of 2.86 persons per family. On the other hand, single male/father families (8 | 2.9%) represent the smallest median family size with 2.38 persons per family.
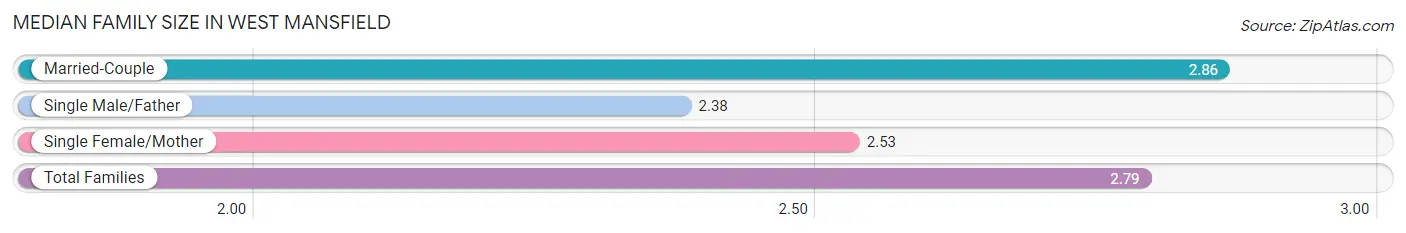
| Family Type | # Families | Family Size |
| Married-Couple | 223 (79.6%) | 2.86 |
| Single Male/Father | 8 (2.9%) | 2.38 |
| Single Female/Mother | 49 (17.5%) | 2.53 |
| Total Families | 280 (100.0%) | 2.79 |
Median Household Size in West Mansfield
The median household size in West Mansfield is 2.48 persons per household, with single male/father households (8 | 2.2%) accounting for the largest median household size of 2.88 persons per household. non-family households (75 | 21.1%) represent the smallest median household size with 1.20 persons per household.
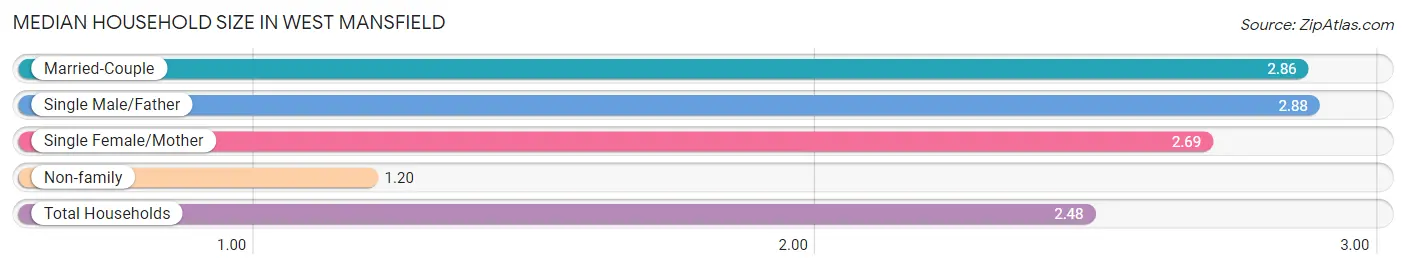
| Household Type | # Households | Household Size |
| Married-Couple | 223 (62.8%) | 2.86 |
| Single Male/Father | 8 (2.2%) | 2.88 |
| Single Female/Mother | 49 (13.8%) | 2.69 |
| Non-family | 75 (21.1%) | 1.20 |
| Total Households | 355 (100.0%) | 2.48 |
Household Size by Marriage Status in West Mansfield
Out of a total of 355 households in West Mansfield, 280 (78.9%) are family households, while 75 (21.1%) are nonfamily households. The most numerous type of family households are 2-person households, comprising 140, and the most common type of nonfamily households are 1-person households, comprising 63.
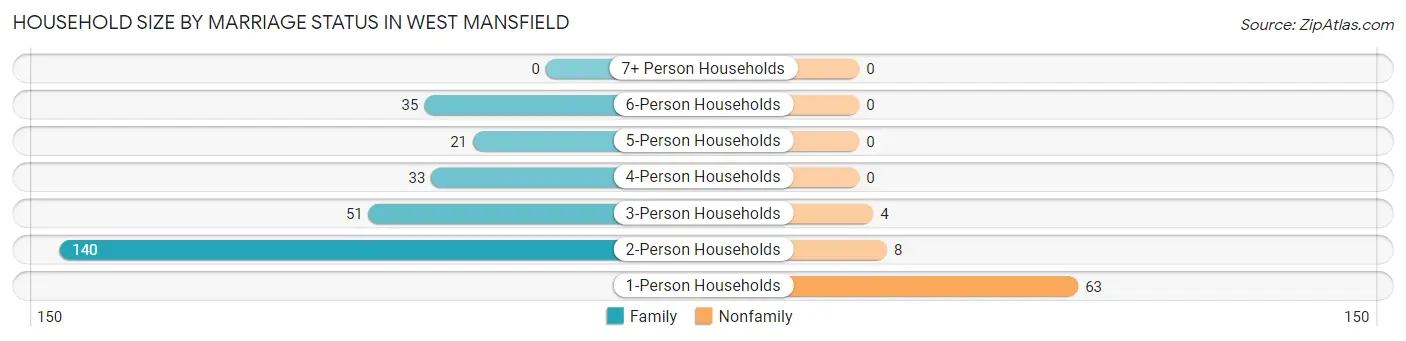
| Household Size | Family Households | Nonfamily Households |
| 1-Person Households | - | 63 (17.7%) |
| 2-Person Households | 140 (39.4%) | 8 (2.2%) |
| 3-Person Households | 51 (14.4%) | 4 (1.1%) |
| 4-Person Households | 33 (9.3%) | 0 (0.0%) |
| 5-Person Households | 21 (5.9%) | 0 (0.0%) |
| 6-Person Households | 35 (9.9%) | 0 (0.0%) |
| 7+ Person Households | 0 (0.0%) | 0 (0.0%) |
| Total | 280 (78.9%) | 75 (21.1%) |
Female Fertility in West Mansfield
Fertility by Age in West Mansfield
| Age Bracket | Women with Births | Births / 1,000 Women |
| 15 to 19 years | 0 (0.0%) | 0.0 |
| 20 to 34 years | 0 (0.0%) | 0.0 |
| 35 to 50 years | 0 (0.0%) | 0.0 |
| Total | 0 (0.0%) | 0.0 |
Fertility by Age by Marriage Status in West Mansfield
| Age Bracket | Married | Unmarried |
| 15 to 19 years | 0 (0.0%) | 0 (0.0%) |
| 20 to 34 years | 0 (0.0%) | 0 (0.0%) |
| 35 to 50 years | 0 (0.0%) | 0 (0.0%) |
| Total | 0 (0.0%) | 0 (0.0%) |
Fertility by Education in West Mansfield
| Educational Attainment | Women with Births | Births / 1,000 Women |
| Less than High School | 0 (0.0%) | 0.0 |
| High School Diploma | 0 (0.0%) | 0.0 |
| College or Associate's Degree | 0 (0.0%) | 0.0 |
| Bachelor's Degree | 0 (0.0%) | 0.0 |
| Graduate Degree | 0 (0.0%) | 0.0 |
| Total | 0 (0.0%) | 0.0 |
Fertility by Education by Marriage Status in West Mansfield
| Educational Attainment | Married | Unmarried |
| Less than High School | 0 (0.0%) | 0 (0.0%) |
| High School Diploma | 0 (0.0%) | 0 (0.0%) |
| College or Associate's Degree | 0 (0.0%) | 0 (0.0%) |
| Bachelor's Degree | 0 (0.0%) | 0 (0.0%) |
| Graduate Degree | 0 (0.0%) | 0 (0.0%) |
| Total | 0 (0.0%) | 0 (0.0%) |
Employment Characteristics in West Mansfield
Employment by Class of Employer in West Mansfield
Among the 441 employed individuals in West Mansfield, private company employees (319 | 72.3%), not-for-profit organizations (40 | 9.1%), and local government employees (27 | 6.1%) make up the most common classes of employment.
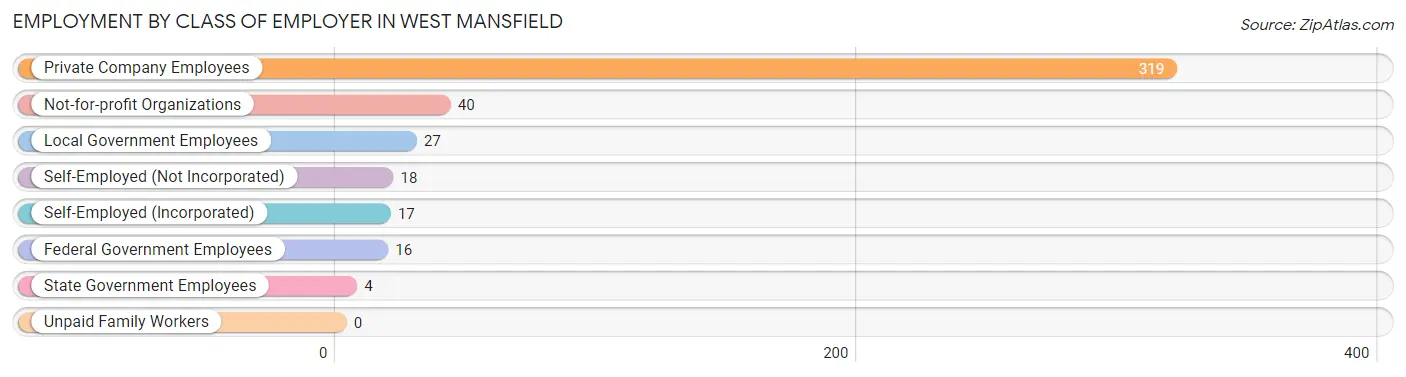
| Employer Class | # Employees | % Employees |
| Private Company Employees | 319 | 72.3% |
| Self-Employed (Incorporated) | 17 | 3.8% |
| Self-Employed (Not Incorporated) | 18 | 4.1% |
| Not-for-profit Organizations | 40 | 9.1% |
| Local Government Employees | 27 | 6.1% |
| State Government Employees | 4 | 0.9% |
| Federal Government Employees | 16 | 3.6% |
| Unpaid Family Workers | 0 | 0.0% |
| Total | 441 | 100.0% |
Employment Status by Age in West Mansfield
According to the labor force statistics for West Mansfield, out of the total population over 16 years of age (679), 70.3% or 477 individuals are in the labor force, with 6.7% or 32 of them unemployed. The age group with the highest labor force participation rate is 35 to 44 years, with 97.2% or 106 individuals in the labor force. Within the labor force, the 16 to 19 years age range has the highest percentage of unemployed individuals, with 35.1% or 13 of them being unemployed.
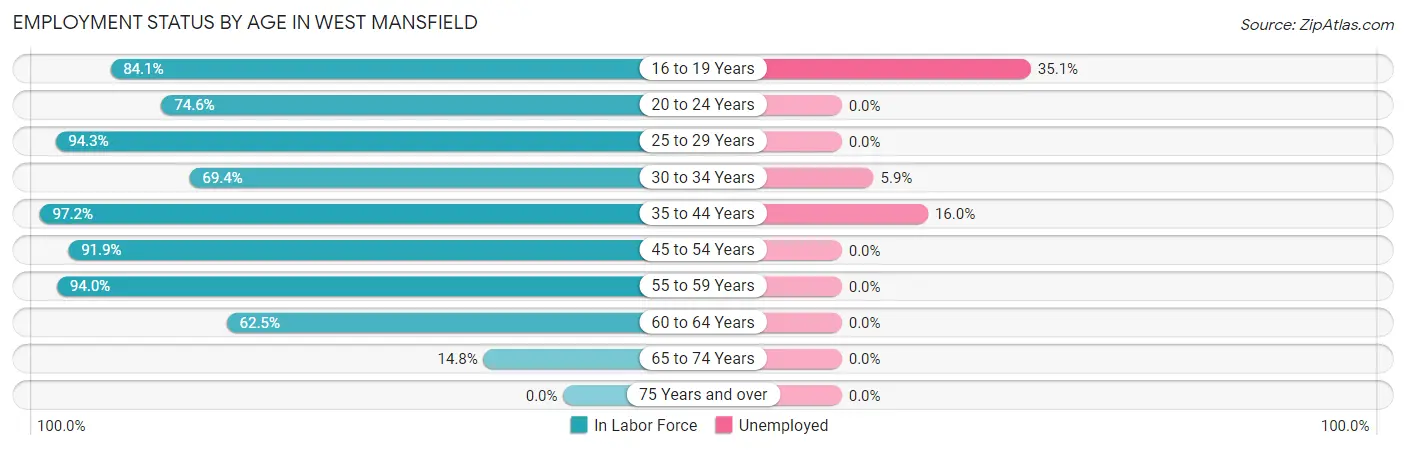
| Age Bracket | In Labor Force | Unemployed |
| 16 to 19 Years | 37 (84.1%) | 13 (35.1%) |
| 20 to 24 Years | 44 (74.6%) | 0 (0.0%) |
| 25 to 29 Years | 66 (94.3%) | 0 (0.0%) |
| 30 to 34 Years | 34 (69.4%) | 2 (5.9%) |
| 35 to 44 Years | 106 (97.2%) | 17 (16.0%) |
| 45 to 54 Years | 79 (91.9%) | 0 (0.0%) |
| 55 to 59 Years | 47 (94.0%) | 0 (0.0%) |
| 60 to 64 Years | 55 (62.5%) | 0 (0.0%) |
| 65 to 74 Years | 9 (14.8%) | 0 (0.0%) |
| 75 Years and over | 0 (0.0%) | 0 (0.0%) |
| Total | 477 (70.3%) | 32 (6.7%) |
Employment Status by Educational Attainment in West Mansfield
According to labor force statistics for West Mansfield, 85.6% of individuals (387) out of the total population between 25 and 64 years of age (452) are in the labor force, with 4.9% or 19 of them being unemployed. The group with the highest labor force participation rate are those with the educational attainment of bachelor's degree or higher, with 92.5% or 49 individuals in the labor force. Within the labor force, individuals with less than high school education have the highest percentage of unemployment, with 25.9% or 7 of them being unemployed.
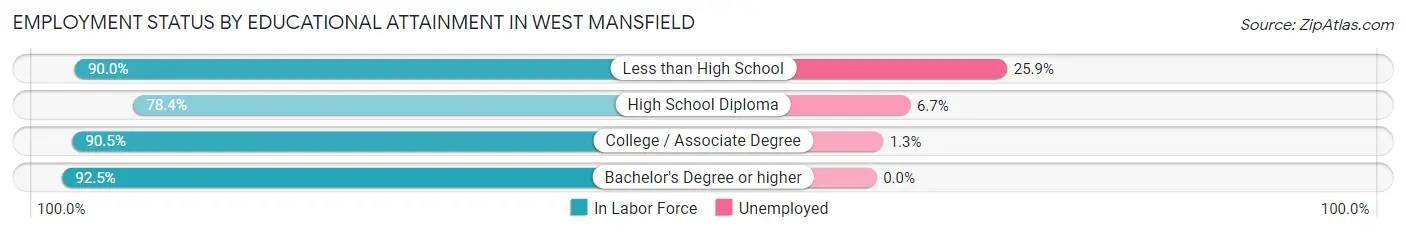
| Educational Attainment | In Labor Force | Unemployed |
| Less than High School | 27 (90.0%) | 8 (25.9%) |
| High School Diploma | 149 (78.4%) | 13 (6.7%) |
| College / Associate Degree | 162 (90.5%) | 2 (1.3%) |
| Bachelor's Degree or higher | 49 (92.5%) | 0 (0.0%) |
| Total | 387 (85.6%) | 22 (4.9%) |
Employment Occupations by Sex in West Mansfield
Management, Business, Science and Arts Occupations
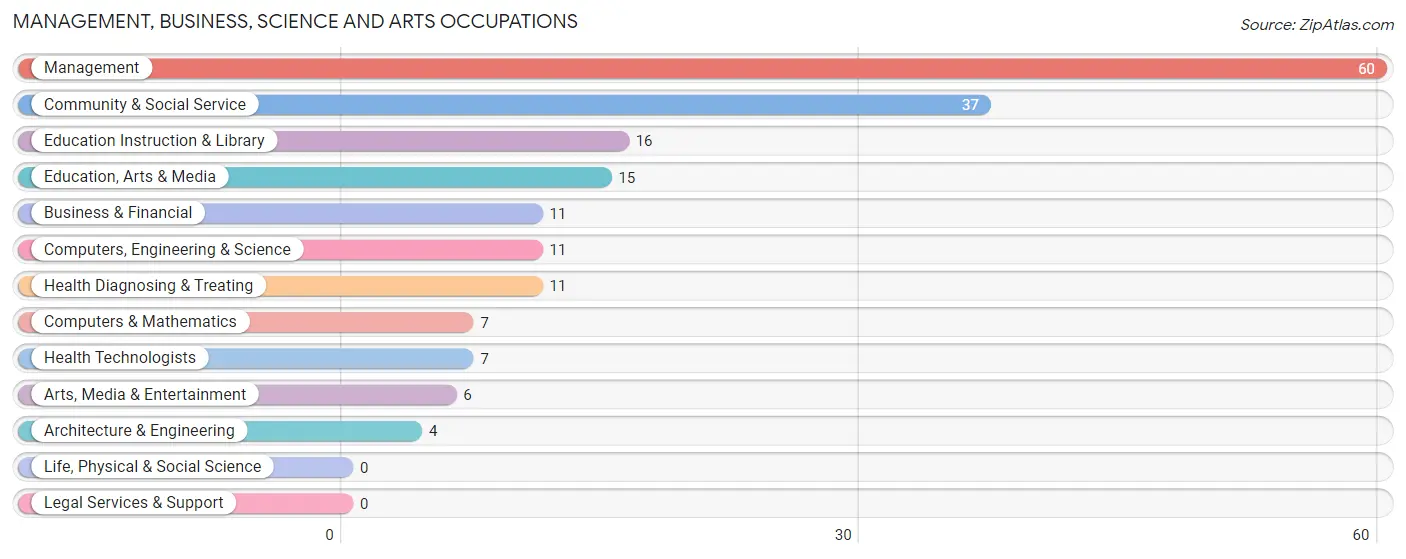
The most common Management, Business, Science and Arts occupations in West Mansfield are Management (60 | 13.5%), Community & Social Service (37 | 8.4%), Education Instruction & Library (16 | 3.6%), Education, Arts & Media (15 | 3.4%), and Business & Financial (11 | 2.5%).
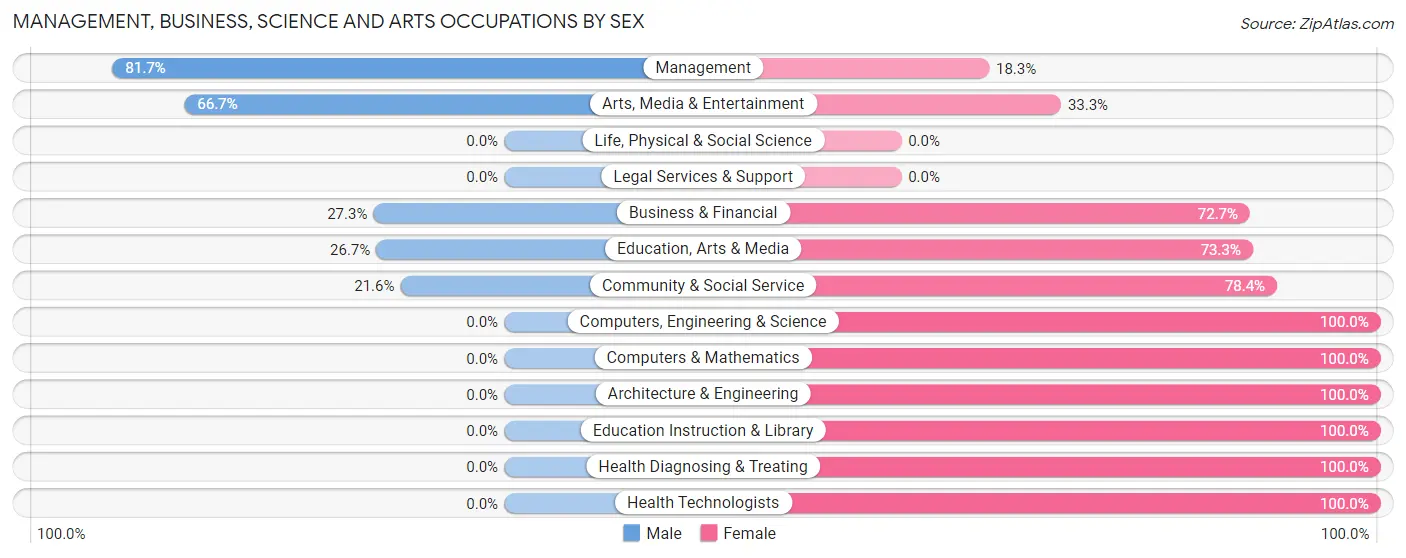
Management, Business, Science and Arts Occupations by Sex
Within the Management, Business, Science and Arts occupations in West Mansfield, the most male-oriented occupations are Management (81.7%), Arts, Media & Entertainment (66.7%), and Business & Financial (27.3%), while the most female-oriented occupations are Computers, Engineering & Science (100.0%), Computers & Mathematics (100.0%), and Architecture & Engineering (100.0%).
| Occupation | Male | Female |
| Management | 49 (81.7%) | 11 (18.3%) |
| Business & Financial | 3 (27.3%) | 8 (72.7%) |
| Computers, Engineering & Science | 0 (0.0%) | 11 (100.0%) |
| Computers & Mathematics | 0 (0.0%) | 7 (100.0%) |
| Architecture & Engineering | 0 (0.0%) | 4 (100.0%) |
| Life, Physical & Social Science | 0 (0.0%) | 0 (0.0%) |
| Community & Social Service | 8 (21.6%) | 29 (78.4%) |
| Education, Arts & Media | 4 (26.7%) | 11 (73.3%) |
| Legal Services & Support | 0 (0.0%) | 0 (0.0%) |
| Education Instruction & Library | 0 (0.0%) | 16 (100.0%) |
| Arts, Media & Entertainment | 4 (66.7%) | 2 (33.3%) |
| Health Diagnosing & Treating | 0 (0.0%) | 11 (100.0%) |
| Health Technologists | 0 (0.0%) | 7 (100.0%) |
| Total (Category) | 60 (46.2%) | 70 (53.8%) |
| Total (Overall) | 259 (58.5%) | 184 (41.5%) |
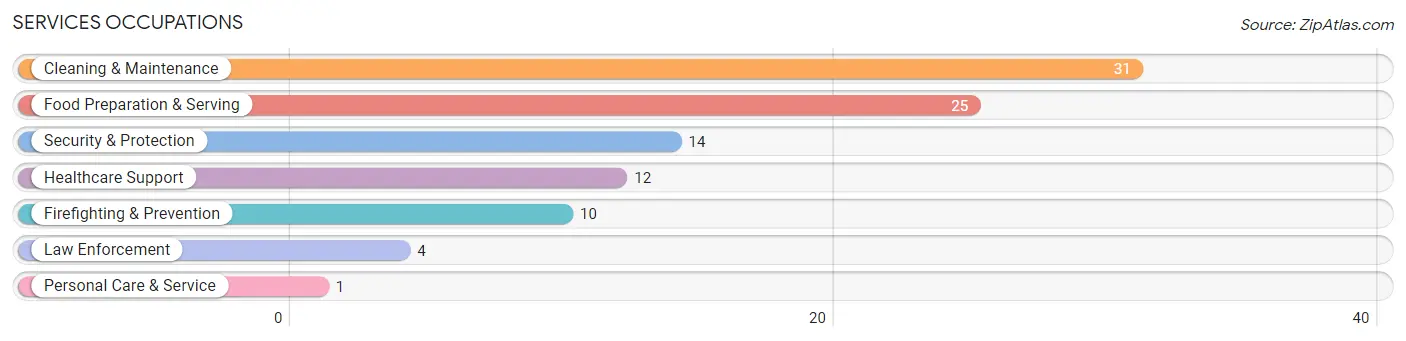
Services Occupations
The most common Services occupations in West Mansfield are Cleaning & Maintenance (31 | 7.0%), Food Preparation & Serving (25 | 5.6%), Security & Protection (14 | 3.2%), Healthcare Support (12 | 2.7%), and Firefighting & Prevention (10 | 2.3%).
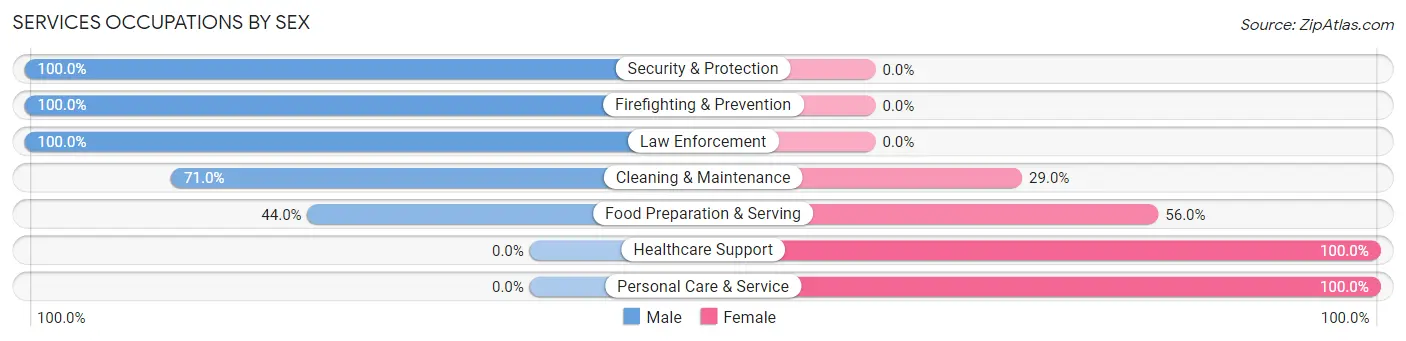
Services Occupations by Sex
Within the Services occupations in West Mansfield, the most male-oriented occupations are Security & Protection (100.0%), Firefighting & Prevention (100.0%), and Law Enforcement (100.0%), while the most female-oriented occupations are Healthcare Support (100.0%), Personal Care & Service (100.0%), and Food Preparation & Serving (56.0%).
| Occupation | Male | Female |
| Healthcare Support | 0 (0.0%) | 12 (100.0%) |
| Security & Protection | 14 (100.0%) | 0 (0.0%) |
| Firefighting & Prevention | 10 (100.0%) | 0 (0.0%) |
| Law Enforcement | 4 (100.0%) | 0 (0.0%) |
| Food Preparation & Serving | 11 (44.0%) | 14 (56.0%) |
| Cleaning & Maintenance | 22 (71.0%) | 9 (29.0%) |
| Personal Care & Service | 0 (0.0%) | 1 (100.0%) |
| Total (Category) | 47 (56.6%) | 36 (43.4%) |
| Total (Overall) | 259 (58.5%) | 184 (41.5%) |
Sales and Office Occupations
The most common Sales and Office occupations in West Mansfield are Office & Administration (52 | 11.7%), and Sales & Related (30 | 6.8%).
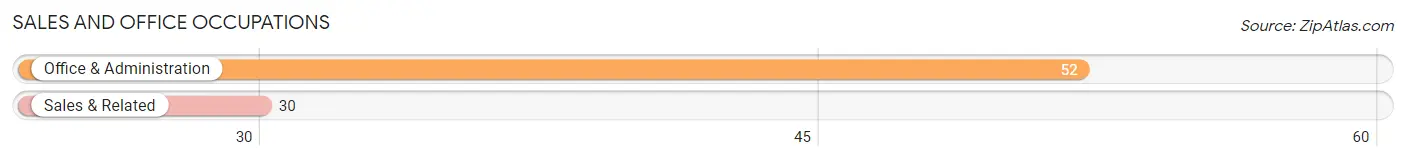
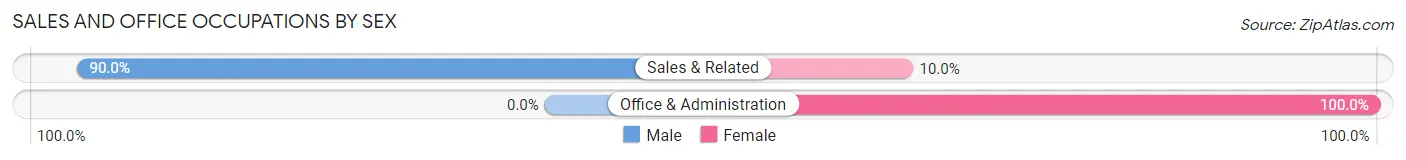
Sales and Office Occupations by Sex
| Occupation | Male | Female |
| Sales & Related | 27 (90.0%) | 3 (10.0%) |
| Office & Administration | 0 (0.0%) | 52 (100.0%) |
| Total (Category) | 27 (32.9%) | 55 (67.1%) |
| Total (Overall) | 259 (58.5%) | 184 (41.5%) |
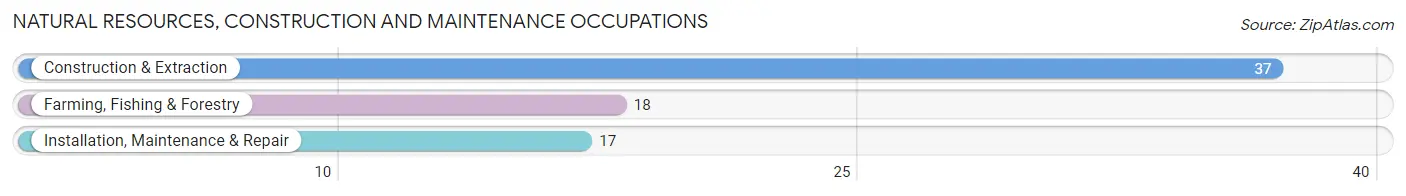
Natural Resources, Construction and Maintenance Occupations
The most common Natural Resources, Construction and Maintenance occupations in West Mansfield are Construction & Extraction (37 | 8.4%), Farming, Fishing & Forestry (18 | 4.1%), and Installation, Maintenance & Repair (17 | 3.8%).
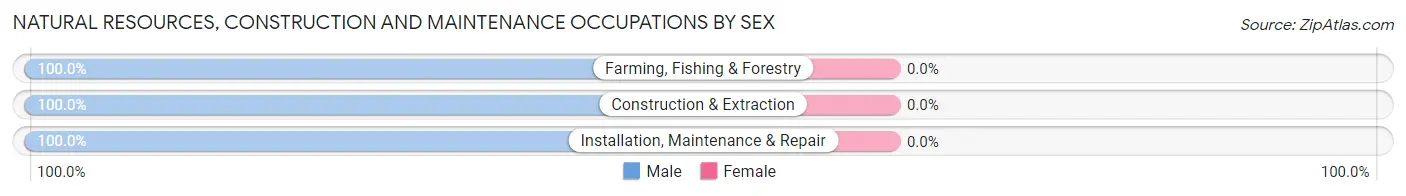
Natural Resources, Construction and Maintenance Occupations by Sex
| Occupation | Male | Female |
| Farming, Fishing & Forestry | 18 (100.0%) | 0 (0.0%) |
| Construction & Extraction | 37 (100.0%) | 0 (0.0%) |
| Installation, Maintenance & Repair | 17 (100.0%) | 0 (0.0%) |
| Total (Category) | 72 (100.0%) | 0 (0.0%) |
| Total (Overall) | 259 (58.5%) | 184 (41.5%) |
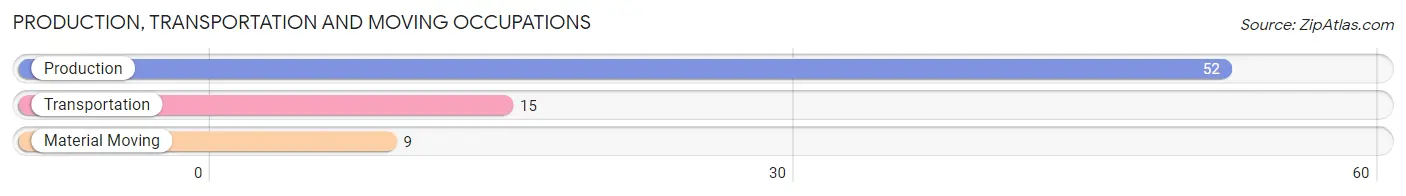
Production, Transportation and Moving Occupations
The most common Production, Transportation and Moving occupations in West Mansfield are Production (52 | 11.7%), Transportation (15 | 3.4%), and Material Moving (9 | 2.0%).
Production, Transportation and Moving Occupations by Sex
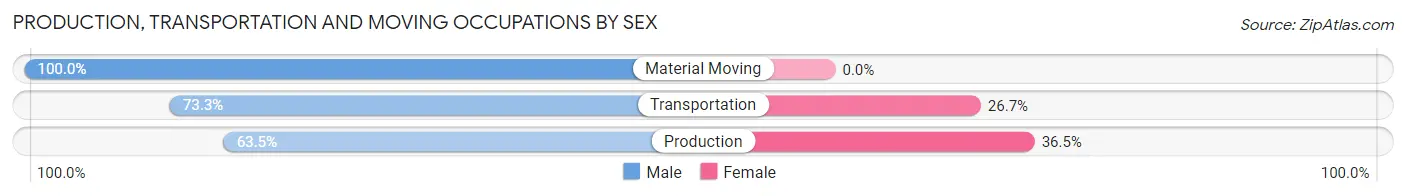
| Occupation | Male | Female |
| Production | 33 (63.5%) | 19 (36.5%) |
| Transportation | 11 (73.3%) | 4 (26.7%) |
| Material Moving | 9 (100.0%) | 0 (0.0%) |
| Total (Category) | 53 (69.7%) | 23 (30.3%) |
| Total (Overall) | 259 (58.5%) | 184 (41.5%) |
Employment Industries by Sex in West Mansfield
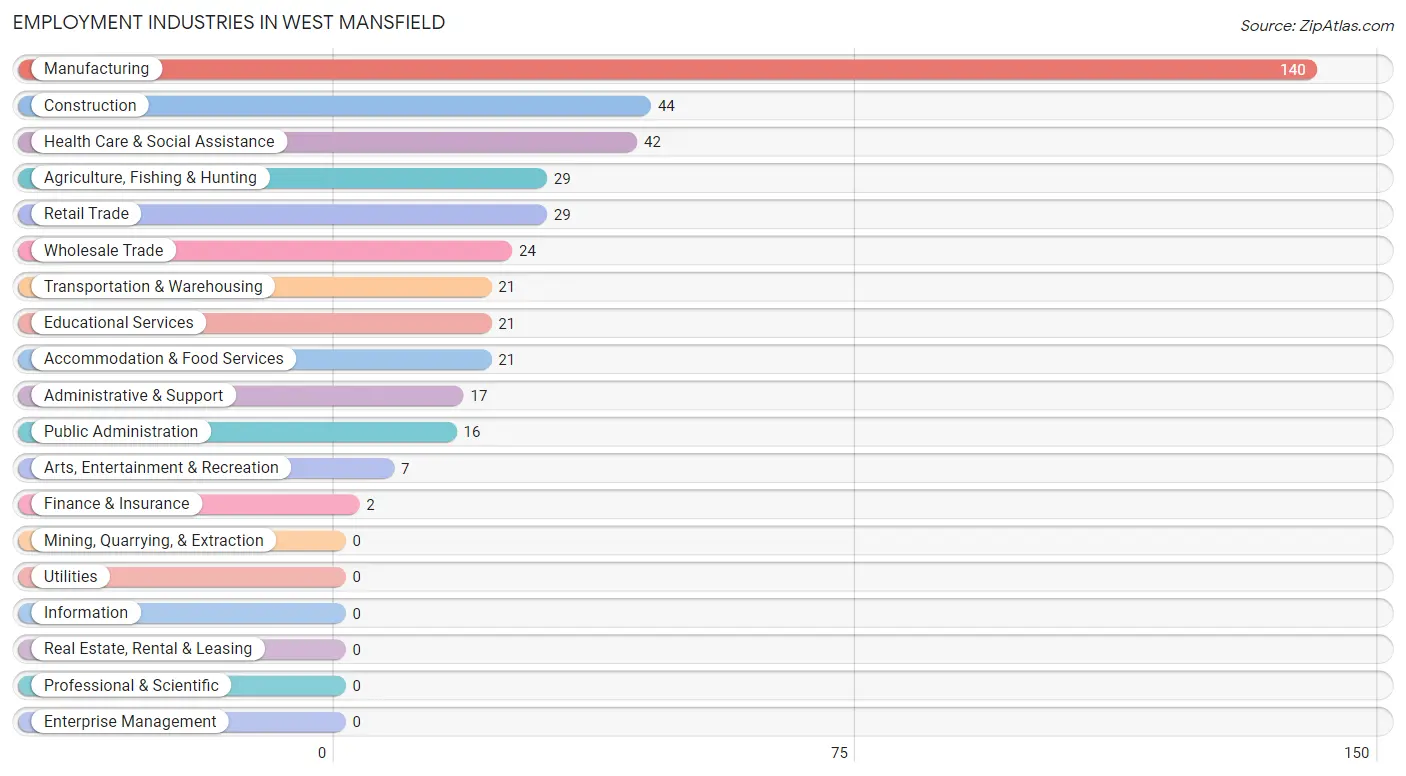
Employment Industries in West Mansfield
The major employment industries in West Mansfield include Manufacturing (140 | 31.6%), Construction (44 | 9.9%), Health Care & Social Assistance (42 | 9.5%), Agriculture, Fishing & Hunting (29 | 6.6%), and Retail Trade (29 | 6.6%).
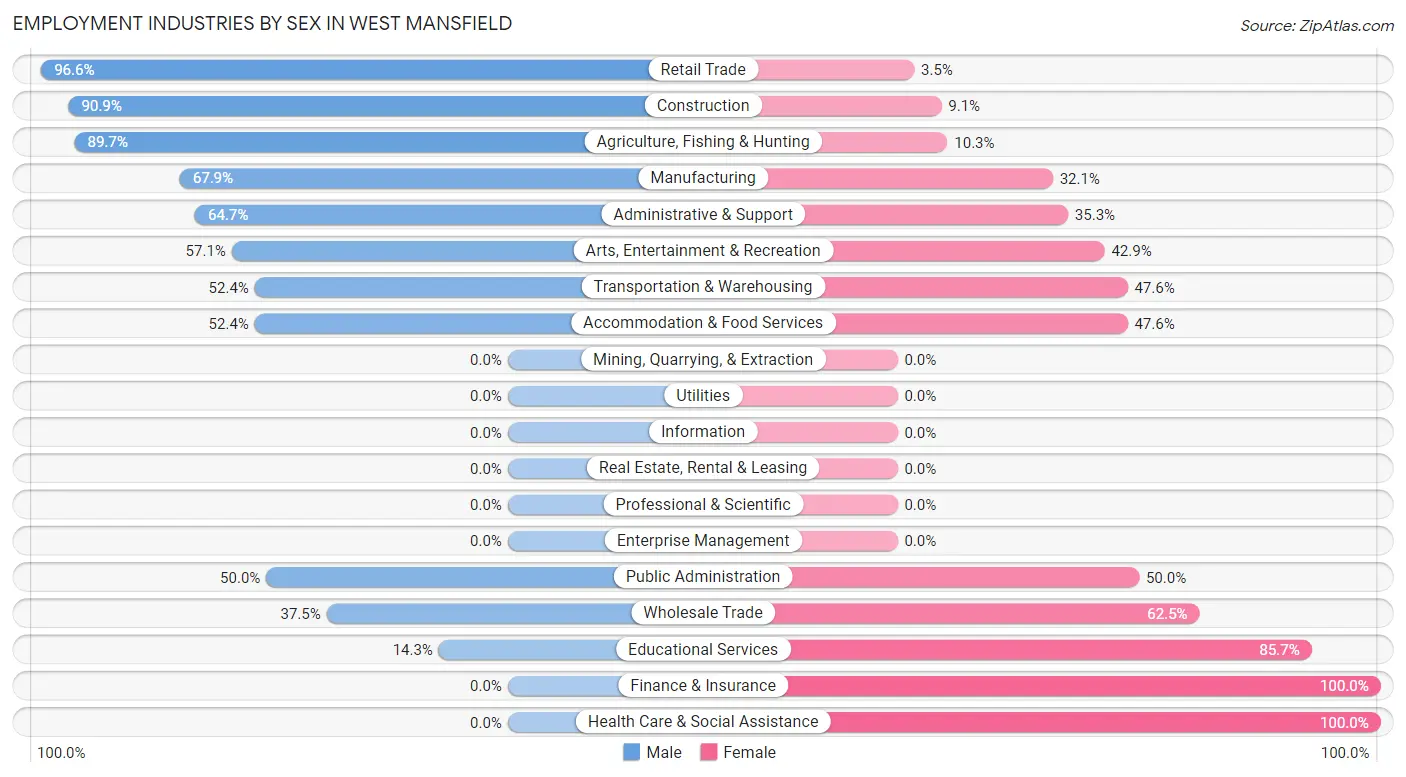
Employment Industries by Sex in West Mansfield
The West Mansfield industries that see more men than women are Retail Trade (96.6%), Construction (90.9%), and Agriculture, Fishing & Hunting (89.7%), whereas the industries that tend to have a higher number of women are Finance & Insurance (100.0%), Health Care & Social Assistance (100.0%), and Educational Services (85.7%).
| Industry | Male | Female |
| Agriculture, Fishing & Hunting | 26 (89.7%) | 3 (10.3%) |
| Mining, Quarrying, & Extraction | 0 (0.0%) | 0 (0.0%) |
| Construction | 40 (90.9%) | 4 (9.1%) |
| Manufacturing | 95 (67.9%) | 45 (32.1%) |
| Wholesale Trade | 9 (37.5%) | 15 (62.5%) |
| Retail Trade | 28 (96.6%) | 1 (3.5%) |
| Transportation & Warehousing | 11 (52.4%) | 10 (47.6%) |
| Utilities | 0 (0.0%) | 0 (0.0%) |
| Information | 0 (0.0%) | 0 (0.0%) |
| Finance & Insurance | 0 (0.0%) | 2 (100.0%) |
| Real Estate, Rental & Leasing | 0 (0.0%) | 0 (0.0%) |
| Professional & Scientific | 0 (0.0%) | 0 (0.0%) |
| Enterprise Management | 0 (0.0%) | 0 (0.0%) |
| Administrative & Support | 11 (64.7%) | 6 (35.3%) |
| Educational Services | 3 (14.3%) | 18 (85.7%) |
| Health Care & Social Assistance | 0 (0.0%) | 42 (100.0%) |
| Arts, Entertainment & Recreation | 4 (57.1%) | 3 (42.9%) |
| Accommodation & Food Services | 11 (52.4%) | 10 (47.6%) |
| Public Administration | 8 (50.0%) | 8 (50.0%) |
| Total | 259 (58.5%) | 184 (41.5%) |
Education in West Mansfield
School Enrollment in West Mansfield
The most common levels of schooling among the 236 students in West Mansfield are middle school (81 | 34.3%), elementary school (64 | 27.1%), and high school (54 | 22.9%).
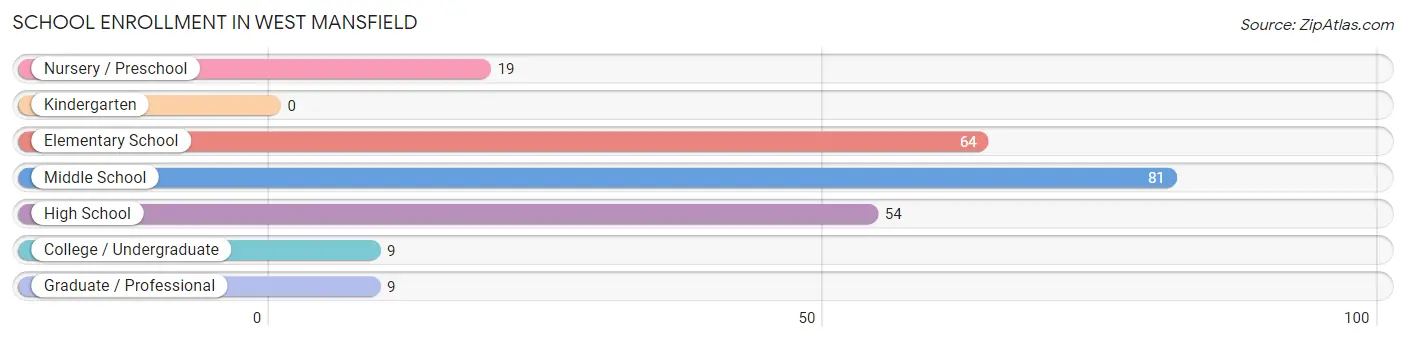
| School Level | # Students | % Students |
| Nursery / Preschool | 19 | 8.1% |
| Kindergarten | 0 | 0.0% |
| Elementary School | 64 | 27.1% |
| Middle School | 81 | 34.3% |
| High School | 54 | 22.9% |
| College / Undergraduate | 9 | 3.8% |
| Graduate / Professional | 9 | 3.8% |
| Total | 236 | 100.0% |
School Enrollment by Age by Funding Source in West Mansfield
Out of a total of 236 students who are enrolled in schools in West Mansfield, 14 (5.9%) attend a private institution, while the remaining 222 (94.1%) are enrolled in public schools. The age group of 3 to 4 year olds has the highest likelihood of being enrolled in private schools, with 8 (42.1% in the age bracket) enrolled. Conversely, the age group of 5 to 9 year old has the lowest likelihood of being enrolled in a private school, with 57 (100.0% in the age bracket) attending a public institution.
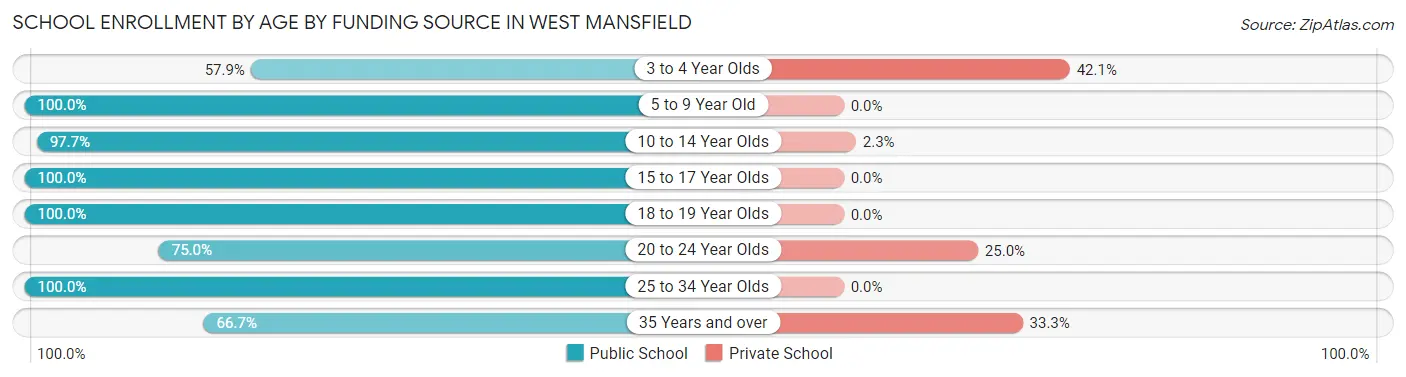
| Age Bracket | Public School | Private School |
| 3 to 4 Year Olds | 11 (57.9%) | 8 (42.1%) |
| 5 to 9 Year Old | 57 (100.0%) | 0 (0.0%) |
| 10 to 14 Year Olds | 86 (97.7%) | 2 (2.3%) |
| 15 to 17 Year Olds | 44 (100.0%) | 0 (0.0%) |
| 18 to 19 Year Olds | 8 (100.0%) | 0 (0.0%) |
| 20 to 24 Year Olds | 3 (75.0%) | 1 (25.0%) |
| 25 to 34 Year Olds | 7 (100.0%) | 0 (0.0%) |
| 35 Years and over | 6 (66.7%) | 3 (33.3%) |
| Total | 222 (94.1%) | 14 (5.9%) |
Educational Attainment by Field of Study in West Mansfield
Business (28 | 48.3%), arts & humanities (11 | 19.0%), education (9 | 15.5%), bio, nature & agricultural (3 | 5.2%), and literature & languages (3 | 5.2%) are the most common fields of study among 58 individuals in West Mansfield who have obtained a bachelor's degree or higher.
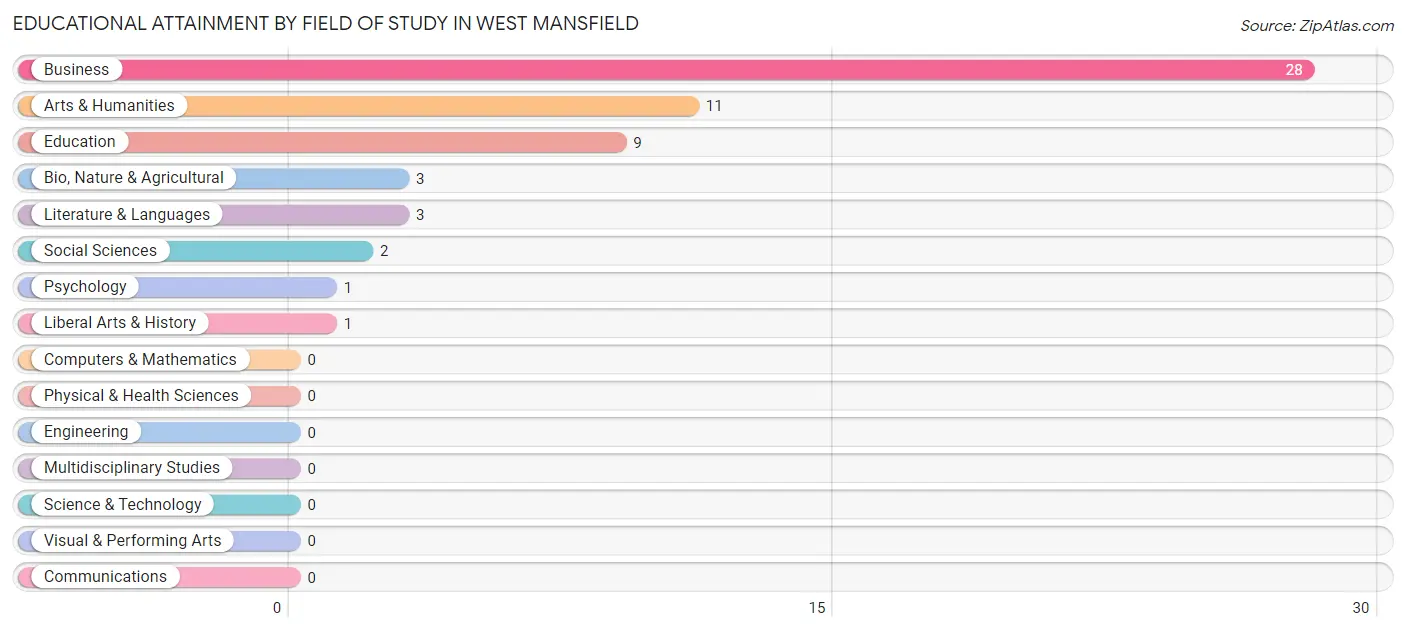
| Field of Study | # Graduates | % Graduates |
| Computers & Mathematics | 0 | 0.0% |
| Bio, Nature & Agricultural | 3 | 5.2% |
| Physical & Health Sciences | 0 | 0.0% |
| Psychology | 1 | 1.7% |
| Social Sciences | 2 | 3.5% |
| Engineering | 0 | 0.0% |
| Multidisciplinary Studies | 0 | 0.0% |
| Science & Technology | 0 | 0.0% |
| Business | 28 | 48.3% |
| Education | 9 | 15.5% |
| Literature & Languages | 3 | 5.2% |
| Liberal Arts & History | 1 | 1.7% |
| Visual & Performing Arts | 0 | 0.0% |
| Communications | 0 | 0.0% |
| Arts & Humanities | 11 | 19.0% |
| Total | 58 | 100.0% |
Transportation & Commute in West Mansfield
Vehicle Availability by Sex in West Mansfield
The most prevalent vehicle ownership categories in West Mansfield are males with 2 vehicles (135, accounting for 51.7%) and females with 2 vehicles (62, making up 75.0%).
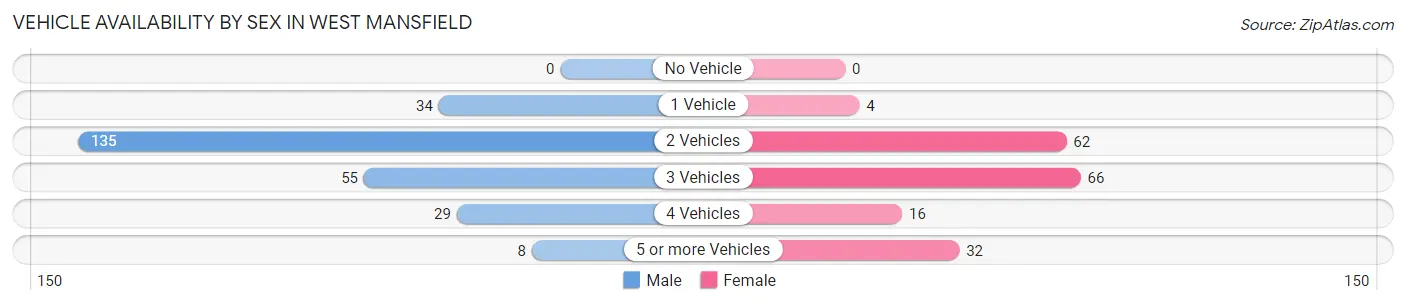
| Vehicles Available | Male | Female |
| No Vehicle | 0 (0.0%) | 0 (0.0%) |
| 1 Vehicle | 34 (13.0%) | 4 (2.2%) |
| 2 Vehicles | 135 (51.7%) | 62 (34.4%) |
| 3 Vehicles | 55 (21.1%) | 66 (36.7%) |
| 4 Vehicles | 29 (11.1%) | 16 (8.9%) |
| 5 or more Vehicles | 8 (3.1%) | 32 (17.8%) |
| Total | 261 (100.0%) | 180 (100.0%) |
Commute Time in West Mansfield
The most frequently occuring commute durations in West Mansfield are 20 to 24 minutes (116 commuters, 27.6%), 15 to 19 minutes (98 commuters, 23.3%), and 45 to 59 minutes (48 commuters, 11.4%).
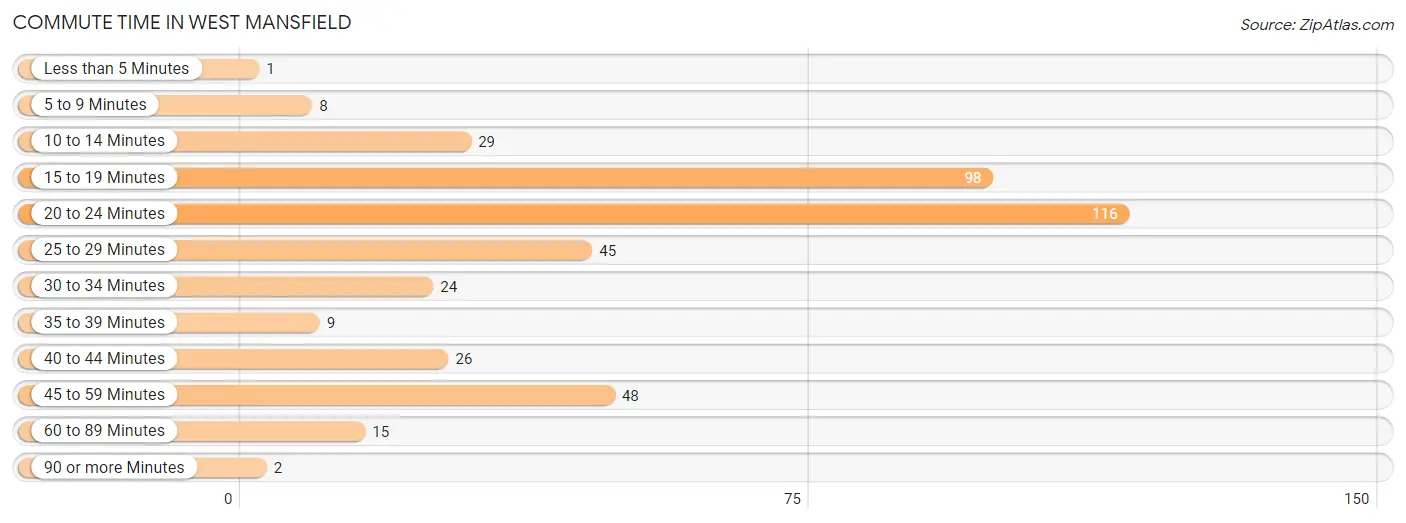
| Commute Time | # Commuters | % Commuters |
| Less than 5 Minutes | 1 | 0.2% |
| 5 to 9 Minutes | 8 | 1.9% |
| 10 to 14 Minutes | 29 | 6.9% |
| 15 to 19 Minutes | 98 | 23.3% |
| 20 to 24 Minutes | 116 | 27.6% |
| 25 to 29 Minutes | 45 | 10.7% |
| 30 to 34 Minutes | 24 | 5.7% |
| 35 to 39 Minutes | 9 | 2.1% |
| 40 to 44 Minutes | 26 | 6.2% |
| 45 to 59 Minutes | 48 | 11.4% |
| 60 to 89 Minutes | 15 | 3.6% |
| 90 or more Minutes | 2 | 0.5% |
Commute Time by Sex in West Mansfield
The most common commute times in West Mansfield are 20 to 24 minutes (78 commuters, 31.8%) for males and 15 to 19 minutes (41 commuters, 23.3%) for females.
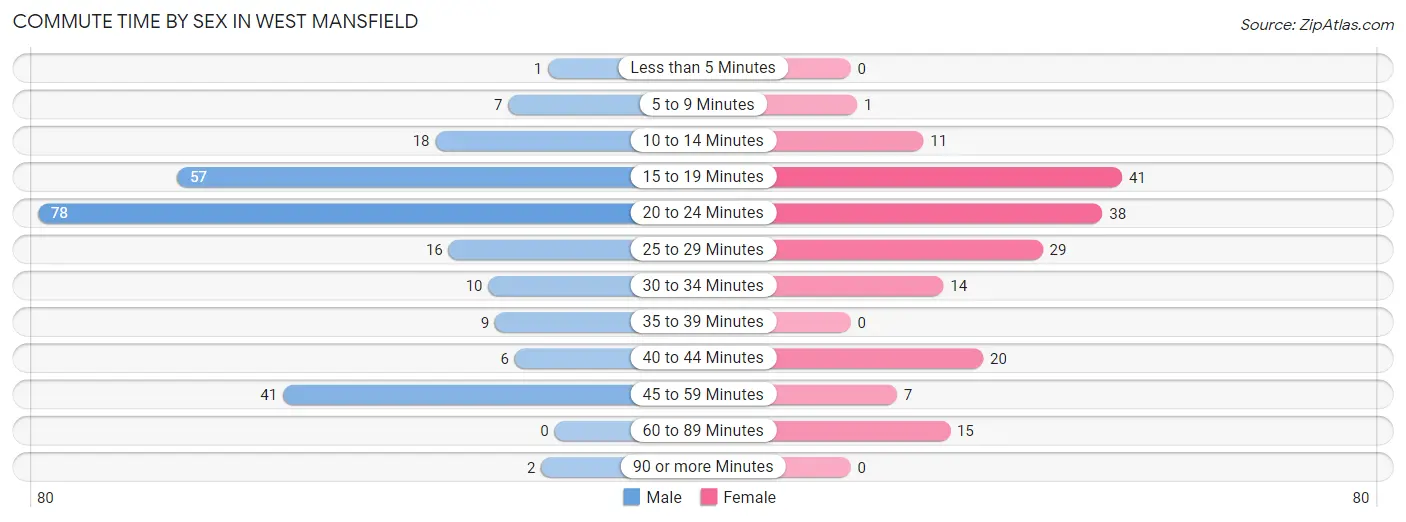
| Commute Time | Male | Female |
| Less than 5 Minutes | 1 (0.4%) | 0 (0.0%) |
| 5 to 9 Minutes | 7 (2.9%) | 1 (0.6%) |
| 10 to 14 Minutes | 18 (7.3%) | 11 (6.2%) |
| 15 to 19 Minutes | 57 (23.3%) | 41 (23.3%) |
| 20 to 24 Minutes | 78 (31.8%) | 38 (21.6%) |
| 25 to 29 Minutes | 16 (6.5%) | 29 (16.5%) |
| 30 to 34 Minutes | 10 (4.1%) | 14 (8.0%) |
| 35 to 39 Minutes | 9 (3.7%) | 0 (0.0%) |
| 40 to 44 Minutes | 6 (2.5%) | 20 (11.4%) |
| 45 to 59 Minutes | 41 (16.7%) | 7 (4.0%) |
| 60 to 89 Minutes | 0 (0.0%) | 15 (8.5%) |
| 90 or more Minutes | 2 (0.8%) | 0 (0.0%) |
Time of Departure to Work by Sex in West Mansfield
The most frequent times of departure to work in West Mansfield are 5:30 AM to 5:59 AM (55, 22.5%) for males and 6:30 AM to 6:59 AM (28, 15.9%) for females.
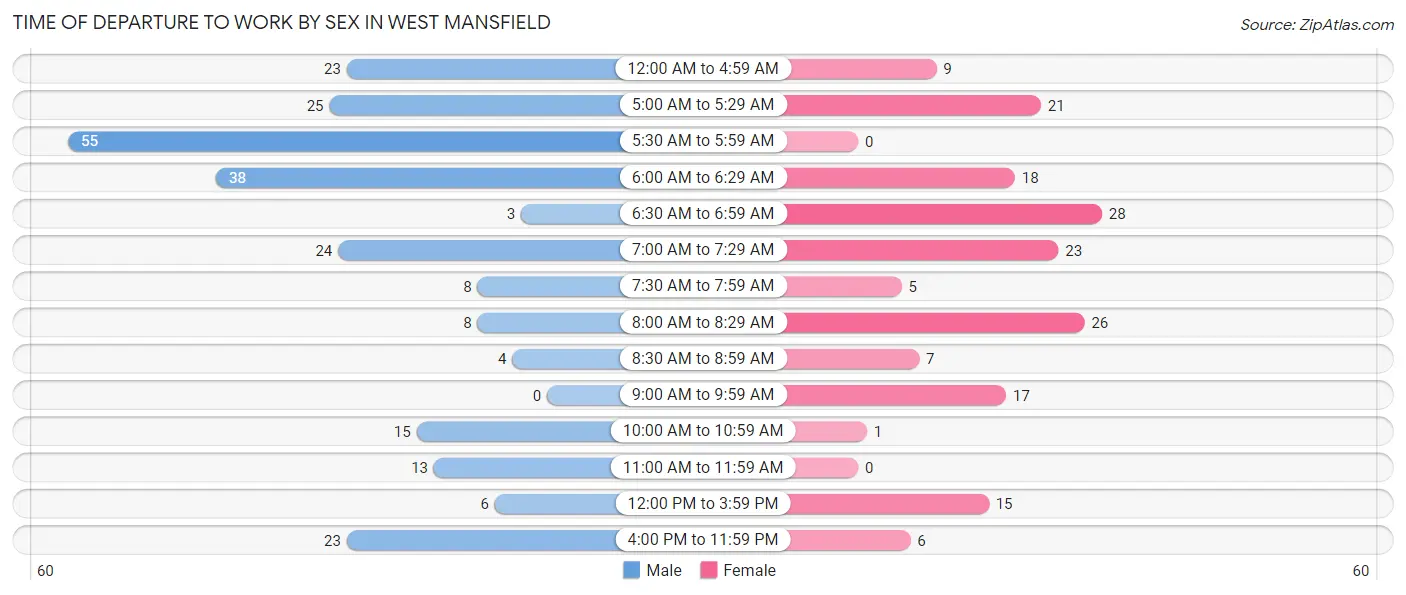
| Time of Departure | Male | Female |
| 12:00 AM to 4:59 AM | 23 (9.4%) | 9 (5.1%) |
| 5:00 AM to 5:29 AM | 25 (10.2%) | 21 (11.9%) |
| 5:30 AM to 5:59 AM | 55 (22.5%) | 0 (0.0%) |
| 6:00 AM to 6:29 AM | 38 (15.5%) | 18 (10.2%) |
| 6:30 AM to 6:59 AM | 3 (1.2%) | 28 (15.9%) |
| 7:00 AM to 7:29 AM | 24 (9.8%) | 23 (13.1%) |
| 7:30 AM to 7:59 AM | 8 (3.3%) | 5 (2.8%) |
| 8:00 AM to 8:29 AM | 8 (3.3%) | 26 (14.8%) |
| 8:30 AM to 8:59 AM | 4 (1.6%) | 7 (4.0%) |
| 9:00 AM to 9:59 AM | 0 (0.0%) | 17 (9.7%) |
| 10:00 AM to 10:59 AM | 15 (6.1%) | 1 (0.6%) |
| 11:00 AM to 11:59 AM | 13 (5.3%) | 0 (0.0%) |
| 12:00 PM to 3:59 PM | 6 (2.5%) | 15 (8.5%) |
| 4:00 PM to 11:59 PM | 23 (9.4%) | 6 (3.4%) |
| Total | 245 (100.0%) | 176 (100.0%) |
Housing Occupancy in West Mansfield
Occupancy by Ownership in West Mansfield
Of the total 355 dwellings in West Mansfield, owner-occupied units account for 281 (79.1%), while renter-occupied units make up 74 (20.8%).
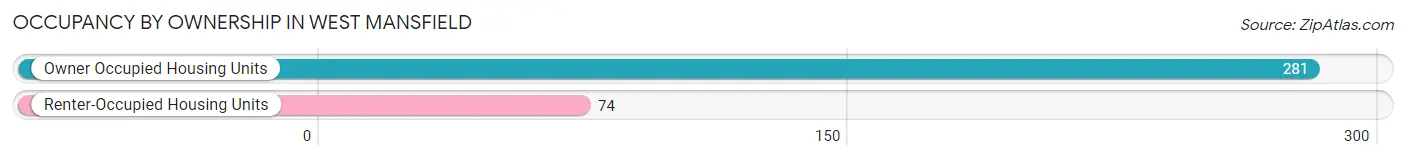
| Occupancy | # Housing Units | % Housing Units |
| Owner Occupied Housing Units | 281 | 79.1% |
| Renter-Occupied Housing Units | 74 | 20.8% |
| Total Occupied Housing Units | 355 | 100.0% |
Occupancy by Household Size in West Mansfield
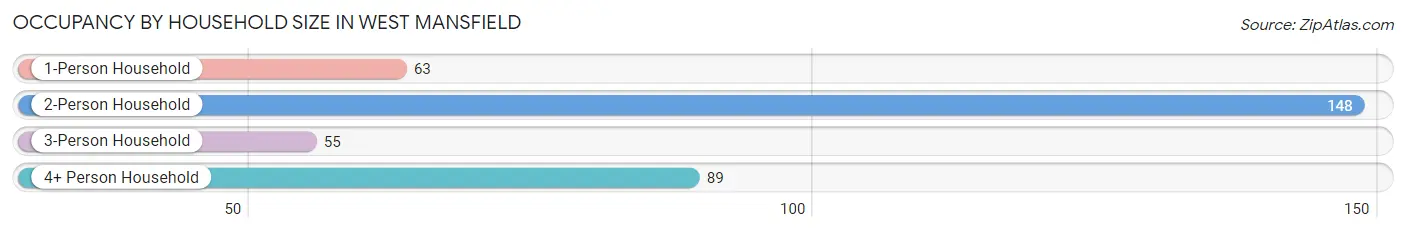
| Household Size | # Housing Units | % Housing Units |
| 1-Person Household | 63 | 17.7% |
| 2-Person Household | 148 | 41.7% |
| 3-Person Household | 55 | 15.5% |
| 4+ Person Household | 89 | 25.1% |
| Total Housing Units | 355 | 100.0% |
Occupancy by Ownership by Household Size in West Mansfield
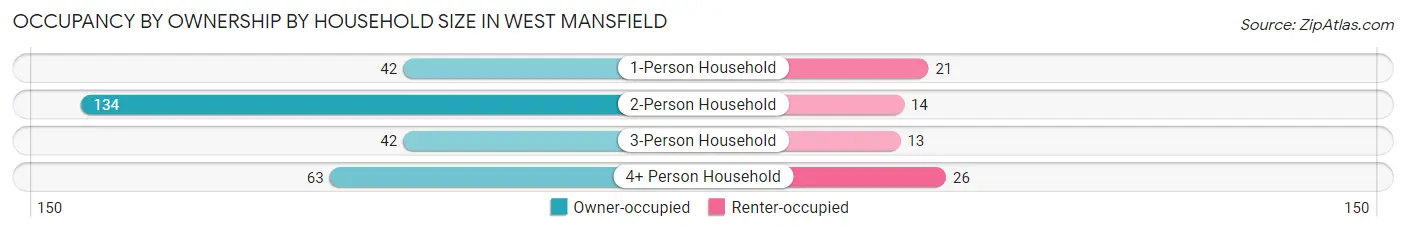
| Household Size | Owner-occupied | Renter-occupied |
| 1-Person Household | 42 (66.7%) | 21 (33.3%) |
| 2-Person Household | 134 (90.5%) | 14 (9.5%) |
| 3-Person Household | 42 (76.4%) | 13 (23.6%) |
| 4+ Person Household | 63 (70.8%) | 26 (29.2%) |
| Total Housing Units | 281 (79.1%) | 74 (20.8%) |
Occupancy by Educational Attainment in West Mansfield
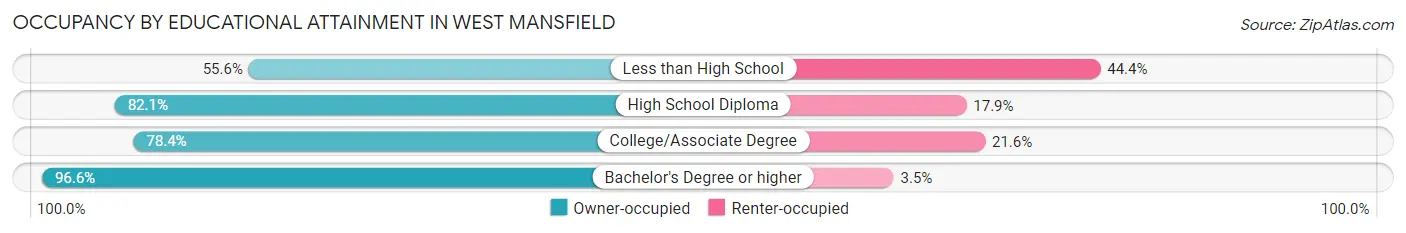
| Household Size | Owner-occupied | Renter-occupied |
| Less than High School | 20 (55.6%) | 16 (44.4%) |
| High School Diploma | 124 (82.1%) | 27 (17.9%) |
| College/Associate Degree | 109 (78.4%) | 30 (21.6%) |
| Bachelor's Degree or higher | 28 (96.6%) | 1 (3.5%) |
Occupancy by Age of Householder in West Mansfield
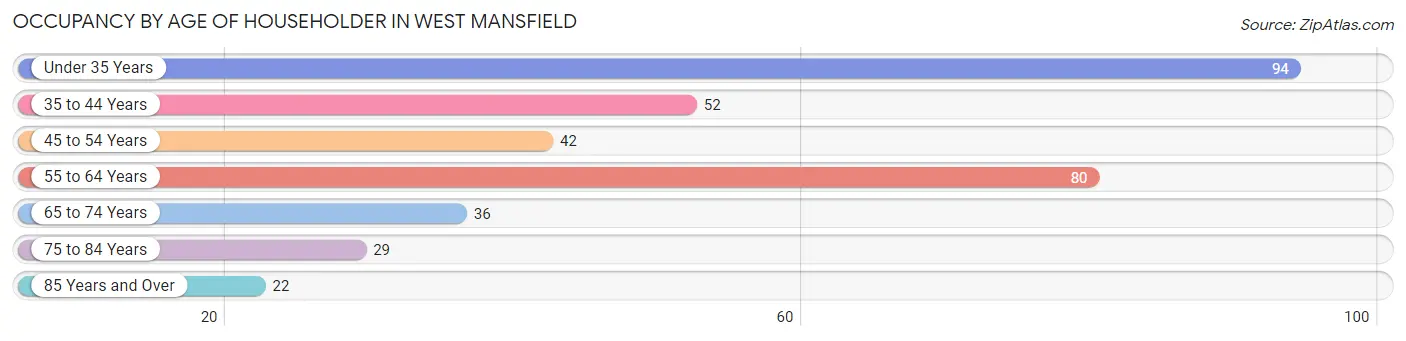
| Age Bracket | # Households | % Households |
| Under 35 Years | 94 | 26.5% |
| 35 to 44 Years | 52 | 14.6% |
| 45 to 54 Years | 42 | 11.8% |
| 55 to 64 Years | 80 | 22.5% |
| 65 to 74 Years | 36 | 10.1% |
| 75 to 84 Years | 29 | 8.2% |
| 85 Years and Over | 22 | 6.2% |
| Total | 355 | 100.0% |
Housing Finances in West Mansfield
Median Income by Occupancy in West Mansfield
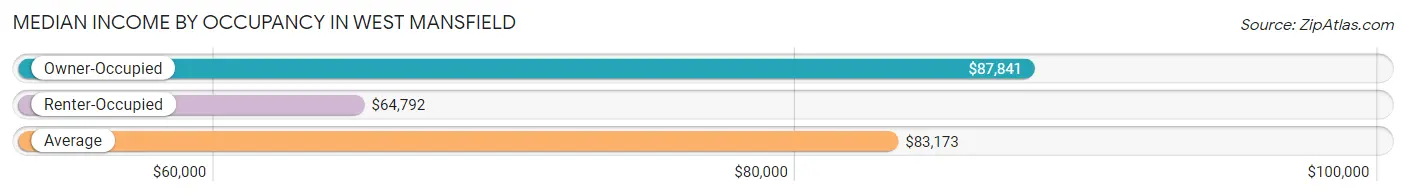
| Occupancy Type | # Households | Median Income |
| Owner-Occupied | 281 (79.1%) | $87,841 |
| Renter-Occupied | 74 (20.8%) | $64,792 |
| Average | 355 (100.0%) | $83,173 |
Occupancy by Householder Income Bracket in West Mansfield
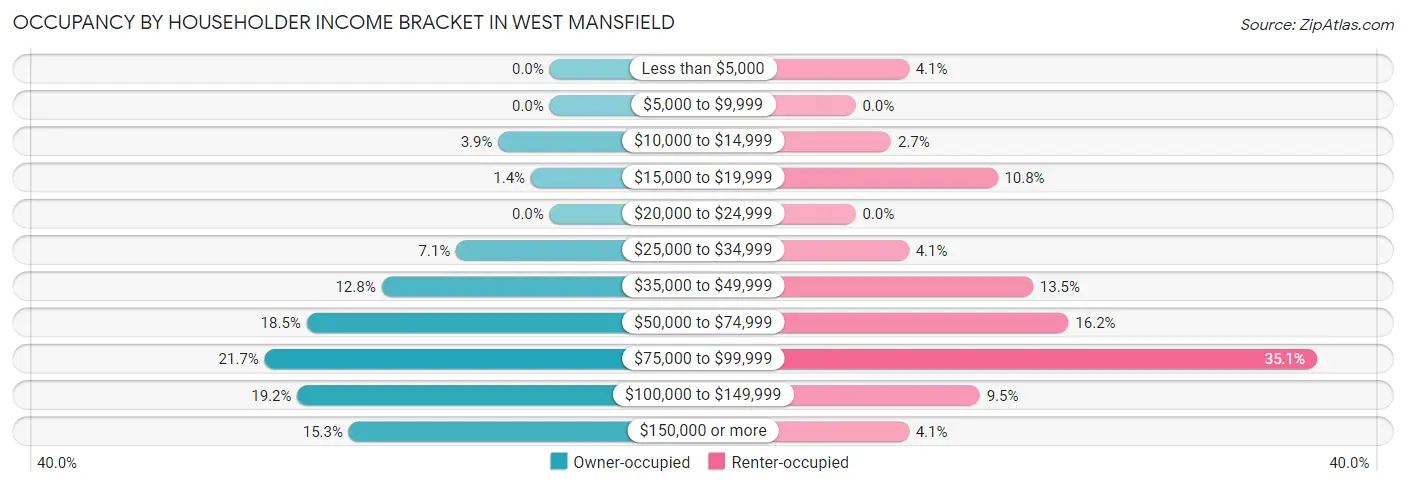
| Income Bracket | Owner-occupied | Renter-occupied |
| Less than $5,000 | 0 (0.0%) | 3 (4.1%) |
| $5,000 to $9,999 | 0 (0.0%) | 0 (0.0%) |
| $10,000 to $14,999 | 11 (3.9%) | 2 (2.7%) |
| $15,000 to $19,999 | 4 (1.4%) | 8 (10.8%) |
| $20,000 to $24,999 | 0 (0.0%) | 0 (0.0%) |
| $25,000 to $34,999 | 20 (7.1%) | 3 (4.1%) |
| $35,000 to $49,999 | 36 (12.8%) | 10 (13.5%) |
| $50,000 to $74,999 | 52 (18.5%) | 12 (16.2%) |
| $75,000 to $99,999 | 61 (21.7%) | 26 (35.1%) |
| $100,000 to $149,999 | 54 (19.2%) | 7 (9.5%) |
| $150,000 or more | 43 (15.3%) | 3 (4.1%) |
| Total | 281 (100.0%) | 74 (100.0%) |
Monthly Housing Cost Tiers in West Mansfield
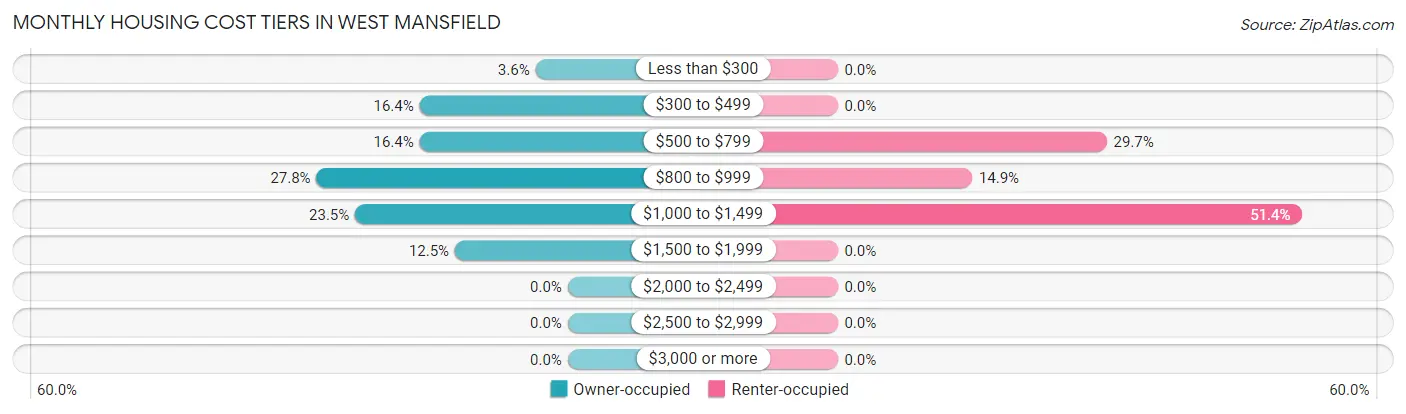
| Monthly Cost | Owner-occupied | Renter-occupied |
| Less than $300 | 10 (3.6%) | 0 (0.0%) |
| $300 to $499 | 46 (16.4%) | 0 (0.0%) |
| $500 to $799 | 46 (16.4%) | 22 (29.7%) |
| $800 to $999 | 78 (27.8%) | 11 (14.9%) |
| $1,000 to $1,499 | 66 (23.5%) | 38 (51.3%) |
| $1,500 to $1,999 | 35 (12.5%) | 0 (0.0%) |
| $2,000 to $2,499 | 0 (0.0%) | 0 (0.0%) |
| $2,500 to $2,999 | 0 (0.0%) | 0 (0.0%) |
| $3,000 or more | 0 (0.0%) | 0 (0.0%) |
| Total | 281 (100.0%) | 74 (100.0%) |
Physical Housing Characteristics in West Mansfield
Housing Structures in West Mansfield
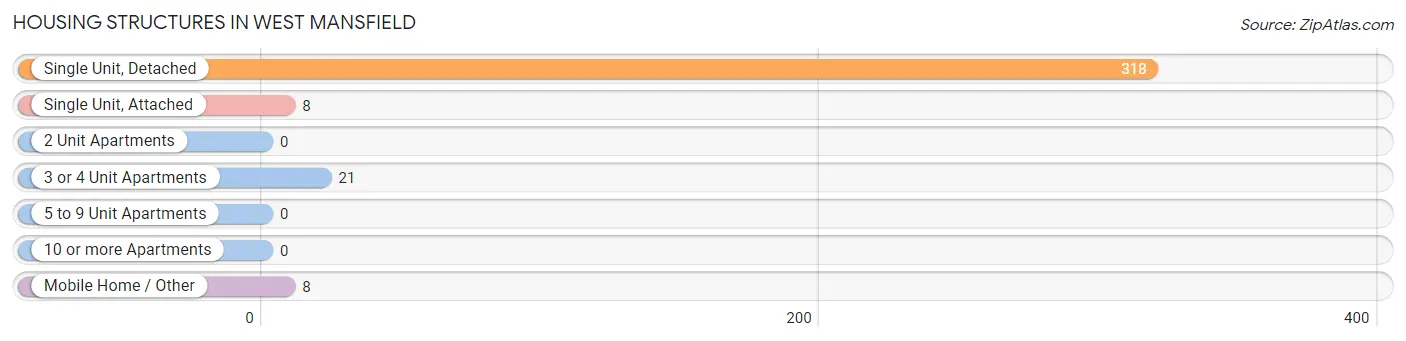
| Structure Type | # Housing Units | % Housing Units |
| Single Unit, Detached | 318 | 89.6% |
| Single Unit, Attached | 8 | 2.2% |
| 2 Unit Apartments | 0 | 0.0% |
| 3 or 4 Unit Apartments | 21 | 5.9% |
| 5 to 9 Unit Apartments | 0 | 0.0% |
| 10 or more Apartments | 0 | 0.0% |
| Mobile Home / Other | 8 | 2.2% |
| Total | 355 | 100.0% |
Housing Structures by Occupancy in West Mansfield
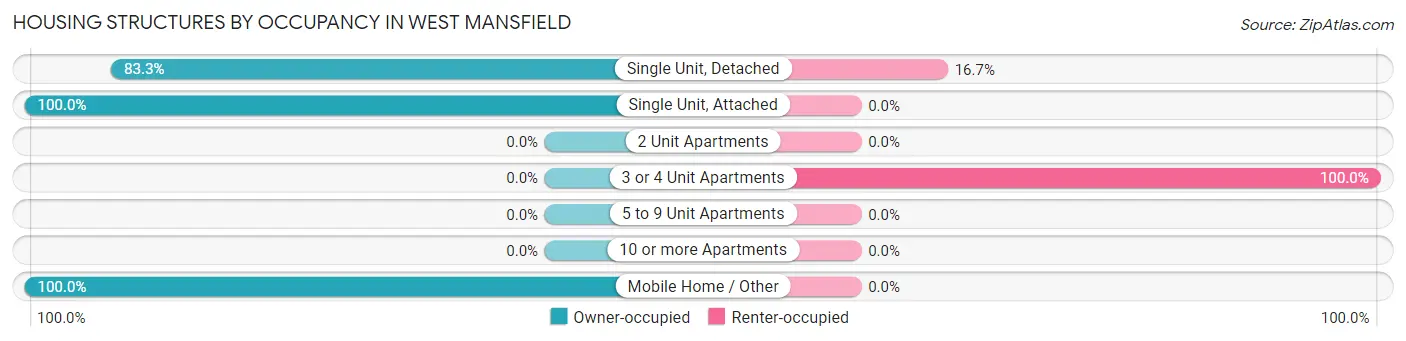
| Structure Type | Owner-occupied | Renter-occupied |
| Single Unit, Detached | 265 (83.3%) | 53 (16.7%) |
| Single Unit, Attached | 8 (100.0%) | 0 (0.0%) |
| 2 Unit Apartments | 0 (0.0%) | 0 (0.0%) |
| 3 or 4 Unit Apartments | 0 (0.0%) | 21 (100.0%) |
| 5 to 9 Unit Apartments | 0 (0.0%) | 0 (0.0%) |
| 10 or more Apartments | 0 (0.0%) | 0 (0.0%) |
| Mobile Home / Other | 8 (100.0%) | 0 (0.0%) |
| Total | 281 (79.1%) | 74 (20.8%) |
Housing Structures by Number of Rooms in West Mansfield
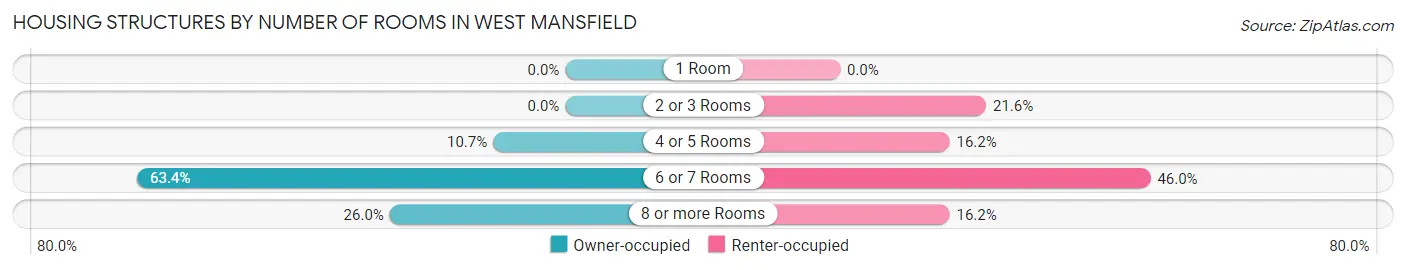
| Number of Rooms | Owner-occupied | Renter-occupied |
| 1 Room | 0 (0.0%) | 0 (0.0%) |
| 2 or 3 Rooms | 0 (0.0%) | 16 (21.6%) |
| 4 or 5 Rooms | 30 (10.7%) | 12 (16.2%) |
| 6 or 7 Rooms | 178 (63.3%) | 34 (46.0%) |
| 8 or more Rooms | 73 (26.0%) | 12 (16.2%) |
| Total | 281 (100.0%) | 74 (100.0%) |
Housing Structure by Heating Type in West Mansfield
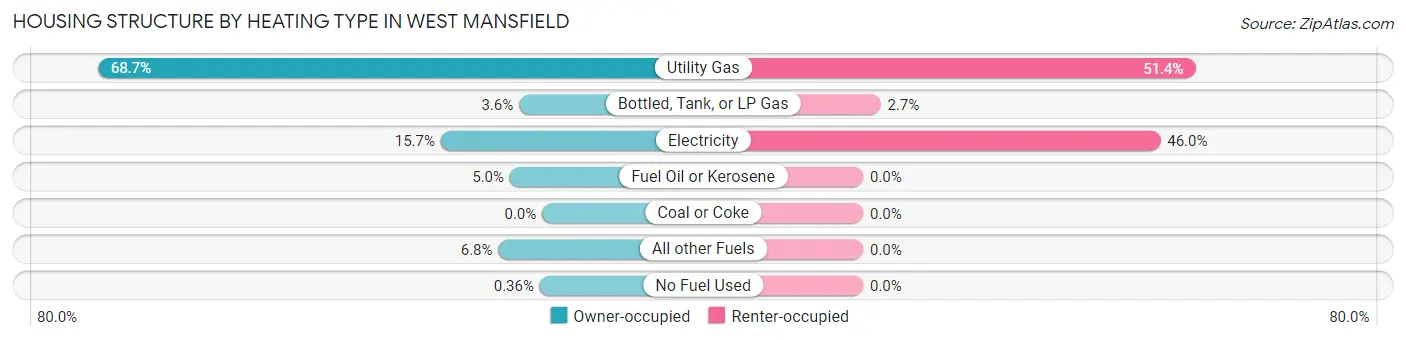
| Heating Type | Owner-occupied | Renter-occupied |
| Utility Gas | 193 (68.7%) | 38 (51.3%) |
| Bottled, Tank, or LP Gas | 10 (3.6%) | 2 (2.7%) |
| Electricity | 44 (15.7%) | 34 (46.0%) |
| Fuel Oil or Kerosene | 14 (5.0%) | 0 (0.0%) |
| Coal or Coke | 0 (0.0%) | 0 (0.0%) |
| All other Fuels | 19 (6.8%) | 0 (0.0%) |
| No Fuel Used | 1 (0.4%) | 0 (0.0%) |
| Total | 281 (100.0%) | 74 (100.0%) |
Household Vehicle Usage in West Mansfield
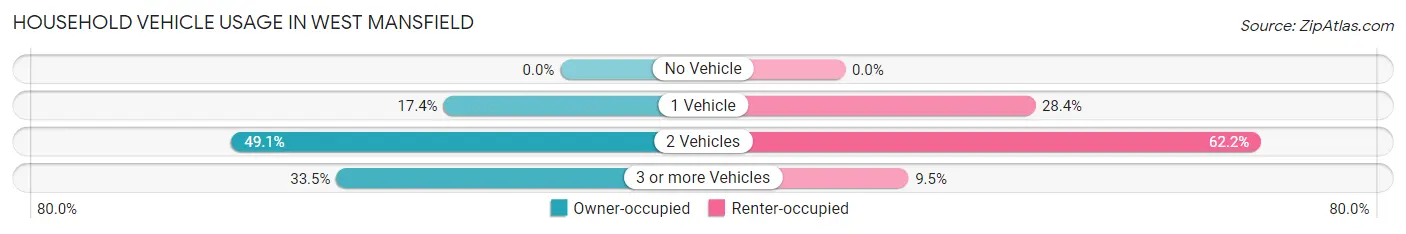
| Vehicles per Household | Owner-occupied | Renter-occupied |
| No Vehicle | 0 (0.0%) | 0 (0.0%) |
| 1 Vehicle | 49 (17.4%) | 21 (28.4%) |
| 2 Vehicles | 138 (49.1%) | 46 (62.2%) |
| 3 or more Vehicles | 94 (33.5%) | 7 (9.5%) |
| Total | 281 (100.0%) | 74 (100.0%) |
Real Estate & Mortgages in West Mansfield
Real Estate and Mortgage Overview in West Mansfield
| Characteristic | Without Mortgage | With Mortgage |
| Housing Units | 141 | 140 |
| Median Property Value | $151,800 | $134,900 |
| Median Household Income | $71,964 | $3 |
| Monthly Housing Costs | $619 | $0 |
| Real Estate Taxes | $1,467 | $0 |
Property Value by Mortgage Status in West Mansfield
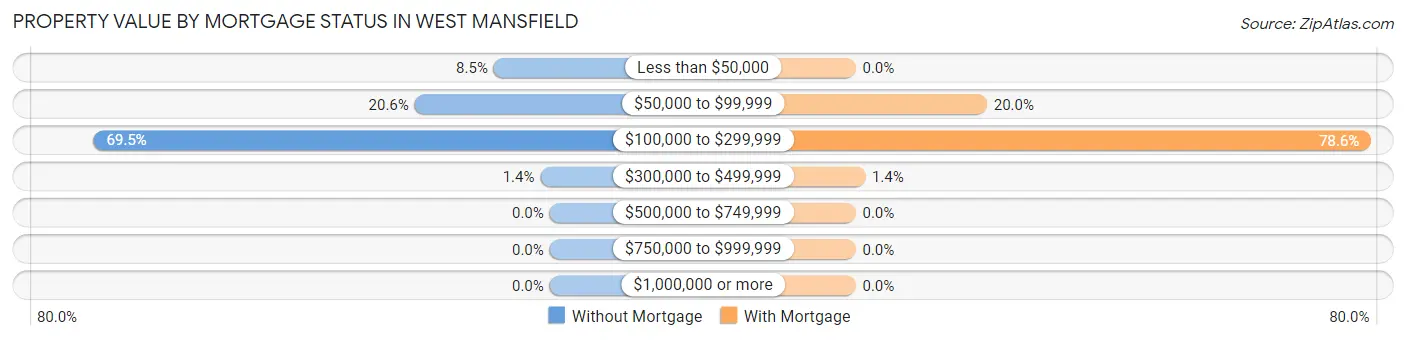
| Property Value | Without Mortgage | With Mortgage |
| Less than $50,000 | 12 (8.5%) | 0 (0.0%) |
| $50,000 to $99,999 | 29 (20.6%) | 28 (20.0%) |
| $100,000 to $299,999 | 98 (69.5%) | 110 (78.6%) |
| $300,000 to $499,999 | 2 (1.4%) | 2 (1.4%) |
| $500,000 to $749,999 | 0 (0.0%) | 0 (0.0%) |
| $750,000 to $999,999 | 0 (0.0%) | 0 (0.0%) |
| $1,000,000 or more | 0 (0.0%) | 0 (0.0%) |
| Total | 141 (100.0%) | 140 (100.0%) |
Household Income by Mortgage Status in West Mansfield
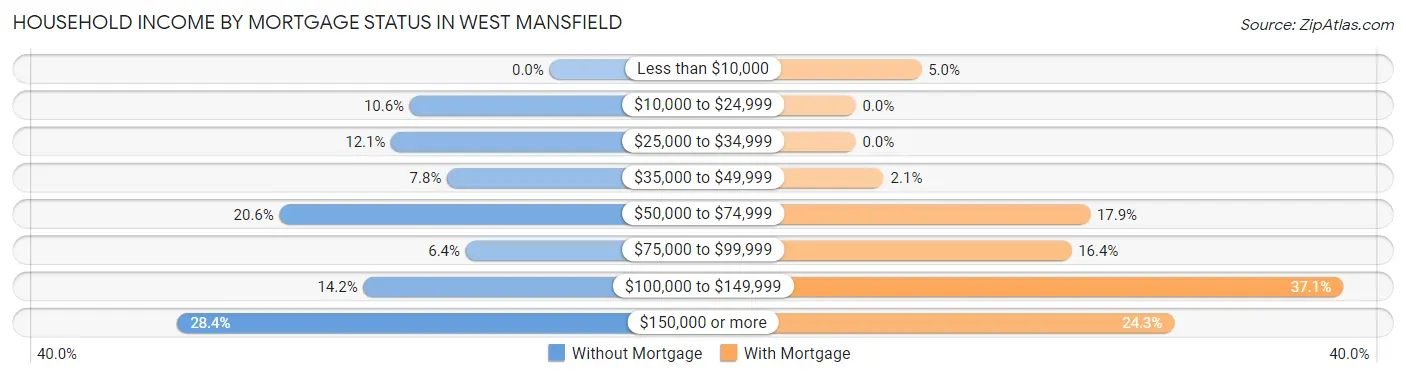
| Household Income | Without Mortgage | With Mortgage |
| Less than $10,000 | 0 (0.0%) | 7 (5.0%) |
| $10,000 to $24,999 | 15 (10.6%) | 0 (0.0%) |
| $25,000 to $34,999 | 17 (12.1%) | 0 (0.0%) |
| $35,000 to $49,999 | 11 (7.8%) | 3 (2.1%) |
| $50,000 to $74,999 | 29 (20.6%) | 25 (17.9%) |
| $75,000 to $99,999 | 9 (6.4%) | 23 (16.4%) |
| $100,000 to $149,999 | 20 (14.2%) | 52 (37.1%) |
| $150,000 or more | 40 (28.4%) | 34 (24.3%) |
| Total | 141 (100.0%) | 140 (100.0%) |
Property Value to Household Income Ratio in West Mansfield
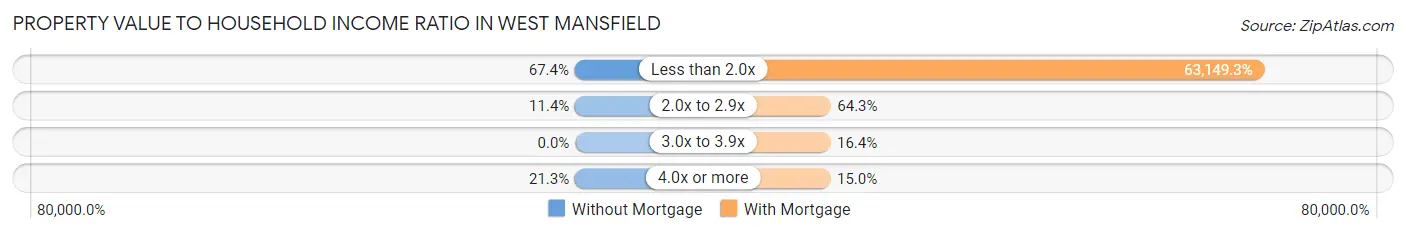
| Value-to-Income Ratio | Without Mortgage | With Mortgage |
| Less than 2.0x | 95 (67.4%) | 88,409 (63,149.3%) |
| 2.0x to 2.9x | 16 (11.4%) | 90 (64.3%) |
| 3.0x to 3.9x | 0 (0.0%) | 23 (16.4%) |
| 4.0x or more | 30 (21.3%) | 21 (15.0%) |
| Total | 141 (100.0%) | 140 (100.0%) |
Real Estate Taxes by Mortgage Status in West Mansfield
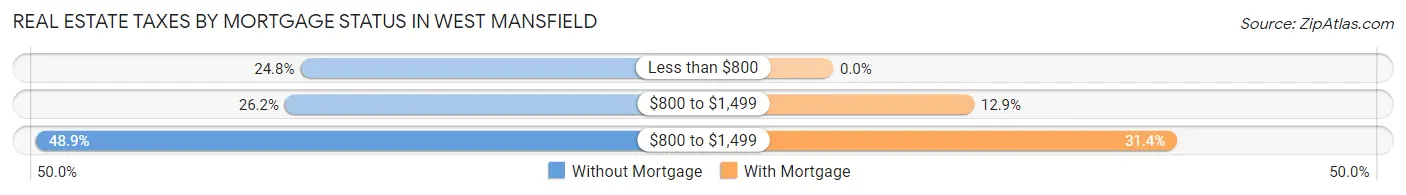
| Property Taxes | Without Mortgage | With Mortgage |
| Less than $800 | 35 (24.8%) | 0 (0.0%) |
| $800 to $1,499 | 37 (26.2%) | 18 (12.9%) |
| $800 to $1,499 | 69 (48.9%) | 44 (31.4%) |
| Total | 141 (100.0%) | 140 (100.0%) |
Health & Disability in West Mansfield
Health Insurance Coverage by Age in West Mansfield
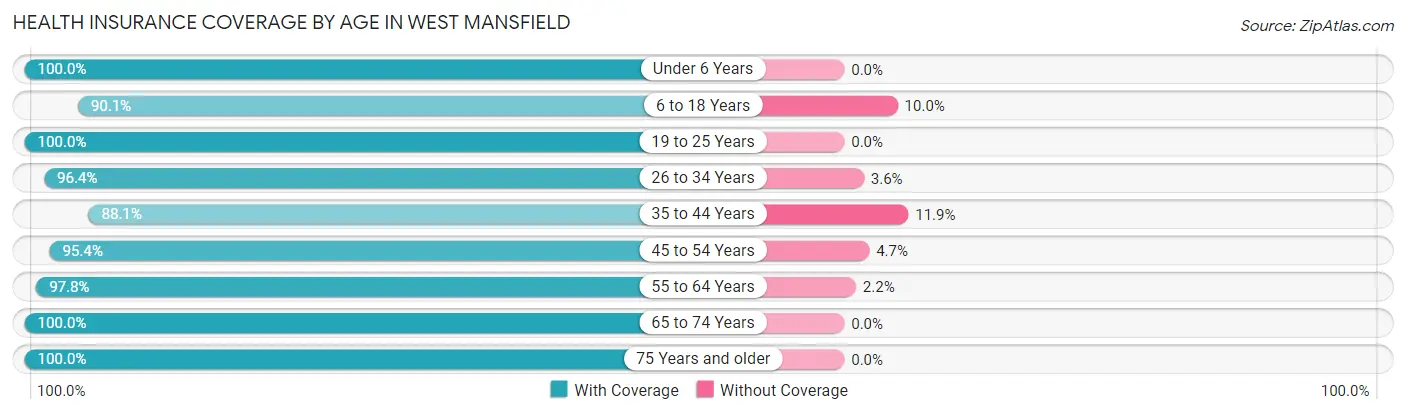
| Age Bracket | With Coverage | Without Coverage |
| Under 6 Years | 48 (100.0%) | 0 (0.0%) |
| 6 to 18 Years | 172 (90.0%) | 19 (10.0%) |
| 19 to 25 Years | 74 (100.0%) | 0 (0.0%) |
| 26 to 34 Years | 106 (96.4%) | 4 (3.6%) |
| 35 to 44 Years | 96 (88.1%) | 13 (11.9%) |
| 45 to 54 Years | 82 (95.4%) | 4 (4.6%) |
| 55 to 64 Years | 135 (97.8%) | 3 (2.2%) |
| 65 to 74 Years | 61 (100.0%) | 0 (0.0%) |
| 75 Years and older | 63 (100.0%) | 0 (0.0%) |
| Total | 837 (95.1%) | 43 (4.9%) |
Health Insurance Coverage by Citizenship Status in West Mansfield
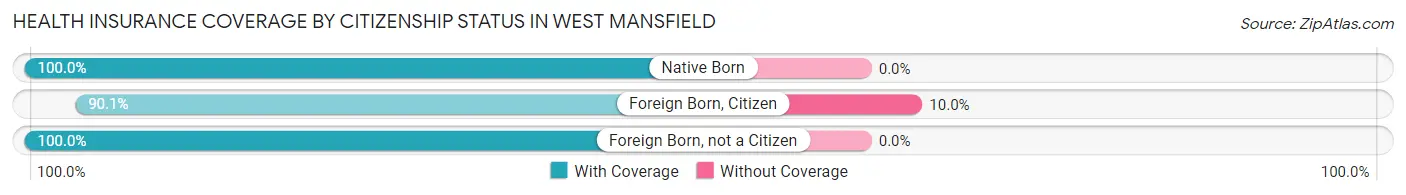
| Citizenship Status | With Coverage | Without Coverage |
| Native Born | 48 (100.0%) | 0 (0.0%) |
| Foreign Born, Citizen | 172 (90.0%) | 19 (10.0%) |
| Foreign Born, not a Citizen | 74 (100.0%) | 0 (0.0%) |
Health Insurance Coverage by Household Income in West Mansfield
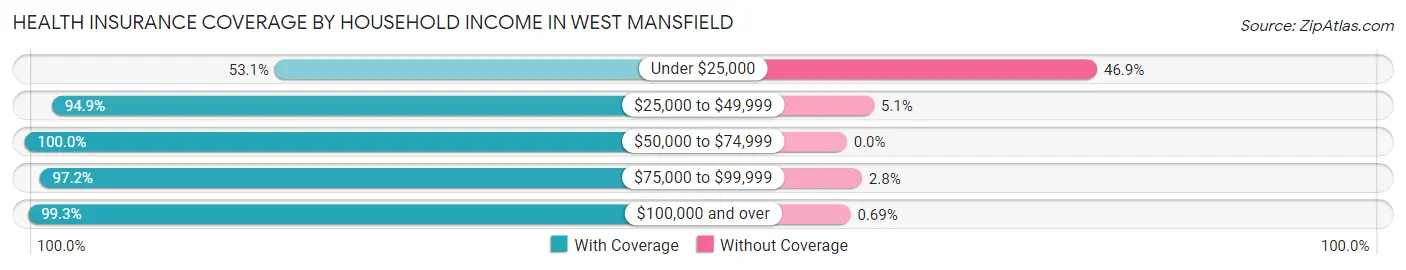
| Household Income | With Coverage | Without Coverage |
| Under $25,000 | 34 (53.1%) | 30 (46.9%) |
| $25,000 to $49,999 | 93 (94.9%) | 5 (5.1%) |
| $50,000 to $74,999 | 216 (100.0%) | 0 (0.0%) |
| $75,000 to $99,999 | 206 (97.2%) | 6 (2.8%) |
| $100,000 and over | 288 (99.3%) | 2 (0.7%) |
Public vs Private Health Insurance Coverage by Age in West Mansfield
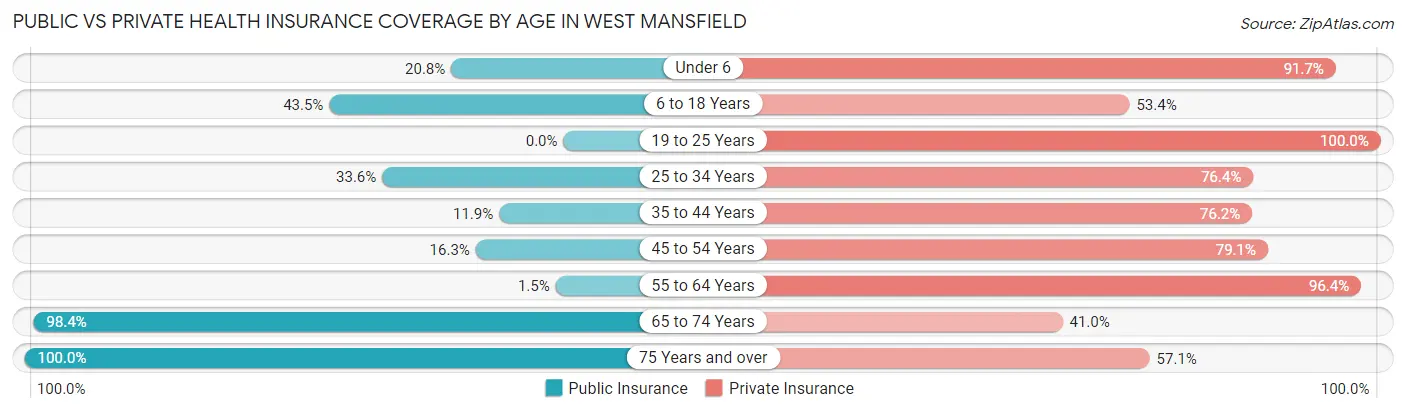
| Age Bracket | Public Insurance | Private Insurance |
| Under 6 | 10 (20.8%) | 44 (91.7%) |
| 6 to 18 Years | 83 (43.5%) | 102 (53.4%) |
| 19 to 25 Years | 0 (0.0%) | 74 (100.0%) |
| 25 to 34 Years | 37 (33.6%) | 84 (76.4%) |
| 35 to 44 Years | 13 (11.9%) | 83 (76.1%) |
| 45 to 54 Years | 14 (16.3%) | 68 (79.1%) |
| 55 to 64 Years | 2 (1.5%) | 133 (96.4%) |
| 65 to 74 Years | 60 (98.4%) | 25 (41.0%) |
| 75 Years and over | 63 (100.0%) | 36 (57.1%) |
| Total | 282 (32.1%) | 649 (73.8%) |
Disability Status by Sex by Age in West Mansfield
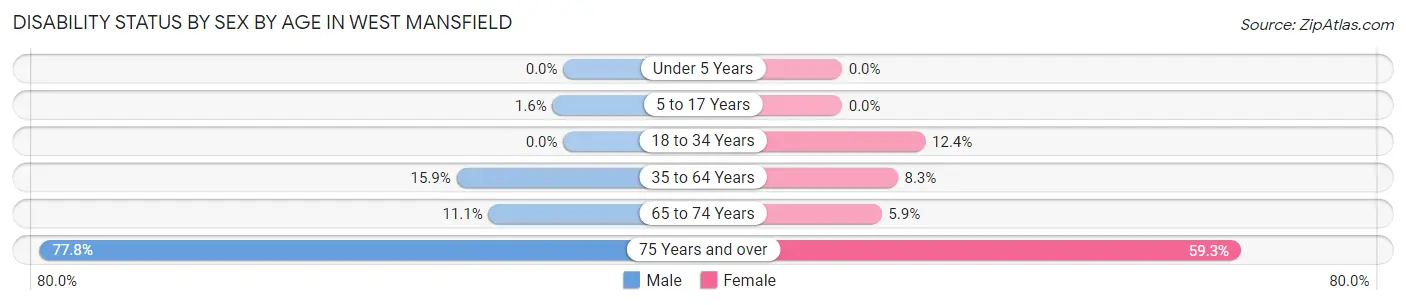
| Age Bracket | Male | Female |
| Under 5 Years | 0 (0.0%) | 0 (0.0%) |
| 5 to 17 Years | 2 (1.6%) | 0 (0.0%) |
| 18 to 34 Years | 0 (0.0%) | 12 (12.4%) |
| 35 to 64 Years | 26 (15.9%) | 14 (8.3%) |
| 65 to 74 Years | 3 (11.1%) | 2 (5.9%) |
| 75 Years and over | 7 (77.8%) | 32 (59.3%) |
Disability Class by Sex by Age in West Mansfield
Disability Class: Hearing Difficulty
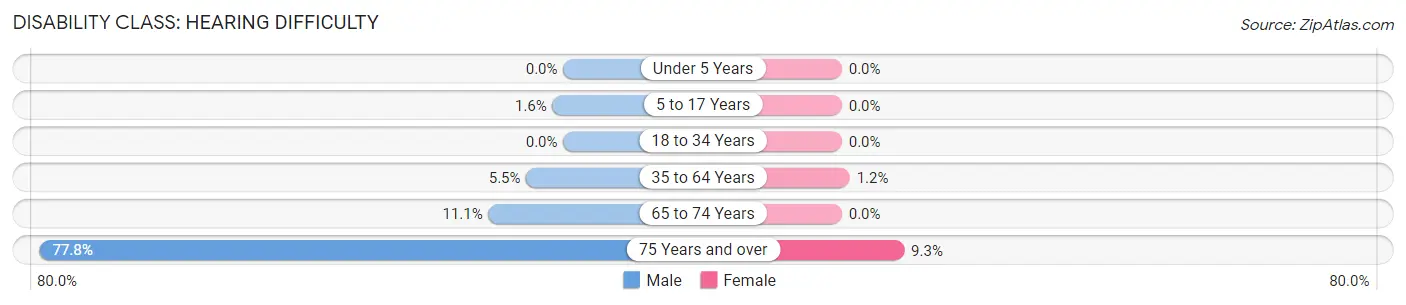
| Age Bracket | Male | Female |
| Under 5 Years | 0 (0.0%) | 0 (0.0%) |
| 5 to 17 Years | 2 (1.6%) | 0 (0.0%) |
| 18 to 34 Years | 0 (0.0%) | 0 (0.0%) |
| 35 to 64 Years | 9 (5.5%) | 2 (1.2%) |
| 65 to 74 Years | 3 (11.1%) | 0 (0.0%) |
| 75 Years and over | 7 (77.8%) | 5 (9.3%) |
Disability Class: Vision Difficulty
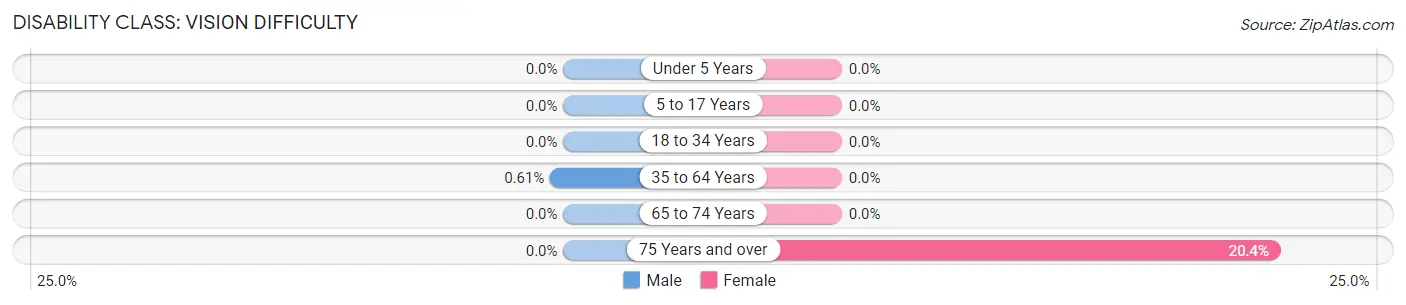
| Age Bracket | Male | Female |
| Under 5 Years | 0 (0.0%) | 0 (0.0%) |
| 5 to 17 Years | 0 (0.0%) | 0 (0.0%) |
| 18 to 34 Years | 0 (0.0%) | 0 (0.0%) |
| 35 to 64 Years | 1 (0.6%) | 0 (0.0%) |
| 65 to 74 Years | 0 (0.0%) | 0 (0.0%) |
| 75 Years and over | 0 (0.0%) | 11 (20.4%) |
Disability Class: Cognitive Difficulty
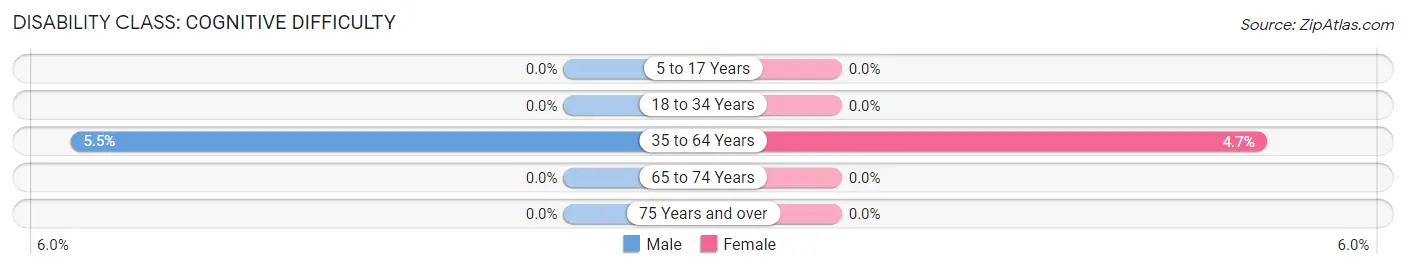
| Age Bracket | Male | Female |
| 5 to 17 Years | 0 (0.0%) | 0 (0.0%) |
| 18 to 34 Years | 0 (0.0%) | 0 (0.0%) |
| 35 to 64 Years | 9 (5.5%) | 8 (4.7%) |
| 65 to 74 Years | 0 (0.0%) | 0 (0.0%) |
| 75 Years and over | 0 (0.0%) | 0 (0.0%) |
Disability Class: Ambulatory Difficulty
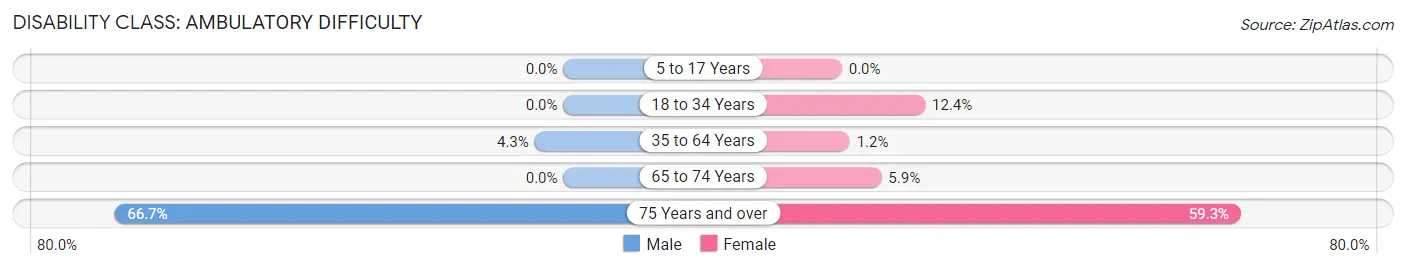
| Age Bracket | Male | Female |
| 5 to 17 Years | 0 (0.0%) | 0 (0.0%) |
| 18 to 34 Years | 0 (0.0%) | 12 (12.4%) |
| 35 to 64 Years | 7 (4.3%) | 2 (1.2%) |
| 65 to 74 Years | 0 (0.0%) | 2 (5.9%) |
| 75 Years and over | 6 (66.7%) | 32 (59.3%) |
Disability Class: Self-Care Difficulty
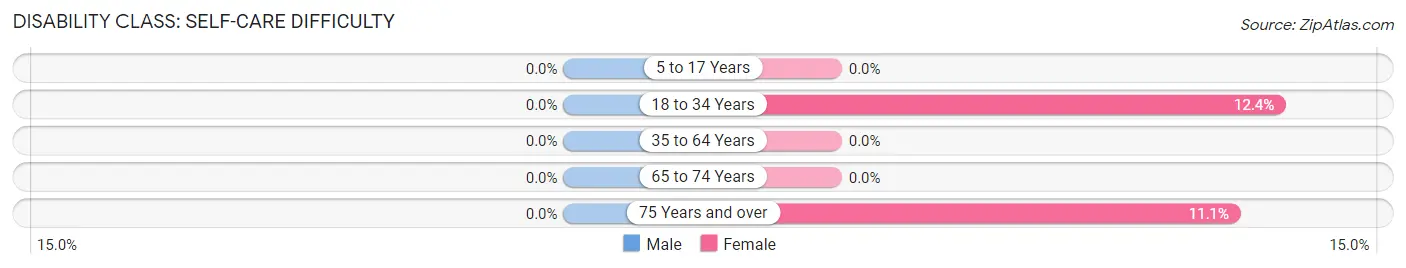
| Age Bracket | Male | Female |
| 5 to 17 Years | 0 (0.0%) | 0 (0.0%) |
| 18 to 34 Years | 0 (0.0%) | 12 (12.4%) |
| 35 to 64 Years | 0 (0.0%) | 0 (0.0%) |
| 65 to 74 Years | 0 (0.0%) | 0 (0.0%) |
| 75 Years and over | 0 (0.0%) | 6 (11.1%) |
Technology Access in West Mansfield
Computing Device Access in West Mansfield
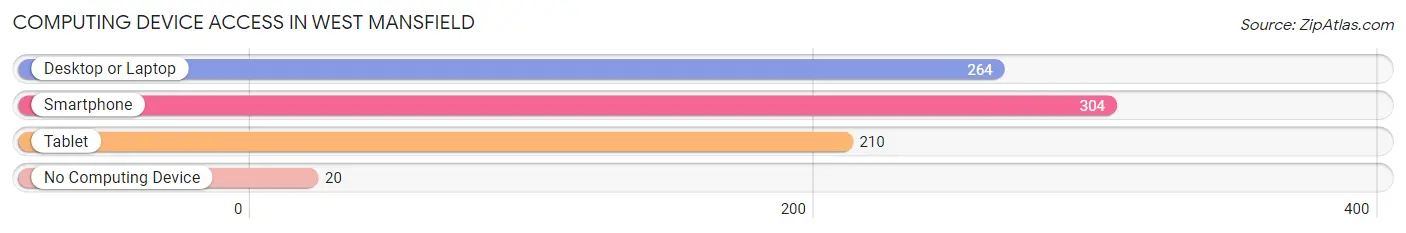
| Device Type | # Households | % Households |
| Desktop or Laptop | 264 | 74.4% |
| Smartphone | 304 | 85.6% |
| Tablet | 210 | 59.2% |
| No Computing Device | 20 | 5.6% |
| Total | 355 | 100.0% |
Internet Access in West Mansfield
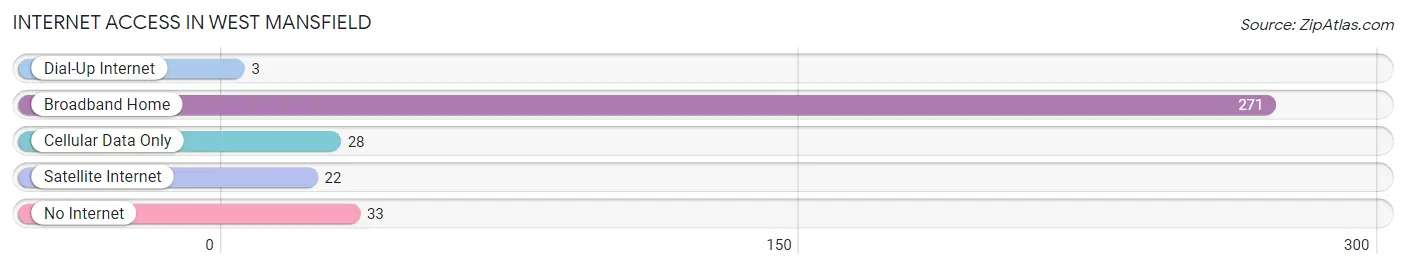
| Internet Type | # Households | % Households |
| Dial-Up Internet | 3 | 0.9% |
| Broadband Home | 271 | 76.3% |
| Cellular Data Only | 28 | 7.9% |
| Satellite Internet | 22 | 6.2% |
| No Internet | 33 | 9.3% |
| Total | 355 | 100.0% |
West Mansfield Summary
History
West Mansfield, Ohio is a small village located in Union County, Ohio. It is situated on the western edge of the county, just south of the city of Marysville. The village was founded in 1835 by a group of settlers from Mansfield, Ohio, who were looking for a place to settle and start a new life. The village was originally known as West Mansfield, but the name was changed to West Liberty in 1837.
The village was a small farming community for many years, but in the late 19th century, it began to grow and develop. The first industry to come to the village was a sawmill, which was built in 1876. This sawmill provided the village with much-needed jobs and helped to spur economic growth.
In the early 20th century, West Mansfield began to experience a period of growth and development. The village was incorporated in 1908 and the first mayor was elected in 1909. During this time, the village saw the construction of several new businesses, including a bank, a hotel, a general store, and a post office.
The village continued to grow and develop throughout the 20th century. In the 1950s, the village was home to a number of manufacturing plants, including a paper mill, a furniture factory, and a canning factory. These factories provided jobs for many of the residents of West Mansfield and helped to spur economic growth.
In the late 20th century, the village began to experience a period of decline. Many of the factories closed and the population began to decline. However, in recent years, the village has seen a resurgence in growth and development. The village is now home to a number of businesses, including a grocery store, a hardware store, and a restaurant.
Geography
West Mansfield is located in Union County, Ohio. It is situated on the western edge of the county, just south of the city of Marysville. The village is located on the banks of the Big Darby Creek, which flows through the village. The village is surrounded by rolling hills and farmland.
The village covers an area of 0.6 square miles and has a population of approximately 1,000 people. The village is located approximately 25 miles northwest of Columbus, Ohio and is accessible by State Route 4.
Economy
West Mansfield is a small village with a population of approximately 1,000 people. The village is home to a number of businesses, including a grocery store, a hardware store, and a restaurant. The village is also home to a number of manufacturing plants, including a paper mill, a furniture factory, and a canning factory.
The village is also home to a number of agricultural businesses, including a dairy farm, a grain elevator, and a feed mill. These businesses provide jobs for many of the residents of West Mansfield and help to spur economic growth.
Demographics
As of the 2010 census, the population of West Mansfield was 1,000 people. The racial makeup of the village was 97.2% White, 0.7% African American, 0.2% Native American, 0.2% Asian, 0.2% from other races, and 1.7% from two or more races. Hispanic or Latino of any race were 0.7% of the population.
The median household income in West Mansfield was $45,000, and the median family income was $50,000. The per capita income for the village was $20,000. About 8.3% of families and 10.2% of the population were below the poverty line, including 14.3% of those under age 18 and none of those age 65 or over.
Common Questions
What is Per Capita Income in West Mansfield?
Per Capita income in West Mansfield is $36,332.
What is the Median Family Income in West Mansfield?
Median Family Income in West Mansfield is $88,636.
What is the Median Household income in West Mansfield?
Median Household Income in West Mansfield is $83,173.
What is Income or Wage Gap in West Mansfield?
Income or Wage Gap in West Mansfield is 22.5%.
Women in West Mansfield earn 77.5 cents for every dollar earned by a man.
What is Inequality or Gini Index in West Mansfield?
Inequality or Gini Index in West Mansfield is 0.36.
What is the Total Population of West Mansfield?
Total Population of West Mansfield is 882.
What is the Total Male Population of West Mansfield?
Total Male Population of West Mansfield is 447.
What is the Total Female Population of West Mansfield?
Total Female Population of West Mansfield is 435.
What is the Ratio of Males per 100 Females in West Mansfield?
There are 102.76 Males per 100 Females in West Mansfield.
What is the Ratio of Females per 100 Males in West Mansfield?
There are 97.32 Females per 100 Males in West Mansfield.
What is the Median Population Age in West Mansfield?
Median Population Age in West Mansfield is 36.1 Years.
What is the Average Family Size in West Mansfield
Average Family Size in West Mansfield is 2.8 People.
What is the Average Household Size in West Mansfield
Average Household Size in West Mansfield is 2.5 People.
How Large is the Labor Force in West Mansfield?
There are 477 People in the Labor Forcein in West Mansfield.
What is the Percentage of People in the Labor Force in West Mansfield?
70.3% of People are in the Labor Force in West Mansfield.
What is the Unemployment Rate in West Mansfield?
Unemployment Rate in West Mansfield is 6.7%.