Mount Vernon, OH Map & Demographics
Mount Vernon Map
Mount Vernon Overview
$29,548
PER CAPITA INCOME
$65,325
AVG FAMILY INCOME
$52,286
AVG HOUSEHOLD INCOME
25.7%
WAGE / INCOME GAP [ % ]
74.3¢/ $1
WAGE / INCOME GAP [ $ ]
0.43
INEQUALITY / GINI INDEX
16,861
TOTAL POPULATION
7,890
MALE POPULATION
8,971
FEMALE POPULATION
87.95
MALES / 100 FEMALES
113.70
FEMALES / 100 MALES
40.5
MEDIAN AGE
2.9
AVG FAMILY SIZE
2.2
AVG HOUSEHOLD SIZE
8,237
LABOR FORCE [ PEOPLE ]
58.0%
PERCENT IN LABOR FORCE
3.3%
UNEMPLOYMENT RATE
Mount Vernon Zip Codes
Mount Vernon Area Codes
Income in Mount Vernon
Income Overview in Mount Vernon
Per Capita Income in Mount Vernon is $29,548, while median incomes of families and households are $65,325 and $52,286 respectively.
| Characteristic | Number | Measure |
| Per Capita Income | 16,861 | $29,548 |
| Median Family Income | 3,925 | $65,325 |
| Mean Family Income | 3,925 | $76,406 |
| Median Household Income | 7,181 | $52,286 |
| Mean Household Income | 7,181 | $67,260 |
| Income Deficit | 3,925 | $0 |
| Wage / Income Gap (%) | 16,861 | 25.66% |
| Wage / Income Gap ($) | 16,861 | 74.34¢ per $1 |
| Gini / Inequality Index | 16,861 | 0.43 |
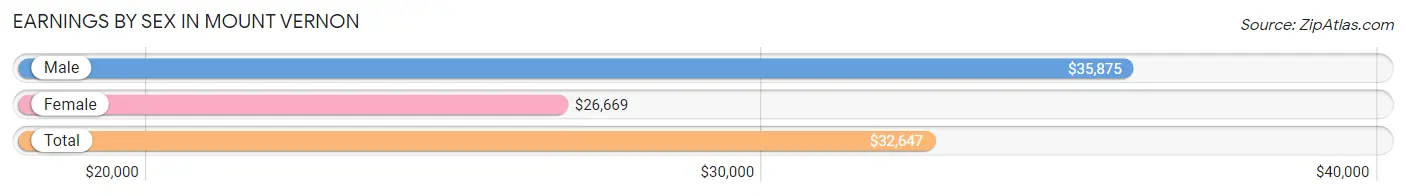
Earnings by Sex in Mount Vernon
Average Earnings in Mount Vernon are $32,647, $35,875 for men and $26,669 for women, a difference of 25.7%.
| Sex | Number | Average Earnings |
| Male | 4,540 (49.8%) | $35,875 |
| Female | 4,579 (50.2%) | $26,669 |
| Total | 9,119 (100.0%) | $32,647 |
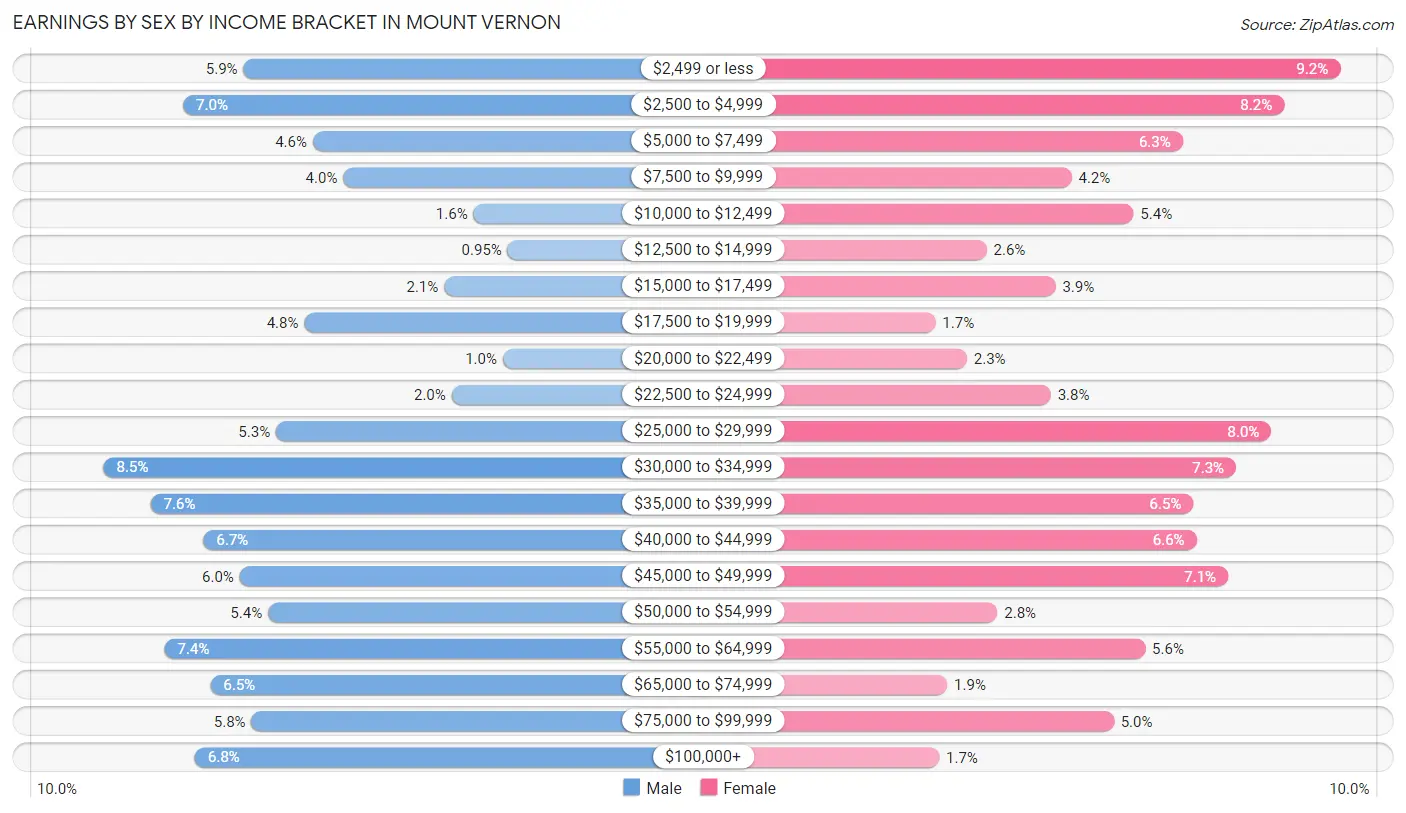
Earnings by Sex by Income Bracket in Mount Vernon
The most common earnings brackets in Mount Vernon are $30,000 to $34,999 for men (387 | 8.5%) and $2,499 or less for women (423 | 9.2%).
| Income | Male | Female |
| $2,499 or less | 268 (5.9%) | 423 (9.2%) |
| $2,500 to $4,999 | 319 (7.0%) | 375 (8.2%) |
| $5,000 to $7,499 | 209 (4.6%) | 288 (6.3%) |
| $7,500 to $9,999 | 183 (4.0%) | 193 (4.2%) |
| $10,000 to $12,499 | 72 (1.6%) | 246 (5.4%) |
| $12,500 to $14,999 | 43 (0.9%) | 120 (2.6%) |
| $15,000 to $17,499 | 97 (2.1%) | 179 (3.9%) |
| $17,500 to $19,999 | 216 (4.8%) | 76 (1.7%) |
| $20,000 to $22,499 | 47 (1.0%) | 103 (2.2%) |
| $22,500 to $24,999 | 91 (2.0%) | 175 (3.8%) |
| $25,000 to $29,999 | 240 (5.3%) | 364 (8.0%) |
| $30,000 to $34,999 | 387 (8.5%) | 334 (7.3%) |
| $35,000 to $39,999 | 347 (7.6%) | 297 (6.5%) |
| $40,000 to $44,999 | 302 (6.7%) | 300 (6.6%) |
| $45,000 to $49,999 | 271 (6.0%) | 327 (7.1%) |
| $50,000 to $54,999 | 247 (5.4%) | 129 (2.8%) |
| $55,000 to $64,999 | 335 (7.4%) | 256 (5.6%) |
| $65,000 to $74,999 | 296 (6.5%) | 86 (1.9%) |
| $75,000 to $99,999 | 261 (5.8%) | 229 (5.0%) |
| $100,000+ | 309 (6.8%) | 79 (1.7%) |
| Total | 4,540 (100.0%) | 4,579 (100.0%) |
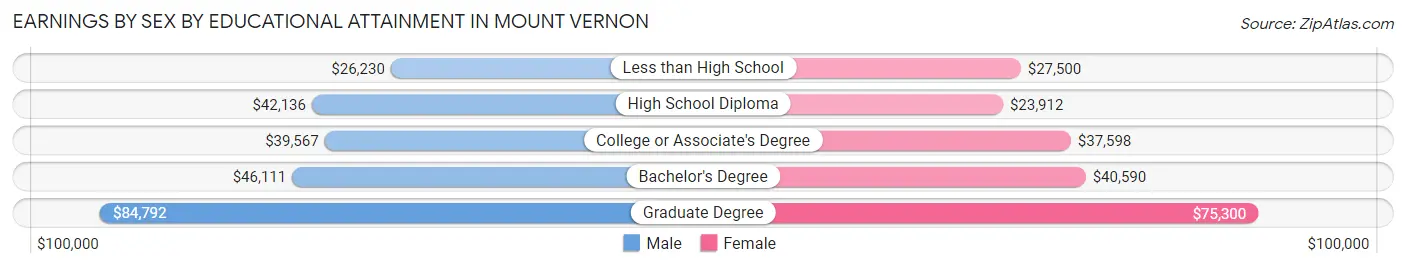
Earnings by Sex by Educational Attainment in Mount Vernon
Average earnings in Mount Vernon are $42,574 for men and $33,623 for women, a difference of 21.0%. Men with an educational attainment of graduate degree enjoy the highest average annual earnings of $84,792, while those with less than high school education earn the least with $26,230. Women with an educational attainment of graduate degree earn the most with the average annual earnings of $75,300, while those with high school diploma education have the smallest earnings of $23,912.
| Educational Attainment | Male Income | Female Income |
| Less than High School | $26,230 | $27,500 |
| High School Diploma | $42,136 | $23,912 |
| College or Associate's Degree | $39,567 | $37,598 |
| Bachelor's Degree | $46,111 | $40,590 |
| Graduate Degree | $84,792 | $75,300 |
| Total | $42,574 | $33,623 |
Family Income in Mount Vernon
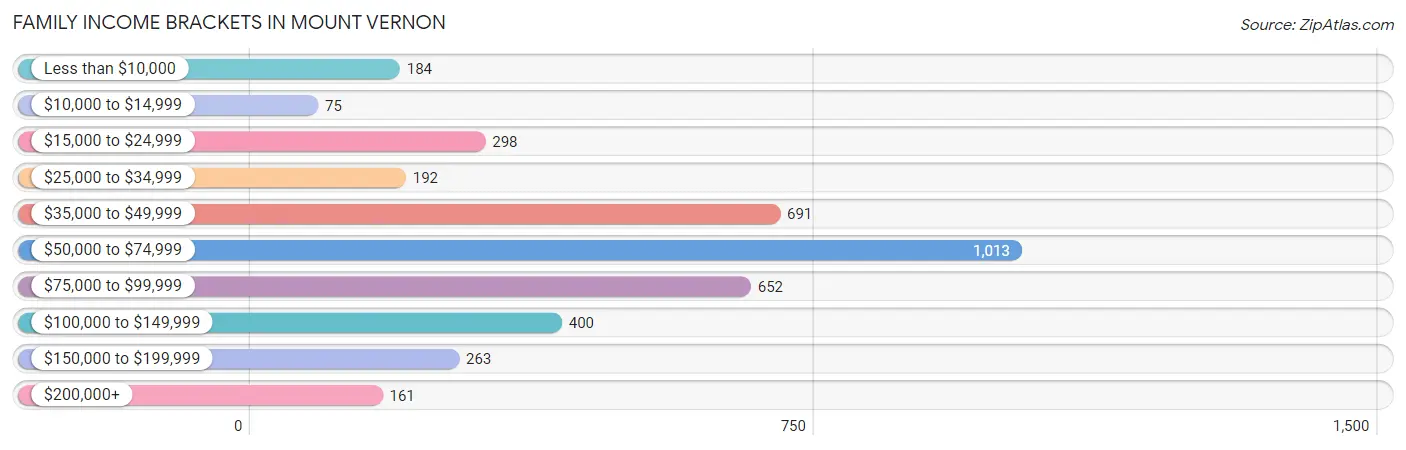
Family Income Brackets in Mount Vernon
According to the Mount Vernon family income data, there are 1,013 families falling into the $50,000 to $74,999 income range, which is the most common income bracket and makes up 25.8% of all families. Conversely, the $10,000 to $14,999 income bracket is the least frequent group with only 75 families (1.9%) belonging to this category.
| Income Bracket | # Families | % Families |
| Less than $10,000 | 184 | 4.7% |
| $10,000 to $14,999 | 75 | 1.9% |
| $15,000 to $24,999 | 298 | 7.6% |
| $25,000 to $34,999 | 192 | 4.9% |
| $35,000 to $49,999 | 691 | 17.6% |
| $50,000 to $74,999 | 1,013 | 25.8% |
| $75,000 to $99,999 | 652 | 16.6% |
| $100,000 to $149,999 | 400 | 10.2% |
| $150,000 to $199,999 | 263 | 6.7% |
| $200,000+ | 161 | 4.1% |
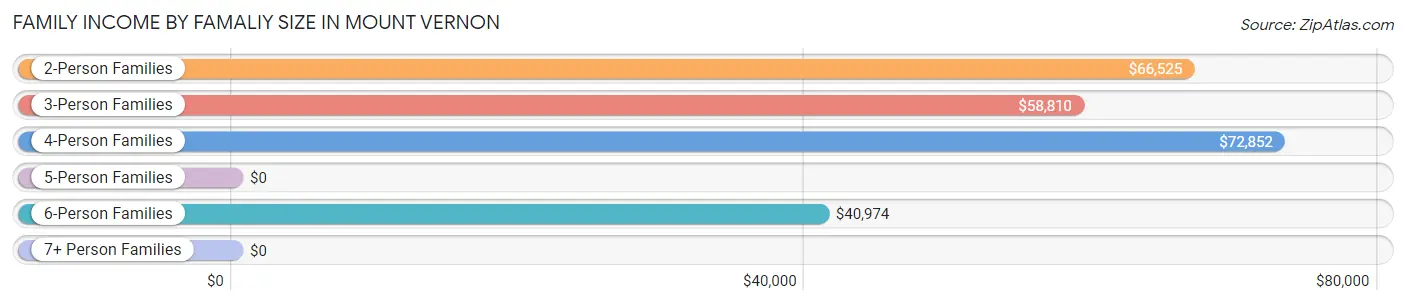
Family Income by Famaliy Size in Mount Vernon
4-person families (600 | 15.3%) account for the highest median family income in Mount Vernon with $72,852 per family, while 2-person families (2,227 | 56.7%) have the highest median income of $33,262 per family member.
| Income Bracket | # Families | Median Income |
| 2-Person Families | 2,227 (56.7%) | $66,525 |
| 3-Person Families | 842 (21.4%) | $58,810 |
| 4-Person Families | 600 (15.3%) | $72,852 |
| 5-Person Families | 108 (2.8%) | $0 |
| 6-Person Families | 143 (3.6%) | $40,974 |
| 7+ Person Families | 5 (0.1%) | $0 |
| Total | 3,925 (100.0%) | $65,325 |
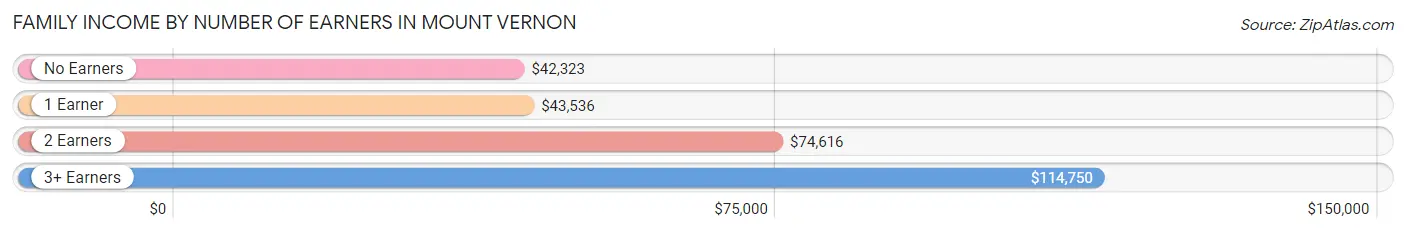
Family Income by Number of Earners in Mount Vernon
The median family income in Mount Vernon is $65,325, with families comprising 3+ earners (299) having the highest median family income of $114,750, while families with no earners (657) have the lowest median family income of $42,323, accounting for 7.6% and 16.7% of families, respectively.
| Number of Earners | # Families | Median Income |
| No Earners | 657 (16.7%) | $42,323 |
| 1 Earner | 1,256 (32.0%) | $43,536 |
| 2 Earners | 1,713 (43.6%) | $74,616 |
| 3+ Earners | 299 (7.6%) | $114,750 |
| Total | 3,925 (100.0%) | $65,325 |
Household Income in Mount Vernon
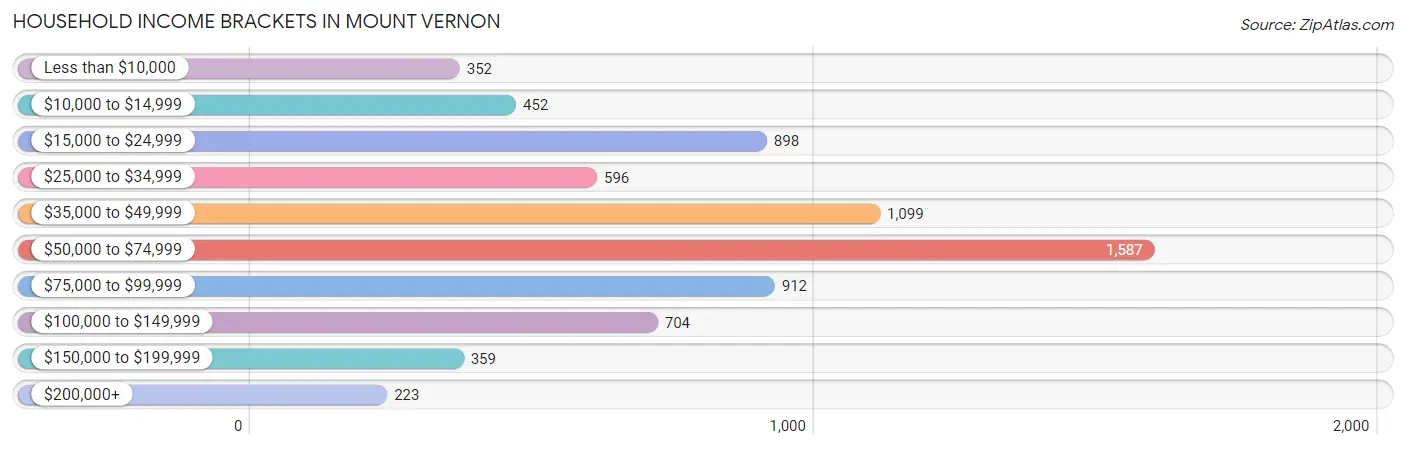
Household Income Brackets in Mount Vernon
With 1,587 households falling in the category, the $50,000 to $74,999 income range is the most frequent in Mount Vernon, accounting for 22.1% of all households. In contrast, only 223 households (3.1%) fall into the $200,000+ income bracket, making it the least populous group.
| Income Bracket | # Households | % Households |
| Less than $10,000 | 352 | 4.9% |
| $10,000 to $14,999 | 452 | 6.3% |
| $15,000 to $24,999 | 898 | 12.5% |
| $25,000 to $34,999 | 596 | 8.3% |
| $35,000 to $49,999 | 1,099 | 15.3% |
| $50,000 to $74,999 | 1,587 | 22.1% |
| $75,000 to $99,999 | 912 | 12.7% |
| $100,000 to $149,999 | 704 | 9.8% |
| $150,000 to $199,999 | 359 | 5.0% |
| $200,000+ | 223 | 3.1% |
Household Income by Householder Age in Mount Vernon
The median household income in Mount Vernon is $52,286, with the highest median household income of $60,702 found in the 25 to 44 years age bracket for the primary householder. A total of 2,048 households (28.5%) fall into this category. Meanwhile, the 15 to 24 years age bracket for the primary householder has the lowest median household income of $0, with 471 households (6.6%) in this group.
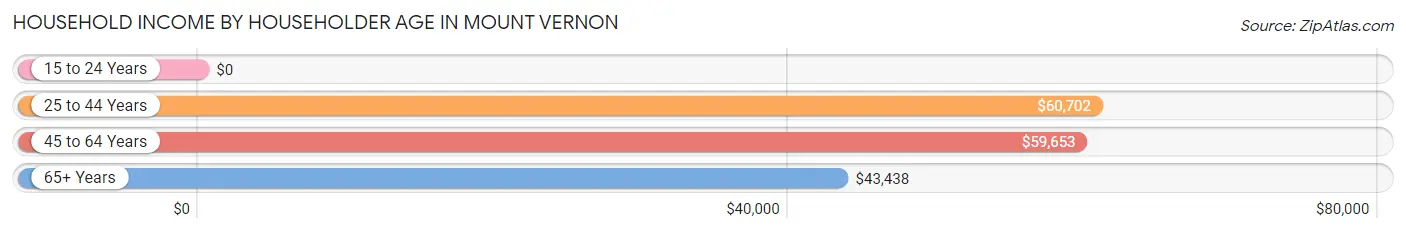
| Income Bracket | # Households | Median Income |
| 15 to 24 Years | 471 (6.6%) | $0 |
| 25 to 44 Years | 2,048 (28.5%) | $60,702 |
| 45 to 64 Years | 2,392 (33.3%) | $59,653 |
| 65+ Years | 2,270 (31.6%) | $43,438 |
| Total | 7,181 (100.0%) | $52,286 |
Poverty in Mount Vernon
Income Below Poverty by Sex and Age in Mount Vernon
With 15.9% poverty level for males and 23.8% for females among the residents of Mount Vernon, 12 to 14 year old males and under 5 year old females are the most vulnerable to poverty, with 153 males (49.8%) and 185 females (60.5%) in their respective age groups living below the poverty level.
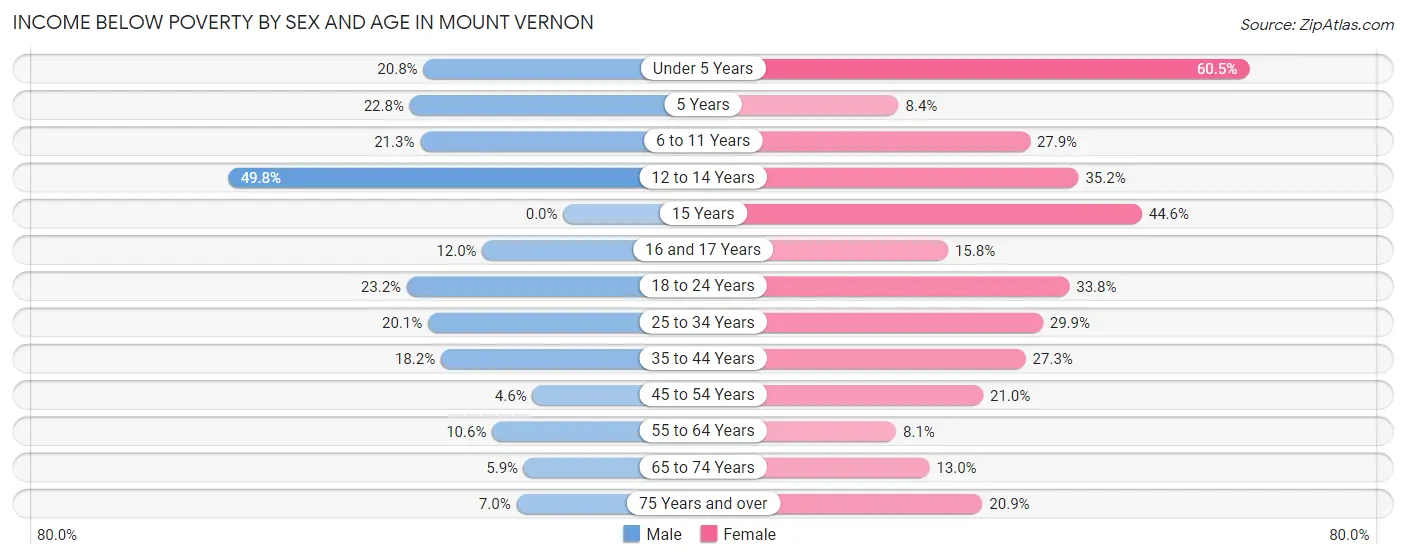
| Age Bracket | Male | Female |
| Under 5 Years | 80 (20.8%) | 185 (60.5%) |
| 5 Years | 13 (22.8%) | 7 (8.4%) |
| 6 to 11 Years | 122 (21.2%) | 76 (27.9%) |
| 12 to 14 Years | 153 (49.8%) | 142 (35.1%) |
| 15 Years | 0 (0.0%) | 94 (44.6%) |
| 16 and 17 Years | 31 (12.0%) | 47 (15.8%) |
| 18 to 24 Years | 181 (23.2%) | 152 (33.8%) |
| 25 to 34 Years | 159 (20.1%) | 286 (29.8%) |
| 35 to 44 Years | 219 (18.2%) | 315 (27.3%) |
| 45 to 54 Years | 32 (4.6%) | 240 (21.0%) |
| 55 to 64 Years | 102 (10.6%) | 75 (8.1%) |
| 65 to 74 Years | 46 (5.9%) | 133 (13.0%) |
| 75 Years and over | 38 (7.0%) | 204 (20.9%) |
| Total | 1,176 (15.9%) | 1,956 (23.8%) |
Income Above Poverty by Sex and Age in Mount Vernon
According to the poverty statistics in Mount Vernon, males aged 15 years and females aged 55 to 64 years are the age groups that are most secure financially, with 100.0% of males and 91.9% of females in these age groups living above the poverty line.
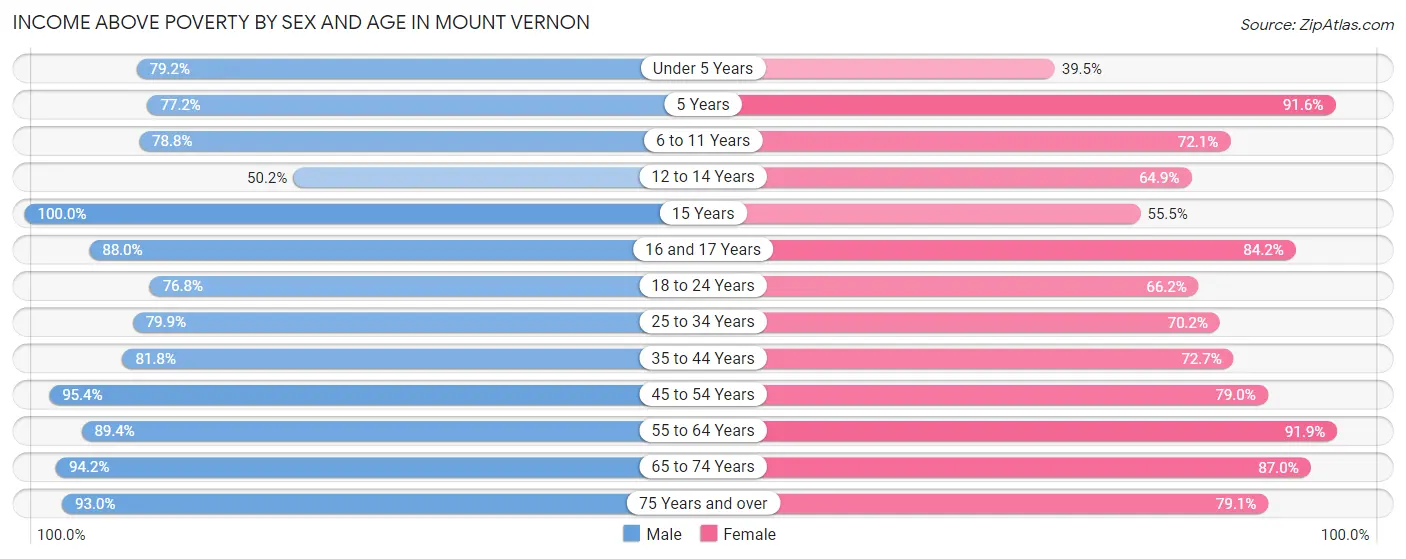
| Age Bracket | Male | Female |
| Under 5 Years | 305 (79.2%) | 121 (39.5%) |
| 5 Years | 44 (77.2%) | 76 (91.6%) |
| 6 to 11 Years | 452 (78.7%) | 196 (72.1%) |
| 12 to 14 Years | 154 (50.2%) | 262 (64.8%) |
| 15 Years | 58 (100.0%) | 117 (55.4%) |
| 16 and 17 Years | 227 (88.0%) | 251 (84.2%) |
| 18 to 24 Years | 598 (76.8%) | 298 (66.2%) |
| 25 to 34 Years | 633 (79.9%) | 672 (70.2%) |
| 35 to 44 Years | 986 (81.8%) | 839 (72.7%) |
| 45 to 54 Years | 666 (95.4%) | 904 (79.0%) |
| 55 to 64 Years | 864 (89.4%) | 856 (91.9%) |
| 65 to 74 Years | 740 (94.2%) | 889 (87.0%) |
| 75 Years and over | 508 (93.0%) | 773 (79.1%) |
| Total | 6,235 (84.1%) | 6,254 (76.2%) |
Income Below Poverty Among Married-Couple Families in Mount Vernon
The poverty statistics for married-couple families in Mount Vernon show that 7.1% or 195 of the total 2,754 families live below the poverty line. Families with 3 or 4 children have the highest poverty rate of 55.7%, comprising of 59 families. On the other hand, families with no children have the lowest poverty rate of 2.9%, which includes 52 families.
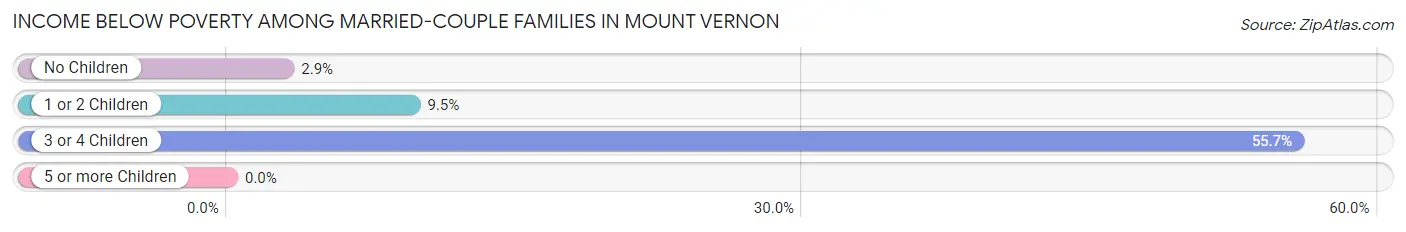
| Children | Above Poverty | Below Poverty |
| No Children | 1,715 (97.1%) | 52 (2.9%) |
| 1 or 2 Children | 797 (90.5%) | 84 (9.5%) |
| 3 or 4 Children | 47 (44.3%) | 59 (55.7%) |
| 5 or more Children | 0 (0.0%) | 0 (0.0%) |
| Total | 2,559 (92.9%) | 195 (7.1%) |
Income Below Poverty Among Single-Parent Households in Mount Vernon
According to the poverty data in Mount Vernon, 11.2% or 22 single-father households and 38.1% or 371 single-mother households are living below the poverty line. Among single-father households, those with 3 or 4 children have the highest poverty rate, with 21 households (100.0%) experiencing poverty. Likewise, among single-mother households, those with 3 or 4 children have the highest poverty rate, with 39 households (56.5%) falling below the poverty line.
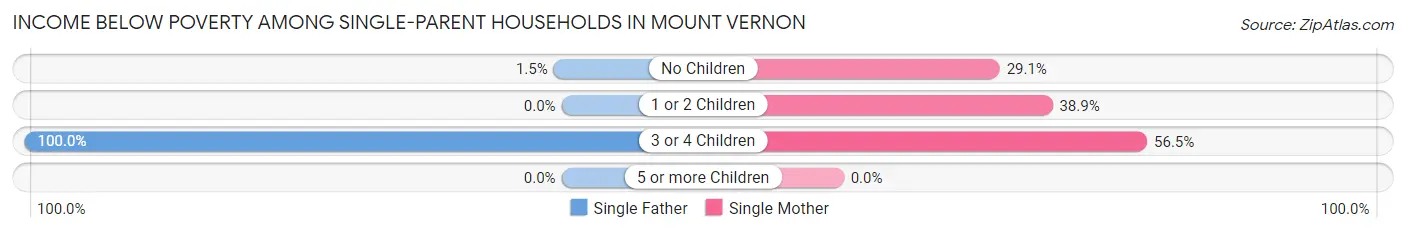
| Children | Single Father | Single Mother |
| No Children | 1 (1.5%) | 59 (29.1%) |
| 1 or 2 Children | 0 (0.0%) | 273 (38.9%) |
| 3 or 4 Children | 21 (100.0%) | 39 (56.5%) |
| 5 or more Children | 0 (0.0%) | 0 (0.0%) |
| Total | 22 (11.2%) | 371 (38.1%) |
Income Below Poverty Among Married-Couple vs Single-Parent Households in Mount Vernon
The poverty data for Mount Vernon shows that 195 of the married-couple family households (7.1%) and 393 of the single-parent households (33.6%) are living below the poverty level. Within the married-couple family households, those with 3 or 4 children have the highest poverty rate, with 59 households (55.7%) falling below the poverty line. Among the single-parent households, those with 3 or 4 children have the highest poverty rate, with 60 household (66.7%) living below poverty.
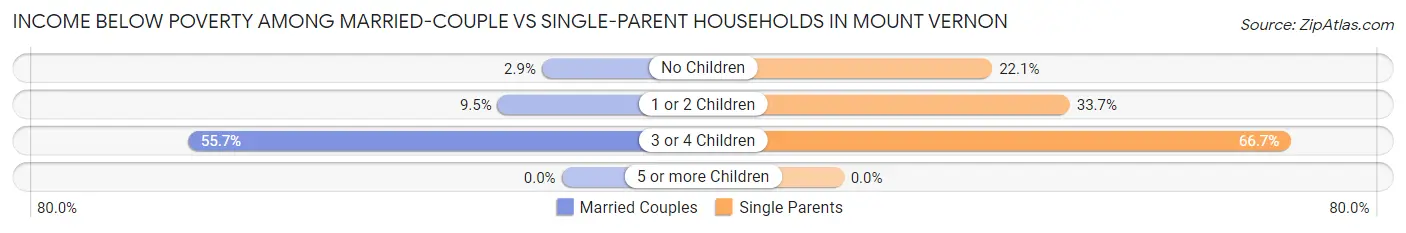
| Children | Married-Couple Families | Single-Parent Households |
| No Children | 52 (2.9%) | 60 (22.1%) |
| 1 or 2 Children | 84 (9.5%) | 273 (33.7%) |
| 3 or 4 Children | 59 (55.7%) | 60 (66.7%) |
| 5 or more Children | 0 (0.0%) | 0 (0.0%) |
| Total | 195 (7.1%) | 393 (33.6%) |
Race in Mount Vernon
The most populous races in Mount Vernon are White / Caucasian (15,307 | 90.8%), Two or more Races (772 | 4.6%), and Hispanic or Latino (592 | 3.5%).
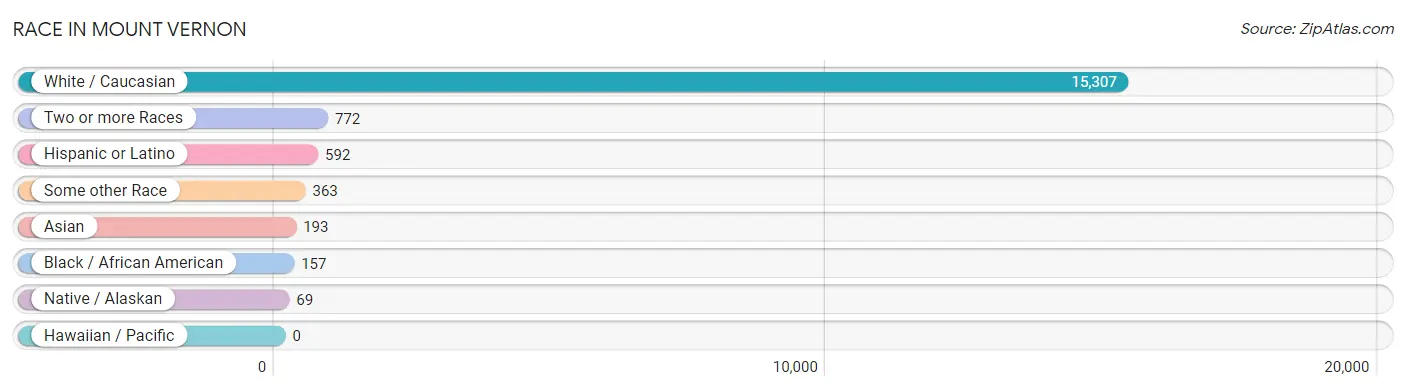
| Race | # Population | % Population |
| Asian | 193 | 1.1% |
| Black / African American | 157 | 0.9% |
| Hawaiian / Pacific | 0 | 0.0% |
| Hispanic or Latino | 592 | 3.5% |
| Native / Alaskan | 69 | 0.4% |
| White / Caucasian | 15,307 | 90.8% |
| Two or more Races | 772 | 4.6% |
| Some other Race | 363 | 2.1% |
| Total | 16,861 | 100.0% |
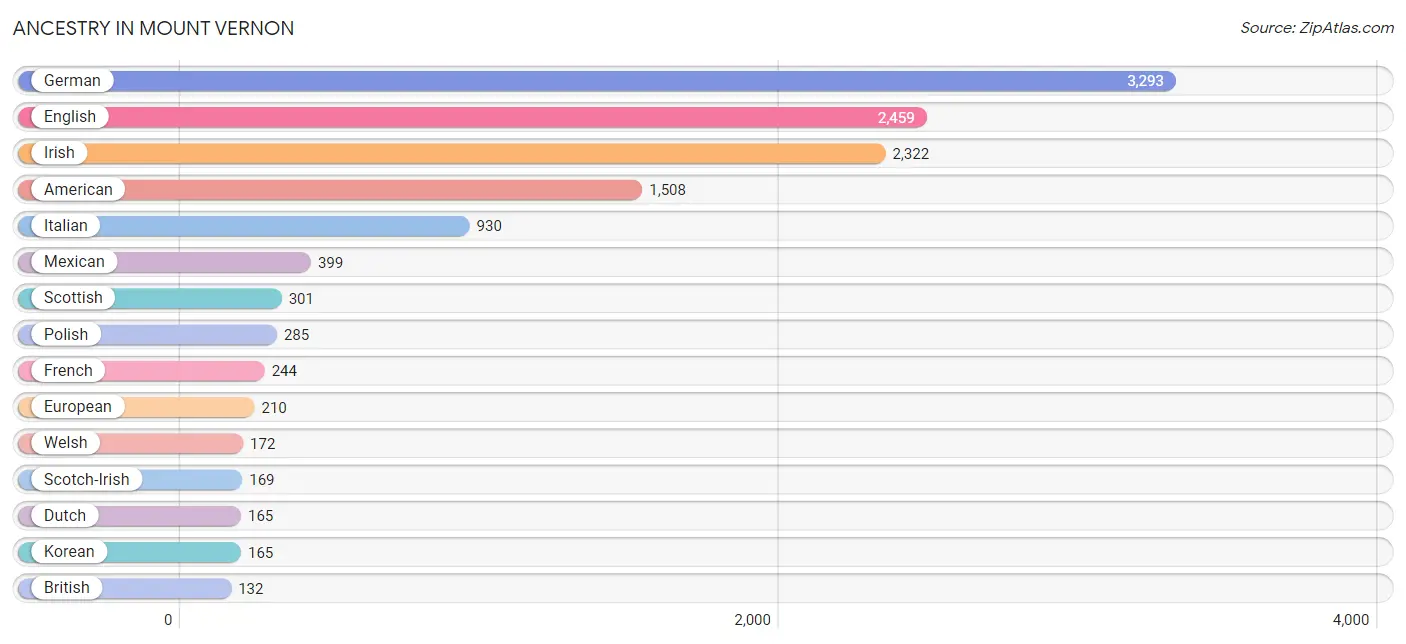
Ancestry in Mount Vernon
The most populous ancestries reported in Mount Vernon are German (3,293 | 19.5%), English (2,459 | 14.6%), Irish (2,322 | 13.8%), American (1,508 | 8.9%), and Italian (930 | 5.5%), together accounting for 62.3% of all Mount Vernon residents.
| Ancestry | # Population | % Population |
| American | 1,508 | 8.9% |
| Apache | 3 | 0.0% |
| Arab | 19 | 0.1% |
| Austrian | 37 | 0.2% |
| Bhutanese | 41 | 0.2% |
| Bolivian | 27 | 0.2% |
| British | 132 | 0.8% |
| Burmese | 16 | 0.1% |
| Cherokee | 81 | 0.5% |
| Colombian | 4 | 0.0% |
| Creek | 1 | 0.0% |
| Croatian | 6 | 0.0% |
| Czech | 71 | 0.4% |
| Czechoslovakian | 7 | 0.0% |
| Dutch | 165 | 1.0% |
| Eastern European | 56 | 0.3% |
| English | 2,459 | 14.6% |
| European | 210 | 1.3% |
| Finnish | 14 | 0.1% |
| French | 244 | 1.5% |
| French Canadian | 15 | 0.1% |
| German | 3,293 | 19.5% |
| Greek | 53 | 0.3% |
| Hungarian | 81 | 0.5% |
| Irish | 2,322 | 13.8% |
| Italian | 930 | 5.5% |
| Korean | 165 | 1.0% |
| Lebanese | 9 | 0.1% |
| Mexican | 399 | 2.4% |
| Northern European | 16 | 0.1% |
| Norwegian | 86 | 0.5% |
| Pakistani | 87 | 0.5% |
| Pennsylvania German | 8 | 0.1% |
| Polish | 285 | 1.7% |
| Portuguese | 43 | 0.3% |
| Puerto Rican | 81 | 0.5% |
| Russian | 10 | 0.1% |
| Scandinavian | 49 | 0.3% |
| Scotch-Irish | 169 | 1.0% |
| Scottish | 301 | 1.8% |
| Sioux | 69 | 0.4% |
| Slovak | 24 | 0.1% |
| Slovene | 20 | 0.1% |
| South American | 31 | 0.2% |
| Spanish | 47 | 0.3% |
| Swedish | 66 | 0.4% |
| Swiss | 49 | 0.3% |
| Thai | 55 | 0.3% |
| Turkish | 21 | 0.1% |
| Ukrainian | 24 | 0.1% |
| Welsh | 172 | 1.0% |
| Yugoslavian | 8 | 0.1% | View All 52 Rows |
Immigrants in Mount Vernon
The most numerous immigrant groups reported in Mount Vernon came from Asia (168 | 1.0%), Latin America (168 | 1.0%), Central America (153 | 0.9%), Mexico (153 | 0.9%), and Philippines (75 | 0.4%), together accounting for 4.3% of all Mount Vernon residents.
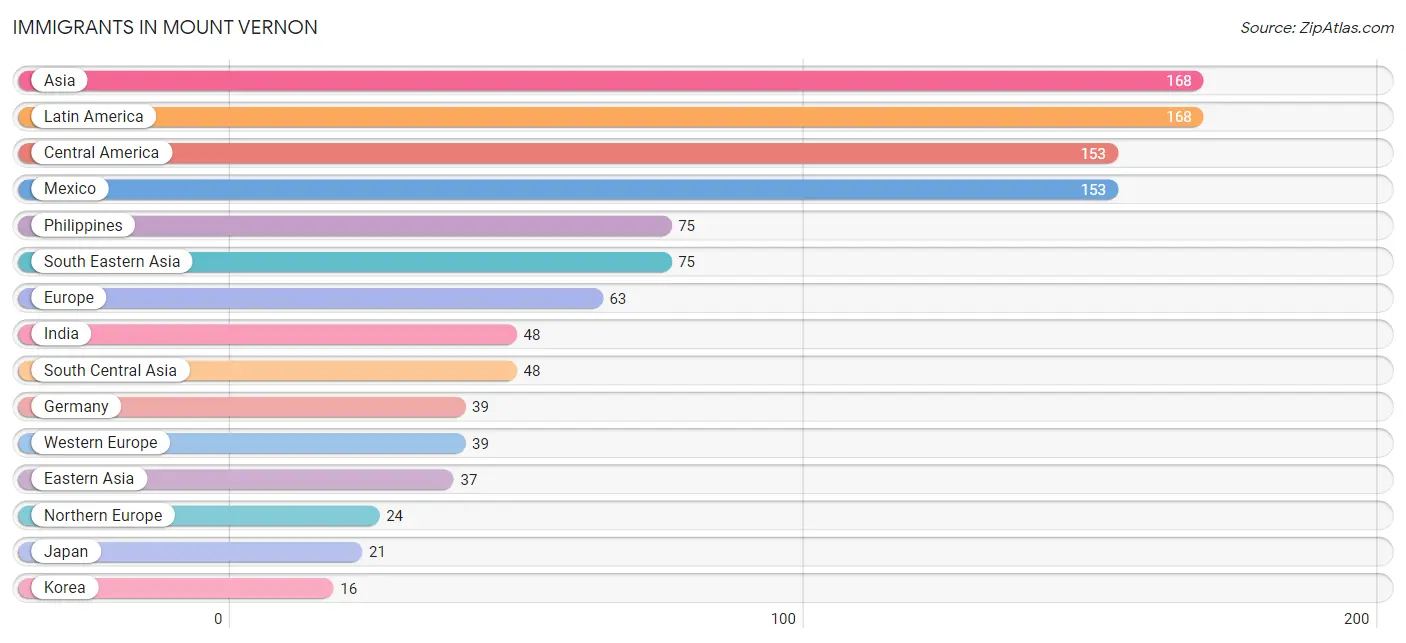
| Immigration Origin | # Population | % Population |
| Asia | 168 | 1.0% |
| Bolivia | 11 | 0.1% |
| Canada | 6 | 0.0% |
| Central America | 153 | 0.9% |
| Colombia | 4 | 0.0% |
| Eastern Asia | 37 | 0.2% |
| England | 10 | 0.1% |
| Europe | 63 | 0.4% |
| Germany | 39 | 0.2% |
| India | 48 | 0.3% |
| Japan | 21 | 0.1% |
| Korea | 16 | 0.1% |
| Latin America | 168 | 1.0% |
| Mexico | 153 | 0.9% |
| Northern Europe | 24 | 0.1% |
| Norway | 10 | 0.1% |
| Philippines | 75 | 0.4% |
| South America | 15 | 0.1% |
| South Central Asia | 48 | 0.3% |
| South Eastern Asia | 75 | 0.4% |
| Sweden | 3 | 0.0% |
| Turkey | 8 | 0.1% |
| Western Asia | 8 | 0.1% |
| Western Europe | 39 | 0.2% | View All 24 Rows |
Sex and Age in Mount Vernon
Sex and Age in Mount Vernon
The most populous age groups in Mount Vernon are 40 to 44 Years (792 | 10.0%) for men and 15 to 19 Years (881 | 9.8%) for women.
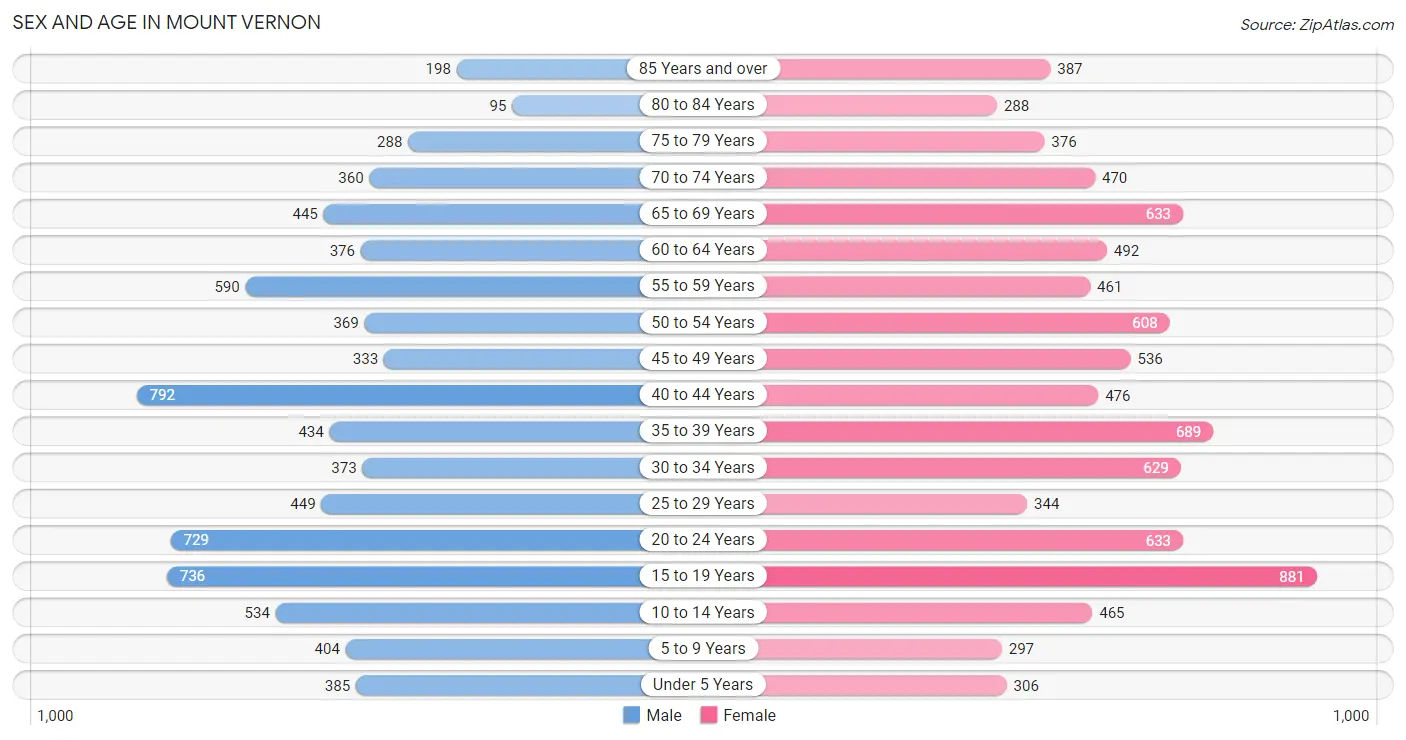
| Age Bracket | Male | Female |
| Under 5 Years | 385 (4.9%) | 306 (3.4%) |
| 5 to 9 Years | 404 (5.1%) | 297 (3.3%) |
| 10 to 14 Years | 534 (6.8%) | 465 (5.2%) |
| 15 to 19 Years | 736 (9.3%) | 881 (9.8%) |
| 20 to 24 Years | 729 (9.2%) | 633 (7.1%) |
| 25 to 29 Years | 449 (5.7%) | 344 (3.8%) |
| 30 to 34 Years | 373 (4.7%) | 629 (7.0%) |
| 35 to 39 Years | 434 (5.5%) | 689 (7.7%) |
| 40 to 44 Years | 792 (10.0%) | 476 (5.3%) |
| 45 to 49 Years | 333 (4.2%) | 536 (6.0%) |
| 50 to 54 Years | 369 (4.7%) | 608 (6.8%) |
| 55 to 59 Years | 590 (7.5%) | 461 (5.1%) |
| 60 to 64 Years | 376 (4.8%) | 492 (5.5%) |
| 65 to 69 Years | 445 (5.6%) | 633 (7.1%) |
| 70 to 74 Years | 360 (4.6%) | 470 (5.2%) |
| 75 to 79 Years | 288 (3.6%) | 376 (4.2%) |
| 80 to 84 Years | 95 (1.2%) | 288 (3.2%) |
| 85 Years and over | 198 (2.5%) | 387 (4.3%) |
| Total | 7,890 (100.0%) | 8,971 (100.0%) |
Families and Households in Mount Vernon
Median Family Size in Mount Vernon
The median family size in Mount Vernon is 2.90 persons per family, with single male/father families (197 | 5.0%) accounting for the largest median family size of 3.98 persons per family. On the other hand, single female/mother families (974 | 24.8%) represent the smallest median family size with 2.64 persons per family.
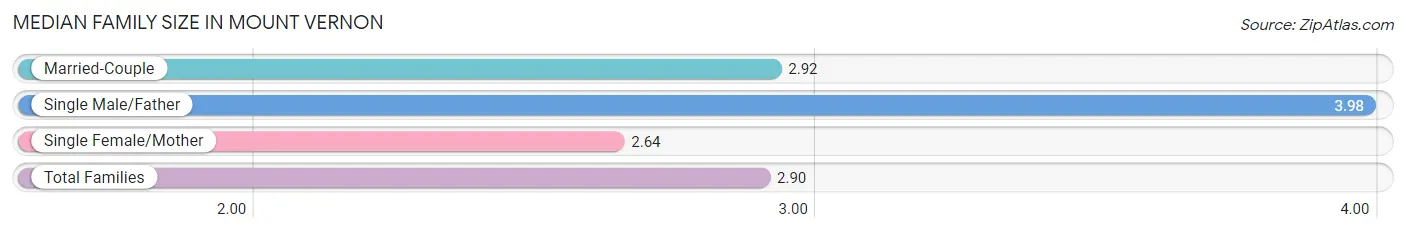
| Family Type | # Families | Family Size |
| Married-Couple | 2,754 (70.2%) | 2.92 |
| Single Male/Father | 197 (5.0%) | 3.98 |
| Single Female/Mother | 974 (24.8%) | 2.64 |
| Total Families | 3,925 (100.0%) | 2.90 |
Median Household Size in Mount Vernon
The median household size in Mount Vernon is 2.17 persons per household, with single male/father households (197 | 2.7%) accounting for the largest median household size of 4.36 persons per household. non-family households (3,256 | 45.3%) represent the smallest median household size with 1.16 persons per household.
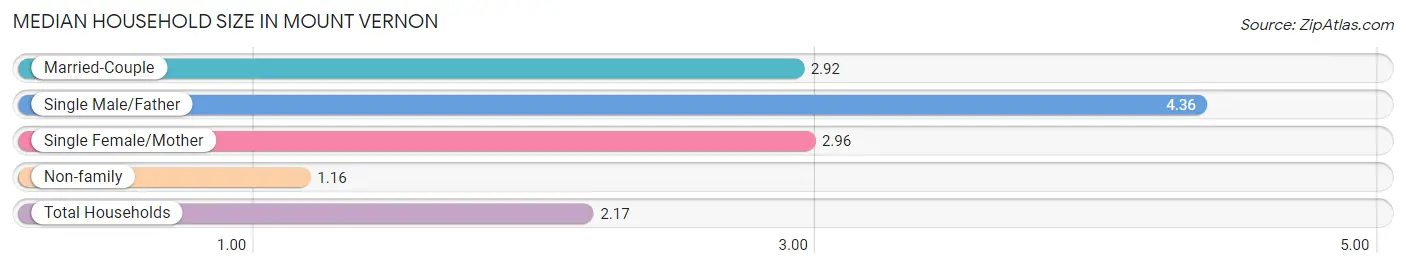
| Household Type | # Households | Household Size |
| Married-Couple | 2,754 (38.4%) | 2.92 |
| Single Male/Father | 197 (2.7%) | 4.36 |
| Single Female/Mother | 974 (13.6%) | 2.96 |
| Non-family | 3,256 (45.3%) | 1.16 |
| Total Households | 7,181 (100.0%) | 2.17 |
Household Size by Marriage Status in Mount Vernon
Out of a total of 7,181 households in Mount Vernon, 3,925 (54.7%) are family households, while 3,256 (45.3%) are nonfamily households. The most numerous type of family households are 2-person households, comprising 2,181, and the most common type of nonfamily households are 1-person households, comprising 2,792.
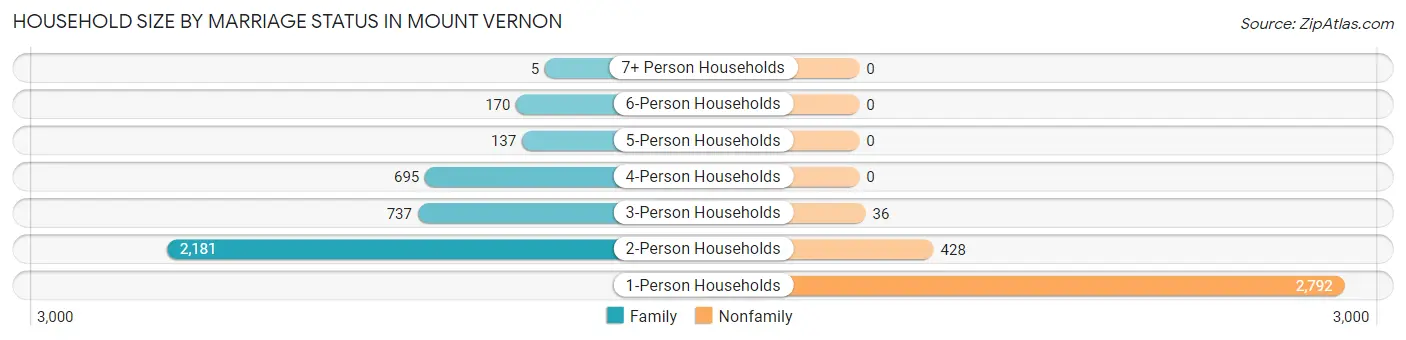
| Household Size | Family Households | Nonfamily Households |
| 1-Person Households | - | 2,792 (38.9%) |
| 2-Person Households | 2,181 (30.4%) | 428 (6.0%) |
| 3-Person Households | 737 (10.3%) | 36 (0.5%) |
| 4-Person Households | 695 (9.7%) | 0 (0.0%) |
| 5-Person Households | 137 (1.9%) | 0 (0.0%) |
| 6-Person Households | 170 (2.4%) | 0 (0.0%) |
| 7+ Person Households | 5 (0.1%) | 0 (0.0%) |
| Total | 3,925 (54.7%) | 3,256 (45.3%) |
Female Fertility in Mount Vernon
Fertility by Age in Mount Vernon
Average fertility rate in Mount Vernon is 55.0 births per 1,000 women. Women in the age bracket of 35 to 50 years have the highest fertility rate with 112.0 births per 1,000 women. Women in the age bracket of 35 to 50 years acount for 87.1% of all women with births.
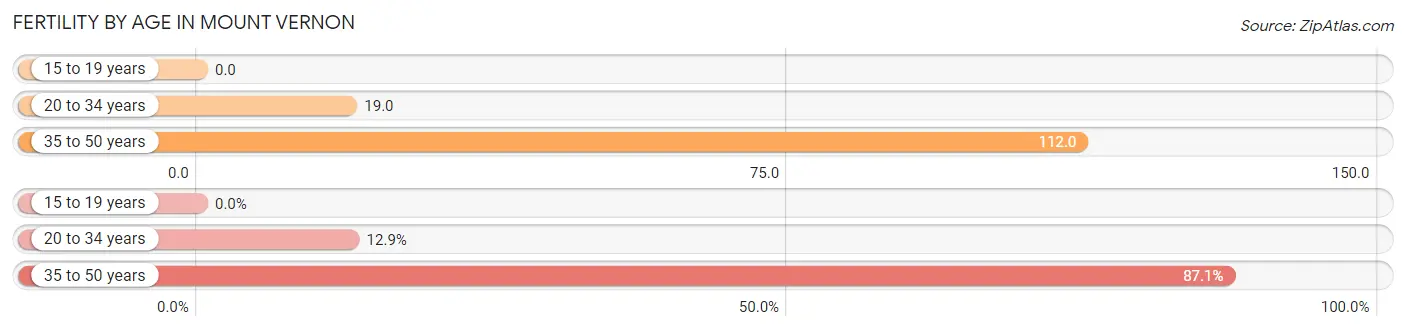
| Age Bracket | Women with Births | Births / 1,000 Women |
| 15 to 19 years | 0 (0.0%) | 0.0 |
| 20 to 34 years | 31 (12.9%) | 19.0 |
| 35 to 50 years | 210 (87.1%) | 112.0 |
| Total | 241 (100.0%) | 55.0 |
Fertility by Age by Marriage Status in Mount Vernon
41.5% of women with births (241) in Mount Vernon are married. The highest percentage of unmarried women with births falls into 35 to 50 years age bracket with 65.7% of them unmarried at the time of birth, while the lowest percentage of unmarried women with births belong to 20 to 34 years age bracket with 9.7% of them unmarried.
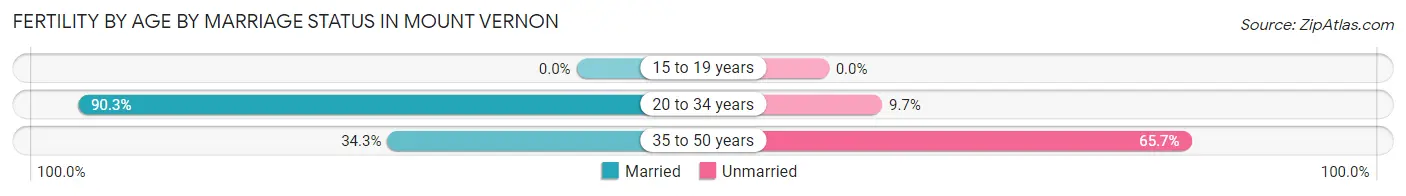
| Age Bracket | Married | Unmarried |
| 15 to 19 years | 0 (0.0%) | 0 (0.0%) |
| 20 to 34 years | 28 (90.3%) | 3 (9.7%) |
| 35 to 50 years | 72 (34.3%) | 138 (65.7%) |
| Total | 100 (41.5%) | 141 (58.5%) |
Fertility by Education in Mount Vernon
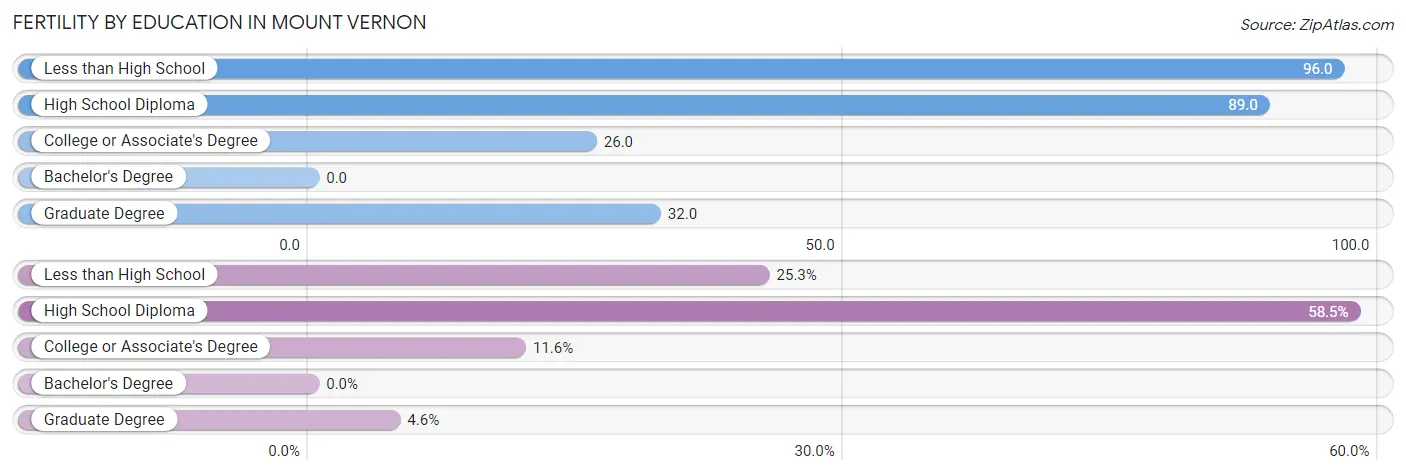
| Educational Attainment | Women with Births | Births / 1,000 Women |
| Less than High School | 61 (25.3%) | 96.0 |
| High School Diploma | 141 (58.5%) | 89.0 |
| College or Associate's Degree | 28 (11.6%) | 26.0 |
| Bachelor's Degree | 0 (0.0%) | 0.0 |
| Graduate Degree | 11 (4.6%) | 32.0 |
| Total | 241 (100.0%) | 55.0 |
Fertility by Education by Marriage Status in Mount Vernon
58.5% of women with births in Mount Vernon are unmarried. Women with the educational attainment of less than high school are most likely to be married with 100.0% of them married at childbirth, while women with the educational attainment of high school diploma are least likely to be married with 100.0% of them unmarried at childbirth.
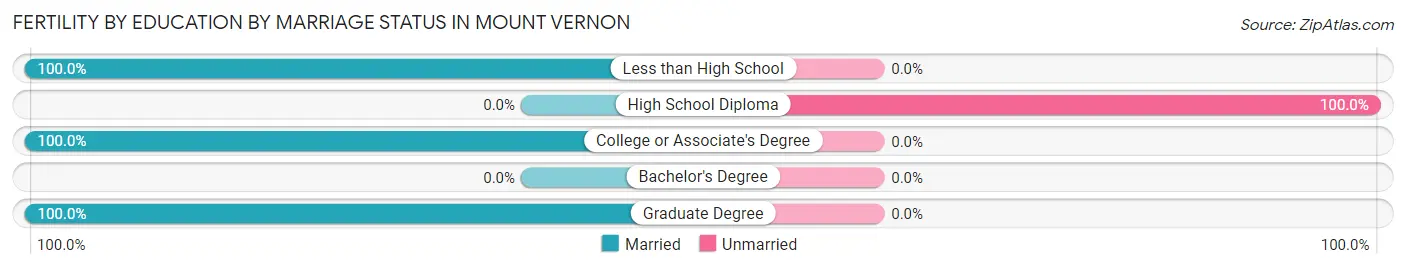
| Educational Attainment | Married | Unmarried |
| Less than High School | 61 (100.0%) | 0 (0.0%) |
| High School Diploma | 0 (0.0%) | 141 (100.0%) |
| College or Associate's Degree | 28 (100.0%) | 0 (0.0%) |
| Bachelor's Degree | 0 (0.0%) | 0 (0.0%) |
| Graduate Degree | 11 (100.0%) | 0 (0.0%) |
| Total | 100 (41.5%) | 141 (58.5%) |
Employment Characteristics in Mount Vernon
Employment by Class of Employer in Mount Vernon
Among the 7,687 employed individuals in Mount Vernon, private company employees (5,310 | 69.1%), not-for-profit organizations (892 | 11.6%), and local government employees (662 | 8.6%) make up the most common classes of employment.
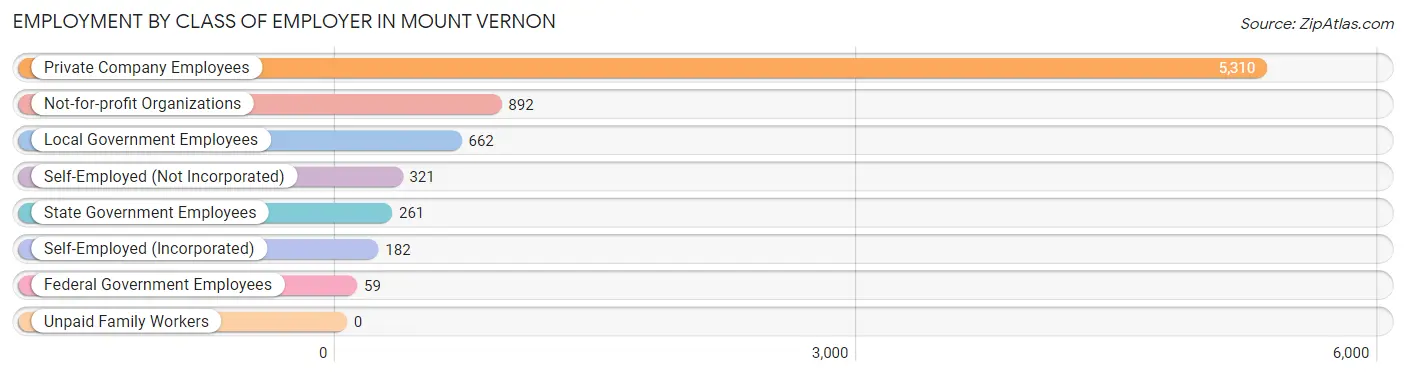
| Employer Class | # Employees | % Employees |
| Private Company Employees | 5,310 | 69.1% |
| Self-Employed (Incorporated) | 182 | 2.4% |
| Self-Employed (Not Incorporated) | 321 | 4.2% |
| Not-for-profit Organizations | 892 | 11.6% |
| Local Government Employees | 662 | 8.6% |
| State Government Employees | 261 | 3.4% |
| Federal Government Employees | 59 | 0.8% |
| Unpaid Family Workers | 0 | 0.0% |
| Total | 7,687 | 100.0% |
Employment Status by Age in Mount Vernon
According to the labor force statistics for Mount Vernon, out of the total population over 16 years of age (14,201), 58.0% or 8,237 individuals are in the labor force, with 3.3% or 272 of them unemployed. The age group with the highest labor force participation rate is 20 to 24 years, with 84.4% or 1,150 individuals in the labor force. Within the labor force, the 16 to 19 years age range has the highest percentage of unemployed individuals, with 10.3% or 61 of them being unemployed.
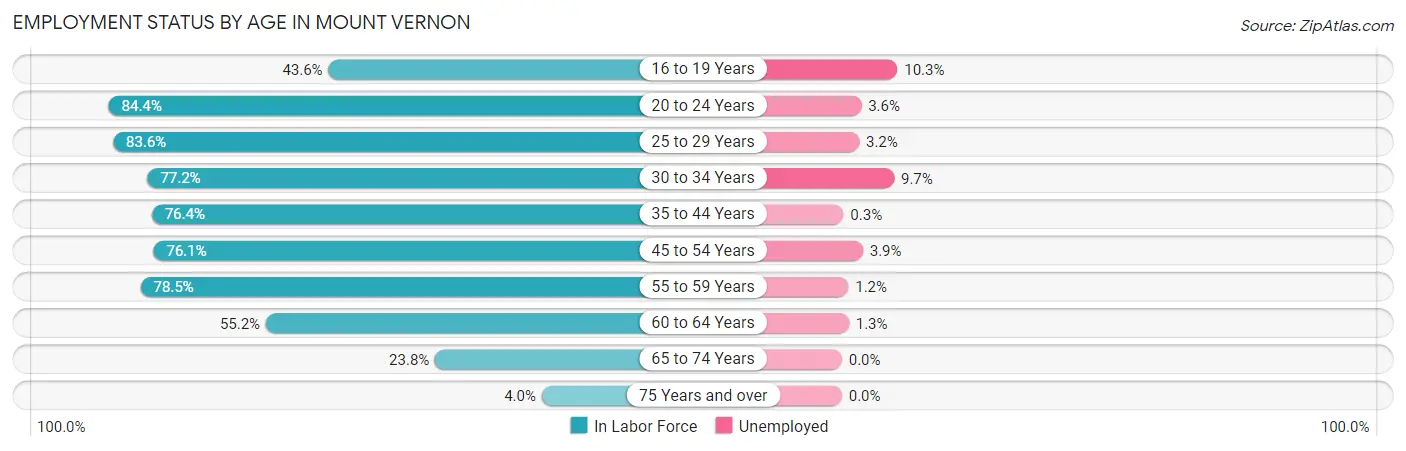
| Age Bracket | In Labor Force | Unemployed |
| 16 to 19 Years | 588 (43.6%) | 61 (10.3%) |
| 20 to 24 Years | 1,150 (84.4%) | 41 (3.6%) |
| 25 to 29 Years | 663 (83.6%) | 21 (3.2%) |
| 30 to 34 Years | 774 (77.2%) | 75 (9.7%) |
| 35 to 44 Years | 1,827 (76.4%) | 5 (0.3%) |
| 45 to 54 Years | 1,405 (76.1%) | 55 (3.9%) |
| 55 to 59 Years | 825 (78.5%) | 10 (1.2%) |
| 60 to 64 Years | 479 (55.2%) | 6 (1.3%) |
| 65 to 74 Years | 454 (23.8%) | 0 (0.0%) |
| 75 Years and over | 65 (4.0%) | 0 (0.0%) |
| Total | 8,237 (58.0%) | 272 (3.3%) |
Employment Status by Educational Attainment in Mount Vernon
According to labor force statistics for Mount Vernon, 75.1% of individuals (5,971) out of the total population between 25 and 64 years of age (7,951) are in the labor force, with 2.9% or 173 of them being unemployed. The group with the highest labor force participation rate are those with the educational attainment of bachelor's degree or higher, with 92.8% or 1,999 individuals in the labor force. Within the labor force, individuals with less than high school education have the highest percentage of unemployment, with 5.1% or 23 of them being unemployed.
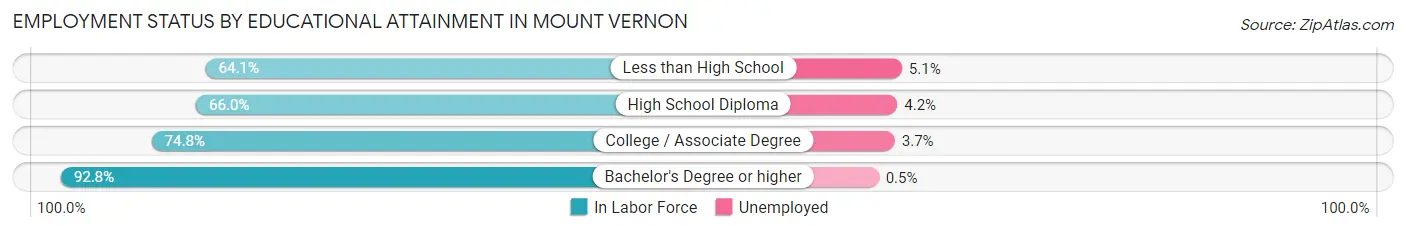
| Educational Attainment | In Labor Force | Unemployed |
| Less than High School | 451 (64.1%) | 36 (5.1%) |
| High School Diploma | 2,160 (66.0%) | 137 (4.2%) |
| College / Associate Degree | 1,361 (74.8%) | 67 (3.7%) |
| Bachelor's Degree or higher | 1,999 (92.8%) | 11 (0.5%) |
| Total | 5,971 (75.1%) | 231 (2.9%) |
Employment Occupations by Sex in Mount Vernon
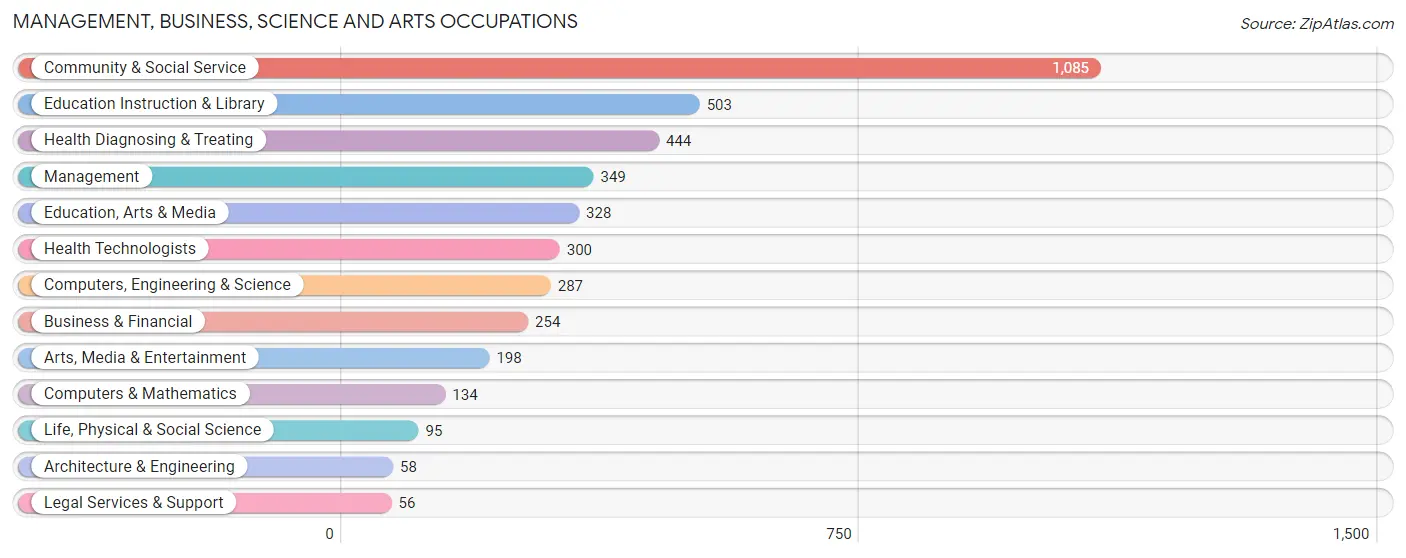
Management, Business, Science and Arts Occupations
The most common Management, Business, Science and Arts occupations in Mount Vernon are Community & Social Service (1,085 | 13.7%), Education Instruction & Library (503 | 6.3%), Health Diagnosing & Treating (444 | 5.6%), Management (349 | 4.4%), and Education, Arts & Media (328 | 4.1%).
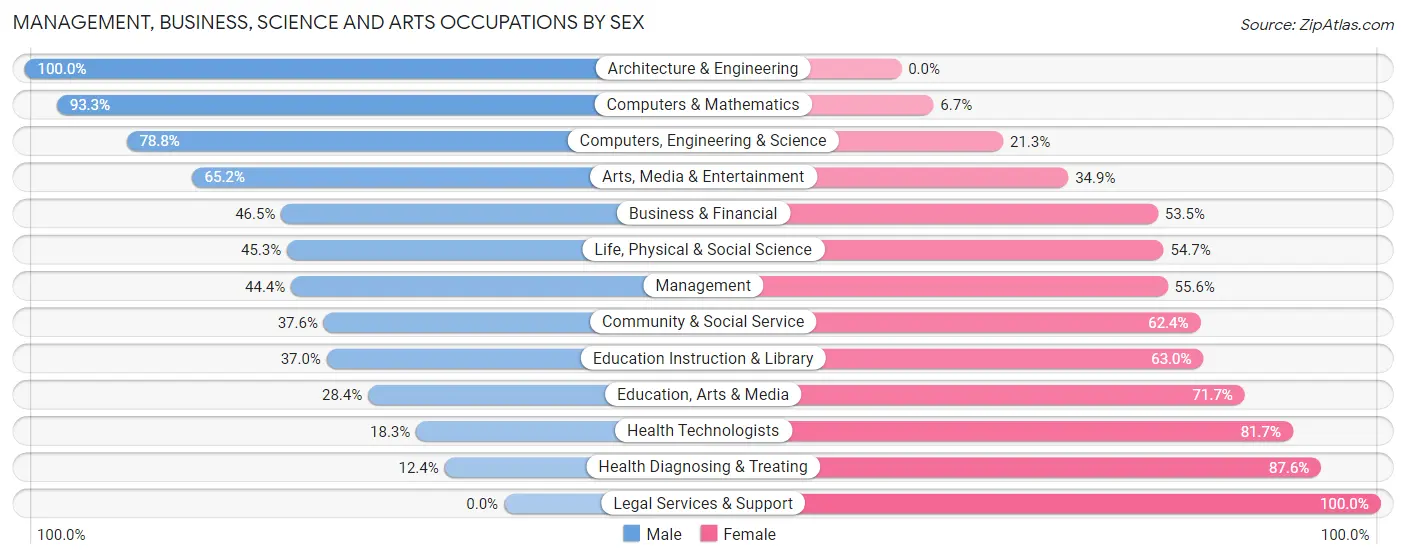
Management, Business, Science and Arts Occupations by Sex
Within the Management, Business, Science and Arts occupations in Mount Vernon, the most male-oriented occupations are Architecture & Engineering (100.0%), Computers & Mathematics (93.3%), and Computers, Engineering & Science (78.7%), while the most female-oriented occupations are Legal Services & Support (100.0%), Health Diagnosing & Treating (87.6%), and Health Technologists (81.7%).
| Occupation | Male | Female |
| Management | 155 (44.4%) | 194 (55.6%) |
| Business & Financial | 118 (46.5%) | 136 (53.5%) |
| Computers, Engineering & Science | 226 (78.7%) | 61 (21.2%) |
| Computers & Mathematics | 125 (93.3%) | 9 (6.7%) |
| Architecture & Engineering | 58 (100.0%) | 0 (0.0%) |
| Life, Physical & Social Science | 43 (45.3%) | 52 (54.7%) |
| Community & Social Service | 408 (37.6%) | 677 (62.4%) |
| Education, Arts & Media | 93 (28.3%) | 235 (71.7%) |
| Legal Services & Support | 0 (0.0%) | 56 (100.0%) |
| Education Instruction & Library | 186 (37.0%) | 317 (63.0%) |
| Arts, Media & Entertainment | 129 (65.1%) | 69 (34.8%) |
| Health Diagnosing & Treating | 55 (12.4%) | 389 (87.6%) |
| Health Technologists | 55 (18.3%) | 245 (81.7%) |
| Total (Category) | 962 (39.8%) | 1,457 (60.2%) |
| Total (Overall) | 3,994 (50.2%) | 3,955 (49.7%) |
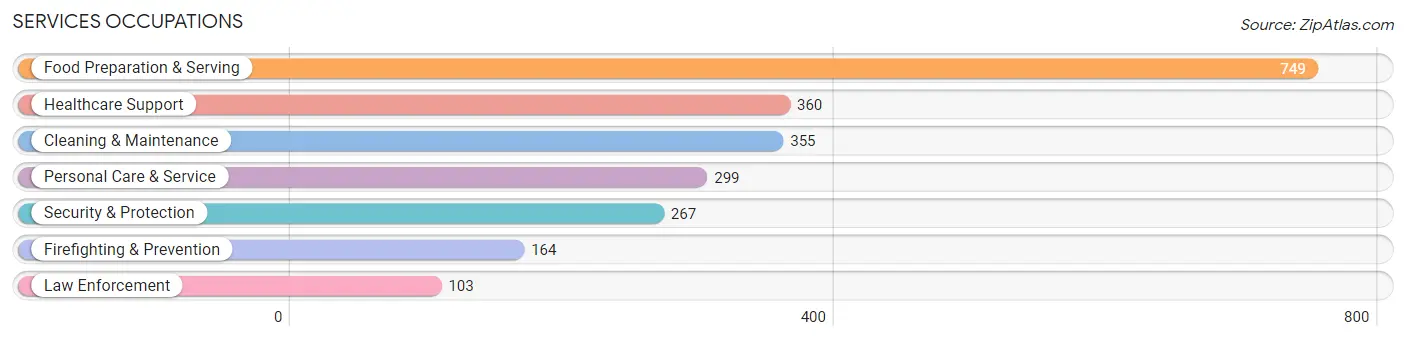
Services Occupations
The most common Services occupations in Mount Vernon are Food Preparation & Serving (749 | 9.4%), Healthcare Support (360 | 4.5%), Cleaning & Maintenance (355 | 4.5%), Personal Care & Service (299 | 3.8%), and Security & Protection (267 | 3.4%).
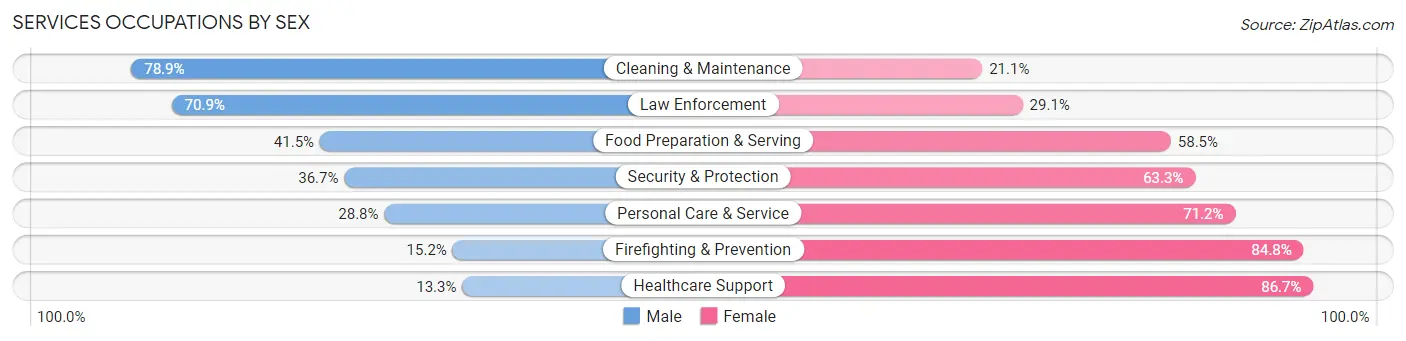
Services Occupations by Sex
Within the Services occupations in Mount Vernon, the most male-oriented occupations are Cleaning & Maintenance (78.9%), Law Enforcement (70.9%), and Food Preparation & Serving (41.5%), while the most female-oriented occupations are Healthcare Support (86.7%), Firefighting & Prevention (84.8%), and Personal Care & Service (71.2%).
| Occupation | Male | Female |
| Healthcare Support | 48 (13.3%) | 312 (86.7%) |
| Security & Protection | 98 (36.7%) | 169 (63.3%) |
| Firefighting & Prevention | 25 (15.2%) | 139 (84.8%) |
| Law Enforcement | 73 (70.9%) | 30 (29.1%) |
| Food Preparation & Serving | 311 (41.5%) | 438 (58.5%) |
| Cleaning & Maintenance | 280 (78.9%) | 75 (21.1%) |
| Personal Care & Service | 86 (28.8%) | 213 (71.2%) |
| Total (Category) | 823 (40.5%) | 1,207 (59.5%) |
| Total (Overall) | 3,994 (50.2%) | 3,955 (49.7%) |
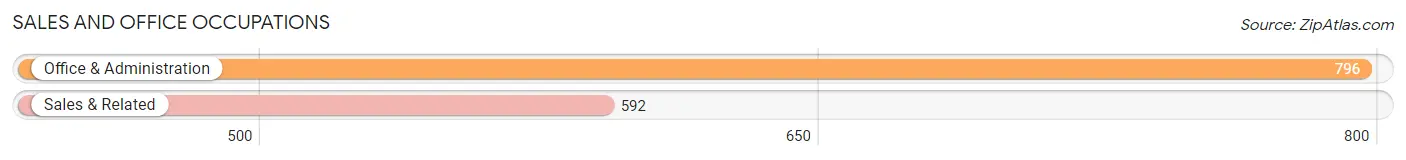
Sales and Office Occupations
The most common Sales and Office occupations in Mount Vernon are Office & Administration (796 | 10.0%), and Sales & Related (592 | 7.4%).
Sales and Office Occupations by Sex
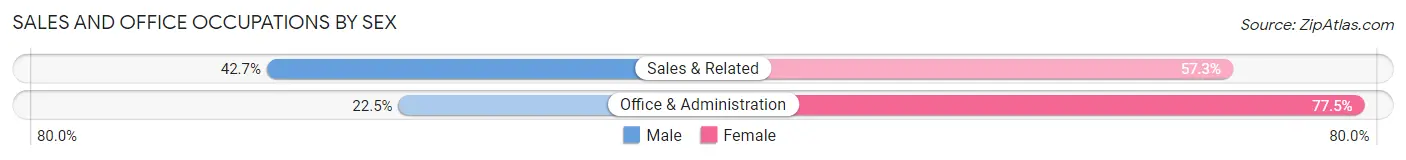
| Occupation | Male | Female |
| Sales & Related | 253 (42.7%) | 339 (57.3%) |
| Office & Administration | 179 (22.5%) | 617 (77.5%) |
| Total (Category) | 432 (31.1%) | 956 (68.9%) |
| Total (Overall) | 3,994 (50.2%) | 3,955 (49.7%) |
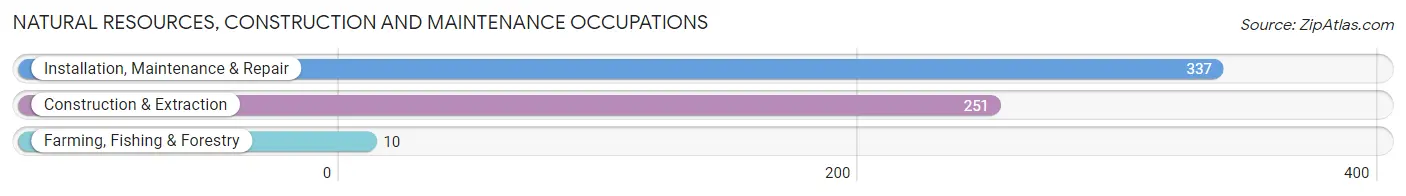
Natural Resources, Construction and Maintenance Occupations
The most common Natural Resources, Construction and Maintenance occupations in Mount Vernon are Installation, Maintenance & Repair (337 | 4.2%), Construction & Extraction (251 | 3.2%), and Farming, Fishing & Forestry (10 | 0.1%).
Natural Resources, Construction and Maintenance Occupations by Sex
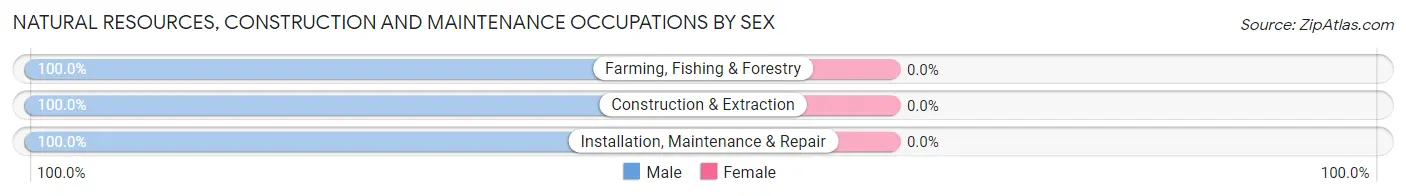
| Occupation | Male | Female |
| Farming, Fishing & Forestry | 10 (100.0%) | 0 (0.0%) |
| Construction & Extraction | 251 (100.0%) | 0 (0.0%) |
| Installation, Maintenance & Repair | 337 (100.0%) | 0 (0.0%) |
| Total (Category) | 598 (100.0%) | 0 (0.0%) |
| Total (Overall) | 3,994 (50.2%) | 3,955 (49.7%) |
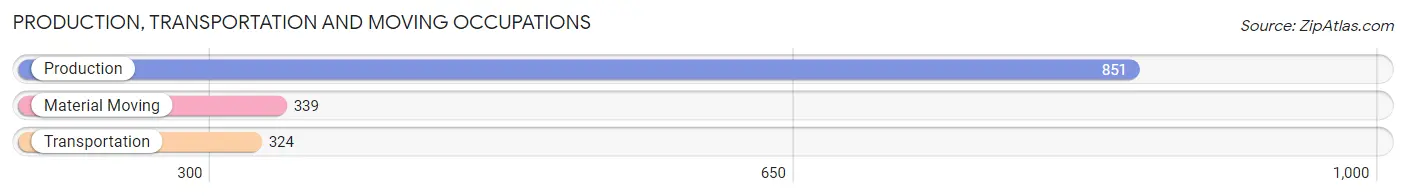
Production, Transportation and Moving Occupations
The most common Production, Transportation and Moving occupations in Mount Vernon are Production (851 | 10.7%), Material Moving (339 | 4.3%), and Transportation (324 | 4.1%).
Production, Transportation and Moving Occupations by Sex
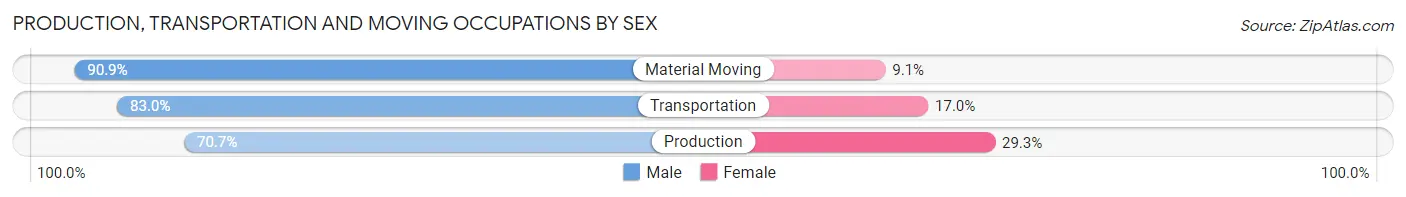
| Occupation | Male | Female |
| Production | 602 (70.7%) | 249 (29.3%) |
| Transportation | 269 (83.0%) | 55 (17.0%) |
| Material Moving | 308 (90.9%) | 31 (9.1%) |
| Total (Category) | 1,179 (77.9%) | 335 (22.1%) |
| Total (Overall) | 3,994 (50.2%) | 3,955 (49.7%) |
Employment Industries by Sex in Mount Vernon
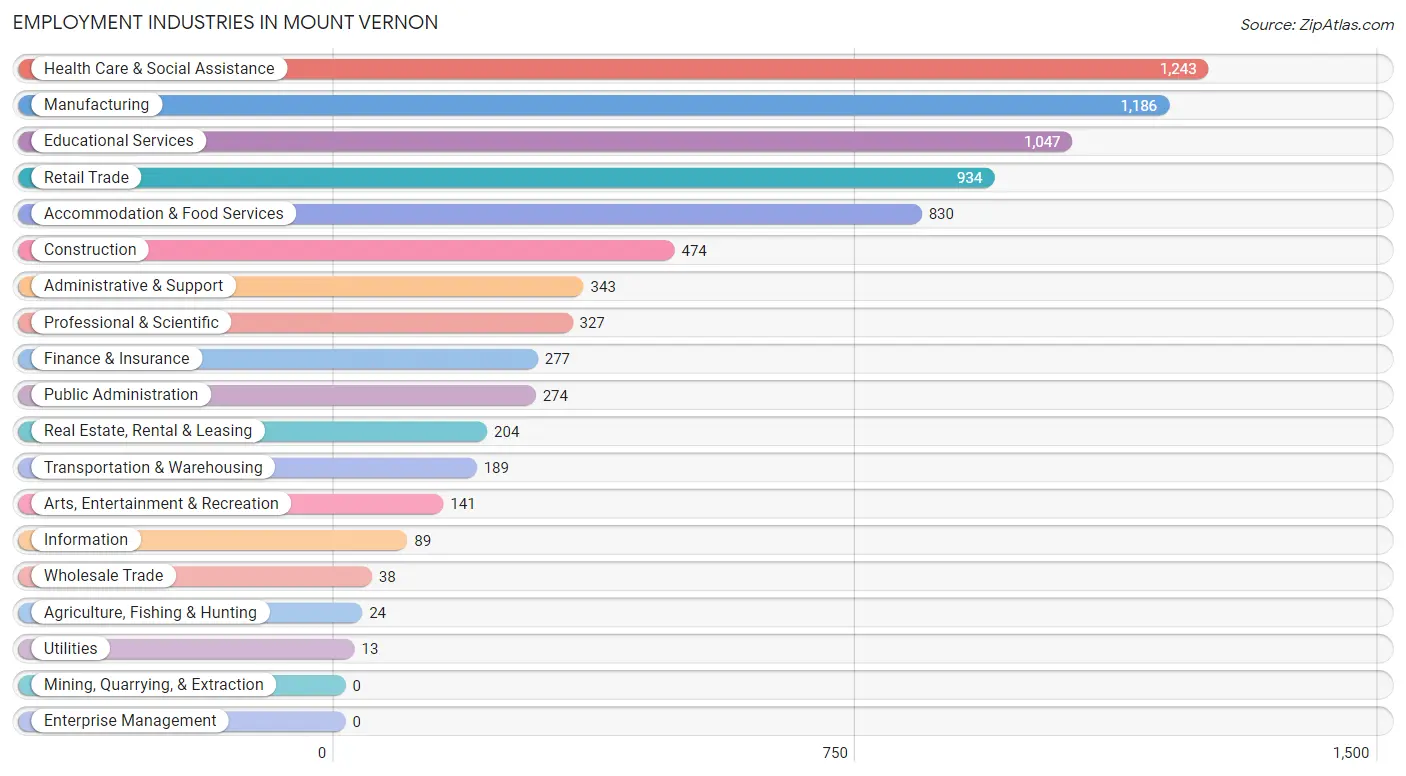
Employment Industries in Mount Vernon
The major employment industries in Mount Vernon include Health Care & Social Assistance (1,243 | 15.6%), Manufacturing (1,186 | 14.9%), Educational Services (1,047 | 13.2%), Retail Trade (934 | 11.7%), and Accommodation & Food Services (830 | 10.4%).
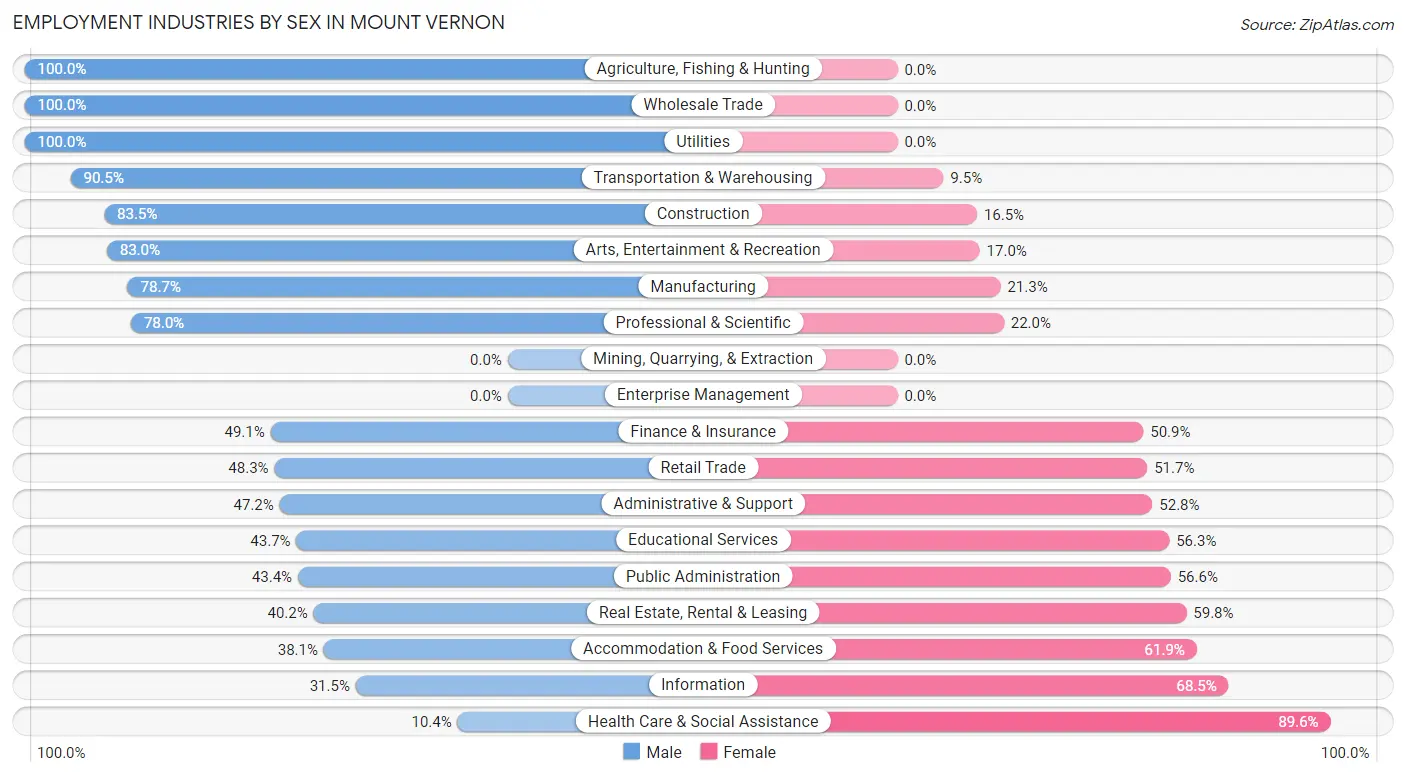
Employment Industries by Sex in Mount Vernon
The Mount Vernon industries that see more men than women are Agriculture, Fishing & Hunting (100.0%), Wholesale Trade (100.0%), and Utilities (100.0%), whereas the industries that tend to have a higher number of women are Health Care & Social Assistance (89.6%), Information (68.5%), and Accommodation & Food Services (61.9%).
| Industry | Male | Female |
| Agriculture, Fishing & Hunting | 24 (100.0%) | 0 (0.0%) |
| Mining, Quarrying, & Extraction | 0 (0.0%) | 0 (0.0%) |
| Construction | 396 (83.5%) | 78 (16.5%) |
| Manufacturing | 933 (78.7%) | 253 (21.3%) |
| Wholesale Trade | 38 (100.0%) | 0 (0.0%) |
| Retail Trade | 451 (48.3%) | 483 (51.7%) |
| Transportation & Warehousing | 171 (90.5%) | 18 (9.5%) |
| Utilities | 13 (100.0%) | 0 (0.0%) |
| Information | 28 (31.5%) | 61 (68.5%) |
| Finance & Insurance | 136 (49.1%) | 141 (50.9%) |
| Real Estate, Rental & Leasing | 82 (40.2%) | 122 (59.8%) |
| Professional & Scientific | 255 (78.0%) | 72 (22.0%) |
| Enterprise Management | 0 (0.0%) | 0 (0.0%) |
| Administrative & Support | 162 (47.2%) | 181 (52.8%) |
| Educational Services | 458 (43.7%) | 589 (56.3%) |
| Health Care & Social Assistance | 129 (10.4%) | 1,114 (89.6%) |
| Arts, Entertainment & Recreation | 117 (83.0%) | 24 (17.0%) |
| Accommodation & Food Services | 316 (38.1%) | 514 (61.9%) |
| Public Administration | 119 (43.4%) | 155 (56.6%) |
| Total | 3,994 (50.2%) | 3,955 (49.7%) |
Education in Mount Vernon
School Enrollment in Mount Vernon
The most common levels of schooling among the 4,227 students in Mount Vernon are college / undergraduate (1,314 | 31.1%), high school (955 | 22.6%), and middle school (809 | 19.1%).
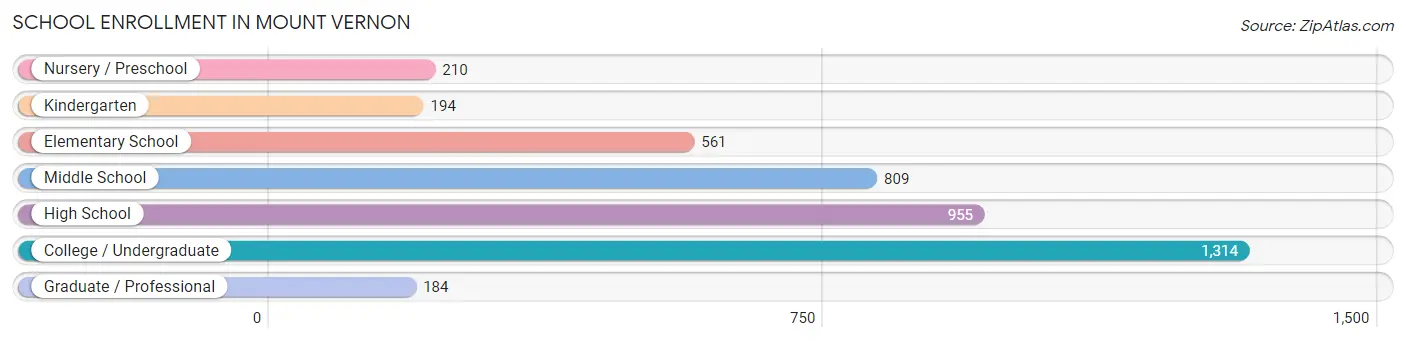
| School Level | # Students | % Students |
| Nursery / Preschool | 210 | 5.0% |
| Kindergarten | 194 | 4.6% |
| Elementary School | 561 | 13.3% |
| Middle School | 809 | 19.1% |
| High School | 955 | 22.6% |
| College / Undergraduate | 1,314 | 31.1% |
| Graduate / Professional | 184 | 4.3% |
| Total | 4,227 | 100.0% |
School Enrollment by Age by Funding Source in Mount Vernon
Out of a total of 4,227 students who are enrolled in schools in Mount Vernon, 1,150 (27.2%) attend a private institution, while the remaining 3,077 (72.8%) are enrolled in public schools. The age group of 18 to 19 year olds has the highest likelihood of being enrolled in private schools, with 494 (77.5% in the age bracket) enrolled. Conversely, the age group of 10 to 14 year olds has the lowest likelihood of being enrolled in a private school, with 964 (98.7% in the age bracket) attending a public institution.
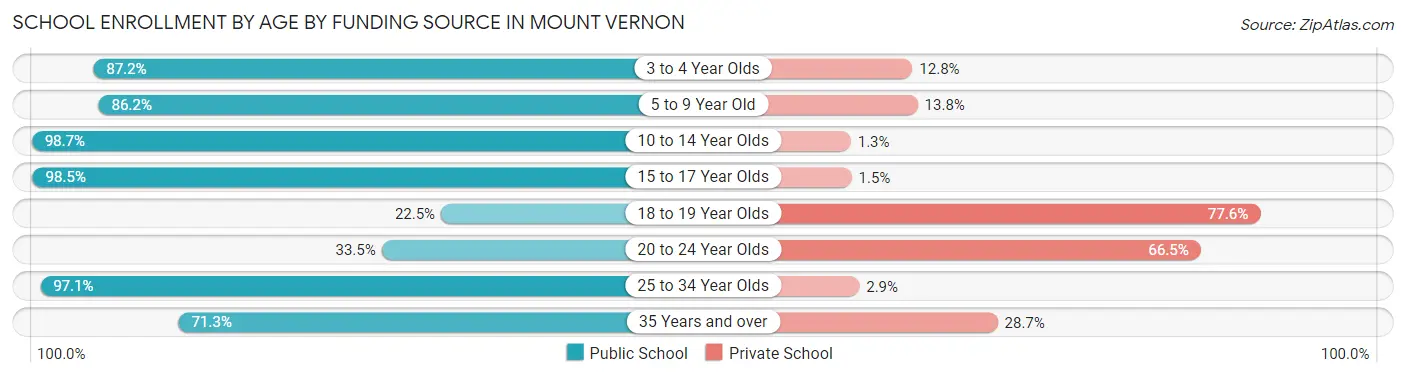
| Age Bracket | Public School | Private School |
| 3 to 4 Year Olds | 143 (87.2%) | 21 (12.8%) |
| 5 to 9 Year Old | 582 (86.2%) | 93 (13.8%) |
| 10 to 14 Year Olds | 964 (98.7%) | 13 (1.3%) |
| 15 to 17 Year Olds | 806 (98.5%) | 12 (1.5%) |
| 18 to 19 Year Olds | 143 (22.5%) | 494 (77.5%) |
| 20 to 24 Year Olds | 238 (33.5%) | 472 (66.5%) |
| 25 to 34 Year Olds | 100 (97.1%) | 3 (2.9%) |
| 35 Years and over | 102 (71.3%) | 41 (28.7%) |
| Total | 3,077 (72.8%) | 1,150 (27.2%) |
Educational Attainment by Field of Study in Mount Vernon
Education (662 | 20.5%), business (493 | 15.3%), science & technology (470 | 14.6%), arts & humanities (277 | 8.6%), and liberal arts & history (225 | 7.0%) are the most common fields of study among 3,228 individuals in Mount Vernon who have obtained a bachelor's degree or higher.
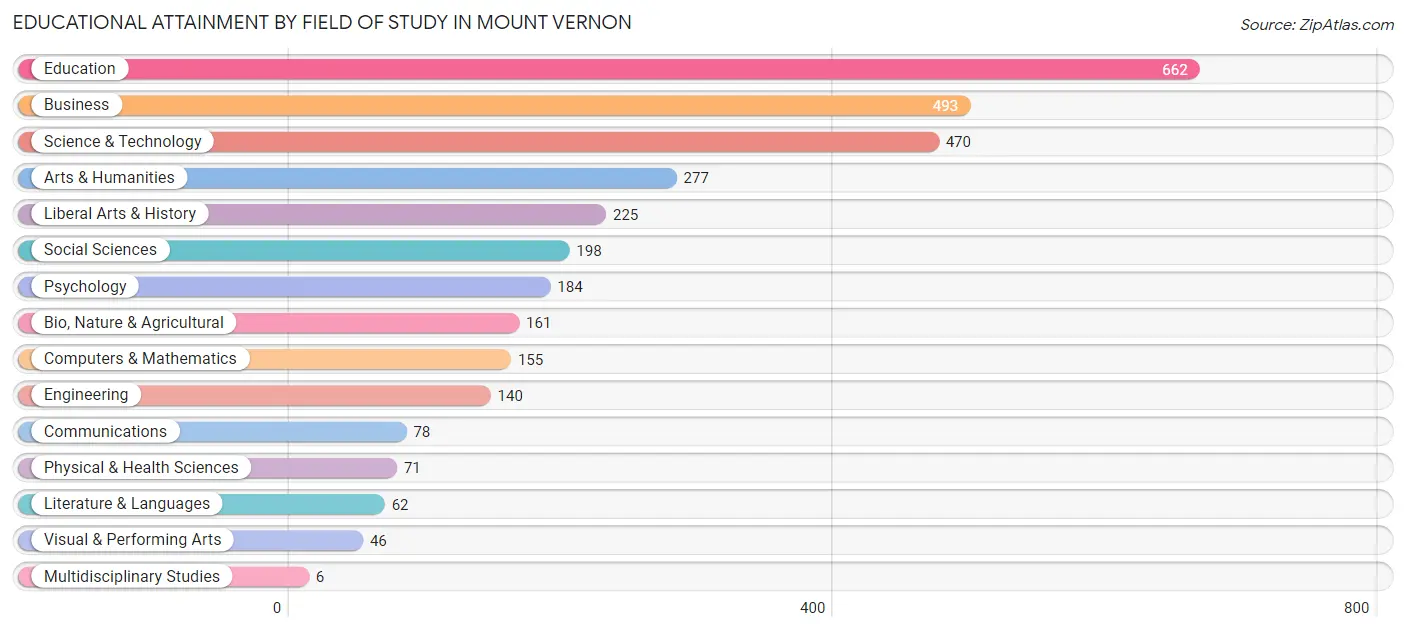
| Field of Study | # Graduates | % Graduates |
| Computers & Mathematics | 155 | 4.8% |
| Bio, Nature & Agricultural | 161 | 5.0% |
| Physical & Health Sciences | 71 | 2.2% |
| Psychology | 184 | 5.7% |
| Social Sciences | 198 | 6.1% |
| Engineering | 140 | 4.3% |
| Multidisciplinary Studies | 6 | 0.2% |
| Science & Technology | 470 | 14.6% |
| Business | 493 | 15.3% |
| Education | 662 | 20.5% |
| Literature & Languages | 62 | 1.9% |
| Liberal Arts & History | 225 | 7.0% |
| Visual & Performing Arts | 46 | 1.4% |
| Communications | 78 | 2.4% |
| Arts & Humanities | 277 | 8.6% |
| Total | 3,228 | 100.0% |
Transportation & Commute in Mount Vernon
Vehicle Availability by Sex in Mount Vernon
The most prevalent vehicle ownership categories in Mount Vernon are males with 2 vehicles (1,593, accounting for 42.1%) and females with 2 vehicles (1,542, making up 45.8%).
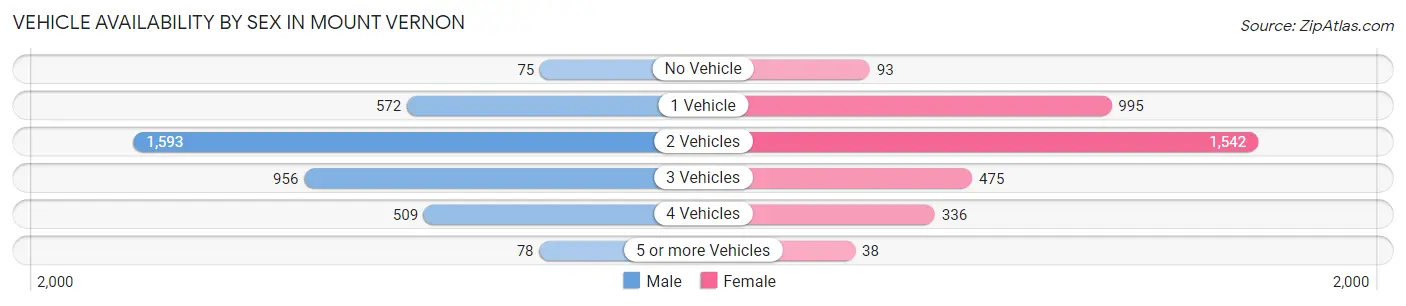
| Vehicles Available | Male | Female |
| No Vehicle | 75 (2.0%) | 93 (2.7%) |
| 1 Vehicle | 572 (15.1%) | 995 (28.6%) |
| 2 Vehicles | 1,593 (42.1%) | 1,542 (44.3%) |
| 3 Vehicles | 956 (25.3%) | 475 (13.7%) |
| 4 Vehicles | 509 (13.5%) | 336 (9.7%) |
| 5 or more Vehicles | 78 (2.1%) | 38 (1.1%) |
| Total | 3,783 (100.0%) | 3,479 (100.0%) |
Commute Time in Mount Vernon
The most frequently occuring commute durations in Mount Vernon are 10 to 14 minutes (1,672 commuters, 24.0%), 5 to 9 minutes (1,538 commuters, 22.1%), and 15 to 19 minutes (963 commuters, 13.8%).
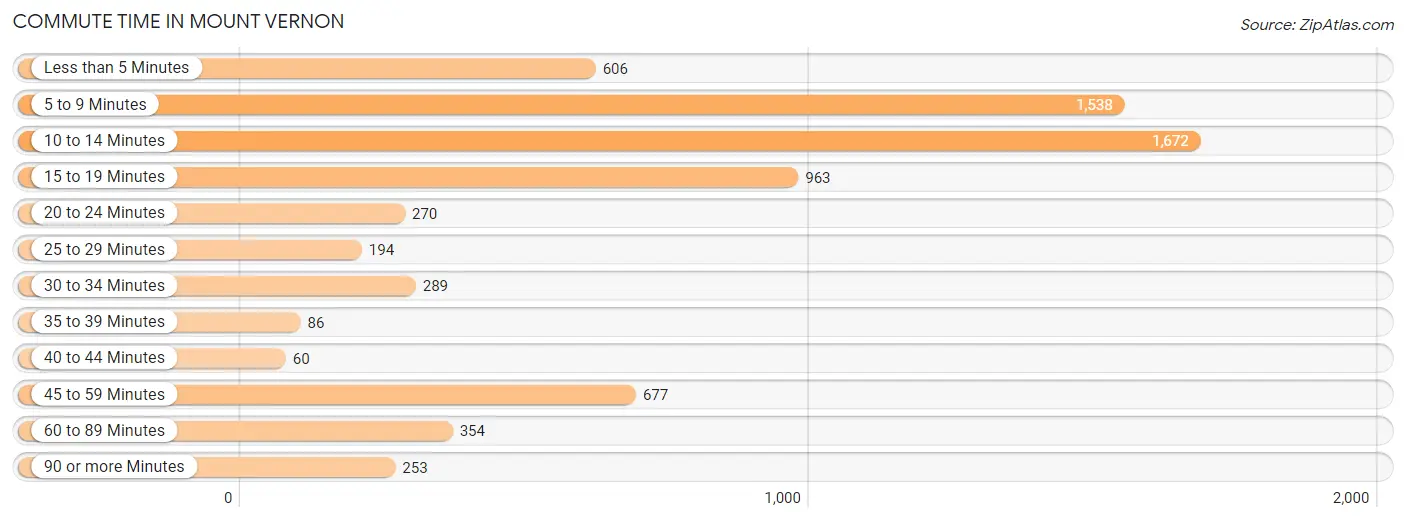
| Commute Time | # Commuters | % Commuters |
| Less than 5 Minutes | 606 | 8.7% |
| 5 to 9 Minutes | 1,538 | 22.1% |
| 10 to 14 Minutes | 1,672 | 24.0% |
| 15 to 19 Minutes | 963 | 13.8% |
| 20 to 24 Minutes | 270 | 3.9% |
| 25 to 29 Minutes | 194 | 2.8% |
| 30 to 34 Minutes | 289 | 4.2% |
| 35 to 39 Minutes | 86 | 1.2% |
| 40 to 44 Minutes | 60 | 0.9% |
| 45 to 59 Minutes | 677 | 9.7% |
| 60 to 89 Minutes | 354 | 5.1% |
| 90 or more Minutes | 253 | 3.6% |
Commute Time by Sex in Mount Vernon
The most common commute times in Mount Vernon are 10 to 14 minutes (906 commuters, 24.4%) for males and 5 to 9 minutes (912 commuters, 28.1%) for females.
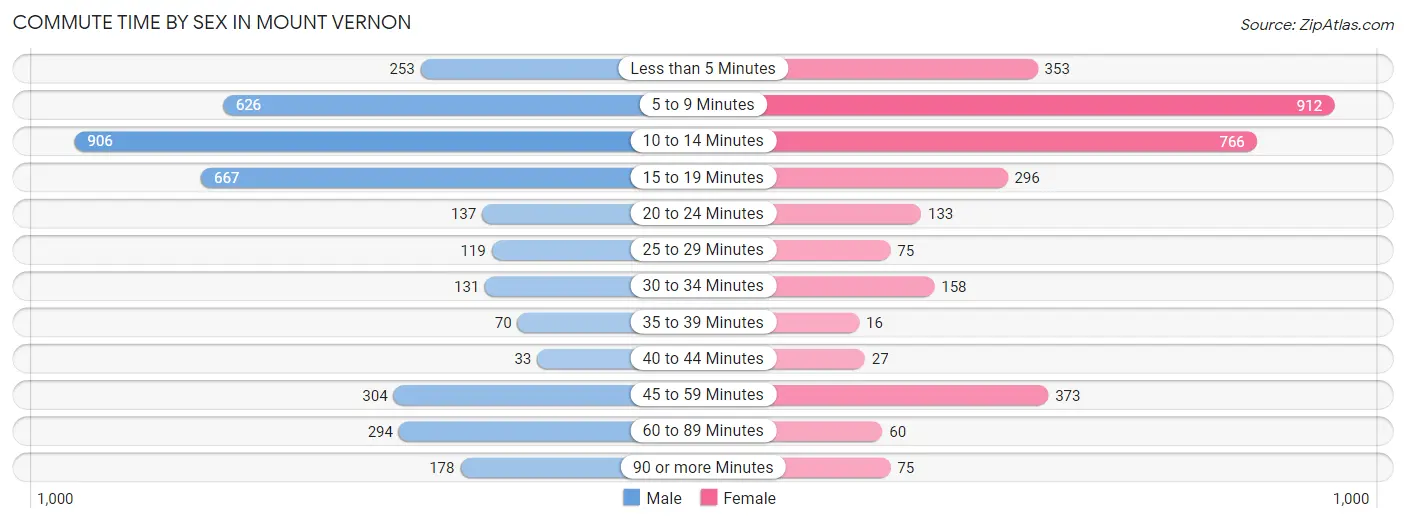
| Commute Time | Male | Female |
| Less than 5 Minutes | 253 (6.8%) | 353 (10.9%) |
| 5 to 9 Minutes | 626 (16.8%) | 912 (28.1%) |
| 10 to 14 Minutes | 906 (24.4%) | 766 (23.6%) |
| 15 to 19 Minutes | 667 (17.9%) | 296 (9.1%) |
| 20 to 24 Minutes | 137 (3.7%) | 133 (4.1%) |
| 25 to 29 Minutes | 119 (3.2%) | 75 (2.3%) |
| 30 to 34 Minutes | 131 (3.5%) | 158 (4.9%) |
| 35 to 39 Minutes | 70 (1.9%) | 16 (0.5%) |
| 40 to 44 Minutes | 33 (0.9%) | 27 (0.8%) |
| 45 to 59 Minutes | 304 (8.2%) | 373 (11.5%) |
| 60 to 89 Minutes | 294 (7.9%) | 60 (1.8%) |
| 90 or more Minutes | 178 (4.8%) | 75 (2.3%) |
Time of Departure to Work by Sex in Mount Vernon
The most frequent times of departure to work in Mount Vernon are 7:30 AM to 7:59 AM (492, 13.2%) for males and 7:30 AM to 7:59 AM (543, 16.7%) for females.
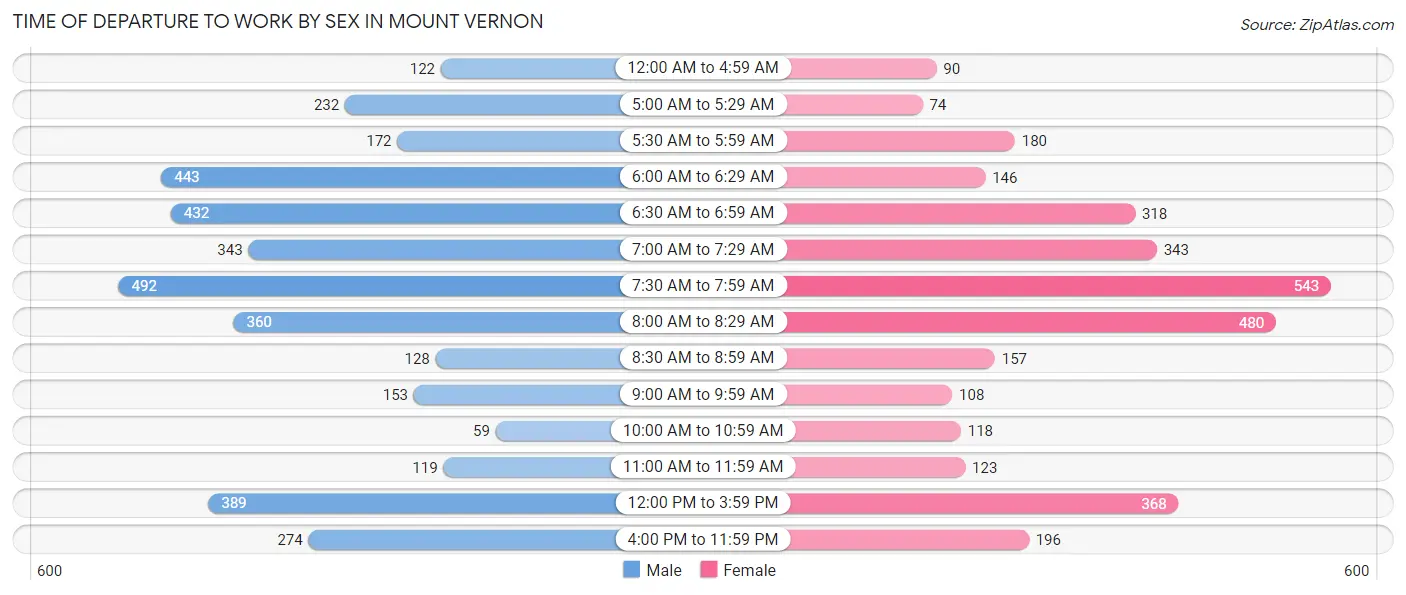
| Time of Departure | Male | Female |
| 12:00 AM to 4:59 AM | 122 (3.3%) | 90 (2.8%) |
| 5:00 AM to 5:29 AM | 232 (6.2%) | 74 (2.3%) |
| 5:30 AM to 5:59 AM | 172 (4.6%) | 180 (5.6%) |
| 6:00 AM to 6:29 AM | 443 (11.9%) | 146 (4.5%) |
| 6:30 AM to 6:59 AM | 432 (11.6%) | 318 (9.8%) |
| 7:00 AM to 7:29 AM | 343 (9.2%) | 343 (10.6%) |
| 7:30 AM to 7:59 AM | 492 (13.2%) | 543 (16.7%) |
| 8:00 AM to 8:29 AM | 360 (9.7%) | 480 (14.8%) |
| 8:30 AM to 8:59 AM | 128 (3.4%) | 157 (4.8%) |
| 9:00 AM to 9:59 AM | 153 (4.1%) | 108 (3.3%) |
| 10:00 AM to 10:59 AM | 59 (1.6%) | 118 (3.6%) |
| 11:00 AM to 11:59 AM | 119 (3.2%) | 123 (3.8%) |
| 12:00 PM to 3:59 PM | 389 (10.5%) | 368 (11.3%) |
| 4:00 PM to 11:59 PM | 274 (7.4%) | 196 (6.0%) |
| Total | 3,718 (100.0%) | 3,244 (100.0%) |
Housing Occupancy in Mount Vernon
Occupancy by Ownership in Mount Vernon
Of the total 7,181 dwellings in Mount Vernon, owner-occupied units account for 3,724 (51.9%), while renter-occupied units make up 3,457 (48.1%).
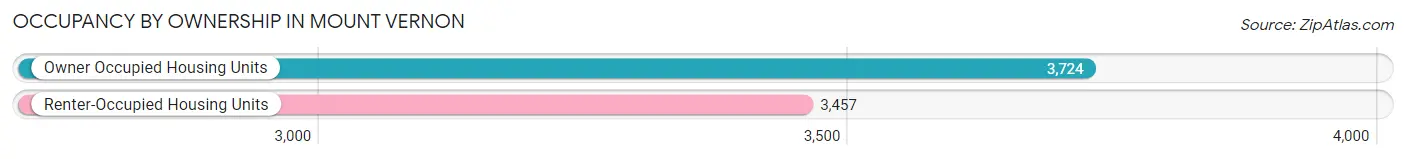
| Occupancy | # Housing Units | % Housing Units |
| Owner Occupied Housing Units | 3,724 | 51.9% |
| Renter-Occupied Housing Units | 3,457 | 48.1% |
| Total Occupied Housing Units | 7,181 | 100.0% |
Occupancy by Household Size in Mount Vernon
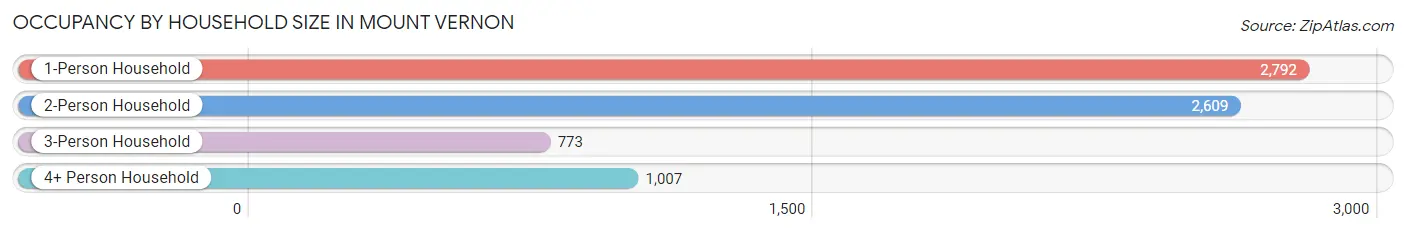
| Household Size | # Housing Units | % Housing Units |
| 1-Person Household | 2,792 | 38.9% |
| 2-Person Household | 2,609 | 36.3% |
| 3-Person Household | 773 | 10.8% |
| 4+ Person Household | 1,007 | 14.0% |
| Total Housing Units | 7,181 | 100.0% |
Occupancy by Ownership by Household Size in Mount Vernon
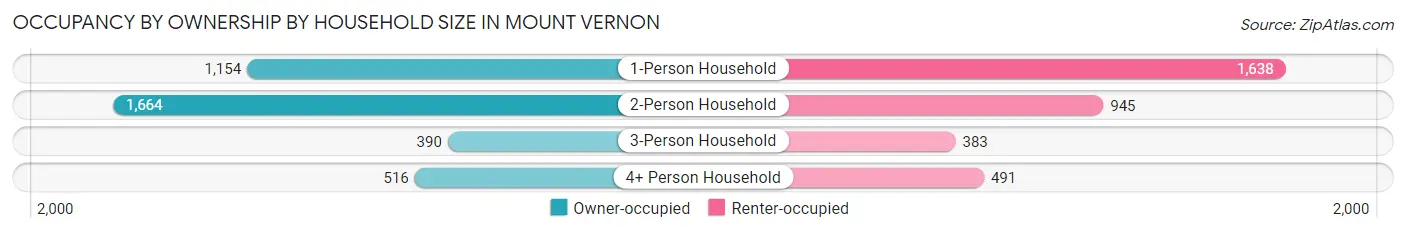
| Household Size | Owner-occupied | Renter-occupied |
| 1-Person Household | 1,154 (41.3%) | 1,638 (58.7%) |
| 2-Person Household | 1,664 (63.8%) | 945 (36.2%) |
| 3-Person Household | 390 (50.4%) | 383 (49.5%) |
| 4+ Person Household | 516 (51.2%) | 491 (48.8%) |
| Total Housing Units | 3,724 (51.9%) | 3,457 (48.1%) |
Occupancy by Educational Attainment in Mount Vernon
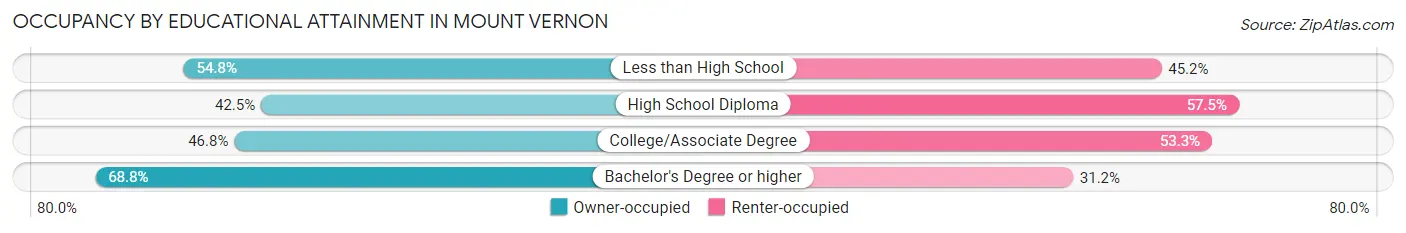
| Household Size | Owner-occupied | Renter-occupied |
| Less than High School | 298 (54.8%) | 246 (45.2%) |
| High School Diploma | 1,256 (42.5%) | 1,699 (57.5%) |
| College/Associate Degree | 770 (46.8%) | 877 (53.2%) |
| Bachelor's Degree or higher | 1,400 (68.8%) | 635 (31.2%) |
Occupancy by Age of Householder in Mount Vernon
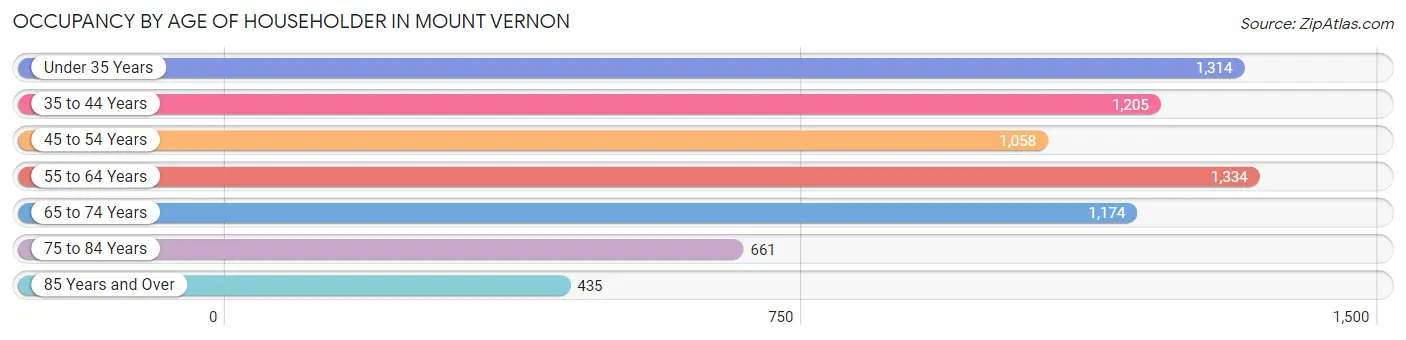
| Age Bracket | # Households | % Households |
| Under 35 Years | 1,314 | 18.3% |
| 35 to 44 Years | 1,205 | 16.8% |
| 45 to 54 Years | 1,058 | 14.7% |
| 55 to 64 Years | 1,334 | 18.6% |
| 65 to 74 Years | 1,174 | 16.4% |
| 75 to 84 Years | 661 | 9.2% |
| 85 Years and Over | 435 | 6.1% |
| Total | 7,181 | 100.0% |
Housing Finances in Mount Vernon
Median Income by Occupancy in Mount Vernon
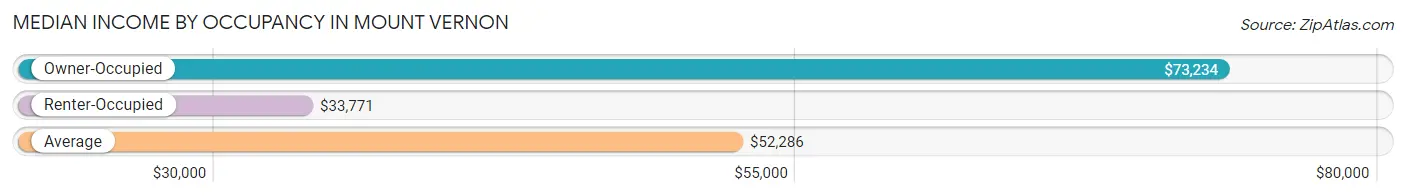
| Occupancy Type | # Households | Median Income |
| Owner-Occupied | 3,724 (51.9%) | $73,234 |
| Renter-Occupied | 3,457 (48.1%) | $33,771 |
| Average | 7,181 (100.0%) | $52,286 |
Occupancy by Householder Income Bracket in Mount Vernon
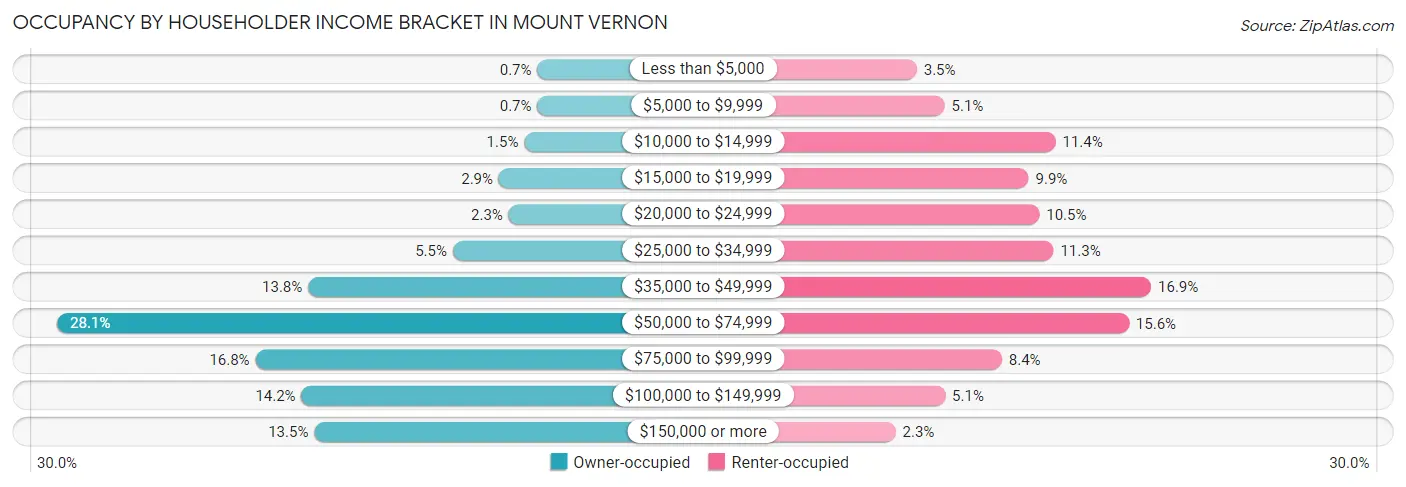
| Income Bracket | Owner-occupied | Renter-occupied |
| Less than $5,000 | 26 (0.7%) | 121 (3.5%) |
| $5,000 to $9,999 | 26 (0.7%) | 176 (5.1%) |
| $10,000 to $14,999 | 54 (1.5%) | 395 (11.4%) |
| $15,000 to $19,999 | 108 (2.9%) | 342 (9.9%) |
| $20,000 to $24,999 | 87 (2.3%) | 363 (10.5%) |
| $25,000 to $34,999 | 206 (5.5%) | 391 (11.3%) |
| $35,000 to $49,999 | 514 (13.8%) | 584 (16.9%) |
| $50,000 to $74,999 | 1,048 (28.1%) | 540 (15.6%) |
| $75,000 to $99,999 | 626 (16.8%) | 289 (8.4%) |
| $100,000 to $149,999 | 528 (14.2%) | 177 (5.1%) |
| $150,000 or more | 501 (13.5%) | 79 (2.3%) |
| Total | 3,724 (100.0%) | 3,457 (100.0%) |
Monthly Housing Cost Tiers in Mount Vernon
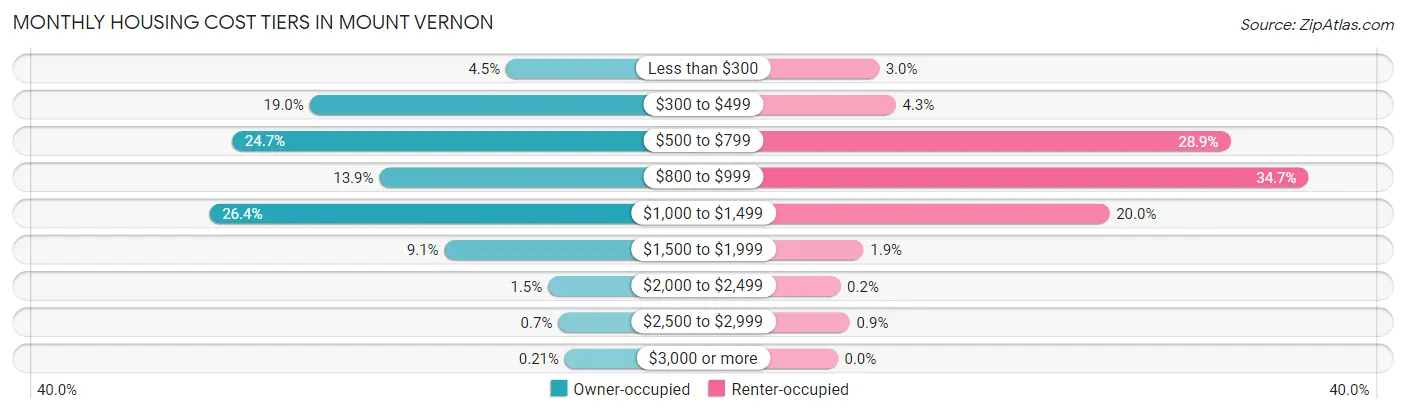
| Monthly Cost | Owner-occupied | Renter-occupied |
| Less than $300 | 169 (4.5%) | 105 (3.0%) |
| $300 to $499 | 708 (19.0%) | 148 (4.3%) |
| $500 to $799 | 921 (24.7%) | 1,000 (28.9%) |
| $800 to $999 | 517 (13.9%) | 1,199 (34.7%) |
| $1,000 to $1,499 | 983 (26.4%) | 692 (20.0%) |
| $1,500 to $1,999 | 338 (9.1%) | 66 (1.9%) |
| $2,000 to $2,499 | 54 (1.5%) | 7 (0.2%) |
| $2,500 to $2,999 | 26 (0.7%) | 31 (0.9%) |
| $3,000 or more | 8 (0.2%) | 0 (0.0%) |
| Total | 3,724 (100.0%) | 3,457 (100.0%) |
Physical Housing Characteristics in Mount Vernon
Housing Structures in Mount Vernon
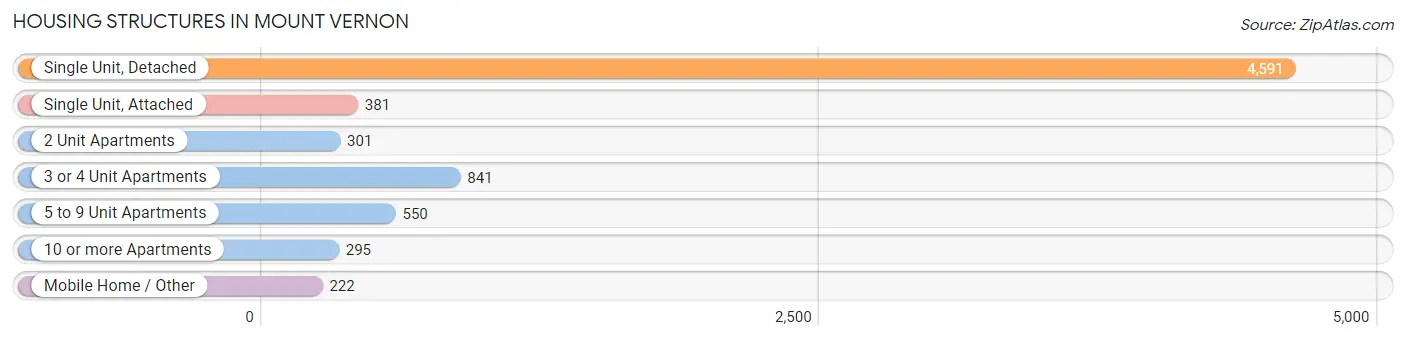
| Structure Type | # Housing Units | % Housing Units |
| Single Unit, Detached | 4,591 | 63.9% |
| Single Unit, Attached | 381 | 5.3% |
| 2 Unit Apartments | 301 | 4.2% |
| 3 or 4 Unit Apartments | 841 | 11.7% |
| 5 to 9 Unit Apartments | 550 | 7.7% |
| 10 or more Apartments | 295 | 4.1% |
| Mobile Home / Other | 222 | 3.1% |
| Total | 7,181 | 100.0% |
Housing Structures by Occupancy in Mount Vernon
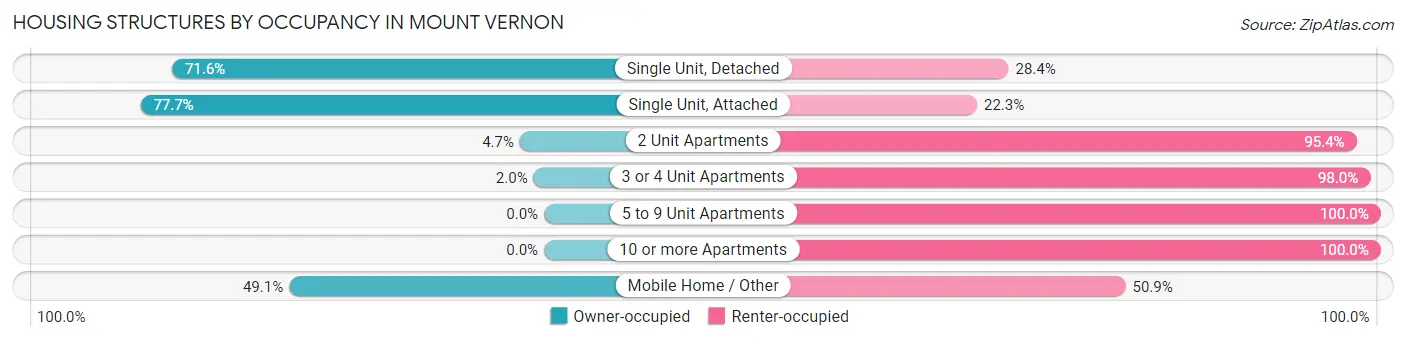
| Structure Type | Owner-occupied | Renter-occupied |
| Single Unit, Detached | 3,288 (71.6%) | 1,303 (28.4%) |
| Single Unit, Attached | 296 (77.7%) | 85 (22.3%) |
| 2 Unit Apartments | 14 (4.6%) | 287 (95.4%) |
| 3 or 4 Unit Apartments | 17 (2.0%) | 824 (98.0%) |
| 5 to 9 Unit Apartments | 0 (0.0%) | 550 (100.0%) |
| 10 or more Apartments | 0 (0.0%) | 295 (100.0%) |
| Mobile Home / Other | 109 (49.1%) | 113 (50.9%) |
| Total | 3,724 (51.9%) | 3,457 (48.1%) |
Housing Structures by Number of Rooms in Mount Vernon
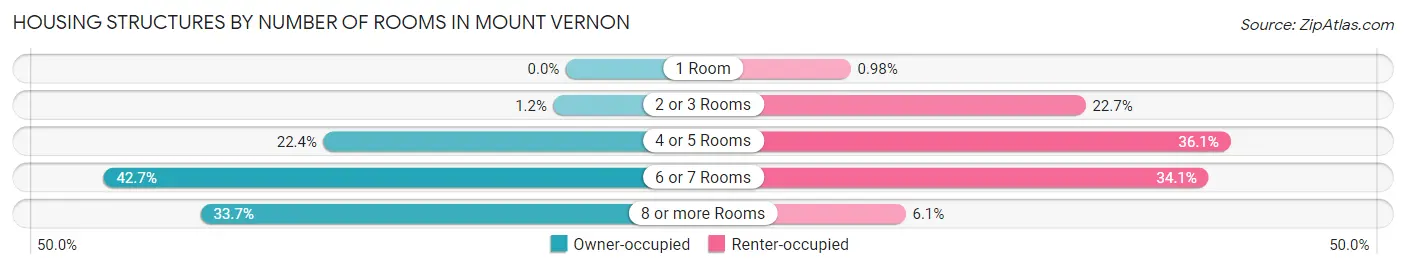
| Number of Rooms | Owner-occupied | Renter-occupied |
| 1 Room | 0 (0.0%) | 34 (1.0%) |
| 2 or 3 Rooms | 43 (1.1%) | 785 (22.7%) |
| 4 or 5 Rooms | 835 (22.4%) | 1,249 (36.1%) |
| 6 or 7 Rooms | 1,590 (42.7%) | 1,179 (34.1%) |
| 8 or more Rooms | 1,256 (33.7%) | 210 (6.1%) |
| Total | 3,724 (100.0%) | 3,457 (100.0%) |
Housing Structure by Heating Type in Mount Vernon
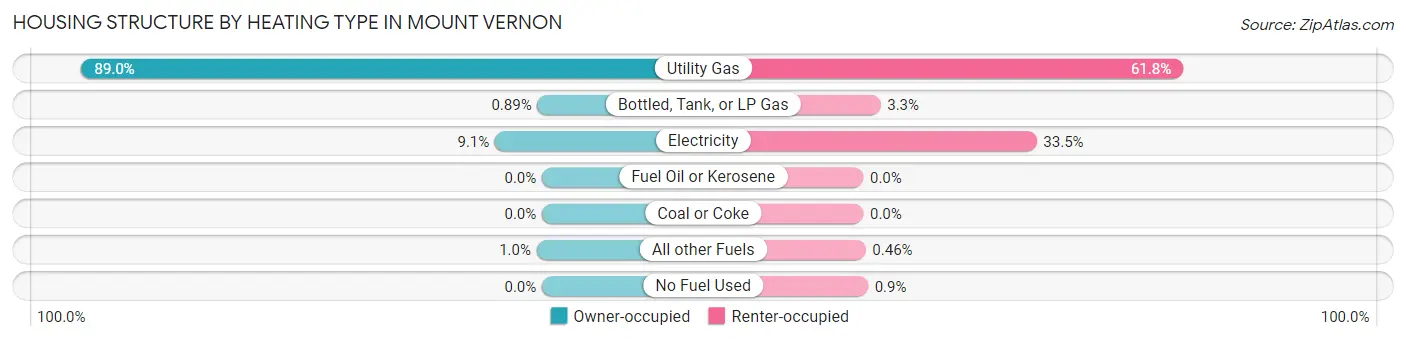
| Heating Type | Owner-occupied | Renter-occupied |
| Utility Gas | 3,315 (89.0%) | 2,137 (61.8%) |
| Bottled, Tank, or LP Gas | 33 (0.9%) | 115 (3.3%) |
| Electricity | 338 (9.1%) | 1,158 (33.5%) |
| Fuel Oil or Kerosene | 0 (0.0%) | 0 (0.0%) |
| Coal or Coke | 0 (0.0%) | 0 (0.0%) |
| All other Fuels | 38 (1.0%) | 16 (0.5%) |
| No Fuel Used | 0 (0.0%) | 31 (0.9%) |
| Total | 3,724 (100.0%) | 3,457 (100.0%) |
Household Vehicle Usage in Mount Vernon
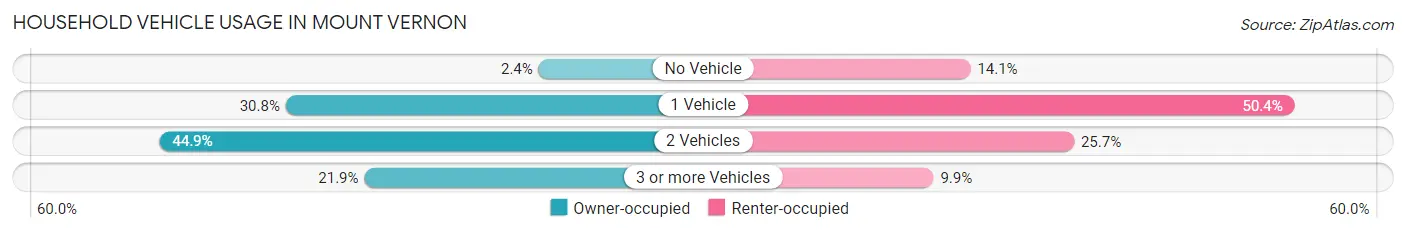
| Vehicles per Household | Owner-occupied | Renter-occupied |
| No Vehicle | 90 (2.4%) | 486 (14.1%) |
| 1 Vehicle | 1,145 (30.7%) | 1,741 (50.4%) |
| 2 Vehicles | 1,672 (44.9%) | 887 (25.7%) |
| 3 or more Vehicles | 817 (21.9%) | 343 (9.9%) |
| Total | 3,724 (100.0%) | 3,457 (100.0%) |
Real Estate & Mortgages in Mount Vernon
Real Estate and Mortgage Overview in Mount Vernon
| Characteristic | Without Mortgage | With Mortgage |
| Housing Units | 1,548 | 2,176 |
| Median Property Value | $150,000 | $149,000 |
| Median Household Income | $58,397 | $309 |
| Monthly Housing Costs | $477 | $0 |
| Real Estate Taxes | $1,590 | $27 |
Property Value by Mortgage Status in Mount Vernon
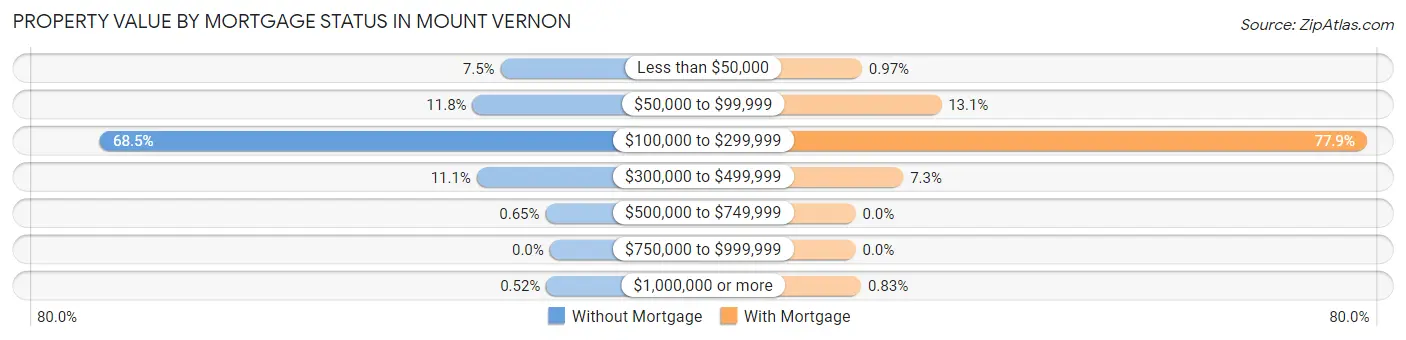
| Property Value | Without Mortgage | With Mortgage |
| Less than $50,000 | 116 (7.5%) | 21 (1.0%) |
| $50,000 to $99,999 | 182 (11.8%) | 284 (13.1%) |
| $100,000 to $299,999 | 1,060 (68.5%) | 1,695 (77.9%) |
| $300,000 to $499,999 | 172 (11.1%) | 158 (7.3%) |
| $500,000 to $749,999 | 10 (0.6%) | 0 (0.0%) |
| $750,000 to $999,999 | 0 (0.0%) | 0 (0.0%) |
| $1,000,000 or more | 8 (0.5%) | 18 (0.8%) |
| Total | 1,548 (100.0%) | 2,176 (100.0%) |
Household Income by Mortgage Status in Mount Vernon
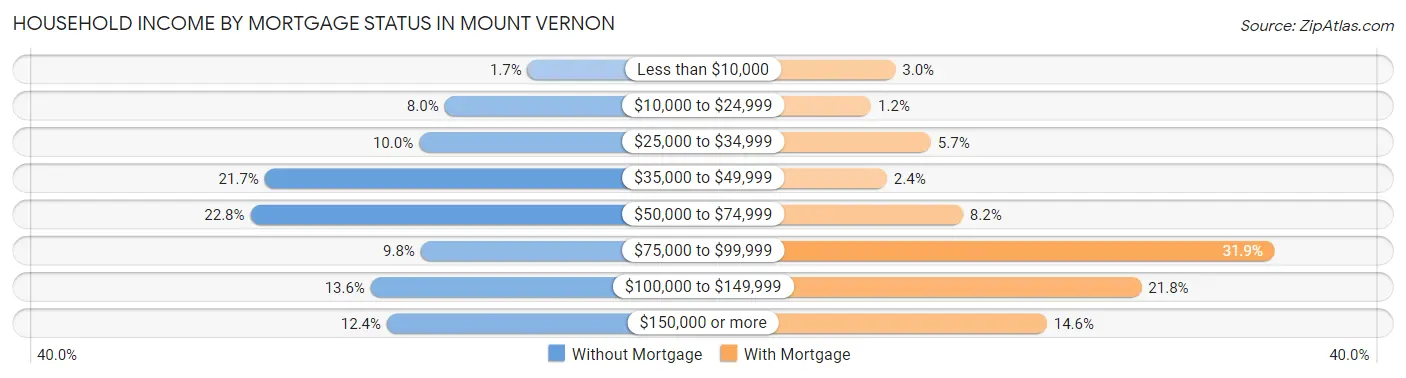
| Household Income | Without Mortgage | With Mortgage |
| Less than $10,000 | 26 (1.7%) | 66 (3.0%) |
| $10,000 to $24,999 | 124 (8.0%) | 26 (1.2%) |
| $25,000 to $34,999 | 154 (10.0%) | 125 (5.7%) |
| $35,000 to $49,999 | 336 (21.7%) | 52 (2.4%) |
| $50,000 to $74,999 | 353 (22.8%) | 178 (8.2%) |
| $75,000 to $99,999 | 152 (9.8%) | 695 (31.9%) |
| $100,000 to $149,999 | 211 (13.6%) | 474 (21.8%) |
| $150,000 or more | 192 (12.4%) | 317 (14.6%) |
| Total | 1,548 (100.0%) | 2,176 (100.0%) |
Property Value to Household Income Ratio in Mount Vernon
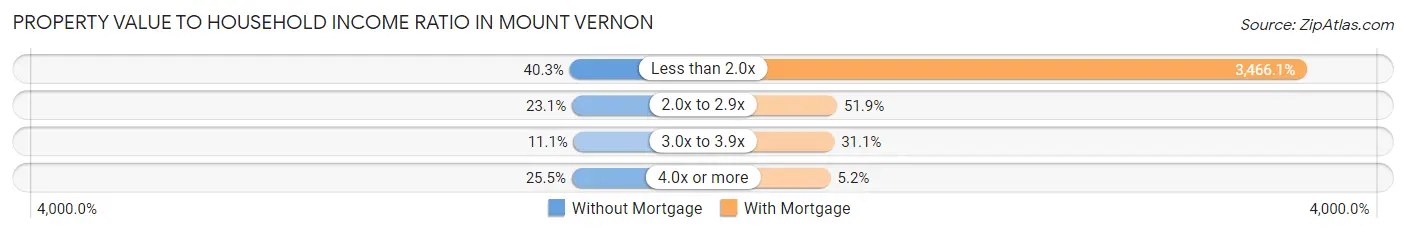
| Value-to-Income Ratio | Without Mortgage | With Mortgage |
| Less than 2.0x | 624 (40.3%) | 75,423 (3,466.1%) |
| 2.0x to 2.9x | 357 (23.1%) | 1,130 (51.9%) |
| 3.0x to 3.9x | 172 (11.1%) | 677 (31.1%) |
| 4.0x or more | 395 (25.5%) | 112 (5.1%) |
| Total | 1,548 (100.0%) | 2,176 (100.0%) |
Real Estate Taxes by Mortgage Status in Mount Vernon
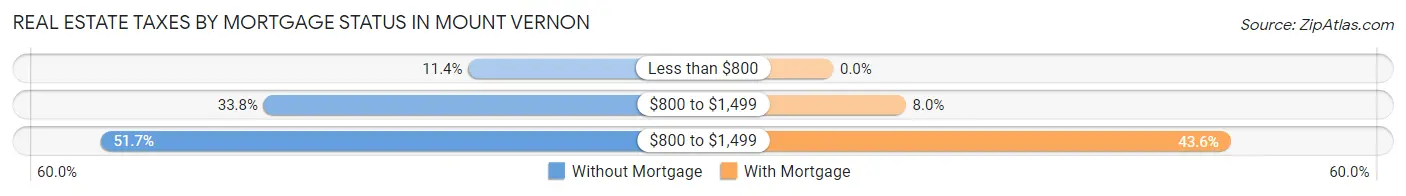
| Property Taxes | Without Mortgage | With Mortgage |
| Less than $800 | 176 (11.4%) | 0 (0.0%) |
| $800 to $1,499 | 523 (33.8%) | 173 (8.0%) |
| $800 to $1,499 | 800 (51.7%) | 948 (43.6%) |
| Total | 1,548 (100.0%) | 2,176 (100.0%) |
Health & Disability in Mount Vernon
Health Insurance Coverage by Age in Mount Vernon
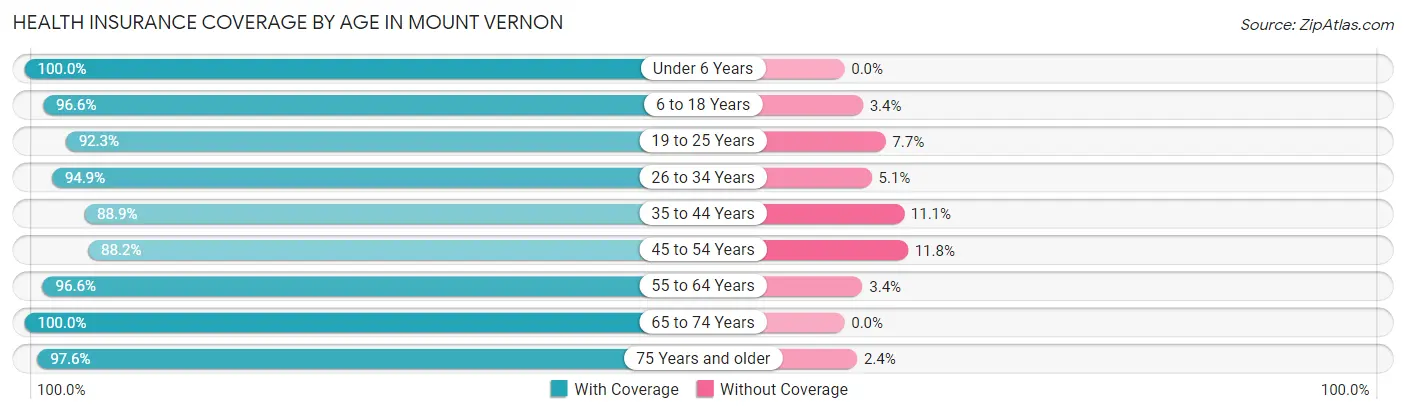
| Age Bracket | With Coverage | Without Coverage |
| Under 6 Years | 831 (100.0%) | 0 (0.0%) |
| 6 to 18 Years | 2,608 (96.6%) | 93 (3.4%) |
| 19 to 25 Years | 1,806 (92.3%) | 150 (7.7%) |
| 26 to 34 Years | 1,528 (94.9%) | 82 (5.1%) |
| 35 to 44 Years | 2,097 (88.9%) | 262 (11.1%) |
| 45 to 54 Years | 1,624 (88.2%) | 218 (11.8%) |
| 55 to 64 Years | 1,833 (96.6%) | 64 (3.4%) |
| 65 to 74 Years | 1,808 (100.0%) | 0 (0.0%) |
| 75 Years and older | 1,487 (97.6%) | 36 (2.4%) |
| Total | 15,622 (94.5%) | 905 (5.5%) |
Health Insurance Coverage by Citizenship Status in Mount Vernon
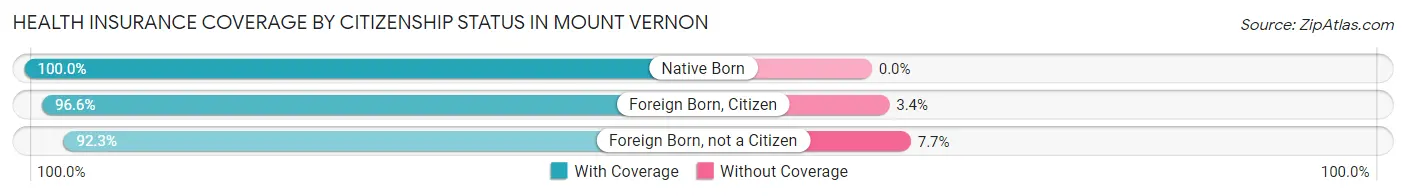
| Citizenship Status | With Coverage | Without Coverage |
| Native Born | 831 (100.0%) | 0 (0.0%) |
| Foreign Born, Citizen | 2,608 (96.6%) | 93 (3.4%) |
| Foreign Born, not a Citizen | 1,806 (92.3%) | 150 (7.7%) |
Health Insurance Coverage by Household Income in Mount Vernon
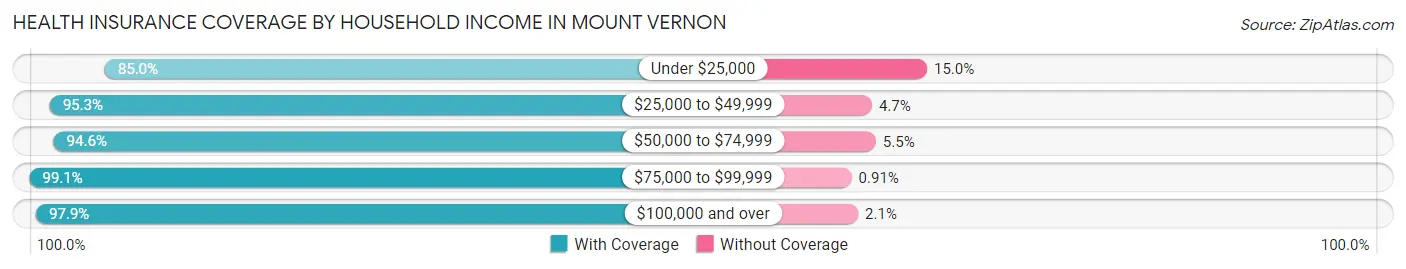
| Household Income | With Coverage | Without Coverage |
| Under $25,000 | 2,283 (85.0%) | 404 (15.0%) |
| $25,000 to $49,999 | 3,719 (95.3%) | 184 (4.7%) |
| $50,000 to $74,999 | 3,295 (94.6%) | 190 (5.4%) |
| $75,000 to $99,999 | 2,186 (99.1%) | 20 (0.9%) |
| $100,000 and over | 3,212 (97.9%) | 70 (2.1%) |
Public vs Private Health Insurance Coverage by Age in Mount Vernon
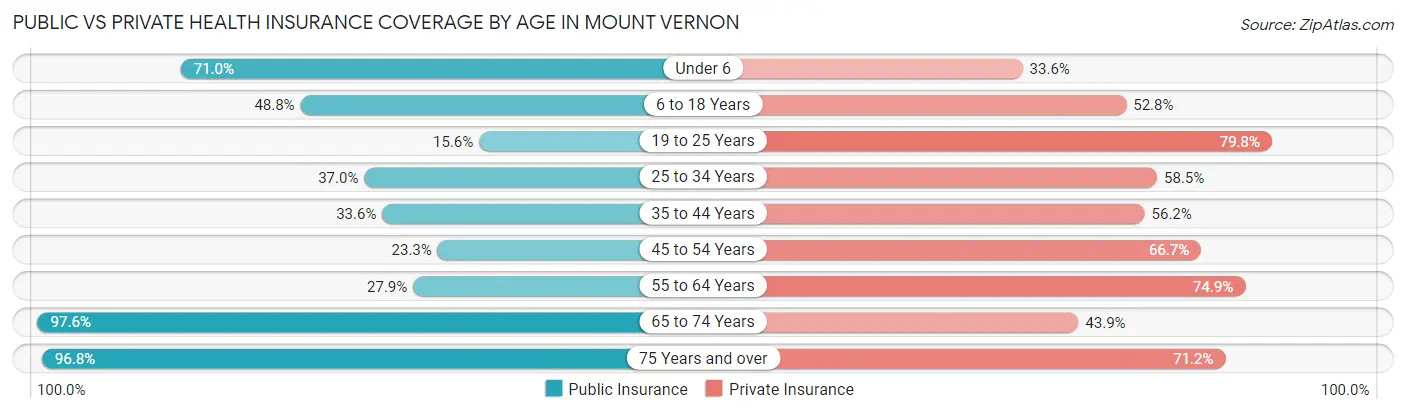
| Age Bracket | Public Insurance | Private Insurance |
| Under 6 | 590 (71.0%) | 279 (33.6%) |
| 6 to 18 Years | 1,318 (48.8%) | 1,426 (52.8%) |
| 19 to 25 Years | 306 (15.6%) | 1,561 (79.8%) |
| 25 to 34 Years | 595 (37.0%) | 942 (58.5%) |
| 35 to 44 Years | 793 (33.6%) | 1,326 (56.2%) |
| 45 to 54 Years | 430 (23.3%) | 1,228 (66.7%) |
| 55 to 64 Years | 529 (27.9%) | 1,420 (74.9%) |
| 65 to 74 Years | 1,764 (97.6%) | 794 (43.9%) |
| 75 Years and over | 1,474 (96.8%) | 1,084 (71.2%) |
| Total | 7,799 (47.2%) | 10,060 (60.9%) |
Disability Status by Sex by Age in Mount Vernon
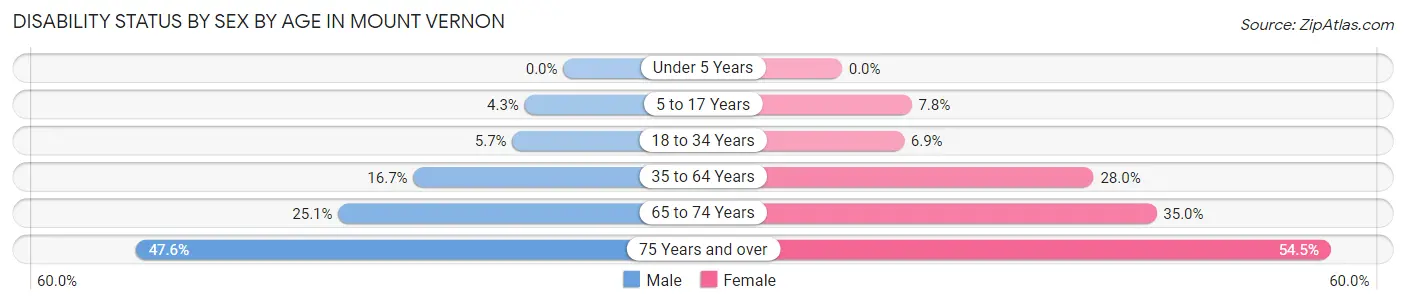
| Age Bracket | Male | Female |
| Under 5 Years | 0 (0.0%) | 0 (0.0%) |
| 5 to 17 Years | 54 (4.3%) | 99 (7.8%) |
| 18 to 34 Years | 109 (5.7%) | 135 (6.9%) |
| 35 to 64 Years | 479 (16.7%) | 905 (28.0%) |
| 65 to 74 Years | 197 (25.1%) | 358 (35.0%) |
| 75 Years and over | 260 (47.6%) | 532 (54.4%) |
Disability Class by Sex by Age in Mount Vernon
Disability Class: Hearing Difficulty
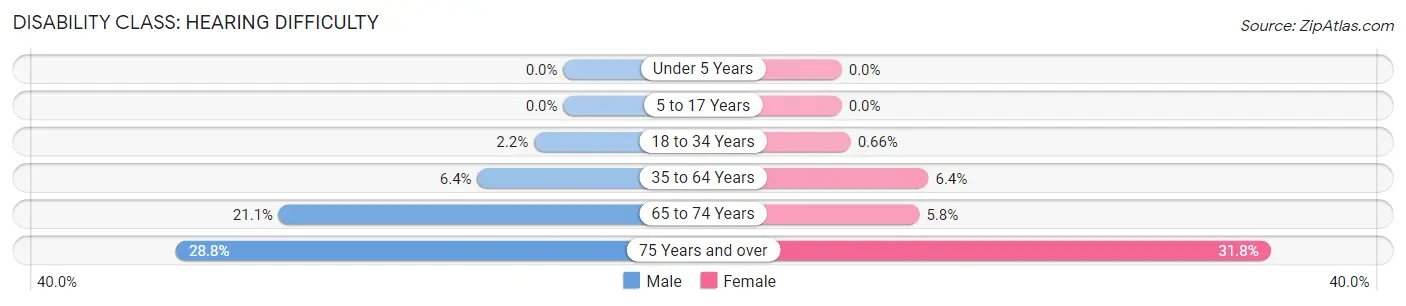
| Age Bracket | Male | Female |
| Under 5 Years | 0 (0.0%) | 0 (0.0%) |
| 5 to 17 Years | 0 (0.0%) | 0 (0.0%) |
| 18 to 34 Years | 42 (2.2%) | 13 (0.7%) |
| 35 to 64 Years | 183 (6.4%) | 208 (6.4%) |
| 65 to 74 Years | 166 (21.1%) | 59 (5.8%) |
| 75 Years and over | 157 (28.7%) | 311 (31.8%) |
Disability Class: Vision Difficulty
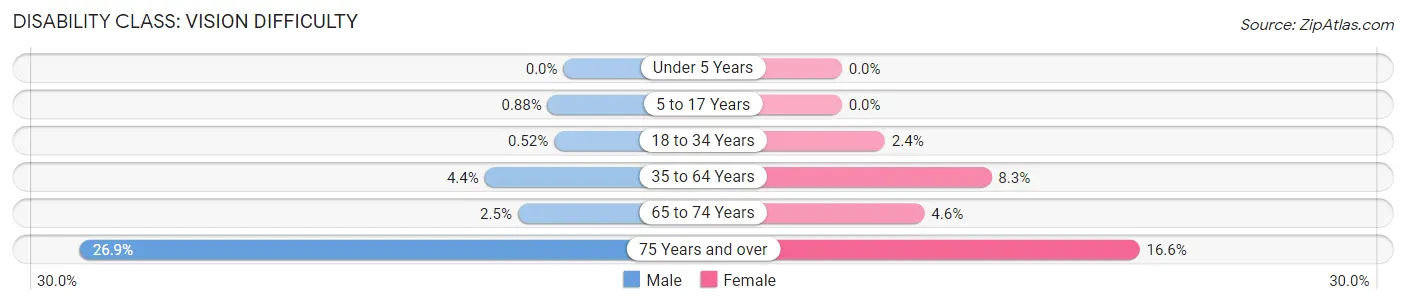
| Age Bracket | Male | Female |
| Under 5 Years | 0 (0.0%) | 0 (0.0%) |
| 5 to 17 Years | 11 (0.9%) | 0 (0.0%) |
| 18 to 34 Years | 10 (0.5%) | 47 (2.4%) |
| 35 to 64 Years | 126 (4.4%) | 269 (8.3%) |
| 65 to 74 Years | 20 (2.5%) | 47 (4.6%) |
| 75 Years and over | 147 (26.9%) | 162 (16.6%) |
Disability Class: Cognitive Difficulty
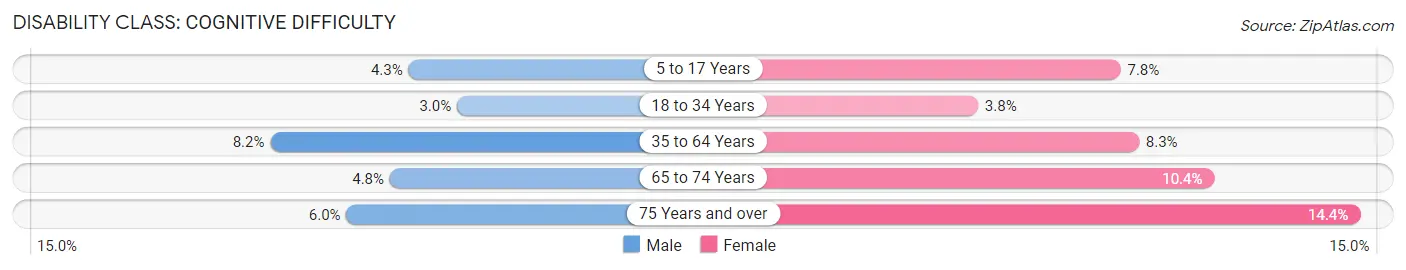
| Age Bracket | Male | Female |
| 5 to 17 Years | 54 (4.3%) | 99 (7.8%) |
| 18 to 34 Years | 57 (3.0%) | 74 (3.8%) |
| 35 to 64 Years | 234 (8.2%) | 267 (8.3%) |
| 65 to 74 Years | 38 (4.8%) | 106 (10.4%) |
| 75 Years and over | 33 (6.0%) | 141 (14.4%) |
Disability Class: Ambulatory Difficulty
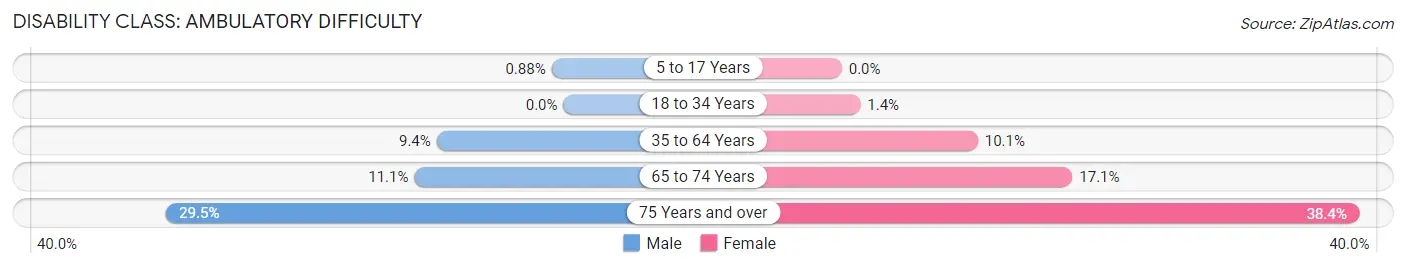
| Age Bracket | Male | Female |
| 5 to 17 Years | 11 (0.9%) | 0 (0.0%) |
| 18 to 34 Years | 0 (0.0%) | 27 (1.4%) |
| 35 to 64 Years | 270 (9.4%) | 326 (10.1%) |
| 65 to 74 Years | 87 (11.1%) | 175 (17.1%) |
| 75 Years and over | 161 (29.5%) | 375 (38.4%) |
Disability Class: Self-Care Difficulty
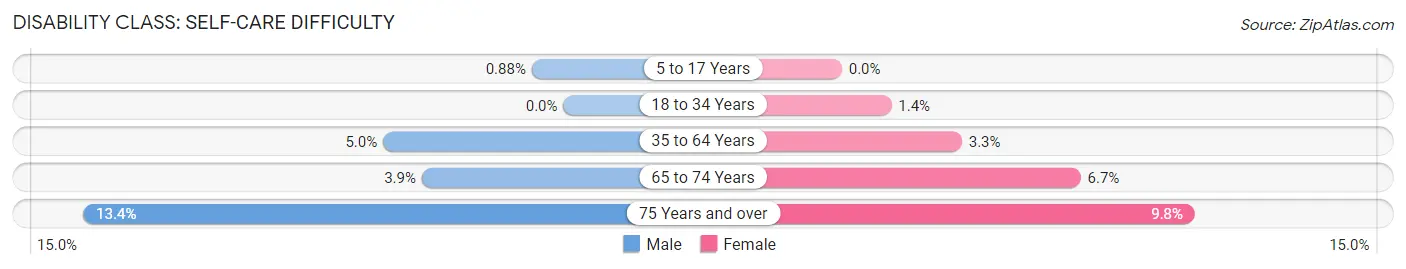
| Age Bracket | Male | Female |
| 5 to 17 Years | 11 (0.9%) | 0 (0.0%) |
| 18 to 34 Years | 0 (0.0%) | 27 (1.4%) |
| 35 to 64 Years | 144 (5.0%) | 108 (3.3%) |
| 65 to 74 Years | 31 (3.9%) | 68 (6.7%) |
| 75 Years and over | 73 (13.4%) | 96 (9.8%) |
Technology Access in Mount Vernon
Computing Device Access in Mount Vernon
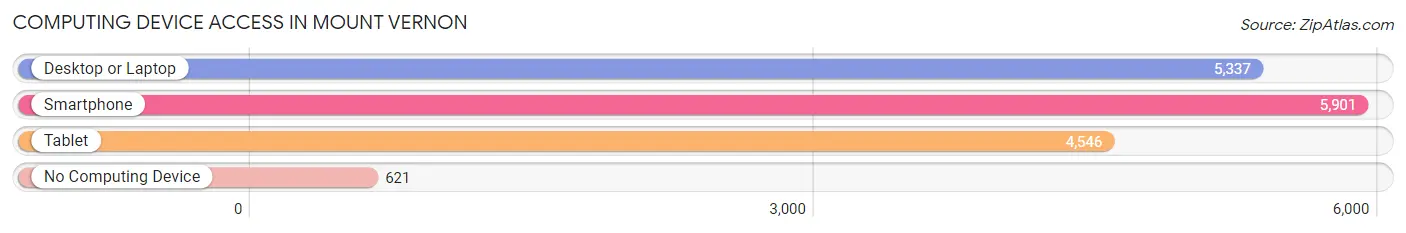
| Device Type | # Households | % Households |
| Desktop or Laptop | 5,337 | 74.3% |
| Smartphone | 5,901 | 82.2% |
| Tablet | 4,546 | 63.3% |
| No Computing Device | 621 | 8.6% |
| Total | 7,181 | 100.0% |
Internet Access in Mount Vernon
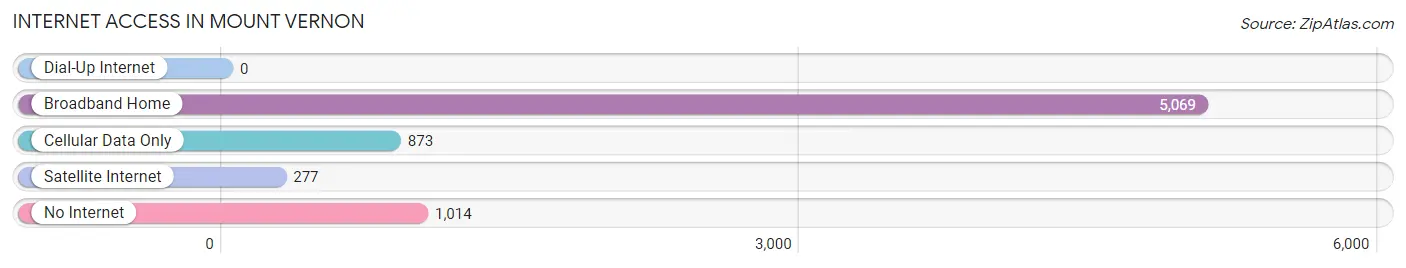
| Internet Type | # Households | % Households |
| Dial-Up Internet | 0 | 0.0% |
| Broadband Home | 5,069 | 70.6% |
| Cellular Data Only | 873 | 12.2% |
| Satellite Internet | 277 | 3.9% |
| No Internet | 1,014 | 14.1% |
| Total | 7,181 | 100.0% |
Mount Vernon Summary
Introduction
Mount Vernon, Ohio is a city located in Knox County, Ohio, United States. It is the county seat of Knox County and is located in the central part of the state. The city is situated on the Kokosing River, approximately 40 miles northeast of Columbus, the state capital. The population of Mount Vernon was 16,990 at the 2010 census, making it the largest city in Knox County.
History
Mount Vernon was founded in 1805 by William Doan, a Revolutionary War veteran. Doan named the city after George Washington's Virginia estate, Mount Vernon. The city was incorporated in 1817 and became the county seat of Knox County in 1824.
Mount Vernon was a major stop on the Underground Railroad, with many slaves escaping to freedom in Canada. The city was also a major center of the abolitionist movement in the mid-1800s.
In the late 19th century, Mount Vernon was a major industrial center, with several factories producing a variety of products, including furniture, textiles, and agricultural equipment. The city was also home to several railroads, which connected it to other parts of the state and country.
Geography
Mount Vernon is located at 40°23'N, 82°27'W (40.38, -82.45). The city is situated on the Kokosing River, approximately 40 miles northeast of Columbus, the state capital. The city has a total area of 8.3 square miles, all of which is land.
The city is located in the Central Lowlands region of Ohio, which is characterized by rolling hills and flat plains. The climate is humid continental, with hot, humid summers and cold, snowy winters.
Economy
Mount Vernon's economy is largely based on manufacturing and agriculture. The city is home to several factories, including a furniture factory, a textile mill, and an agricultural equipment manufacturer. The city is also home to several retail stores, restaurants, and other businesses.
The city is also home to several educational institutions, including Mount Vernon Nazarene University, Kenyon College, and Central Ohio Technical College.
Demographics
As of the 2010 census, the population of Mount Vernon was 16,990. The racial makeup of the city was 92.3% White, 4.2% African American, 0.4% Native American, 0.7% Asian, 0.1% Pacific Islander, 0.7% from other races, and 1.6% from two or more races. Hispanic or Latino of any race were 2.2% of the population.
The median household income in Mount Vernon was $37,945, and the median family income was $45,945. The per capita income was $20,845. About 14.3% of families and 17.2% of the population were below the poverty line, including 25.2% of those under age 18 and 8.2% of those age 65 or over.
Conclusion
Mount Vernon, Ohio is a city located in Knox County, Ohio, United States. It is the county seat of Knox County and is located in the central part of the state. The city is situated on the Kokosing River, approximately 40 miles northeast of Columbus, the state capital. The population of Mount Vernon was 16,990 at the 2010 census, making it the largest city in Knox County. The city's economy is largely based on manufacturing and agriculture, and it is home to several educational institutions. The racial makeup of the city is predominantly white, with African Americans, Native Americans, Asians, and Pacific Islanders making up the remainder of the population. The median household income in Mount Vernon was $37,945, and the median family income was $45,945. About 14.3% of families and 17.2% of the population were below the poverty line.
Common Questions
What is Per Capita Income in Mount Vernon?
Per Capita income in Mount Vernon is $29,548.
What is the Median Family Income in Mount Vernon?
Median Family Income in Mount Vernon is $65,325.
What is the Median Household income in Mount Vernon?
Median Household Income in Mount Vernon is $52,286.
What is Income or Wage Gap in Mount Vernon?
Income or Wage Gap in Mount Vernon is 25.7%.
Women in Mount Vernon earn 74.3 cents for every dollar earned by a man.
What is Inequality or Gini Index in Mount Vernon?
Inequality or Gini Index in Mount Vernon is 0.43.
What is the Total Population of Mount Vernon?
Total Population of Mount Vernon is 16,861.
What is the Total Male Population of Mount Vernon?
Total Male Population of Mount Vernon is 7,890.
What is the Total Female Population of Mount Vernon?
Total Female Population of Mount Vernon is 8,971.
What is the Ratio of Males per 100 Females in Mount Vernon?
There are 87.95 Males per 100 Females in Mount Vernon.
What is the Ratio of Females per 100 Males in Mount Vernon?
There are 113.70 Females per 100 Males in Mount Vernon.
What is the Median Population Age in Mount Vernon?
Median Population Age in Mount Vernon is 40.5 Years.
What is the Average Family Size in Mount Vernon
Average Family Size in Mount Vernon is 2.9 People.
What is the Average Household Size in Mount Vernon
Average Household Size in Mount Vernon is 2.2 People.
How Large is the Labor Force in Mount Vernon?
There are 8,237 People in the Labor Forcein in Mount Vernon.
What is the Percentage of People in the Labor Force in Mount Vernon?
58.0% of People are in the Labor Force in Mount Vernon.
What is the Unemployment Rate in Mount Vernon?
Unemployment Rate in Mount Vernon is 3.3%.