Steubenville, OH Map & Demographics
Steubenville Map
Steubenville Overview
$26,747
PER CAPITA INCOME
$67,750
AVG FAMILY INCOME
$42,725
AVG HOUSEHOLD INCOME
37.9%
WAGE / INCOME GAP [ % ]
62.1¢/ $1
WAGE / INCOME GAP [ $ ]
$11,875
FAMILY INCOME DEFICIT
0.52
INEQUALITY / GINI INDEX
18,175
TOTAL POPULATION
8,893
MALE POPULATION
9,282
FEMALE POPULATION
95.81
MALES / 100 FEMALES
104.37
FEMALES / 100 MALES
37.0
MEDIAN AGE
3.1
AVG FAMILY SIZE
2.2
AVG HOUSEHOLD SIZE
8,412
LABOR FORCE [ PEOPLE ]
55.0%
PERCENT IN LABOR FORCE
7.6%
UNEMPLOYMENT RATE
Steubenville Area Codes
Income in Steubenville
Income Overview in Steubenville
Per Capita Income in Steubenville is $26,747, while median incomes of families and households are $67,750 and $42,725 respectively.
| Characteristic | Number | Measure |
| Per Capita Income | 18,175 | $26,747 |
| Median Family Income | 3,671 | $67,750 |
| Mean Family Income | 3,671 | $83,641 |
| Median Household Income | 7,382 | $42,725 |
| Mean Household Income | 7,382 | $61,119 |
| Income Deficit | 3,671 | $11,875 |
| Wage / Income Gap (%) | 18,175 | 37.86% |
| Wage / Income Gap ($) | 18,175 | 62.14¢ per $1 |
| Gini / Inequality Index | 18,175 | 0.52 |
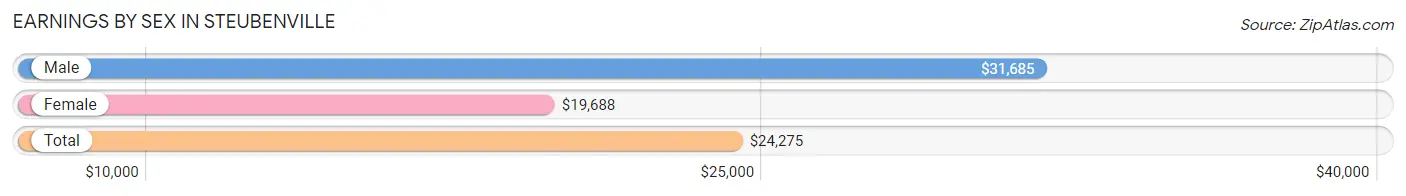
Earnings by Sex in Steubenville
Average Earnings in Steubenville are $24,275, $31,685 for men and $19,688 for women, a difference of 37.9%.
| Sex | Number | Average Earnings |
| Male | 4,426 (48.2%) | $31,685 |
| Female | 4,761 (51.8%) | $19,688 |
| Total | 9,187 (100.0%) | $24,275 |
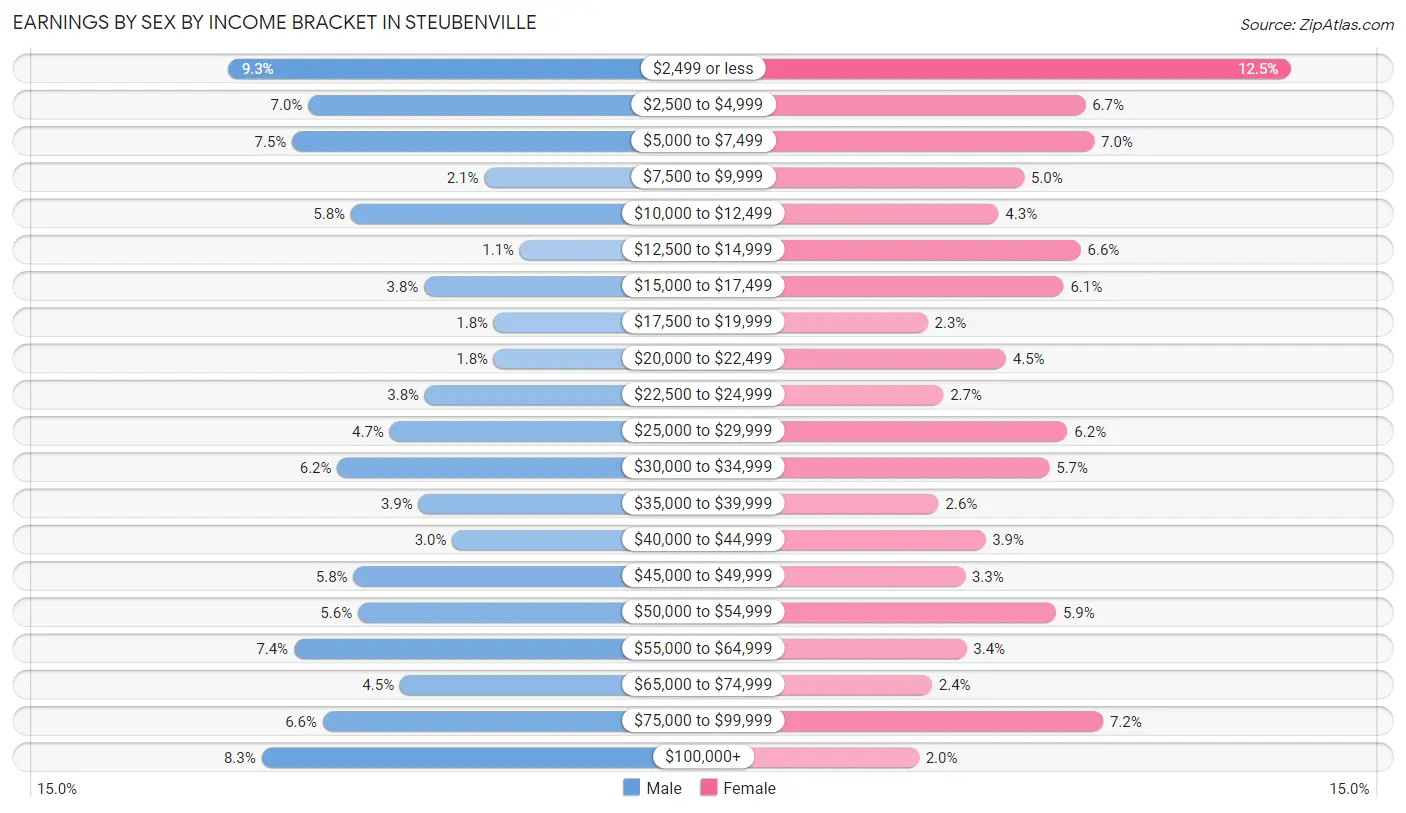
Earnings by Sex by Income Bracket in Steubenville
The most common earnings brackets in Steubenville are $2,499 or less for men (410 | 9.3%) and $2,499 or less for women (593 | 12.5%).
| Income | Male | Female |
| $2,499 or less | 410 (9.3%) | 593 (12.5%) |
| $2,500 to $4,999 | 311 (7.0%) | 319 (6.7%) |
| $5,000 to $7,499 | 331 (7.5%) | 331 (7.0%) |
| $7,500 to $9,999 | 92 (2.1%) | 237 (5.0%) |
| $10,000 to $12,499 | 258 (5.8%) | 203 (4.3%) |
| $12,500 to $14,999 | 48 (1.1%) | 313 (6.6%) |
| $15,000 to $17,499 | 167 (3.8%) | 290 (6.1%) |
| $17,500 to $19,999 | 80 (1.8%) | 108 (2.3%) |
| $20,000 to $22,499 | 80 (1.8%) | 213 (4.5%) |
| $22,500 to $24,999 | 166 (3.7%) | 129 (2.7%) |
| $25,000 to $29,999 | 210 (4.7%) | 295 (6.2%) |
| $30,000 to $34,999 | 275 (6.2%) | 271 (5.7%) |
| $35,000 to $39,999 | 174 (3.9%) | 123 (2.6%) |
| $40,000 to $44,999 | 132 (3.0%) | 185 (3.9%) |
| $45,000 to $49,999 | 255 (5.8%) | 158 (3.3%) |
| $50,000 to $54,999 | 249 (5.6%) | 280 (5.9%) |
| $55,000 to $64,999 | 329 (7.4%) | 160 (3.4%) |
| $65,000 to $74,999 | 197 (4.4%) | 114 (2.4%) |
| $75,000 to $99,999 | 293 (6.6%) | 343 (7.2%) |
| $100,000+ | 369 (8.3%) | 96 (2.0%) |
| Total | 4,426 (100.0%) | 4,761 (100.0%) |
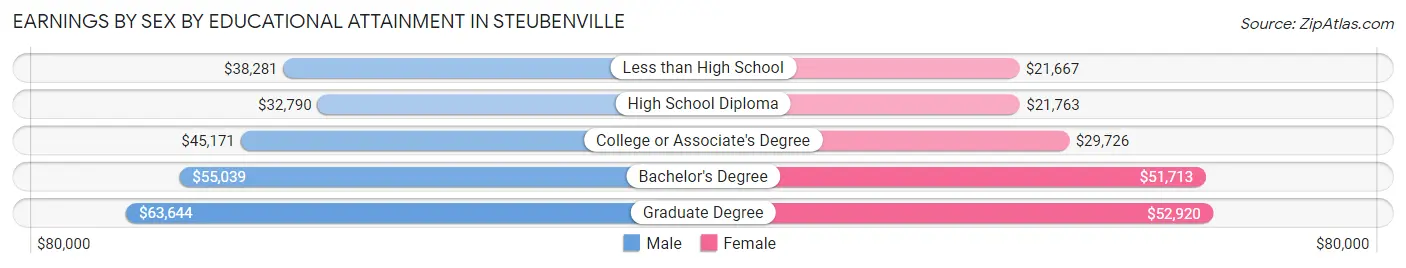
Earnings by Sex by Educational Attainment in Steubenville
Average earnings in Steubenville are $42,326 for men and $30,603 for women, a difference of 27.7%. Men with an educational attainment of graduate degree enjoy the highest average annual earnings of $63,644, while those with high school diploma education earn the least with $32,790. Women with an educational attainment of graduate degree earn the most with the average annual earnings of $52,920, while those with less than high school education have the smallest earnings of $21,667.
| Educational Attainment | Male Income | Female Income |
| Less than High School | $38,281 | $21,667 |
| High School Diploma | $32,790 | $21,763 |
| College or Associate's Degree | $45,171 | $29,726 |
| Bachelor's Degree | $55,039 | $51,713 |
| Graduate Degree | $63,644 | $52,920 |
| Total | $42,326 | $30,603 |
Family Income in Steubenville
Family Income Brackets in Steubenville
According to the Steubenville family income data, there are 694 families falling into the $75,000 to $99,999 income range, which is the most common income bracket and makes up 18.9% of all families. Conversely, the $200,000+ income bracket is the least frequent group with only 117 families (3.2%) belonging to this category.
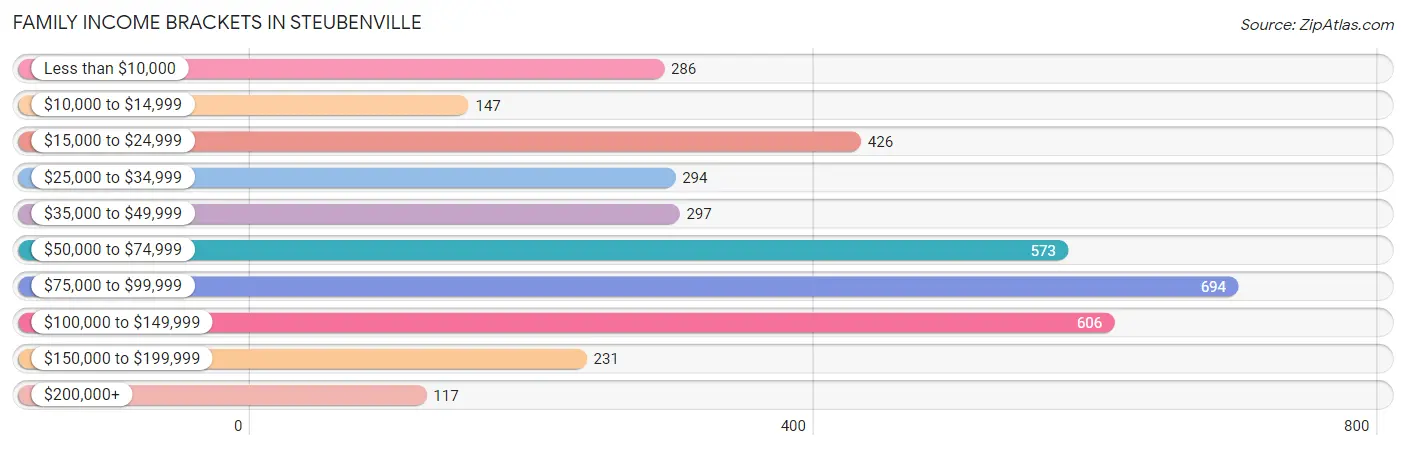
| Income Bracket | # Families | % Families |
| Less than $10,000 | 286 | 7.8% |
| $10,000 to $14,999 | 147 | 4.0% |
| $15,000 to $24,999 | 426 | 11.6% |
| $25,000 to $34,999 | 294 | 8.0% |
| $35,000 to $49,999 | 297 | 8.1% |
| $50,000 to $74,999 | 573 | 15.6% |
| $75,000 to $99,999 | 694 | 18.9% |
| $100,000 to $149,999 | 606 | 16.5% |
| $150,000 to $199,999 | 231 | 6.3% |
| $200,000+ | 117 | 3.2% |
Family Income by Famaliy Size in Steubenville
7+ person families (52 | 1.4%) account for the highest median family income in Steubenville with $90,833 per family, while 2-person families (1,939 | 52.8%) have the highest median income of $29,271 per family member.
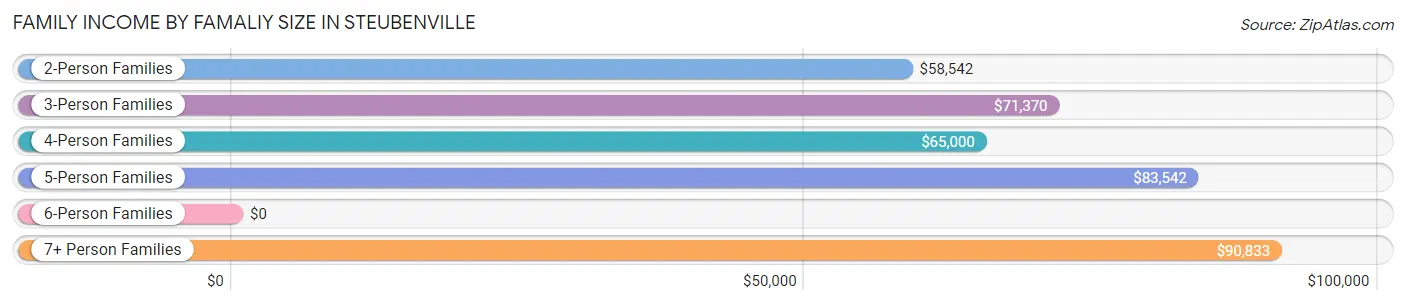
| Income Bracket | # Families | Median Income |
| 2-Person Families | 1,939 (52.8%) | $58,542 |
| 3-Person Families | 880 (24.0%) | $71,370 |
| 4-Person Families | 502 (13.7%) | $65,000 |
| 5-Person Families | 136 (3.7%) | $83,542 |
| 6-Person Families | 162 (4.4%) | $0 |
| 7+ Person Families | 52 (1.4%) | $90,833 |
| Total | 3,671 (100.0%) | $67,750 |
Family Income by Number of Earners in Steubenville
The median family income in Steubenville is $67,750, with families comprising 3+ earners (332) having the highest median family income of $136,371, while families with no earners (860) have the lowest median family income of $24,205, accounting for 9.0% and 23.4% of families, respectively.
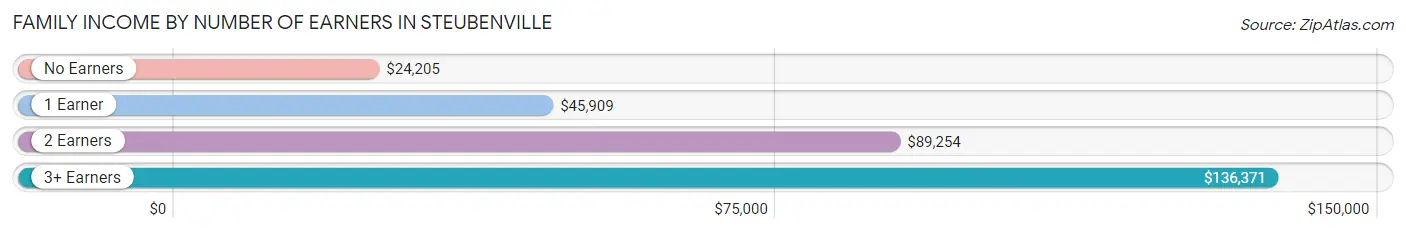
| Number of Earners | # Families | Median Income |
| No Earners | 860 (23.4%) | $24,205 |
| 1 Earner | 1,122 (30.6%) | $45,909 |
| 2 Earners | 1,357 (37.0%) | $89,254 |
| 3+ Earners | 332 (9.0%) | $136,371 |
| Total | 3,671 (100.0%) | $67,750 |
Household Income in Steubenville
Household Income Brackets in Steubenville
With 1,048 households falling in the category, the $15,000 to $24,999 income range is the most frequent in Steubenville, accounting for 14.2% of all households. In contrast, only 170 households (2.3%) fall into the $200,000+ income bracket, making it the least populous group.
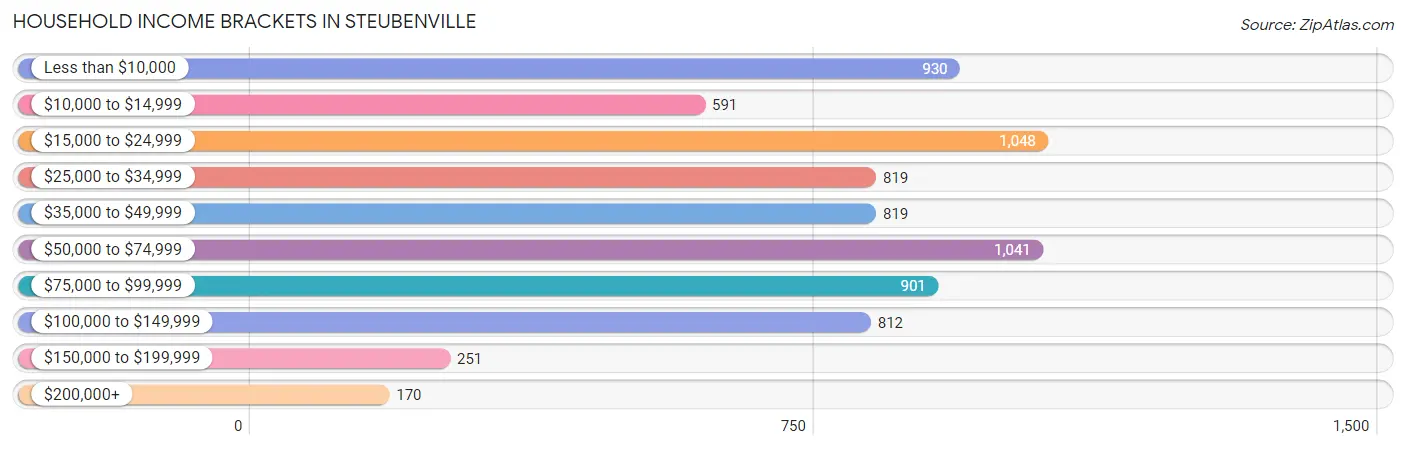
| Income Bracket | # Households | % Households |
| Less than $10,000 | 930 | 12.6% |
| $10,000 to $14,999 | 591 | 8.0% |
| $15,000 to $24,999 | 1,048 | 14.2% |
| $25,000 to $34,999 | 819 | 11.1% |
| $35,000 to $49,999 | 819 | 11.1% |
| $50,000 to $74,999 | 1,041 | 14.1% |
| $75,000 to $99,999 | 901 | 12.2% |
| $100,000 to $149,999 | 812 | 11.0% |
| $150,000 to $199,999 | 251 | 3.4% |
| $200,000+ | 170 | 2.3% |
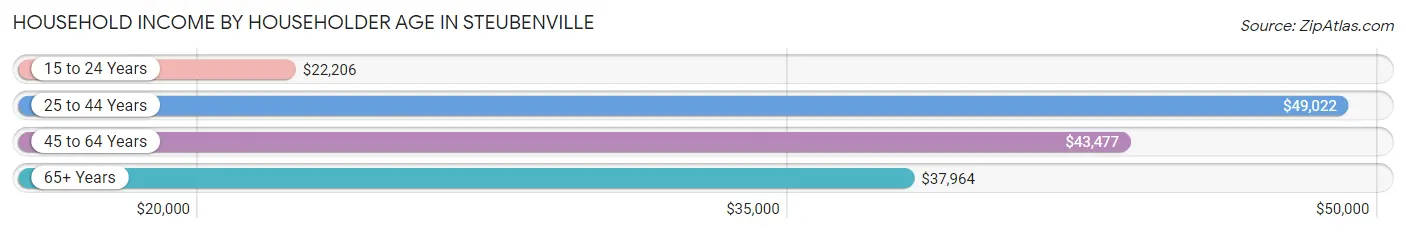
Household Income by Householder Age in Steubenville
The median household income in Steubenville is $42,725, with the highest median household income of $49,022 found in the 25 to 44 years age bracket for the primary householder. A total of 2,076 households (28.1%) fall into this category. Meanwhile, the 15 to 24 years age bracket for the primary householder has the lowest median household income of $22,206, with 374 households (5.1%) in this group.
| Income Bracket | # Households | Median Income |
| 15 to 24 Years | 374 (5.1%) | $22,206 |
| 25 to 44 Years | 2,076 (28.1%) | $49,022 |
| 45 to 64 Years | 2,671 (36.2%) | $43,477 |
| 65+ Years | 2,261 (30.6%) | $37,964 |
| Total | 7,382 (100.0%) | $42,725 |
Poverty in Steubenville
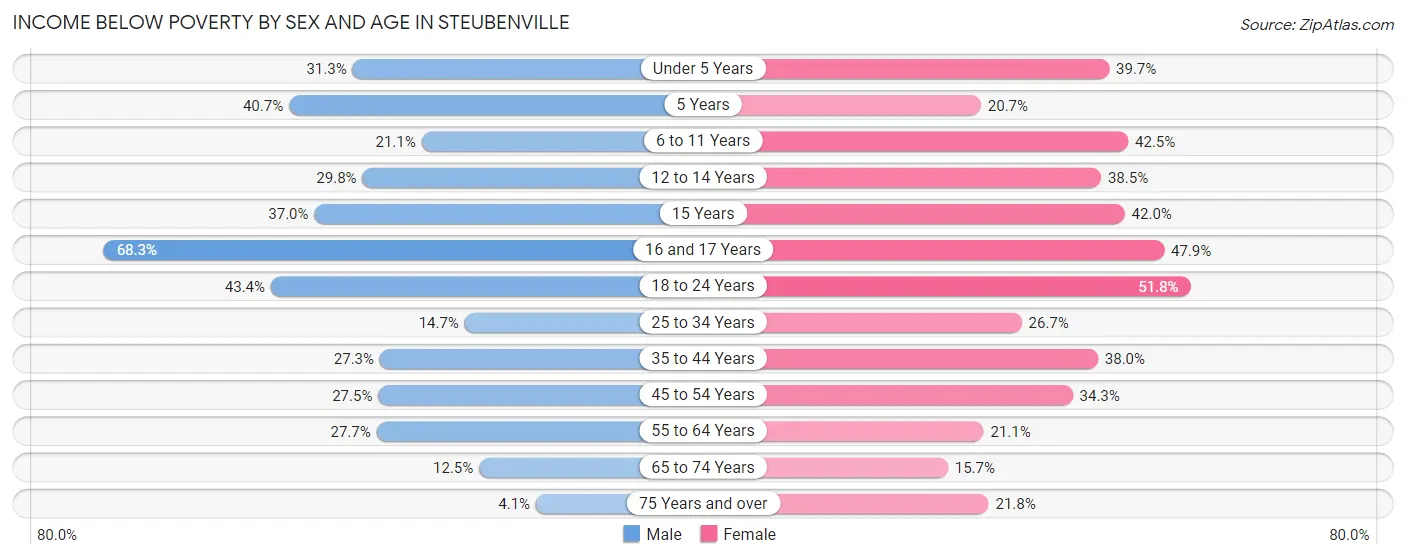
Income Below Poverty by Sex and Age in Steubenville
With 24.4% poverty level for males and 31.2% for females among the residents of Steubenville, 16 and 17 year old males and 18 to 24 year old females are the most vulnerable to poverty, with 43 males (68.2%) and 470 females (51.8%) in their respective age groups living below the poverty level.
| Age Bracket | Male | Female |
| Under 5 Years | 139 (31.3%) | 202 (39.7%) |
| 5 Years | 22 (40.7%) | 38 (20.6%) |
| 6 to 11 Years | 100 (21.0%) | 142 (42.5%) |
| 12 to 14 Years | 111 (29.8%) | 107 (38.5%) |
| 15 Years | 61 (37.0%) | 21 (42.0%) |
| 16 and 17 Years | 43 (68.2%) | 89 (47.8%) |
| 18 to 24 Years | 360 (43.4%) | 470 (51.8%) |
| 25 to 34 Years | 188 (14.6%) | 290 (26.7%) |
| 35 to 44 Years | 260 (27.3%) | 327 (38.0%) |
| 45 to 54 Years | 243 (27.5%) | 352 (34.3%) |
| 55 to 64 Years | 286 (27.7%) | 246 (21.1%) |
| 65 to 74 Years | 131 (12.5%) | 158 (15.7%) |
| 75 Years and over | 18 (4.1%) | 158 (21.8%) |
| Total | 1,962 (24.4%) | 2,600 (31.2%) |
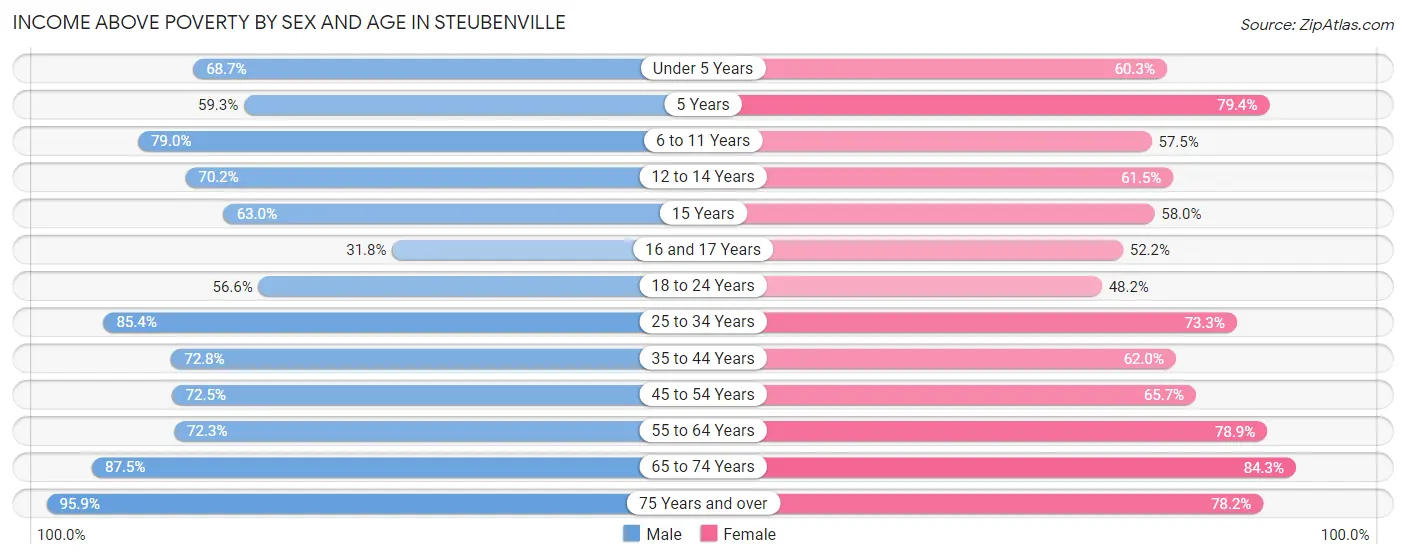
Income Above Poverty by Sex and Age in Steubenville
According to the poverty statistics in Steubenville, males aged 75 years and over and females aged 65 to 74 years are the age groups that are most secure financially, with 95.9% of males and 84.3% of females in these age groups living above the poverty line.
| Age Bracket | Male | Female |
| Under 5 Years | 305 (68.7%) | 307 (60.3%) |
| 5 Years | 32 (59.3%) | 146 (79.3%) |
| 6 to 11 Years | 375 (78.9%) | 192 (57.5%) |
| 12 to 14 Years | 261 (70.2%) | 171 (61.5%) |
| 15 Years | 104 (63.0%) | 29 (58.0%) |
| 16 and 17 Years | 20 (31.8%) | 97 (52.1%) |
| 18 to 24 Years | 469 (56.6%) | 438 (48.2%) |
| 25 to 34 Years | 1,095 (85.4%) | 796 (73.3%) |
| 35 to 44 Years | 694 (72.8%) | 533 (62.0%) |
| 45 to 54 Years | 641 (72.5%) | 675 (65.7%) |
| 55 to 64 Years | 745 (72.3%) | 922 (78.9%) |
| 65 to 74 Years | 915 (87.5%) | 846 (84.3%) |
| 75 Years and over | 424 (95.9%) | 567 (78.2%) |
| Total | 6,080 (75.6%) | 5,719 (68.8%) |
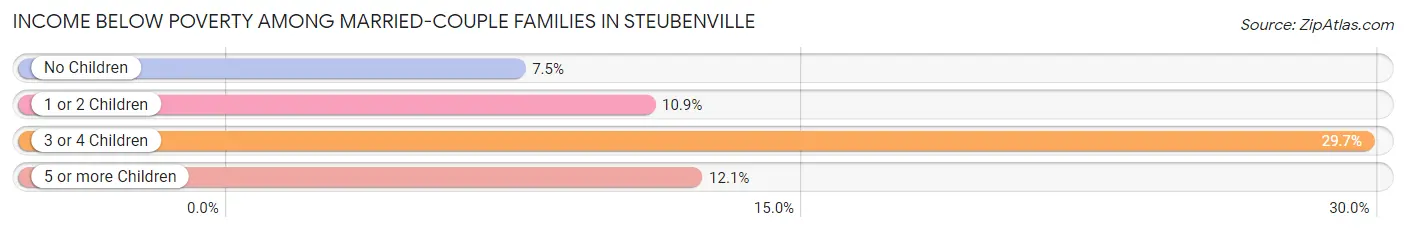
Income Below Poverty Among Married-Couple Families in Steubenville
The poverty statistics for married-couple families in Steubenville show that 9.6% or 236 of the total 2,459 families live below the poverty line. Families with 3 or 4 children have the highest poverty rate of 29.7%, comprising of 35 families. On the other hand, families with no children have the lowest poverty rate of 7.5%, which includes 120 families.
| Children | Above Poverty | Below Poverty |
| No Children | 1,481 (92.5%) | 120 (7.5%) |
| 1 or 2 Children | 630 (89.1%) | 77 (10.9%) |
| 3 or 4 Children | 83 (70.3%) | 35 (29.7%) |
| 5 or more Children | 29 (87.9%) | 4 (12.1%) |
| Total | 2,223 (90.4%) | 236 (9.6%) |
Income Below Poverty Among Single-Parent Households in Steubenville
According to the poverty data in Steubenville, 33.9% or 88 single-father households and 42.9% or 408 single-mother households are living below the poverty line. Among single-father households, those with 1 or 2 children have the highest poverty rate, with 88 households (71.0%) experiencing poverty. Likewise, among single-mother households, those with 5 or more children have the highest poverty rate, with 43 households (100.0%) falling below the poverty line.
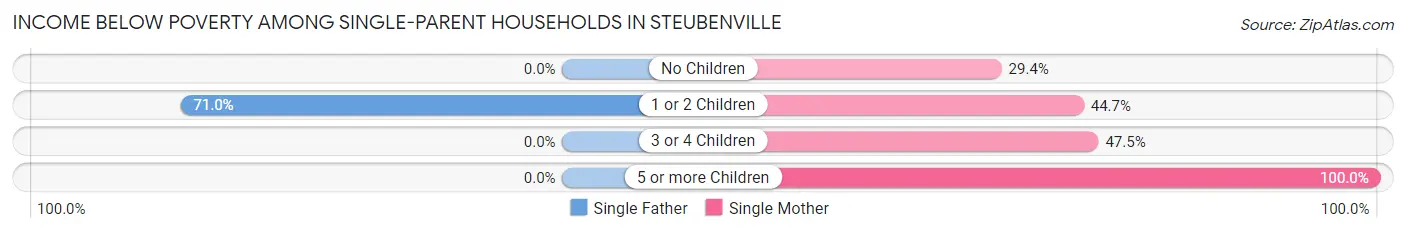
| Children | Single Father | Single Mother |
| No Children | 0 (0.0%) | 83 (29.4%) |
| 1 or 2 Children | 88 (71.0%) | 254 (44.7%) |
| 3 or 4 Children | 0 (0.0%) | 28 (47.5%) |
| 5 or more Children | 0 (0.0%) | 43 (100.0%) |
| Total | 88 (33.9%) | 408 (42.9%) |
Income Below Poverty Among Married-Couple vs Single-Parent Households in Steubenville
The poverty data for Steubenville shows that 236 of the married-couple family households (9.6%) and 496 of the single-parent households (40.9%) are living below the poverty level. Within the married-couple family households, those with 3 or 4 children have the highest poverty rate, with 35 households (29.7%) falling below the poverty line. Among the single-parent households, those with 5 or more children have the highest poverty rate, with 43 household (100.0%) living below poverty.
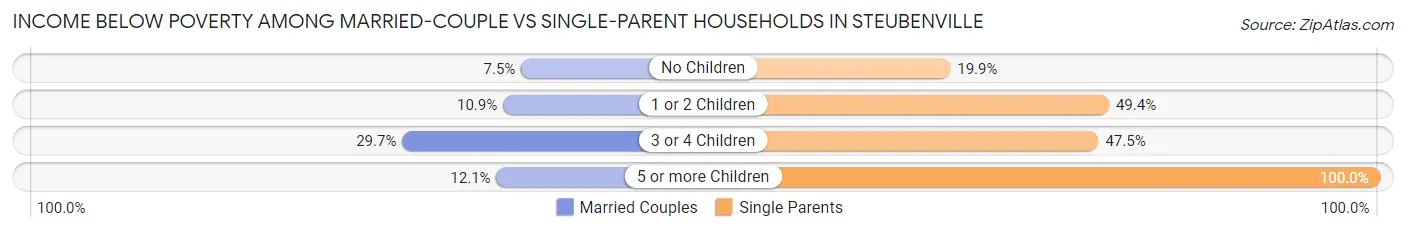
| Children | Married-Couple Families | Single-Parent Households |
| No Children | 120 (7.5%) | 83 (19.9%) |
| 1 or 2 Children | 77 (10.9%) | 342 (49.4%) |
| 3 or 4 Children | 35 (29.7%) | 28 (47.5%) |
| 5 or more Children | 4 (12.1%) | 43 (100.0%) |
| Total | 236 (9.6%) | 496 (40.9%) |
Race in Steubenville
The most populous races in Steubenville are White / Caucasian (14,013 | 77.1%), Black / African American (2,443 | 13.4%), and Two or more Races (1,100 | 6.0%).
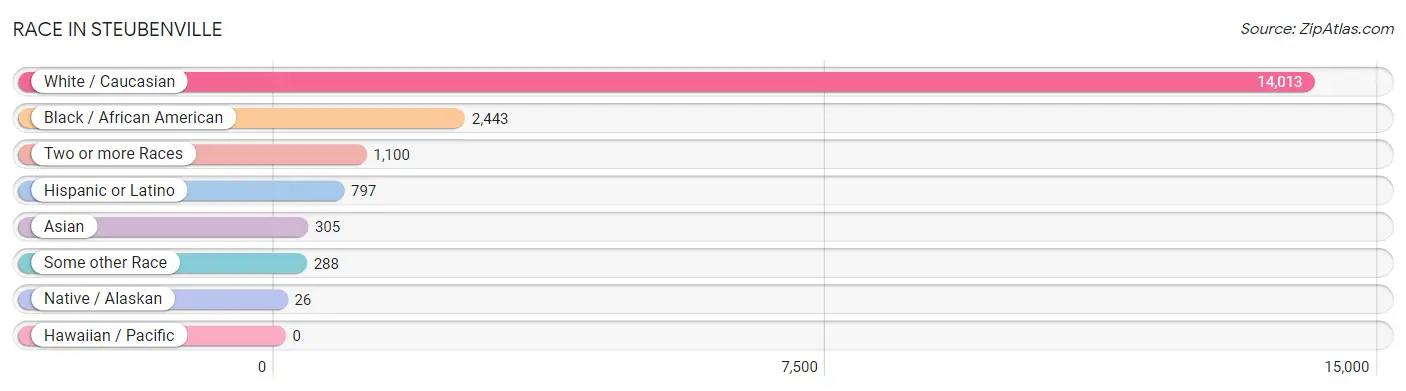
| Race | # Population | % Population |
| Asian | 305 | 1.7% |
| Black / African American | 2,443 | 13.4% |
| Hawaiian / Pacific | 0 | 0.0% |
| Hispanic or Latino | 797 | 4.4% |
| Native / Alaskan | 26 | 0.1% |
| White / Caucasian | 14,013 | 77.1% |
| Two or more Races | 1,100 | 6.0% |
| Some other Race | 288 | 1.6% |
| Total | 18,175 | 100.0% |
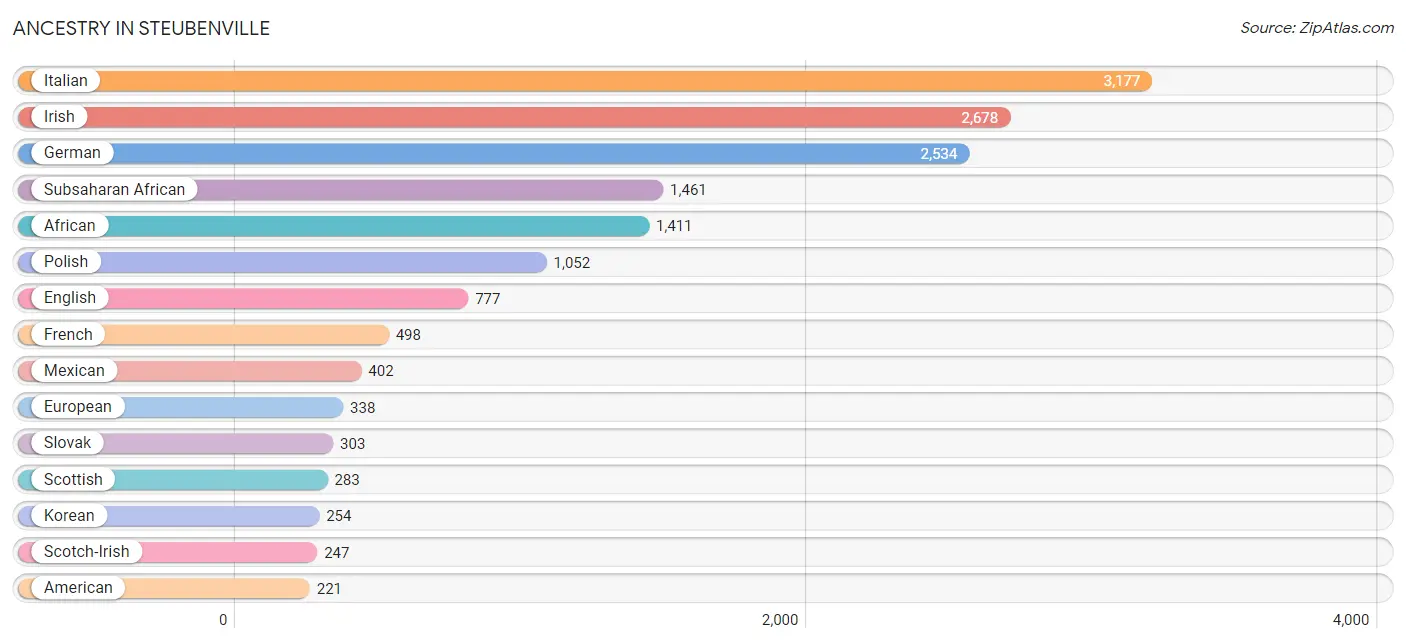
Ancestry in Steubenville
The most populous ancestries reported in Steubenville are Italian (3,177 | 17.5%), Irish (2,678 | 14.7%), German (2,534 | 13.9%), Subsaharan African (1,461 | 8.0%), and African (1,411 | 7.8%), together accounting for 62.0% of all Steubenville residents.
| Ancestry | # Population | % Population |
| African | 1,411 | 7.8% |
| American | 221 | 1.2% |
| Arab | 20 | 0.1% |
| Armenian | 5 | 0.0% |
| Assyrian / Chaldean / Syriac | 25 | 0.1% |
| Australian | 64 | 0.4% |
| Austrian | 53 | 0.3% |
| Bhutanese | 14 | 0.1% |
| Blackfeet | 2 | 0.0% |
| Brazilian | 33 | 0.2% |
| British | 178 | 1.0% |
| Burmese | 1 | 0.0% |
| Central American | 122 | 0.7% |
| Cherokee | 42 | 0.2% |
| Chippewa | 16 | 0.1% |
| Colombian | 3 | 0.0% |
| Costa Rican | 3 | 0.0% |
| Croatian | 16 | 0.1% |
| Crow | 11 | 0.1% |
| Cuban | 44 | 0.2% |
| Czech | 21 | 0.1% |
| Czechoslovakian | 18 | 0.1% |
| Dominican | 16 | 0.1% |
| Dutch | 128 | 0.7% |
| Eastern European | 32 | 0.2% |
| Ecuadorian | 5 | 0.0% |
| English | 777 | 4.3% |
| European | 338 | 1.9% |
| Filipino | 9 | 0.1% |
| Finnish | 35 | 0.2% |
| French | 498 | 2.7% |
| French Canadian | 65 | 0.4% |
| German | 2,534 | 13.9% |
| Greek | 92 | 0.5% |
| Guatemalan | 5 | 0.0% |
| Haitian | 3 | 0.0% |
| Hungarian | 183 | 1.0% |
| Indian (Asian) | 172 | 0.9% |
| Irish | 2,678 | 14.7% |
| Israeli | 11 | 0.1% |
| Italian | 3,177 | 17.5% |
| Jamaican | 9 | 0.1% |
| Korean | 254 | 1.4% |
| Lithuanian | 54 | 0.3% |
| Mexican | 402 | 2.2% |
| Mexican American Indian | 3 | 0.0% |
| Nicaraguan | 97 | 0.5% |
| Nigerian | 50 | 0.3% |
| Northern European | 20 | 0.1% |
| Norwegian | 21 | 0.1% |
| Pakistani | 5 | 0.0% |
| Pennsylvania German | 72 | 0.4% |
| Peruvian | 9 | 0.1% |
| Polish | 1,052 | 5.8% |
| Puerto Rican | 91 | 0.5% |
| Romanian | 24 | 0.1% |
| Russian | 55 | 0.3% |
| Salvadoran | 17 | 0.1% |
| Scandinavian | 18 | 0.1% |
| Scotch-Irish | 247 | 1.4% |
| Scottish | 283 | 1.6% |
| Serbian | 194 | 1.1% |
| Slavic | 8 | 0.0% |
| Slovak | 303 | 1.7% |
| South American | 17 | 0.1% |
| Spanish | 98 | 0.5% |
| Sri Lankan | 35 | 0.2% |
| Subsaharan African | 1,461 | 8.0% |
| Swedish | 28 | 0.2% |
| Swiss | 57 | 0.3% |
| Syrian | 20 | 0.1% |
| Thai | 37 | 0.2% |
| Trinidadian and Tobagonian | 1 | 0.0% |
| Ukrainian | 44 | 0.2% |
| Welsh | 90 | 0.5% | View All 75 Rows |
Immigrants in Steubenville
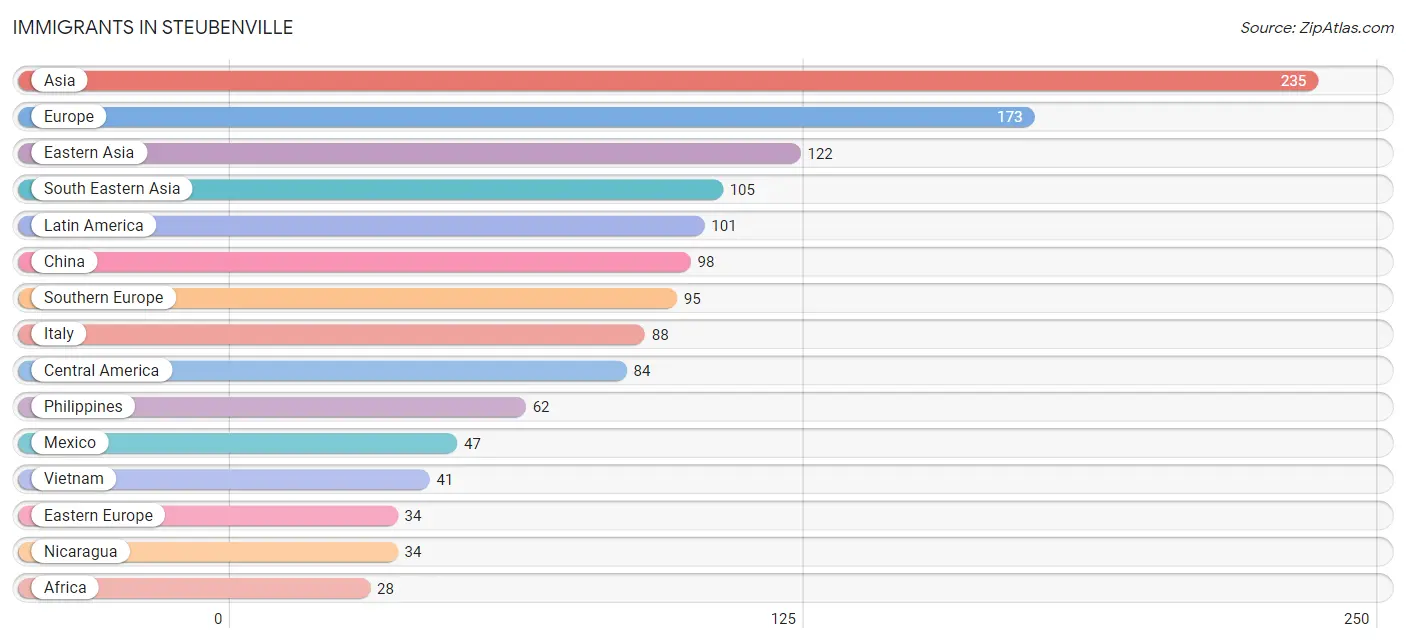
The most numerous immigrant groups reported in Steubenville came from Asia (235 | 1.3%), Europe (173 | 0.9%), Eastern Asia (122 | 0.7%), South Eastern Asia (105 | 0.6%), and Latin America (101 | 0.6%), together accounting for 4.1% of all Steubenville residents.
| Immigration Origin | # Population | % Population |
| Africa | 28 | 0.2% |
| Asia | 235 | 1.3% |
| Austria | 21 | 0.1% |
| Brazil | 14 | 0.1% |
| Canada | 1 | 0.0% |
| Caribbean | 3 | 0.0% |
| Central America | 84 | 0.5% |
| China | 98 | 0.5% |
| Czechoslovakia | 10 | 0.1% |
| Eastern Africa | 22 | 0.1% |
| Eastern Asia | 122 | 0.7% |
| Eastern Europe | 34 | 0.2% |
| Ethiopia | 6 | 0.0% |
| Europe | 173 | 0.9% |
| Greece | 7 | 0.0% |
| Guatemala | 3 | 0.0% |
| Haiti | 3 | 0.0% |
| India | 8 | 0.0% |
| Italy | 88 | 0.5% |
| Japan | 23 | 0.1% |
| Kenya | 16 | 0.1% |
| Korea | 1 | 0.0% |
| Latin America | 101 | 0.6% |
| Mexico | 47 | 0.3% |
| Nicaragua | 34 | 0.2% |
| Nigeria | 6 | 0.0% |
| Northern Europe | 23 | 0.1% |
| Philippines | 62 | 0.3% |
| Russia | 19 | 0.1% |
| South America | 14 | 0.1% |
| South Central Asia | 8 | 0.0% |
| South Eastern Asia | 105 | 0.6% |
| Southern Europe | 95 | 0.5% |
| Taiwan | 9 | 0.1% |
| Thailand | 2 | 0.0% |
| Vietnam | 41 | 0.2% |
| Western Africa | 6 | 0.0% |
| Western Europe | 21 | 0.1% | View All 38 Rows |
Sex and Age in Steubenville
Sex and Age in Steubenville
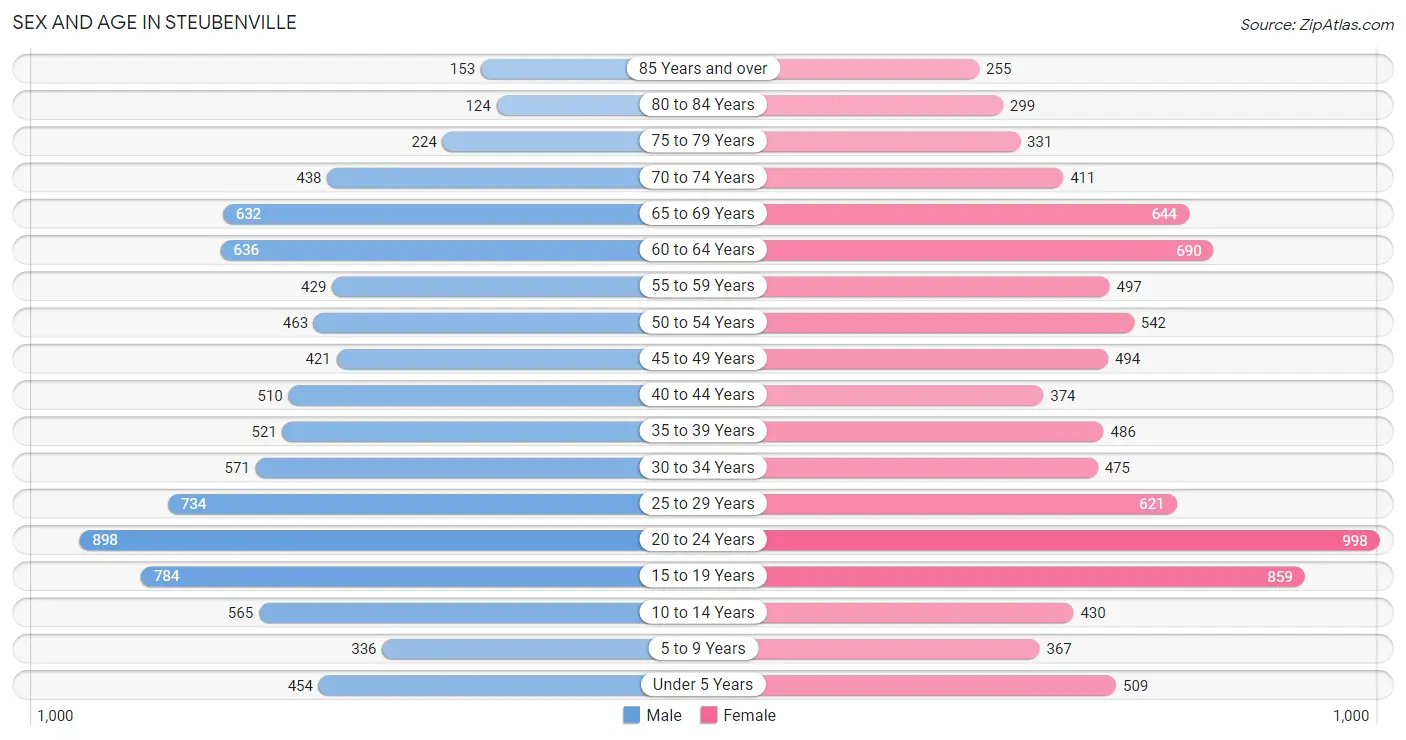
The most populous age groups in Steubenville are 20 to 24 Years (898 | 10.1%) for men and 20 to 24 Years (998 | 10.7%) for women.
| Age Bracket | Male | Female |
| Under 5 Years | 454 (5.1%) | 509 (5.5%) |
| 5 to 9 Years | 336 (3.8%) | 367 (4.0%) |
| 10 to 14 Years | 565 (6.4%) | 430 (4.6%) |
| 15 to 19 Years | 784 (8.8%) | 859 (9.2%) |
| 20 to 24 Years | 898 (10.1%) | 998 (10.7%) |
| 25 to 29 Years | 734 (8.3%) | 621 (6.7%) |
| 30 to 34 Years | 571 (6.4%) | 475 (5.1%) |
| 35 to 39 Years | 521 (5.9%) | 486 (5.2%) |
| 40 to 44 Years | 510 (5.7%) | 374 (4.0%) |
| 45 to 49 Years | 421 (4.7%) | 494 (5.3%) |
| 50 to 54 Years | 463 (5.2%) | 542 (5.8%) |
| 55 to 59 Years | 429 (4.8%) | 497 (5.3%) |
| 60 to 64 Years | 636 (7.1%) | 690 (7.4%) |
| 65 to 69 Years | 632 (7.1%) | 644 (6.9%) |
| 70 to 74 Years | 438 (4.9%) | 411 (4.4%) |
| 75 to 79 Years | 224 (2.5%) | 331 (3.6%) |
| 80 to 84 Years | 124 (1.4%) | 299 (3.2%) |
| 85 Years and over | 153 (1.7%) | 255 (2.8%) |
| Total | 8,893 (100.0%) | 9,282 (100.0%) |
Families and Households in Steubenville
Median Family Size in Steubenville
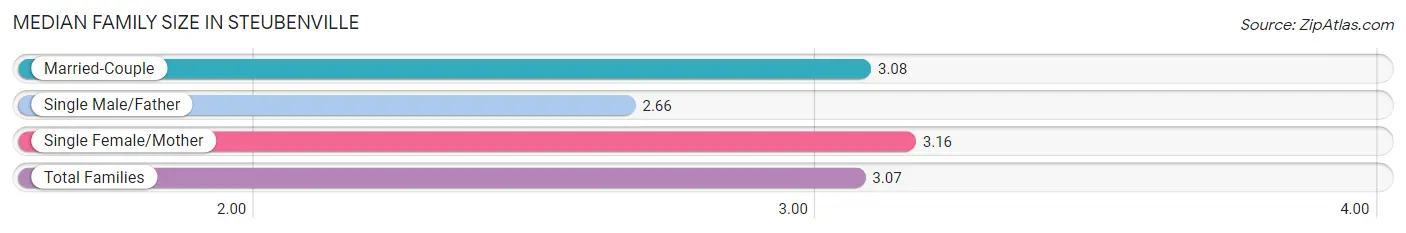
The median family size in Steubenville is 3.07 persons per family, with single female/mother families (952 | 25.9%) accounting for the largest median family size of 3.16 persons per family. On the other hand, single male/father families (260 | 7.1%) represent the smallest median family size with 2.66 persons per family.
| Family Type | # Families | Family Size |
| Married-Couple | 2,459 (67.0%) | 3.08 |
| Single Male/Father | 260 (7.1%) | 2.66 |
| Single Female/Mother | 952 (25.9%) | 3.16 |
| Total Families | 3,671 (100.0%) | 3.07 |
Median Household Size in Steubenville
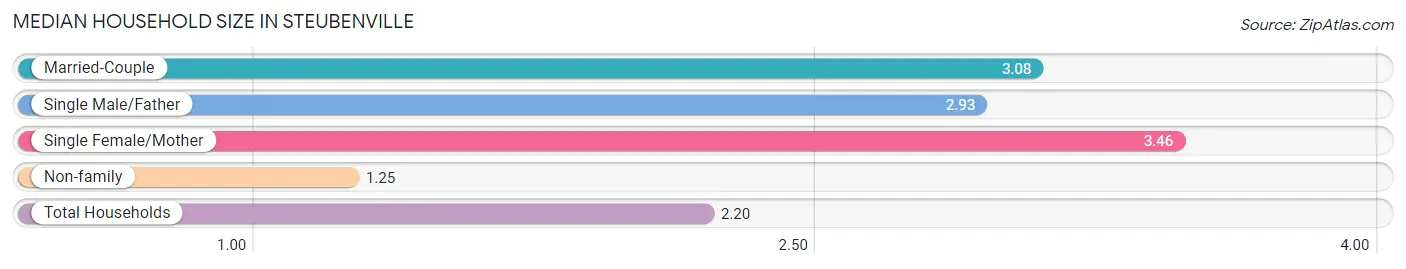
The median household size in Steubenville is 2.20 persons per household, with single female/mother households (952 | 12.9%) accounting for the largest median household size of 3.46 persons per household. non-family households (3,711 | 50.3%) represent the smallest median household size with 1.25 persons per household.
| Household Type | # Households | Household Size |
| Married-Couple | 2,459 (33.3%) | 3.08 |
| Single Male/Father | 260 (3.5%) | 2.93 |
| Single Female/Mother | 952 (12.9%) | 3.46 |
| Non-family | 3,711 (50.3%) | 1.25 |
| Total Households | 7,382 (100.0%) | 2.20 |
Household Size by Marriage Status in Steubenville
Out of a total of 7,382 households in Steubenville, 3,671 (49.7%) are family households, while 3,711 (50.3%) are nonfamily households. The most numerous type of family households are 2-person households, comprising 1,735, and the most common type of nonfamily households are 1-person households, comprising 3,194.
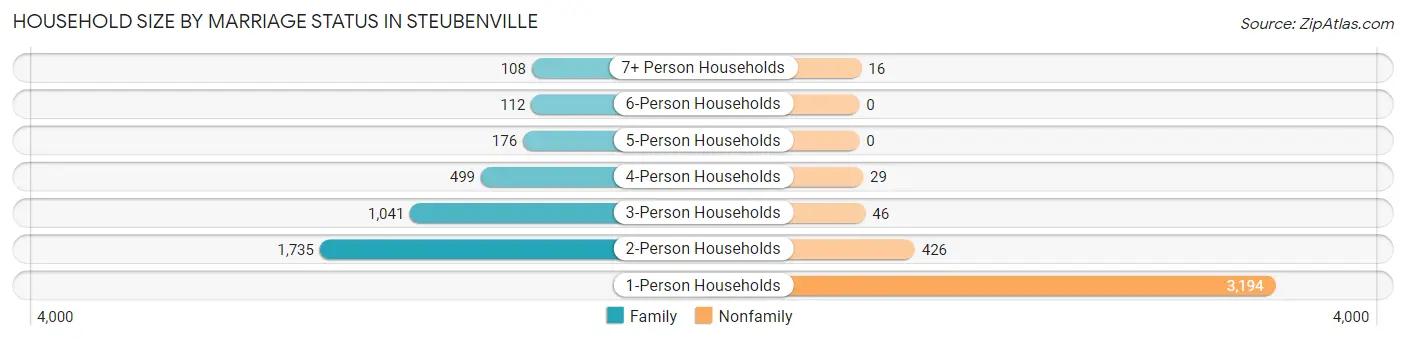
| Household Size | Family Households | Nonfamily Households |
| 1-Person Households | - | 3,194 (43.3%) |
| 2-Person Households | 1,735 (23.5%) | 426 (5.8%) |
| 3-Person Households | 1,041 (14.1%) | 46 (0.6%) |
| 4-Person Households | 499 (6.8%) | 29 (0.4%) |
| 5-Person Households | 176 (2.4%) | 0 (0.0%) |
| 6-Person Households | 112 (1.5%) | 0 (0.0%) |
| 7+ Person Households | 108 (1.5%) | 16 (0.2%) |
| Total | 3,671 (49.7%) | 3,711 (50.3%) |
Female Fertility in Steubenville
Fertility by Age in Steubenville
Average fertility rate in Steubenville is 28.0 births per 1,000 women. Women in the age bracket of 20 to 34 years have the highest fertility rate with 49.0 births per 1,000 women. Women in the age bracket of 20 to 34 years acount for 82.9% of all women with births.
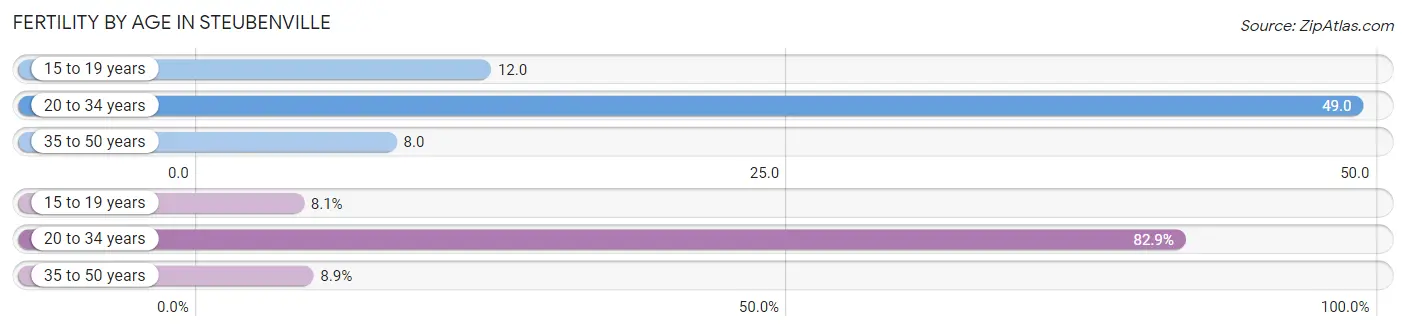
| Age Bracket | Women with Births | Births / 1,000 Women |
| 15 to 19 years | 10 (8.1%) | 12.0 |
| 20 to 34 years | 102 (82.9%) | 49.0 |
| 35 to 50 years | 11 (8.9%) | 8.0 |
| Total | 123 (100.0%) | 28.0 |
Fertility by Age by Marriage Status in Steubenville
69.1% of women with births (123) in Steubenville are married. The highest percentage of unmarried women with births falls into 15 to 19 years age bracket with 100.0% of them unmarried at the time of birth, while the lowest percentage of unmarried women with births belong to 35 to 50 years age bracket with 0.0% of them unmarried.
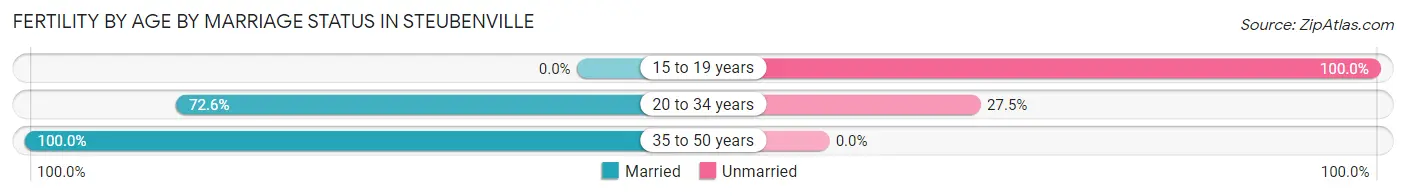
| Age Bracket | Married | Unmarried |
| 15 to 19 years | 0 (0.0%) | 10 (100.0%) |
| 20 to 34 years | 74 (72.6%) | 28 (27.5%) |
| 35 to 50 years | 11 (100.0%) | 0 (0.0%) |
| Total | 85 (69.1%) | 38 (30.9%) |
Fertility by Education in Steubenville
Average fertility rate in Steubenville is 28.0 births per 1,000 women. Women with the education attainment of bachelor's degree have the highest fertility rate of 63.0 births per 1,000 women, while women with the education attainment of college or associate's degree have the lowest fertility at 15.0 births per 1,000 women. Women with the education attainment of bachelor's degree represent 30.9% of all women with births.
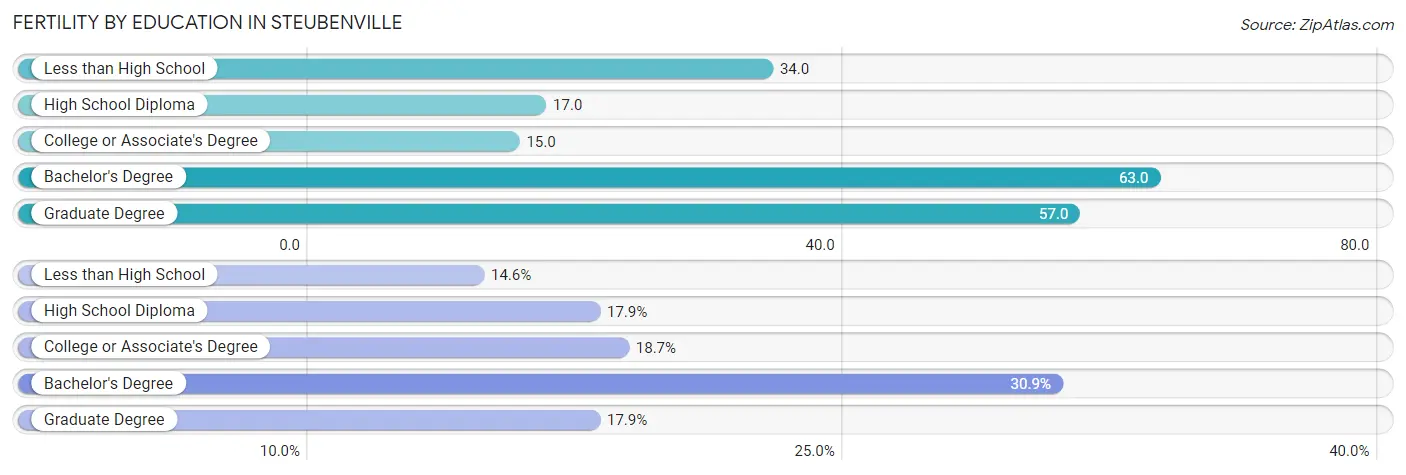
| Educational Attainment | Women with Births | Births / 1,000 Women |
| Less than High School | 18 (14.6%) | 34.0 |
| High School Diploma | 22 (17.9%) | 17.0 |
| College or Associate's Degree | 23 (18.7%) | 15.0 |
| Bachelor's Degree | 38 (30.9%) | 63.0 |
| Graduate Degree | 22 (17.9%) | 57.0 |
| Total | 123 (100.0%) | 28.0 |
Fertility by Education by Marriage Status in Steubenville
30.9% of women with births in Steubenville are unmarried. Women with the educational attainment of college or associate's degree are most likely to be married with 100.0% of them married at childbirth, while women with the educational attainment of less than high school are least likely to be married with 100.0% of them unmarried at childbirth.
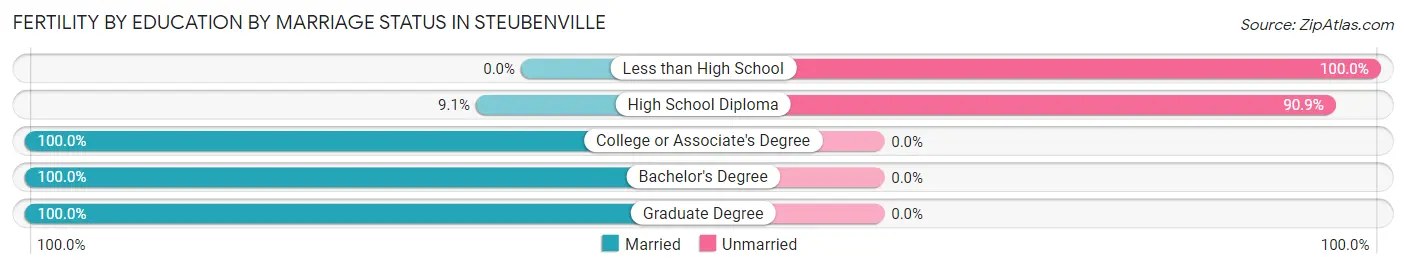
| Educational Attainment | Married | Unmarried |
| Less than High School | 0 (0.0%) | 18 (100.0%) |
| High School Diploma | 2 (9.1%) | 20 (90.9%) |
| College or Associate's Degree | 23 (100.0%) | 0 (0.0%) |
| Bachelor's Degree | 38 (100.0%) | 0 (0.0%) |
| Graduate Degree | 22 (100.0%) | 0 (0.0%) |
| Total | 85 (69.1%) | 38 (30.9%) |
Employment Characteristics in Steubenville
Employment by Class of Employer in Steubenville
Among the 7,621 employed individuals in Steubenville, private company employees (5,055 | 66.3%), not-for-profit organizations (1,092 | 14.3%), and local government employees (711 | 9.3%) make up the most common classes of employment.
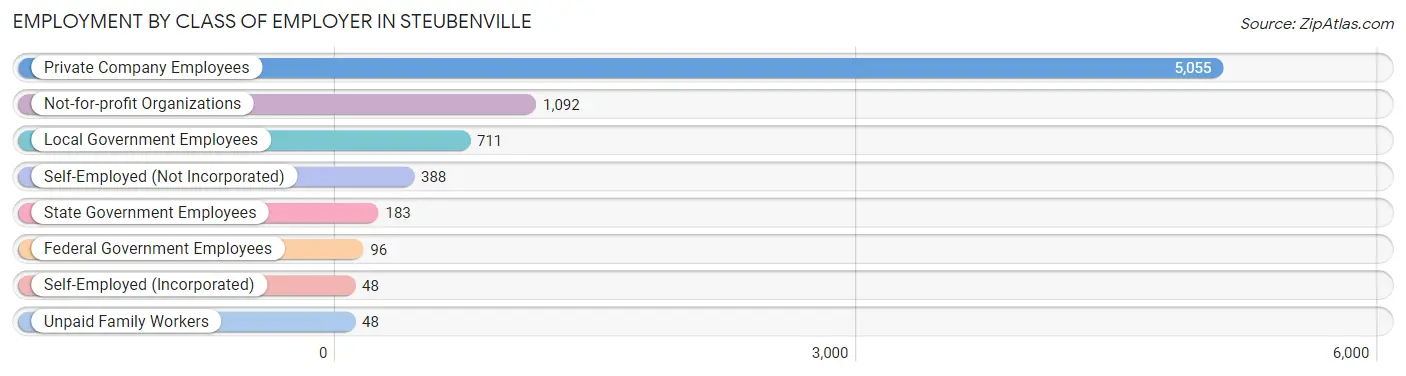
| Employer Class | # Employees | % Employees |
| Private Company Employees | 5,055 | 66.3% |
| Self-Employed (Incorporated) | 48 | 0.6% |
| Self-Employed (Not Incorporated) | 388 | 5.1% |
| Not-for-profit Organizations | 1,092 | 14.3% |
| Local Government Employees | 711 | 9.3% |
| State Government Employees | 183 | 2.4% |
| Federal Government Employees | 96 | 1.3% |
| Unpaid Family Workers | 48 | 0.6% |
| Total | 7,621 | 100.0% |
Employment Status by Age in Steubenville
According to the labor force statistics for Steubenville, out of the total population over 16 years of age (15,295), 55.0% or 8,412 individuals are in the labor force, with 7.6% or 639 of them unemployed. The age group with the highest labor force participation rate is 25 to 29 years, with 83.4% or 1,130 individuals in the labor force. Within the labor force, the 75 years and over age range has the highest percentage of unemployed individuals, with 17.9% or 22 of them being unemployed.
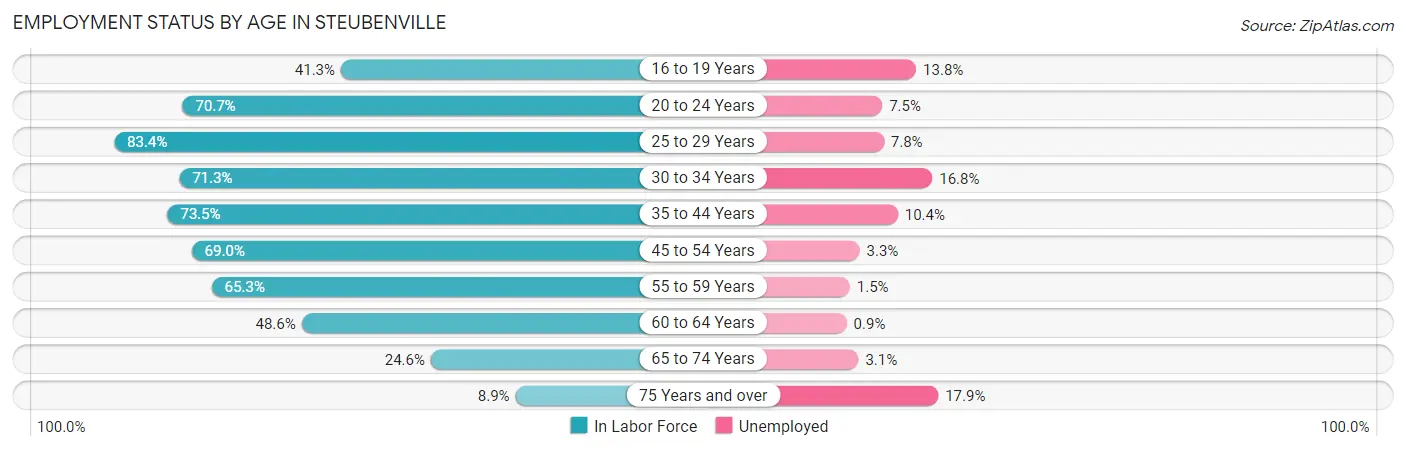
| Age Bracket | In Labor Force | Unemployed |
| 16 to 19 Years | 588 (41.3%) | 81 (13.8%) |
| 20 to 24 Years | 1,340 (70.7%) | 100 (7.5%) |
| 25 to 29 Years | 1,130 (83.4%) | 88 (7.8%) |
| 30 to 34 Years | 746 (71.3%) | 125 (16.8%) |
| 35 to 44 Years | 1,390 (73.5%) | 145 (10.4%) |
| 45 to 54 Years | 1,325 (69.0%) | 44 (3.3%) |
| 55 to 59 Years | 605 (65.3%) | 9 (1.5%) |
| 60 to 64 Years | 644 (48.6%) | 6 (0.9%) |
| 65 to 74 Years | 523 (24.6%) | 16 (3.1%) |
| 75 Years and over | 123 (8.9%) | 22 (17.9%) |
| Total | 8,412 (55.0%) | 639 (7.6%) |
Employment Status by Educational Attainment in Steubenville
According to labor force statistics for Steubenville, 69.0% of individuals (5,840) out of the total population between 25 and 64 years of age (8,464) are in the labor force, with 7.1% or 415 of them being unemployed. The group with the highest labor force participation rate are those with the educational attainment of bachelor's degree or higher, with 79.3% or 2,067 individuals in the labor force. Within the labor force, individuals with less than high school education have the highest percentage of unemployment, with 23.8% or 46 of them being unemployed.
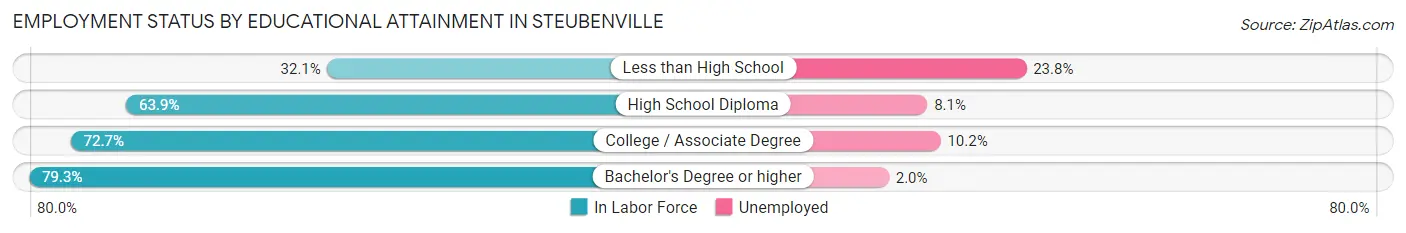
| Educational Attainment | In Labor Force | Unemployed |
| Less than High School | 193 (32.1%) | 143 (23.8%) |
| High School Diploma | 1,752 (63.9%) | 222 (8.1%) |
| College / Associate Degree | 1,828 (72.7%) | 256 (10.2%) |
| Bachelor's Degree or higher | 2,067 (79.3%) | 52 (2.0%) |
| Total | 5,840 (69.0%) | 601 (7.1%) |
Employment Occupations by Sex in Steubenville
Management, Business, Science and Arts Occupations
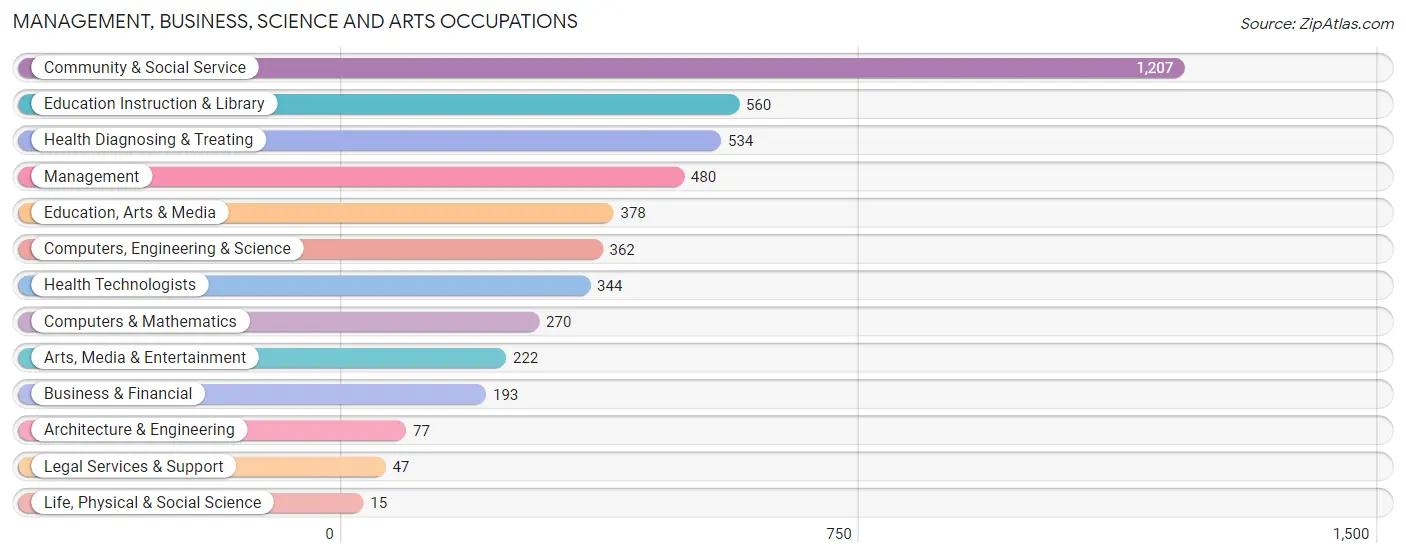
The most common Management, Business, Science and Arts occupations in Steubenville are Community & Social Service (1,207 | 15.5%), Education Instruction & Library (560 | 7.2%), Health Diagnosing & Treating (534 | 6.9%), Management (480 | 6.2%), and Education, Arts & Media (378 | 4.9%).
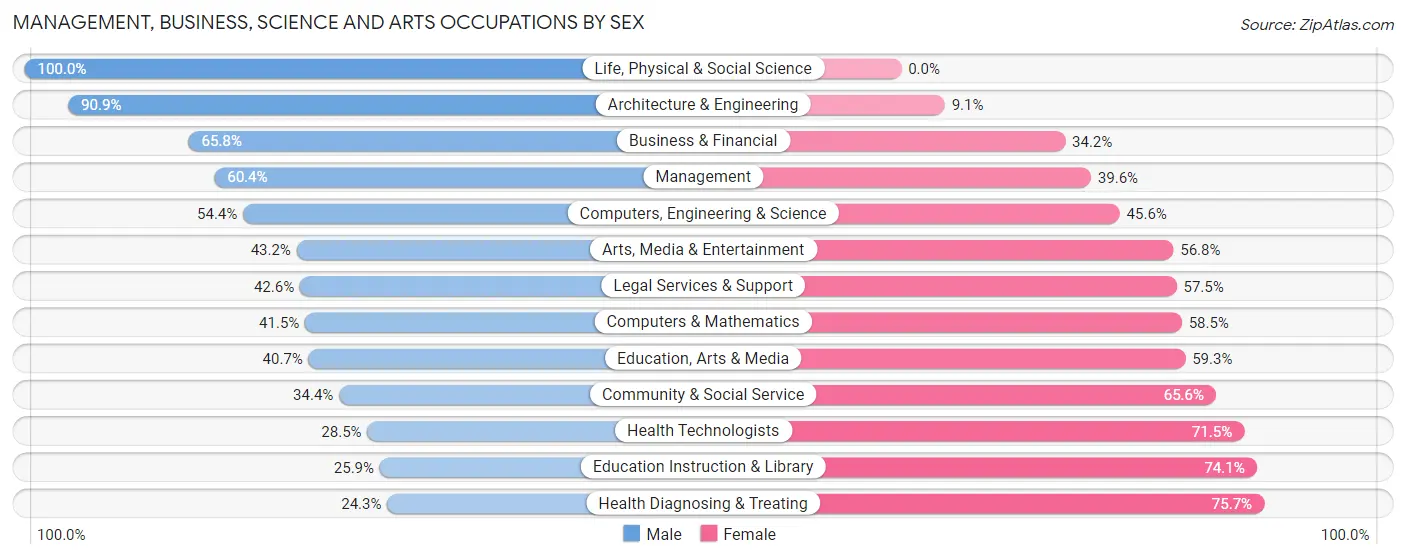
Management, Business, Science and Arts Occupations by Sex
Within the Management, Business, Science and Arts occupations in Steubenville, the most male-oriented occupations are Life, Physical & Social Science (100.0%), Architecture & Engineering (90.9%), and Business & Financial (65.8%), while the most female-oriented occupations are Health Diagnosing & Treating (75.7%), Education Instruction & Library (74.1%), and Health Technologists (71.5%).
| Occupation | Male | Female |
| Management | 290 (60.4%) | 190 (39.6%) |
| Business & Financial | 127 (65.8%) | 66 (34.2%) |
| Computers, Engineering & Science | 197 (54.4%) | 165 (45.6%) |
| Computers & Mathematics | 112 (41.5%) | 158 (58.5%) |
| Architecture & Engineering | 70 (90.9%) | 7 (9.1%) |
| Life, Physical & Social Science | 15 (100.0%) | 0 (0.0%) |
| Community & Social Service | 415 (34.4%) | 792 (65.6%) |
| Education, Arts & Media | 154 (40.7%) | 224 (59.3%) |
| Legal Services & Support | 20 (42.5%) | 27 (57.5%) |
| Education Instruction & Library | 145 (25.9%) | 415 (74.1%) |
| Arts, Media & Entertainment | 96 (43.2%) | 126 (56.8%) |
| Health Diagnosing & Treating | 130 (24.3%) | 404 (75.7%) |
| Health Technologists | 98 (28.5%) | 246 (71.5%) |
| Total (Category) | 1,159 (41.7%) | 1,617 (58.3%) |
| Total (Overall) | 3,754 (48.3%) | 4,023 (51.7%) |
Services Occupations
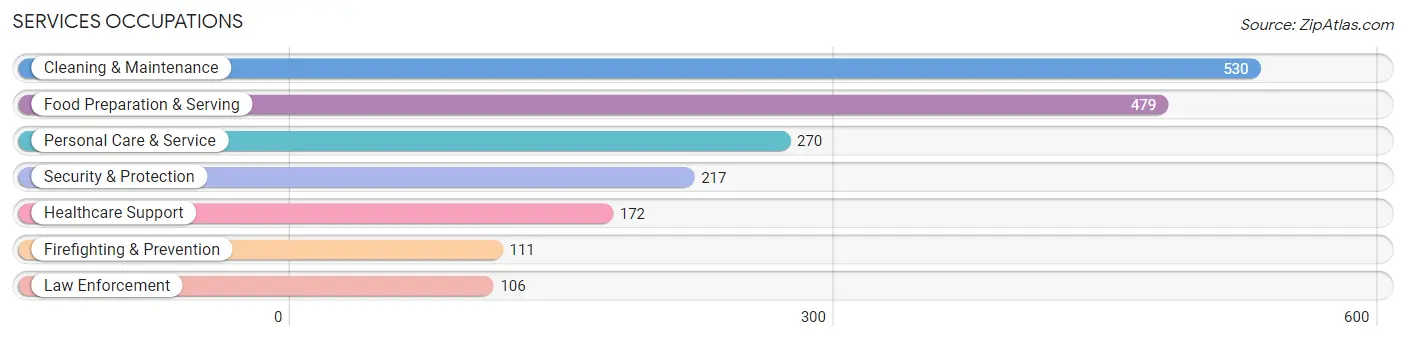
The most common Services occupations in Steubenville are Cleaning & Maintenance (530 | 6.8%), Food Preparation & Serving (479 | 6.2%), Personal Care & Service (270 | 3.5%), Security & Protection (217 | 2.8%), and Healthcare Support (172 | 2.2%).
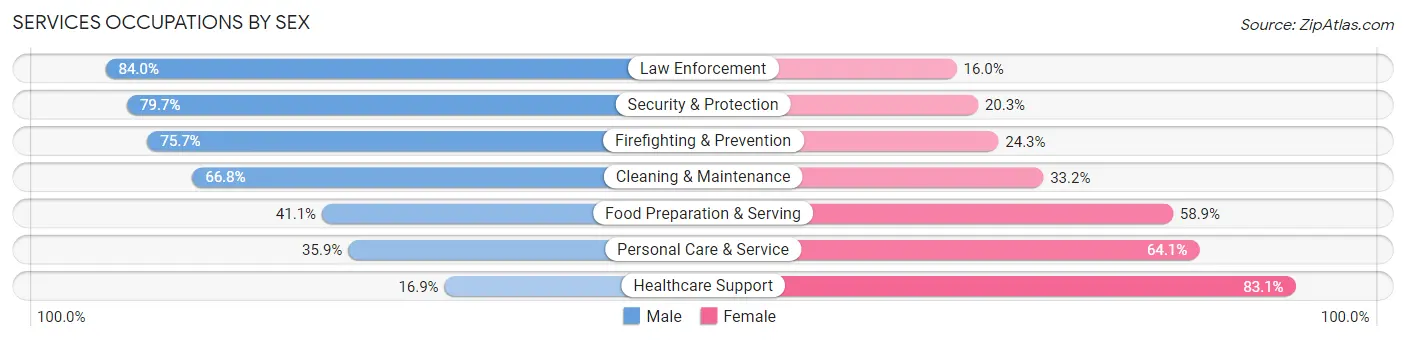
Services Occupations by Sex
Within the Services occupations in Steubenville, the most male-oriented occupations are Law Enforcement (84.0%), Security & Protection (79.7%), and Firefighting & Prevention (75.7%), while the most female-oriented occupations are Healthcare Support (83.1%), Personal Care & Service (64.1%), and Food Preparation & Serving (58.9%).
| Occupation | Male | Female |
| Healthcare Support | 29 (16.9%) | 143 (83.1%) |
| Security & Protection | 173 (79.7%) | 44 (20.3%) |
| Firefighting & Prevention | 84 (75.7%) | 27 (24.3%) |
| Law Enforcement | 89 (84.0%) | 17 (16.0%) |
| Food Preparation & Serving | 197 (41.1%) | 282 (58.9%) |
| Cleaning & Maintenance | 354 (66.8%) | 176 (33.2%) |
| Personal Care & Service | 97 (35.9%) | 173 (64.1%) |
| Total (Category) | 850 (51.0%) | 818 (49.0%) |
| Total (Overall) | 3,754 (48.3%) | 4,023 (51.7%) |
Sales and Office Occupations
The most common Sales and Office occupations in Steubenville are Office & Administration (943 | 12.1%), and Sales & Related (827 | 10.6%).

Sales and Office Occupations by Sex
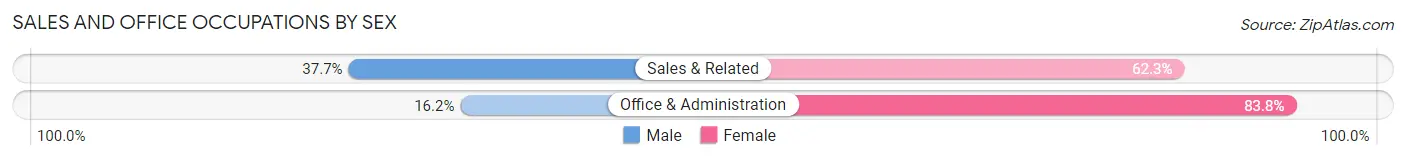
| Occupation | Male | Female |
| Sales & Related | 312 (37.7%) | 515 (62.3%) |
| Office & Administration | 153 (16.2%) | 790 (83.8%) |
| Total (Category) | 465 (26.3%) | 1,305 (73.7%) |
| Total (Overall) | 3,754 (48.3%) | 4,023 (51.7%) |
Natural Resources, Construction and Maintenance Occupations
The most common Natural Resources, Construction and Maintenance occupations in Steubenville are Construction & Extraction (311 | 4.0%), and Installation, Maintenance & Repair (224 | 2.9%).

Natural Resources, Construction and Maintenance Occupations by Sex
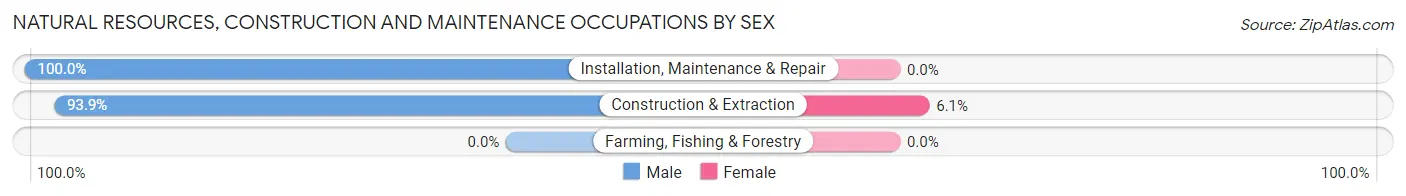
| Occupation | Male | Female |
| Farming, Fishing & Forestry | 0 (0.0%) | 0 (0.0%) |
| Construction & Extraction | 292 (93.9%) | 19 (6.1%) |
| Installation, Maintenance & Repair | 224 (100.0%) | 0 (0.0%) |
| Total (Category) | 516 (96.5%) | 19 (3.5%) |
| Total (Overall) | 3,754 (48.3%) | 4,023 (51.7%) |
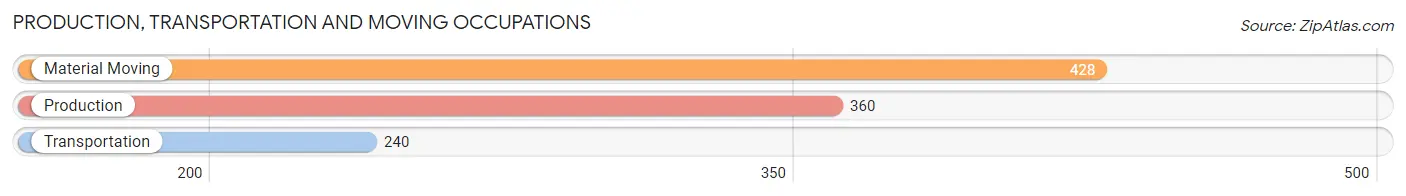
Production, Transportation and Moving Occupations
The most common Production, Transportation and Moving occupations in Steubenville are Material Moving (428 | 5.5%), Production (360 | 4.6%), and Transportation (240 | 3.1%).
Production, Transportation and Moving Occupations by Sex
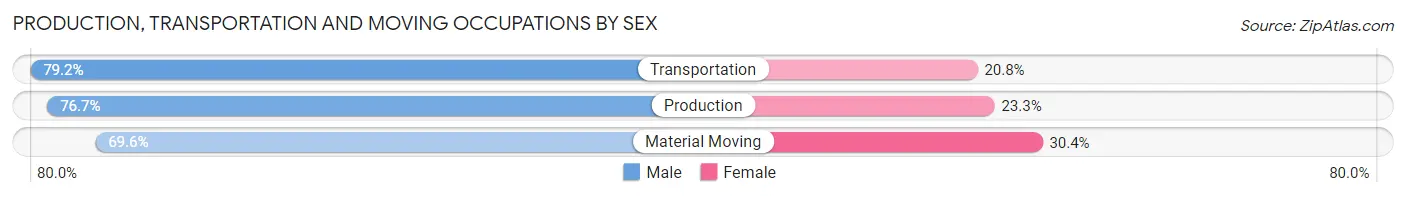
| Occupation | Male | Female |
| Production | 276 (76.7%) | 84 (23.3%) |
| Transportation | 190 (79.2%) | 50 (20.8%) |
| Material Moving | 298 (69.6%) | 130 (30.4%) |
| Total (Category) | 764 (74.3%) | 264 (25.7%) |
| Total (Overall) | 3,754 (48.3%) | 4,023 (51.7%) |
Employment Industries by Sex in Steubenville
Employment Industries in Steubenville
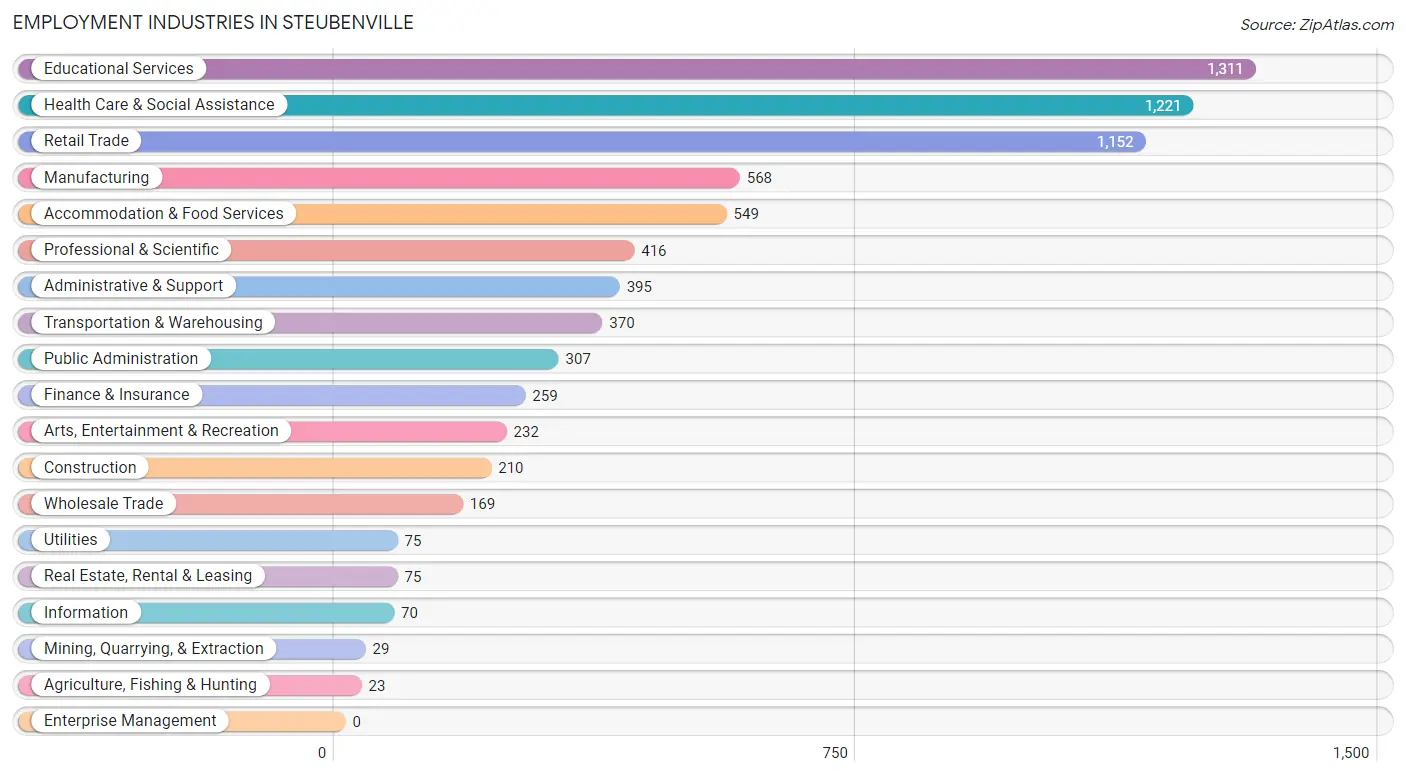
The major employment industries in Steubenville include Educational Services (1,311 | 16.9%), Health Care & Social Assistance (1,221 | 15.7%), Retail Trade (1,152 | 14.8%), Manufacturing (568 | 7.3%), and Accommodation & Food Services (549 | 7.1%).
Employment Industries by Sex in Steubenville
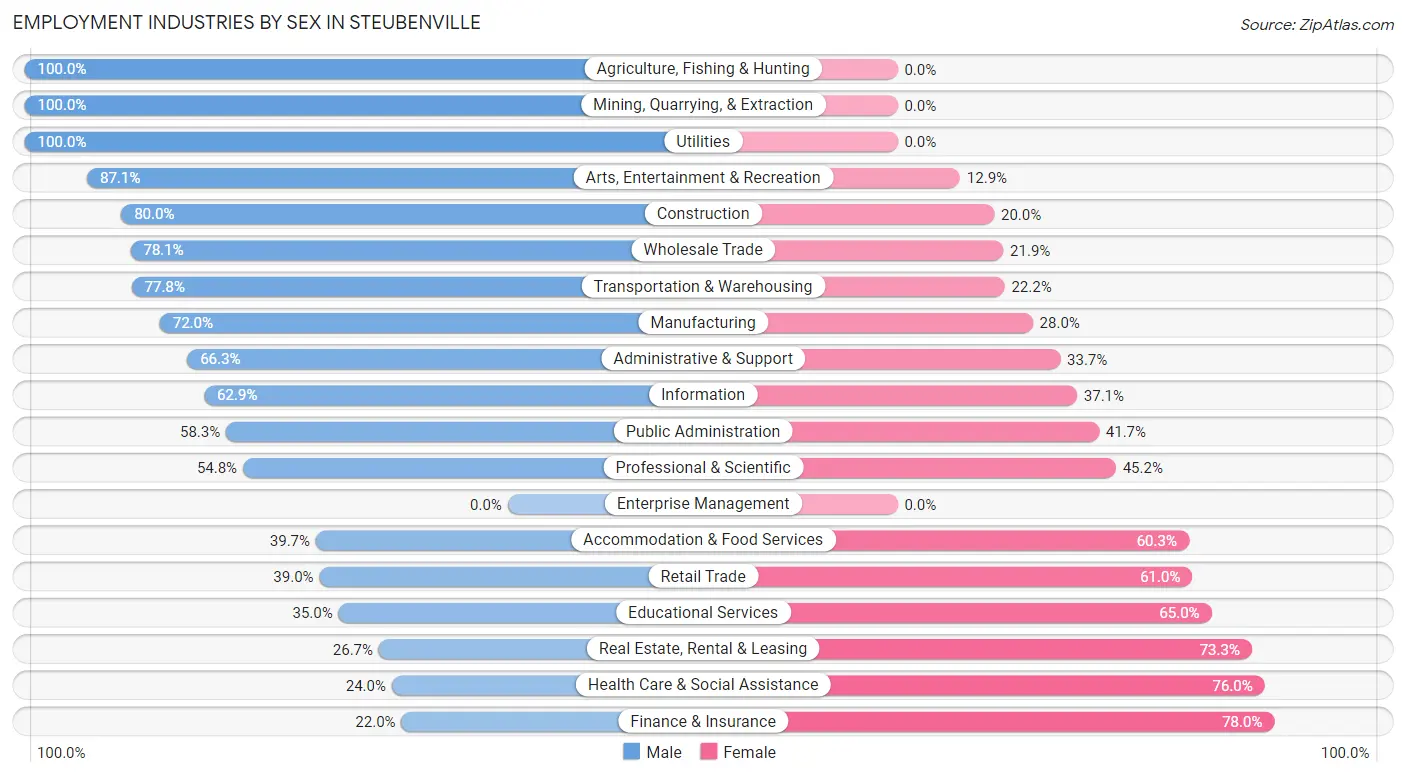
The Steubenville industries that see more men than women are Agriculture, Fishing & Hunting (100.0%), Mining, Quarrying, & Extraction (100.0%), and Utilities (100.0%), whereas the industries that tend to have a higher number of women are Finance & Insurance (78.0%), Health Care & Social Assistance (76.0%), and Real Estate, Rental & Leasing (73.3%).
| Industry | Male | Female |
| Agriculture, Fishing & Hunting | 23 (100.0%) | 0 (0.0%) |
| Mining, Quarrying, & Extraction | 29 (100.0%) | 0 (0.0%) |
| Construction | 168 (80.0%) | 42 (20.0%) |
| Manufacturing | 409 (72.0%) | 159 (28.0%) |
| Wholesale Trade | 132 (78.1%) | 37 (21.9%) |
| Retail Trade | 449 (39.0%) | 703 (61.0%) |
| Transportation & Warehousing | 288 (77.8%) | 82 (22.2%) |
| Utilities | 75 (100.0%) | 0 (0.0%) |
| Information | 44 (62.9%) | 26 (37.1%) |
| Finance & Insurance | 57 (22.0%) | 202 (78.0%) |
| Real Estate, Rental & Leasing | 20 (26.7%) | 55 (73.3%) |
| Professional & Scientific | 228 (54.8%) | 188 (45.2%) |
| Enterprise Management | 0 (0.0%) | 0 (0.0%) |
| Administrative & Support | 262 (66.3%) | 133 (33.7%) |
| Educational Services | 459 (35.0%) | 852 (65.0%) |
| Health Care & Social Assistance | 293 (24.0%) | 928 (76.0%) |
| Arts, Entertainment & Recreation | 202 (87.1%) | 30 (12.9%) |
| Accommodation & Food Services | 218 (39.7%) | 331 (60.3%) |
| Public Administration | 179 (58.3%) | 128 (41.7%) |
| Total | 3,754 (48.3%) | 4,023 (51.7%) |
Education in Steubenville
School Enrollment in Steubenville
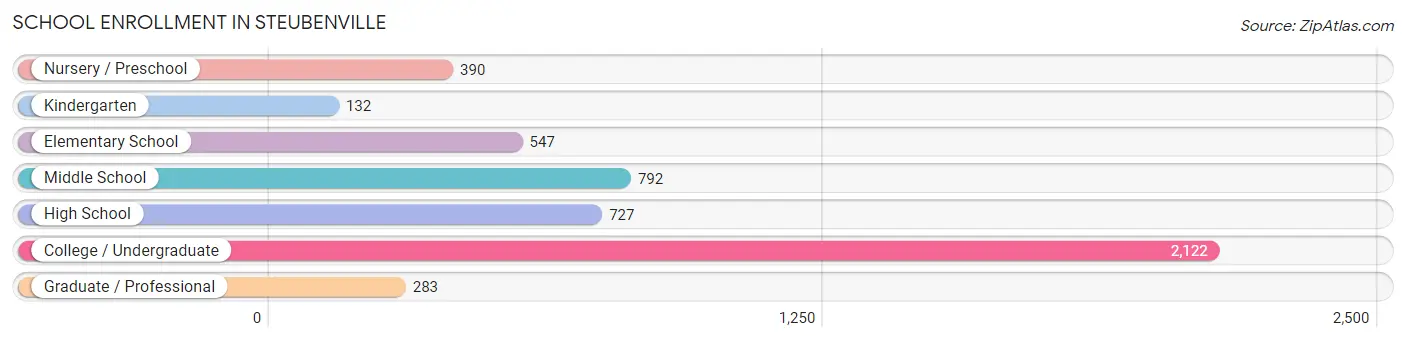
The most common levels of schooling among the 4,993 students in Steubenville are college / undergraduate (2,122 | 42.5%), middle school (792 | 15.9%), and high school (727 | 14.6%).
| School Level | # Students | % Students |
| Nursery / Preschool | 390 | 7.8% |
| Kindergarten | 132 | 2.6% |
| Elementary School | 547 | 11.0% |
| Middle School | 792 | 15.9% |
| High School | 727 | 14.6% |
| College / Undergraduate | 2,122 | 42.5% |
| Graduate / Professional | 283 | 5.7% |
| Total | 4,993 | 100.0% |
School Enrollment by Age by Funding Source in Steubenville
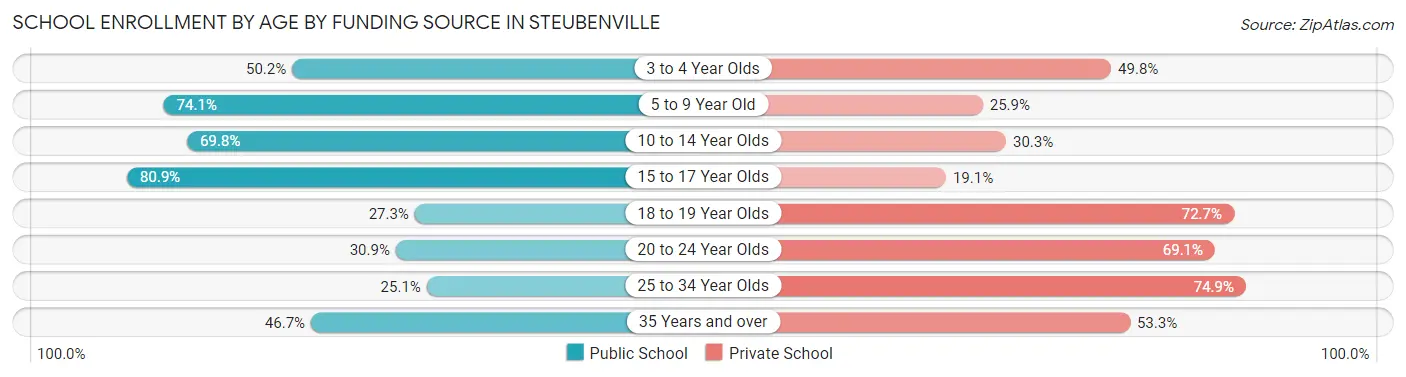
Out of a total of 4,993 students who are enrolled in schools in Steubenville, 2,477 (49.6%) attend a private institution, while the remaining 2,516 (50.4%) are enrolled in public schools. The age group of 25 to 34 year olds has the highest likelihood of being enrolled in private schools, with 173 (74.9% in the age bracket) enrolled. Conversely, the age group of 15 to 17 year olds has the lowest likelihood of being enrolled in a private school, with 412 (80.9% in the age bracket) attending a public institution.
| Age Bracket | Public School | Private School |
| 3 to 4 Year Olds | 139 (50.2%) | 138 (49.8%) |
| 5 to 9 Year Old | 509 (74.1%) | 178 (25.9%) |
| 10 to 14 Year Olds | 694 (69.8%) | 301 (30.2%) |
| 15 to 17 Year Olds | 412 (80.9%) | 97 (19.1%) |
| 18 to 19 Year Olds | 263 (27.3%) | 699 (72.7%) |
| 20 to 24 Year Olds | 351 (30.9%) | 786 (69.1%) |
| 25 to 34 Year Olds | 58 (25.1%) | 173 (74.9%) |
| 35 Years and over | 91 (46.7%) | 104 (53.3%) |
| Total | 2,516 (50.4%) | 2,477 (49.6%) |
Educational Attainment by Field of Study in Steubenville
Business (751 | 20.3%), education (453 | 12.3%), science & technology (430 | 11.6%), liberal arts & history (372 | 10.1%), and arts & humanities (258 | 7.0%) are the most common fields of study among 3,696 individuals in Steubenville who have obtained a bachelor's degree or higher.
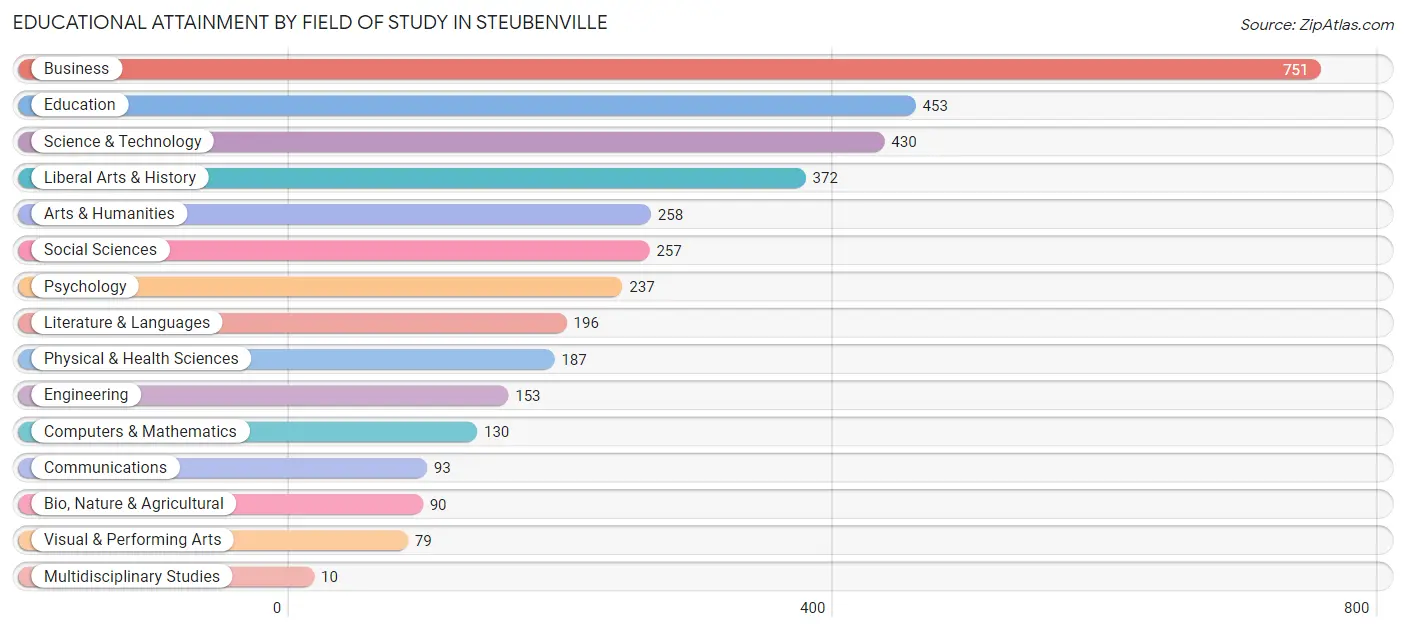
| Field of Study | # Graduates | % Graduates |
| Computers & Mathematics | 130 | 3.5% |
| Bio, Nature & Agricultural | 90 | 2.4% |
| Physical & Health Sciences | 187 | 5.1% |
| Psychology | 237 | 6.4% |
| Social Sciences | 257 | 7.0% |
| Engineering | 153 | 4.1% |
| Multidisciplinary Studies | 10 | 0.3% |
| Science & Technology | 430 | 11.6% |
| Business | 751 | 20.3% |
| Education | 453 | 12.3% |
| Literature & Languages | 196 | 5.3% |
| Liberal Arts & History | 372 | 10.1% |
| Visual & Performing Arts | 79 | 2.1% |
| Communications | 93 | 2.5% |
| Arts & Humanities | 258 | 7.0% |
| Total | 3,696 | 100.0% |
Transportation & Commute in Steubenville
Vehicle Availability by Sex in Steubenville
The most prevalent vehicle ownership categories in Steubenville are males with 2 vehicles (1,759, accounting for 51.0%) and females with 2 vehicles (1,527, making up 48.9%).
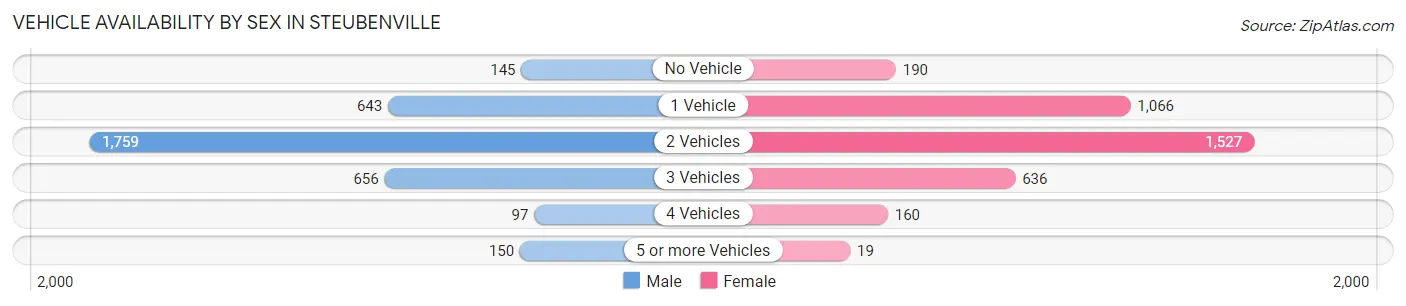
| Vehicles Available | Male | Female |
| No Vehicle | 145 (4.2%) | 190 (5.3%) |
| 1 Vehicle | 643 (18.6%) | 1,066 (29.6%) |
| 2 Vehicles | 1,759 (51.0%) | 1,527 (42.4%) |
| 3 Vehicles | 656 (19.0%) | 636 (17.7%) |
| 4 Vehicles | 97 (2.8%) | 160 (4.4%) |
| 5 or more Vehicles | 150 (4.3%) | 19 (0.5%) |
| Total | 3,450 (100.0%) | 3,598 (100.0%) |
Commute Time in Steubenville
The most frequently occuring commute durations in Steubenville are 5 to 9 minutes (1,904 commuters, 28.3%), 10 to 14 minutes (1,454 commuters, 21.6%), and 15 to 19 minutes (780 commuters, 11.6%).
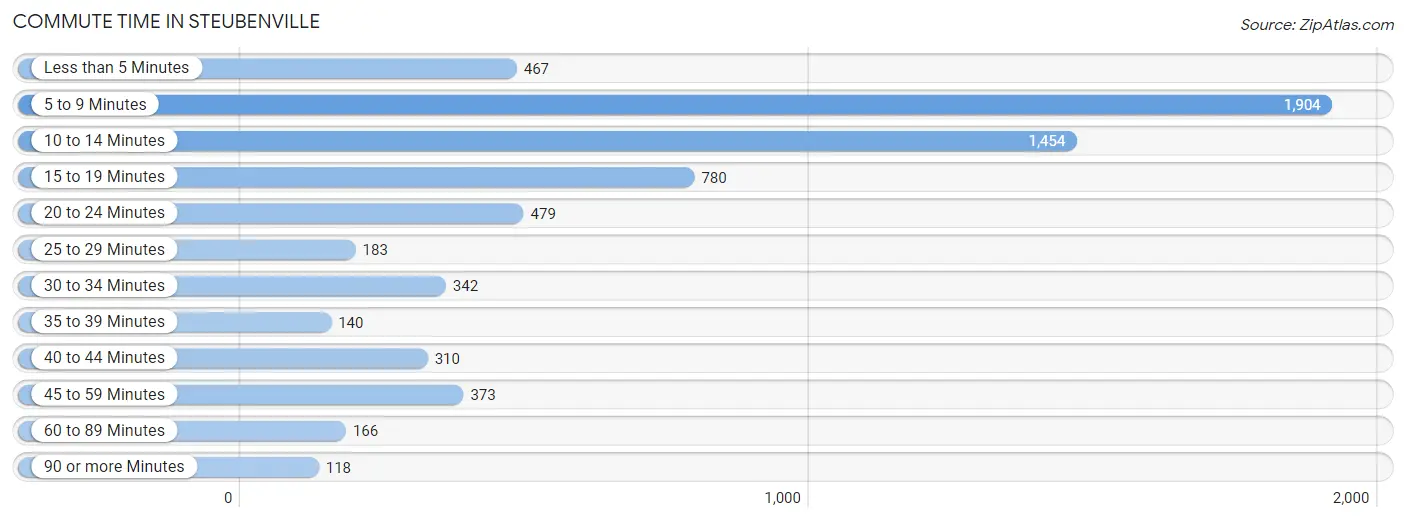
| Commute Time | # Commuters | % Commuters |
| Less than 5 Minutes | 467 | 7.0% |
| 5 to 9 Minutes | 1,904 | 28.3% |
| 10 to 14 Minutes | 1,454 | 21.6% |
| 15 to 19 Minutes | 780 | 11.6% |
| 20 to 24 Minutes | 479 | 7.1% |
| 25 to 29 Minutes | 183 | 2.7% |
| 30 to 34 Minutes | 342 | 5.1% |
| 35 to 39 Minutes | 140 | 2.1% |
| 40 to 44 Minutes | 310 | 4.6% |
| 45 to 59 Minutes | 373 | 5.6% |
| 60 to 89 Minutes | 166 | 2.5% |
| 90 or more Minutes | 118 | 1.8% |
Commute Time by Sex in Steubenville
The most common commute times in Steubenville are 5 to 9 minutes (785 commuters, 23.2%) for males and 5 to 9 minutes (1,119 commuters, 33.6%) for females.
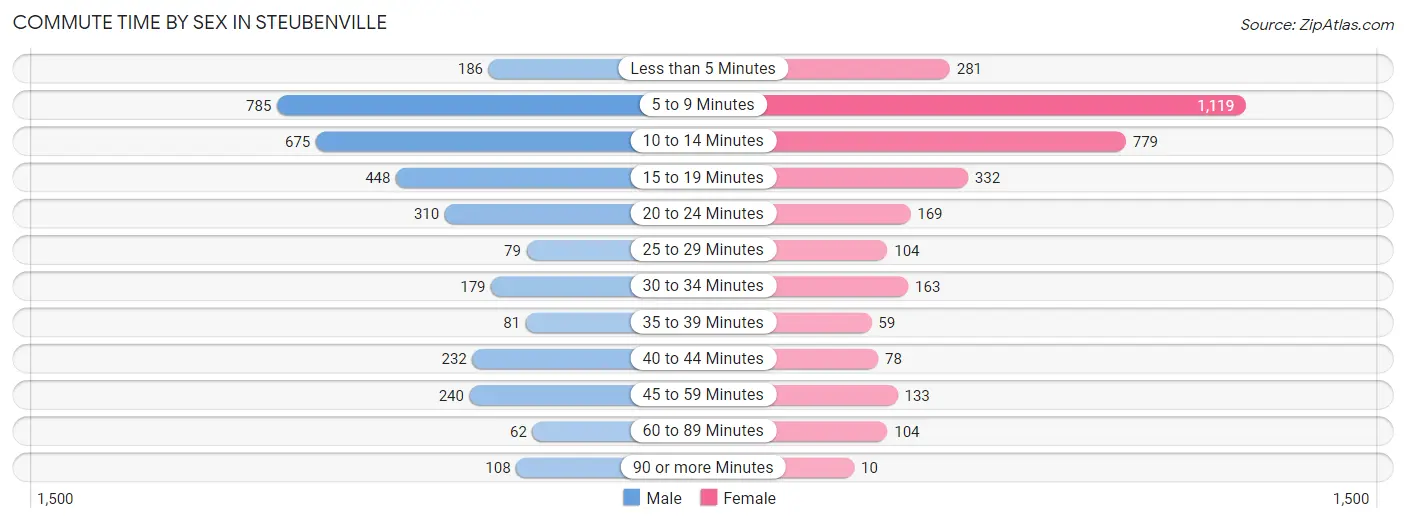
| Commute Time | Male | Female |
| Less than 5 Minutes | 186 (5.5%) | 281 (8.4%) |
| 5 to 9 Minutes | 785 (23.2%) | 1,119 (33.6%) |
| 10 to 14 Minutes | 675 (19.9%) | 779 (23.4%) |
| 15 to 19 Minutes | 448 (13.2%) | 332 (10.0%) |
| 20 to 24 Minutes | 310 (9.2%) | 169 (5.1%) |
| 25 to 29 Minutes | 79 (2.3%) | 104 (3.1%) |
| 30 to 34 Minutes | 179 (5.3%) | 163 (4.9%) |
| 35 to 39 Minutes | 81 (2.4%) | 59 (1.8%) |
| 40 to 44 Minutes | 232 (6.9%) | 78 (2.3%) |
| 45 to 59 Minutes | 240 (7.1%) | 133 (4.0%) |
| 60 to 89 Minutes | 62 (1.8%) | 104 (3.1%) |
| 90 or more Minutes | 108 (3.2%) | 10 (0.3%) |
Time of Departure to Work by Sex in Steubenville
The most frequent times of departure to work in Steubenville are 7:30 AM to 7:59 AM (558, 16.5%) for males and 8:00 AM to 8:29 AM (607, 18.2%) for females.
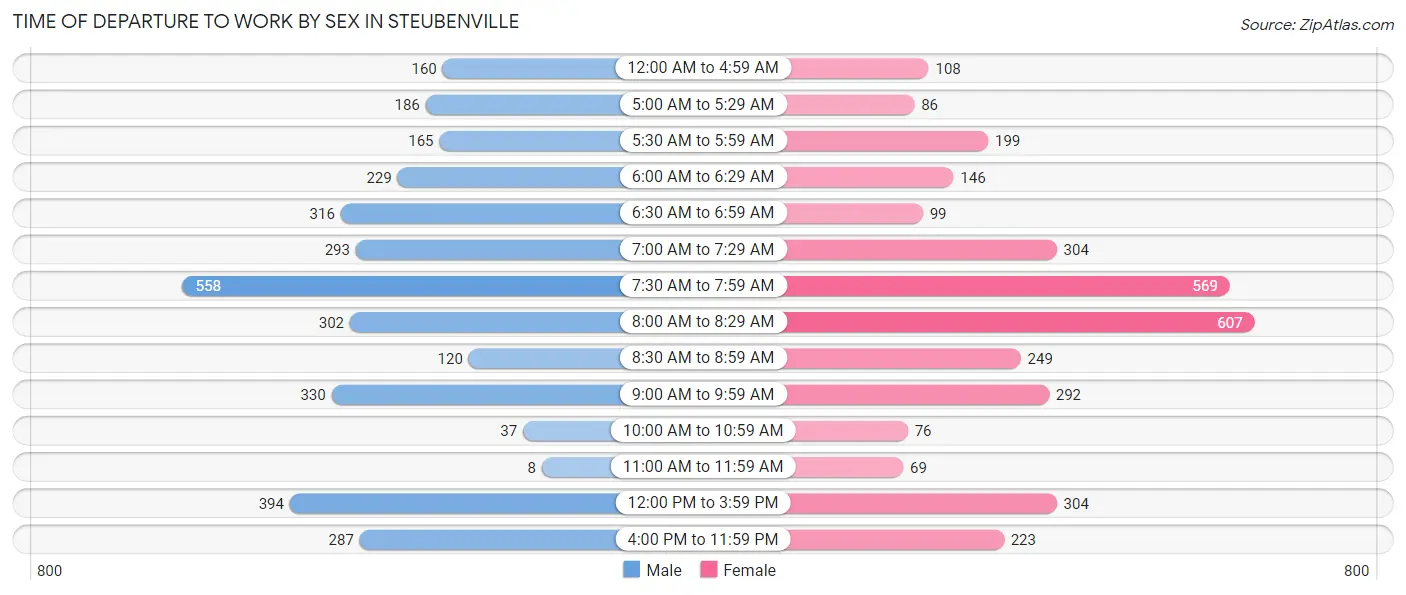
| Time of Departure | Male | Female |
| 12:00 AM to 4:59 AM | 160 (4.7%) | 108 (3.2%) |
| 5:00 AM to 5:29 AM | 186 (5.5%) | 86 (2.6%) |
| 5:30 AM to 5:59 AM | 165 (4.9%) | 199 (6.0%) |
| 6:00 AM to 6:29 AM | 229 (6.8%) | 146 (4.4%) |
| 6:30 AM to 6:59 AM | 316 (9.3%) | 99 (3.0%) |
| 7:00 AM to 7:29 AM | 293 (8.7%) | 304 (9.1%) |
| 7:30 AM to 7:59 AM | 558 (16.5%) | 569 (17.1%) |
| 8:00 AM to 8:29 AM | 302 (8.9%) | 607 (18.2%) |
| 8:30 AM to 8:59 AM | 120 (3.5%) | 249 (7.5%) |
| 9:00 AM to 9:59 AM | 330 (9.8%) | 292 (8.8%) |
| 10:00 AM to 10:59 AM | 37 (1.1%) | 76 (2.3%) |
| 11:00 AM to 11:59 AM | 8 (0.2%) | 69 (2.1%) |
| 12:00 PM to 3:59 PM | 394 (11.6%) | 304 (9.1%) |
| 4:00 PM to 11:59 PM | 287 (8.5%) | 223 (6.7%) |
| Total | 3,385 (100.0%) | 3,331 (100.0%) |
Housing Occupancy in Steubenville
Occupancy by Ownership in Steubenville
Of the total 7,382 dwellings in Steubenville, owner-occupied units account for 4,072 (55.2%), while renter-occupied units make up 3,310 (44.8%).
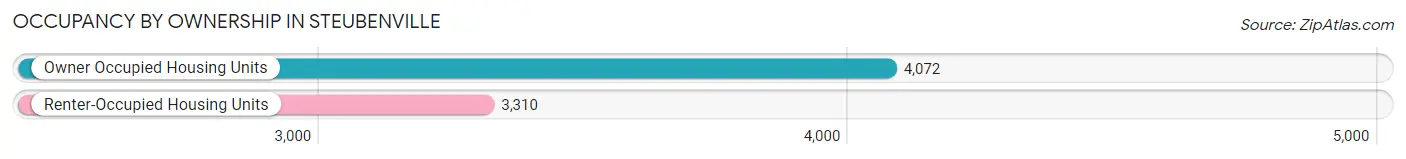
| Occupancy | # Housing Units | % Housing Units |
| Owner Occupied Housing Units | 4,072 | 55.2% |
| Renter-Occupied Housing Units | 3,310 | 44.8% |
| Total Occupied Housing Units | 7,382 | 100.0% |
Occupancy by Household Size in Steubenville
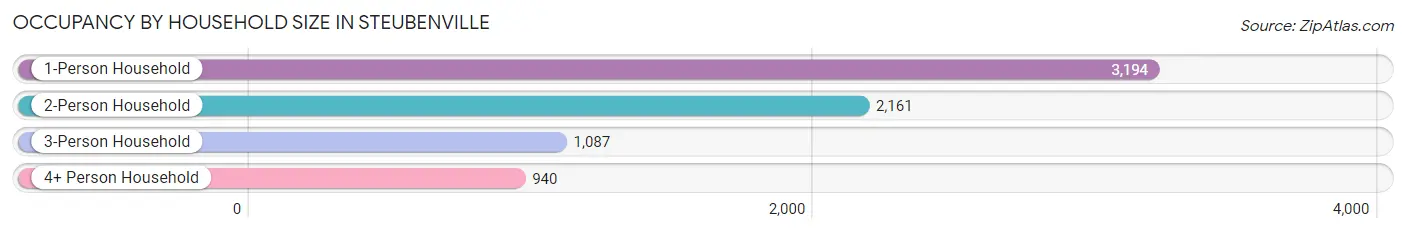
| Household Size | # Housing Units | % Housing Units |
| 1-Person Household | 3,194 | 43.3% |
| 2-Person Household | 2,161 | 29.3% |
| 3-Person Household | 1,087 | 14.7% |
| 4+ Person Household | 940 | 12.7% |
| Total Housing Units | 7,382 | 100.0% |
Occupancy by Ownership by Household Size in Steubenville
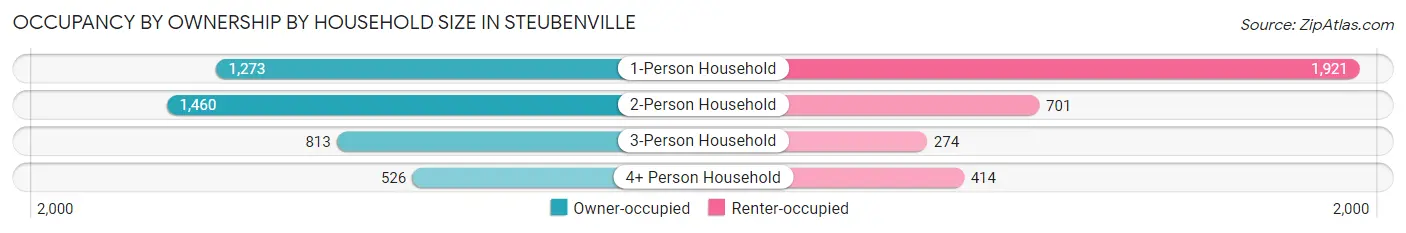
| Household Size | Owner-occupied | Renter-occupied |
| 1-Person Household | 1,273 (39.9%) | 1,921 (60.1%) |
| 2-Person Household | 1,460 (67.6%) | 701 (32.4%) |
| 3-Person Household | 813 (74.8%) | 274 (25.2%) |
| 4+ Person Household | 526 (56.0%) | 414 (44.0%) |
| Total Housing Units | 4,072 (55.2%) | 3,310 (44.8%) |
Occupancy by Educational Attainment in Steubenville
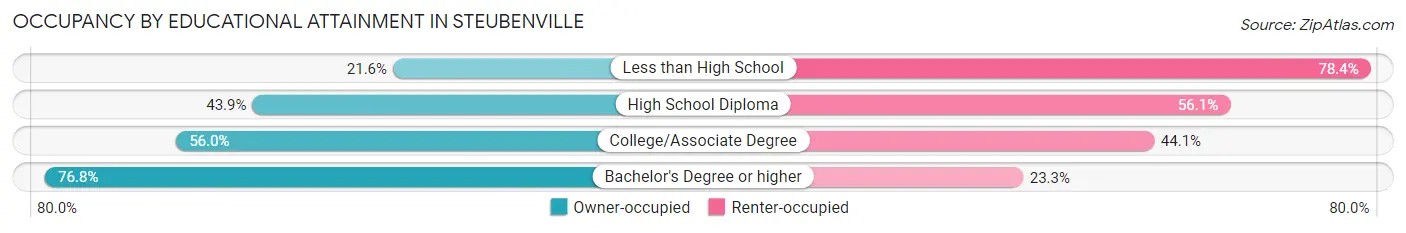
| Household Size | Owner-occupied | Renter-occupied |
| Less than High School | 106 (21.6%) | 385 (78.4%) |
| High School Diploma | 1,174 (43.9%) | 1,501 (56.1%) |
| College/Associate Degree | 1,194 (55.9%) | 940 (44.1%) |
| Bachelor's Degree or higher | 1,598 (76.7%) | 484 (23.3%) |
Occupancy by Age of Householder in Steubenville
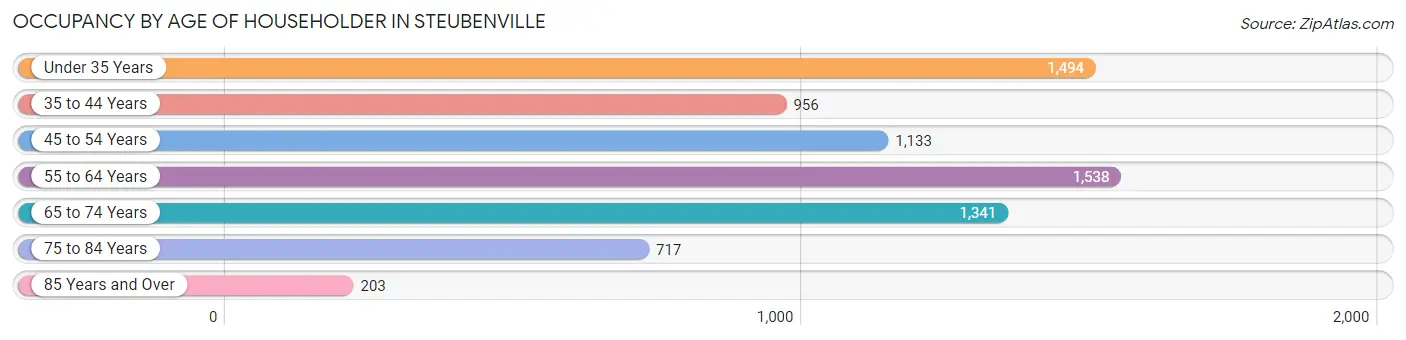
| Age Bracket | # Households | % Households |
| Under 35 Years | 1,494 | 20.2% |
| 35 to 44 Years | 956 | 13.0% |
| 45 to 54 Years | 1,133 | 15.3% |
| 55 to 64 Years | 1,538 | 20.8% |
| 65 to 74 Years | 1,341 | 18.2% |
| 75 to 84 Years | 717 | 9.7% |
| 85 Years and Over | 203 | 2.8% |
| Total | 7,382 | 100.0% |
Housing Finances in Steubenville
Median Income by Occupancy in Steubenville
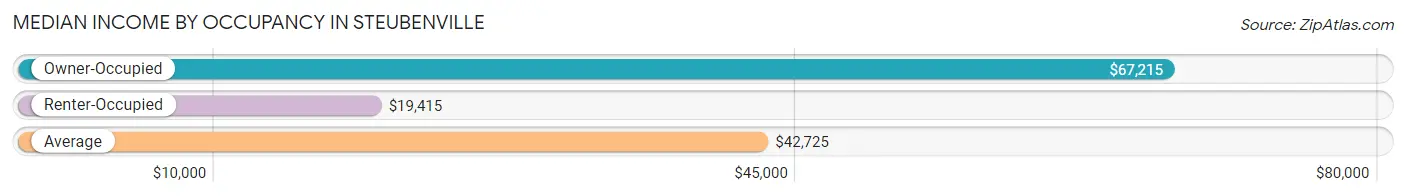
| Occupancy Type | # Households | Median Income |
| Owner-Occupied | 4,072 (55.2%) | $67,215 |
| Renter-Occupied | 3,310 (44.8%) | $19,415 |
| Average | 7,382 (100.0%) | $42,725 |
Occupancy by Householder Income Bracket in Steubenville
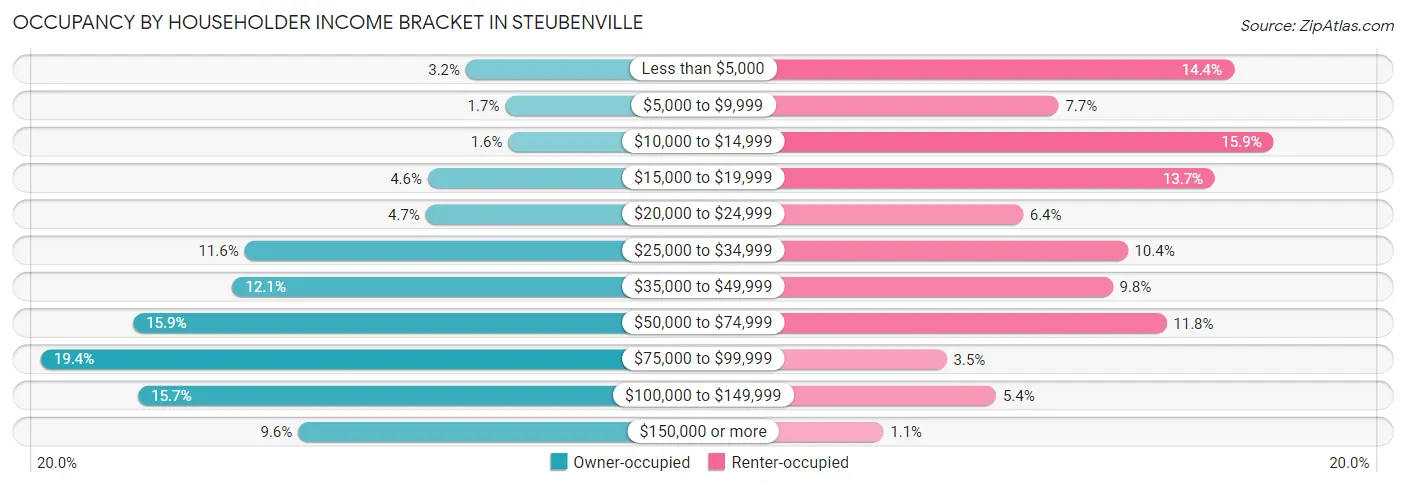
| Income Bracket | Owner-occupied | Renter-occupied |
| Less than $5,000 | 130 (3.2%) | 477 (14.4%) |
| $5,000 to $9,999 | 69 (1.7%) | 256 (7.7%) |
| $10,000 to $14,999 | 64 (1.6%) | 527 (15.9%) |
| $15,000 to $19,999 | 189 (4.6%) | 453 (13.7%) |
| $20,000 to $24,999 | 192 (4.7%) | 211 (6.4%) |
| $25,000 to $34,999 | 473 (11.6%) | 343 (10.4%) |
| $35,000 to $49,999 | 492 (12.1%) | 324 (9.8%) |
| $50,000 to $74,999 | 646 (15.9%) | 392 (11.8%) |
| $75,000 to $99,999 | 789 (19.4%) | 115 (3.5%) |
| $100,000 to $149,999 | 638 (15.7%) | 177 (5.3%) |
| $150,000 or more | 390 (9.6%) | 35 (1.1%) |
| Total | 4,072 (100.0%) | 3,310 (100.0%) |
Monthly Housing Cost Tiers in Steubenville
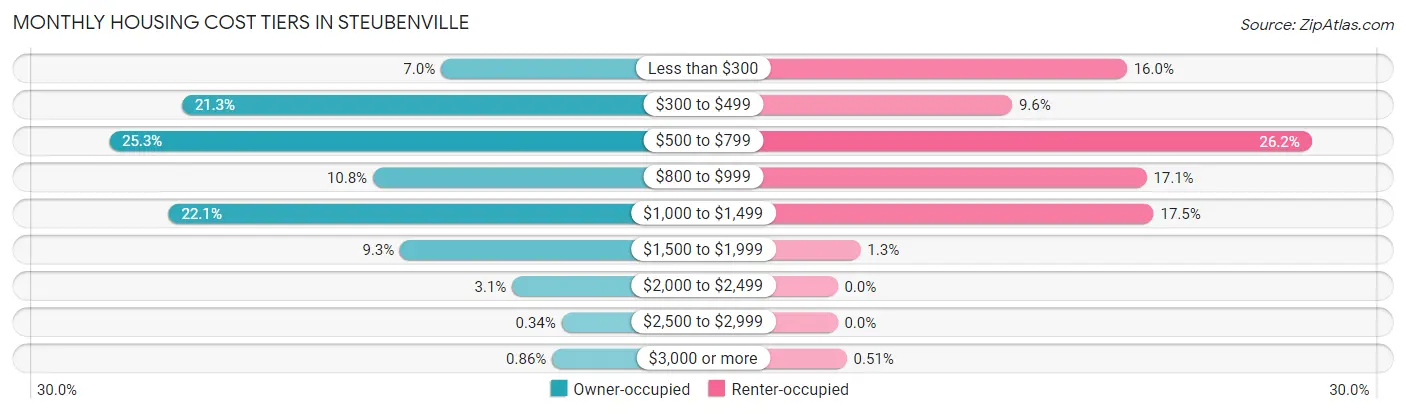
| Monthly Cost | Owner-occupied | Renter-occupied |
| Less than $300 | 285 (7.0%) | 529 (16.0%) |
| $300 to $499 | 868 (21.3%) | 319 (9.6%) |
| $500 to $799 | 1,032 (25.3%) | 867 (26.2%) |
| $800 to $999 | 438 (10.8%) | 565 (17.1%) |
| $1,000 to $1,499 | 898 (22.1%) | 578 (17.5%) |
| $1,500 to $1,999 | 377 (9.3%) | 42 (1.3%) |
| $2,000 to $2,499 | 125 (3.1%) | 0 (0.0%) |
| $2,500 to $2,999 | 14 (0.3%) | 0 (0.0%) |
| $3,000 or more | 35 (0.9%) | 17 (0.5%) |
| Total | 4,072 (100.0%) | 3,310 (100.0%) |
Physical Housing Characteristics in Steubenville
Housing Structures in Steubenville
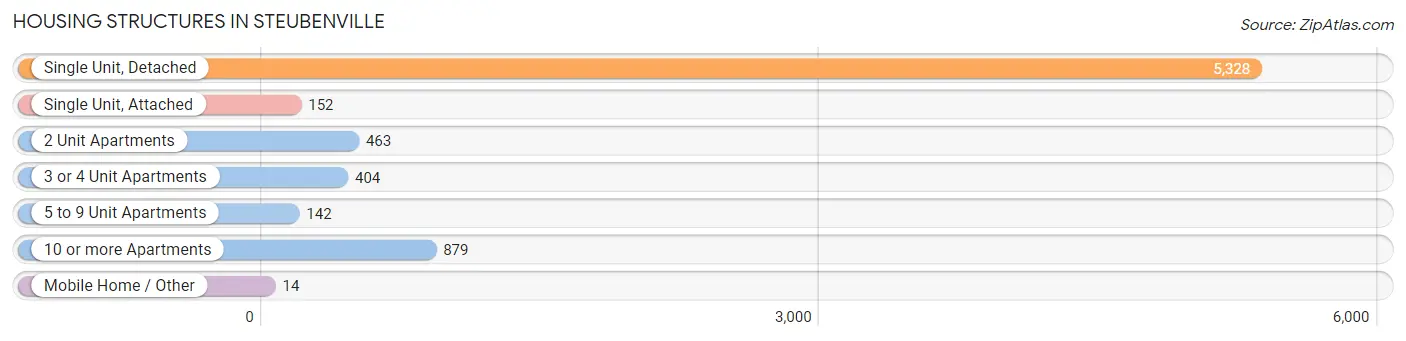
| Structure Type | # Housing Units | % Housing Units |
| Single Unit, Detached | 5,328 | 72.2% |
| Single Unit, Attached | 152 | 2.1% |
| 2 Unit Apartments | 463 | 6.3% |
| 3 or 4 Unit Apartments | 404 | 5.5% |
| 5 to 9 Unit Apartments | 142 | 1.9% |
| 10 or more Apartments | 879 | 11.9% |
| Mobile Home / Other | 14 | 0.2% |
| Total | 7,382 | 100.0% |
Housing Structures by Occupancy in Steubenville
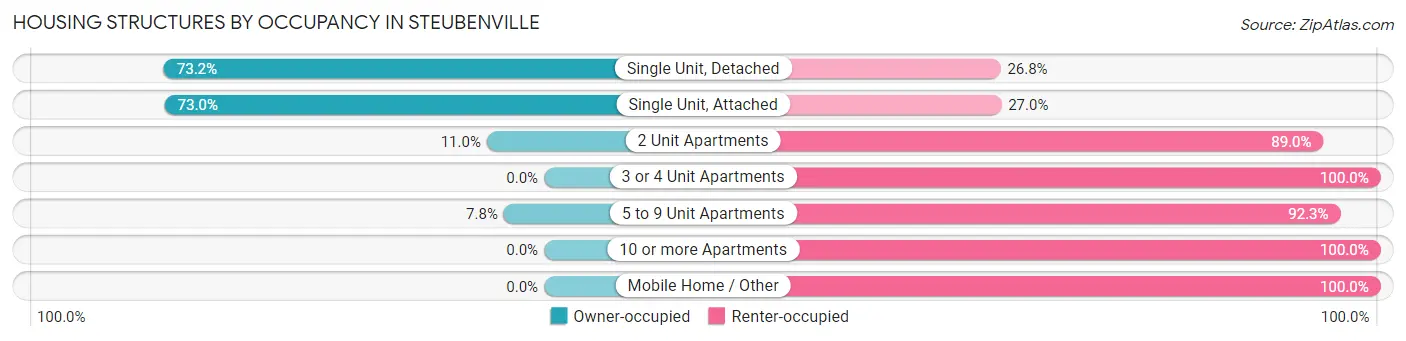
| Structure Type | Owner-occupied | Renter-occupied |
| Single Unit, Detached | 3,899 (73.2%) | 1,429 (26.8%) |
| Single Unit, Attached | 111 (73.0%) | 41 (27.0%) |
| 2 Unit Apartments | 51 (11.0%) | 412 (89.0%) |
| 3 or 4 Unit Apartments | 0 (0.0%) | 404 (100.0%) |
| 5 to 9 Unit Apartments | 11 (7.7%) | 131 (92.2%) |
| 10 or more Apartments | 0 (0.0%) | 879 (100.0%) |
| Mobile Home / Other | 0 (0.0%) | 14 (100.0%) |
| Total | 4,072 (55.2%) | 3,310 (44.8%) |
Housing Structures by Number of Rooms in Steubenville
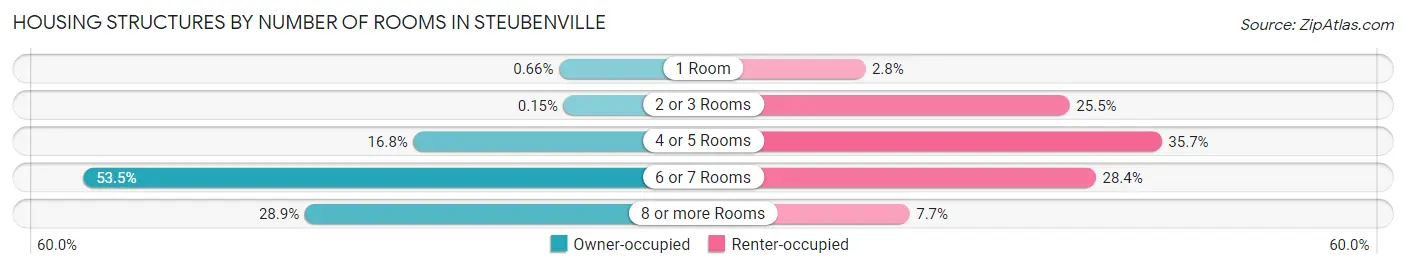
| Number of Rooms | Owner-occupied | Renter-occupied |
| 1 Room | 27 (0.7%) | 92 (2.8%) |
| 2 or 3 Rooms | 6 (0.2%) | 843 (25.5%) |
| 4 or 5 Rooms | 685 (16.8%) | 1,181 (35.7%) |
| 6 or 7 Rooms | 2,178 (53.5%) | 939 (28.4%) |
| 8 or more Rooms | 1,176 (28.9%) | 255 (7.7%) |
| Total | 4,072 (100.0%) | 3,310 (100.0%) |
Housing Structure by Heating Type in Steubenville

| Heating Type | Owner-occupied | Renter-occupied |
| Utility Gas | 3,579 (87.9%) | 1,801 (54.4%) |
| Bottled, Tank, or LP Gas | 42 (1.0%) | 64 (1.9%) |
| Electricity | 433 (10.6%) | 1,432 (43.3%) |
| Fuel Oil or Kerosene | 10 (0.3%) | 0 (0.0%) |
| Coal or Coke | 0 (0.0%) | 0 (0.0%) |
| All other Fuels | 8 (0.2%) | 13 (0.4%) |
| No Fuel Used | 0 (0.0%) | 0 (0.0%) |
| Total | 4,072 (100.0%) | 3,310 (100.0%) |
Household Vehicle Usage in Steubenville
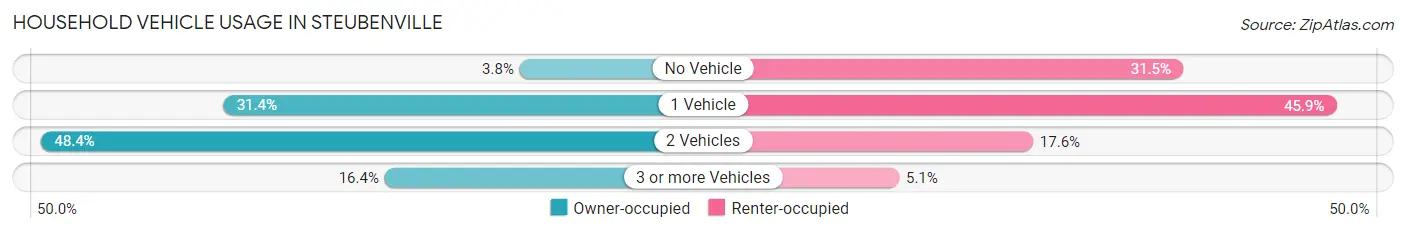
| Vehicles per Household | Owner-occupied | Renter-occupied |
| No Vehicle | 154 (3.8%) | 1,044 (31.5%) |
| 1 Vehicle | 1,279 (31.4%) | 1,518 (45.9%) |
| 2 Vehicles | 1,972 (48.4%) | 581 (17.5%) |
| 3 or more Vehicles | 667 (16.4%) | 167 (5.1%) |
| Total | 4,072 (100.0%) | 3,310 (100.0%) |
Real Estate & Mortgages in Steubenville
Real Estate and Mortgage Overview in Steubenville
| Characteristic | Without Mortgage | With Mortgage |
| Housing Units | 1,997 | 2,075 |
| Median Property Value | $96,500 | $143,400 |
| Median Household Income | $47,062 | $298 |
| Monthly Housing Costs | $474 | $16 |
| Real Estate Taxes | $1,001 | $16 |
Property Value by Mortgage Status in Steubenville
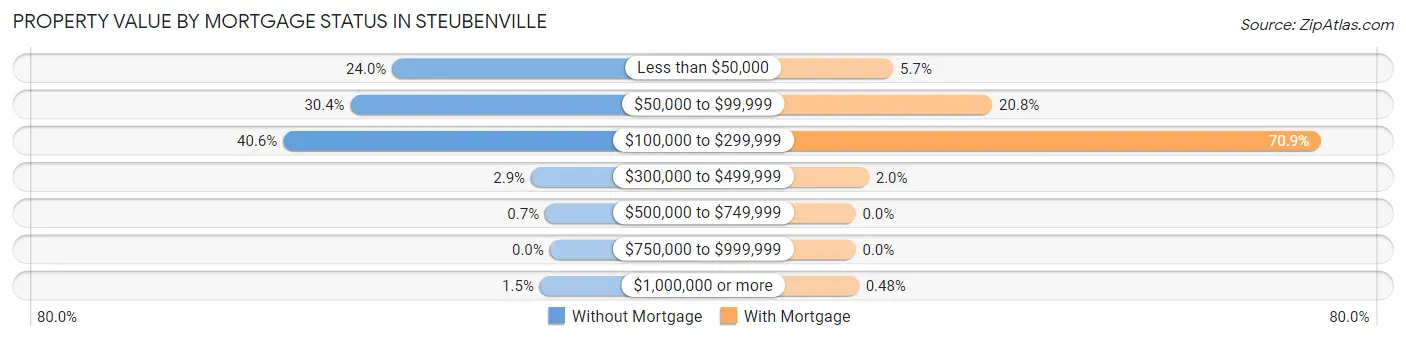
| Property Value | Without Mortgage | With Mortgage |
| Less than $50,000 | 479 (24.0%) | 119 (5.7%) |
| $50,000 to $99,999 | 606 (30.3%) | 432 (20.8%) |
| $100,000 to $299,999 | 811 (40.6%) | 1,472 (70.9%) |
| $300,000 to $499,999 | 57 (2.9%) | 42 (2.0%) |
| $500,000 to $749,999 | 14 (0.7%) | 0 (0.0%) |
| $750,000 to $999,999 | 0 (0.0%) | 0 (0.0%) |
| $1,000,000 or more | 30 (1.5%) | 10 (0.5%) |
| Total | 1,997 (100.0%) | 2,075 (100.0%) |
Household Income by Mortgage Status in Steubenville
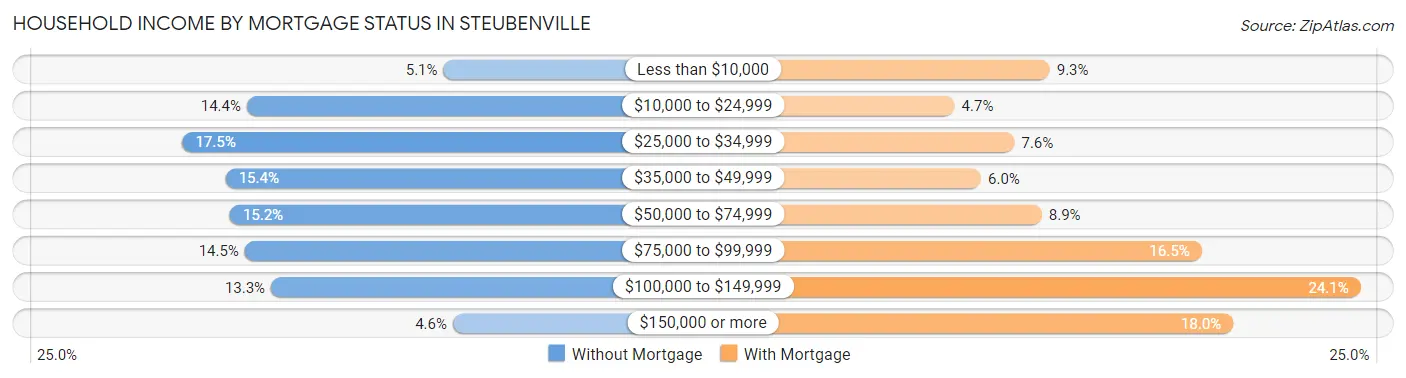
| Household Income | Without Mortgage | With Mortgage |
| Less than $10,000 | 101 (5.1%) | 192 (9.2%) |
| $10,000 to $24,999 | 288 (14.4%) | 98 (4.7%) |
| $25,000 to $34,999 | 349 (17.5%) | 157 (7.6%) |
| $35,000 to $49,999 | 308 (15.4%) | 124 (6.0%) |
| $50,000 to $74,999 | 304 (15.2%) | 184 (8.9%) |
| $75,000 to $99,999 | 290 (14.5%) | 342 (16.5%) |
| $100,000 to $149,999 | 265 (13.3%) | 499 (24.0%) |
| $150,000 or more | 92 (4.6%) | 373 (18.0%) |
| Total | 1,997 (100.0%) | 2,075 (100.0%) |
Property Value to Household Income Ratio in Steubenville
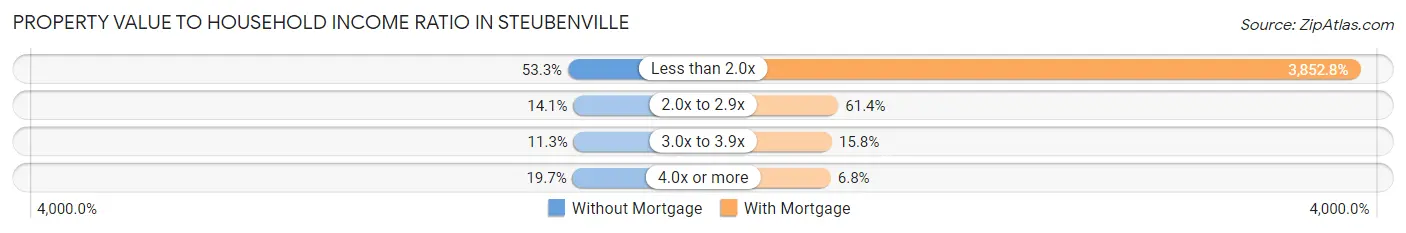
| Value-to-Income Ratio | Without Mortgage | With Mortgage |
| Less than 2.0x | 1,064 (53.3%) | 79,945 (3,852.8%) |
| 2.0x to 2.9x | 282 (14.1%) | 1,274 (61.4%) |
| 3.0x to 3.9x | 225 (11.3%) | 328 (15.8%) |
| 4.0x or more | 394 (19.7%) | 140 (6.8%) |
| Total | 1,997 (100.0%) | 2,075 (100.0%) |
Real Estate Taxes by Mortgage Status in Steubenville
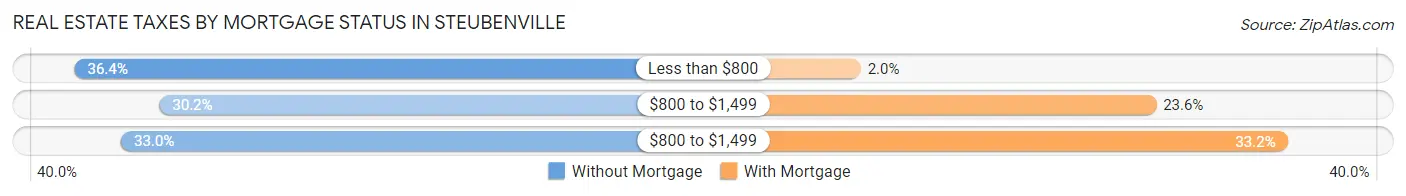
| Property Taxes | Without Mortgage | With Mortgage |
| Less than $800 | 726 (36.3%) | 42 (2.0%) |
| $800 to $1,499 | 602 (30.1%) | 490 (23.6%) |
| $800 to $1,499 | 658 (33.0%) | 689 (33.2%) |
| Total | 1,997 (100.0%) | 2,075 (100.0%) |
Health & Disability in Steubenville
Health Insurance Coverage by Age in Steubenville
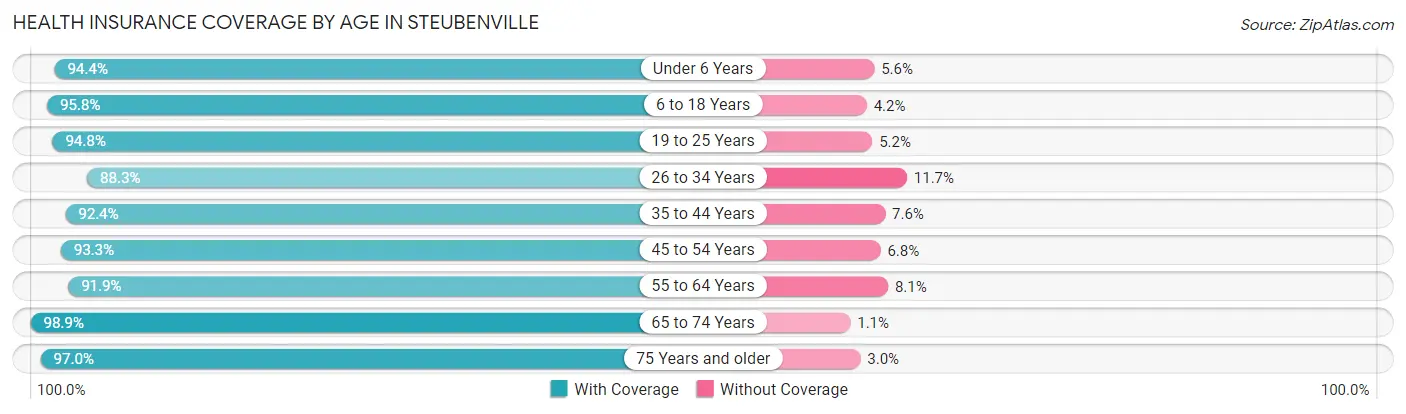
| Age Bracket | With Coverage | Without Coverage |
| Under 6 Years | 1,134 (94.4%) | 67 (5.6%) |
| 6 to 18 Years | 2,313 (95.8%) | 101 (4.2%) |
| 19 to 25 Years | 2,745 (94.8%) | 151 (5.2%) |
| 26 to 34 Years | 1,802 (88.3%) | 238 (11.7%) |
| 35 to 44 Years | 1,676 (92.4%) | 138 (7.6%) |
| 45 to 54 Years | 1,782 (93.2%) | 129 (6.8%) |
| 55 to 64 Years | 2,020 (91.9%) | 179 (8.1%) |
| 65 to 74 Years | 2,027 (98.9%) | 23 (1.1%) |
| 75 Years and older | 1,132 (97.0%) | 35 (3.0%) |
| Total | 16,631 (94.0%) | 1,061 (6.0%) |
Health Insurance Coverage by Citizenship Status in Steubenville
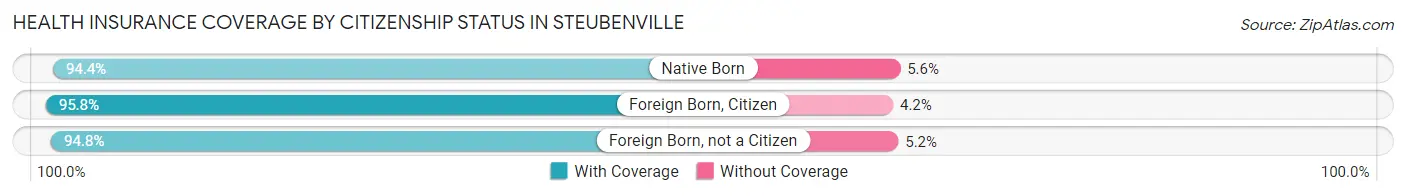
| Citizenship Status | With Coverage | Without Coverage |
| Native Born | 1,134 (94.4%) | 67 (5.6%) |
| Foreign Born, Citizen | 2,313 (95.8%) | 101 (4.2%) |
| Foreign Born, not a Citizen | 2,745 (94.8%) | 151 (5.2%) |
Health Insurance Coverage by Household Income in Steubenville
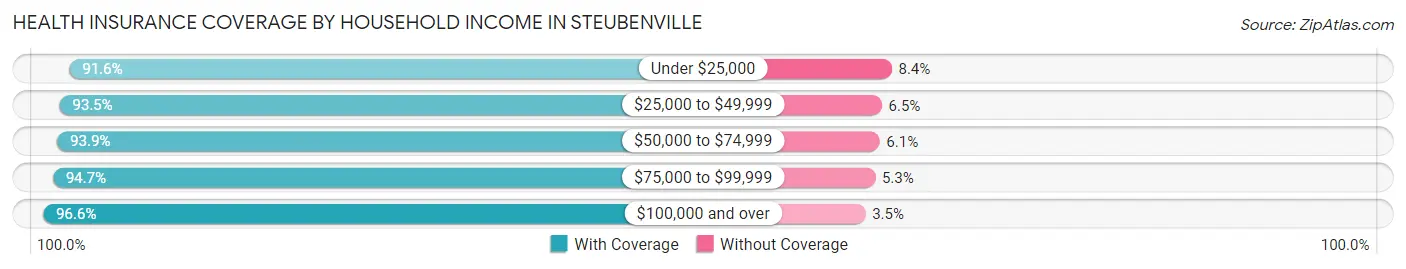
| Household Income | With Coverage | Without Coverage |
| Under $25,000 | 4,004 (91.6%) | 366 (8.4%) |
| $25,000 to $49,999 | 2,825 (93.5%) | 197 (6.5%) |
| $50,000 to $74,999 | 2,321 (93.9%) | 151 (6.1%) |
| $75,000 to $99,999 | 2,387 (94.7%) | 133 (5.3%) |
| $100,000 and over | 3,748 (96.6%) | 134 (3.5%) |
Public vs Private Health Insurance Coverage by Age in Steubenville
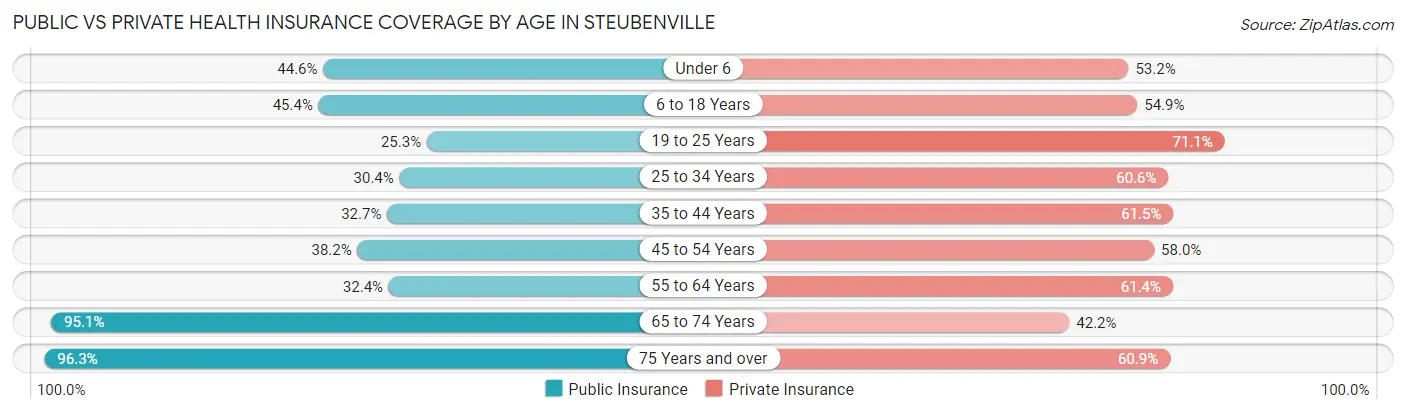
| Age Bracket | Public Insurance | Private Insurance |
| Under 6 | 535 (44.6%) | 639 (53.2%) |
| 6 to 18 Years | 1,096 (45.4%) | 1,324 (54.8%) |
| 19 to 25 Years | 733 (25.3%) | 2,058 (71.1%) |
| 25 to 34 Years | 620 (30.4%) | 1,236 (60.6%) |
| 35 to 44 Years | 593 (32.7%) | 1,116 (61.5%) |
| 45 to 54 Years | 730 (38.2%) | 1,108 (58.0%) |
| 55 to 64 Years | 712 (32.4%) | 1,351 (61.4%) |
| 65 to 74 Years | 1,949 (95.1%) | 866 (42.2%) |
| 75 Years and over | 1,124 (96.3%) | 711 (60.9%) |
| Total | 8,092 (45.7%) | 10,409 (58.8%) |
Disability Status by Sex by Age in Steubenville
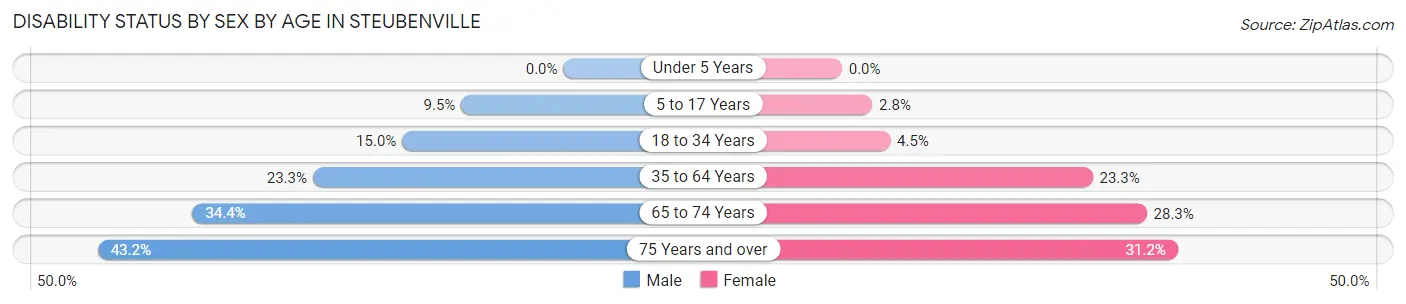
| Age Bracket | Male | Female |
| Under 5 Years | 0 (0.0%) | 0 (0.0%) |
| 5 to 17 Years | 107 (9.5%) | 30 (2.8%) |
| 18 to 34 Years | 407 (15.0%) | 120 (4.5%) |
| 35 to 64 Years | 667 (23.3%) | 711 (23.3%) |
| 65 to 74 Years | 360 (34.4%) | 284 (28.3%) |
| 75 Years and over | 191 (43.2%) | 226 (31.2%) |
Disability Class by Sex by Age in Steubenville
Disability Class: Hearing Difficulty
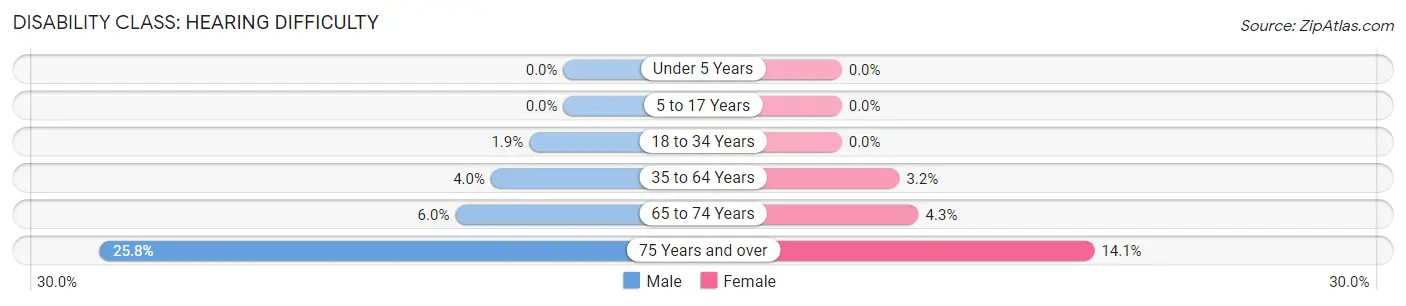
| Age Bracket | Male | Female |
| Under 5 Years | 0 (0.0%) | 0 (0.0%) |
| 5 to 17 Years | 0 (0.0%) | 0 (0.0%) |
| 18 to 34 Years | 52 (1.9%) | 0 (0.0%) |
| 35 to 64 Years | 116 (4.0%) | 98 (3.2%) |
| 65 to 74 Years | 63 (6.0%) | 43 (4.3%) |
| 75 Years and over | 114 (25.8%) | 102 (14.1%) |
Disability Class: Vision Difficulty
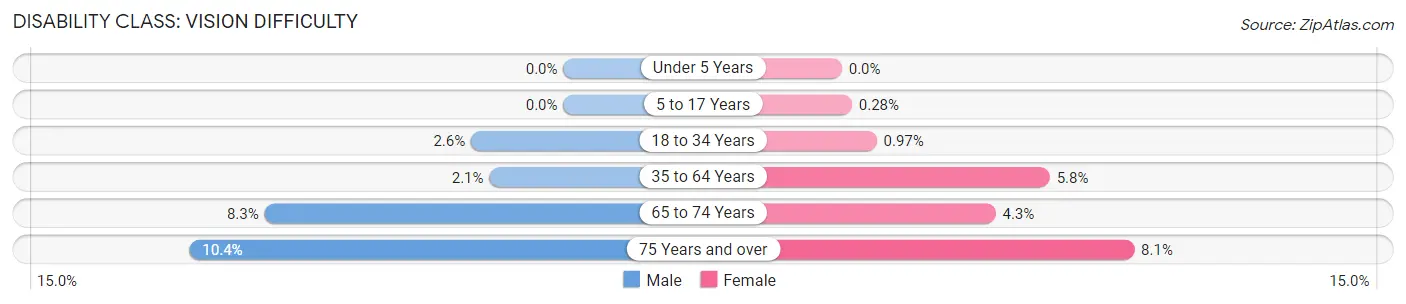
| Age Bracket | Male | Female |
| Under 5 Years | 0 (0.0%) | 0 (0.0%) |
| 5 to 17 Years | 0 (0.0%) | 3 (0.3%) |
| 18 to 34 Years | 70 (2.6%) | 26 (1.0%) |
| 35 to 64 Years | 59 (2.1%) | 177 (5.8%) |
| 65 to 74 Years | 87 (8.3%) | 43 (4.3%) |
| 75 Years and over | 46 (10.4%) | 59 (8.1%) |
Disability Class: Cognitive Difficulty
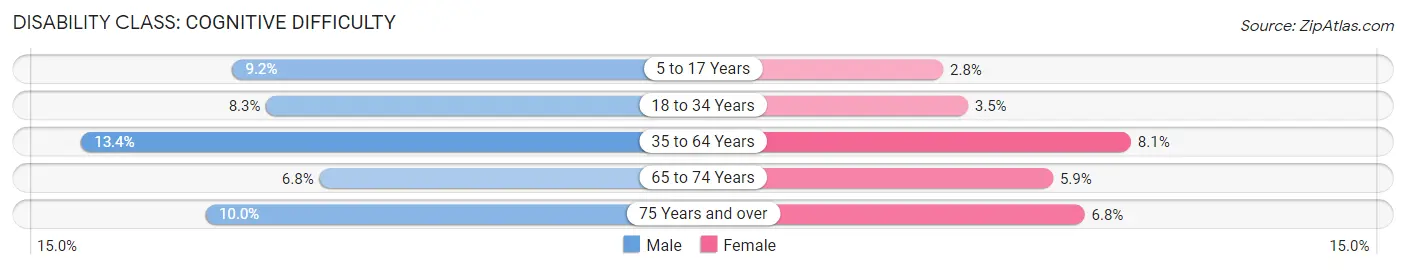
| Age Bracket | Male | Female |
| 5 to 17 Years | 104 (9.2%) | 30 (2.8%) |
| 18 to 34 Years | 225 (8.3%) | 94 (3.5%) |
| 35 to 64 Years | 385 (13.4%) | 246 (8.1%) |
| 65 to 74 Years | 71 (6.8%) | 59 (5.9%) |
| 75 Years and over | 44 (10.0%) | 49 (6.8%) |
Disability Class: Ambulatory Difficulty
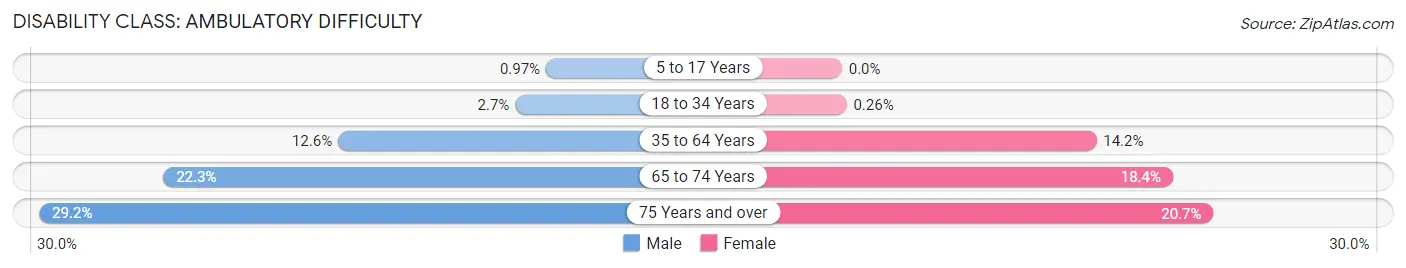
| Age Bracket | Male | Female |
| 5 to 17 Years | 11 (1.0%) | 0 (0.0%) |
| 18 to 34 Years | 73 (2.7%) | 7 (0.3%) |
| 35 to 64 Years | 360 (12.6%) | 433 (14.2%) |
| 65 to 74 Years | 233 (22.3%) | 185 (18.4%) |
| 75 Years and over | 129 (29.2%) | 150 (20.7%) |
Disability Class: Self-Care Difficulty
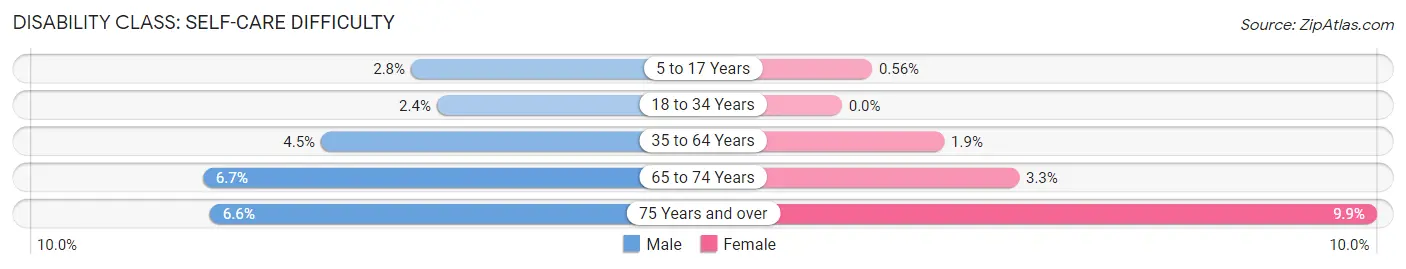
| Age Bracket | Male | Female |
| 5 to 17 Years | 32 (2.8%) | 6 (0.6%) |
| 18 to 34 Years | 64 (2.4%) | 0 (0.0%) |
| 35 to 64 Years | 129 (4.5%) | 58 (1.9%) |
| 65 to 74 Years | 70 (6.7%) | 33 (3.3%) |
| 75 Years and over | 29 (6.6%) | 72 (9.9%) |
Technology Access in Steubenville
Computing Device Access in Steubenville
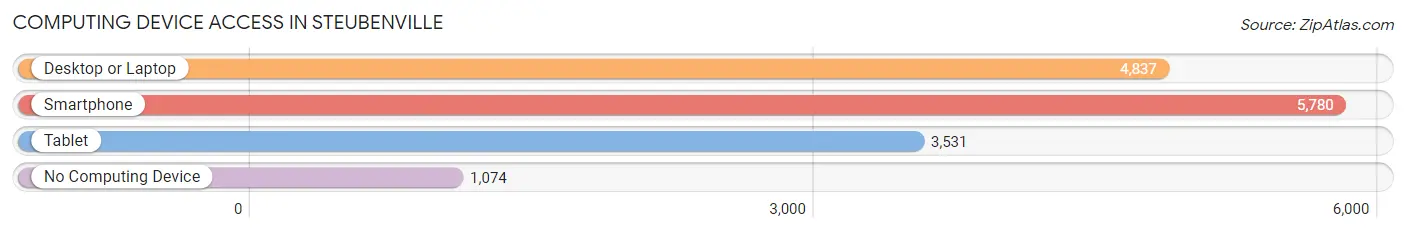
| Device Type | # Households | % Households |
| Desktop or Laptop | 4,837 | 65.5% |
| Smartphone | 5,780 | 78.3% |
| Tablet | 3,531 | 47.8% |
| No Computing Device | 1,074 | 14.5% |
| Total | 7,382 | 100.0% |
Internet Access in Steubenville
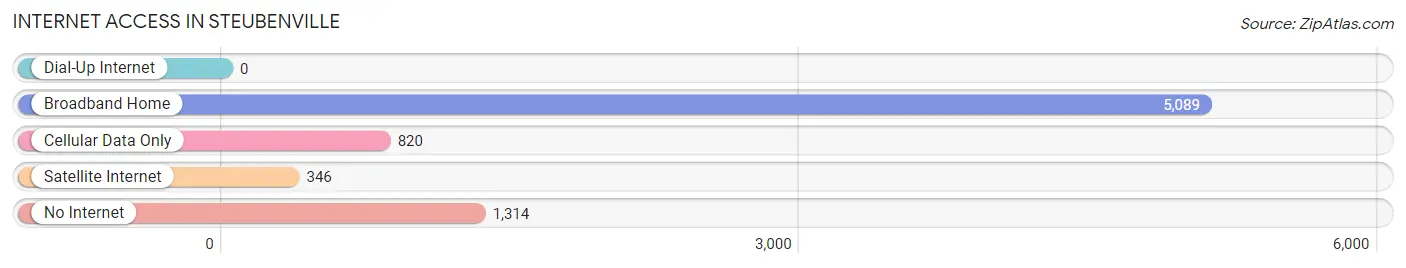
| Internet Type | # Households | % Households |
| Dial-Up Internet | 0 | 0.0% |
| Broadband Home | 5,089 | 68.9% |
| Cellular Data Only | 820 | 11.1% |
| Satellite Internet | 346 | 4.7% |
| No Internet | 1,314 | 17.8% |
| Total | 7,382 | 100.0% |
Steubenville Summary
Steubenville, Ohio is a city located in Jefferson County, Ohio, United States. It is situated along the Ohio River, approximately 40 miles west of Pittsburgh, Pennsylvania. The city has a population of approximately 18,659 people, according to the 2010 census.
History
Steubenville was founded in 1797 by Colonel John Steuben, a Revolutionary War veteran. The city was named after him in honor of his service. Steubenville was originally a small trading post and was later incorporated as a village in 1802. The city grew rapidly in the 19th century due to its location on the Ohio River, which allowed for easy transportation of goods and people. The city was also a major stop on the Underground Railroad, which helped many African Americans escape slavery.
In the late 19th century, Steubenville was a major steel producer and was home to several large steel mills. The city was also a major center for the coal industry, with several coal mines located in the area. The city was also home to several glass factories, which produced a variety of glass products.
Geography
Steubenville is located in the eastern part of Ohio, along the Ohio River. The city is situated in a valley, surrounded by hills and mountains. The city has a total area of 8.3 square miles, of which 8.2 square miles is land and 0.1 square miles is water.
The climate in Steubenville is classified as humid continental, with hot summers and cold winters. The average temperature in the summer is around 75 degrees Fahrenheit, while the average temperature in the winter is around 30 degrees Fahrenheit.
Economy
Steubenville’s economy is largely based on manufacturing and services. The city is home to several large manufacturing companies, including steel mills, glass factories, and coal mines. The city is also home to several service-based businesses, such as restaurants, hotels, and retail stores.
The city is also home to Franciscan University of Steubenville, a private Catholic university. The university is a major employer in the city and provides a variety of educational and cultural opportunities for the community.
Demographics
According to the 2010 census, the population of Steubenville was 18,659. The racial makeup of the city was 87.3% White, 8.7% African American, 0.3% Native American, 0.7% Asian, 0.1% Pacific Islander, and 2.9% from other races. The median household income was $30,945, and the median family income was $37,945.
Steubenville is a diverse city, with a variety of cultures and religions represented. The city is home to a large Catholic population, as well as a variety of Protestant denominations. The city is also home to a large Italian-American population, as well as a growing Hispanic population.
Conclusion
Steubenville, Ohio is a city located in Jefferson County, Ohio, United States. It is situated along the Ohio River, approximately 40 miles west of Pittsburgh, Pennsylvania. The city has a population of approximately 18,659 people, according to the 2010 census. Steubenville was founded in 1797 by Colonel John Steuben and was originally a small trading post. The city grew rapidly in the 19th century due to its location on the Ohio River, which allowed for easy transportation of goods and people. The city’s economy is largely based on manufacturing and services, and the city is home to several large manufacturing companies, as well as Franciscan University of Steubenville. The city is also home to a diverse population, with a variety of cultures and religions represented.
Common Questions
What is Per Capita Income in Steubenville?
Per Capita income in Steubenville is $26,747.
What is the Median Family Income in Steubenville?
Median Family Income in Steubenville is $67,750.
What is the Median Household income in Steubenville?
Median Household Income in Steubenville is $42,725.
What is Income or Wage Gap in Steubenville?
Income or Wage Gap in Steubenville is 37.9%.
Women in Steubenville earn 62.1 cents for every dollar earned by a man.
What is Family Income Deficit in Steubenville?
Family Income Deficit in Steubenville is $11,875.
Families that are below poverty line in Steubenville earn $11,875 less on average than the poverty threshold level.
What is Inequality or Gini Index in Steubenville?
Inequality or Gini Index in Steubenville is 0.52.
What is the Total Population of Steubenville?
Total Population of Steubenville is 18,175.
What is the Total Male Population of Steubenville?
Total Male Population of Steubenville is 8,893.
What is the Total Female Population of Steubenville?
Total Female Population of Steubenville is 9,282.
What is the Ratio of Males per 100 Females in Steubenville?
There are 95.81 Males per 100 Females in Steubenville.
What is the Ratio of Females per 100 Males in Steubenville?
There are 104.37 Females per 100 Males in Steubenville.
What is the Median Population Age in Steubenville?
Median Population Age in Steubenville is 37.0 Years.
What is the Average Family Size in Steubenville
Average Family Size in Steubenville is 3.1 People.
What is the Average Household Size in Steubenville
Average Household Size in Steubenville is 2.2 People.
How Large is the Labor Force in Steubenville?
There are 8,412 People in the Labor Forcein in Steubenville.
What is the Percentage of People in the Labor Force in Steubenville?
55.0% of People are in the Labor Force in Steubenville.
What is the Unemployment Rate in Steubenville?
Unemployment Rate in Steubenville is 7.6%.