Bucyrus, OH Map & Demographics
Bucyrus Map
Bucyrus Overview
$27,775
PER CAPITA INCOME
$56,667
AVG FAMILY INCOME
$49,021
AVG HOUSEHOLD INCOME
36.4%
WAGE / INCOME GAP [ % ]
63.6¢/ $1
WAGE / INCOME GAP [ $ ]
0.43
INEQUALITY / GINI INDEX
11,643
TOTAL POPULATION
5,877
MALE POPULATION
5,766
FEMALE POPULATION
101.93
MALES / 100 FEMALES
98.11
FEMALES / 100 MALES
41.4
MEDIAN AGE
2.8
AVG FAMILY SIZE
2.2
AVG HOUSEHOLD SIZE
5,446
LABOR FORCE [ PEOPLE ]
58.8%
PERCENT IN LABOR FORCE
7.6%
UNEMPLOYMENT RATE
Bucyrus Zip Codes
Bucyrus Area Codes
Income in Bucyrus
Income Overview in Bucyrus
Per Capita Income in Bucyrus is $27,775, while median incomes of families and households are $56,667 and $49,021 respectively.
| Characteristic | Number | Measure |
| Per Capita Income | 11,643 | $27,775 |
| Median Family Income | 2,860 | $56,667 |
| Mean Family Income | 2,860 | $70,096 |
| Median Household Income | 5,149 | $49,021 |
| Mean Household Income | 5,149 | $61,111 |
| Income Deficit | 2,860 | $0 |
| Wage / Income Gap (%) | 11,643 | 36.43% |
| Wage / Income Gap ($) | 11,643 | 63.57¢ per $1 |
| Gini / Inequality Index | 11,643 | 0.43 |
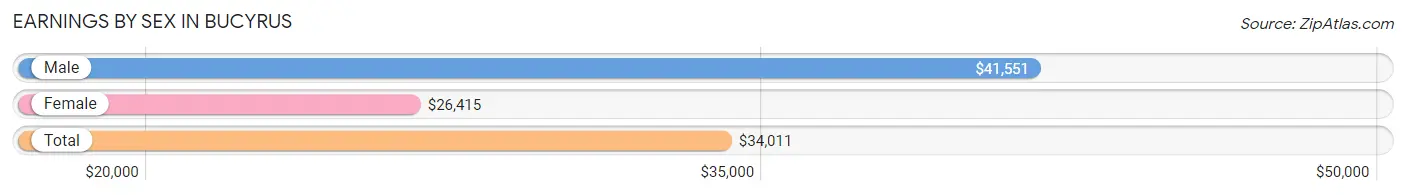
Earnings by Sex in Bucyrus
Average Earnings in Bucyrus are $34,011, $41,551 for men and $26,415 for women, a difference of 36.4%.
| Sex | Number | Average Earnings |
| Male | 2,903 (51.4%) | $41,551 |
| Female | 2,744 (48.6%) | $26,415 |
| Total | 5,647 (100.0%) | $34,011 |
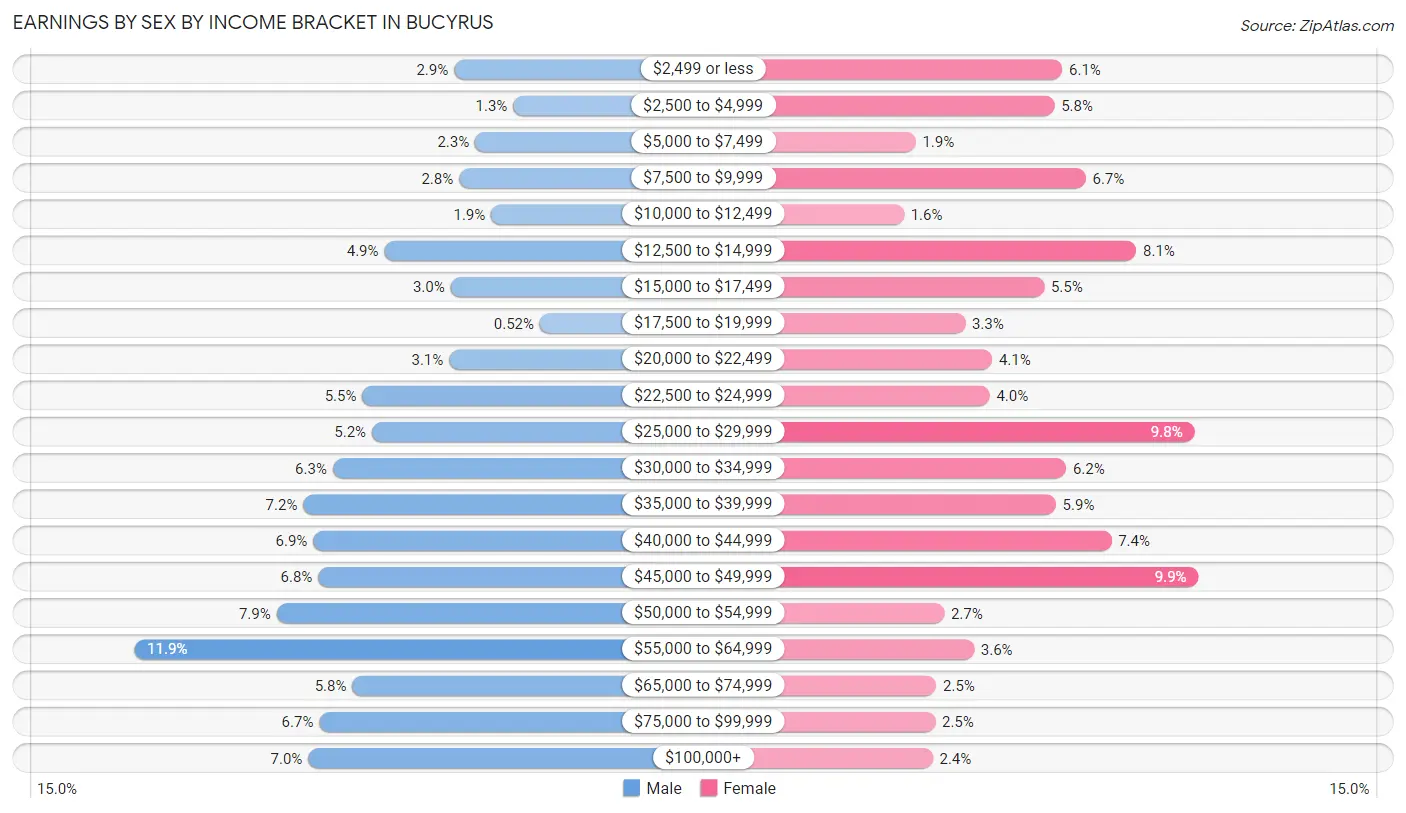
Earnings by Sex by Income Bracket in Bucyrus
The most common earnings brackets in Bucyrus are $55,000 to $64,999 for men (346 | 11.9%) and $45,000 to $49,999 for women (271 | 9.9%).
| Income | Male | Female |
| $2,499 or less | 85 (2.9%) | 166 (6.0%) |
| $2,500 to $4,999 | 37 (1.3%) | 160 (5.8%) |
| $5,000 to $7,499 | 68 (2.3%) | 53 (1.9%) |
| $7,500 to $9,999 | 81 (2.8%) | 184 (6.7%) |
| $10,000 to $12,499 | 55 (1.9%) | 44 (1.6%) |
| $12,500 to $14,999 | 142 (4.9%) | 223 (8.1%) |
| $15,000 to $17,499 | 88 (3.0%) | 152 (5.5%) |
| $17,500 to $19,999 | 15 (0.5%) | 91 (3.3%) |
| $20,000 to $22,499 | 89 (3.1%) | 112 (4.1%) |
| $22,500 to $24,999 | 160 (5.5%) | 110 (4.0%) |
| $25,000 to $29,999 | 152 (5.2%) | 268 (9.8%) |
| $30,000 to $34,999 | 184 (6.3%) | 169 (6.2%) |
| $35,000 to $39,999 | 208 (7.2%) | 161 (5.9%) |
| $40,000 to $44,999 | 200 (6.9%) | 204 (7.4%) |
| $45,000 to $49,999 | 196 (6.8%) | 271 (9.9%) |
| $50,000 to $54,999 | 230 (7.9%) | 75 (2.7%) |
| $55,000 to $64,999 | 346 (11.9%) | 98 (3.6%) |
| $65,000 to $74,999 | 168 (5.8%) | 69 (2.5%) |
| $75,000 to $99,999 | 195 (6.7%) | 68 (2.5%) |
| $100,000+ | 204 (7.0%) | 66 (2.4%) |
| Total | 2,903 (100.0%) | 2,744 (100.0%) |
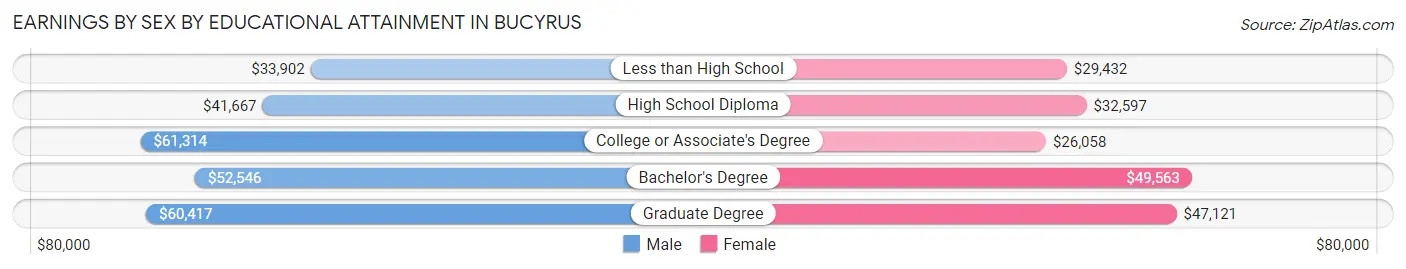
Earnings by Sex by Educational Attainment in Bucyrus
Average earnings in Bucyrus are $45,742 for men and $31,401 for women, a difference of 31.4%. Men with an educational attainment of college or associate's degree enjoy the highest average annual earnings of $61,314, while those with less than high school education earn the least with $33,902. Women with an educational attainment of bachelor's degree earn the most with the average annual earnings of $49,563, while those with college or associate's degree education have the smallest earnings of $26,058.
| Educational Attainment | Male Income | Female Income |
| Less than High School | $33,902 | $29,432 |
| High School Diploma | $41,667 | $32,597 |
| College or Associate's Degree | $61,314 | $26,058 |
| Bachelor's Degree | $52,546 | $49,563 |
| Graduate Degree | $60,417 | $47,121 |
| Total | $45,742 | $31,401 |
Family Income in Bucyrus
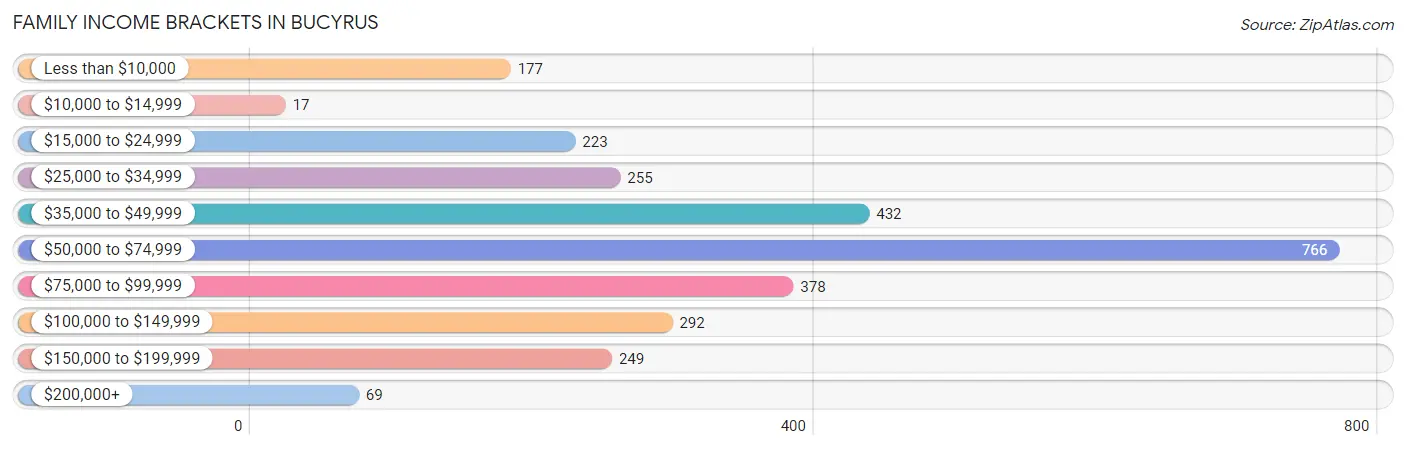
Family Income Brackets in Bucyrus
According to the Bucyrus family income data, there are 766 families falling into the $50,000 to $74,999 income range, which is the most common income bracket and makes up 26.8% of all families. Conversely, the $10,000 to $14,999 income bracket is the least frequent group with only 17 families (0.6%) belonging to this category.
| Income Bracket | # Families | % Families |
| Less than $10,000 | 177 | 6.2% |
| $10,000 to $14,999 | 17 | 0.6% |
| $15,000 to $24,999 | 223 | 7.8% |
| $25,000 to $34,999 | 255 | 8.9% |
| $35,000 to $49,999 | 432 | 15.1% |
| $50,000 to $74,999 | 766 | 26.8% |
| $75,000 to $99,999 | 378 | 13.2% |
| $100,000 to $149,999 | 292 | 10.2% |
| $150,000 to $199,999 | 249 | 8.7% |
| $200,000+ | 69 | 2.4% |
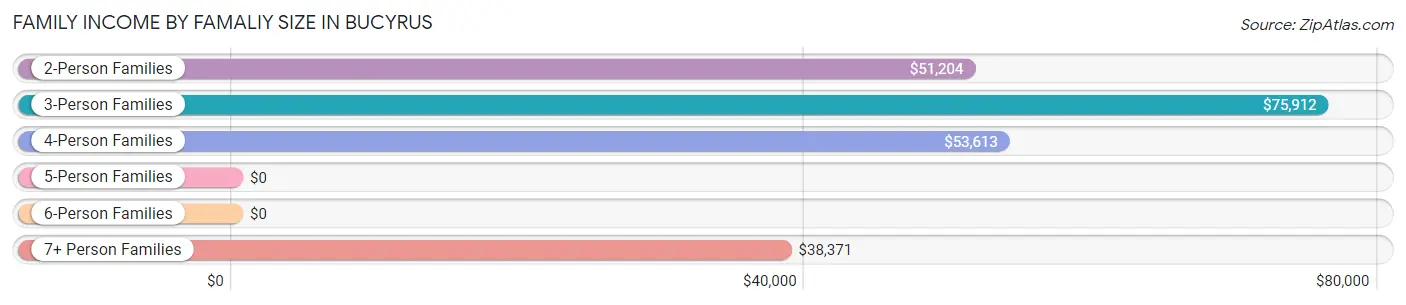
Family Income by Famaliy Size in Bucyrus
3-person families (614 | 21.5%) account for the highest median family income in Bucyrus with $75,912 per family, while 2-person families (1,437 | 50.2%) have the highest median income of $25,602 per family member.
| Income Bracket | # Families | Median Income |
| 2-Person Families | 1,437 (50.2%) | $51,204 |
| 3-Person Families | 614 (21.5%) | $75,912 |
| 4-Person Families | 587 (20.5%) | $53,613 |
| 5-Person Families | 148 (5.2%) | $0 |
| 6-Person Families | 9 (0.3%) | $0 |
| 7+ Person Families | 65 (2.3%) | $38,371 |
| Total | 2,860 (100.0%) | $56,667 |
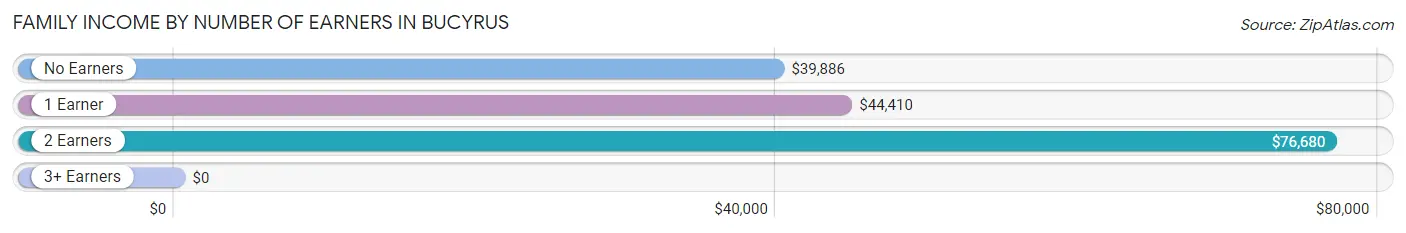
Family Income by Number of Earners in Bucyrus
| Number of Earners | # Families | Median Income |
| No Earners | 605 (21.1%) | $39,886 |
| 1 Earner | 993 (34.7%) | $44,410 |
| 2 Earners | 1,100 (38.5%) | $76,680 |
| 3+ Earners | 162 (5.7%) | $0 |
| Total | 2,860 (100.0%) | $56,667 |
Household Income in Bucyrus
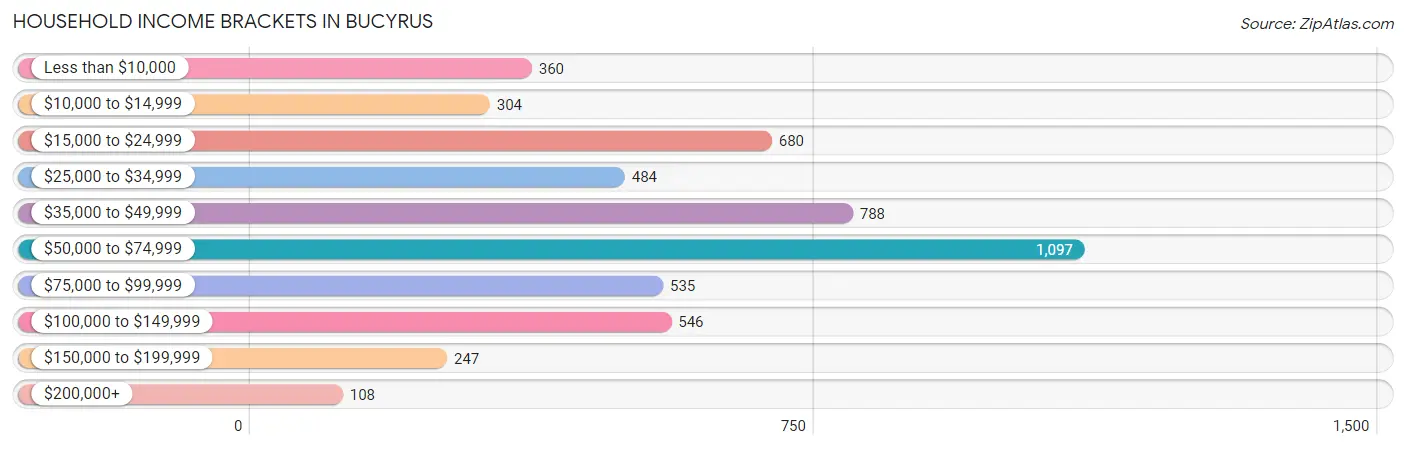
Household Income Brackets in Bucyrus
With 1,097 households falling in the category, the $50,000 to $74,999 income range is the most frequent in Bucyrus, accounting for 21.3% of all households. In contrast, only 108 households (2.1%) fall into the $200,000+ income bracket, making it the least populous group.
| Income Bracket | # Households | % Households |
| Less than $10,000 | 360 | 7.0% |
| $10,000 to $14,999 | 304 | 5.9% |
| $15,000 to $24,999 | 680 | 13.2% |
| $25,000 to $34,999 | 484 | 9.4% |
| $35,000 to $49,999 | 788 | 15.3% |
| $50,000 to $74,999 | 1,097 | 21.3% |
| $75,000 to $99,999 | 535 | 10.4% |
| $100,000 to $149,999 | 546 | 10.6% |
| $150,000 to $199,999 | 247 | 4.8% |
| $200,000+ | 108 | 2.1% |
Household Income by Householder Age in Bucyrus
The median household income in Bucyrus is $49,021, with the highest median household income of $68,836 found in the 45 to 64 years age bracket for the primary householder. A total of 1,689 households (32.8%) fall into this category. Meanwhile, the 15 to 24 years age bracket for the primary householder has the lowest median household income of $0, with 188 households (3.6%) in this group.
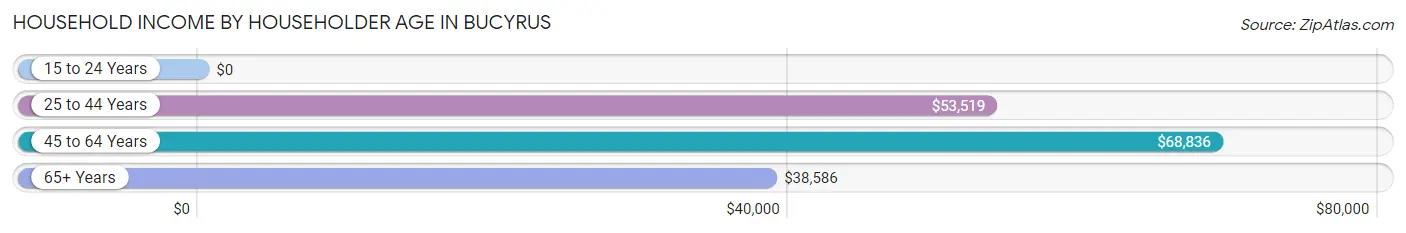
| Income Bracket | # Households | Median Income |
| 15 to 24 Years | 188 (3.6%) | $0 |
| 25 to 44 Years | 1,454 (28.2%) | $53,519 |
| 45 to 64 Years | 1,689 (32.8%) | $68,836 |
| 65+ Years | 1,818 (35.3%) | $38,586 |
| Total | 5,149 (100.0%) | $49,021 |
Poverty in Bucyrus
Income Below Poverty by Sex and Age in Bucyrus
With 17.6% poverty level for males and 22.3% for females among the residents of Bucyrus, under 5 year old males and 12 to 14 year old females are the most vulnerable to poverty, with 213 males (62.5%) and 103 females (55.7%) in their respective age groups living below the poverty level.
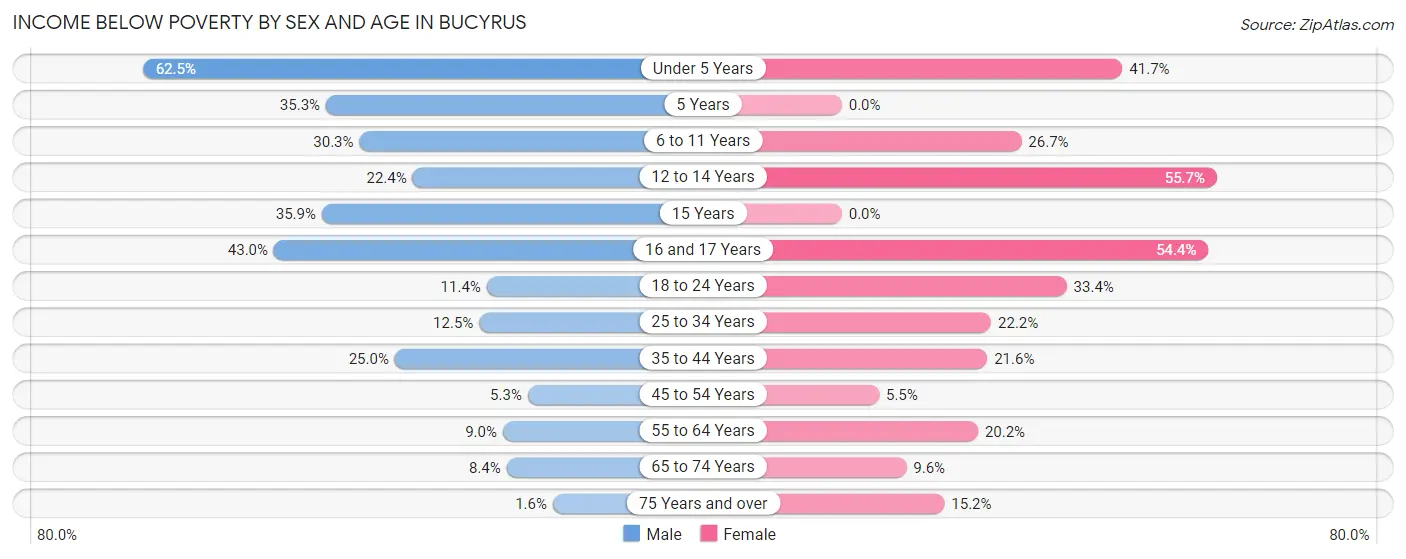
| Age Bracket | Male | Female |
| Under 5 Years | 213 (62.5%) | 145 (41.7%) |
| 5 Years | 67 (35.3%) | 0 (0.0%) |
| 6 to 11 Years | 156 (30.3%) | 80 (26.7%) |
| 12 to 14 Years | 45 (22.4%) | 103 (55.7%) |
| 15 Years | 33 (35.9%) | 0 (0.0%) |
| 16 and 17 Years | 46 (43.0%) | 74 (54.4%) |
| 18 to 24 Years | 45 (11.4%) | 188 (33.4%) |
| 25 to 34 Years | 88 (12.5%) | 176 (22.2%) |
| 35 to 44 Years | 148 (25.0%) | 119 (21.6%) |
| 45 to 54 Years | 39 (5.3%) | 29 (5.5%) |
| 55 to 64 Years | 57 (9.0%) | 165 (20.2%) |
| 65 to 74 Years | 47 (8.4%) | 61 (9.6%) |
| 75 Years and over | 9 (1.6%) | 106 (15.2%) |
| Total | 993 (17.6%) | 1,246 (22.3%) |
Income Above Poverty by Sex and Age in Bucyrus
According to the poverty statistics in Bucyrus, males aged 75 years and over and females aged 5 years are the age groups that are most secure financially, with 98.4% of males and 100.0% of females in these age groups living above the poverty line.
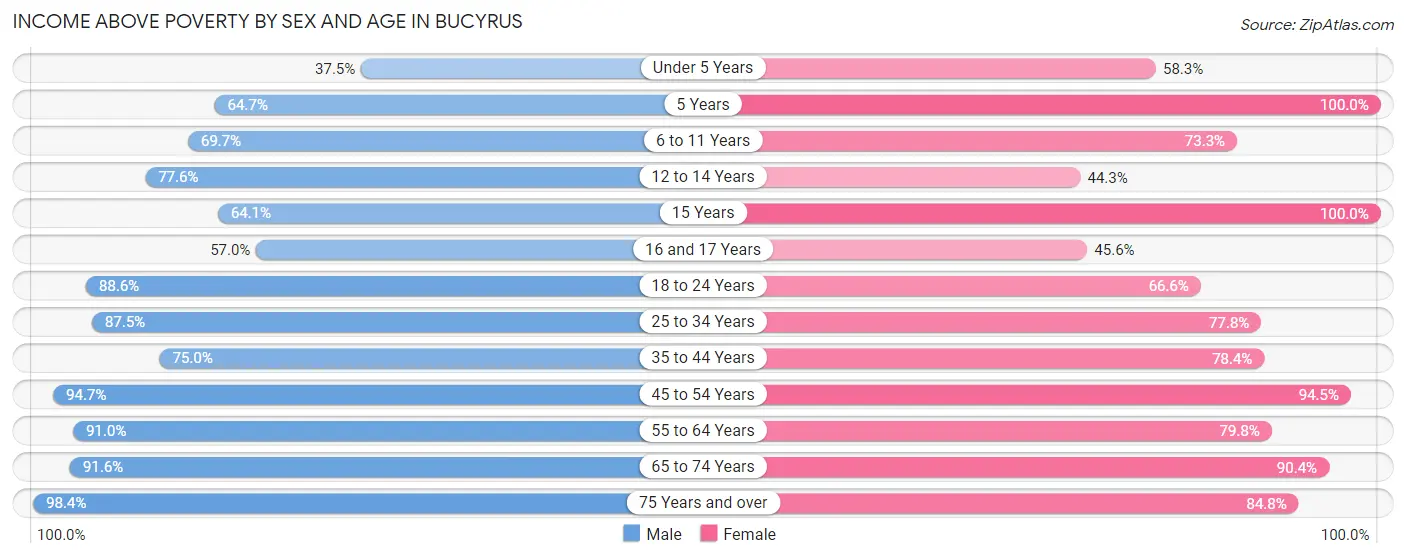
| Age Bracket | Male | Female |
| Under 5 Years | 128 (37.5%) | 203 (58.3%) |
| 5 Years | 123 (64.7%) | 22 (100.0%) |
| 6 to 11 Years | 359 (69.7%) | 220 (73.3%) |
| 12 to 14 Years | 156 (77.6%) | 82 (44.3%) |
| 15 Years | 59 (64.1%) | 28 (100.0%) |
| 16 and 17 Years | 61 (57.0%) | 62 (45.6%) |
| 18 to 24 Years | 350 (88.6%) | 375 (66.6%) |
| 25 to 34 Years | 616 (87.5%) | 618 (77.8%) |
| 35 to 44 Years | 443 (75.0%) | 432 (78.4%) |
| 45 to 54 Years | 698 (94.7%) | 495 (94.5%) |
| 55 to 64 Years | 577 (91.0%) | 651 (79.8%) |
| 65 to 74 Years | 511 (91.6%) | 575 (90.4%) |
| 75 Years and over | 566 (98.4%) | 590 (84.8%) |
| Total | 4,647 (82.4%) | 4,353 (77.7%) |
Income Below Poverty Among Married-Couple Families in Bucyrus
The poverty statistics for married-couple families in Bucyrus show that 6.4% or 121 of the total 1,893 families live below the poverty line. Families with 5 or more children have the highest poverty rate of 83.1%, comprising of 54 families. On the other hand, families with no children have the lowest poverty rate of 2.3%, which includes 28 families.
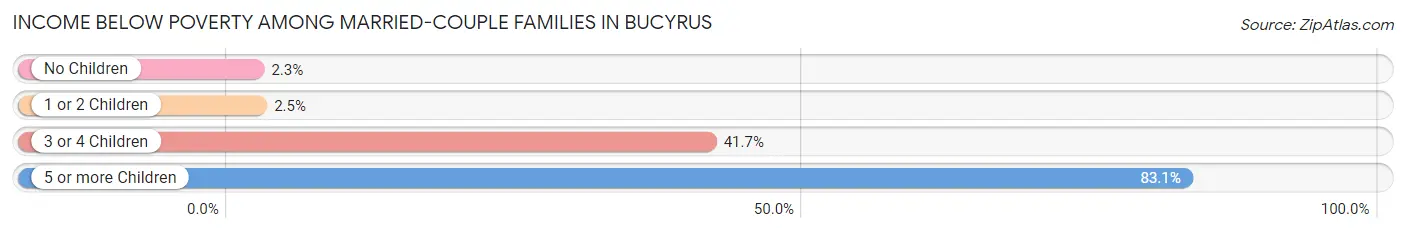
| Children | Above Poverty | Below Poverty |
| No Children | 1,188 (97.7%) | 28 (2.3%) |
| 1 or 2 Children | 538 (97.5%) | 14 (2.5%) |
| 3 or 4 Children | 35 (58.3%) | 25 (41.7%) |
| 5 or more Children | 11 (16.9%) | 54 (83.1%) |
| Total | 1,772 (93.6%) | 121 (6.4%) |
Income Below Poverty Among Single-Parent Households in Bucyrus
According to the poverty data in Bucyrus, 5.2% or 14 single-father households and 37.6% or 262 single-mother households are living below the poverty line. Among single-father households, those with 3 or 4 children have the highest poverty rate, with 14 households (100.0%) experiencing poverty. Likewise, among single-mother households, those with 3 or 4 children have the highest poverty rate, with 126 households (75.4%) falling below the poverty line.
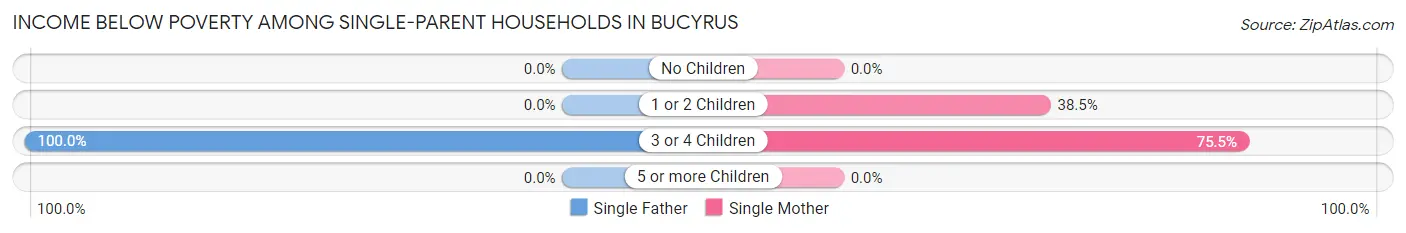
| Children | Single Father | Single Mother |
| No Children | 0 (0.0%) | 0 (0.0%) |
| 1 or 2 Children | 0 (0.0%) | 136 (38.5%) |
| 3 or 4 Children | 14 (100.0%) | 126 (75.4%) |
| 5 or more Children | 0 (0.0%) | 0 (0.0%) |
| Total | 14 (5.2%) | 262 (37.6%) |
Income Below Poverty Among Married-Couple vs Single-Parent Households in Bucyrus
The poverty data for Bucyrus shows that 121 of the married-couple family households (6.4%) and 276 of the single-parent households (28.5%) are living below the poverty level. Within the married-couple family households, those with 5 or more children have the highest poverty rate, with 54 households (83.1%) falling below the poverty line. Among the single-parent households, those with 3 or 4 children have the highest poverty rate, with 140 household (77.3%) living below poverty.
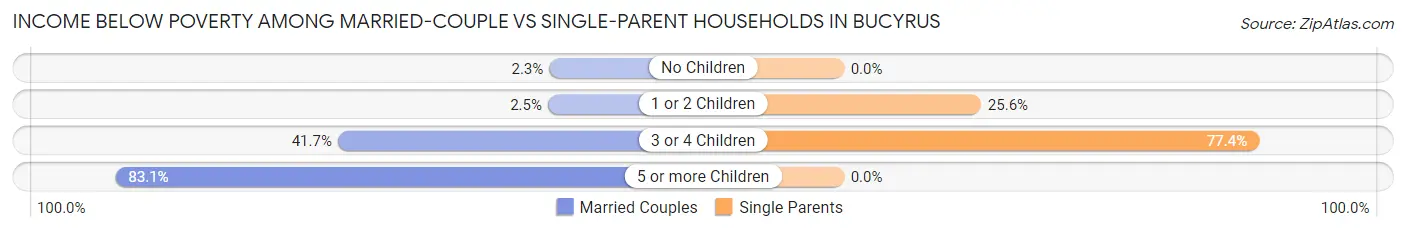
| Children | Married-Couple Families | Single-Parent Households |
| No Children | 28 (2.3%) | 0 (0.0%) |
| 1 or 2 Children | 14 (2.5%) | 136 (25.6%) |
| 3 or 4 Children | 25 (41.7%) | 140 (77.3%) |
| 5 or more Children | 54 (83.1%) | 0 (0.0%) |
| Total | 121 (6.4%) | 276 (28.5%) |
Race in Bucyrus
The most populous races in Bucyrus are White / Caucasian (11,037 | 94.8%), Hispanic or Latino (389 | 3.3%), and Two or more Races (328 | 2.8%).
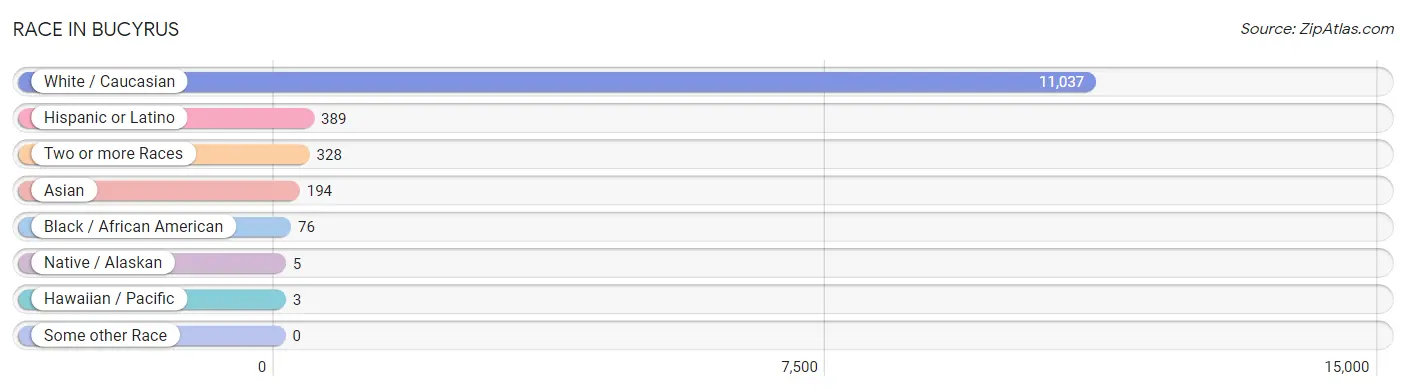
| Race | # Population | % Population |
| Asian | 194 | 1.7% |
| Black / African American | 76 | 0.6% |
| Hawaiian / Pacific | 3 | 0.0% |
| Hispanic or Latino | 389 | 3.3% |
| Native / Alaskan | 5 | 0.0% |
| White / Caucasian | 11,037 | 94.8% |
| Two or more Races | 328 | 2.8% |
| Some other Race | 0 | 0.0% |
| Total | 11,643 | 100.0% |
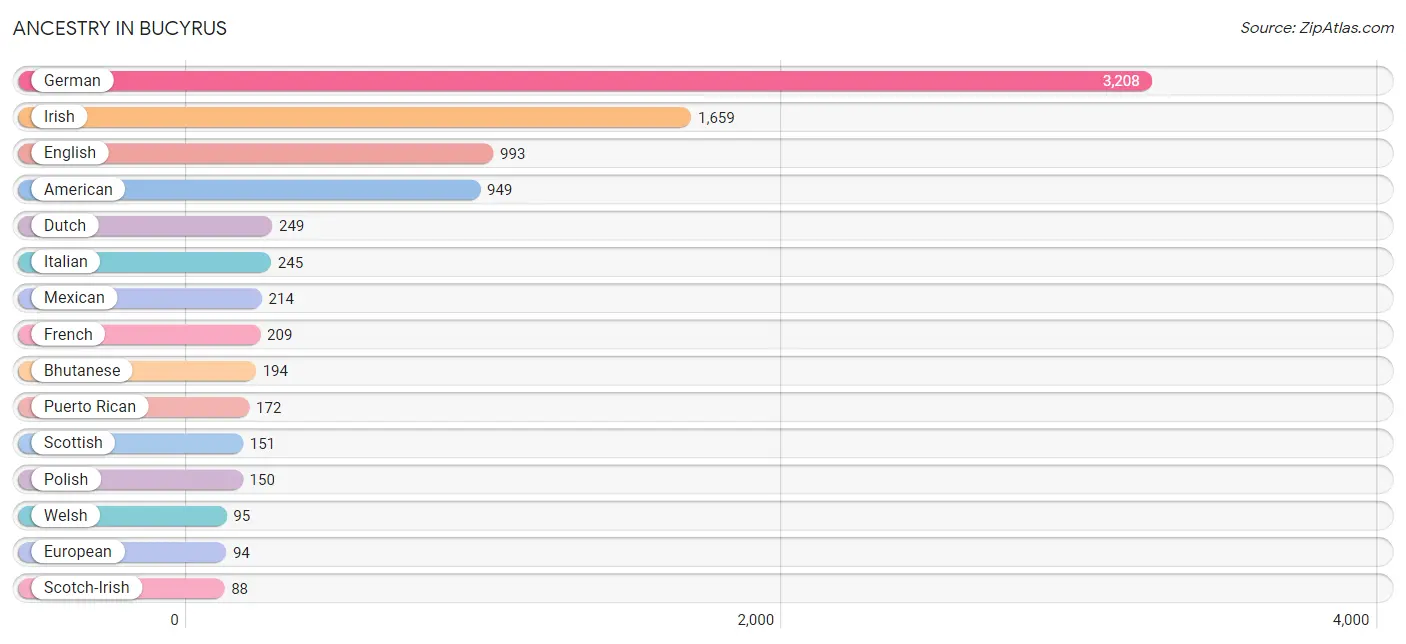
Ancestry in Bucyrus
The most populous ancestries reported in Bucyrus are German (3,208 | 27.6%), Irish (1,659 | 14.2%), English (993 | 8.5%), American (949 | 8.2%), and Dutch (249 | 2.1%), together accounting for 60.6% of all Bucyrus residents.
| Ancestry | # Population | % Population |
| African | 17 | 0.2% |
| American | 949 | 8.2% |
| Arab | 10 | 0.1% |
| Australian | 9 | 0.1% |
| Belgian | 10 | 0.1% |
| Bhutanese | 194 | 1.7% |
| Blackfeet | 4 | 0.0% |
| British | 78 | 0.7% |
| Cherokee | 26 | 0.2% |
| Chickasaw | 2 | 0.0% |
| Creek | 2 | 0.0% |
| Croatian | 3 | 0.0% |
| Cuban | 3 | 0.0% |
| Czech | 60 | 0.5% |
| Danish | 39 | 0.3% |
| Dutch | 249 | 2.1% |
| English | 993 | 8.5% |
| European | 94 | 0.8% |
| French | 209 | 1.8% |
| French American Indian | 3 | 0.0% |
| German | 3,208 | 27.6% |
| Greek | 16 | 0.1% |
| Hungarian | 47 | 0.4% |
| Irish | 1,659 | 14.2% |
| Iroquois | 3 | 0.0% |
| Italian | 245 | 2.1% |
| Lebanese | 10 | 0.1% |
| Lumbee | 5 | 0.0% |
| Mexican | 214 | 1.8% |
| Native Hawaiian | 3 | 0.0% |
| Navajo | 2 | 0.0% |
| Nigerian | 2 | 0.0% |
| Northern European | 22 | 0.2% |
| Norwegian | 47 | 0.4% |
| Polish | 150 | 1.3% |
| Puerto Rican | 172 | 1.5% |
| Romanian | 10 | 0.1% |
| Russian | 6 | 0.1% |
| Scotch-Irish | 88 | 0.8% |
| Scottish | 151 | 1.3% |
| Sioux | 3 | 0.0% |
| Subsaharan African | 19 | 0.2% |
| Swedish | 73 | 0.6% |
| Swiss | 47 | 0.4% |
| Ukrainian | 5 | 0.0% |
| Welsh | 95 | 0.8% | View All 46 Rows |
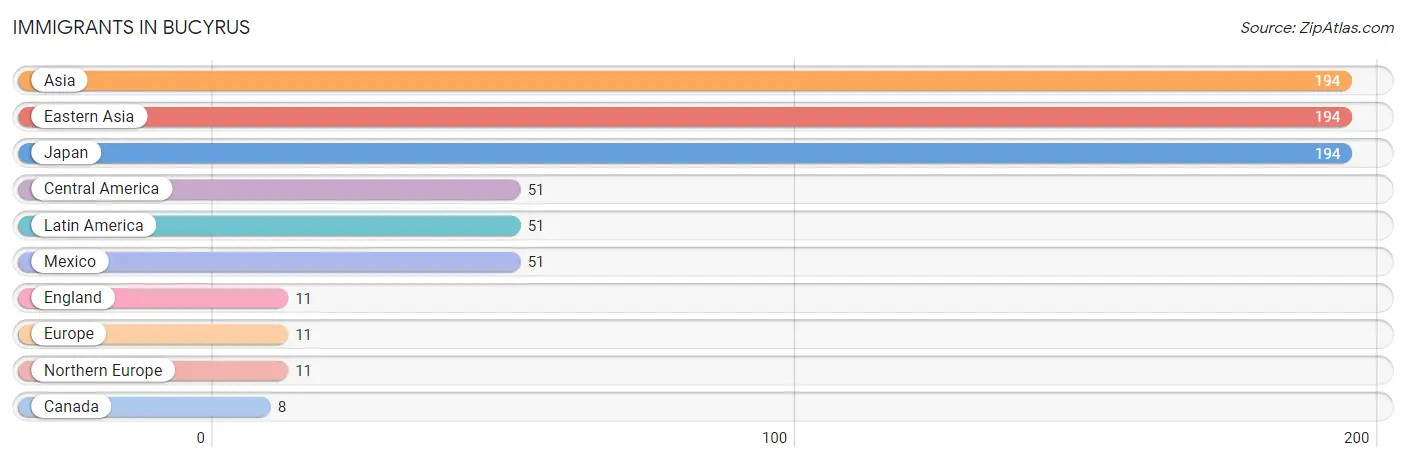
Immigrants in Bucyrus
The most numerous immigrant groups reported in Bucyrus came from Asia (194 | 1.7%), Eastern Asia (194 | 1.7%), Japan (194 | 1.7%), Central America (51 | 0.4%), and Latin America (51 | 0.4%), together accounting for 5.9% of all Bucyrus residents.
| Immigration Origin | # Population | % Population |
| Asia | 194 | 1.7% |
| Canada | 8 | 0.1% |
| Central America | 51 | 0.4% |
| Eastern Asia | 194 | 1.7% |
| England | 11 | 0.1% |
| Europe | 11 | 0.1% |
| Japan | 194 | 1.7% |
| Latin America | 51 | 0.4% |
| Mexico | 51 | 0.4% |
| Northern Europe | 11 | 0.1% | View All 10 Rows |
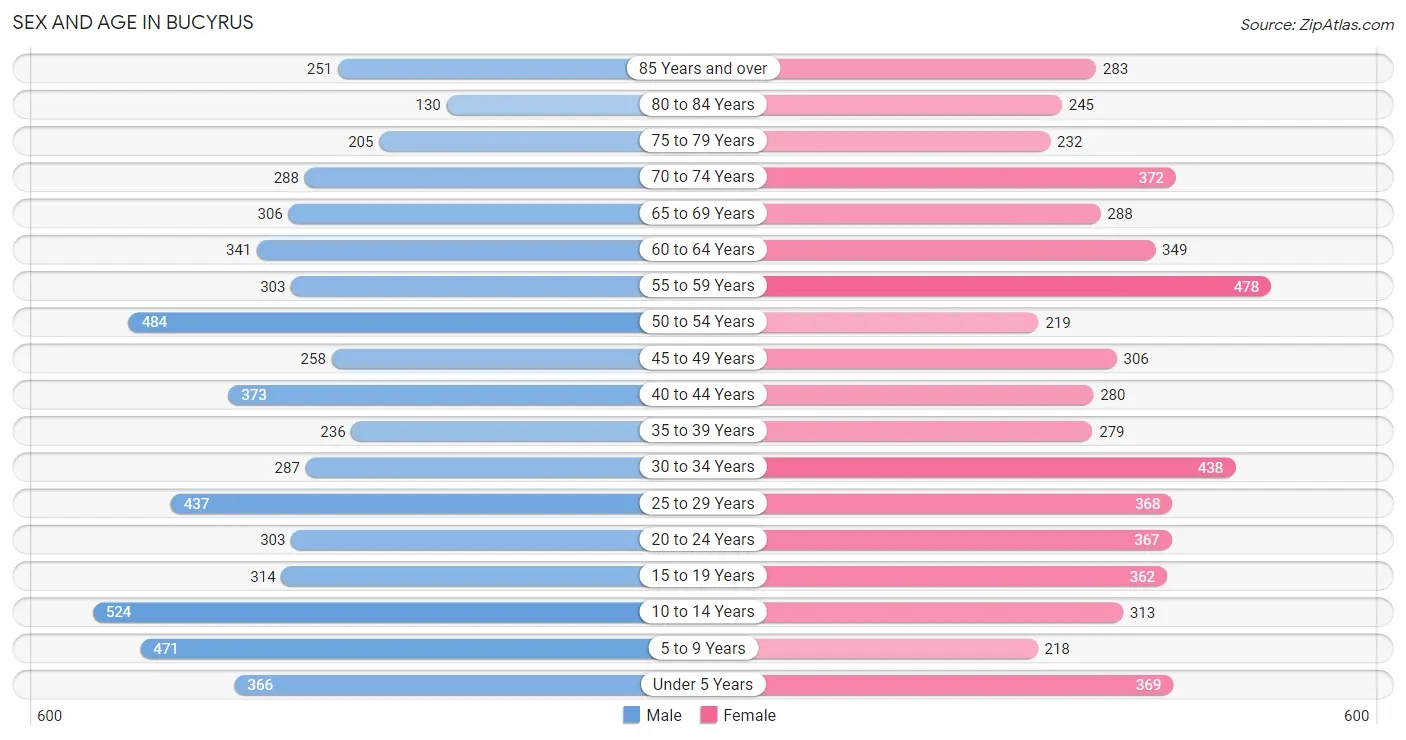
Sex and Age in Bucyrus
Sex and Age in Bucyrus
The most populous age groups in Bucyrus are 10 to 14 Years (524 | 8.9%) for men and 55 to 59 Years (478 | 8.3%) for women.
| Age Bracket | Male | Female |
| Under 5 Years | 366 (6.2%) | 369 (6.4%) |
| 5 to 9 Years | 471 (8.0%) | 218 (3.8%) |
| 10 to 14 Years | 524 (8.9%) | 313 (5.4%) |
| 15 to 19 Years | 314 (5.3%) | 362 (6.3%) |
| 20 to 24 Years | 303 (5.2%) | 367 (6.4%) |
| 25 to 29 Years | 437 (7.4%) | 368 (6.4%) |
| 30 to 34 Years | 287 (4.9%) | 438 (7.6%) |
| 35 to 39 Years | 236 (4.0%) | 279 (4.8%) |
| 40 to 44 Years | 373 (6.4%) | 280 (4.9%) |
| 45 to 49 Years | 258 (4.4%) | 306 (5.3%) |
| 50 to 54 Years | 484 (8.2%) | 219 (3.8%) |
| 55 to 59 Years | 303 (5.2%) | 478 (8.3%) |
| 60 to 64 Years | 341 (5.8%) | 349 (6.0%) |
| 65 to 69 Years | 306 (5.2%) | 288 (5.0%) |
| 70 to 74 Years | 288 (4.9%) | 372 (6.5%) |
| 75 to 79 Years | 205 (3.5%) | 232 (4.0%) |
| 80 to 84 Years | 130 (2.2%) | 245 (4.3%) |
| 85 Years and over | 251 (4.3%) | 283 (4.9%) |
| Total | 5,877 (100.0%) | 5,766 (100.0%) |
Families and Households in Bucyrus
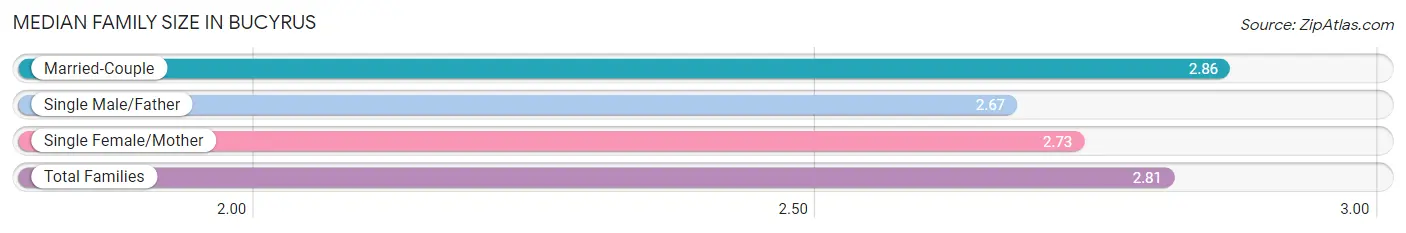
Median Family Size in Bucyrus
The median family size in Bucyrus is 2.81 persons per family, with married-couple families (1,893 | 66.2%) accounting for the largest median family size of 2.86 persons per family. On the other hand, single male/father families (270 | 9.4%) represent the smallest median family size with 2.67 persons per family.
| Family Type | # Families | Family Size |
| Married-Couple | 1,893 (66.2%) | 2.86 |
| Single Male/Father | 270 (9.4%) | 2.67 |
| Single Female/Mother | 697 (24.4%) | 2.73 |
| Total Families | 2,860 (100.0%) | 2.81 |
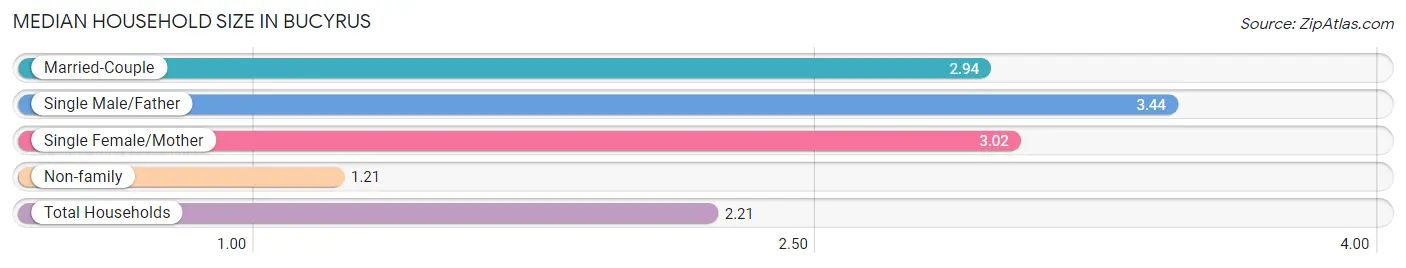
Median Household Size in Bucyrus
The median household size in Bucyrus is 2.21 persons per household, with single male/father households (270 | 5.2%) accounting for the largest median household size of 3.44 persons per household. non-family households (2,289 | 44.5%) represent the smallest median household size with 1.21 persons per household.
| Household Type | # Households | Household Size |
| Married-Couple | 1,893 (36.8%) | 2.94 |
| Single Male/Father | 270 (5.2%) | 3.44 |
| Single Female/Mother | 697 (13.5%) | 3.02 |
| Non-family | 2,289 (44.5%) | 1.21 |
| Total Households | 5,149 (100.0%) | 2.21 |
Household Size by Marriage Status in Bucyrus
Out of a total of 5,149 households in Bucyrus, 2,860 (55.5%) are family households, while 2,289 (44.5%) are nonfamily households. The most numerous type of family households are 2-person households, comprising 1,213, and the most common type of nonfamily households are 1-person households, comprising 1,919.
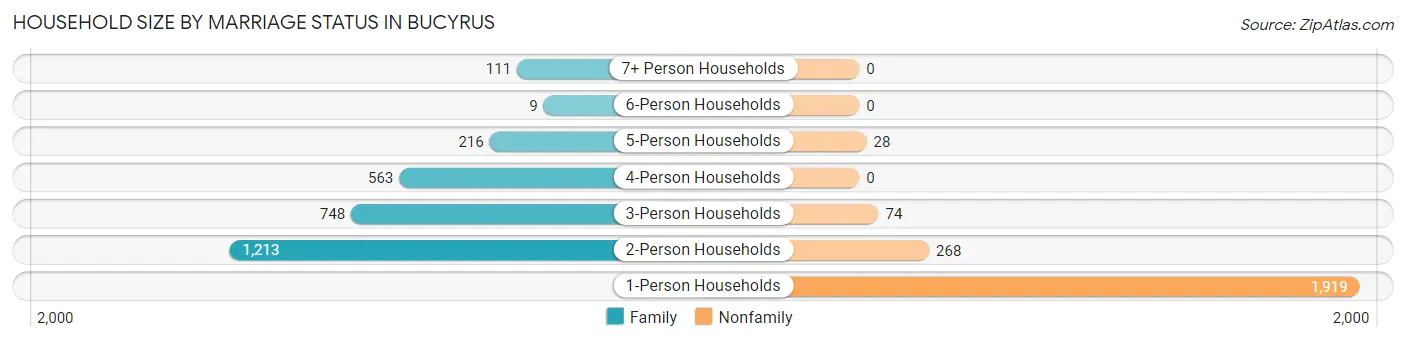
| Household Size | Family Households | Nonfamily Households |
| 1-Person Households | - | 1,919 (37.3%) |
| 2-Person Households | 1,213 (23.6%) | 268 (5.2%) |
| 3-Person Households | 748 (14.5%) | 74 (1.4%) |
| 4-Person Households | 563 (10.9%) | 0 (0.0%) |
| 5-Person Households | 216 (4.2%) | 28 (0.5%) |
| 6-Person Households | 9 (0.2%) | 0 (0.0%) |
| 7+ Person Households | 111 (2.2%) | 0 (0.0%) |
| Total | 2,860 (55.5%) | 2,289 (44.5%) |
Female Fertility in Bucyrus
Fertility by Age in Bucyrus
Average fertility rate in Bucyrus is 94.0 births per 1,000 women. Women in the age bracket of 20 to 34 years have the highest fertility rate with 176.0 births per 1,000 women. Women in the age bracket of 20 to 34 years acount for 89.6% of all women with births.
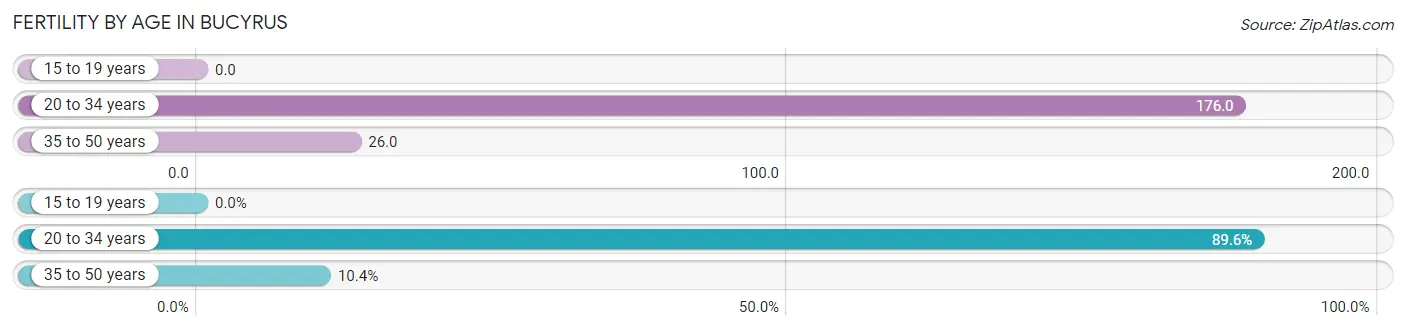
| Age Bracket | Women with Births | Births / 1,000 Women |
| 15 to 19 years | 0 (0.0%) | 0.0 |
| 20 to 34 years | 206 (89.6%) | 176.0 |
| 35 to 50 years | 24 (10.4%) | 26.0 |
| Total | 230 (100.0%) | 94.0 |
Fertility by Age by Marriage Status in Bucyrus
47.4% of women with births (230) in Bucyrus are married. The highest percentage of unmarried women with births falls into 20 to 34 years age bracket with 56.8% of them unmarried at the time of birth, while the lowest percentage of unmarried women with births belong to 35 to 50 years age bracket with 16.7% of them unmarried.
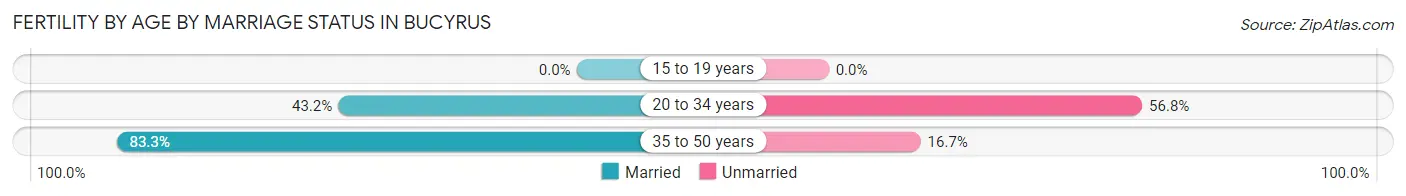
| Age Bracket | Married | Unmarried |
| 15 to 19 years | 0 (0.0%) | 0 (0.0%) |
| 20 to 34 years | 89 (43.2%) | 117 (56.8%) |
| 35 to 50 years | 20 (83.3%) | 4 (16.7%) |
| Total | 109 (47.4%) | 121 (52.6%) |
Fertility by Education in Bucyrus
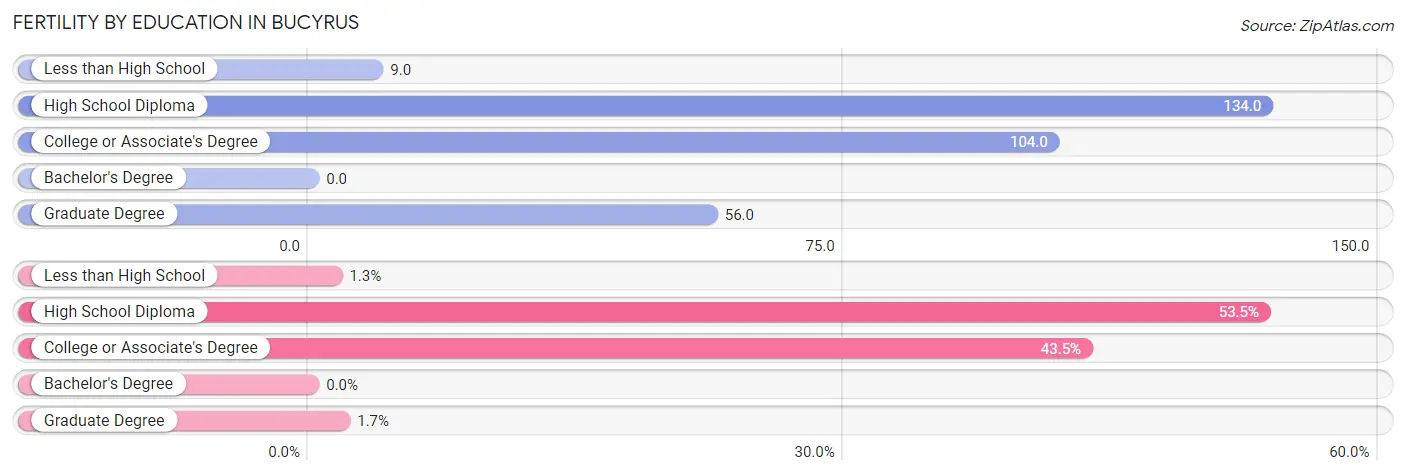
| Educational Attainment | Women with Births | Births / 1,000 Women |
| Less than High School | 3 (1.3%) | 9.0 |
| High School Diploma | 123 (53.5%) | 134.0 |
| College or Associate's Degree | 100 (43.5%) | 104.0 |
| Bachelor's Degree | 0 (0.0%) | 0.0 |
| Graduate Degree | 4 (1.7%) | 56.0 |
| Total | 230 (100.0%) | 94.0 |
Fertility by Education by Marriage Status in Bucyrus
52.6% of women with births in Bucyrus are unmarried. Women with the educational attainment of college or associate's degree are most likely to be married with 77.0% of them married at childbirth, while women with the educational attainment of less than high school are least likely to be married with 100.0% of them unmarried at childbirth.
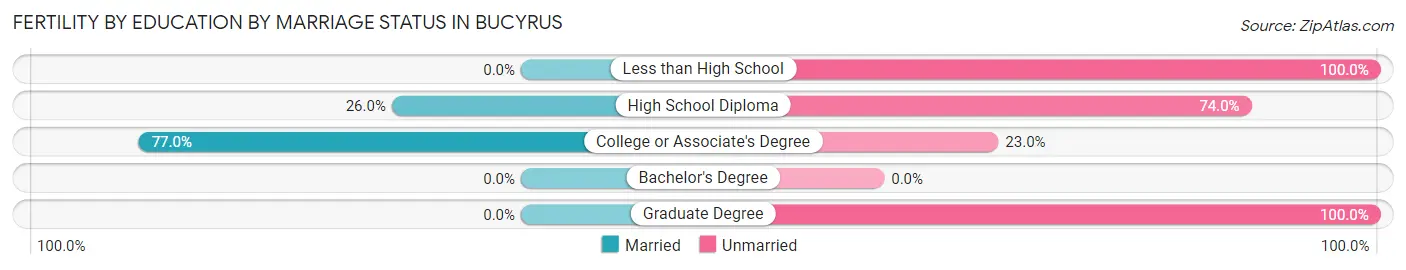
| Educational Attainment | Married | Unmarried |
| Less than High School | 0 (0.0%) | 3 (100.0%) |
| High School Diploma | 32 (26.0%) | 91 (74.0%) |
| College or Associate's Degree | 77 (77.0%) | 23 (23.0%) |
| Bachelor's Degree | 0 (0.0%) | 0 (0.0%) |
| Graduate Degree | 0 (0.0%) | 4 (100.0%) |
| Total | 109 (47.4%) | 121 (52.6%) |
Employment Characteristics in Bucyrus
Employment by Class of Employer in Bucyrus
Among the 4,969 employed individuals in Bucyrus, private company employees (4,060 | 81.7%), local government employees (291 | 5.9%), and not-for-profit organizations (258 | 5.2%) make up the most common classes of employment.
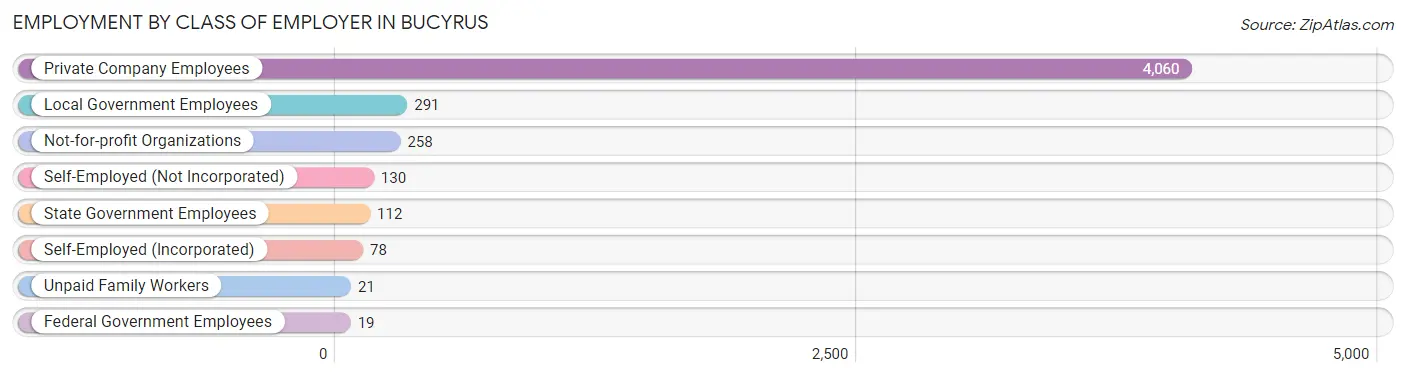
| Employer Class | # Employees | % Employees |
| Private Company Employees | 4,060 | 81.7% |
| Self-Employed (Incorporated) | 78 | 1.6% |
| Self-Employed (Not Incorporated) | 130 | 2.6% |
| Not-for-profit Organizations | 258 | 5.2% |
| Local Government Employees | 291 | 5.9% |
| State Government Employees | 112 | 2.2% |
| Federal Government Employees | 19 | 0.4% |
| Unpaid Family Workers | 21 | 0.4% |
| Total | 4,969 | 100.0% |
Employment Status by Age in Bucyrus
According to the labor force statistics for Bucyrus, out of the total population over 16 years of age (9,262), 58.8% or 5,446 individuals are in the labor force, with 7.6% or 414 of them unemployed. The age group with the highest labor force participation rate is 25 to 29 years, with 91.7% or 738 individuals in the labor force. Within the labor force, the 20 to 24 years age range has the highest percentage of unemployed individuals, with 28.8% or 161 of them being unemployed.
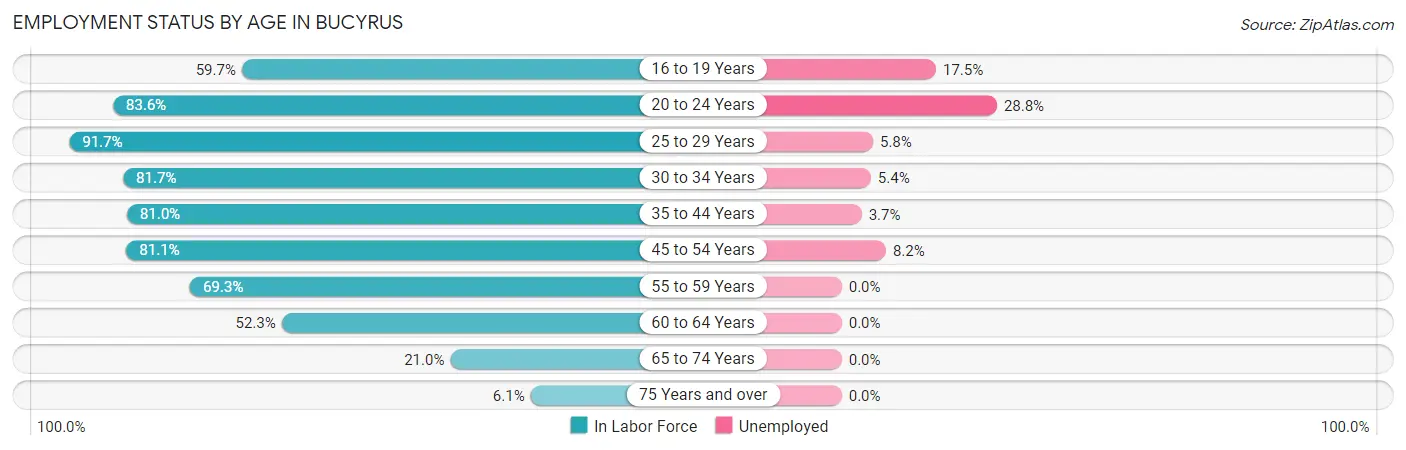
| Age Bracket | In Labor Force | Unemployed |
| 16 to 19 Years | 332 (59.7%) | 58 (17.5%) |
| 20 to 24 Years | 560 (83.6%) | 161 (28.8%) |
| 25 to 29 Years | 738 (91.7%) | 43 (5.8%) |
| 30 to 34 Years | 592 (81.7%) | 32 (5.4%) |
| 35 to 44 Years | 946 (81.0%) | 35 (3.7%) |
| 45 to 54 Years | 1,028 (81.1%) | 84 (8.2%) |
| 55 to 59 Years | 541 (69.3%) | 0 (0.0%) |
| 60 to 64 Years | 361 (52.3%) | 0 (0.0%) |
| 65 to 74 Years | 263 (21.0%) | 0 (0.0%) |
| 75 Years and over | 82 (6.1%) | 0 (0.0%) |
| Total | 5,446 (58.8%) | 414 (7.6%) |
Employment Status by Educational Attainment in Bucyrus
According to labor force statistics for Bucyrus, 77.4% of individuals (4,207) out of the total population between 25 and 64 years of age (5,436) are in the labor force, with 4.6% or 194 of them being unemployed. The group with the highest labor force participation rate are those with the educational attainment of bachelor's degree or higher, with 96.9% or 468 individuals in the labor force. Within the labor force, individuals with less than high school education have the highest percentage of unemployment, with 25.7% or 87 of them being unemployed.
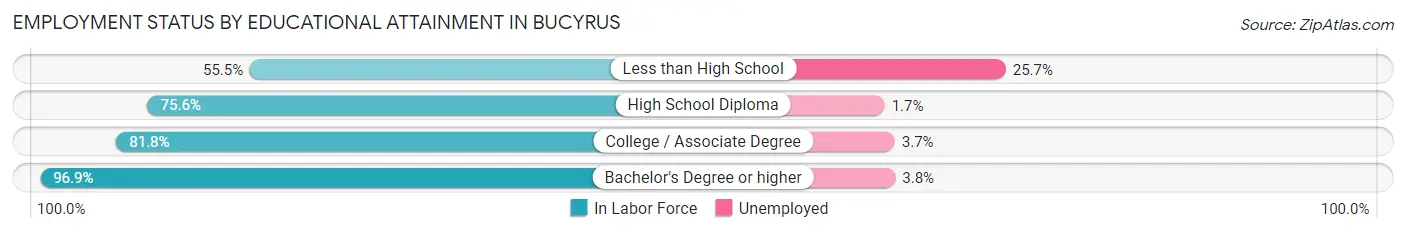
| Educational Attainment | In Labor Force | Unemployed |
| Less than High School | 338 (55.5%) | 157 (25.7%) |
| High School Diploma | 1,903 (75.6%) | 43 (1.7%) |
| College / Associate Degree | 1,494 (81.8%) | 68 (3.7%) |
| Bachelor's Degree or higher | 468 (96.9%) | 18 (3.8%) |
| Total | 4,207 (77.4%) | 250 (4.6%) |
Employment Occupations by Sex in Bucyrus
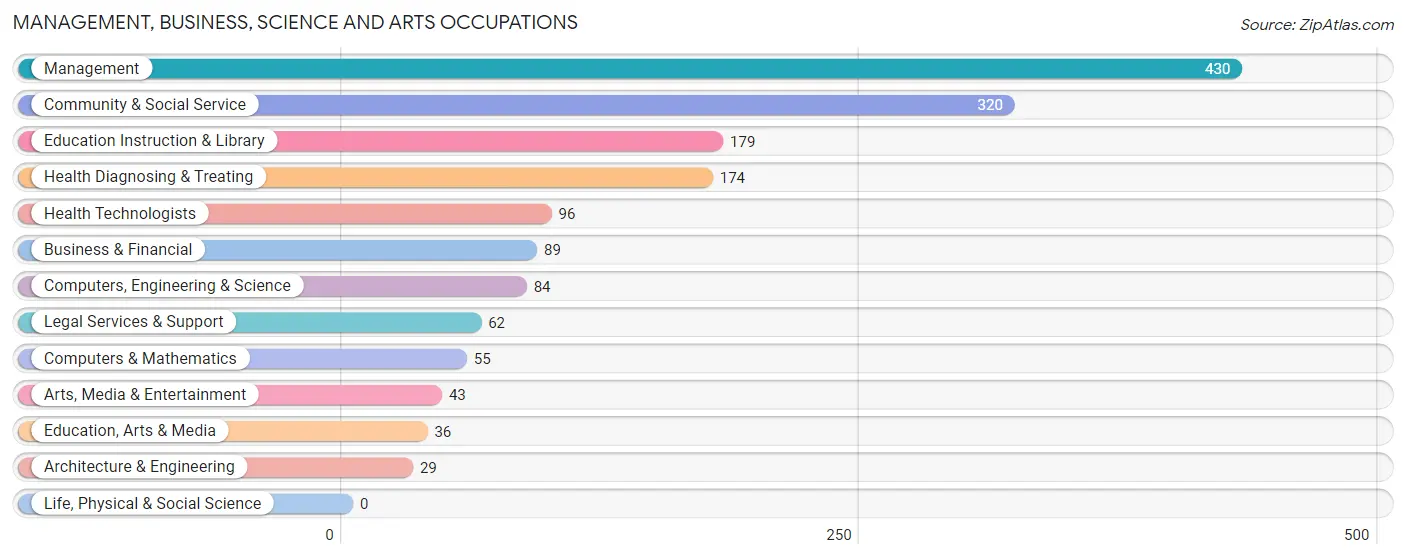
Management, Business, Science and Arts Occupations
The most common Management, Business, Science and Arts occupations in Bucyrus are Management (430 | 8.6%), Community & Social Service (320 | 6.4%), Education Instruction & Library (179 | 3.6%), Health Diagnosing & Treating (174 | 3.5%), and Health Technologists (96 | 1.9%).
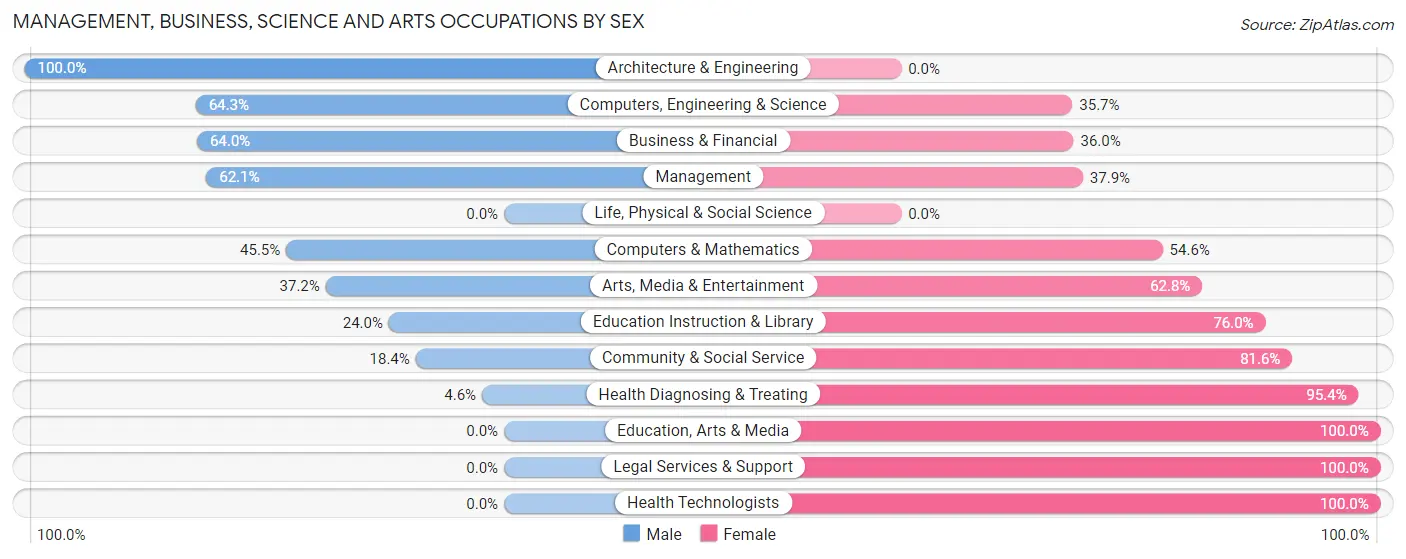
Management, Business, Science and Arts Occupations by Sex
Within the Management, Business, Science and Arts occupations in Bucyrus, the most male-oriented occupations are Architecture & Engineering (100.0%), Computers, Engineering & Science (64.3%), and Business & Financial (64.0%), while the most female-oriented occupations are Education, Arts & Media (100.0%), Legal Services & Support (100.0%), and Health Technologists (100.0%).
| Occupation | Male | Female |
| Management | 267 (62.1%) | 163 (37.9%) |
| Business & Financial | 57 (64.0%) | 32 (36.0%) |
| Computers, Engineering & Science | 54 (64.3%) | 30 (35.7%) |
| Computers & Mathematics | 25 (45.5%) | 30 (54.5%) |
| Architecture & Engineering | 29 (100.0%) | 0 (0.0%) |
| Life, Physical & Social Science | 0 (0.0%) | 0 (0.0%) |
| Community & Social Service | 59 (18.4%) | 261 (81.6%) |
| Education, Arts & Media | 0 (0.0%) | 36 (100.0%) |
| Legal Services & Support | 0 (0.0%) | 62 (100.0%) |
| Education Instruction & Library | 43 (24.0%) | 136 (76.0%) |
| Arts, Media & Entertainment | 16 (37.2%) | 27 (62.8%) |
| Health Diagnosing & Treating | 8 (4.6%) | 166 (95.4%) |
| Health Technologists | 0 (0.0%) | 96 (100.0%) |
| Total (Category) | 445 (40.6%) | 652 (59.4%) |
| Total (Overall) | 2,583 (51.4%) | 2,446 (48.6%) |
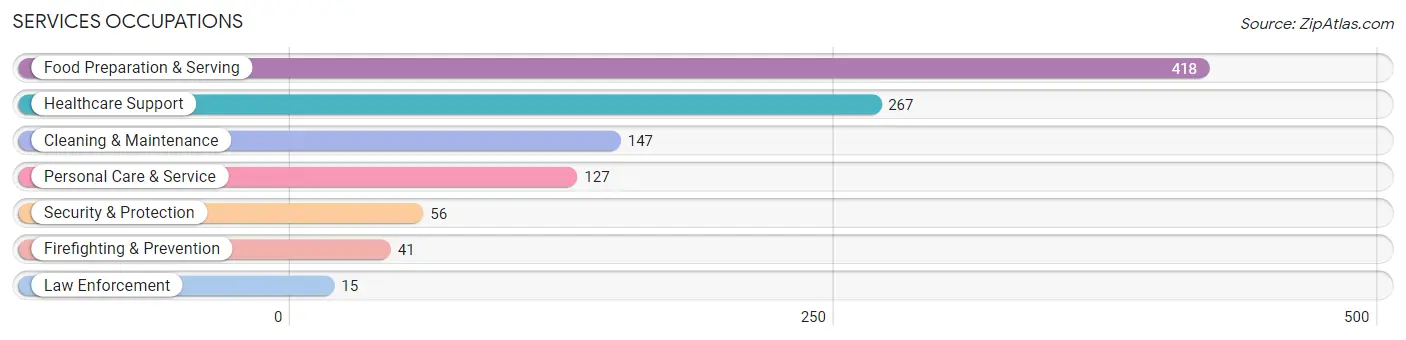
Services Occupations
The most common Services occupations in Bucyrus are Food Preparation & Serving (418 | 8.3%), Healthcare Support (267 | 5.3%), Cleaning & Maintenance (147 | 2.9%), Personal Care & Service (127 | 2.5%), and Security & Protection (56 | 1.1%).
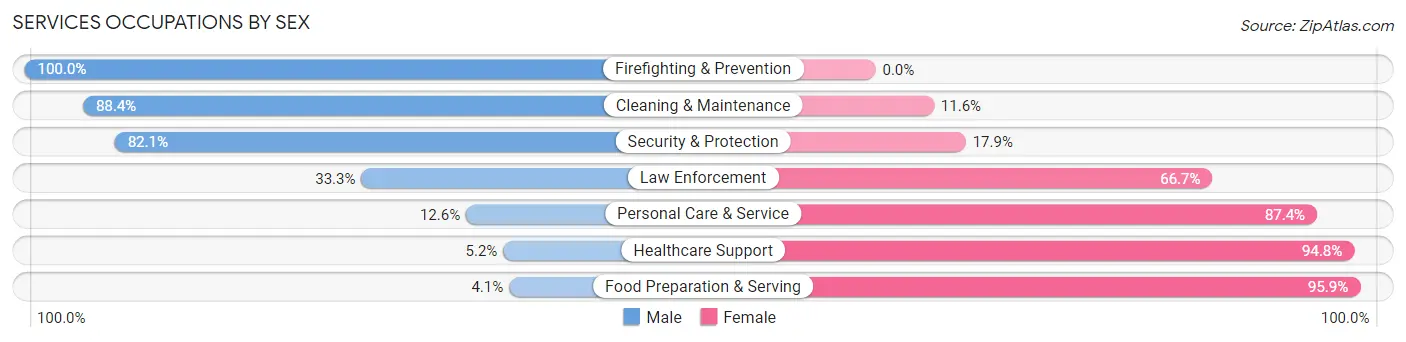
Services Occupations by Sex
Within the Services occupations in Bucyrus, the most male-oriented occupations are Firefighting & Prevention (100.0%), Cleaning & Maintenance (88.4%), and Security & Protection (82.1%), while the most female-oriented occupations are Food Preparation & Serving (95.9%), Healthcare Support (94.8%), and Personal Care & Service (87.4%).
| Occupation | Male | Female |
| Healthcare Support | 14 (5.2%) | 253 (94.8%) |
| Security & Protection | 46 (82.1%) | 10 (17.9%) |
| Firefighting & Prevention | 41 (100.0%) | 0 (0.0%) |
| Law Enforcement | 5 (33.3%) | 10 (66.7%) |
| Food Preparation & Serving | 17 (4.1%) | 401 (95.9%) |
| Cleaning & Maintenance | 130 (88.4%) | 17 (11.6%) |
| Personal Care & Service | 16 (12.6%) | 111 (87.4%) |
| Total (Category) | 223 (22.0%) | 792 (78.0%) |
| Total (Overall) | 2,583 (51.4%) | 2,446 (48.6%) |
Sales and Office Occupations
The most common Sales and Office occupations in Bucyrus are Sales & Related (410 | 8.2%), and Office & Administration (392 | 7.8%).

Sales and Office Occupations by Sex
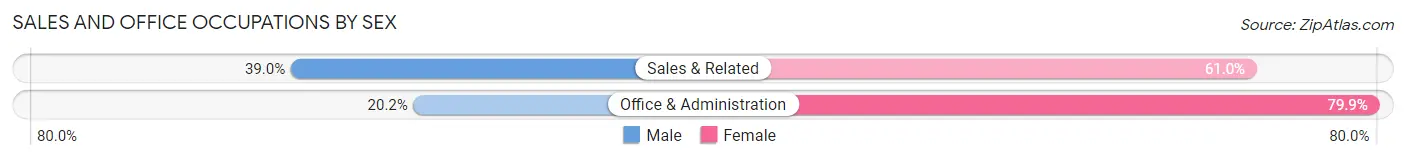
| Occupation | Male | Female |
| Sales & Related | 160 (39.0%) | 250 (61.0%) |
| Office & Administration | 79 (20.2%) | 313 (79.8%) |
| Total (Category) | 239 (29.8%) | 563 (70.2%) |
| Total (Overall) | 2,583 (51.4%) | 2,446 (48.6%) |
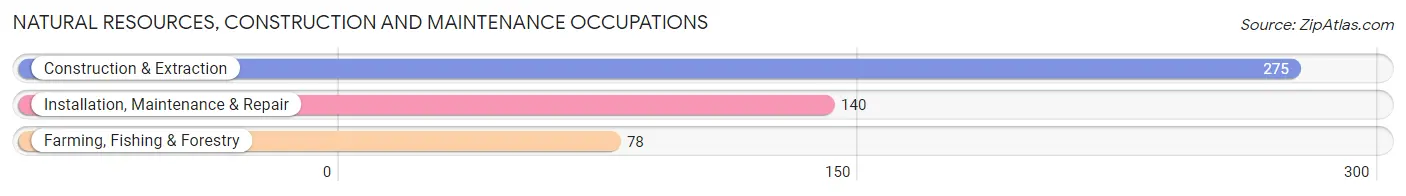
Natural Resources, Construction and Maintenance Occupations
The most common Natural Resources, Construction and Maintenance occupations in Bucyrus are Construction & Extraction (275 | 5.5%), Installation, Maintenance & Repair (140 | 2.8%), and Farming, Fishing & Forestry (78 | 1.5%).
Natural Resources, Construction and Maintenance Occupations by Sex
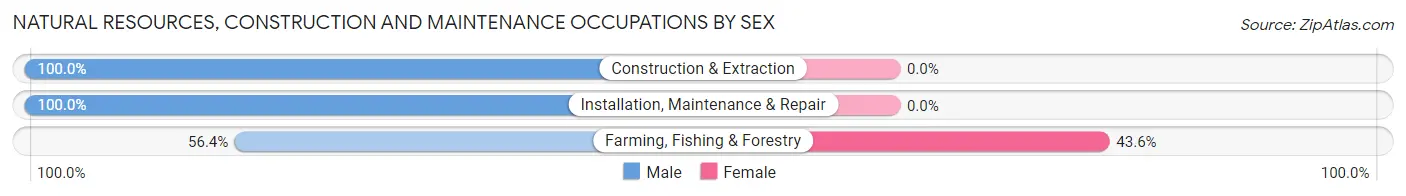
| Occupation | Male | Female |
| Farming, Fishing & Forestry | 44 (56.4%) | 34 (43.6%) |
| Construction & Extraction | 275 (100.0%) | 0 (0.0%) |
| Installation, Maintenance & Repair | 140 (100.0%) | 0 (0.0%) |
| Total (Category) | 459 (93.1%) | 34 (6.9%) |
| Total (Overall) | 2,583 (51.4%) | 2,446 (48.6%) |
Production, Transportation and Moving Occupations
The most common Production, Transportation and Moving occupations in Bucyrus are Production (1,107 | 22.0%), Material Moving (353 | 7.0%), and Transportation (162 | 3.2%).
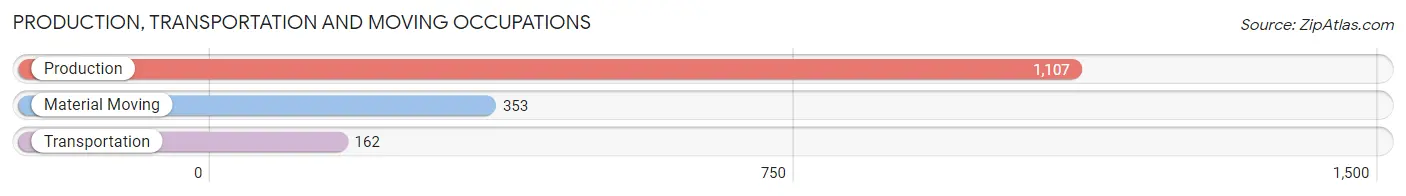
Production, Transportation and Moving Occupations by Sex
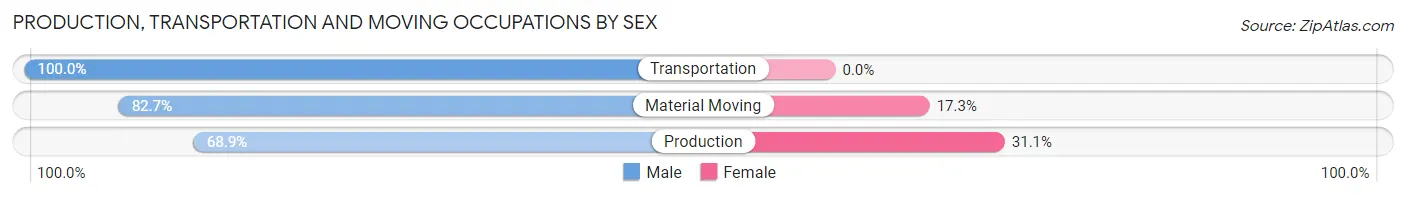
| Occupation | Male | Female |
| Production | 763 (68.9%) | 344 (31.1%) |
| Transportation | 162 (100.0%) | 0 (0.0%) |
| Material Moving | 292 (82.7%) | 61 (17.3%) |
| Total (Category) | 1,217 (75.0%) | 405 (25.0%) |
| Total (Overall) | 2,583 (51.4%) | 2,446 (48.6%) |
Employment Industries by Sex in Bucyrus
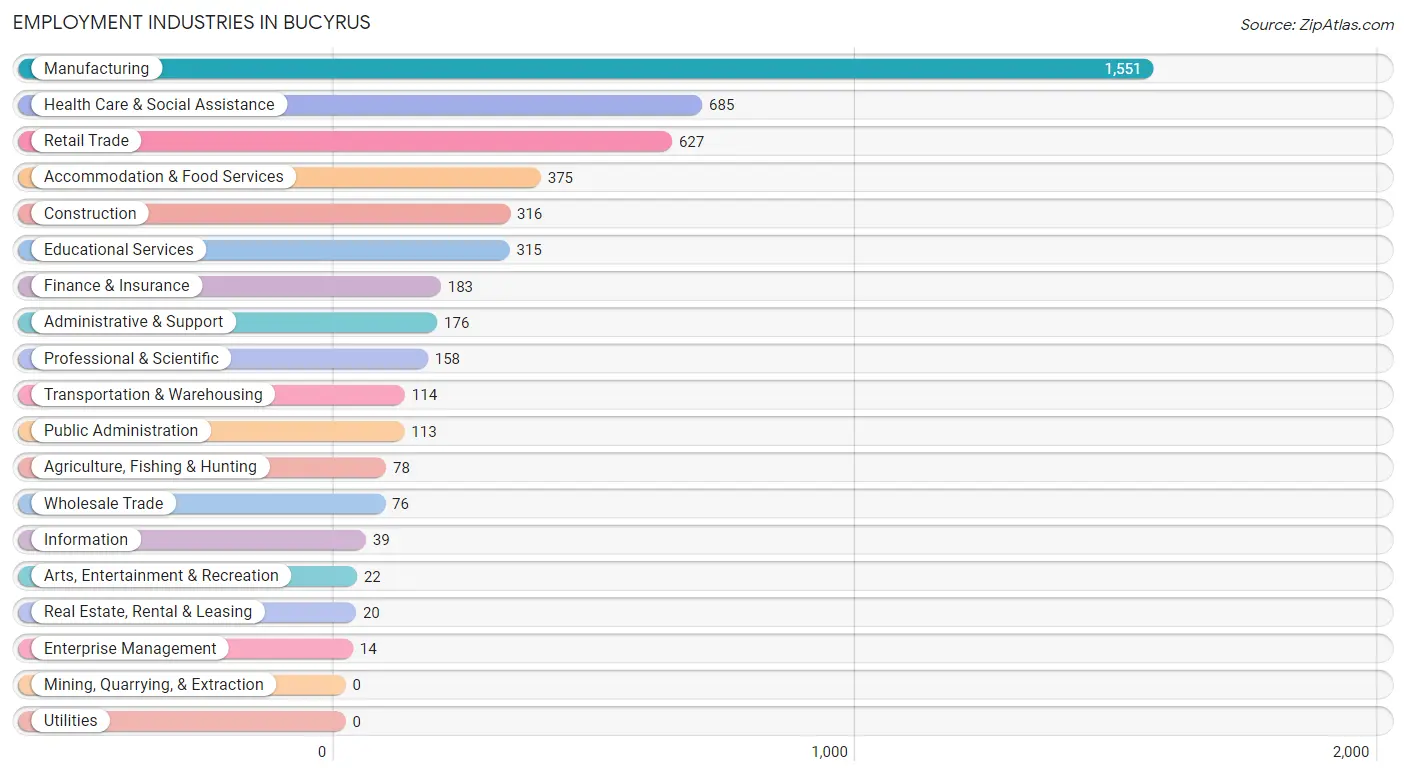
Employment Industries in Bucyrus
The major employment industries in Bucyrus include Manufacturing (1,551 | 30.8%), Health Care & Social Assistance (685 | 13.6%), Retail Trade (627 | 12.5%), Accommodation & Food Services (375 | 7.5%), and Construction (316 | 6.3%).
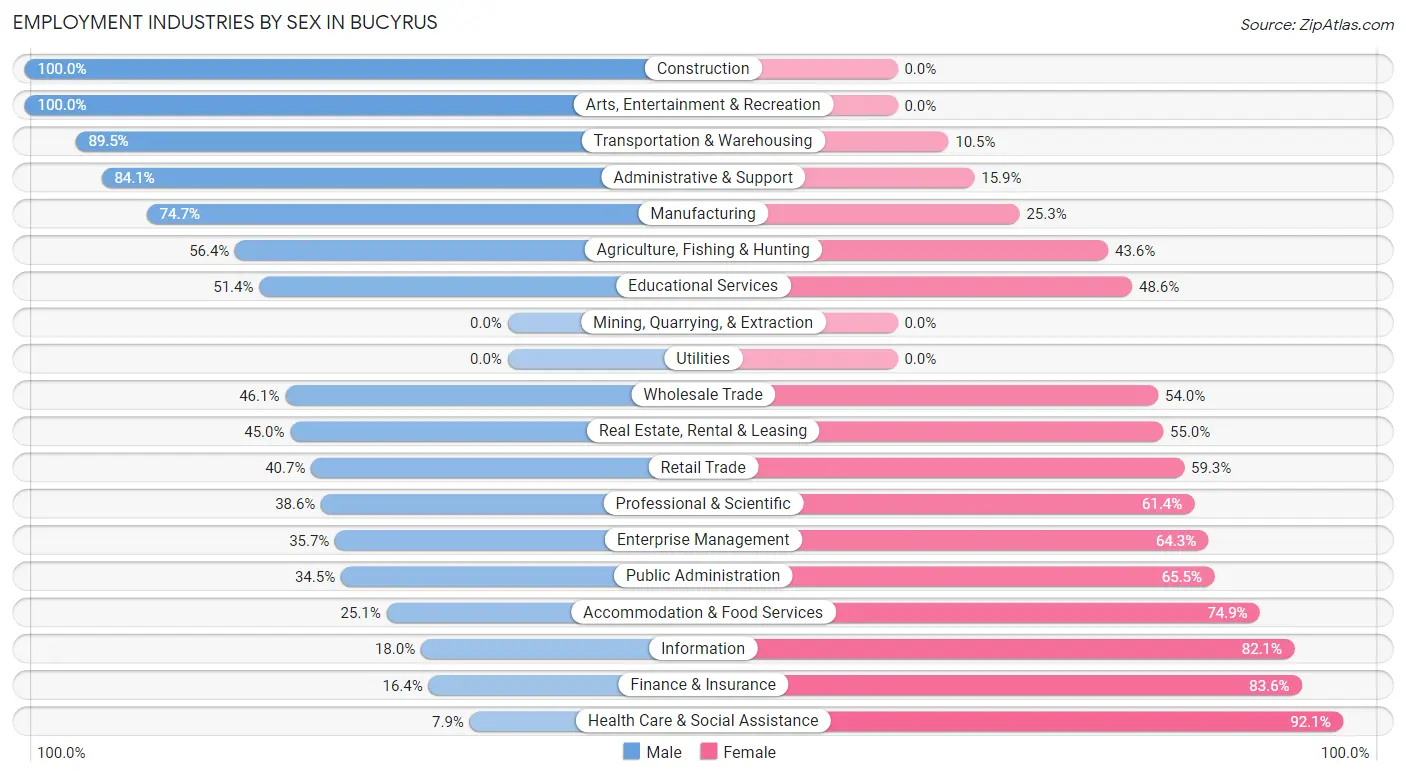
Employment Industries by Sex in Bucyrus
The Bucyrus industries that see more men than women are Construction (100.0%), Arts, Entertainment & Recreation (100.0%), and Transportation & Warehousing (89.5%), whereas the industries that tend to have a higher number of women are Health Care & Social Assistance (92.1%), Finance & Insurance (83.6%), and Information (82.1%).
| Industry | Male | Female |
| Agriculture, Fishing & Hunting | 44 (56.4%) | 34 (43.6%) |
| Mining, Quarrying, & Extraction | 0 (0.0%) | 0 (0.0%) |
| Construction | 316 (100.0%) | 0 (0.0%) |
| Manufacturing | 1,159 (74.7%) | 392 (25.3%) |
| Wholesale Trade | 35 (46.1%) | 41 (53.9%) |
| Retail Trade | 255 (40.7%) | 372 (59.3%) |
| Transportation & Warehousing | 102 (89.5%) | 12 (10.5%) |
| Utilities | 0 (0.0%) | 0 (0.0%) |
| Information | 7 (17.9%) | 32 (82.1%) |
| Finance & Insurance | 30 (16.4%) | 153 (83.6%) |
| Real Estate, Rental & Leasing | 9 (45.0%) | 11 (55.0%) |
| Professional & Scientific | 61 (38.6%) | 97 (61.4%) |
| Enterprise Management | 5 (35.7%) | 9 (64.3%) |
| Administrative & Support | 148 (84.1%) | 28 (15.9%) |
| Educational Services | 162 (51.4%) | 153 (48.6%) |
| Health Care & Social Assistance | 54 (7.9%) | 631 (92.1%) |
| Arts, Entertainment & Recreation | 22 (100.0%) | 0 (0.0%) |
| Accommodation & Food Services | 94 (25.1%) | 281 (74.9%) |
| Public Administration | 39 (34.5%) | 74 (65.5%) |
| Total | 2,583 (51.4%) | 2,446 (48.6%) |
Education in Bucyrus
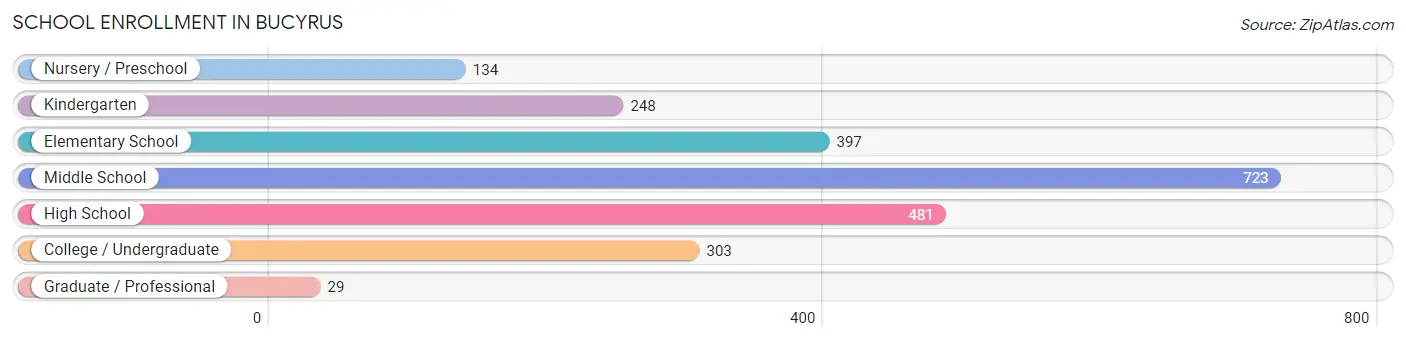
School Enrollment in Bucyrus
The most common levels of schooling among the 2,315 students in Bucyrus are middle school (723 | 31.2%), high school (481 | 20.8%), and elementary school (397 | 17.2%).
| School Level | # Students | % Students |
| Nursery / Preschool | 134 | 5.8% |
| Kindergarten | 248 | 10.7% |
| Elementary School | 397 | 17.2% |
| Middle School | 723 | 31.2% |
| High School | 481 | 20.8% |
| College / Undergraduate | 303 | 13.1% |
| Graduate / Professional | 29 | 1.3% |
| Total | 2,315 | 100.0% |
School Enrollment by Age by Funding Source in Bucyrus
Out of a total of 2,315 students who are enrolled in schools in Bucyrus, 236 (10.2%) attend a private institution, while the remaining 2,079 (89.8%) are enrolled in public schools. The age group of 18 to 19 year olds has the highest likelihood of being enrolled in private schools, with 73 (41.5% in the age bracket) enrolled. Conversely, the age group of 35 years and over has the lowest likelihood of being enrolled in a private school, with 109 (100.0% in the age bracket) attending a public institution.
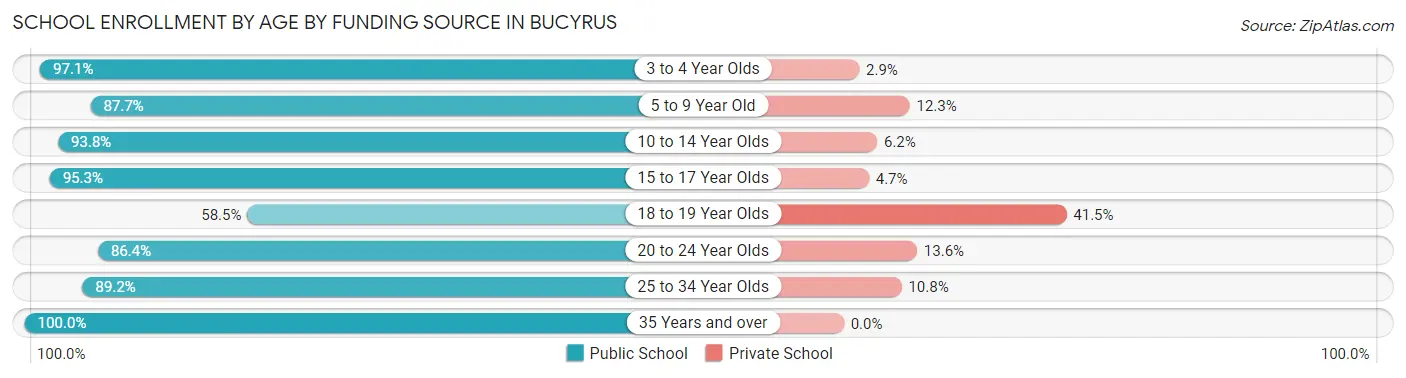
| Age Bracket | Public School | Private School |
| 3 to 4 Year Olds | 101 (97.1%) | 3 (2.9%) |
| 5 to 9 Year Old | 536 (87.7%) | 75 (12.3%) |
| 10 to 14 Year Olds | 770 (93.8%) | 51 (6.2%) |
| 15 to 17 Year Olds | 346 (95.3%) | 17 (4.7%) |
| 18 to 19 Year Olds | 103 (58.5%) | 73 (41.5%) |
| 20 to 24 Year Olds | 57 (86.4%) | 9 (13.6%) |
| 25 to 34 Year Olds | 58 (89.2%) | 7 (10.8%) |
| 35 Years and over | 109 (100.0%) | 0 (0.0%) |
| Total | 2,079 (89.8%) | 236 (10.2%) |
Educational Attainment by Field of Study in Bucyrus
Education (299 | 34.5%), business (129 | 14.9%), engineering (58 | 6.7%), bio, nature & agricultural (56 | 6.5%), and arts & humanities (54 | 6.2%) are the most common fields of study among 867 individuals in Bucyrus who have obtained a bachelor's degree or higher.
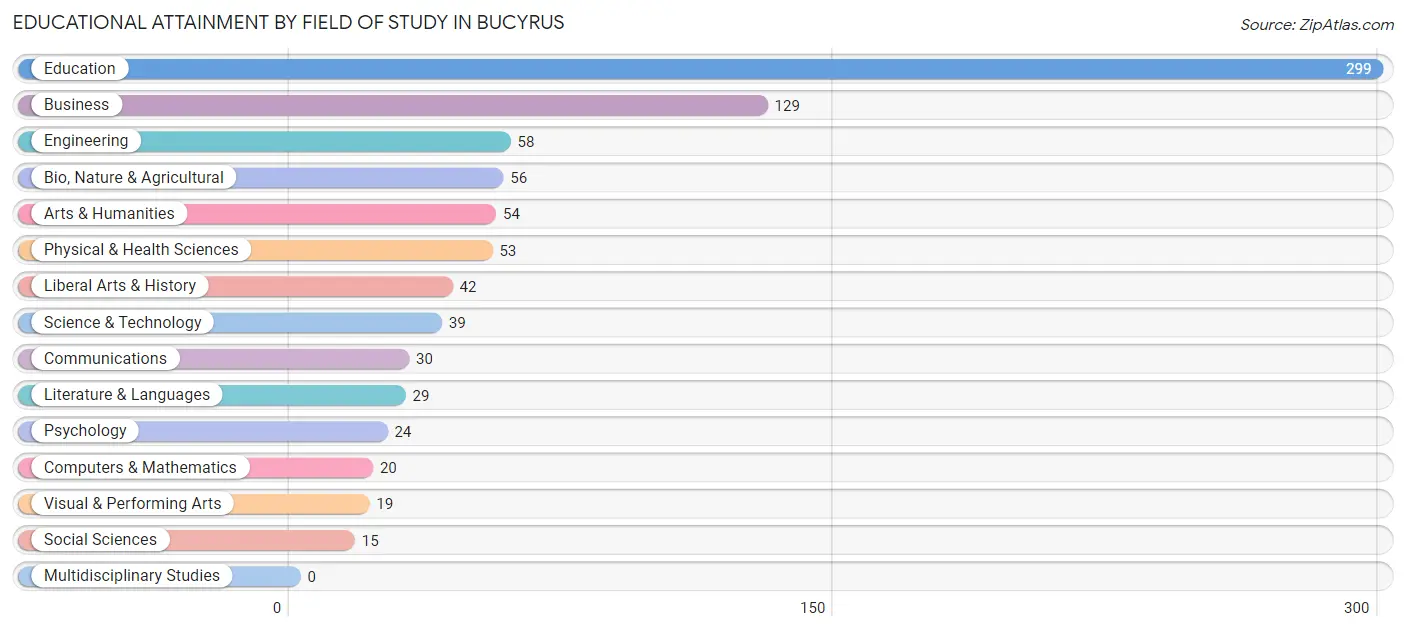
| Field of Study | # Graduates | % Graduates |
| Computers & Mathematics | 20 | 2.3% |
| Bio, Nature & Agricultural | 56 | 6.5% |
| Physical & Health Sciences | 53 | 6.1% |
| Psychology | 24 | 2.8% |
| Social Sciences | 15 | 1.7% |
| Engineering | 58 | 6.7% |
| Multidisciplinary Studies | 0 | 0.0% |
| Science & Technology | 39 | 4.5% |
| Business | 129 | 14.9% |
| Education | 299 | 34.5% |
| Literature & Languages | 29 | 3.3% |
| Liberal Arts & History | 42 | 4.8% |
| Visual & Performing Arts | 19 | 2.2% |
| Communications | 30 | 3.5% |
| Arts & Humanities | 54 | 6.2% |
| Total | 867 | 100.0% |
Transportation & Commute in Bucyrus
Vehicle Availability by Sex in Bucyrus
The most prevalent vehicle ownership categories in Bucyrus are males with 2 vehicles (979, accounting for 38.2%) and females with 2 vehicles (821, making up 40.9%).
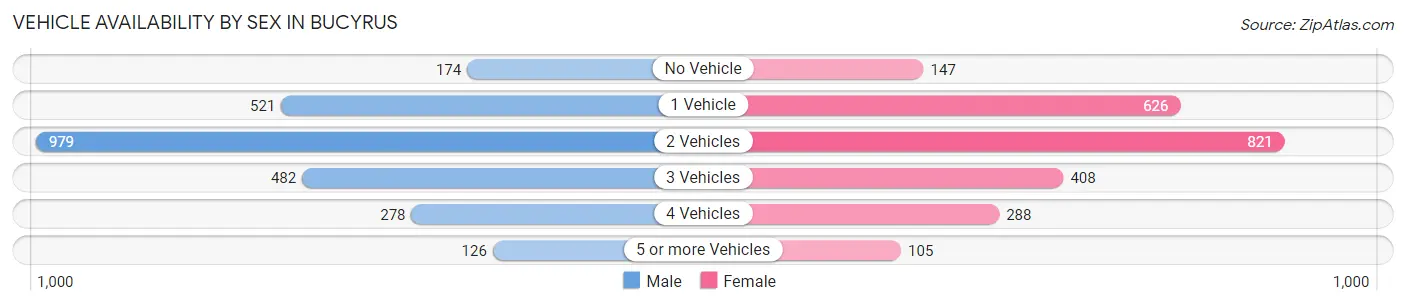
| Vehicles Available | Male | Female |
| No Vehicle | 174 (6.8%) | 147 (6.1%) |
| 1 Vehicle | 521 (20.3%) | 626 (26.1%) |
| 2 Vehicles | 979 (38.2%) | 821 (34.3%) |
| 3 Vehicles | 482 (18.8%) | 408 (17.0%) |
| 4 Vehicles | 278 (10.9%) | 288 (12.0%) |
| 5 or more Vehicles | 126 (4.9%) | 105 (4.4%) |
| Total | 2,560 (100.0%) | 2,395 (100.0%) |
Commute Time in Bucyrus
The most frequently occuring commute durations in Bucyrus are 5 to 9 minutes (1,254 commuters, 25.8%), 15 to 19 minutes (582 commuters, 12.0%), and 30 to 34 minutes (546 commuters, 11.2%).
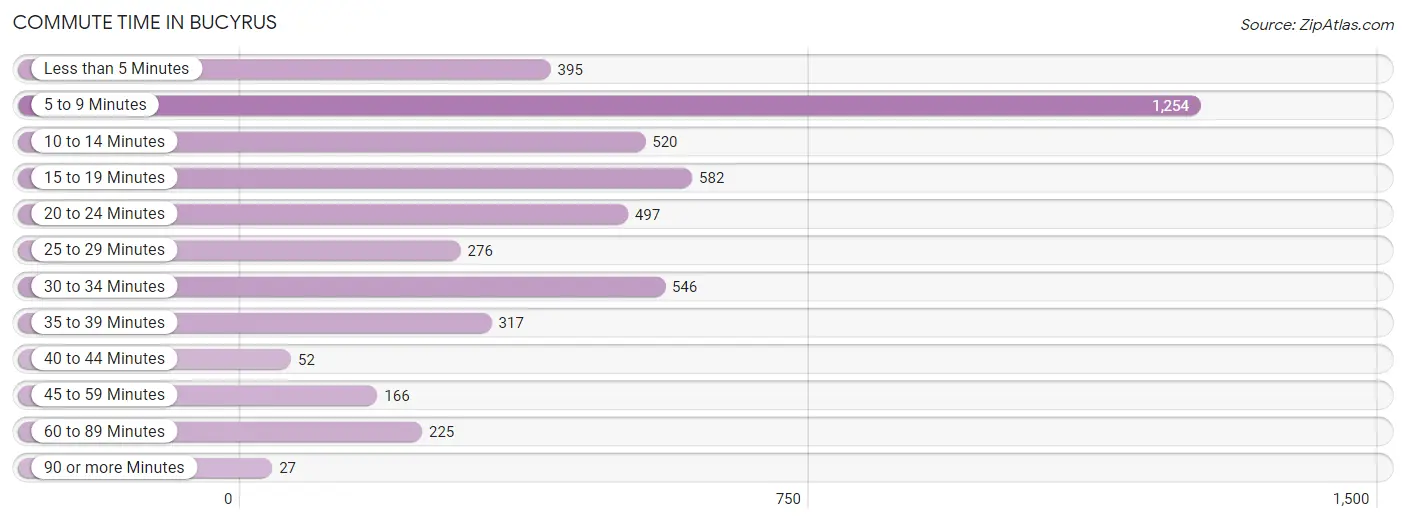
| Commute Time | # Commuters | % Commuters |
| Less than 5 Minutes | 395 | 8.1% |
| 5 to 9 Minutes | 1,254 | 25.8% |
| 10 to 14 Minutes | 520 | 10.7% |
| 15 to 19 Minutes | 582 | 12.0% |
| 20 to 24 Minutes | 497 | 10.2% |
| 25 to 29 Minutes | 276 | 5.7% |
| 30 to 34 Minutes | 546 | 11.2% |
| 35 to 39 Minutes | 317 | 6.5% |
| 40 to 44 Minutes | 52 | 1.1% |
| 45 to 59 Minutes | 166 | 3.4% |
| 60 to 89 Minutes | 225 | 4.6% |
| 90 or more Minutes | 27 | 0.6% |
Commute Time by Sex in Bucyrus
The most common commute times in Bucyrus are 5 to 9 minutes (445 commuters, 17.9%) for males and 5 to 9 minutes (809 commuters, 34.1%) for females.
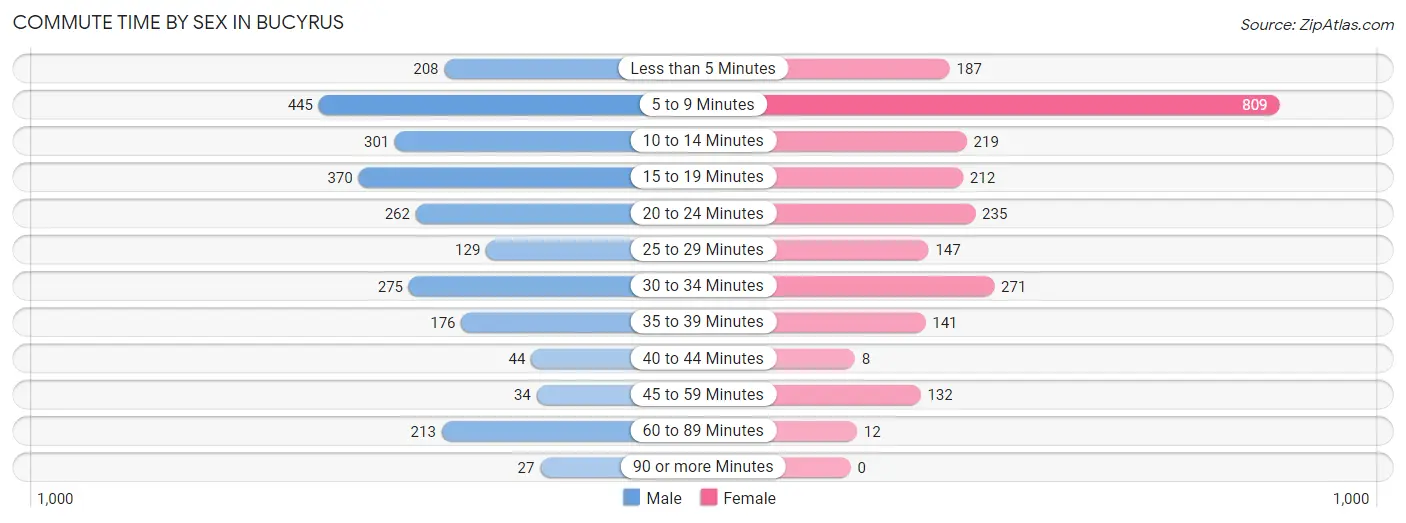
| Commute Time | Male | Female |
| Less than 5 Minutes | 208 (8.4%) | 187 (7.9%) |
| 5 to 9 Minutes | 445 (17.9%) | 809 (34.1%) |
| 10 to 14 Minutes | 301 (12.1%) | 219 (9.2%) |
| 15 to 19 Minutes | 370 (14.9%) | 212 (8.9%) |
| 20 to 24 Minutes | 262 (10.5%) | 235 (9.9%) |
| 25 to 29 Minutes | 129 (5.2%) | 147 (6.2%) |
| 30 to 34 Minutes | 275 (11.1%) | 271 (11.4%) |
| 35 to 39 Minutes | 176 (7.1%) | 141 (5.9%) |
| 40 to 44 Minutes | 44 (1.8%) | 8 (0.3%) |
| 45 to 59 Minutes | 34 (1.4%) | 132 (5.6%) |
| 60 to 89 Minutes | 213 (8.6%) | 12 (0.5%) |
| 90 or more Minutes | 27 (1.1%) | 0 (0.0%) |
Time of Departure to Work by Sex in Bucyrus
The most frequent times of departure to work in Bucyrus are 4:00 PM to 11:59 PM (400, 16.1%) for males and 7:30 AM to 7:59 AM (343, 14.4%) for females.
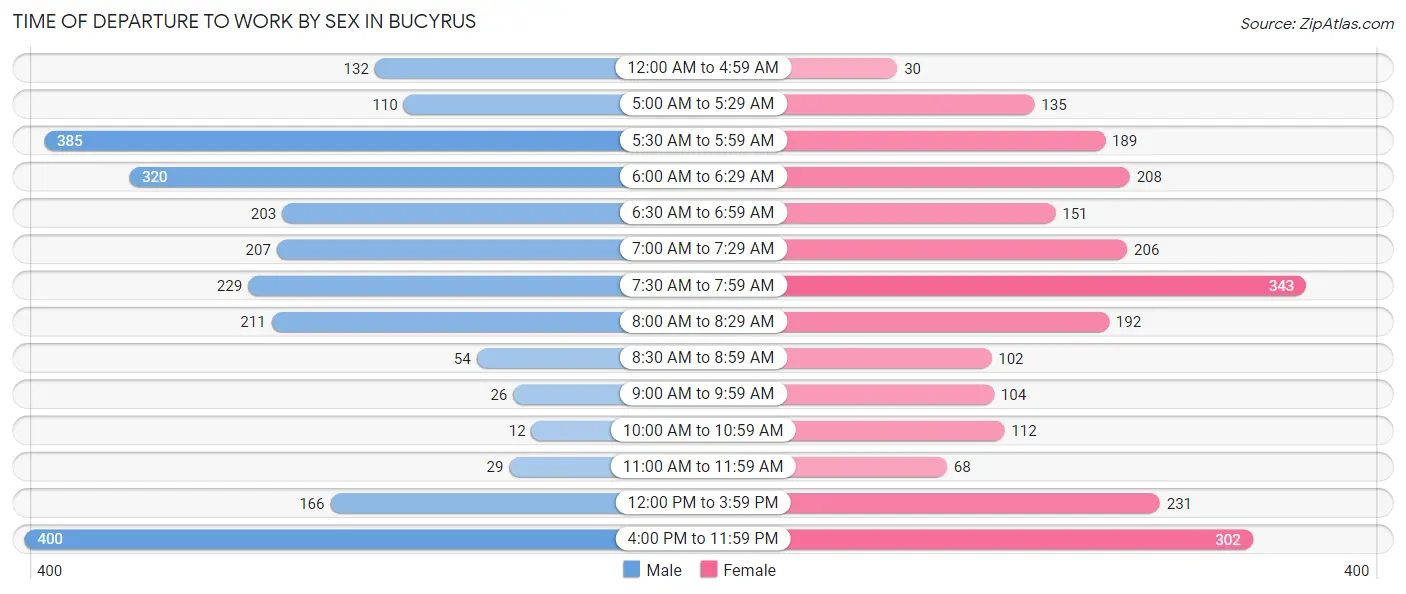
| Time of Departure | Male | Female |
| 12:00 AM to 4:59 AM | 132 (5.3%) | 30 (1.3%) |
| 5:00 AM to 5:29 AM | 110 (4.4%) | 135 (5.7%) |
| 5:30 AM to 5:59 AM | 385 (15.5%) | 189 (8.0%) |
| 6:00 AM to 6:29 AM | 320 (12.9%) | 208 (8.8%) |
| 6:30 AM to 6:59 AM | 203 (8.2%) | 151 (6.4%) |
| 7:00 AM to 7:29 AM | 207 (8.3%) | 206 (8.7%) |
| 7:30 AM to 7:59 AM | 229 (9.2%) | 343 (14.4%) |
| 8:00 AM to 8:29 AM | 211 (8.5%) | 192 (8.1%) |
| 8:30 AM to 8:59 AM | 54 (2.2%) | 102 (4.3%) |
| 9:00 AM to 9:59 AM | 26 (1.1%) | 104 (4.4%) |
| 10:00 AM to 10:59 AM | 12 (0.5%) | 112 (4.7%) |
| 11:00 AM to 11:59 AM | 29 (1.2%) | 68 (2.9%) |
| 12:00 PM to 3:59 PM | 166 (6.7%) | 231 (9.7%) |
| 4:00 PM to 11:59 PM | 400 (16.1%) | 302 (12.7%) |
| Total | 2,484 (100.0%) | 2,373 (100.0%) |
Housing Occupancy in Bucyrus
Occupancy by Ownership in Bucyrus
Of the total 5,149 dwellings in Bucyrus, owner-occupied units account for 3,228 (62.7%), while renter-occupied units make up 1,921 (37.3%).
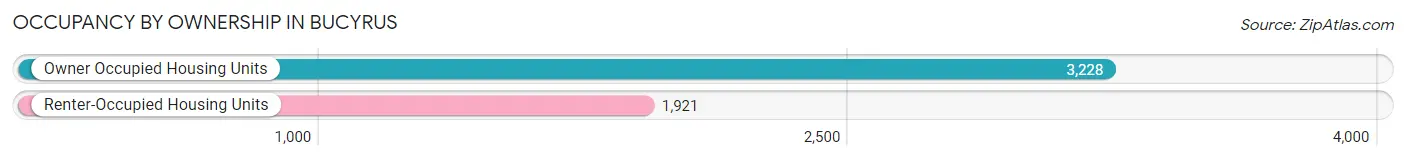
| Occupancy | # Housing Units | % Housing Units |
| Owner Occupied Housing Units | 3,228 | 62.7% |
| Renter-Occupied Housing Units | 1,921 | 37.3% |
| Total Occupied Housing Units | 5,149 | 100.0% |
Occupancy by Household Size in Bucyrus
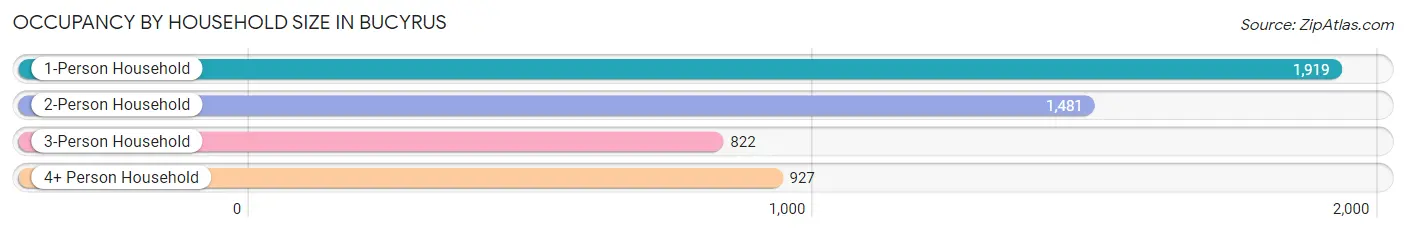
| Household Size | # Housing Units | % Housing Units |
| 1-Person Household | 1,919 | 37.3% |
| 2-Person Household | 1,481 | 28.8% |
| 3-Person Household | 822 | 16.0% |
| 4+ Person Household | 927 | 18.0% |
| Total Housing Units | 5,149 | 100.0% |
Occupancy by Ownership by Household Size in Bucyrus
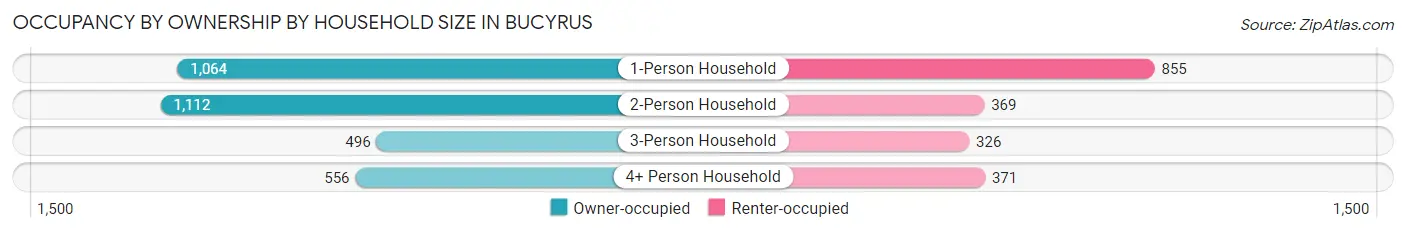
| Household Size | Owner-occupied | Renter-occupied |
| 1-Person Household | 1,064 (55.4%) | 855 (44.6%) |
| 2-Person Household | 1,112 (75.1%) | 369 (24.9%) |
| 3-Person Household | 496 (60.3%) | 326 (39.7%) |
| 4+ Person Household | 556 (60.0%) | 371 (40.0%) |
| Total Housing Units | 3,228 (62.7%) | 1,921 (37.3%) |
Occupancy by Educational Attainment in Bucyrus
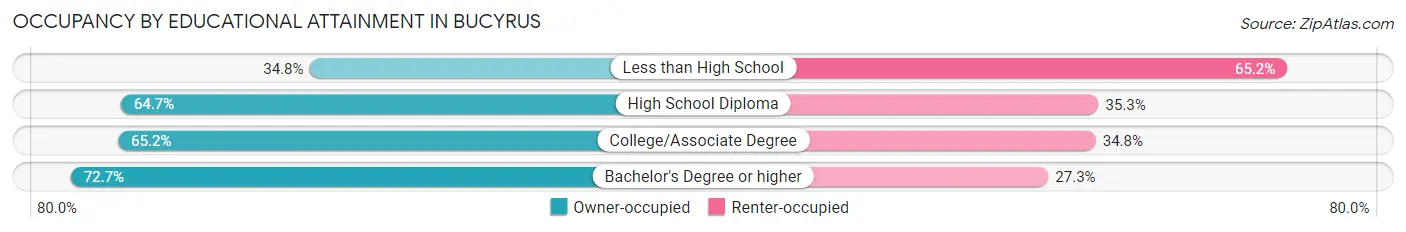
| Household Size | Owner-occupied | Renter-occupied |
| Less than High School | 185 (34.8%) | 346 (65.2%) |
| High School Diploma | 1,606 (64.7%) | 875 (35.3%) |
| College/Associate Degree | 1,006 (65.2%) | 538 (34.8%) |
| Bachelor's Degree or higher | 431 (72.7%) | 162 (27.3%) |
Occupancy by Age of Householder in Bucyrus
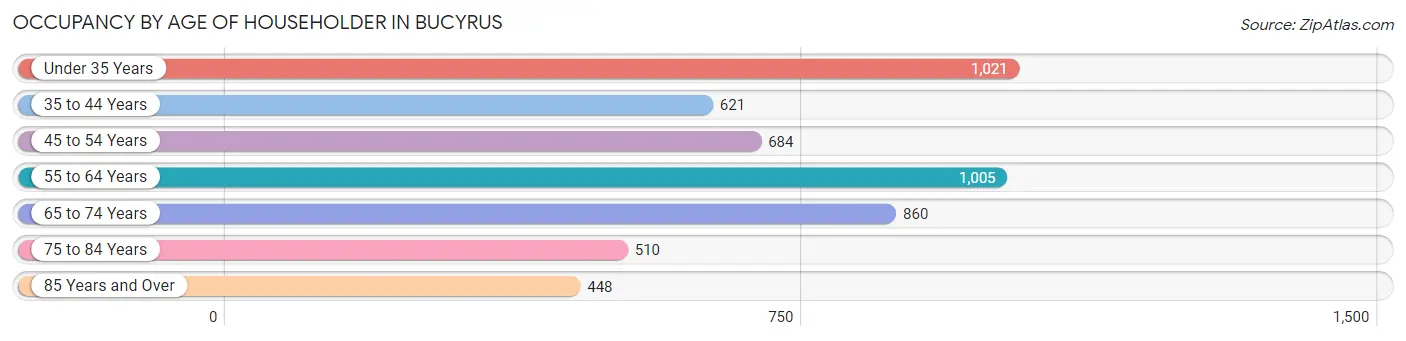
| Age Bracket | # Households | % Households |
| Under 35 Years | 1,021 | 19.8% |
| 35 to 44 Years | 621 | 12.1% |
| 45 to 54 Years | 684 | 13.3% |
| 55 to 64 Years | 1,005 | 19.5% |
| 65 to 74 Years | 860 | 16.7% |
| 75 to 84 Years | 510 | 9.9% |
| 85 Years and Over | 448 | 8.7% |
| Total | 5,149 | 100.0% |
Housing Finances in Bucyrus
Median Income by Occupancy in Bucyrus
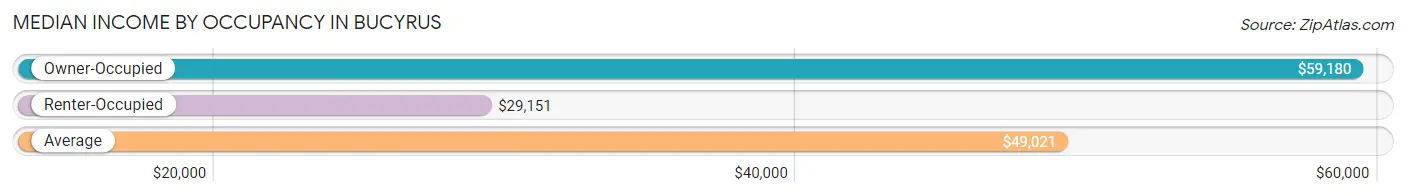
| Occupancy Type | # Households | Median Income |
| Owner-Occupied | 3,228 (62.7%) | $59,180 |
| Renter-Occupied | 1,921 (37.3%) | $29,151 |
| Average | 5,149 (100.0%) | $49,021 |
Occupancy by Householder Income Bracket in Bucyrus
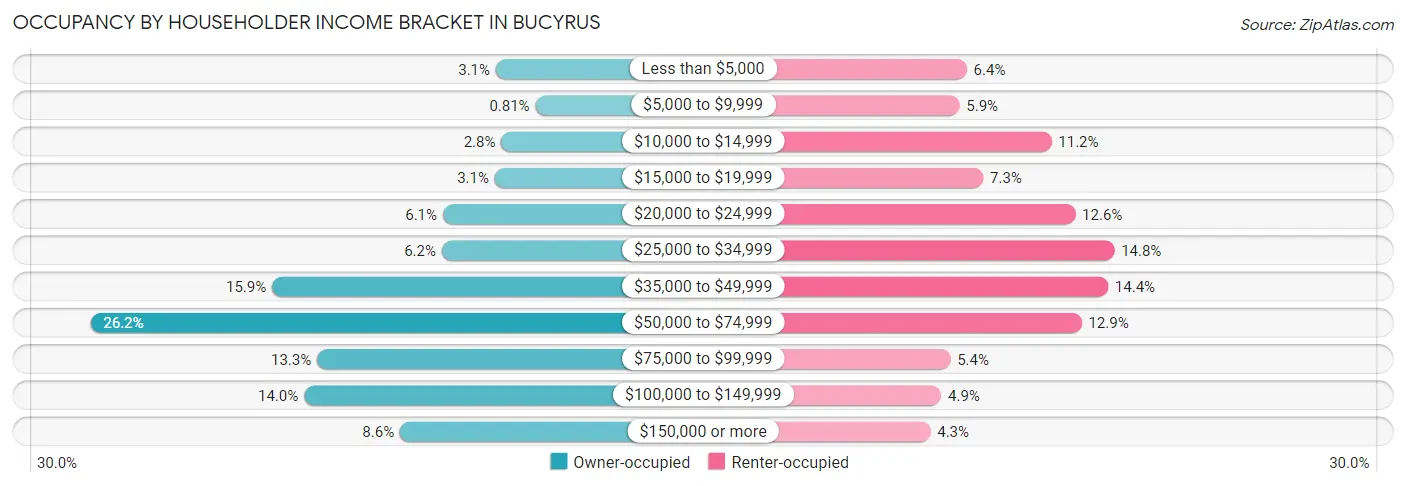
| Income Bracket | Owner-occupied | Renter-occupied |
| Less than $5,000 | 99 (3.1%) | 122 (6.4%) |
| $5,000 to $9,999 | 26 (0.8%) | 114 (5.9%) |
| $10,000 to $14,999 | 89 (2.8%) | 215 (11.2%) |
| $15,000 to $19,999 | 101 (3.1%) | 140 (7.3%) |
| $20,000 to $24,999 | 197 (6.1%) | 241 (12.6%) |
| $25,000 to $34,999 | 199 (6.2%) | 284 (14.8%) |
| $35,000 to $49,999 | 512 (15.9%) | 277 (14.4%) |
| $50,000 to $74,999 | 847 (26.2%) | 248 (12.9%) |
| $75,000 to $99,999 | 429 (13.3%) | 104 (5.4%) |
| $100,000 to $149,999 | 453 (14.0%) | 94 (4.9%) |
| $150,000 or more | 276 (8.6%) | 82 (4.3%) |
| Total | 3,228 (100.0%) | 1,921 (100.0%) |
Monthly Housing Cost Tiers in Bucyrus
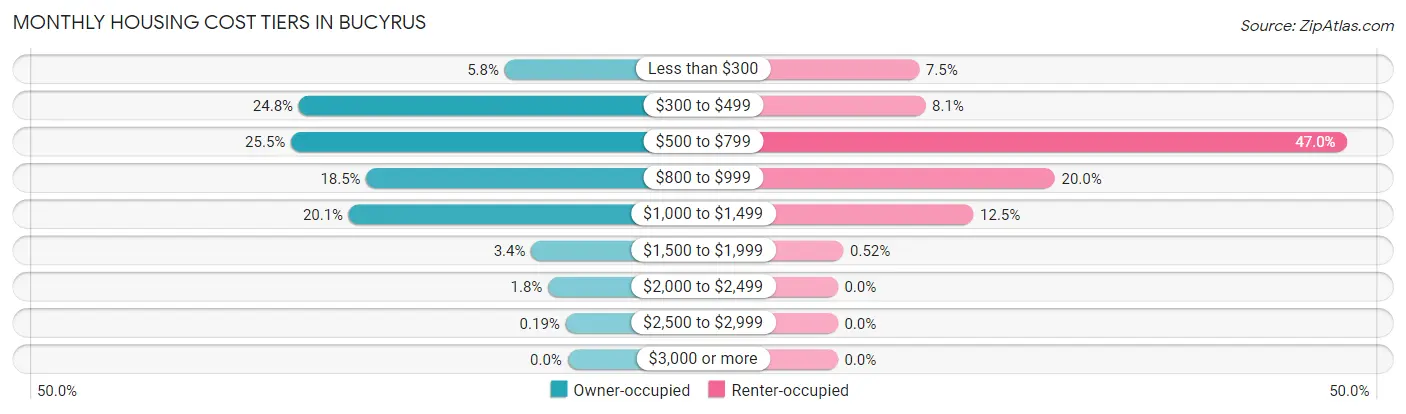
| Monthly Cost | Owner-occupied | Renter-occupied |
| Less than $300 | 187 (5.8%) | 144 (7.5%) |
| $300 to $499 | 799 (24.7%) | 155 (8.1%) |
| $500 to $799 | 822 (25.5%) | 902 (46.9%) |
| $800 to $999 | 598 (18.5%) | 384 (20.0%) |
| $1,000 to $1,499 | 650 (20.1%) | 240 (12.5%) |
| $1,500 to $1,999 | 108 (3.4%) | 10 (0.5%) |
| $2,000 to $2,499 | 58 (1.8%) | 0 (0.0%) |
| $2,500 to $2,999 | 6 (0.2%) | 0 (0.0%) |
| $3,000 or more | 0 (0.0%) | 0 (0.0%) |
| Total | 3,228 (100.0%) | 1,921 (100.0%) |
Physical Housing Characteristics in Bucyrus
Housing Structures in Bucyrus
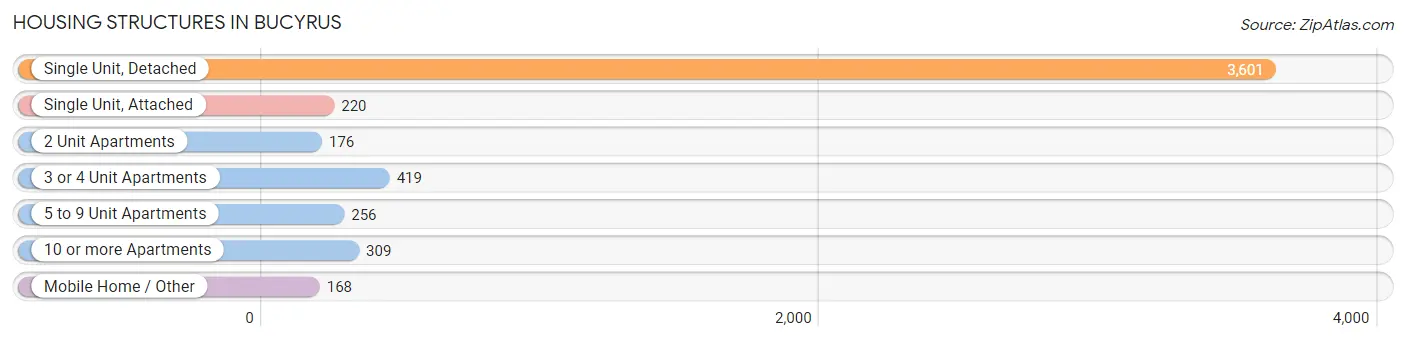
| Structure Type | # Housing Units | % Housing Units |
| Single Unit, Detached | 3,601 | 69.9% |
| Single Unit, Attached | 220 | 4.3% |
| 2 Unit Apartments | 176 | 3.4% |
| 3 or 4 Unit Apartments | 419 | 8.1% |
| 5 to 9 Unit Apartments | 256 | 5.0% |
| 10 or more Apartments | 309 | 6.0% |
| Mobile Home / Other | 168 | 3.3% |
| Total | 5,149 | 100.0% |
Housing Structures by Occupancy in Bucyrus
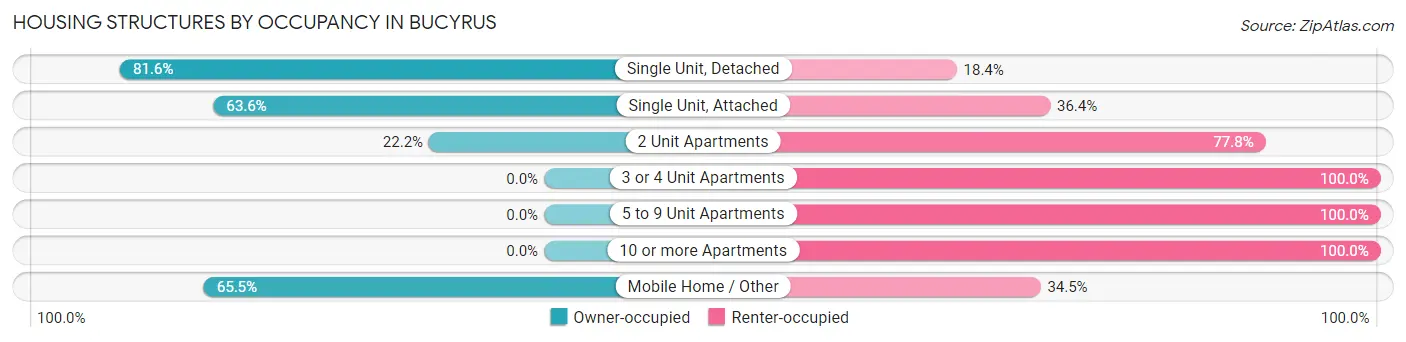
| Structure Type | Owner-occupied | Renter-occupied |
| Single Unit, Detached | 2,939 (81.6%) | 662 (18.4%) |
| Single Unit, Attached | 140 (63.6%) | 80 (36.4%) |
| 2 Unit Apartments | 39 (22.2%) | 137 (77.8%) |
| 3 or 4 Unit Apartments | 0 (0.0%) | 419 (100.0%) |
| 5 to 9 Unit Apartments | 0 (0.0%) | 256 (100.0%) |
| 10 or more Apartments | 0 (0.0%) | 309 (100.0%) |
| Mobile Home / Other | 110 (65.5%) | 58 (34.5%) |
| Total | 3,228 (62.7%) | 1,921 (37.3%) |
Housing Structures by Number of Rooms in Bucyrus
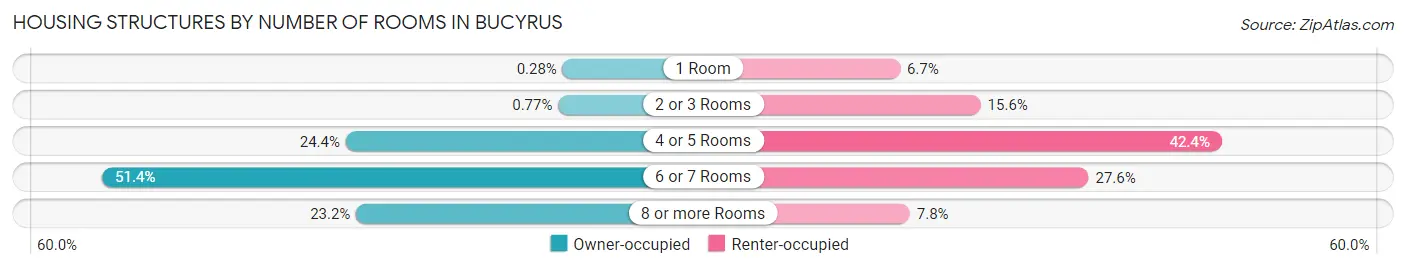
| Number of Rooms | Owner-occupied | Renter-occupied |
| 1 Room | 9 (0.3%) | 128 (6.7%) |
| 2 or 3 Rooms | 25 (0.8%) | 300 (15.6%) |
| 4 or 5 Rooms | 786 (24.3%) | 814 (42.4%) |
| 6 or 7 Rooms | 1,659 (51.4%) | 530 (27.6%) |
| 8 or more Rooms | 749 (23.2%) | 149 (7.8%) |
| Total | 3,228 (100.0%) | 1,921 (100.0%) |
Housing Structure by Heating Type in Bucyrus
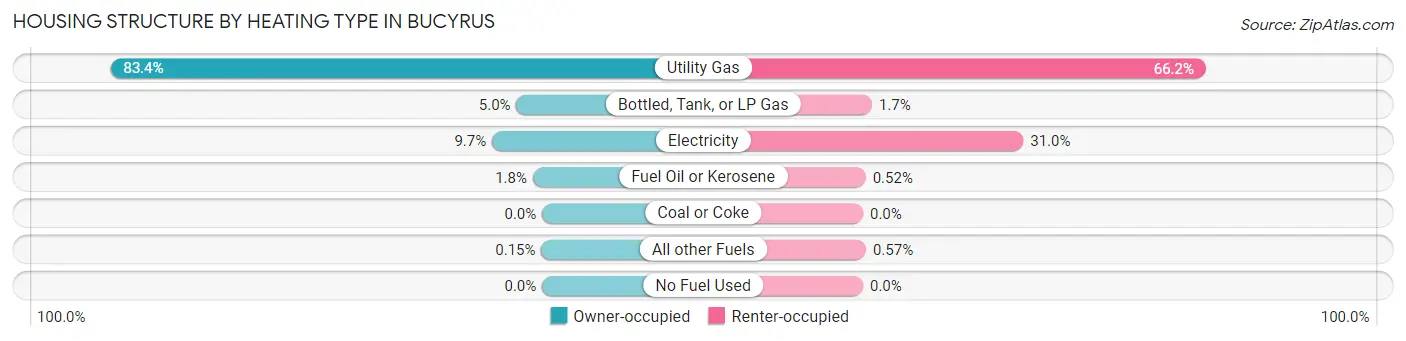
| Heating Type | Owner-occupied | Renter-occupied |
| Utility Gas | 2,693 (83.4%) | 1,272 (66.2%) |
| Bottled, Tank, or LP Gas | 160 (5.0%) | 33 (1.7%) |
| Electricity | 312 (9.7%) | 595 (31.0%) |
| Fuel Oil or Kerosene | 58 (1.8%) | 10 (0.5%) |
| Coal or Coke | 0 (0.0%) | 0 (0.0%) |
| All other Fuels | 5 (0.2%) | 11 (0.6%) |
| No Fuel Used | 0 (0.0%) | 0 (0.0%) |
| Total | 3,228 (100.0%) | 1,921 (100.0%) |
Household Vehicle Usage in Bucyrus
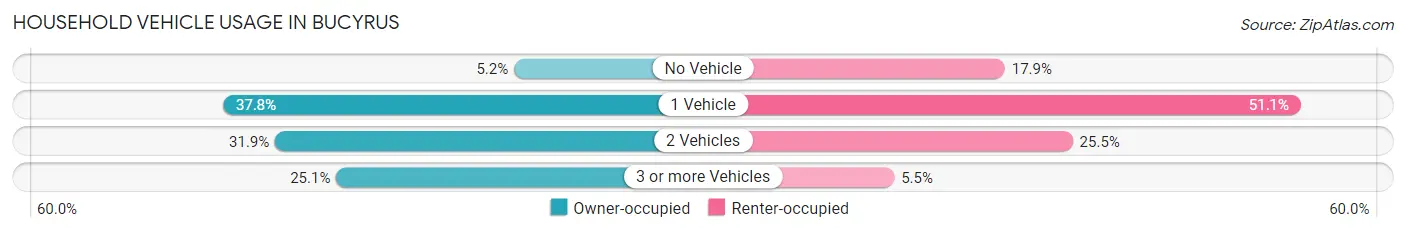
| Vehicles per Household | Owner-occupied | Renter-occupied |
| No Vehicle | 167 (5.2%) | 344 (17.9%) |
| 1 Vehicle | 1,220 (37.8%) | 981 (51.1%) |
| 2 Vehicles | 1,031 (31.9%) | 490 (25.5%) |
| 3 or more Vehicles | 810 (25.1%) | 106 (5.5%) |
| Total | 3,228 (100.0%) | 1,921 (100.0%) |
Real Estate & Mortgages in Bucyrus
Real Estate and Mortgage Overview in Bucyrus
| Characteristic | Without Mortgage | With Mortgage |
| Housing Units | 1,258 | 1,970 |
| Median Property Value | $99,900 | $117,800 |
| Median Household Income | $50,676 | $251 |
| Monthly Housing Costs | $423 | $0 |
| Real Estate Taxes | $1,338 | $90 |
Property Value by Mortgage Status in Bucyrus
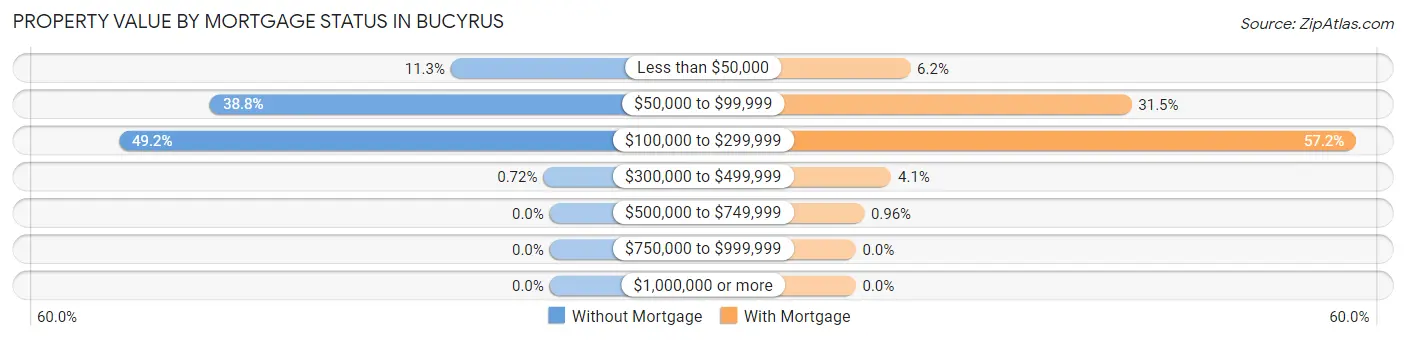
| Property Value | Without Mortgage | With Mortgage |
| Less than $50,000 | 142 (11.3%) | 123 (6.2%) |
| $50,000 to $99,999 | 488 (38.8%) | 621 (31.5%) |
| $100,000 to $299,999 | 619 (49.2%) | 1,127 (57.2%) |
| $300,000 to $499,999 | 9 (0.7%) | 80 (4.1%) |
| $500,000 to $749,999 | 0 (0.0%) | 19 (1.0%) |
| $750,000 to $999,999 | 0 (0.0%) | 0 (0.0%) |
| $1,000,000 or more | 0 (0.0%) | 0 (0.0%) |
| Total | 1,258 (100.0%) | 1,970 (100.0%) |
Household Income by Mortgage Status in Bucyrus
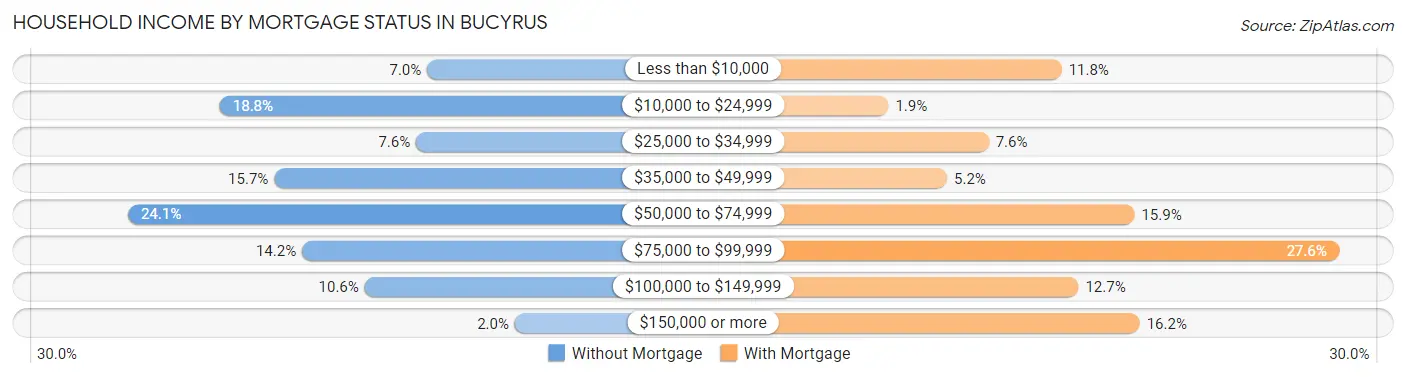
| Household Income | Without Mortgage | With Mortgage |
| Less than $10,000 | 88 (7.0%) | 232 (11.8%) |
| $10,000 to $24,999 | 237 (18.8%) | 37 (1.9%) |
| $25,000 to $34,999 | 96 (7.6%) | 150 (7.6%) |
| $35,000 to $49,999 | 198 (15.7%) | 103 (5.2%) |
| $50,000 to $74,999 | 303 (24.1%) | 314 (15.9%) |
| $75,000 to $99,999 | 178 (14.1%) | 544 (27.6%) |
| $100,000 to $149,999 | 133 (10.6%) | 251 (12.7%) |
| $150,000 or more | 25 (2.0%) | 320 (16.2%) |
| Total | 1,258 (100.0%) | 1,970 (100.0%) |
Property Value to Household Income Ratio in Bucyrus
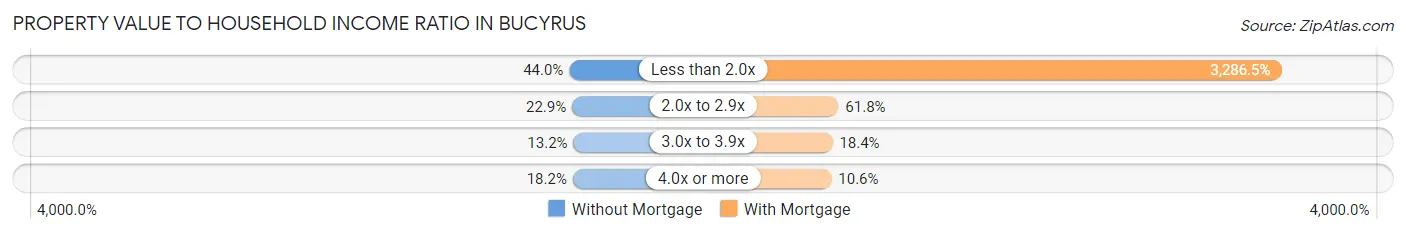
| Value-to-Income Ratio | Without Mortgage | With Mortgage |
| Less than 2.0x | 553 (44.0%) | 64,744 (3,286.5%) |
| 2.0x to 2.9x | 288 (22.9%) | 1,218 (61.8%) |
| 3.0x to 3.9x | 166 (13.2%) | 363 (18.4%) |
| 4.0x or more | 229 (18.2%) | 208 (10.6%) |
| Total | 1,258 (100.0%) | 1,970 (100.0%) |
Real Estate Taxes by Mortgage Status in Bucyrus
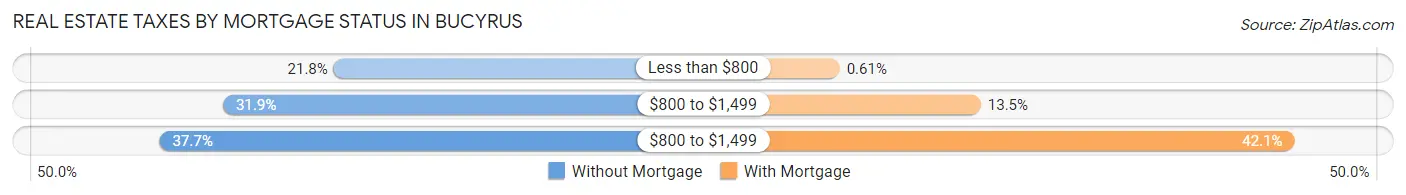
| Property Taxes | Without Mortgage | With Mortgage |
| Less than $800 | 274 (21.8%) | 12 (0.6%) |
| $800 to $1,499 | 401 (31.9%) | 266 (13.5%) |
| $800 to $1,499 | 474 (37.7%) | 830 (42.1%) |
| Total | 1,258 (100.0%) | 1,970 (100.0%) |
Health & Disability in Bucyrus
Health Insurance Coverage by Age in Bucyrus
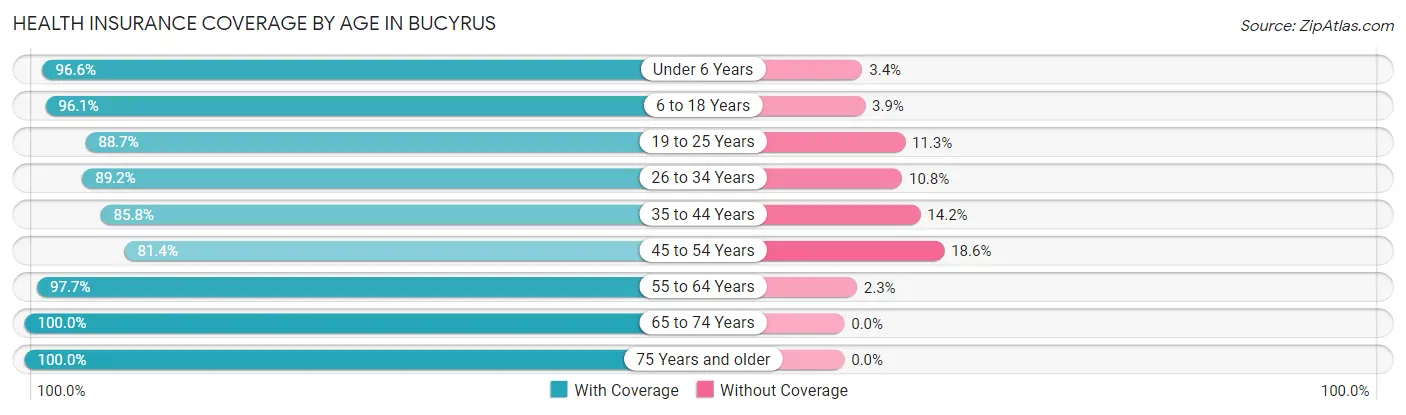
| Age Bracket | With Coverage | Without Coverage |
| Under 6 Years | 946 (96.6%) | 33 (3.4%) |
| 6 to 18 Years | 1,683 (96.1%) | 68 (3.9%) |
| 19 to 25 Years | 783 (88.7%) | 100 (11.3%) |
| 26 to 34 Years | 1,309 (89.2%) | 158 (10.8%) |
| 35 to 44 Years | 980 (85.8%) | 162 (14.2%) |
| 45 to 54 Years | 1,026 (81.4%) | 235 (18.6%) |
| 55 to 64 Years | 1,416 (97.7%) | 34 (2.3%) |
| 65 to 74 Years | 1,194 (100.0%) | 0 (0.0%) |
| 75 Years and older | 1,271 (100.0%) | 0 (0.0%) |
| Total | 10,608 (93.1%) | 790 (6.9%) |
Health Insurance Coverage by Citizenship Status in Bucyrus
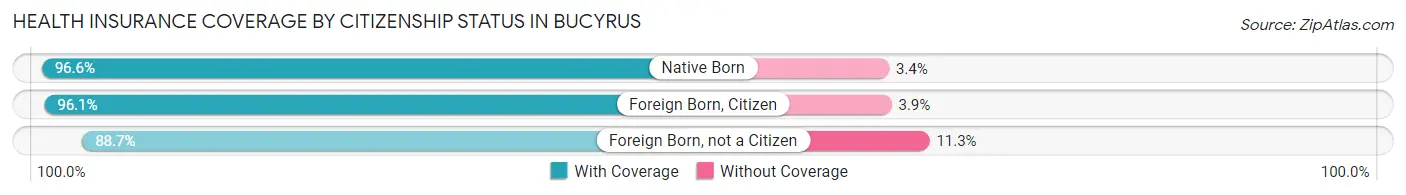
| Citizenship Status | With Coverage | Without Coverage |
| Native Born | 946 (96.6%) | 33 (3.4%) |
| Foreign Born, Citizen | 1,683 (96.1%) | 68 (3.9%) |
| Foreign Born, not a Citizen | 783 (88.7%) | 100 (11.3%) |
Health Insurance Coverage by Household Income in Bucyrus
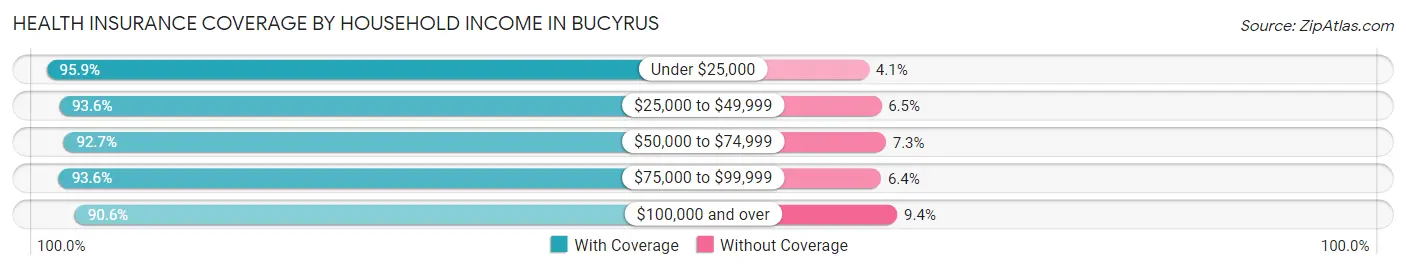
| Household Income | With Coverage | Without Coverage |
| Under $25,000 | 1,991 (95.9%) | 86 (4.1%) |
| $25,000 to $49,999 | 2,496 (93.5%) | 172 (6.5%) |
| $50,000 to $74,999 | 2,372 (92.7%) | 187 (7.3%) |
| $75,000 to $99,999 | 1,184 (93.6%) | 81 (6.4%) |
| $100,000 and over | 2,536 (90.6%) | 264 (9.4%) |
Public vs Private Health Insurance Coverage by Age in Bucyrus
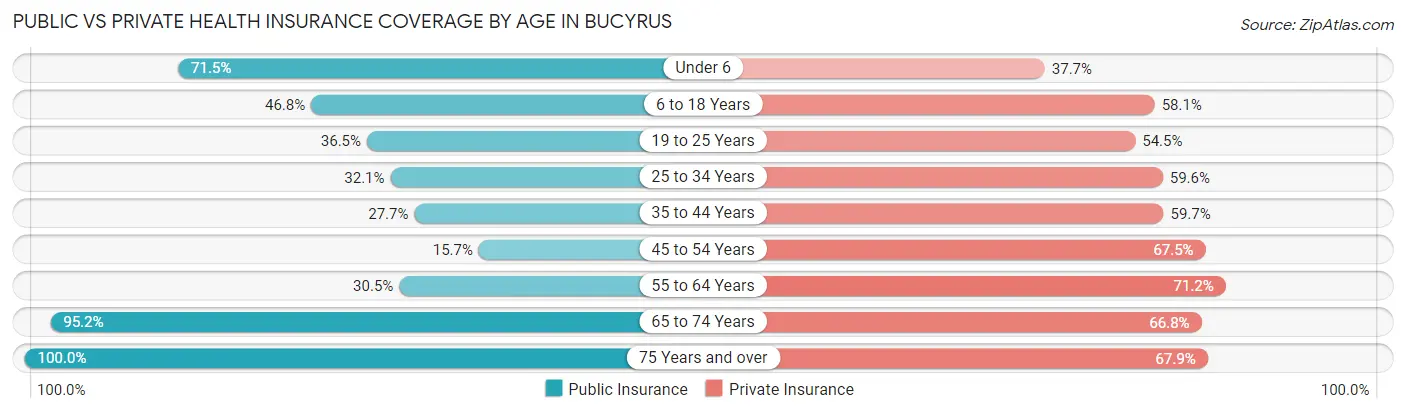
| Age Bracket | Public Insurance | Private Insurance |
| Under 6 | 700 (71.5%) | 369 (37.7%) |
| 6 to 18 Years | 820 (46.8%) | 1,017 (58.1%) |
| 19 to 25 Years | 322 (36.5%) | 481 (54.5%) |
| 25 to 34 Years | 471 (32.1%) | 874 (59.6%) |
| 35 to 44 Years | 316 (27.7%) | 682 (59.7%) |
| 45 to 54 Years | 198 (15.7%) | 851 (67.5%) |
| 55 to 64 Years | 442 (30.5%) | 1,033 (71.2%) |
| 65 to 74 Years | 1,137 (95.2%) | 797 (66.7%) |
| 75 Years and over | 1,271 (100.0%) | 863 (67.9%) |
| Total | 5,677 (49.8%) | 6,967 (61.1%) |
Disability Status by Sex by Age in Bucyrus
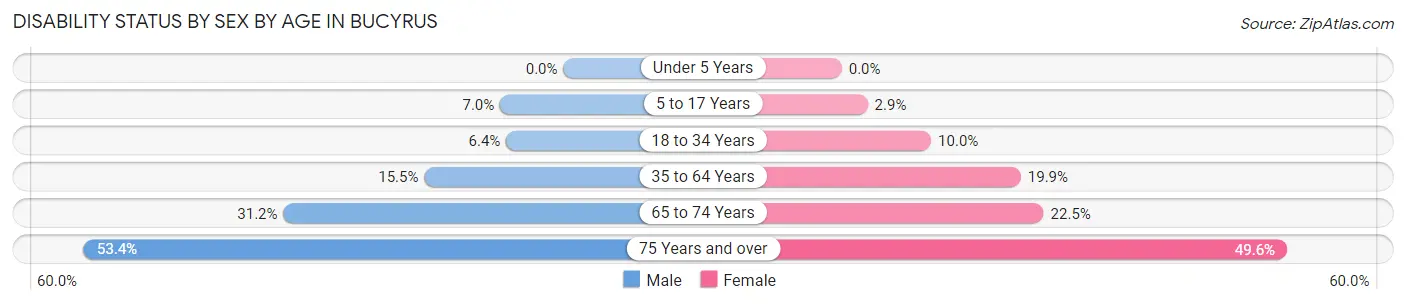
| Age Bracket | Male | Female |
| Under 5 Years | 0 (0.0%) | 0 (0.0%) |
| 5 to 17 Years | 84 (7.0%) | 20 (2.9%) |
| 18 to 34 Years | 70 (6.4%) | 135 (10.0%) |
| 35 to 64 Years | 304 (15.5%) | 377 (19.9%) |
| 65 to 74 Years | 174 (31.2%) | 143 (22.5%) |
| 75 Years and over | 307 (53.4%) | 345 (49.6%) |
Disability Class by Sex by Age in Bucyrus
Disability Class: Hearing Difficulty
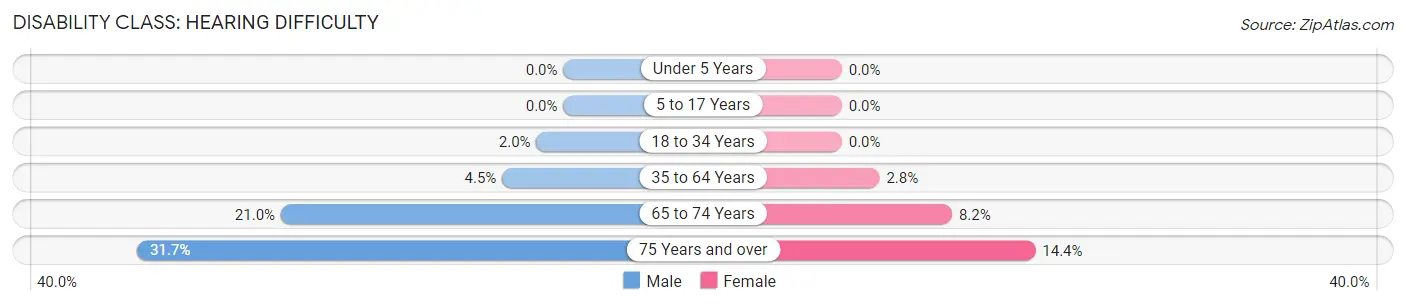
| Age Bracket | Male | Female |
| Under 5 Years | 0 (0.0%) | 0 (0.0%) |
| 5 to 17 Years | 0 (0.0%) | 0 (0.0%) |
| 18 to 34 Years | 22 (2.0%) | 0 (0.0%) |
| 35 to 64 Years | 89 (4.5%) | 53 (2.8%) |
| 65 to 74 Years | 117 (21.0%) | 52 (8.2%) |
| 75 Years and over | 182 (31.7%) | 100 (14.4%) |
Disability Class: Vision Difficulty
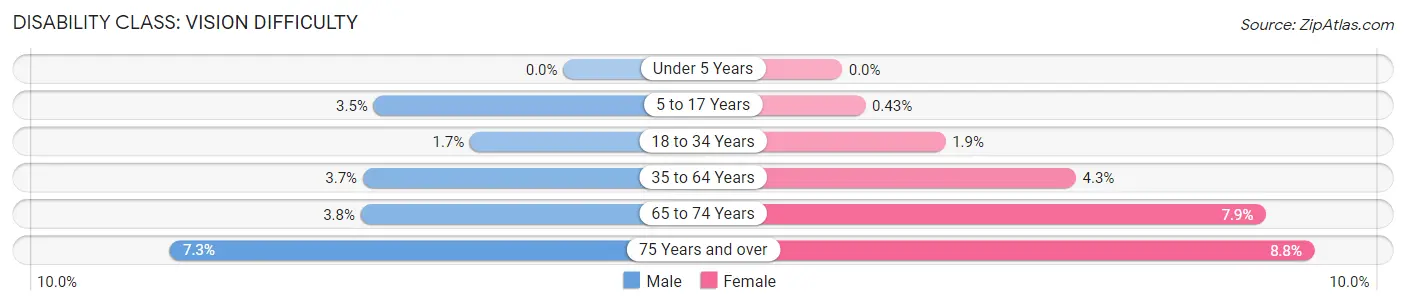
| Age Bracket | Male | Female |
| Under 5 Years | 0 (0.0%) | 0 (0.0%) |
| 5 to 17 Years | 42 (3.5%) | 3 (0.4%) |
| 18 to 34 Years | 19 (1.7%) | 26 (1.9%) |
| 35 to 64 Years | 73 (3.7%) | 82 (4.3%) |
| 65 to 74 Years | 21 (3.8%) | 50 (7.9%) |
| 75 Years and over | 42 (7.3%) | 61 (8.8%) |
Disability Class: Cognitive Difficulty
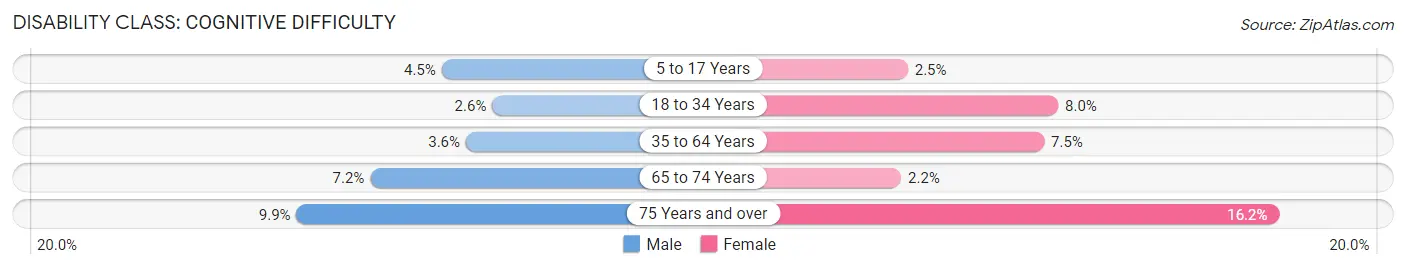
| Age Bracket | Male | Female |
| 5 to 17 Years | 54 (4.5%) | 17 (2.5%) |
| 18 to 34 Years | 29 (2.6%) | 109 (8.0%) |
| 35 to 64 Years | 71 (3.6%) | 142 (7.5%) |
| 65 to 74 Years | 40 (7.2%) | 14 (2.2%) |
| 75 Years and over | 57 (9.9%) | 113 (16.2%) |
Disability Class: Ambulatory Difficulty
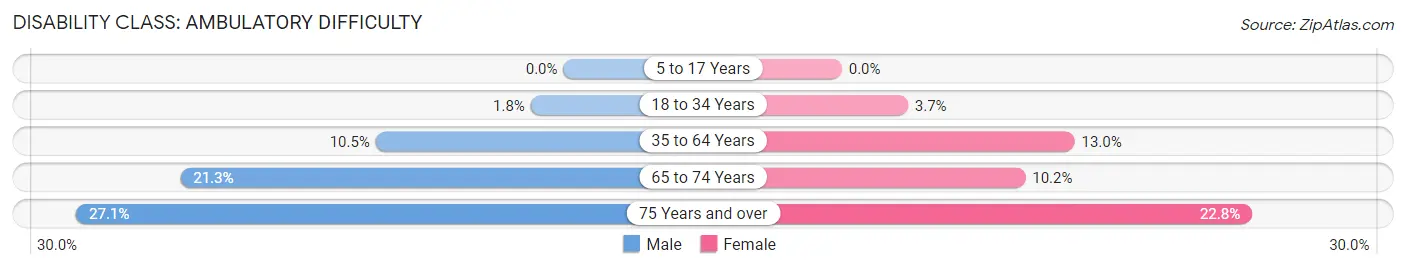
| Age Bracket | Male | Female |
| 5 to 17 Years | 0 (0.0%) | 0 (0.0%) |
| 18 to 34 Years | 20 (1.8%) | 50 (3.7%) |
| 35 to 64 Years | 205 (10.4%) | 245 (13.0%) |
| 65 to 74 Years | 119 (21.3%) | 65 (10.2%) |
| 75 Years and over | 156 (27.1%) | 159 (22.8%) |
Disability Class: Self-Care Difficulty
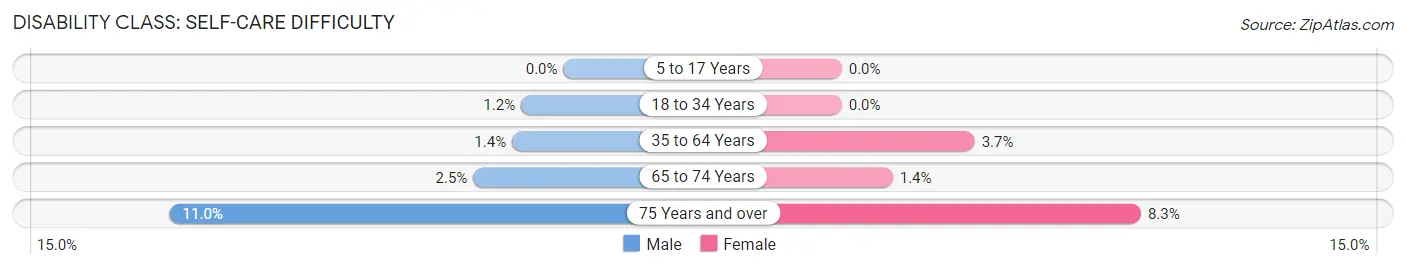
| Age Bracket | Male | Female |
| 5 to 17 Years | 0 (0.0%) | 0 (0.0%) |
| 18 to 34 Years | 13 (1.2%) | 0 (0.0%) |
| 35 to 64 Years | 28 (1.4%) | 70 (3.7%) |
| 65 to 74 Years | 14 (2.5%) | 9 (1.4%) |
| 75 Years and over | 63 (11.0%) | 58 (8.3%) |
Technology Access in Bucyrus
Computing Device Access in Bucyrus
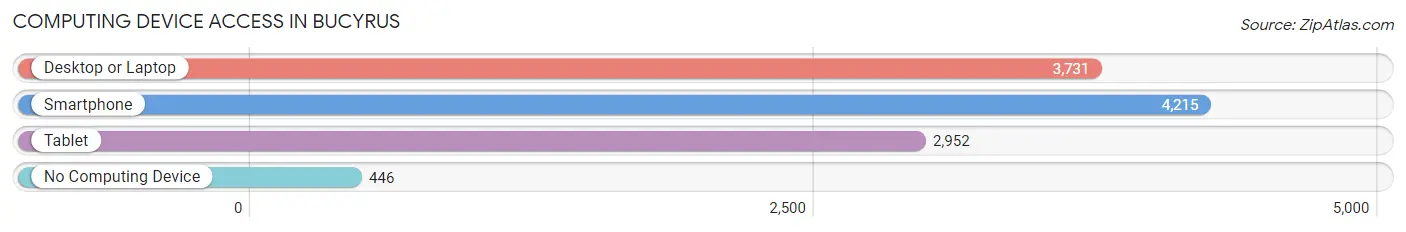
| Device Type | # Households | % Households |
| Desktop or Laptop | 3,731 | 72.5% |
| Smartphone | 4,215 | 81.9% |
| Tablet | 2,952 | 57.3% |
| No Computing Device | 446 | 8.7% |
| Total | 5,149 | 100.0% |
Internet Access in Bucyrus
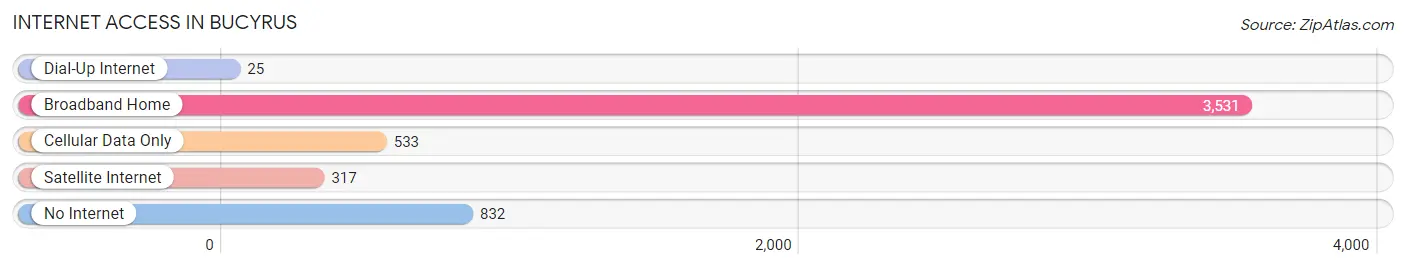
| Internet Type | # Households | % Households |
| Dial-Up Internet | 25 | 0.5% |
| Broadband Home | 3,531 | 68.6% |
| Cellular Data Only | 533 | 10.3% |
| Satellite Internet | 317 | 6.2% |
| No Internet | 832 | 16.2% |
| Total | 5,149 | 100.0% |
Bucyrus Summary
Bucyrus is a city located in the state of Ohio, United States. It is the county seat of Crawford County and is located in the north-central part of the state. The city is situated on the Sandusky River, approximately 50 miles north of Columbus. As of the 2010 census, the city had a population of 12,362.
History
The area that is now Bucyrus was first settled in 1822 by John and William Walker. The town was originally known as "Walker's Mill" and was later renamed "Bucyrus" after the Greek god of the same name. The town was officially incorporated in 1837.
In the late 19th century, Bucyrus was a major center for the production of coal mining equipment. The city was home to several major manufacturers, including the Bucyrus Steam Shovel Company, which produced the first steam shovels used in the coal mining industry.
Geography
Bucyrus is located at 40°48'N 82°59'W (40.80, -82.98). According to the United States Census Bureau, the city has a total area of 8.2 square miles (21.2 km2), of which 8.1 square miles (21.0 km2) is land and 0.1 square miles (0.2 km2) is water.
Economy
Bucyrus is a major center for the production of coal mining equipment. The city is home to several major manufacturers, including the Bucyrus Steam Shovel Company, which produces the first steam shovels used in the coal mining industry. The city is also home to several other manufacturing companies, including the Bucyrus Foundry and Machine Company, which produces a variety of industrial products.
The city is also home to several retail stores, including a Walmart Supercenter, a Kroger grocery store, and several other smaller stores. The city also has a variety of restaurants, including several fast food restaurants, a few sit-down restaurants, and several bars and pubs.
Demographics
As of the 2010 census, there were 12,362 people, 5,093 households, and 3,092 families residing in the city. The population density was 1,521.3 people per square mile (586.2/km2). There were 5,619 housing units at an average density of 694.3 per square mile (268.3/km2). The racial makeup of the city was 97.2% White, 0.7% African American, 0.2% Native American, 0.4% Asian, 0.2% from other races, and 1.3% from two or more races. Hispanic or Latino of any race were 1.2% of the population.
There were 5,093 households, out of which 28.2% had children under the age of 18 living with them, 43.2% were married couples living together, 13.7% had a female householder with no husband present, and 38.2% were non-families. 33.2% of all households were made up of individuals, and 15.2% had someone living alone who was 65 years of age or older. The average household size was 2.30 and the average family size was 2.90.
In the city, the population was spread out, with 23.7% under the age of 18, 8.2% from 18 to 24, 25.7% from 25 to 44, 23.3% from 45 to 64, and 19.1% who were 65 years of age or older. The median age was 39 years. For every 100 females, there were 87.2 males. For every 100 females age 18 and over, there were 82.7 males.
The median income for a household in the city was $30,945, and the median income for a family was $38,945. Males had a median income of $31,945 versus $21,945 for females. The per capita income for the city was $16,945. About 11.2% of families and 14.2% of the population were below the poverty line, including 19.2% of those under age 18 and 8.2% of those age 65 or over.
Common Questions
What is Per Capita Income in Bucyrus?
Per Capita income in Bucyrus is $27,775.
What is the Median Family Income in Bucyrus?
Median Family Income in Bucyrus is $56,667.
What is the Median Household income in Bucyrus?
Median Household Income in Bucyrus is $49,021.
What is Income or Wage Gap in Bucyrus?
Income or Wage Gap in Bucyrus is 36.4%.
Women in Bucyrus earn 63.6 cents for every dollar earned by a man.
What is Inequality or Gini Index in Bucyrus?
Inequality or Gini Index in Bucyrus is 0.43.
What is the Total Population of Bucyrus?
Total Population of Bucyrus is 11,643.
What is the Total Male Population of Bucyrus?
Total Male Population of Bucyrus is 5,877.
What is the Total Female Population of Bucyrus?
Total Female Population of Bucyrus is 5,766.
What is the Ratio of Males per 100 Females in Bucyrus?
There are 101.93 Males per 100 Females in Bucyrus.
What is the Ratio of Females per 100 Males in Bucyrus?
There are 98.11 Females per 100 Males in Bucyrus.
What is the Median Population Age in Bucyrus?
Median Population Age in Bucyrus is 41.4 Years.
What is the Average Family Size in Bucyrus
Average Family Size in Bucyrus is 2.8 People.
What is the Average Household Size in Bucyrus
Average Household Size in Bucyrus is 2.2 People.
How Large is the Labor Force in Bucyrus?
There are 5,446 People in the Labor Forcein in Bucyrus.
What is the Percentage of People in the Labor Force in Bucyrus?
58.8% of People are in the Labor Force in Bucyrus.
What is the Unemployment Rate in Bucyrus?
Unemployment Rate in Bucyrus is 7.6%.