Englewood, OH Map & Demographics
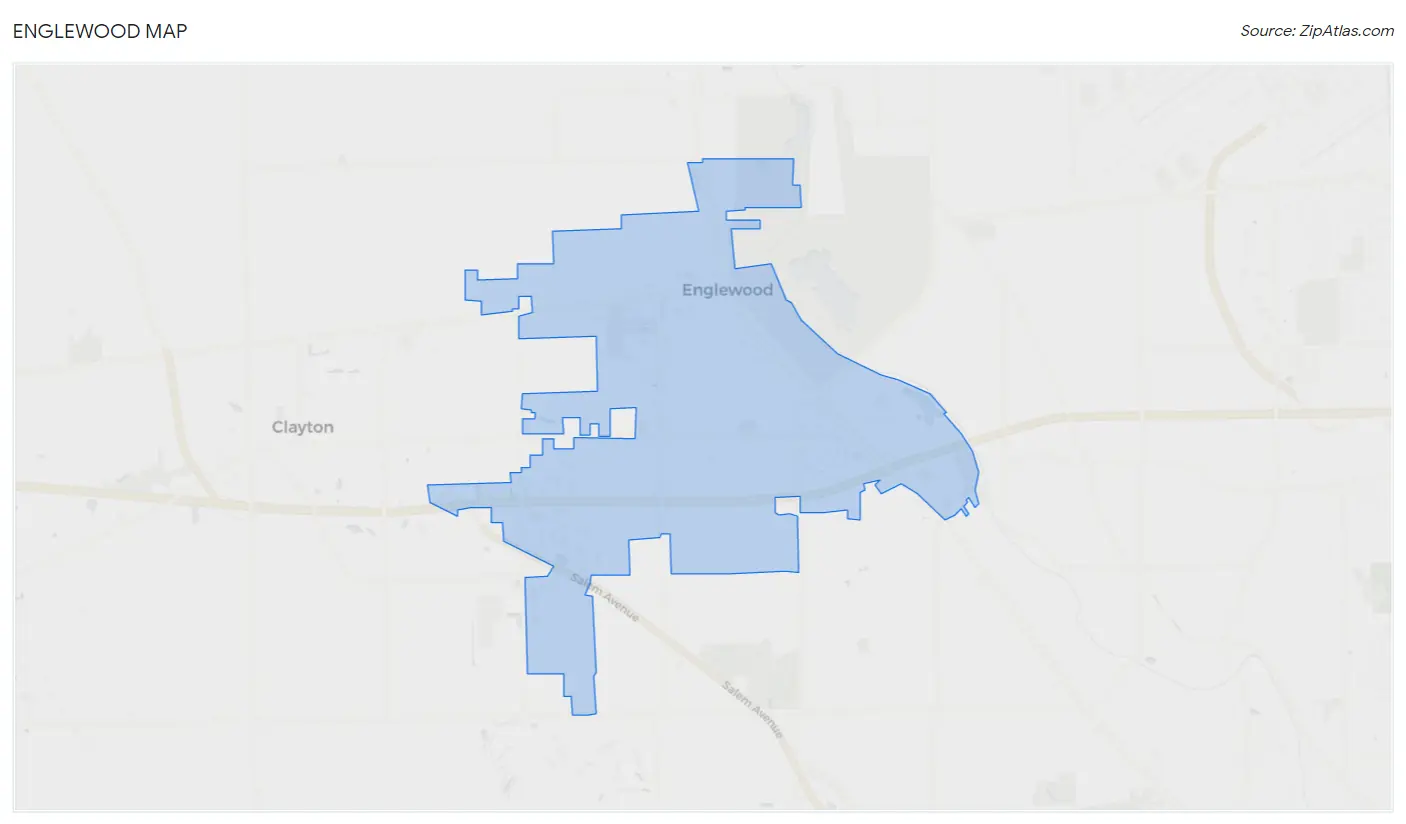
Englewood Map
Englewood Overview
$37,070
PER CAPITA INCOME
$92,500
AVG FAMILY INCOME
$67,769
AVG HOUSEHOLD INCOME
21.1%
WAGE / INCOME GAP [ % ]
78.9¢/ $1
WAGE / INCOME GAP [ $ ]
0.42
INEQUALITY / GINI INDEX
13,433
TOTAL POPULATION
6,206
MALE POPULATION
7,227
FEMALE POPULATION
85.87
MALES / 100 FEMALES
116.45
FEMALES / 100 MALES
43.1
MEDIAN AGE
3.1
AVG FAMILY SIZE
2.3
AVG HOUSEHOLD SIZE
6,423
LABOR FORCE [ PEOPLE ]
61.7%
PERCENT IN LABOR FORCE
4.6%
UNEMPLOYMENT RATE
Englewood Zip Codes
Englewood Area Codes
Income in Englewood
Income Overview in Englewood
Per Capita Income in Englewood is $37,070, while median incomes of families and households are $92,500 and $67,769 respectively.
| Characteristic | Number | Measure |
| Per Capita Income | 13,433 | $37,070 |
| Median Family Income | 3,404 | $92,500 |
| Mean Family Income | 3,404 | $110,822 |
| Median Household Income | 5,636 | $67,769 |
| Mean Household Income | 5,636 | $85,686 |
| Income Deficit | 3,404 | $0 |
| Wage / Income Gap (%) | 13,433 | 21.06% |
| Wage / Income Gap ($) | 13,433 | 78.94¢ per $1 |
| Gini / Inequality Index | 13,433 | 0.42 |
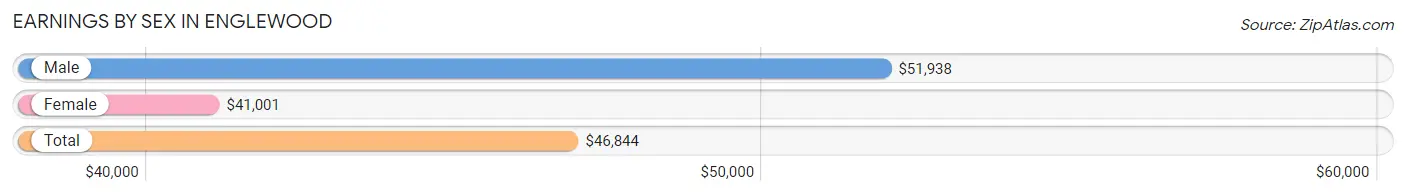
Earnings by Sex in Englewood
Average Earnings in Englewood are $46,844, $51,938 for men and $41,001 for women, a difference of 21.1%.
| Sex | Number | Average Earnings |
| Male | 3,212 (48.7%) | $51,938 |
| Female | 3,389 (51.3%) | $41,001 |
| Total | 6,601 (100.0%) | $46,844 |
Earnings by Sex by Income Bracket in Englewood
The most common earnings brackets in Englewood are $100,000+ for men (640 | 19.9%) and $75,000 to $99,999 for women (370 | 10.9%).
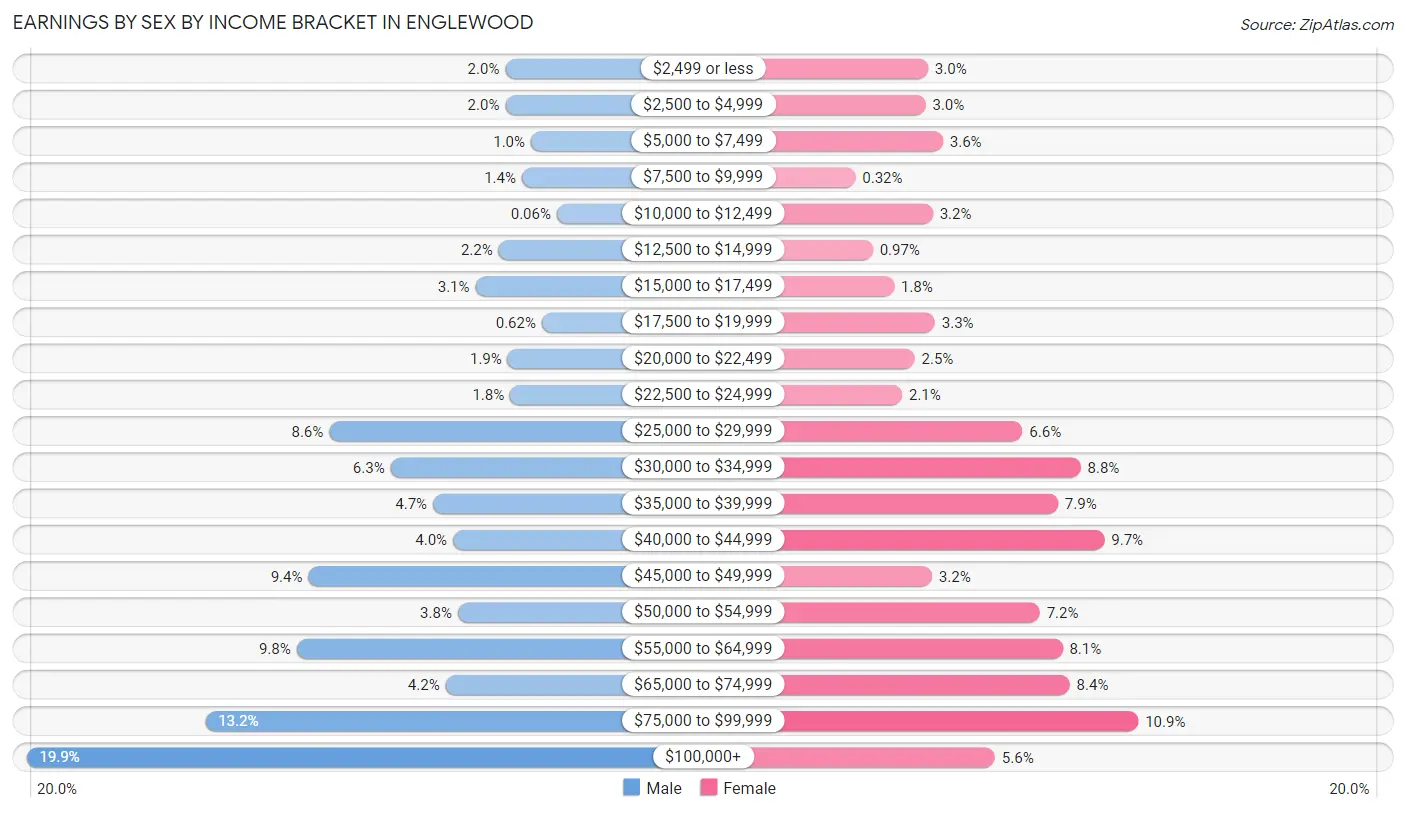
| Income | Male | Female |
| $2,499 or less | 64 (2.0%) | 103 (3.0%) |
| $2,500 to $4,999 | 64 (2.0%) | 100 (2.9%) |
| $5,000 to $7,499 | 33 (1.0%) | 122 (3.6%) |
| $7,500 to $9,999 | 44 (1.4%) | 11 (0.3%) |
| $10,000 to $12,499 | 2 (0.1%) | 109 (3.2%) |
| $12,500 to $14,999 | 72 (2.2%) | 33 (1.0%) |
| $15,000 to $17,499 | 100 (3.1%) | 60 (1.8%) |
| $17,500 to $19,999 | 20 (0.6%) | 112 (3.3%) |
| $20,000 to $22,499 | 61 (1.9%) | 86 (2.5%) |
| $22,500 to $24,999 | 58 (1.8%) | 70 (2.1%) |
| $25,000 to $29,999 | 276 (8.6%) | 223 (6.6%) |
| $30,000 to $34,999 | 202 (6.3%) | 297 (8.8%) |
| $35,000 to $39,999 | 151 (4.7%) | 268 (7.9%) |
| $40,000 to $44,999 | 127 (4.0%) | 327 (9.7%) |
| $45,000 to $49,999 | 301 (9.4%) | 108 (3.2%) |
| $50,000 to $54,999 | 121 (3.8%) | 245 (7.2%) |
| $55,000 to $64,999 | 315 (9.8%) | 274 (8.1%) |
| $65,000 to $74,999 | 136 (4.2%) | 283 (8.4%) |
| $75,000 to $99,999 | 425 (13.2%) | 370 (10.9%) |
| $100,000+ | 640 (19.9%) | 188 (5.6%) |
| Total | 3,212 (100.0%) | 3,389 (100.0%) |
Earnings by Sex by Educational Attainment in Englewood
Average earnings in Englewood are $60,103 for men and $42,845 for women, a difference of 28.7%. Men with an educational attainment of bachelor's degree enjoy the highest average annual earnings of $78,833, while those with high school diploma education earn the least with $46,572. Women with an educational attainment of graduate degree earn the most with the average annual earnings of $67,523, while those with high school diploma education have the smallest earnings of $34,013.
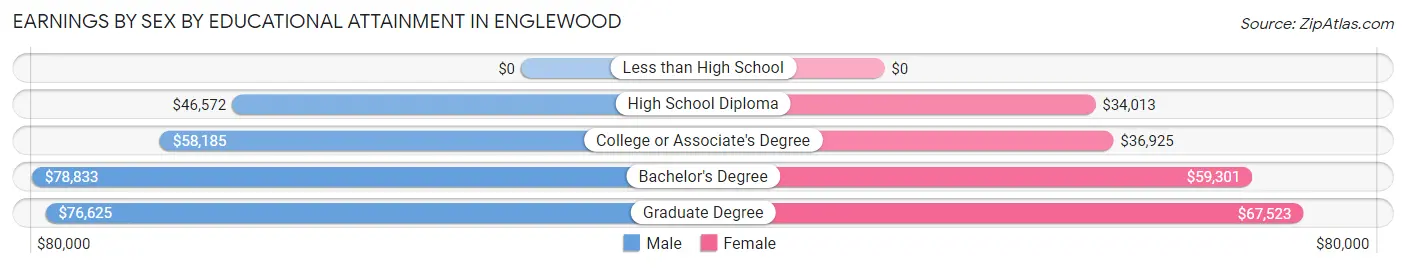
| Educational Attainment | Male Income | Female Income |
| Less than High School | - | - |
| High School Diploma | $46,572 | $34,013 |
| College or Associate's Degree | $58,185 | $36,925 |
| Bachelor's Degree | $78,833 | $59,301 |
| Graduate Degree | $76,625 | $67,523 |
| Total | $60,103 | $42,845 |
Family Income in Englewood
Family Income Brackets in Englewood
According to the Englewood family income data, there are 814 families falling into the $100,000 to $149,999 income range, which is the most common income bracket and makes up 23.9% of all families. Conversely, the less than $10,000 income bracket is the least frequent group with only 17 families (0.5%) belonging to this category.
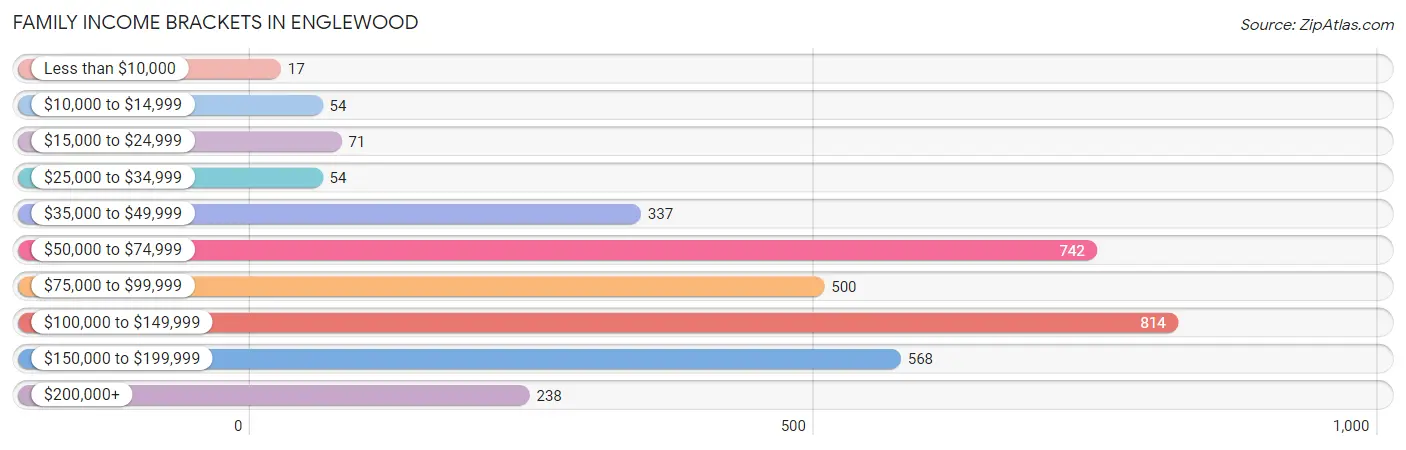
| Income Bracket | # Families | % Families |
| Less than $10,000 | 17 | 0.5% |
| $10,000 to $14,999 | 54 | 1.6% |
| $15,000 to $24,999 | 71 | 2.1% |
| $25,000 to $34,999 | 54 | 1.6% |
| $35,000 to $49,999 | 337 | 9.9% |
| $50,000 to $74,999 | 742 | 21.8% |
| $75,000 to $99,999 | 500 | 14.7% |
| $100,000 to $149,999 | 814 | 23.9% |
| $150,000 to $199,999 | 568 | 16.7% |
| $200,000+ | 238 | 7.0% |
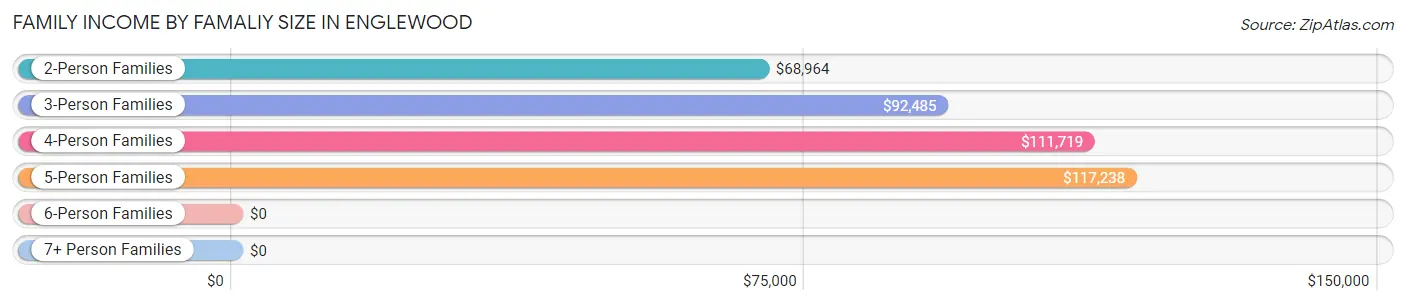
Family Income by Famaliy Size in Englewood
5-person families (499 | 14.7%) account for the highest median family income in Englewood with $117,238 per family, while 2-person families (1,775 | 52.1%) have the highest median income of $34,482 per family member.
| Income Bracket | # Families | Median Income |
| 2-Person Families | 1,775 (52.1%) | $68,964 |
| 3-Person Families | 579 (17.0%) | $92,485 |
| 4-Person Families | 458 (13.5%) | $111,719 |
| 5-Person Families | 499 (14.7%) | $117,238 |
| 6-Person Families | 44 (1.3%) | $0 |
| 7+ Person Families | 49 (1.4%) | $0 |
| Total | 3,404 (100.0%) | $92,500 |
Family Income by Number of Earners in Englewood
The median family income in Englewood is $92,500, with families comprising 3+ earners (424) having the highest median family income of $148,571, while families with no earners (545) have the lowest median family income of $58,616, accounting for 12.5% and 16.0% of families, respectively.
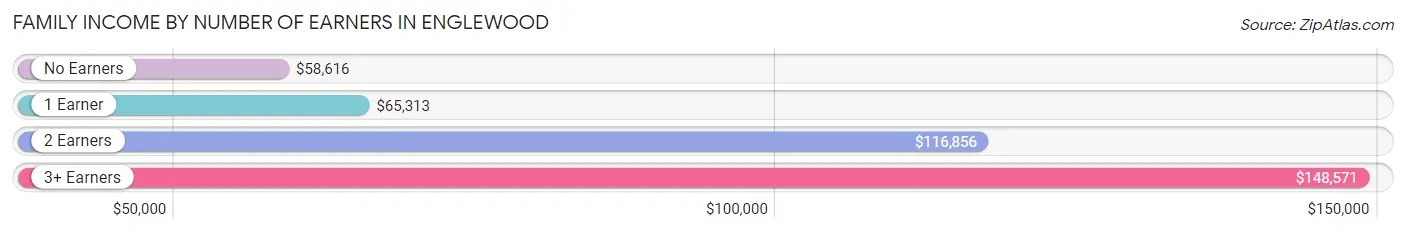
| Number of Earners | # Families | Median Income |
| No Earners | 545 (16.0%) | $58,616 |
| 1 Earner | 1,037 (30.5%) | $65,313 |
| 2 Earners | 1,398 (41.1%) | $116,856 |
| 3+ Earners | 424 (12.5%) | $148,571 |
| Total | 3,404 (100.0%) | $92,500 |
Household Income in Englewood
Household Income Brackets in Englewood
With 969 households falling in the category, the $50,000 to $74,999 income range is the most frequent in Englewood, accounting for 17.2% of all households. In contrast, only 135 households (2.4%) fall into the less than $10,000 income bracket, making it the least populous group.
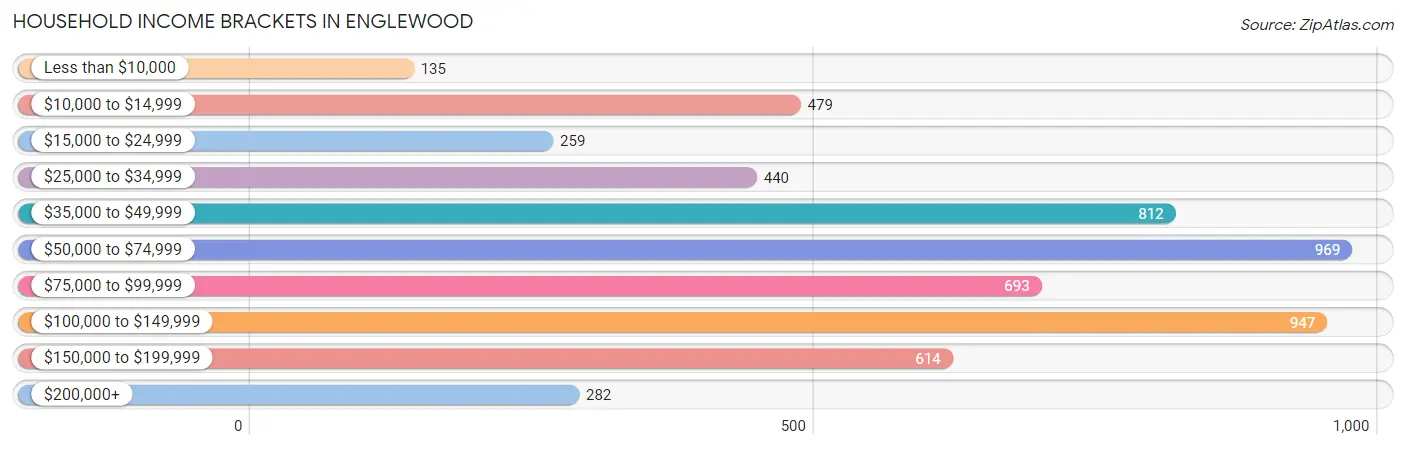
| Income Bracket | # Households | % Households |
| Less than $10,000 | 135 | 2.4% |
| $10,000 to $14,999 | 479 | 8.5% |
| $15,000 to $24,999 | 259 | 4.6% |
| $25,000 to $34,999 | 440 | 7.8% |
| $35,000 to $49,999 | 812 | 14.4% |
| $50,000 to $74,999 | 969 | 17.2% |
| $75,000 to $99,999 | 693 | 12.3% |
| $100,000 to $149,999 | 947 | 16.8% |
| $150,000 to $199,999 | 614 | 10.9% |
| $200,000+ | 282 | 5.0% |
Household Income by Householder Age in Englewood
The median household income in Englewood is $67,769, with the highest median household income of $89,167 found in the 25 to 44 years age bracket for the primary householder. A total of 1,564 households (27.8%) fall into this category. Meanwhile, the 15 to 24 years age bracket for the primary householder has the lowest median household income of $35,583, with 116 households (2.1%) in this group.
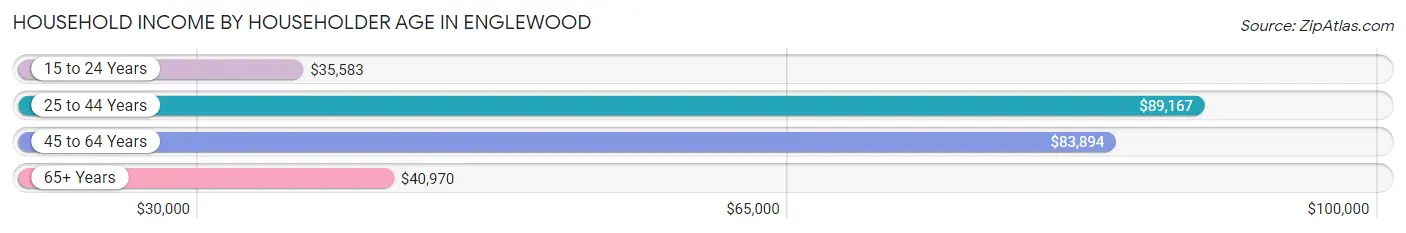
| Income Bracket | # Households | Median Income |
| 15 to 24 Years | 116 (2.1%) | $35,583 |
| 25 to 44 Years | 1,564 (27.8%) | $89,167 |
| 45 to 64 Years | 2,002 (35.5%) | $83,894 |
| 65+ Years | 1,954 (34.7%) | $40,970 |
| Total | 5,636 (100.0%) | $67,769 |
Poverty in Englewood
Income Below Poverty by Sex and Age in Englewood
With 5.6% poverty level for males and 4.4% for females among the residents of Englewood, 18 to 24 year old males and 75 year old and over females are the most vulnerable to poverty, with 88 males (17.3%) and 126 females (14.8%) in their respective age groups living below the poverty level.
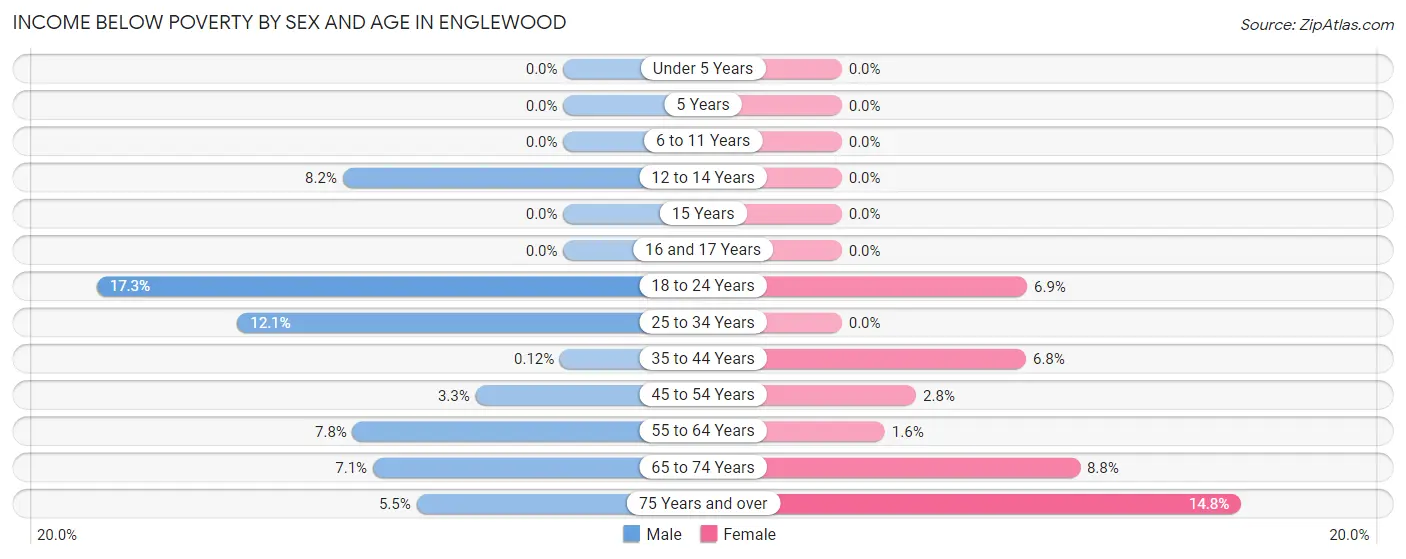
| Age Bracket | Male | Female |
| Under 5 Years | 0 (0.0%) | 0 (0.0%) |
| 5 Years | 0 (0.0%) | 0 (0.0%) |
| 6 to 11 Years | 0 (0.0%) | 0 (0.0%) |
| 12 to 14 Years | 19 (8.2%) | 0 (0.0%) |
| 15 Years | 0 (0.0%) | 0 (0.0%) |
| 16 and 17 Years | 0 (0.0%) | 0 (0.0%) |
| 18 to 24 Years | 88 (17.3%) | 19 (6.9%) |
| 25 to 34 Years | 72 (12.1%) | 0 (0.0%) |
| 35 to 44 Years | 1 (0.1%) | 54 (6.8%) |
| 45 to 54 Years | 22 (3.3%) | 18 (2.8%) |
| 55 to 64 Years | 72 (7.8%) | 18 (1.6%) |
| 65 to 74 Years | 52 (7.1%) | 71 (8.8%) |
| 75 Years and over | 18 (5.4%) | 126 (14.8%) |
| Total | 344 (5.6%) | 306 (4.4%) |
Income Above Poverty by Sex and Age in Englewood
According to the poverty statistics in Englewood, males aged under 5 years and females aged under 5 years are the age groups that are most secure financially, with 100.0% of males and 100.0% of females in these age groups living above the poverty line.
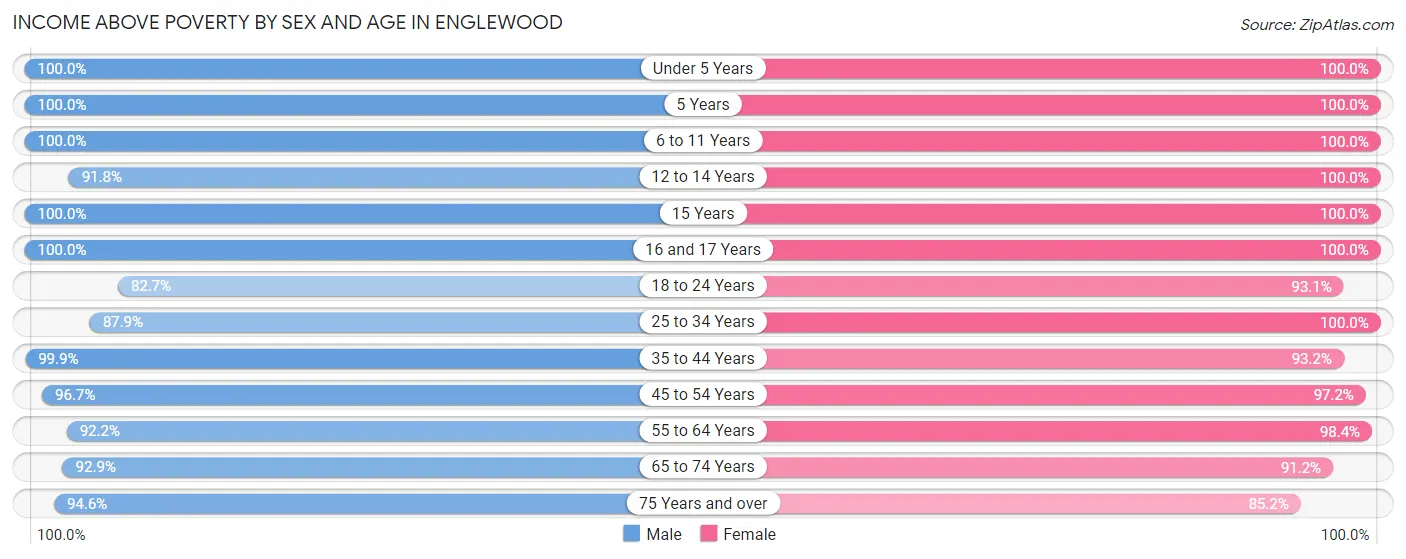
| Age Bracket | Male | Female |
| Under 5 Years | 269 (100.0%) | 566 (100.0%) |
| 5 Years | 176 (100.0%) | 102 (100.0%) |
| 6 to 11 Years | 654 (100.0%) | 472 (100.0%) |
| 12 to 14 Years | 213 (91.8%) | 285 (100.0%) |
| 15 Years | 65 (100.0%) | 111 (100.0%) |
| 16 and 17 Years | 131 (100.0%) | 129 (100.0%) |
| 18 to 24 Years | 420 (82.7%) | 257 (93.1%) |
| 25 to 34 Years | 523 (87.9%) | 797 (100.0%) |
| 35 to 44 Years | 815 (99.9%) | 736 (93.2%) |
| 45 to 54 Years | 652 (96.7%) | 634 (97.2%) |
| 55 to 64 Years | 849 (92.2%) | 1,105 (98.4%) |
| 65 to 74 Years | 683 (92.9%) | 732 (91.2%) |
| 75 Years and over | 312 (94.6%) | 724 (85.2%) |
| Total | 5,762 (94.4%) | 6,650 (95.6%) |
Income Below Poverty Among Married-Couple Families in Englewood
The poverty statistics for married-couple families in Englewood show that 0.7% or 18 of the total 2,539 families live below the poverty line. Families with no children have the highest poverty rate of 1.2%, comprising of 18 families. On the other hand, families with 1 or 2 children have the lowest poverty rate of 0.0%, which includes 0 families.
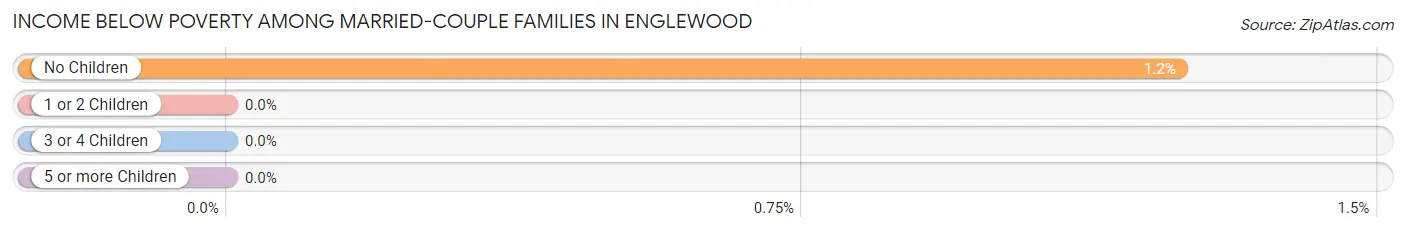
| Children | Above Poverty | Below Poverty |
| No Children | 1,439 (98.8%) | 18 (1.2%) |
| 1 or 2 Children | 662 (100.0%) | 0 (0.0%) |
| 3 or 4 Children | 371 (100.0%) | 0 (0.0%) |
| 5 or more Children | 49 (100.0%) | 0 (0.0%) |
| Total | 2,521 (99.3%) | 18 (0.7%) |
Income Below Poverty Among Single-Parent Households in Englewood
According to the poverty data in Englewood, 8.3% or 18 single-father households and 5.7% or 37 single-mother households are living below the poverty line. Among single-father households, those with no children have the highest poverty rate, with 18 households (14.4%) experiencing poverty. Likewise, among single-mother households, those with no children have the highest poverty rate, with 18 households (7.3%) falling below the poverty line.
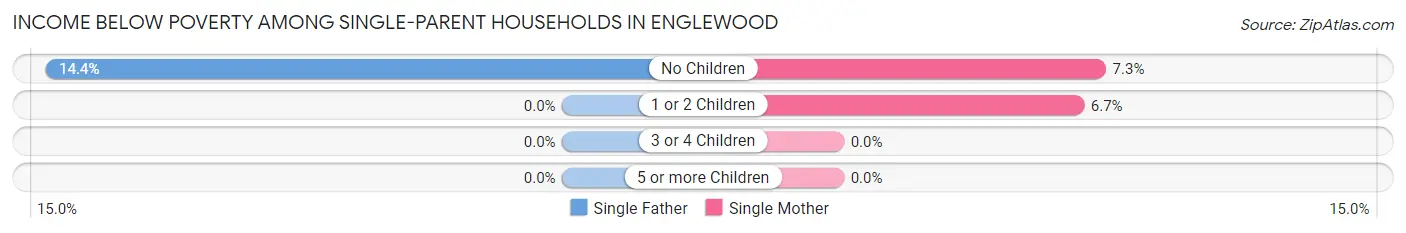
| Children | Single Father | Single Mother |
| No Children | 18 (14.4%) | 18 (7.3%) |
| 1 or 2 Children | 0 (0.0%) | 19 (6.7%) |
| 3 or 4 Children | 0 (0.0%) | 0 (0.0%) |
| 5 or more Children | 0 (0.0%) | 0 (0.0%) |
| Total | 18 (8.3%) | 37 (5.7%) |
Income Below Poverty Among Married-Couple vs Single-Parent Households in Englewood
The poverty data for Englewood shows that 18 of the married-couple family households (0.7%) and 55 of the single-parent households (6.4%) are living below the poverty level. Within the married-couple family households, those with no children have the highest poverty rate, with 18 households (1.2%) falling below the poverty line. Among the single-parent households, those with no children have the highest poverty rate, with 36 household (9.7%) living below poverty.
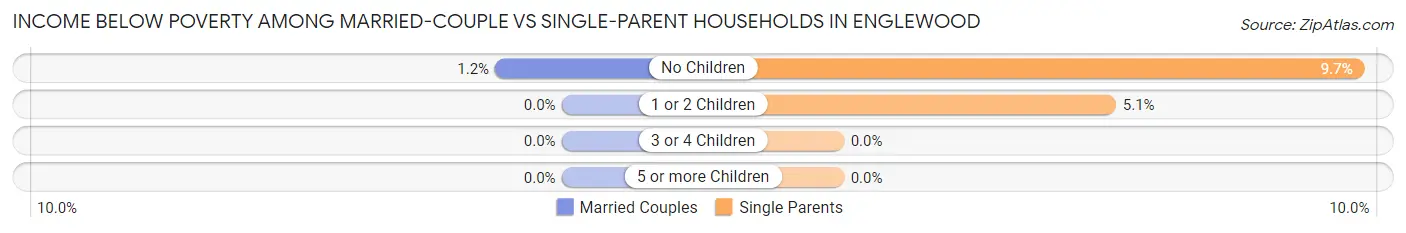
| Children | Married-Couple Families | Single-Parent Households |
| No Children | 18 (1.2%) | 36 (9.7%) |
| 1 or 2 Children | 0 (0.0%) | 19 (5.1%) |
| 3 or 4 Children | 0 (0.0%) | 0 (0.0%) |
| 5 or more Children | 0 (0.0%) | 0 (0.0%) |
| Total | 18 (0.7%) | 55 (6.4%) |
Race in Englewood
The most populous races in Englewood are White / Caucasian (10,373 | 77.2%), Black / African American (2,062 | 15.3%), and Two or more Races (834 | 6.2%).
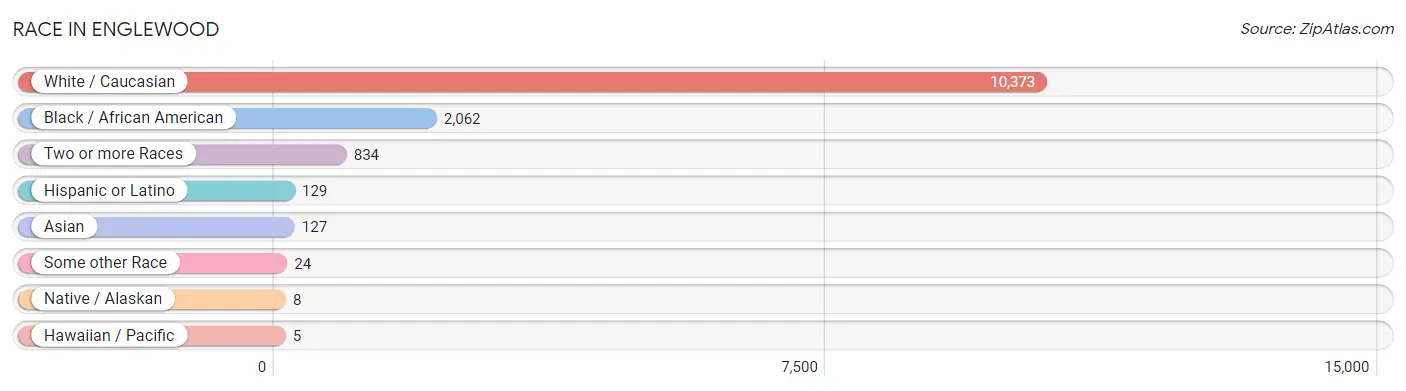
| Race | # Population | % Population |
| Asian | 127 | 0.9% |
| Black / African American | 2,062 | 15.3% |
| Hawaiian / Pacific | 5 | 0.0% |
| Hispanic or Latino | 129 | 1.0% |
| Native / Alaskan | 8 | 0.1% |
| White / Caucasian | 10,373 | 77.2% |
| Two or more Races | 834 | 6.2% |
| Some other Race | 24 | 0.2% |
| Total | 13,433 | 100.0% |
Ancestry in Englewood
The most populous ancestries reported in Englewood are German (3,104 | 23.1%), Irish (1,991 | 14.8%), English (1,987 | 14.8%), American (919 | 6.8%), and Italian (490 | 3.6%), together accounting for 63.2% of all Englewood residents.
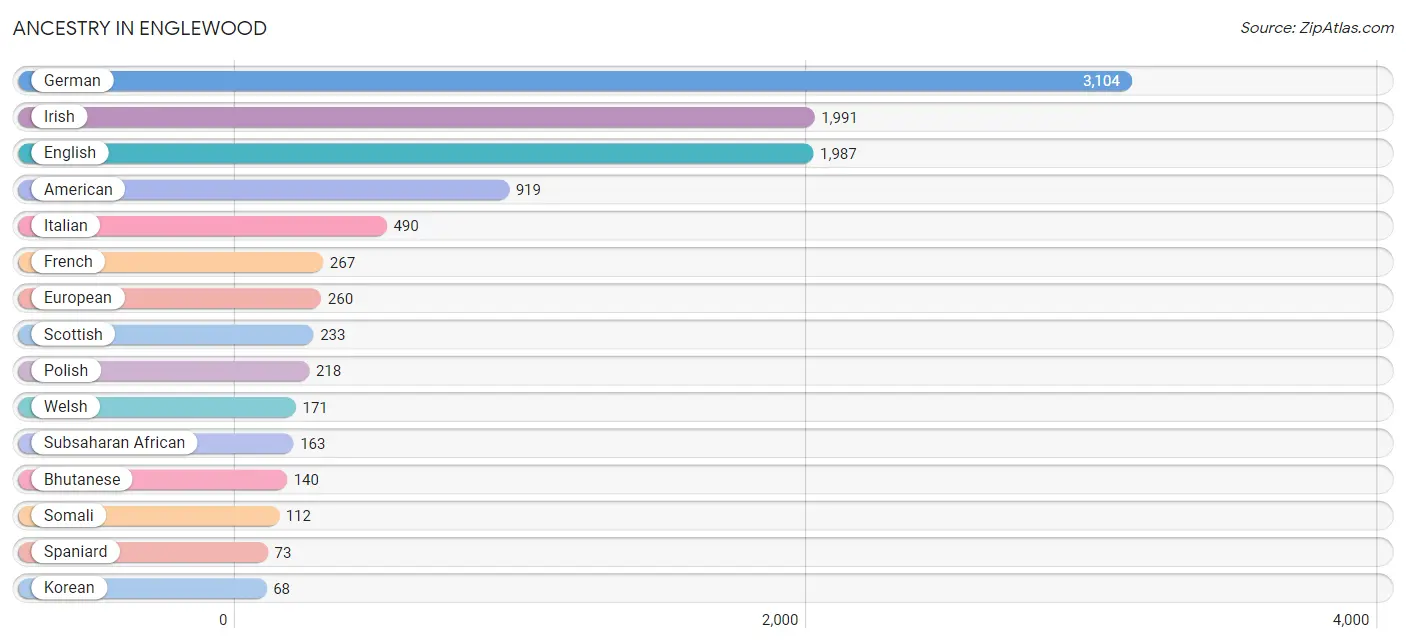
| Ancestry | # Population | % Population |
| African | 51 | 0.4% |
| American | 919 | 6.8% |
| Arab | 16 | 0.1% |
| Austrian | 34 | 0.3% |
| Barbadian | 18 | 0.1% |
| Bhutanese | 140 | 1.0% |
| Blackfeet | 21 | 0.2% |
| British | 49 | 0.4% |
| Burmese | 15 | 0.1% |
| Canadian | 14 | 0.1% |
| Central American | 18 | 0.1% |
| Croatian | 5 | 0.0% |
| Czechoslovakian | 31 | 0.2% |
| Dominican | 19 | 0.1% |
| Dutch | 59 | 0.4% |
| Eastern European | 18 | 0.1% |
| Egyptian | 16 | 0.1% |
| English | 1,987 | 14.8% |
| European | 260 | 1.9% |
| Filipino | 15 | 0.1% |
| French | 267 | 2.0% |
| French Canadian | 17 | 0.1% |
| German | 3,104 | 23.1% |
| Greek | 58 | 0.4% |
| Honduran | 18 | 0.1% |
| Hungarian | 63 | 0.5% |
| Indian (Asian) | 30 | 0.2% |
| Irish | 1,991 | 14.8% |
| Italian | 490 | 3.6% |
| Korean | 68 | 0.5% |
| Latvian | 20 | 0.2% |
| Lebanese | 16 | 0.1% |
| Mexican | 19 | 0.1% |
| Native Hawaiian | 5 | 0.0% |
| Navajo | 19 | 0.1% |
| Norwegian | 18 | 0.1% |
| Polish | 218 | 1.6% |
| Portuguese | 9 | 0.1% |
| Scandinavian | 41 | 0.3% |
| Scotch-Irish | 55 | 0.4% |
| Scottish | 233 | 1.7% |
| Slovak | 18 | 0.1% |
| Somali | 112 | 0.8% |
| Spaniard | 73 | 0.5% |
| Subsaharan African | 163 | 1.2% |
| Swedish | 22 | 0.2% |
| Swiss | 23 | 0.2% |
| Welsh | 171 | 1.3% | View All 48 Rows |
Immigrants in Englewood
The most numerous immigrant groups reported in Englewood came from Africa (146 | 1.1%), Asia (103 | 0.8%), Eastern Africa (90 | 0.7%), Eastern Asia (75 | 0.6%), and Japan (60 | 0.4%), together accounting for 3.5% of all Englewood residents.
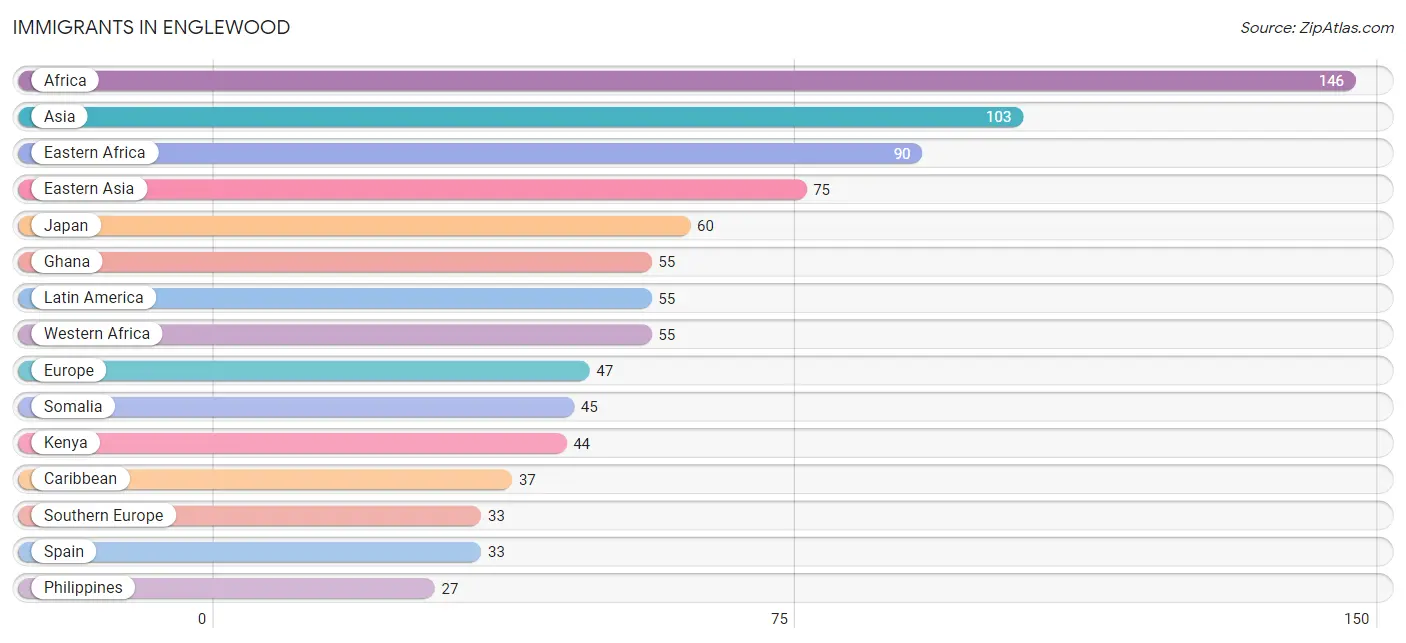
| Immigration Origin | # Population | % Population |
| Africa | 146 | 1.1% |
| Asia | 103 | 0.8% |
| Barbados | 18 | 0.1% |
| Caribbean | 37 | 0.3% |
| Central America | 18 | 0.1% |
| China | 15 | 0.1% |
| Congo | 1 | 0.0% |
| Dominican Republic | 19 | 0.1% |
| Eastern Africa | 90 | 0.7% |
| Eastern Asia | 75 | 0.6% |
| Europe | 47 | 0.4% |
| Germany | 14 | 0.1% |
| Ghana | 55 | 0.4% |
| Honduras | 18 | 0.1% |
| India | 1 | 0.0% |
| Japan | 60 | 0.4% |
| Kenya | 44 | 0.3% |
| Latin America | 55 | 0.4% |
| Middle Africa | 1 | 0.0% |
| Philippines | 27 | 0.2% |
| Somalia | 45 | 0.3% |
| South Central Asia | 1 | 0.0% |
| South Eastern Asia | 27 | 0.2% |
| Southern Europe | 33 | 0.3% |
| Spain | 33 | 0.3% |
| Western Africa | 55 | 0.4% |
| Western Europe | 14 | 0.1% | View All 27 Rows |
Sex and Age in Englewood
Sex and Age in Englewood
The most populous age groups in Englewood are 5 to 9 Years (594 | 9.6%) for men and 60 to 64 Years (634 | 8.8%) for women.
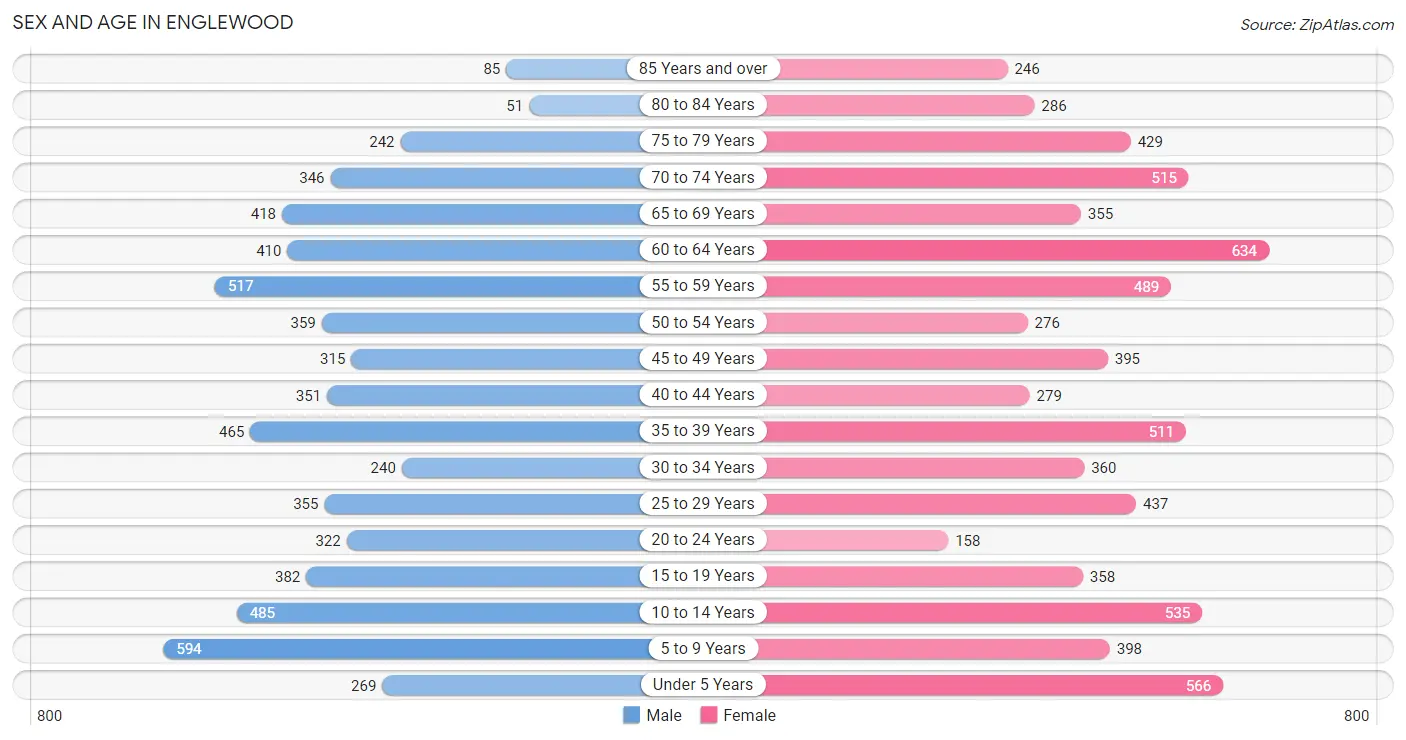
| Age Bracket | Male | Female |
| Under 5 Years | 269 (4.3%) | 566 (7.8%) |
| 5 to 9 Years | 594 (9.6%) | 398 (5.5%) |
| 10 to 14 Years | 485 (7.8%) | 535 (7.4%) |
| 15 to 19 Years | 382 (6.2%) | 358 (5.0%) |
| 20 to 24 Years | 322 (5.2%) | 158 (2.2%) |
| 25 to 29 Years | 355 (5.7%) | 437 (6.0%) |
| 30 to 34 Years | 240 (3.9%) | 360 (5.0%) |
| 35 to 39 Years | 465 (7.5%) | 511 (7.1%) |
| 40 to 44 Years | 351 (5.7%) | 279 (3.9%) |
| 45 to 49 Years | 315 (5.1%) | 395 (5.5%) |
| 50 to 54 Years | 359 (5.8%) | 276 (3.8%) |
| 55 to 59 Years | 517 (8.3%) | 489 (6.8%) |
| 60 to 64 Years | 410 (6.6%) | 634 (8.8%) |
| 65 to 69 Years | 418 (6.7%) | 355 (4.9%) |
| 70 to 74 Years | 346 (5.6%) | 515 (7.1%) |
| 75 to 79 Years | 242 (3.9%) | 429 (5.9%) |
| 80 to 84 Years | 51 (0.8%) | 286 (4.0%) |
| 85 Years and over | 85 (1.4%) | 246 (3.4%) |
| Total | 6,206 (100.0%) | 7,227 (100.0%) |
Families and Households in Englewood
Median Family Size in Englewood
The median family size in Englewood is 3.06 persons per family, with married-couple families (2,539 | 74.6%) accounting for the largest median family size of 3.19 persons per family. On the other hand, single male/father families (217 | 6.4%) represent the smallest median family size with 2.67 persons per family.
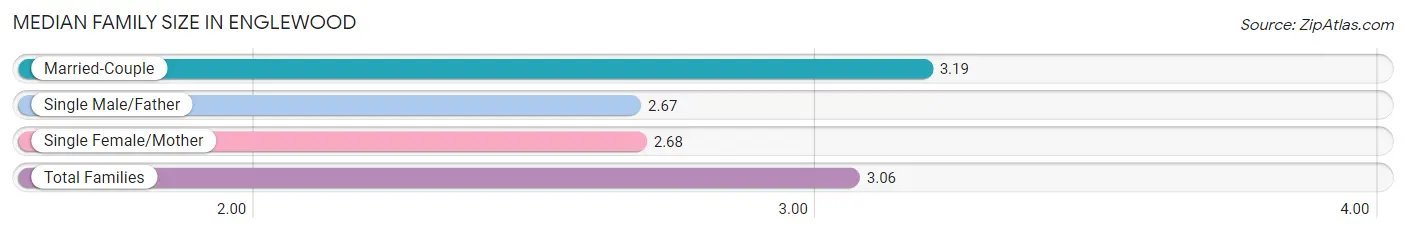
| Family Type | # Families | Family Size |
| Married-Couple | 2,539 (74.6%) | 3.19 |
| Single Male/Father | 217 (6.4%) | 2.67 |
| Single Female/Mother | 648 (19.0%) | 2.68 |
| Total Families | 3,404 (100.0%) | 3.06 |
Median Household Size in Englewood
The median household size in Englewood is 2.33 persons per household, with married-couple households (2,539 | 45.1%) accounting for the largest median household size of 3.2 persons per household. non-family households (2,232 | 39.6%) represent the smallest median household size with 1.11 persons per household.
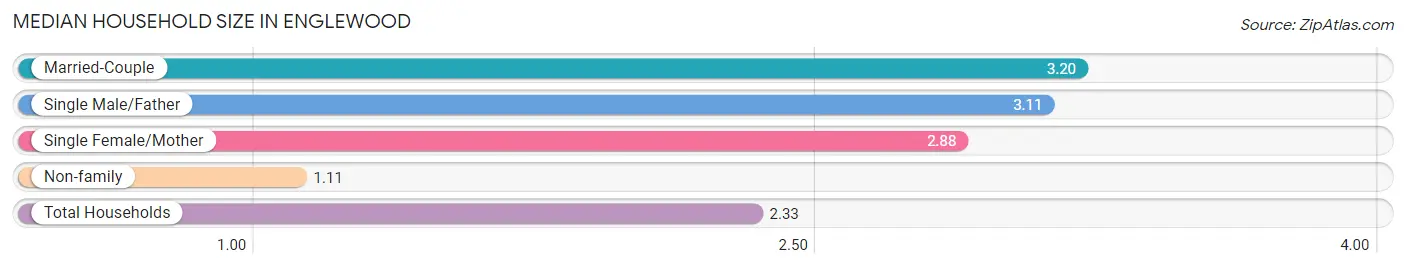
| Household Type | # Households | Household Size |
| Married-Couple | 2,539 (45.1%) | 3.20 |
| Single Male/Father | 217 (3.8%) | 3.11 |
| Single Female/Mother | 648 (11.5%) | 2.88 |
| Non-family | 2,232 (39.6%) | 1.11 |
| Total Households | 5,636 (100.0%) | 2.33 |
Household Size by Marriage Status in Englewood
Out of a total of 5,636 households in Englewood, 3,404 (60.4%) are family households, while 2,232 (39.6%) are nonfamily households. The most numerous type of family households are 2-person households, comprising 1,687, and the most common type of nonfamily households are 1-person households, comprising 2,023.
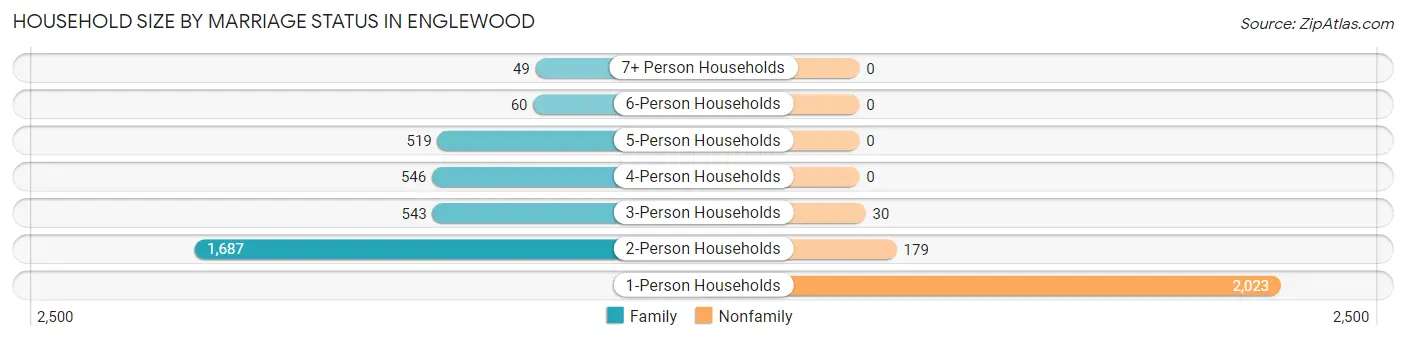
| Household Size | Family Households | Nonfamily Households |
| 1-Person Households | - | 2,023 (35.9%) |
| 2-Person Households | 1,687 (29.9%) | 179 (3.2%) |
| 3-Person Households | 543 (9.6%) | 30 (0.5%) |
| 4-Person Households | 546 (9.7%) | 0 (0.0%) |
| 5-Person Households | 519 (9.2%) | 0 (0.0%) |
| 6-Person Households | 60 (1.1%) | 0 (0.0%) |
| 7+ Person Households | 49 (0.9%) | 0 (0.0%) |
| Total | 3,404 (60.4%) | 2,232 (39.6%) |
Female Fertility in Englewood
Fertility by Age in Englewood
Average fertility rate in Englewood is 74.0 births per 1,000 women. Women in the age bracket of 15 to 19 years have the highest fertility rate with 142.0 births per 1,000 women. Women in the age bracket of 20 to 34 years acount for 50.5% of all women with births.
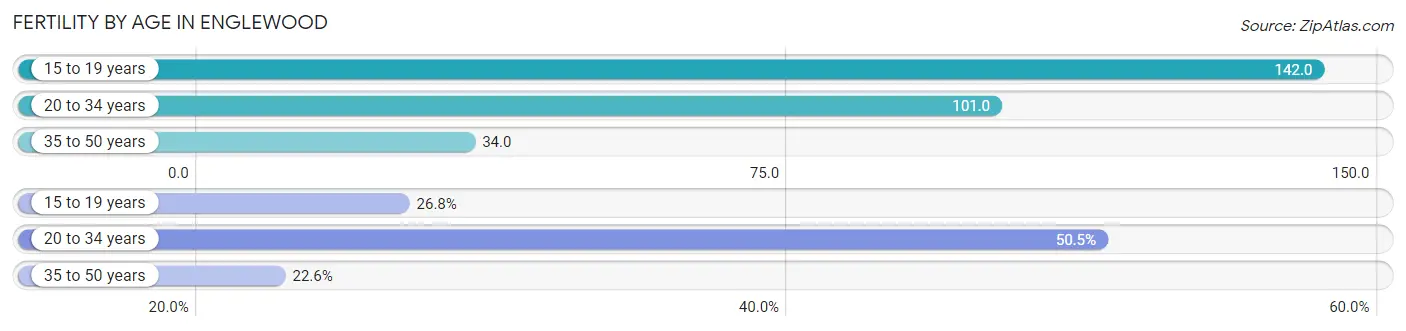
| Age Bracket | Women with Births | Births / 1,000 Women |
| 15 to 19 years | 51 (26.8%) | 142.0 |
| 20 to 34 years | 96 (50.5%) | 101.0 |
| 35 to 50 years | 43 (22.6%) | 34.0 |
| Total | 190 (100.0%) | 74.0 |
Fertility by Age by Marriage Status in Englewood
48.4% of women with births (190) in Englewood are married. The highest percentage of unmarried women with births falls into 15 to 19 years age bracket with 100.0% of them unmarried at the time of birth, while the lowest percentage of unmarried women with births belong to 20 to 34 years age bracket with 11.5% of them unmarried.
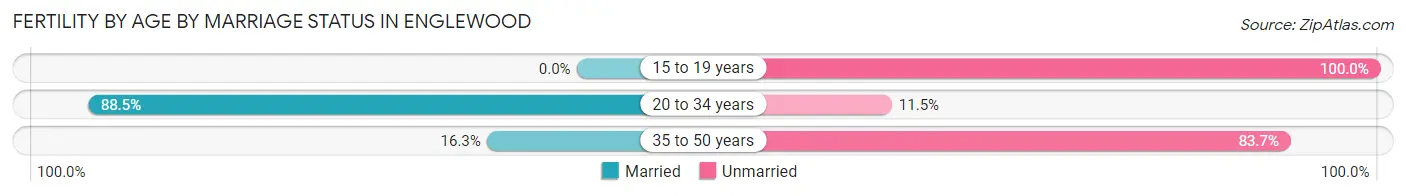
| Age Bracket | Married | Unmarried |
| 15 to 19 years | 0 (0.0%) | 51 (100.0%) |
| 20 to 34 years | 85 (88.5%) | 11 (11.5%) |
| 35 to 50 years | 7 (16.3%) | 36 (83.7%) |
| Total | 92 (48.4%) | 98 (51.6%) |
Fertility by Education in Englewood
Average fertility rate in Englewood is 74.0 births per 1,000 women. Women with the education attainment of college or associate's degree have the highest fertility rate of 111.0 births per 1,000 women, while women with the education attainment of graduate degree have the lowest fertility at 16.0 births per 1,000 women. Women with the education attainment of college or associate's degree represent 57.4% of all women with births.
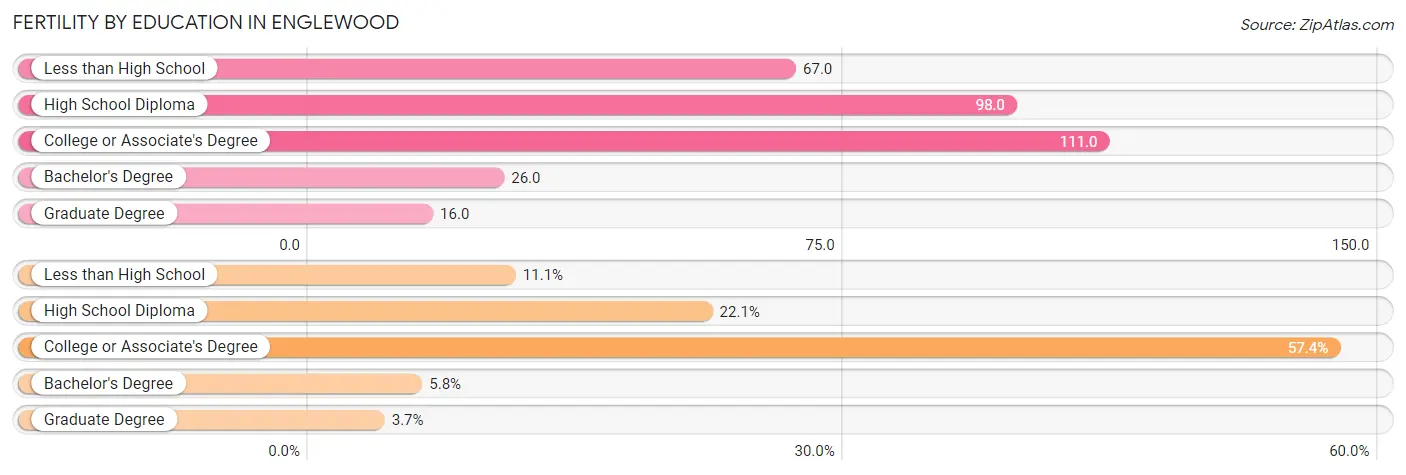
| Educational Attainment | Women with Births | Births / 1,000 Women |
| Less than High School | 21 (11.1%) | 67.0 |
| High School Diploma | 42 (22.1%) | 98.0 |
| College or Associate's Degree | 109 (57.4%) | 111.0 |
| Bachelor's Degree | 11 (5.8%) | 26.0 |
| Graduate Degree | 7 (3.7%) | 16.0 |
| Total | 190 (100.0%) | 74.0 |
Fertility by Education by Marriage Status in Englewood
51.6% of women with births in Englewood are unmarried. Women with the educational attainment of graduate degree are most likely to be married with 100.0% of them married at childbirth, while women with the educational attainment of less than high school are least likely to be married with 100.0% of them unmarried at childbirth.
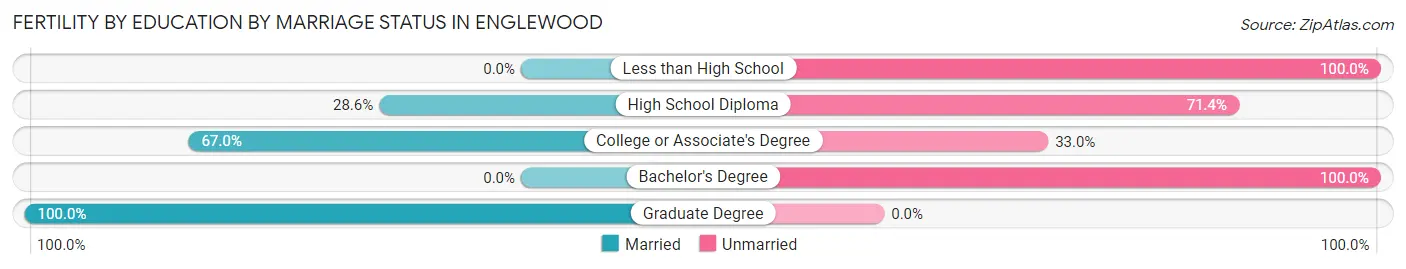
| Educational Attainment | Married | Unmarried |
| Less than High School | 0 (0.0%) | 21 (100.0%) |
| High School Diploma | 12 (28.6%) | 30 (71.4%) |
| College or Associate's Degree | 73 (67.0%) | 36 (33.0%) |
| Bachelor's Degree | 0 (0.0%) | 11 (100.0%) |
| Graduate Degree | 7 (100.0%) | 0 (0.0%) |
| Total | 92 (48.4%) | 98 (51.6%) |
Employment Characteristics in Englewood
Employment by Class of Employer in Englewood
Among the 5,977 employed individuals in Englewood, private company employees (3,960 | 66.2%), local government employees (684 | 11.4%), and not-for-profit organizations (614 | 10.3%) make up the most common classes of employment.
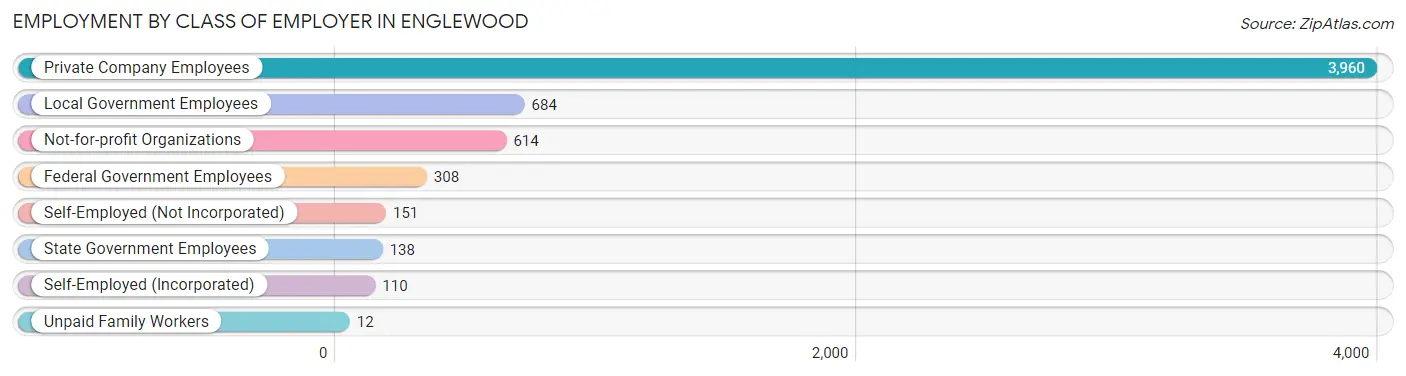
| Employer Class | # Employees | % Employees |
| Private Company Employees | 3,960 | 66.2% |
| Self-Employed (Incorporated) | 110 | 1.8% |
| Self-Employed (Not Incorporated) | 151 | 2.5% |
| Not-for-profit Organizations | 614 | 10.3% |
| Local Government Employees | 684 | 11.4% |
| State Government Employees | 138 | 2.3% |
| Federal Government Employees | 308 | 5.1% |
| Unpaid Family Workers | 12 | 0.2% |
| Total | 5,977 | 100.0% |
Employment Status by Age in Englewood
According to the labor force statistics for Englewood, out of the total population over 16 years of age (10,410), 61.7% or 6,423 individuals are in the labor force, with 4.6% or 295 of them unemployed. The age group with the highest labor force participation rate is 25 to 29 years, with 95.3% or 755 individuals in the labor force. Within the labor force, the 16 to 19 years age range has the highest percentage of unemployed individuals, with 20.1% or 55 of them being unemployed.
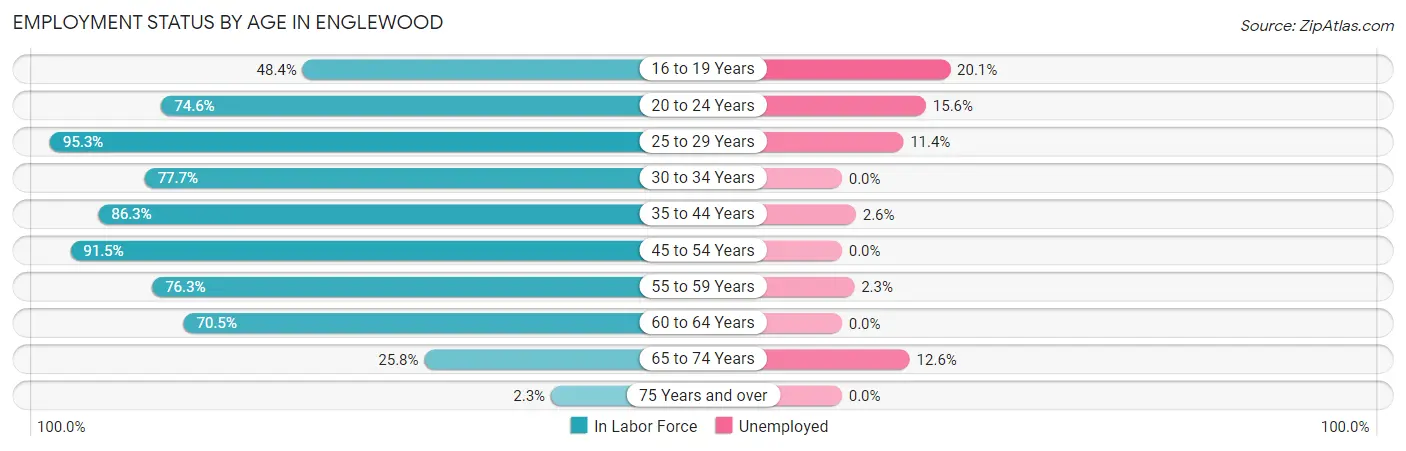
| Age Bracket | In Labor Force | Unemployed |
| 16 to 19 Years | 273 (48.4%) | 55 (20.1%) |
| 20 to 24 Years | 358 (74.6%) | 56 (15.6%) |
| 25 to 29 Years | 755 (95.3%) | 86 (11.4%) |
| 30 to 34 Years | 466 (77.7%) | 0 (0.0%) |
| 35 to 44 Years | 1,386 (86.3%) | 36 (2.6%) |
| 45 to 54 Years | 1,231 (91.5%) | 0 (0.0%) |
| 55 to 59 Years | 768 (76.3%) | 18 (2.3%) |
| 60 to 64 Years | 736 (70.5%) | 0 (0.0%) |
| 65 to 74 Years | 422 (25.8%) | 53 (12.6%) |
| 75 Years and over | 31 (2.3%) | 0 (0.0%) |
| Total | 6,423 (61.7%) | 295 (4.6%) |
Employment Status by Educational Attainment in Englewood
According to labor force statistics for Englewood, 83.6% of individuals (5,345) out of the total population between 25 and 64 years of age (6,393) are in the labor force, with 2.5% or 134 of them being unemployed. The group with the highest labor force participation rate are those with the educational attainment of bachelor's degree or higher, with 93.7% or 2,073 individuals in the labor force. Within the labor force, individuals with high school diploma education have the highest percentage of unemployment, with 4.1% or 36 of them being unemployed.
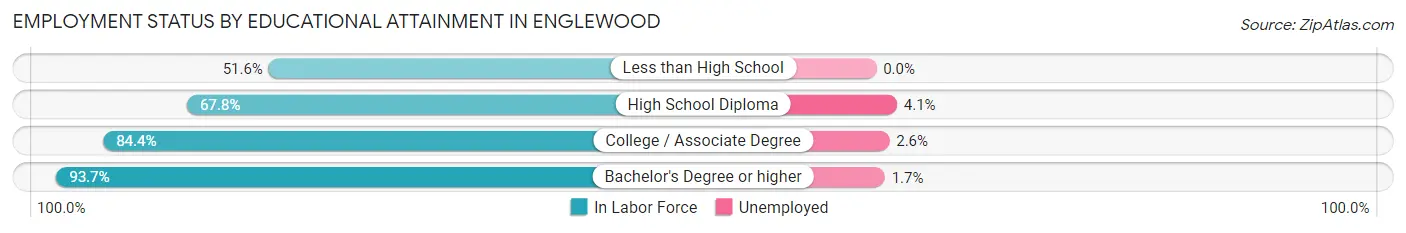
| Educational Attainment | In Labor Force | Unemployed |
| Less than High School | 65 (51.6%) | 0 (0.0%) |
| High School Diploma | 881 (67.8%) | 53 (4.1%) |
| College / Associate Degree | 2,325 (84.4%) | 72 (2.6%) |
| Bachelor's Degree or higher | 2,073 (93.7%) | 38 (1.7%) |
| Total | 5,345 (83.6%) | 160 (2.5%) |
Employment Occupations by Sex in Englewood
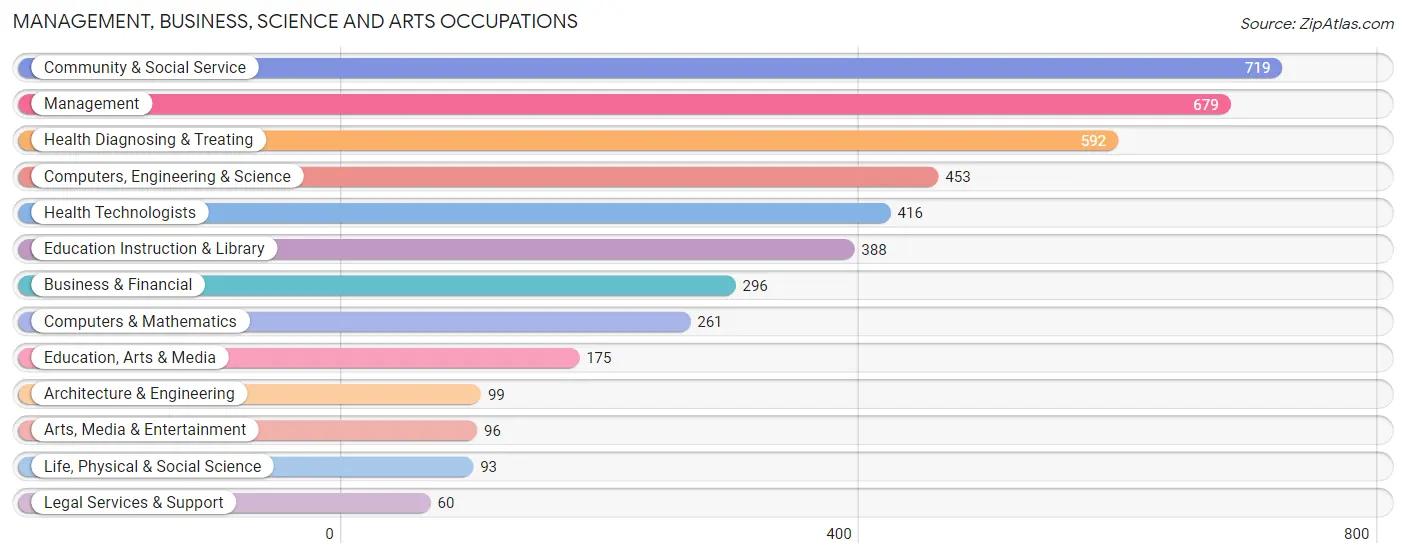
Management, Business, Science and Arts Occupations
The most common Management, Business, Science and Arts occupations in Englewood are Community & Social Service (719 | 11.9%), Management (679 | 11.3%), Health Diagnosing & Treating (592 | 9.8%), Computers, Engineering & Science (453 | 7.5%), and Health Technologists (416 | 6.9%).
Management, Business, Science and Arts Occupations by Sex
Within the Management, Business, Science and Arts occupations in Englewood, the most male-oriented occupations are Architecture & Engineering (100.0%), Life, Physical & Social Science (100.0%), and Computers, Engineering & Science (95.1%), while the most female-oriented occupations are Education Instruction & Library (94.6%), Health Diagnosing & Treating (90.2%), and Health Technologists (86.1%).
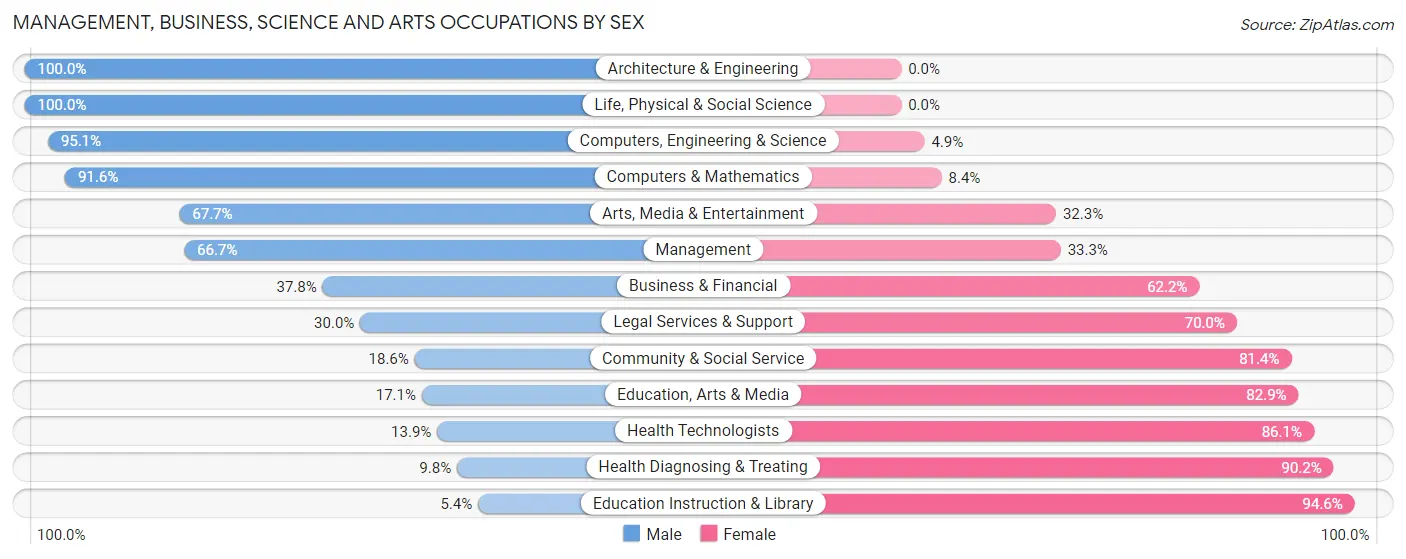
| Occupation | Male | Female |
| Management | 453 (66.7%) | 226 (33.3%) |
| Business & Financial | 112 (37.8%) | 184 (62.2%) |
| Computers, Engineering & Science | 431 (95.1%) | 22 (4.9%) |
| Computers & Mathematics | 239 (91.6%) | 22 (8.4%) |
| Architecture & Engineering | 99 (100.0%) | 0 (0.0%) |
| Life, Physical & Social Science | 93 (100.0%) | 0 (0.0%) |
| Community & Social Service | 134 (18.6%) | 585 (81.4%) |
| Education, Arts & Media | 30 (17.1%) | 145 (82.9%) |
| Legal Services & Support | 18 (30.0%) | 42 (70.0%) |
| Education Instruction & Library | 21 (5.4%) | 367 (94.6%) |
| Arts, Media & Entertainment | 65 (67.7%) | 31 (32.3%) |
| Health Diagnosing & Treating | 58 (9.8%) | 534 (90.2%) |
| Health Technologists | 58 (13.9%) | 358 (86.1%) |
| Total (Category) | 1,188 (43.4%) | 1,551 (56.6%) |
| Total (Overall) | 2,863 (47.4%) | 3,173 (52.6%) |
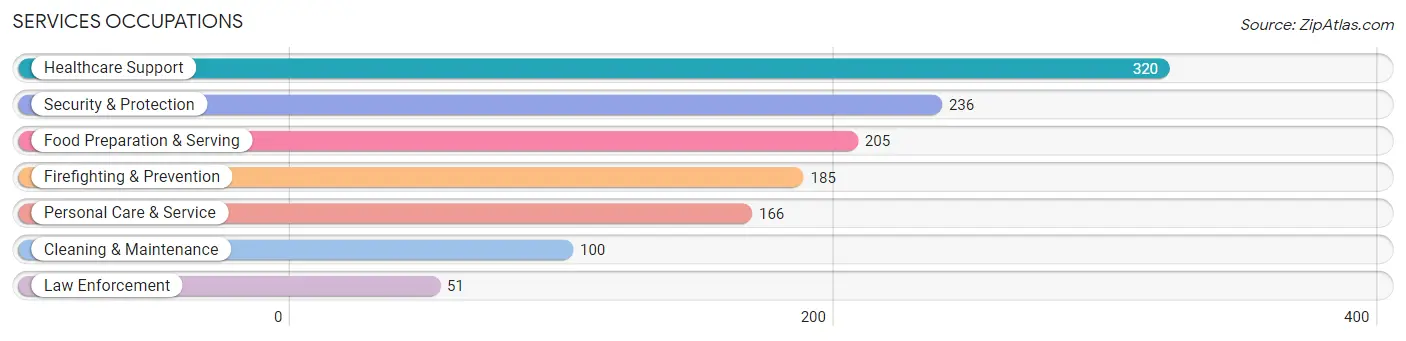
Services Occupations
The most common Services occupations in Englewood are Healthcare Support (320 | 5.3%), Security & Protection (236 | 3.9%), Food Preparation & Serving (205 | 3.4%), Firefighting & Prevention (185 | 3.1%), and Personal Care & Service (166 | 2.8%).
Services Occupations by Sex
Within the Services occupations in Englewood, the most male-oriented occupations are Law Enforcement (100.0%), Security & Protection (83.1%), and Firefighting & Prevention (78.4%), while the most female-oriented occupations are Healthcare Support (86.9%), Personal Care & Service (75.3%), and Food Preparation & Serving (63.9%).
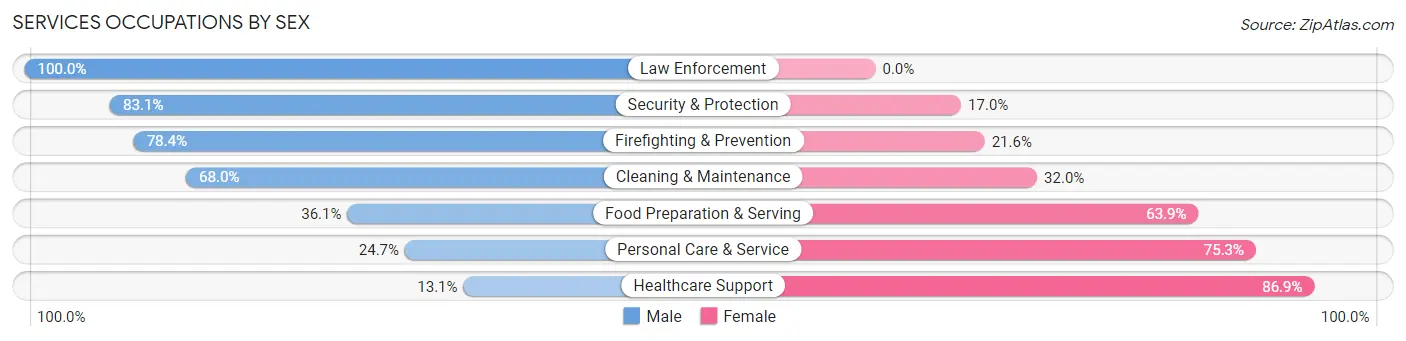
| Occupation | Male | Female |
| Healthcare Support | 42 (13.1%) | 278 (86.9%) |
| Security & Protection | 196 (83.1%) | 40 (17.0%) |
| Firefighting & Prevention | 145 (78.4%) | 40 (21.6%) |
| Law Enforcement | 51 (100.0%) | 0 (0.0%) |
| Food Preparation & Serving | 74 (36.1%) | 131 (63.9%) |
| Cleaning & Maintenance | 68 (68.0%) | 32 (32.0%) |
| Personal Care & Service | 41 (24.7%) | 125 (75.3%) |
| Total (Category) | 421 (41.0%) | 606 (59.0%) |
| Total (Overall) | 2,863 (47.4%) | 3,173 (52.6%) |
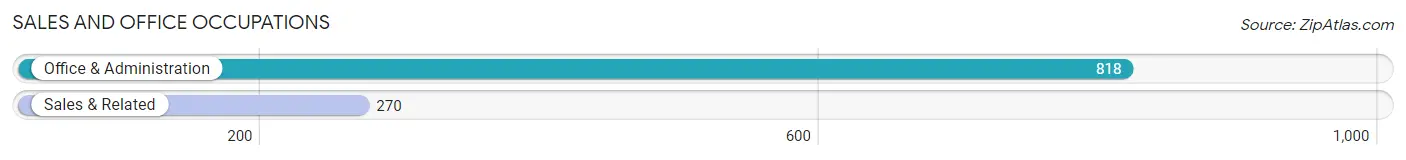
Sales and Office Occupations
The most common Sales and Office occupations in Englewood are Office & Administration (818 | 13.6%), and Sales & Related (270 | 4.5%).
Sales and Office Occupations by Sex
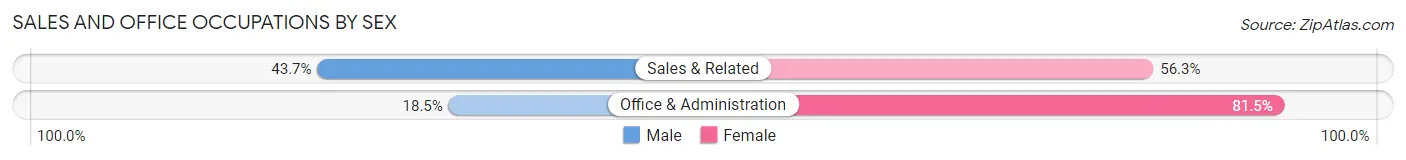
| Occupation | Male | Female |
| Sales & Related | 118 (43.7%) | 152 (56.3%) |
| Office & Administration | 151 (18.5%) | 667 (81.5%) |
| Total (Category) | 269 (24.7%) | 819 (75.3%) |
| Total (Overall) | 2,863 (47.4%) | 3,173 (52.6%) |
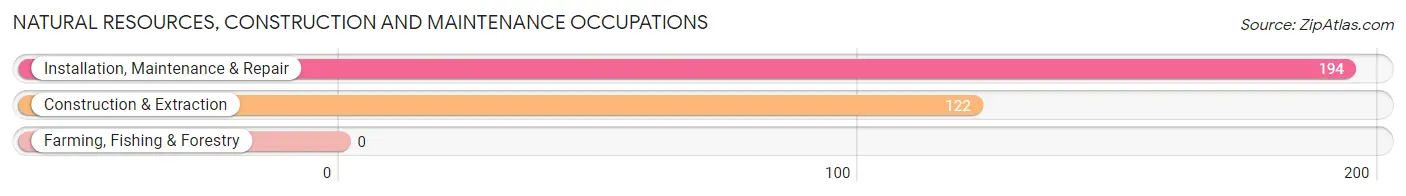
Natural Resources, Construction and Maintenance Occupations
The most common Natural Resources, Construction and Maintenance occupations in Englewood are Installation, Maintenance & Repair (194 | 3.2%), and Construction & Extraction (122 | 2.0%).
Natural Resources, Construction and Maintenance Occupations by Sex
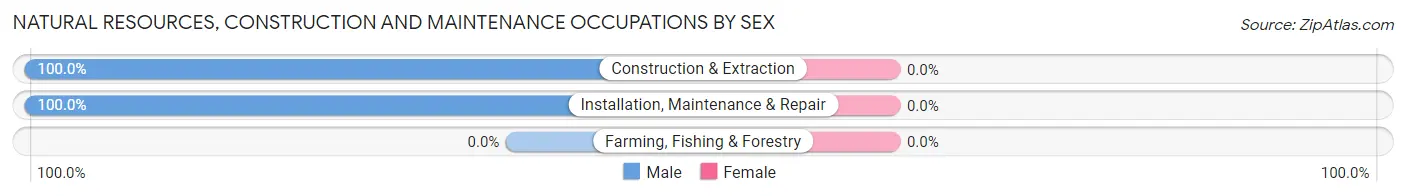
| Occupation | Male | Female |
| Farming, Fishing & Forestry | 0 (0.0%) | 0 (0.0%) |
| Construction & Extraction | 122 (100.0%) | 0 (0.0%) |
| Installation, Maintenance & Repair | 194 (100.0%) | 0 (0.0%) |
| Total (Category) | 316 (100.0%) | 0 (0.0%) |
| Total (Overall) | 2,863 (47.4%) | 3,173 (52.6%) |
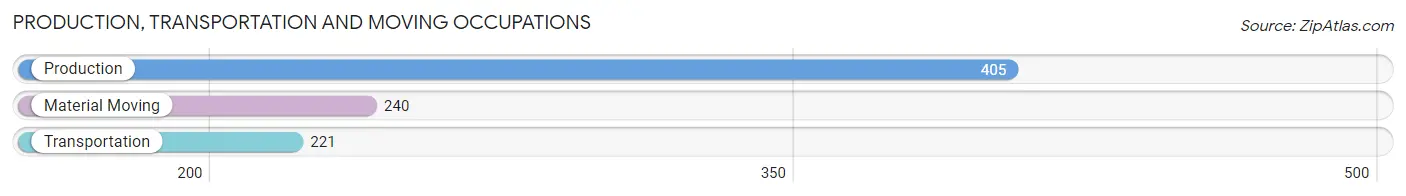
Production, Transportation and Moving Occupations
The most common Production, Transportation and Moving occupations in Englewood are Production (405 | 6.7%), Material Moving (240 | 4.0%), and Transportation (221 | 3.7%).
Production, Transportation and Moving Occupations by Sex
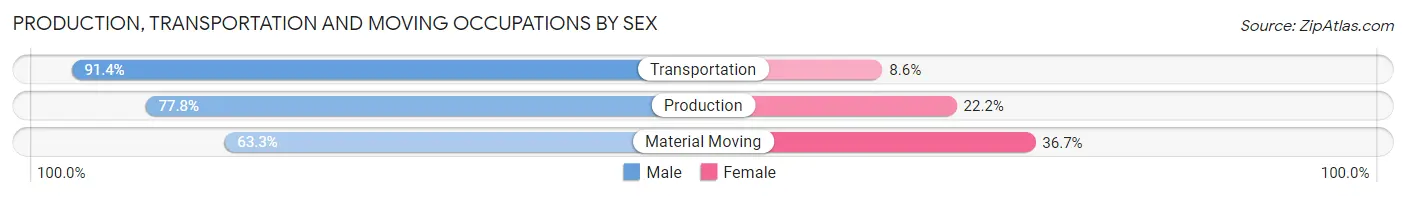
| Occupation | Male | Female |
| Production | 315 (77.8%) | 90 (22.2%) |
| Transportation | 202 (91.4%) | 19 (8.6%) |
| Material Moving | 152 (63.3%) | 88 (36.7%) |
| Total (Category) | 669 (77.2%) | 197 (22.8%) |
| Total (Overall) | 2,863 (47.4%) | 3,173 (52.6%) |
Employment Industries by Sex in Englewood
Employment Industries in Englewood
The major employment industries in Englewood include Health Care & Social Assistance (1,161 | 19.2%), Manufacturing (836 | 13.9%), Retail Trade (589 | 9.8%), Public Administration (501 | 8.3%), and Educational Services (484 | 8.0%).
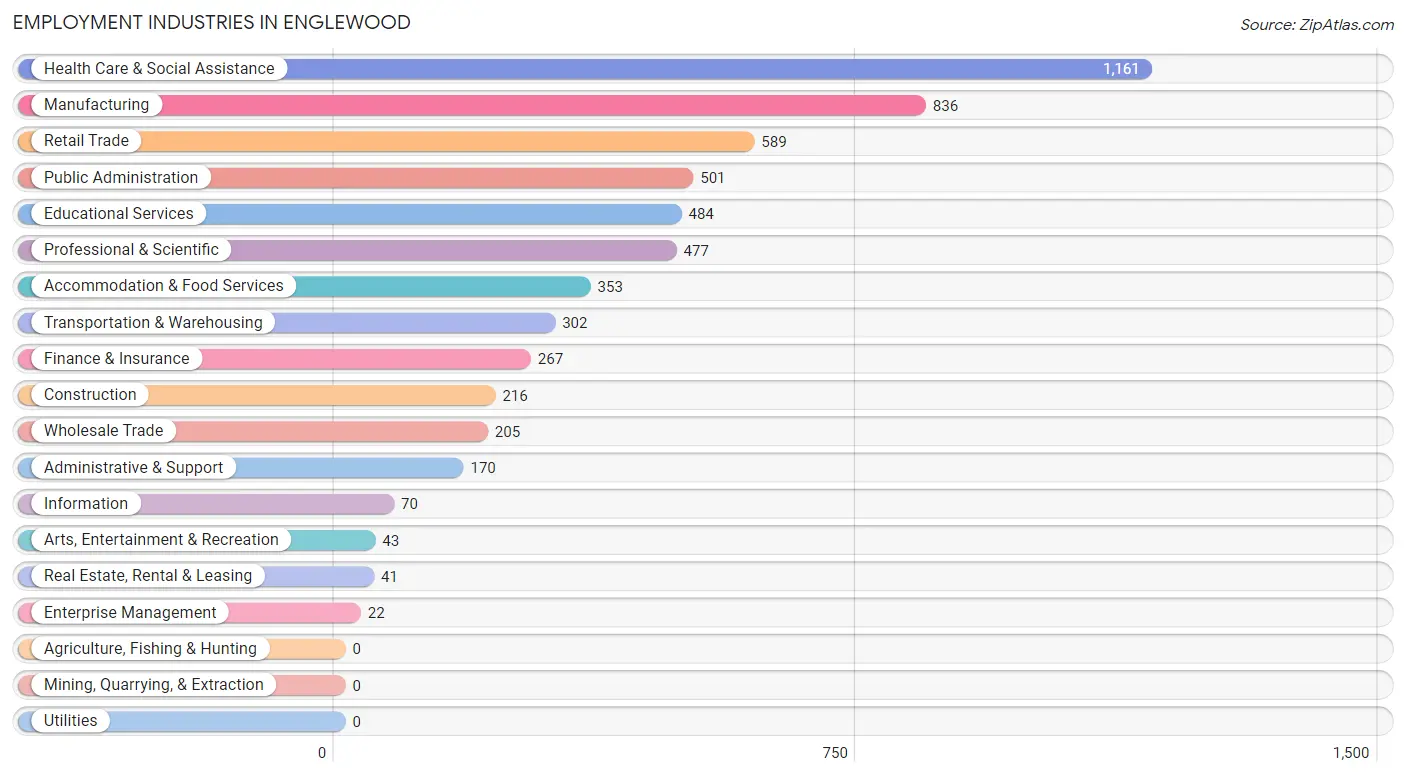
Employment Industries by Sex in Englewood
The Englewood industries that see more men than women are Construction (100.0%), Wholesale Trade (92.7%), and Transportation & Warehousing (88.4%), whereas the industries that tend to have a higher number of women are Enterprise Management (100.0%), Health Care & Social Assistance (84.0%), and Educational Services (77.7%).
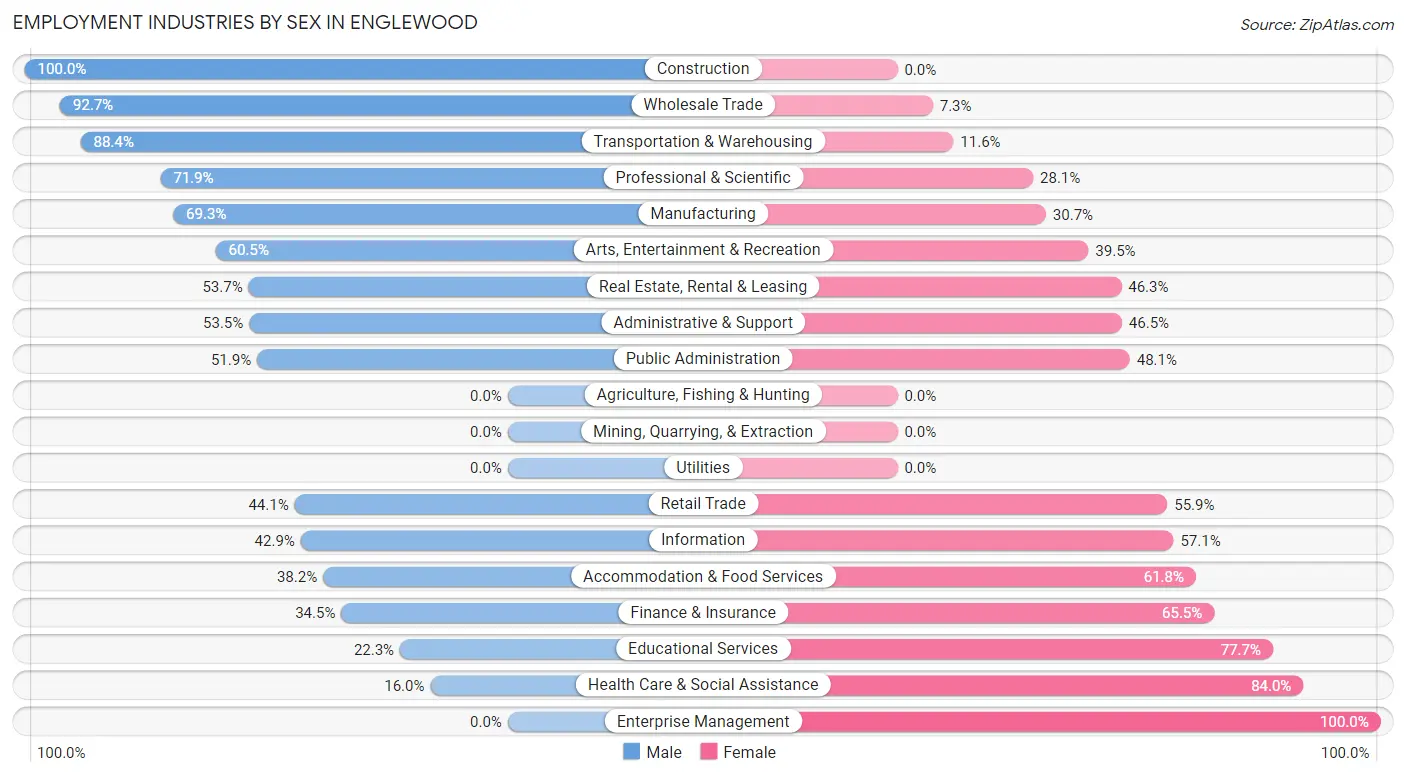
| Industry | Male | Female |
| Agriculture, Fishing & Hunting | 0 (0.0%) | 0 (0.0%) |
| Mining, Quarrying, & Extraction | 0 (0.0%) | 0 (0.0%) |
| Construction | 216 (100.0%) | 0 (0.0%) |
| Manufacturing | 579 (69.3%) | 257 (30.7%) |
| Wholesale Trade | 190 (92.7%) | 15 (7.3%) |
| Retail Trade | 260 (44.1%) | 329 (55.9%) |
| Transportation & Warehousing | 267 (88.4%) | 35 (11.6%) |
| Utilities | 0 (0.0%) | 0 (0.0%) |
| Information | 30 (42.9%) | 40 (57.1%) |
| Finance & Insurance | 92 (34.5%) | 175 (65.5%) |
| Real Estate, Rental & Leasing | 22 (53.7%) | 19 (46.3%) |
| Professional & Scientific | 343 (71.9%) | 134 (28.1%) |
| Enterprise Management | 0 (0.0%) | 22 (100.0%) |
| Administrative & Support | 91 (53.5%) | 79 (46.5%) |
| Educational Services | 108 (22.3%) | 376 (77.7%) |
| Health Care & Social Assistance | 186 (16.0%) | 975 (84.0%) |
| Arts, Entertainment & Recreation | 26 (60.5%) | 17 (39.5%) |
| Accommodation & Food Services | 135 (38.2%) | 218 (61.8%) |
| Public Administration | 260 (51.9%) | 241 (48.1%) |
| Total | 2,863 (47.4%) | 3,173 (52.6%) |
Education in Englewood
School Enrollment in Englewood
The most common levels of schooling among the 3,188 students in Englewood are elementary school (736 | 23.1%), middle school (714 | 22.4%), and high school (695 | 21.8%).
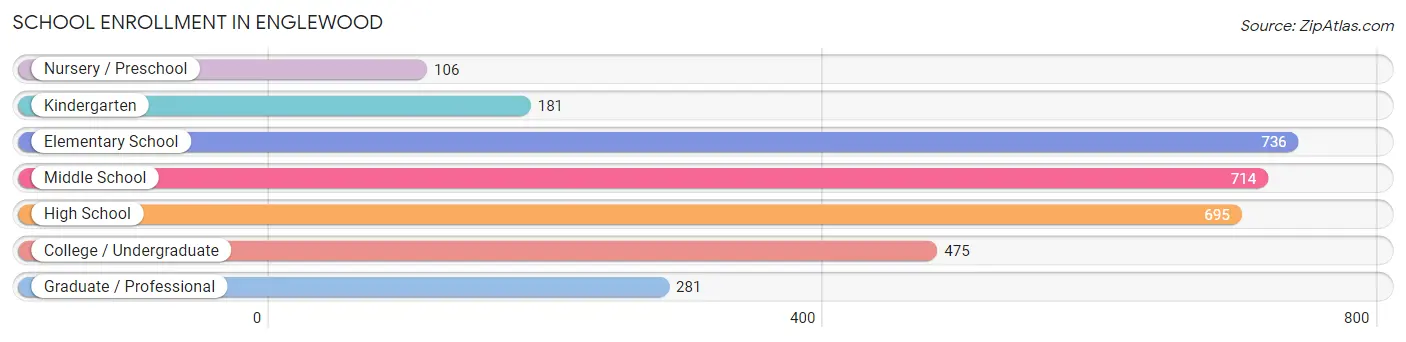
| School Level | # Students | % Students |
| Nursery / Preschool | 106 | 3.3% |
| Kindergarten | 181 | 5.7% |
| Elementary School | 736 | 23.1% |
| Middle School | 714 | 22.4% |
| High School | 695 | 21.8% |
| College / Undergraduate | 475 | 14.9% |
| Graduate / Professional | 281 | 8.8% |
| Total | 3,188 | 100.0% |
School Enrollment by Age by Funding Source in Englewood
Out of a total of 3,188 students who are enrolled in schools in Englewood, 312 (9.8%) attend a private institution, while the remaining 2,876 (90.2%) are enrolled in public schools. The age group of 25 to 34 year olds has the highest likelihood of being enrolled in private schools, with 73 (29.3% in the age bracket) enrolled. Conversely, the age group of 3 to 4 year olds has the lowest likelihood of being enrolled in a private school, with 47 (100.0% in the age bracket) attending a public institution.
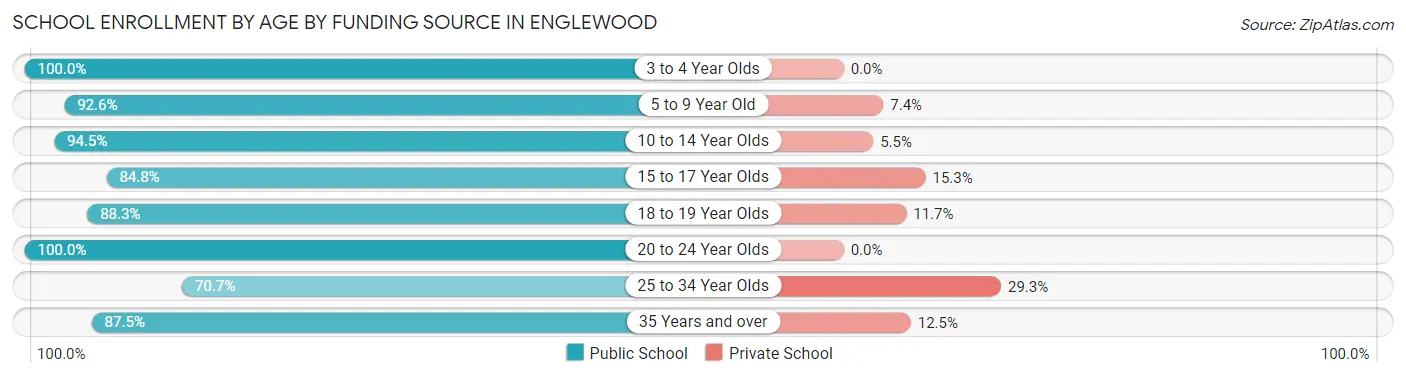
| Age Bracket | Public School | Private School |
| 3 to 4 Year Olds | 47 (100.0%) | 0 (0.0%) |
| 5 to 9 Year Old | 789 (92.6%) | 63 (7.4%) |
| 10 to 14 Year Olds | 927 (94.5%) | 54 (5.5%) |
| 15 to 17 Year Olds | 339 (84.8%) | 61 (15.2%) |
| 18 to 19 Year Olds | 227 (88.3%) | 30 (11.7%) |
| 20 to 24 Year Olds | 154 (100.0%) | 0 (0.0%) |
| 25 to 34 Year Olds | 176 (70.7%) | 73 (29.3%) |
| 35 Years and over | 217 (87.5%) | 31 (12.5%) |
| Total | 2,876 (90.2%) | 312 (9.8%) |
Educational Attainment by Field of Study in Englewood
Education (556 | 18.2%), science & technology (489 | 16.0%), business (461 | 15.1%), arts & humanities (271 | 8.9%), and engineering (256 | 8.4%) are the most common fields of study among 3,050 individuals in Englewood who have obtained a bachelor's degree or higher.
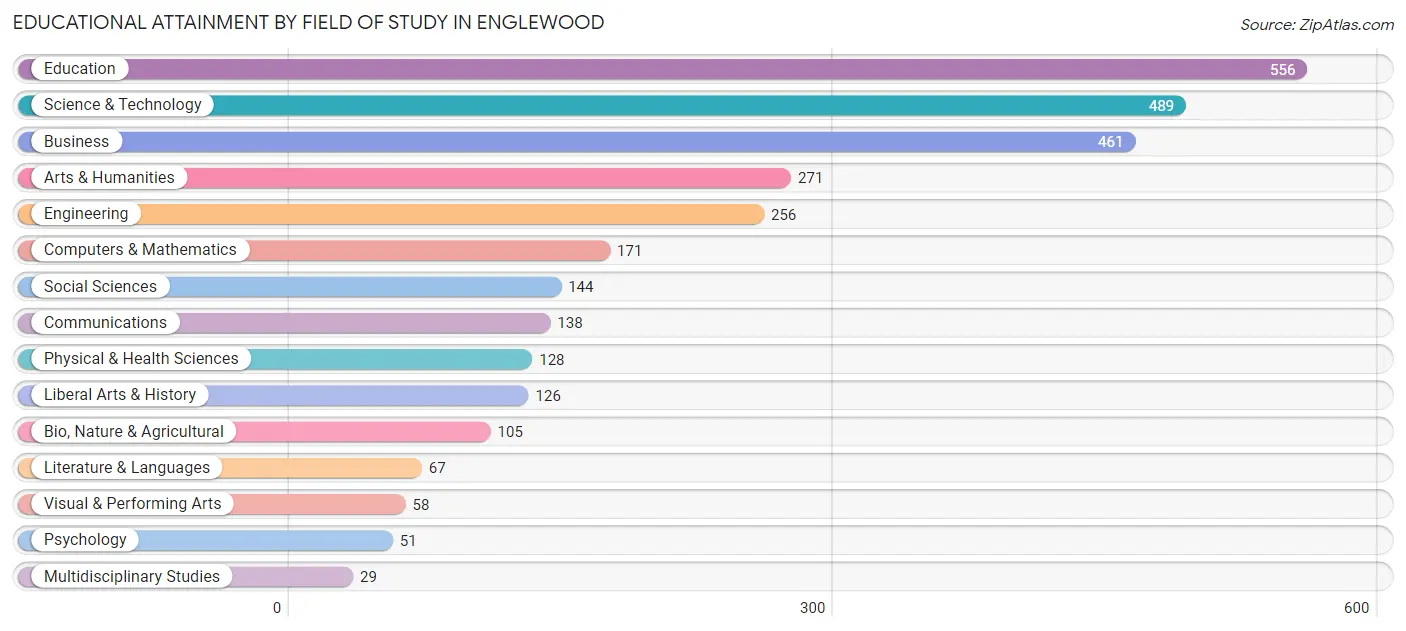
| Field of Study | # Graduates | % Graduates |
| Computers & Mathematics | 171 | 5.6% |
| Bio, Nature & Agricultural | 105 | 3.4% |
| Physical & Health Sciences | 128 | 4.2% |
| Psychology | 51 | 1.7% |
| Social Sciences | 144 | 4.7% |
| Engineering | 256 | 8.4% |
| Multidisciplinary Studies | 29 | 0.9% |
| Science & Technology | 489 | 16.0% |
| Business | 461 | 15.1% |
| Education | 556 | 18.2% |
| Literature & Languages | 67 | 2.2% |
| Liberal Arts & History | 126 | 4.1% |
| Visual & Performing Arts | 58 | 1.9% |
| Communications | 138 | 4.5% |
| Arts & Humanities | 271 | 8.9% |
| Total | 3,050 | 100.0% |
Transportation & Commute in Englewood
Vehicle Availability by Sex in Englewood
The most prevalent vehicle ownership categories in Englewood are males with 2 vehicles (1,447, accounting for 51.3%) and females with 2 vehicles (1,344, making up 45.9%).
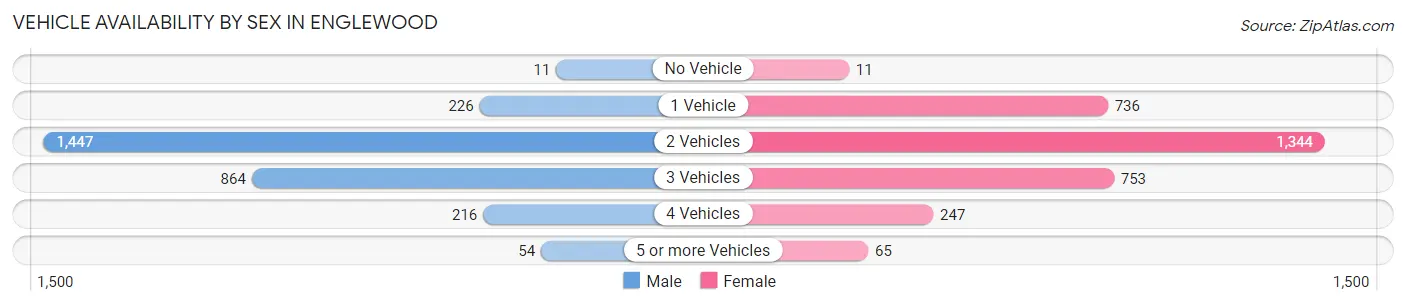
| Vehicles Available | Male | Female |
| No Vehicle | 11 (0.4%) | 11 (0.4%) |
| 1 Vehicle | 226 (8.0%) | 736 (23.3%) |
| 2 Vehicles | 1,447 (51.3%) | 1,344 (42.6%) |
| 3 Vehicles | 864 (30.7%) | 753 (23.9%) |
| 4 Vehicles | 216 (7.7%) | 247 (7.8%) |
| 5 or more Vehicles | 54 (1.9%) | 65 (2.1%) |
| Total | 2,818 (100.0%) | 3,156 (100.0%) |
Commute Time in Englewood
The most frequently occuring commute durations in Englewood are 30 to 34 minutes (1,057 commuters, 19.6%), 20 to 24 minutes (846 commuters, 15.7%), and 10 to 14 minutes (551 commuters, 10.2%).
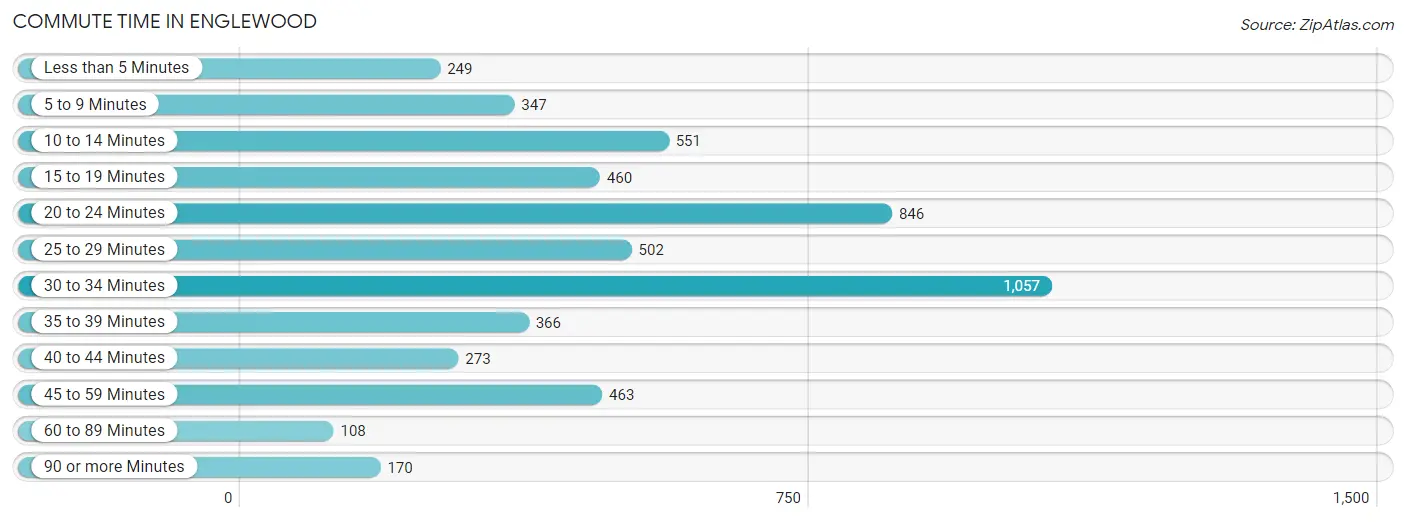
| Commute Time | # Commuters | % Commuters |
| Less than 5 Minutes | 249 | 4.6% |
| 5 to 9 Minutes | 347 | 6.4% |
| 10 to 14 Minutes | 551 | 10.2% |
| 15 to 19 Minutes | 460 | 8.5% |
| 20 to 24 Minutes | 846 | 15.7% |
| 25 to 29 Minutes | 502 | 9.3% |
| 30 to 34 Minutes | 1,057 | 19.6% |
| 35 to 39 Minutes | 366 | 6.8% |
| 40 to 44 Minutes | 273 | 5.1% |
| 45 to 59 Minutes | 463 | 8.6% |
| 60 to 89 Minutes | 108 | 2.0% |
| 90 or more Minutes | 170 | 3.2% |
Commute Time by Sex in Englewood
The most common commute times in Englewood are 30 to 34 minutes (599 commuters, 23.5%) for males and 30 to 34 minutes (458 commuters, 16.1%) for females.
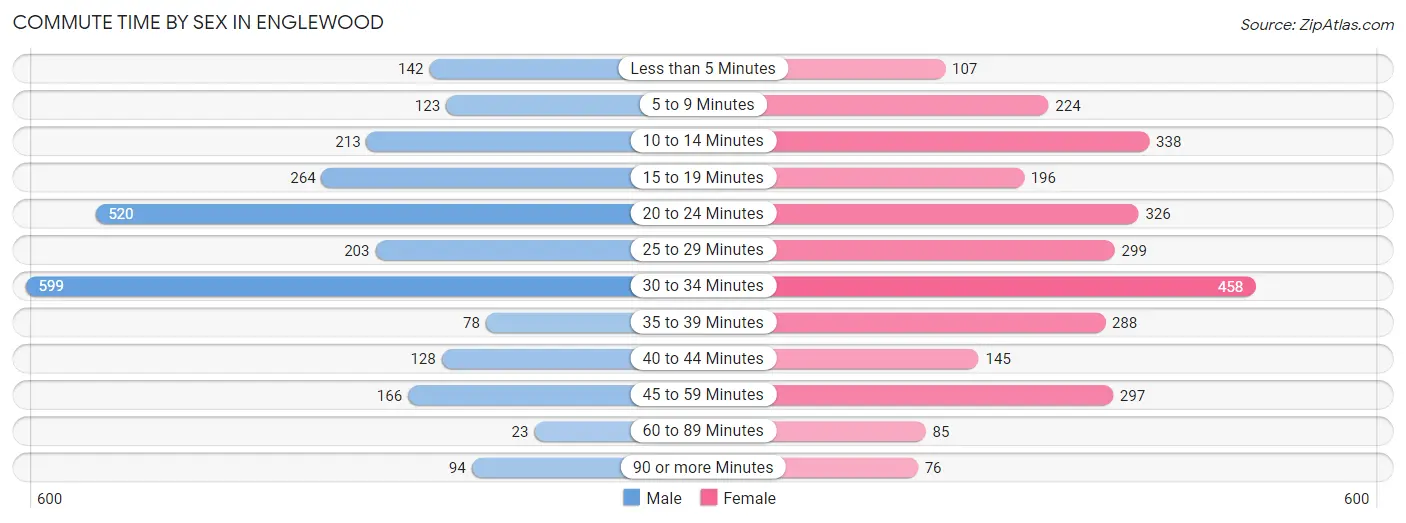
| Commute Time | Male | Female |
| Less than 5 Minutes | 142 (5.6%) | 107 (3.8%) |
| 5 to 9 Minutes | 123 (4.8%) | 224 (7.9%) |
| 10 to 14 Minutes | 213 (8.3%) | 338 (11.9%) |
| 15 to 19 Minutes | 264 (10.3%) | 196 (6.9%) |
| 20 to 24 Minutes | 520 (20.4%) | 326 (11.5%) |
| 25 to 29 Minutes | 203 (8.0%) | 299 (10.5%) |
| 30 to 34 Minutes | 599 (23.5%) | 458 (16.1%) |
| 35 to 39 Minutes | 78 (3.1%) | 288 (10.1%) |
| 40 to 44 Minutes | 128 (5.0%) | 145 (5.1%) |
| 45 to 59 Minutes | 166 (6.5%) | 297 (10.5%) |
| 60 to 89 Minutes | 23 (0.9%) | 85 (3.0%) |
| 90 or more Minutes | 94 (3.7%) | 76 (2.7%) |
Time of Departure to Work by Sex in Englewood
The most frequent times of departure to work in Englewood are 6:00 AM to 6:29 AM (436, 17.1%) for males and 6:30 AM to 6:59 AM (504, 17.7%) for females.
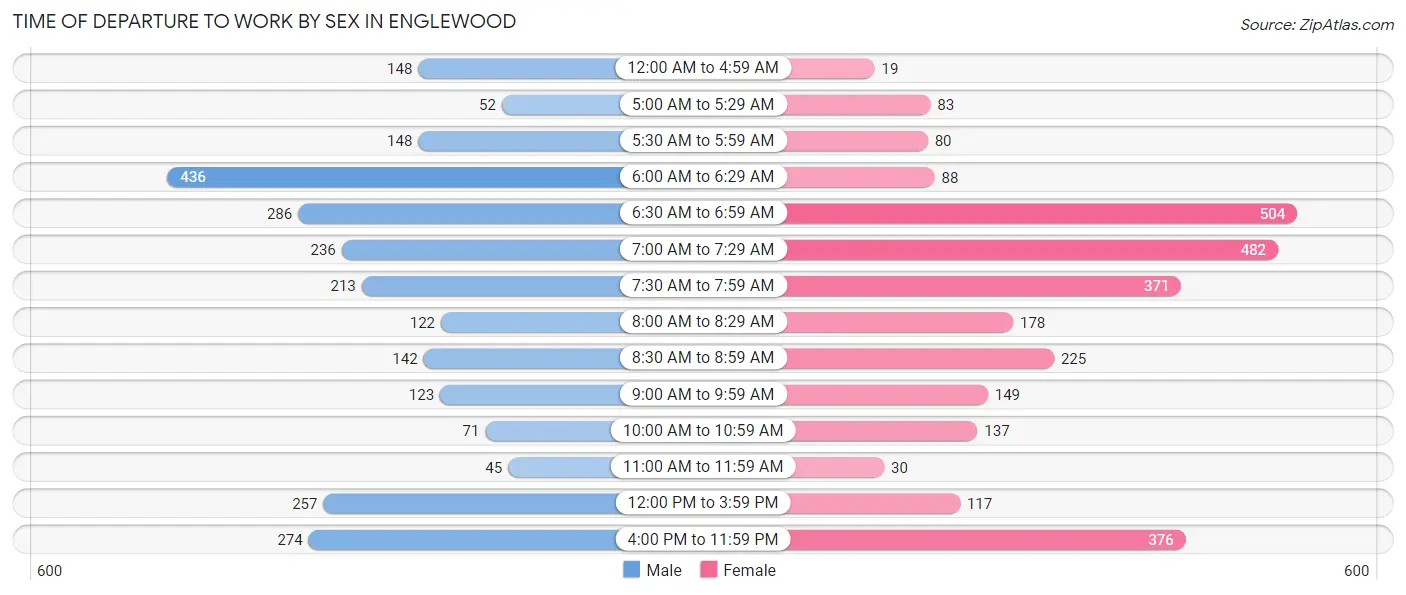
| Time of Departure | Male | Female |
| 12:00 AM to 4:59 AM | 148 (5.8%) | 19 (0.7%) |
| 5:00 AM to 5:29 AM | 52 (2.0%) | 83 (2.9%) |
| 5:30 AM to 5:59 AM | 148 (5.8%) | 80 (2.8%) |
| 6:00 AM to 6:29 AM | 436 (17.1%) | 88 (3.1%) |
| 6:30 AM to 6:59 AM | 286 (11.2%) | 504 (17.7%) |
| 7:00 AM to 7:29 AM | 236 (9.2%) | 482 (17.0%) |
| 7:30 AM to 7:59 AM | 213 (8.3%) | 371 (13.1%) |
| 8:00 AM to 8:29 AM | 122 (4.8%) | 178 (6.3%) |
| 8:30 AM to 8:59 AM | 142 (5.6%) | 225 (7.9%) |
| 9:00 AM to 9:59 AM | 123 (4.8%) | 149 (5.2%) |
| 10:00 AM to 10:59 AM | 71 (2.8%) | 137 (4.8%) |
| 11:00 AM to 11:59 AM | 45 (1.8%) | 30 (1.1%) |
| 12:00 PM to 3:59 PM | 257 (10.1%) | 117 (4.1%) |
| 4:00 PM to 11:59 PM | 274 (10.7%) | 376 (13.2%) |
| Total | 2,553 (100.0%) | 2,839 (100.0%) |
Housing Occupancy in Englewood
Occupancy by Ownership in Englewood
Of the total 5,636 dwellings in Englewood, owner-occupied units account for 3,918 (69.5%), while renter-occupied units make up 1,718 (30.5%).
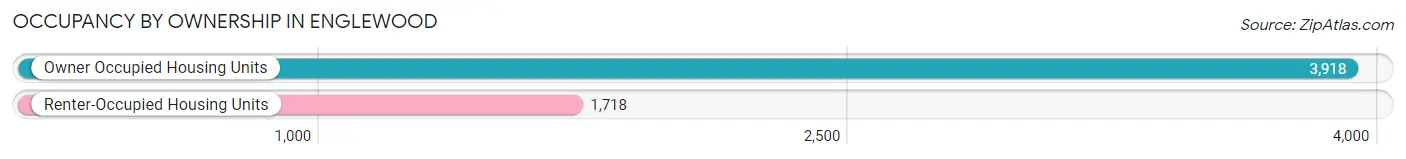
| Occupancy | # Housing Units | % Housing Units |
| Owner Occupied Housing Units | 3,918 | 69.5% |
| Renter-Occupied Housing Units | 1,718 | 30.5% |
| Total Occupied Housing Units | 5,636 | 100.0% |
Occupancy by Household Size in Englewood
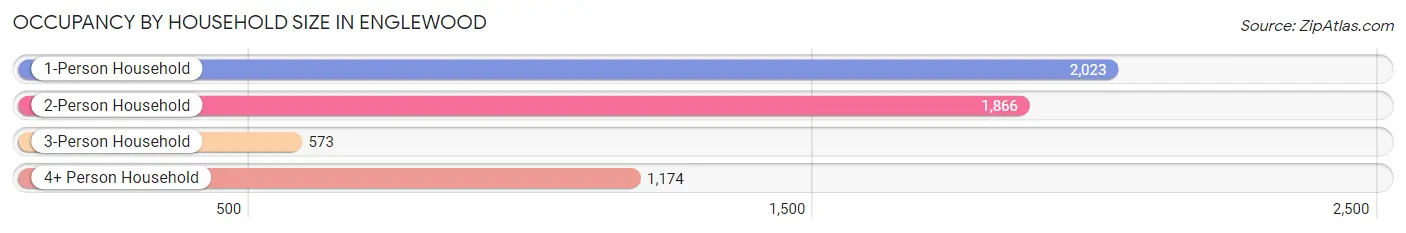
| Household Size | # Housing Units | % Housing Units |
| 1-Person Household | 2,023 | 35.9% |
| 2-Person Household | 1,866 | 33.1% |
| 3-Person Household | 573 | 10.2% |
| 4+ Person Household | 1,174 | 20.8% |
| Total Housing Units | 5,636 | 100.0% |
Occupancy by Ownership by Household Size in Englewood
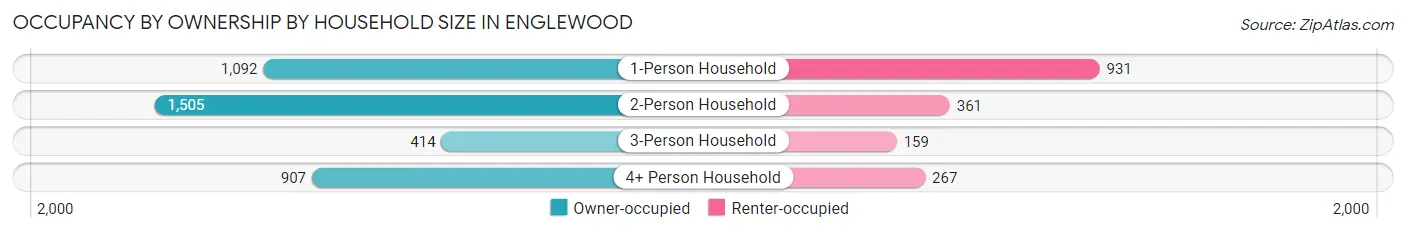
| Household Size | Owner-occupied | Renter-occupied |
| 1-Person Household | 1,092 (54.0%) | 931 (46.0%) |
| 2-Person Household | 1,505 (80.6%) | 361 (19.4%) |
| 3-Person Household | 414 (72.3%) | 159 (27.8%) |
| 4+ Person Household | 907 (77.3%) | 267 (22.7%) |
| Total Housing Units | 3,918 (69.5%) | 1,718 (30.5%) |
Occupancy by Educational Attainment in Englewood
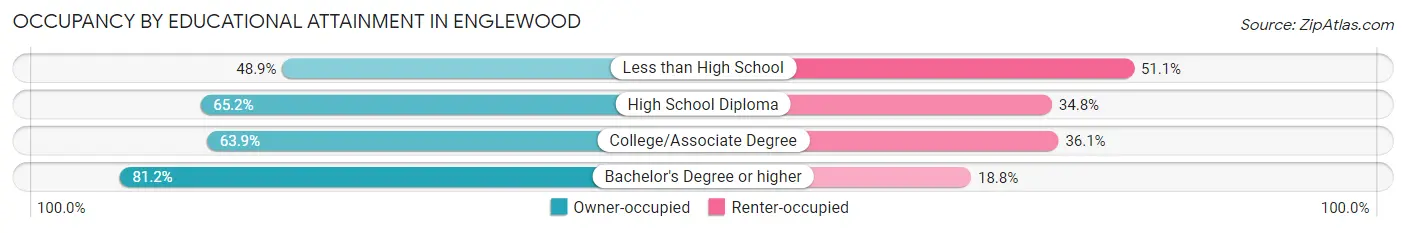
| Household Size | Owner-occupied | Renter-occupied |
| Less than High School | 22 (48.9%) | 23 (51.1%) |
| High School Diploma | 950 (65.2%) | 508 (34.8%) |
| College/Associate Degree | 1,509 (63.9%) | 854 (36.1%) |
| Bachelor's Degree or higher | 1,437 (81.2%) | 333 (18.8%) |
Occupancy by Age of Householder in Englewood
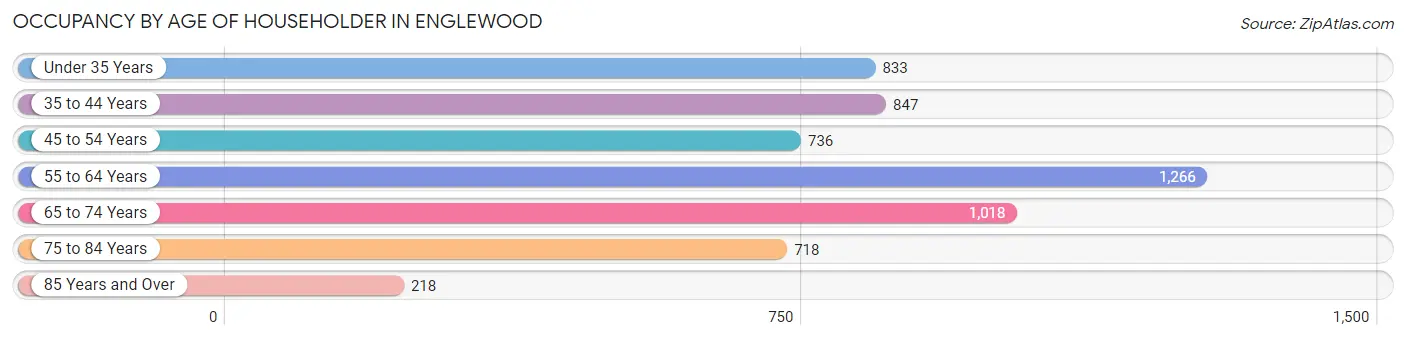
| Age Bracket | # Households | % Households |
| Under 35 Years | 833 | 14.8% |
| 35 to 44 Years | 847 | 15.0% |
| 45 to 54 Years | 736 | 13.1% |
| 55 to 64 Years | 1,266 | 22.5% |
| 65 to 74 Years | 1,018 | 18.1% |
| 75 to 84 Years | 718 | 12.7% |
| 85 Years and Over | 218 | 3.9% |
| Total | 5,636 | 100.0% |
Housing Finances in Englewood
Median Income by Occupancy in Englewood
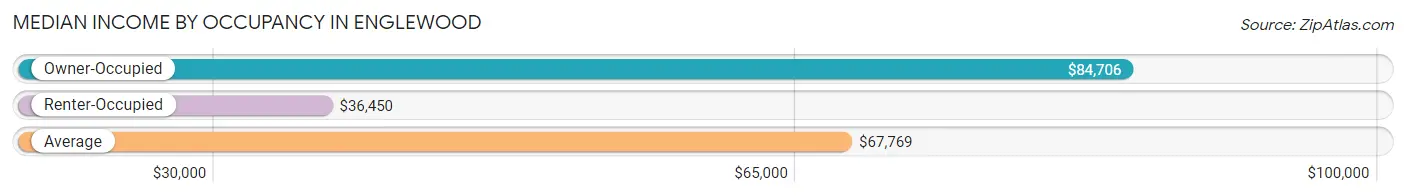
| Occupancy Type | # Households | Median Income |
| Owner-Occupied | 3,918 (69.5%) | $84,706 |
| Renter-Occupied | 1,718 (30.5%) | $36,450 |
| Average | 5,636 (100.0%) | $67,769 |
Occupancy by Householder Income Bracket in Englewood
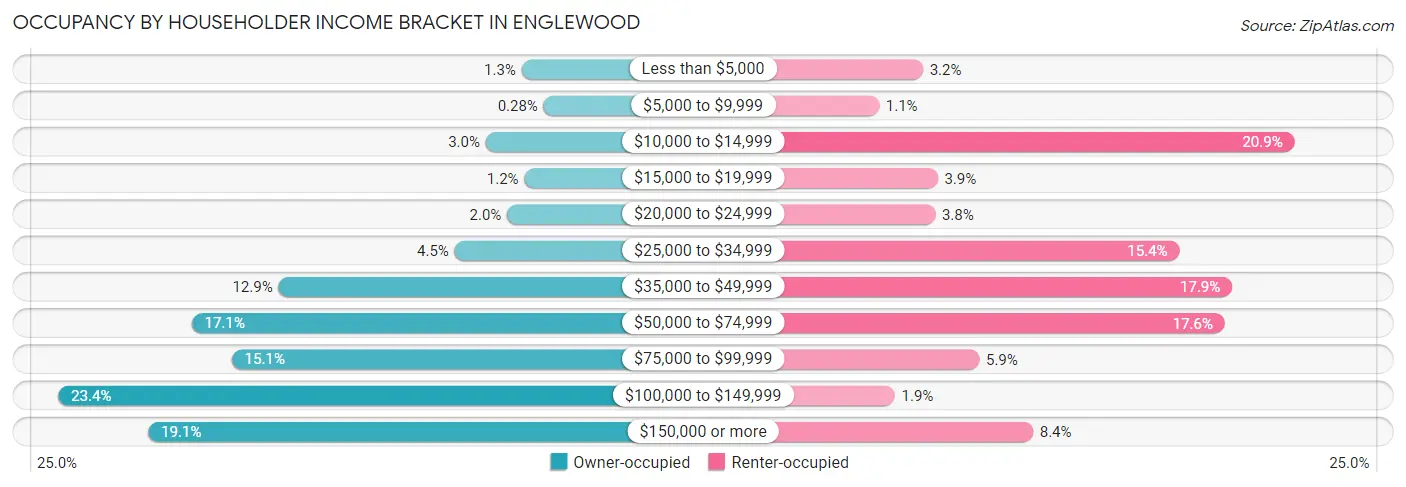
| Income Bracket | Owner-occupied | Renter-occupied |
| Less than $5,000 | 52 (1.3%) | 55 (3.2%) |
| $5,000 to $9,999 | 11 (0.3%) | 19 (1.1%) |
| $10,000 to $14,999 | 119 (3.0%) | 359 (20.9%) |
| $15,000 to $19,999 | 47 (1.2%) | 67 (3.9%) |
| $20,000 to $24,999 | 79 (2.0%) | 65 (3.8%) |
| $25,000 to $34,999 | 177 (4.5%) | 265 (15.4%) |
| $35,000 to $49,999 | 506 (12.9%) | 308 (17.9%) |
| $50,000 to $74,999 | 668 (17.1%) | 302 (17.6%) |
| $75,000 to $99,999 | 593 (15.1%) | 101 (5.9%) |
| $100,000 to $149,999 | 917 (23.4%) | 32 (1.9%) |
| $150,000 or more | 749 (19.1%) | 145 (8.4%) |
| Total | 3,918 (100.0%) | 1,718 (100.0%) |
Monthly Housing Cost Tiers in Englewood
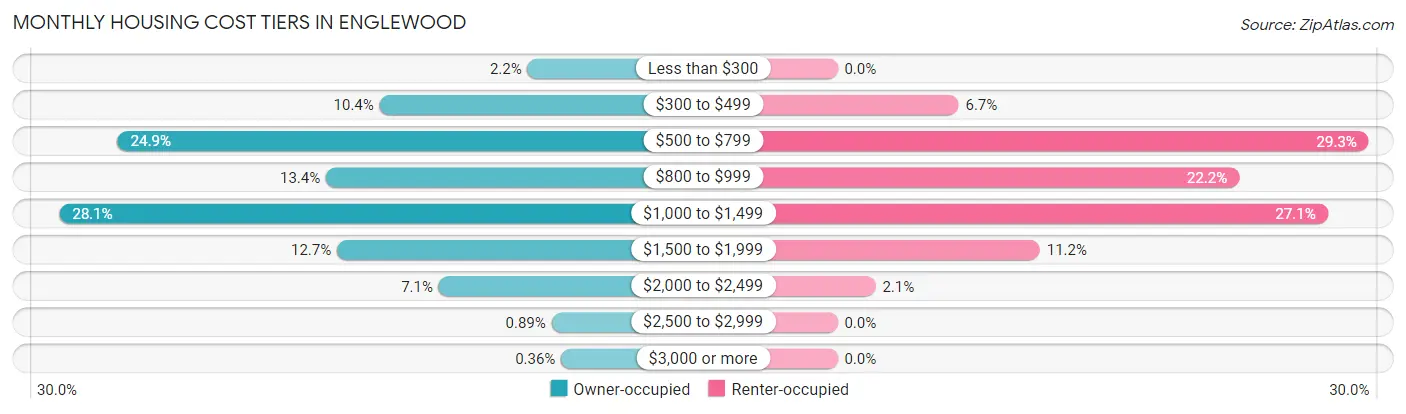
| Monthly Cost | Owner-occupied | Renter-occupied |
| Less than $300 | 87 (2.2%) | 0 (0.0%) |
| $300 to $499 | 407 (10.4%) | 115 (6.7%) |
| $500 to $799 | 974 (24.9%) | 504 (29.3%) |
| $800 to $999 | 523 (13.4%) | 381 (22.2%) |
| $1,000 to $1,499 | 1,100 (28.1%) | 465 (27.1%) |
| $1,500 to $1,999 | 499 (12.7%) | 192 (11.2%) |
| $2,000 to $2,499 | 279 (7.1%) | 36 (2.1%) |
| $2,500 to $2,999 | 35 (0.9%) | 0 (0.0%) |
| $3,000 or more | 14 (0.4%) | 0 (0.0%) |
| Total | 3,918 (100.0%) | 1,718 (100.0%) |
Physical Housing Characteristics in Englewood
Housing Structures in Englewood
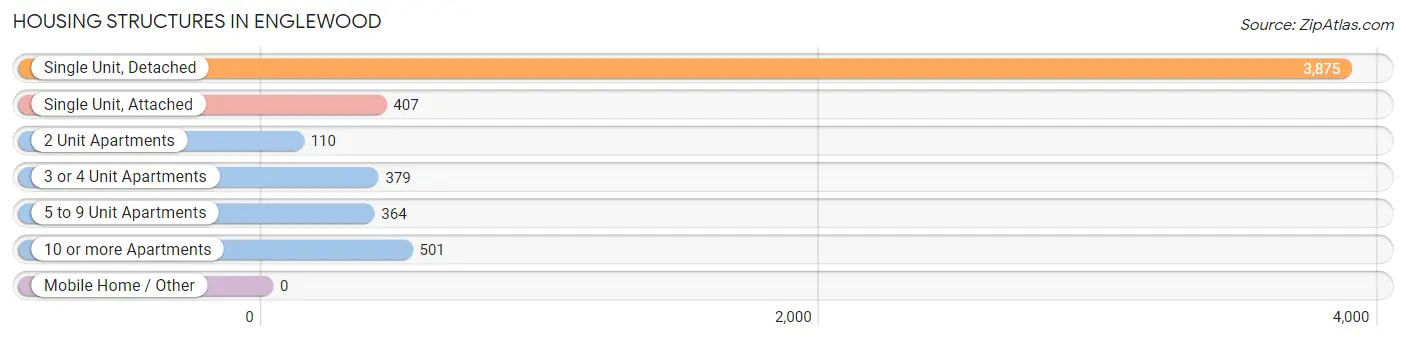
| Structure Type | # Housing Units | % Housing Units |
| Single Unit, Detached | 3,875 | 68.8% |
| Single Unit, Attached | 407 | 7.2% |
| 2 Unit Apartments | 110 | 1.9% |
| 3 or 4 Unit Apartments | 379 | 6.7% |
| 5 to 9 Unit Apartments | 364 | 6.5% |
| 10 or more Apartments | 501 | 8.9% |
| Mobile Home / Other | 0 | 0.0% |
| Total | 5,636 | 100.0% |
Housing Structures by Occupancy in Englewood
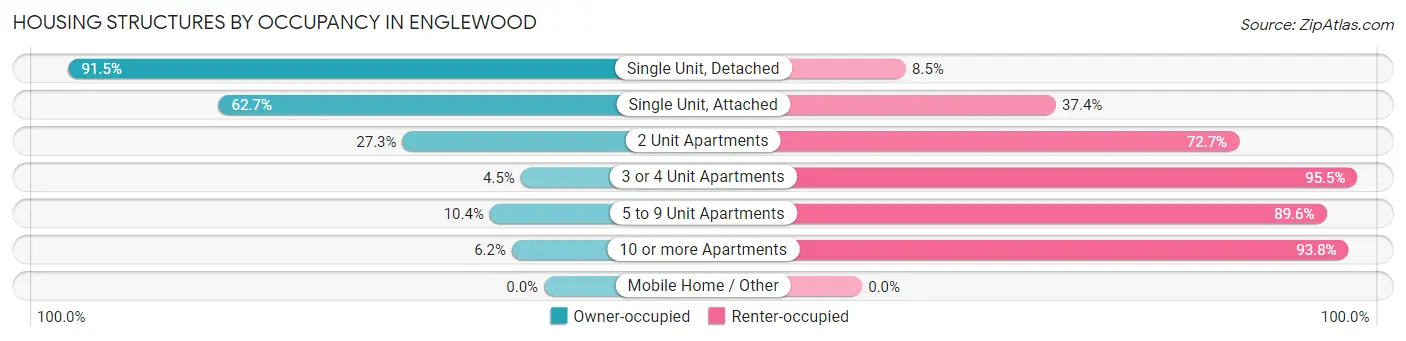
| Structure Type | Owner-occupied | Renter-occupied |
| Single Unit, Detached | 3,547 (91.5%) | 328 (8.5%) |
| Single Unit, Attached | 255 (62.6%) | 152 (37.3%) |
| 2 Unit Apartments | 30 (27.3%) | 80 (72.7%) |
| 3 or 4 Unit Apartments | 17 (4.5%) | 362 (95.5%) |
| 5 to 9 Unit Apartments | 38 (10.4%) | 326 (89.6%) |
| 10 or more Apartments | 31 (6.2%) | 470 (93.8%) |
| Mobile Home / Other | 0 (0.0%) | 0 (0.0%) |
| Total | 3,918 (69.5%) | 1,718 (30.5%) |
Housing Structures by Number of Rooms in Englewood
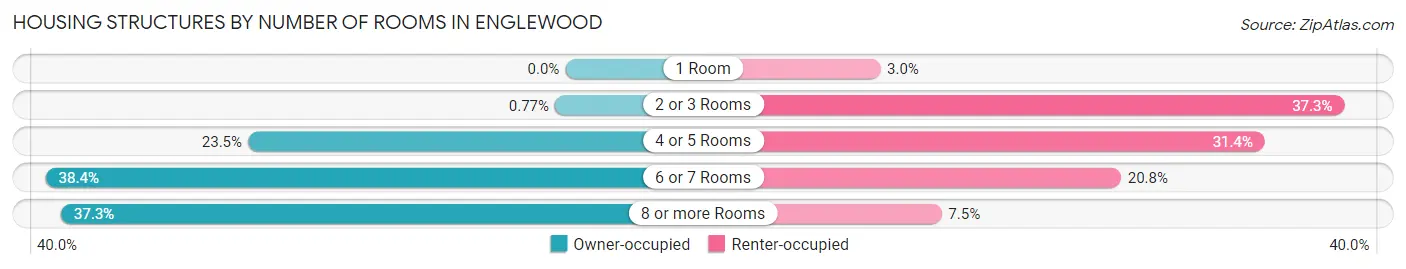
| Number of Rooms | Owner-occupied | Renter-occupied |
| 1 Room | 0 (0.0%) | 51 (3.0%) |
| 2 or 3 Rooms | 30 (0.8%) | 641 (37.3%) |
| 4 or 5 Rooms | 920 (23.5%) | 540 (31.4%) |
| 6 or 7 Rooms | 1,506 (38.4%) | 357 (20.8%) |
| 8 or more Rooms | 1,462 (37.3%) | 129 (7.5%) |
| Total | 3,918 (100.0%) | 1,718 (100.0%) |
Housing Structure by Heating Type in Englewood
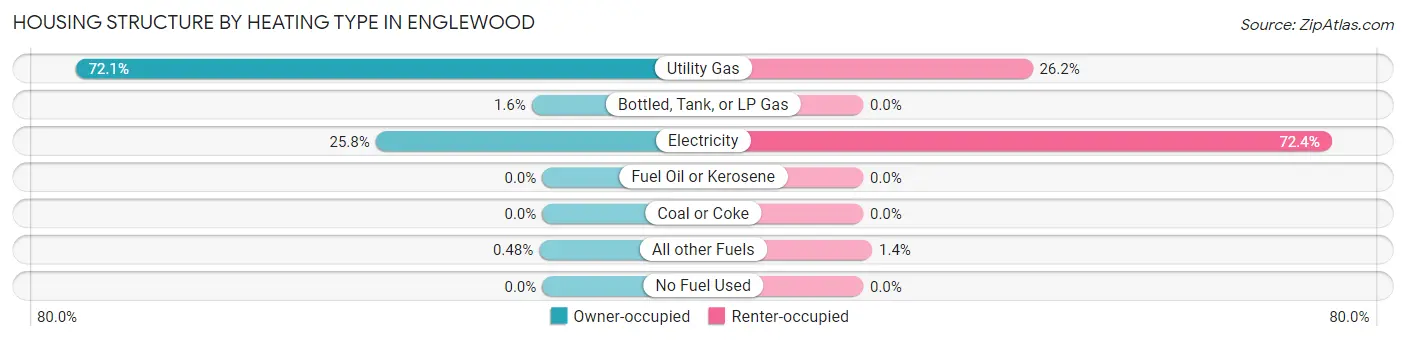
| Heating Type | Owner-occupied | Renter-occupied |
| Utility Gas | 2,826 (72.1%) | 450 (26.2%) |
| Bottled, Tank, or LP Gas | 64 (1.6%) | 0 (0.0%) |
| Electricity | 1,009 (25.8%) | 1,244 (72.4%) |
| Fuel Oil or Kerosene | 0 (0.0%) | 0 (0.0%) |
| Coal or Coke | 0 (0.0%) | 0 (0.0%) |
| All other Fuels | 19 (0.5%) | 24 (1.4%) |
| No Fuel Used | 0 (0.0%) | 0 (0.0%) |
| Total | 3,918 (100.0%) | 1,718 (100.0%) |
Household Vehicle Usage in Englewood
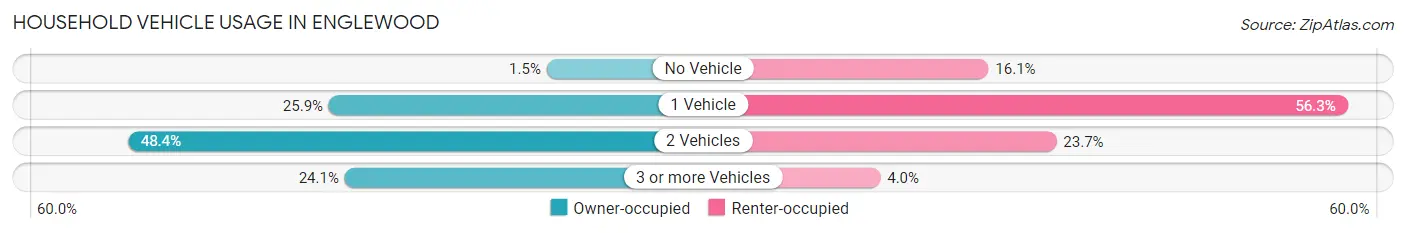
| Vehicles per Household | Owner-occupied | Renter-occupied |
| No Vehicle | 59 (1.5%) | 276 (16.1%) |
| 1 Vehicle | 1,015 (25.9%) | 967 (56.3%) |
| 2 Vehicles | 1,898 (48.4%) | 407 (23.7%) |
| 3 or more Vehicles | 946 (24.1%) | 68 (4.0%) |
| Total | 3,918 (100.0%) | 1,718 (100.0%) |
Real Estate & Mortgages in Englewood
Real Estate and Mortgage Overview in Englewood
| Characteristic | Without Mortgage | With Mortgage |
| Housing Units | 1,515 | 2,403 |
| Median Property Value | $153,700 | $167,100 |
| Median Household Income | $62,005 | $569 |
| Monthly Housing Costs | $565 | $14 |
| Real Estate Taxes | $2,988 | $81 |
Property Value by Mortgage Status in Englewood
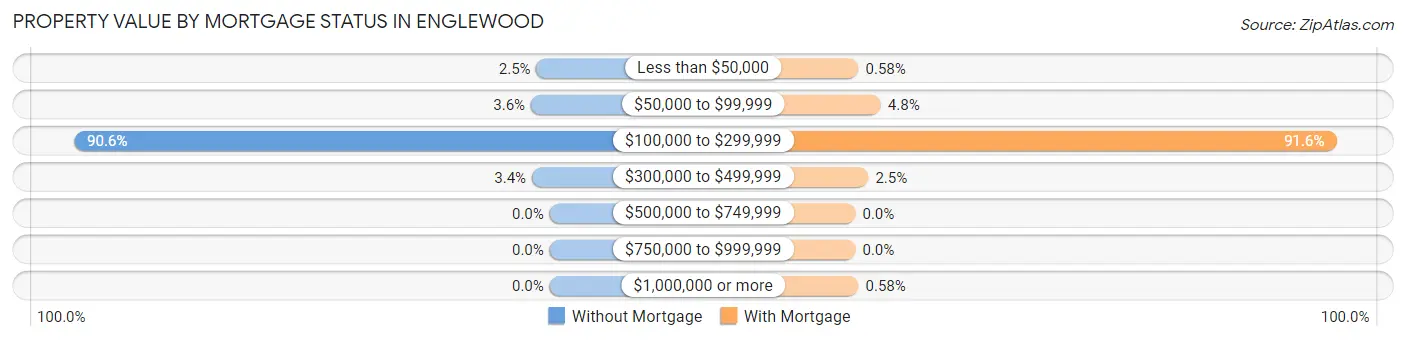
| Property Value | Without Mortgage | With Mortgage |
| Less than $50,000 | 38 (2.5%) | 14 (0.6%) |
| $50,000 to $99,999 | 54 (3.6%) | 116 (4.8%) |
| $100,000 to $299,999 | 1,372 (90.6%) | 2,200 (91.5%) |
| $300,000 to $499,999 | 51 (3.4%) | 59 (2.5%) |
| $500,000 to $749,999 | 0 (0.0%) | 0 (0.0%) |
| $750,000 to $999,999 | 0 (0.0%) | 0 (0.0%) |
| $1,000,000 or more | 0 (0.0%) | 14 (0.6%) |
| Total | 1,515 (100.0%) | 2,403 (100.0%) |
Household Income by Mortgage Status in Englewood
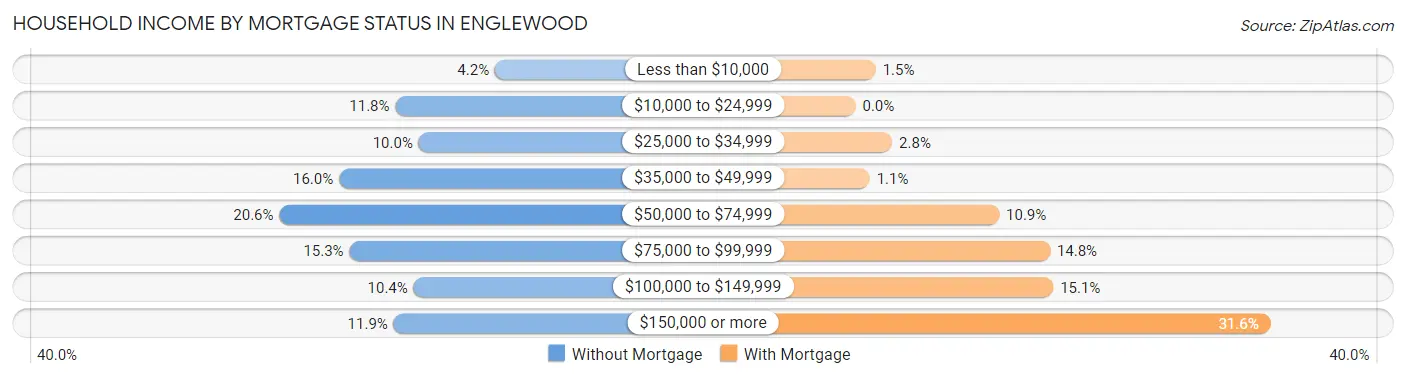
| Household Income | Without Mortgage | With Mortgage |
| Less than $10,000 | 63 (4.2%) | 37 (1.5%) |
| $10,000 to $24,999 | 178 (11.7%) | 0 (0.0%) |
| $25,000 to $34,999 | 151 (10.0%) | 67 (2.8%) |
| $35,000 to $49,999 | 243 (16.0%) | 26 (1.1%) |
| $50,000 to $74,999 | 312 (20.6%) | 263 (10.9%) |
| $75,000 to $99,999 | 231 (15.2%) | 356 (14.8%) |
| $100,000 to $149,999 | 157 (10.4%) | 362 (15.1%) |
| $150,000 or more | 180 (11.9%) | 760 (31.6%) |
| Total | 1,515 (100.0%) | 2,403 (100.0%) |
Property Value to Household Income Ratio in Englewood
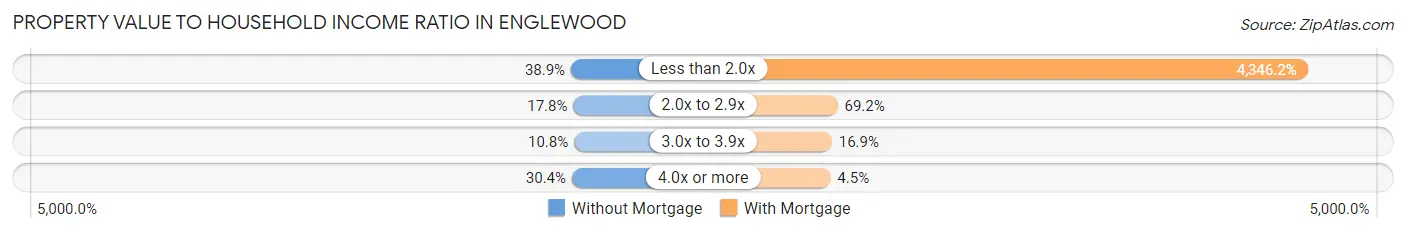
| Value-to-Income Ratio | Without Mortgage | With Mortgage |
| Less than 2.0x | 590 (38.9%) | 104,438 (4,346.2%) |
| 2.0x to 2.9x | 270 (17.8%) | 1,662 (69.2%) |
| 3.0x to 3.9x | 164 (10.8%) | 406 (16.9%) |
| 4.0x or more | 460 (30.4%) | 109 (4.5%) |
| Total | 1,515 (100.0%) | 2,403 (100.0%) |
Real Estate Taxes by Mortgage Status in Englewood
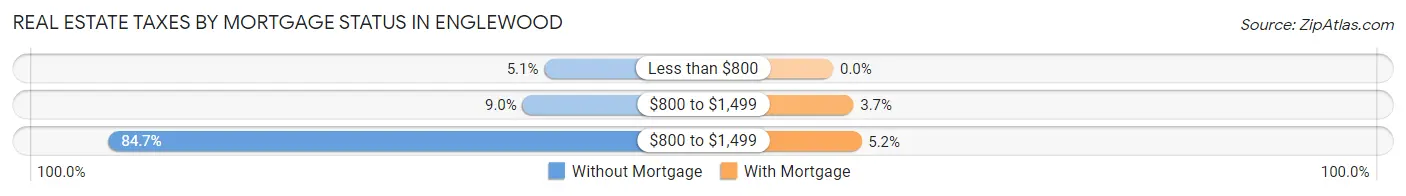
| Property Taxes | Without Mortgage | With Mortgage |
| Less than $800 | 77 (5.1%) | 0 (0.0%) |
| $800 to $1,499 | 137 (9.0%) | 89 (3.7%) |
| $800 to $1,499 | 1,283 (84.7%) | 124 (5.2%) |
| Total | 1,515 (100.0%) | 2,403 (100.0%) |
Health & Disability in Englewood
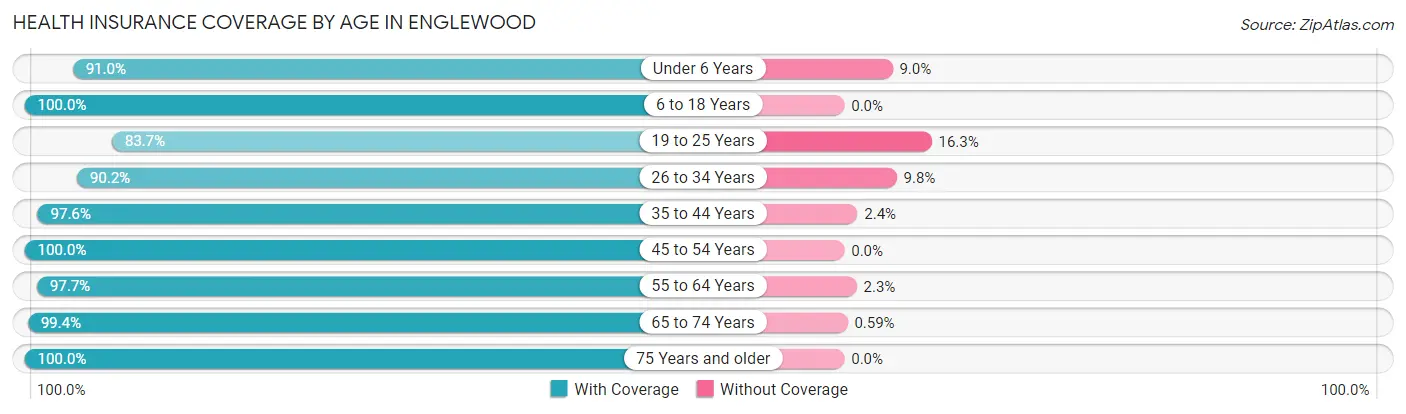
Health Insurance Coverage by Age in Englewood
| Age Bracket | With Coverage | Without Coverage |
| Under 6 Years | 1,013 (91.0%) | 100 (9.0%) |
| 6 to 18 Years | 2,341 (100.0%) | 0 (0.0%) |
| 19 to 25 Years | 638 (83.7%) | 124 (16.3%) |
| 26 to 34 Years | 1,035 (90.2%) | 112 (9.8%) |
| 35 to 44 Years | 1,567 (97.6%) | 39 (2.4%) |
| 45 to 54 Years | 1,326 (100.0%) | 0 (0.0%) |
| 55 to 64 Years | 1,997 (97.7%) | 47 (2.3%) |
| 65 to 74 Years | 1,529 (99.4%) | 9 (0.6%) |
| 75 Years and older | 1,180 (100.0%) | 0 (0.0%) |
| Total | 12,626 (96.7%) | 431 (3.3%) |
Health Insurance Coverage by Citizenship Status in Englewood
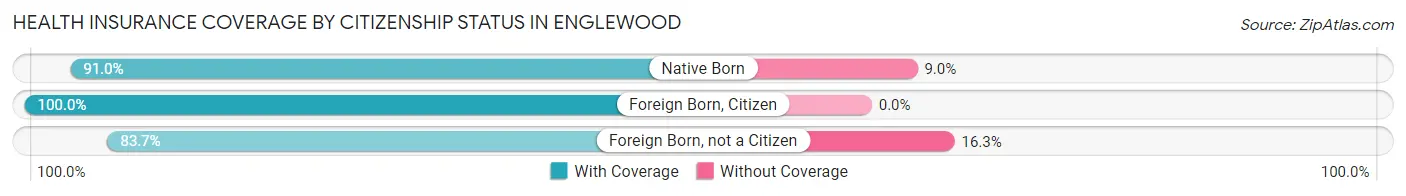
| Citizenship Status | With Coverage | Without Coverage |
| Native Born | 1,013 (91.0%) | 100 (9.0%) |
| Foreign Born, Citizen | 2,341 (100.0%) | 0 (0.0%) |
| Foreign Born, not a Citizen | 638 (83.7%) | 124 (16.3%) |
Health Insurance Coverage by Household Income in Englewood
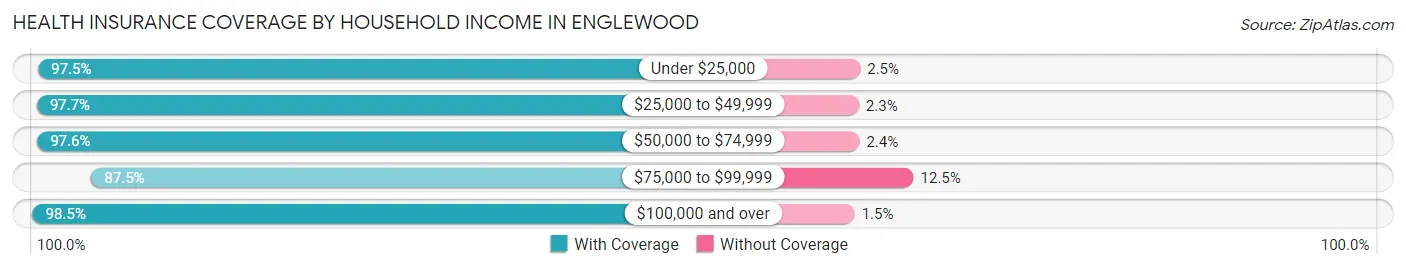
| Household Income | With Coverage | Without Coverage |
| Under $25,000 | 1,041 (97.5%) | 27 (2.5%) |
| $25,000 to $49,999 | 1,941 (97.7%) | 45 (2.3%) |
| $50,000 to $74,999 | 1,936 (97.6%) | 47 (2.4%) |
| $75,000 to $99,999 | 1,509 (87.5%) | 216 (12.5%) |
| $100,000 and over | 6,197 (98.5%) | 93 (1.5%) |
Public vs Private Health Insurance Coverage by Age in Englewood
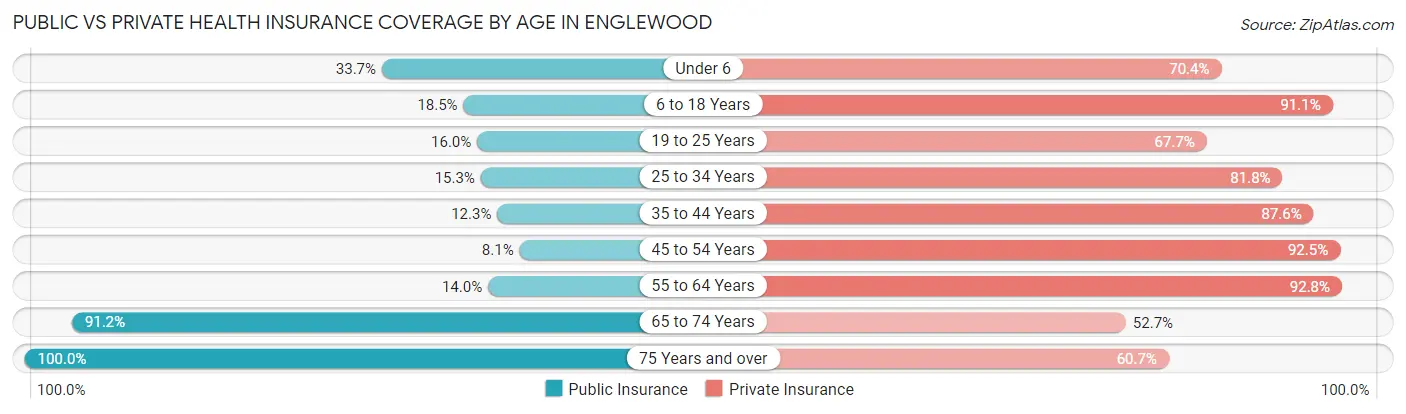
| Age Bracket | Public Insurance | Private Insurance |
| Under 6 | 375 (33.7%) | 784 (70.4%) |
| 6 to 18 Years | 434 (18.5%) | 2,132 (91.1%) |
| 19 to 25 Years | 122 (16.0%) | 516 (67.7%) |
| 25 to 34 Years | 176 (15.3%) | 938 (81.8%) |
| 35 to 44 Years | 197 (12.3%) | 1,406 (87.5%) |
| 45 to 54 Years | 108 (8.1%) | 1,226 (92.5%) |
| 55 to 64 Years | 286 (14.0%) | 1,897 (92.8%) |
| 65 to 74 Years | 1,403 (91.2%) | 811 (52.7%) |
| 75 Years and over | 1,180 (100.0%) | 716 (60.7%) |
| Total | 4,281 (32.8%) | 10,426 (79.8%) |
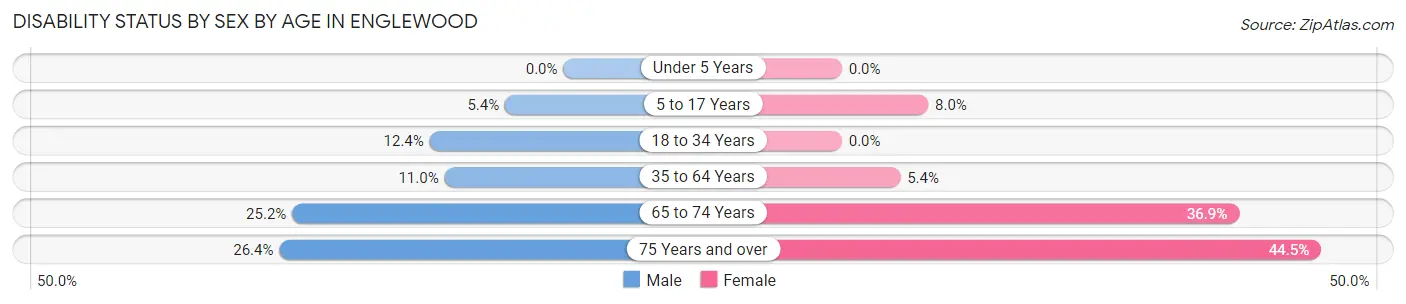
Disability Status by Sex by Age in Englewood
| Age Bracket | Male | Female |
| Under 5 Years | 0 (0.0%) | 0 (0.0%) |
| 5 to 17 Years | 69 (5.4%) | 94 (8.0%) |
| 18 to 34 Years | 131 (12.4%) | 0 (0.0%) |
| 35 to 64 Years | 266 (11.0%) | 139 (5.4%) |
| 65 to 74 Years | 185 (25.2%) | 296 (36.9%) |
| 75 Years and over | 87 (26.4%) | 378 (44.5%) |
Disability Class by Sex by Age in Englewood
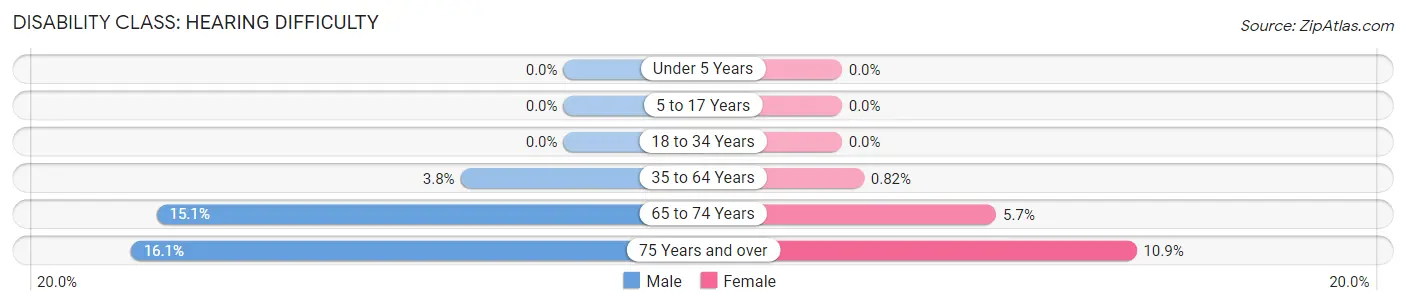
Disability Class: Hearing Difficulty
| Age Bracket | Male | Female |
| Under 5 Years | 0 (0.0%) | 0 (0.0%) |
| 5 to 17 Years | 0 (0.0%) | 0 (0.0%) |
| 18 to 34 Years | 0 (0.0%) | 0 (0.0%) |
| 35 to 64 Years | 92 (3.8%) | 21 (0.8%) |
| 65 to 74 Years | 111 (15.1%) | 46 (5.7%) |
| 75 Years and over | 53 (16.1%) | 93 (10.9%) |
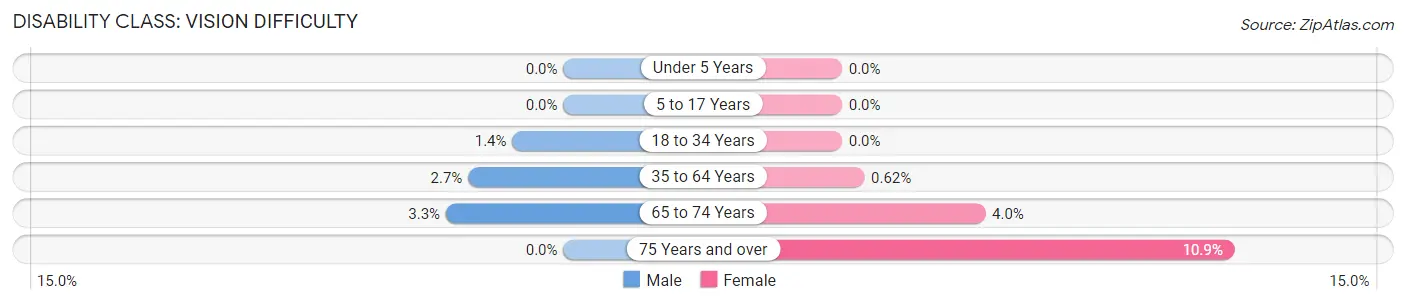
Disability Class: Vision Difficulty
| Age Bracket | Male | Female |
| Under 5 Years | 0 (0.0%) | 0 (0.0%) |
| 5 to 17 Years | 0 (0.0%) | 0 (0.0%) |
| 18 to 34 Years | 15 (1.4%) | 0 (0.0%) |
| 35 to 64 Years | 64 (2.6%) | 16 (0.6%) |
| 65 to 74 Years | 24 (3.3%) | 32 (4.0%) |
| 75 Years and over | 0 (0.0%) | 93 (10.9%) |
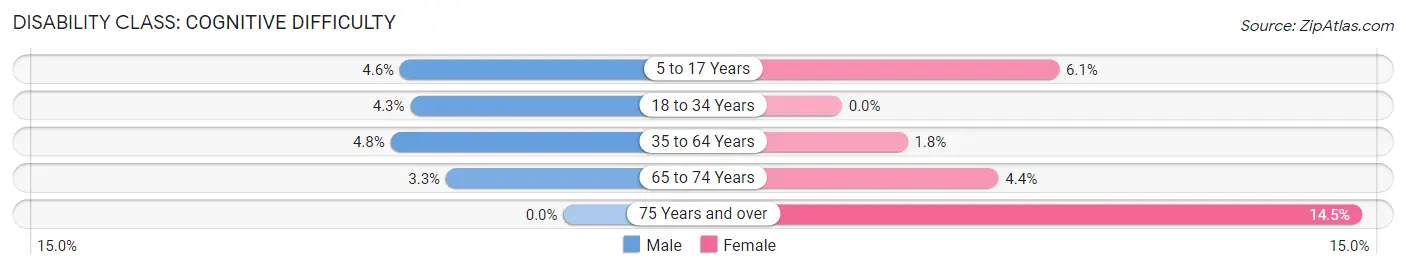
Disability Class: Cognitive Difficulty
| Age Bracket | Male | Female |
| 5 to 17 Years | 58 (4.5%) | 71 (6.0%) |
| 18 to 34 Years | 45 (4.3%) | 0 (0.0%) |
| 35 to 64 Years | 116 (4.8%) | 47 (1.8%) |
| 65 to 74 Years | 24 (3.3%) | 35 (4.4%) |
| 75 Years and over | 0 (0.0%) | 123 (14.5%) |
Disability Class: Ambulatory Difficulty
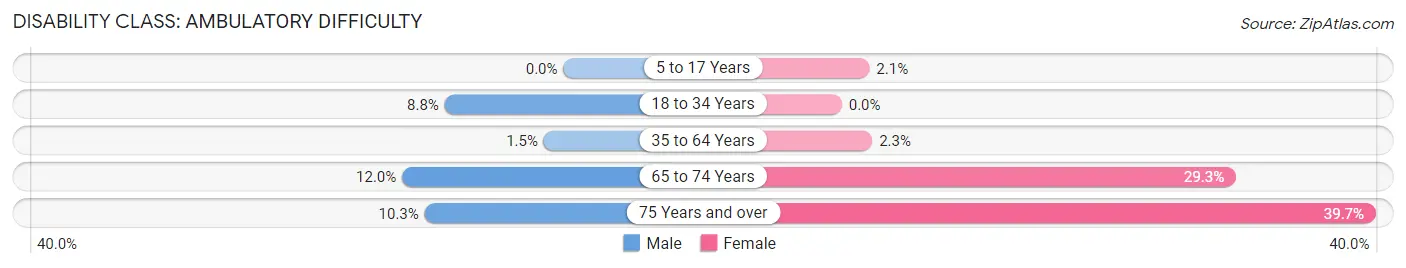
| Age Bracket | Male | Female |
| 5 to 17 Years | 0 (0.0%) | 24 (2.1%) |
| 18 to 34 Years | 93 (8.8%) | 0 (0.0%) |
| 35 to 64 Years | 35 (1.5%) | 58 (2.3%) |
| 65 to 74 Years | 88 (12.0%) | 235 (29.3%) |
| 75 Years and over | 34 (10.3%) | 337 (39.7%) |
Disability Class: Self-Care Difficulty
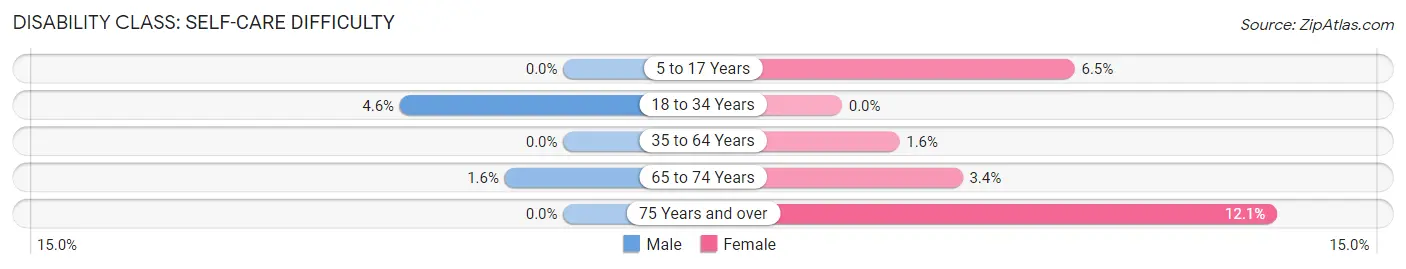
| Age Bracket | Male | Female |
| 5 to 17 Years | 0 (0.0%) | 76 (6.5%) |
| 18 to 34 Years | 48 (4.5%) | 0 (0.0%) |
| 35 to 64 Years | 0 (0.0%) | 41 (1.6%) |
| 65 to 74 Years | 12 (1.6%) | 27 (3.4%) |
| 75 Years and over | 0 (0.0%) | 103 (12.1%) |
Technology Access in Englewood
Computing Device Access in Englewood
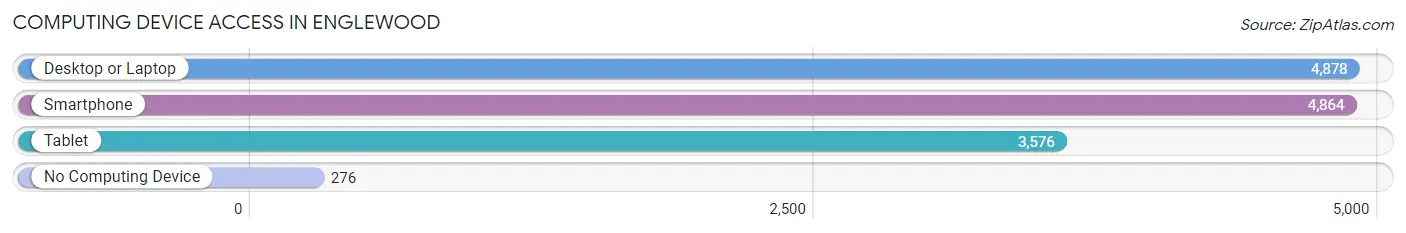
| Device Type | # Households | % Households |
| Desktop or Laptop | 4,878 | 86.6% |
| Smartphone | 4,864 | 86.3% |
| Tablet | 3,576 | 63.4% |
| No Computing Device | 276 | 4.9% |
| Total | 5,636 | 100.0% |
Internet Access in Englewood
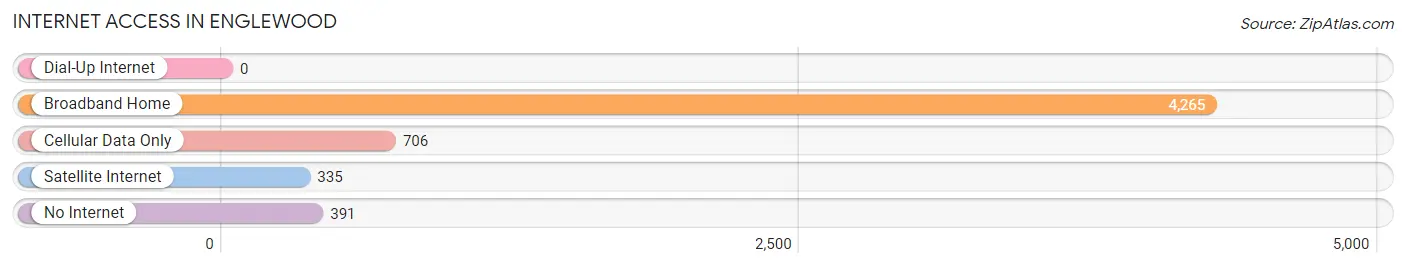
| Internet Type | # Households | % Households |
| Dial-Up Internet | 0 | 0.0% |
| Broadband Home | 4,265 | 75.7% |
| Cellular Data Only | 706 | 12.5% |
| Satellite Internet | 335 | 5.9% |
| No Internet | 391 | 6.9% |
| Total | 5,636 | 100.0% |
Englewood Summary
Englewood, Ohio is a small city located in Montgomery County, Ohio. It is situated approximately 10 miles north of Dayton and is part of the Dayton Metropolitan Statistical Area. The city has a population of approximately 8,000 people and is known for its small-town charm and friendly atmosphere.
History
Englewood was founded in 1851 by a group of settlers from Pennsylvania. The city was named after the nearby Englewood Creek, which was named after a nearby farm owned by the Engle family. The city was incorporated in 1871 and was originally a farming community. In the late 19th century, the city began to grow and develop as a manufacturing center. The city was home to several factories, including the Englewood Manufacturing Company, which produced furniture, and the Englewood Paper Company, which produced paper products.
Geography
Englewood is located in the Miami Valley region of Ohio. The city is situated on the western edge of Montgomery County, approximately 10 miles north of Dayton. The city is bordered by the cities of Clayton, Union, and Trotwood. The city is situated on the banks of the Stillwater River, which flows through the city. The city is also located near the Englewood MetroPark, which offers a variety of recreational activities.
Economy
Englewood’s economy is largely based on manufacturing and retail. The city is home to several factories, including the Englewood Manufacturing Company, which produces furniture, and the Englewood Paper Company, which produces paper products. The city is also home to several retail stores, including a Walmart Supercenter, a Kroger grocery store, and several restaurants.
Demographics
As of the 2010 census, Englewood had a population of 8,000 people. The racial makeup of the city was 79.2% White, 15.2% African American, 0.3% Native American, 0.7% Asian, 0.1% Pacific Islander, and 4.5% from other races. The median household income was $37,941, and the median family income was $45,941. The per capita income was $19,941.
Englewood is a small city with a friendly atmosphere and a rich history. The city is home to several factories and retail stores, and is a great place to live and work. The city is also home to a variety of recreational activities, including the Englewood MetroPark. The city has a diverse population and a strong economy, making it a great place to call home.
Common Questions
What is Per Capita Income in Englewood?
Per Capita income in Englewood is $37,070.
What is the Median Family Income in Englewood?
Median Family Income in Englewood is $92,500.
What is the Median Household income in Englewood?
Median Household Income in Englewood is $67,769.
What is Income or Wage Gap in Englewood?
Income or Wage Gap in Englewood is 21.1%.
Women in Englewood earn 78.9 cents for every dollar earned by a man.
What is Inequality or Gini Index in Englewood?
Inequality or Gini Index in Englewood is 0.42.
What is the Total Population of Englewood?
Total Population of Englewood is 13,433.
What is the Total Male Population of Englewood?
Total Male Population of Englewood is 6,206.
What is the Total Female Population of Englewood?
Total Female Population of Englewood is 7,227.
What is the Ratio of Males per 100 Females in Englewood?
There are 85.87 Males per 100 Females in Englewood.
What is the Ratio of Females per 100 Males in Englewood?
There are 116.45 Females per 100 Males in Englewood.
What is the Median Population Age in Englewood?
Median Population Age in Englewood is 43.1 Years.
What is the Average Family Size in Englewood
Average Family Size in Englewood is 3.1 People.
What is the Average Household Size in Englewood
Average Household Size in Englewood is 2.3 People.
How Large is the Labor Force in Englewood?
There are 6,423 People in the Labor Forcein in Englewood.
What is the Percentage of People in the Labor Force in Englewood?
61.7% of People are in the Labor Force in Englewood.
What is the Unemployment Rate in Englewood?
Unemployment Rate in Englewood is 4.6%.