Tipp City, OH Map & Demographics
Tipp City Map
Tipp City Overview
$46,391
PER CAPITA INCOME
$101,176
AVG FAMILY INCOME
$74,178
AVG HOUSEHOLD INCOME
43.4%
WAGE / INCOME GAP [ % ]
56.6¢/ $1
WAGE / INCOME GAP [ $ ]
0.44
INEQUALITY / GINI INDEX
10,266
TOTAL POPULATION
4,988
MALE POPULATION
5,278
FEMALE POPULATION
94.51
MALES / 100 FEMALES
105.81
FEMALES / 100 MALES
40.1
MEDIAN AGE
2.9
AVG FAMILY SIZE
2.4
AVG HOUSEHOLD SIZE
5,418
LABOR FORCE [ PEOPLE ]
65.9%
PERCENT IN LABOR FORCE
0.9%
UNEMPLOYMENT RATE
Tipp City Zip Codes
Tipp City Area Codes
Income in Tipp City
Income Overview in Tipp City
Per Capita Income in Tipp City is $46,391, while median incomes of families and households are $101,176 and $74,178 respectively.
| Characteristic | Number | Measure |
| Per Capita Income | 10,266 | $46,391 |
| Median Family Income | 2,924 | $101,176 |
| Mean Family Income | 2,924 | $128,867 |
| Median Household Income | 4,299 | $74,178 |
| Mean Household Income | 4,299 | $108,434 |
| Income Deficit | 2,924 | $0 |
| Wage / Income Gap (%) | 10,266 | 43.36% |
| Wage / Income Gap ($) | 10,266 | 56.64¢ per $1 |
| Gini / Inequality Index | 10,266 | 0.44 |
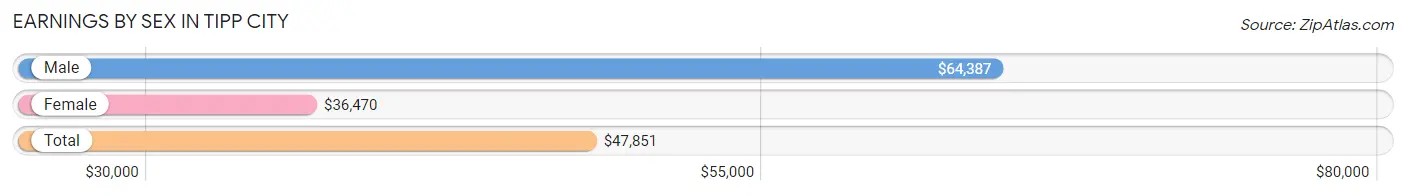
Earnings by Sex in Tipp City
Average Earnings in Tipp City are $47,851, $64,387 for men and $36,470 for women, a difference of 43.4%.
| Sex | Number | Average Earnings |
| Male | 3,022 (53.9%) | $64,387 |
| Female | 2,585 (46.1%) | $36,470 |
| Total | 5,607 (100.0%) | $47,851 |
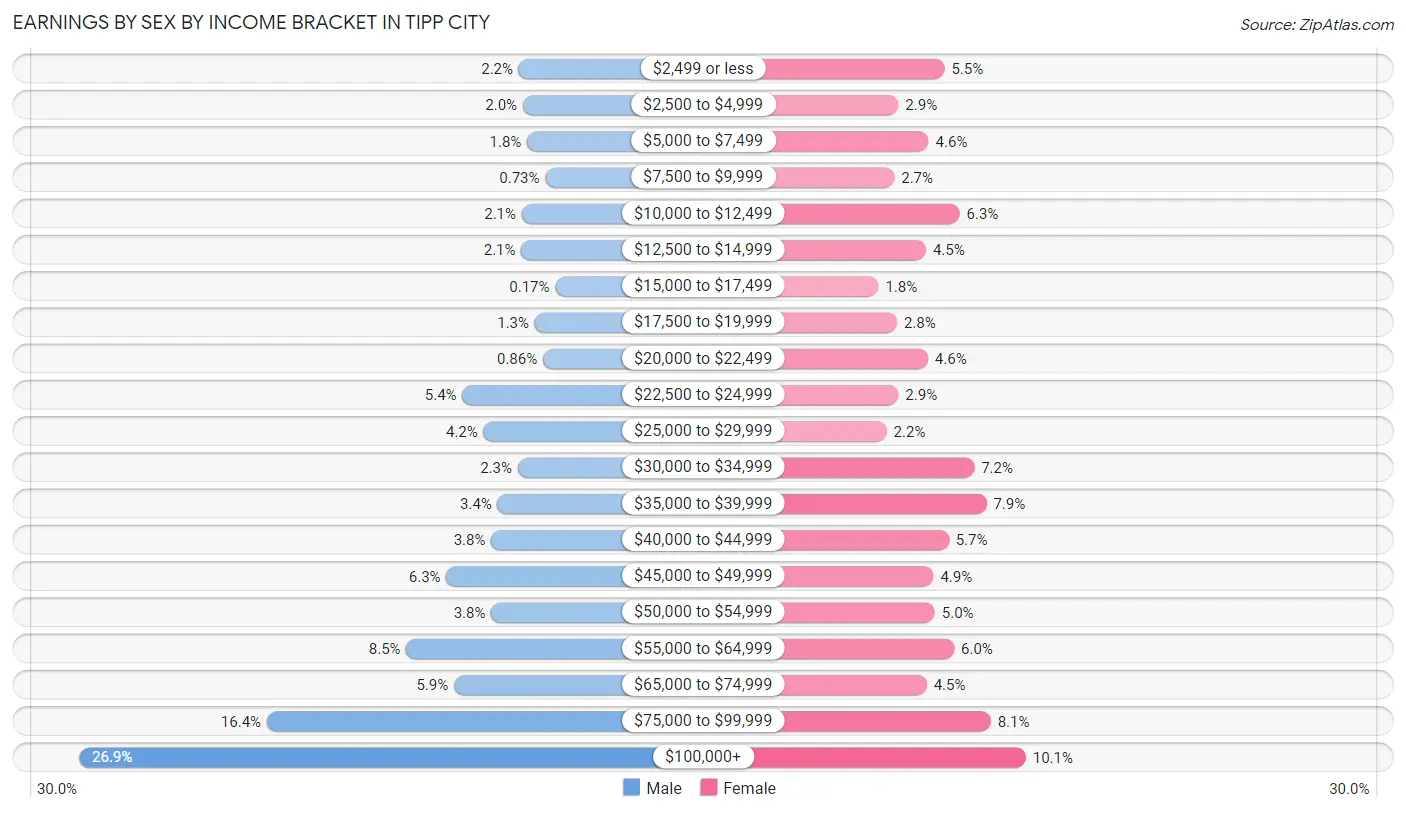
Earnings by Sex by Income Bracket in Tipp City
The most common earnings brackets in Tipp City are $100,000+ for men (814 | 26.9%) and $100,000+ for women (260 | 10.1%).
| Income | Male | Female |
| $2,499 or less | 67 (2.2%) | 142 (5.5%) |
| $2,500 to $4,999 | 60 (2.0%) | 75 (2.9%) |
| $5,000 to $7,499 | 53 (1.8%) | 119 (4.6%) |
| $7,500 to $9,999 | 22 (0.7%) | 69 (2.7%) |
| $10,000 to $12,499 | 62 (2.1%) | 164 (6.3%) |
| $12,500 to $14,999 | 63 (2.1%) | 115 (4.4%) |
| $15,000 to $17,499 | 5 (0.2%) | 46 (1.8%) |
| $17,500 to $19,999 | 40 (1.3%) | 73 (2.8%) |
| $20,000 to $22,499 | 26 (0.9%) | 118 (4.6%) |
| $22,500 to $24,999 | 163 (5.4%) | 75 (2.9%) |
| $25,000 to $29,999 | 127 (4.2%) | 58 (2.2%) |
| $30,000 to $34,999 | 69 (2.3%) | 185 (7.2%) |
| $35,000 to $39,999 | 103 (3.4%) | 203 (7.9%) |
| $40,000 to $44,999 | 114 (3.8%) | 148 (5.7%) |
| $45,000 to $49,999 | 190 (6.3%) | 126 (4.9%) |
| $50,000 to $54,999 | 114 (3.8%) | 128 (5.0%) |
| $55,000 to $64,999 | 258 (8.5%) | 156 (6.0%) |
| $65,000 to $74,999 | 177 (5.9%) | 116 (4.5%) |
| $75,000 to $99,999 | 495 (16.4%) | 209 (8.1%) |
| $100,000+ | 814 (26.9%) | 260 (10.1%) |
| Total | 3,022 (100.0%) | 2,585 (100.0%) |
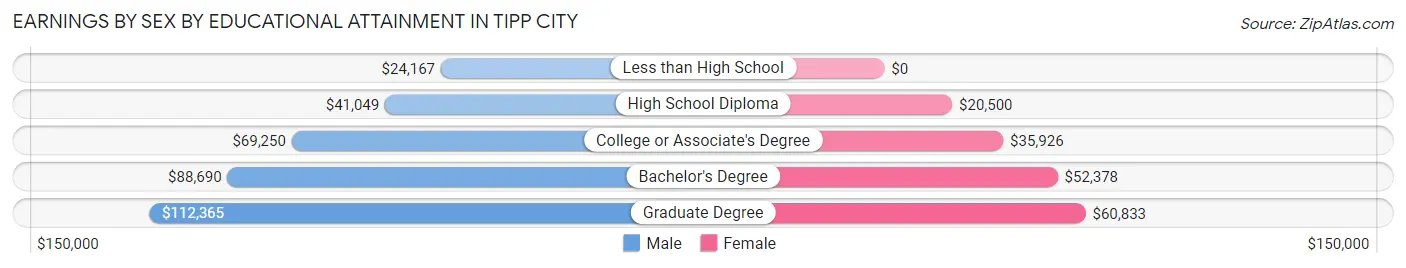
Earnings by Sex by Educational Attainment in Tipp City
Average earnings in Tipp City are $73,795 for men and $40,923 for women, a difference of 44.6%. Men with an educational attainment of graduate degree enjoy the highest average annual earnings of $112,365, while those with less than high school education earn the least with $24,167. Women with an educational attainment of graduate degree earn the most with the average annual earnings of $60,833, while those with high school diploma education have the smallest earnings of $20,500.
| Educational Attainment | Male Income | Female Income |
| Less than High School | $24,167 | $0 |
| High School Diploma | $41,049 | $20,500 |
| College or Associate's Degree | $69,250 | $35,926 |
| Bachelor's Degree | $88,690 | $52,378 |
| Graduate Degree | $112,365 | $60,833 |
| Total | $73,795 | $40,923 |
Family Income in Tipp City
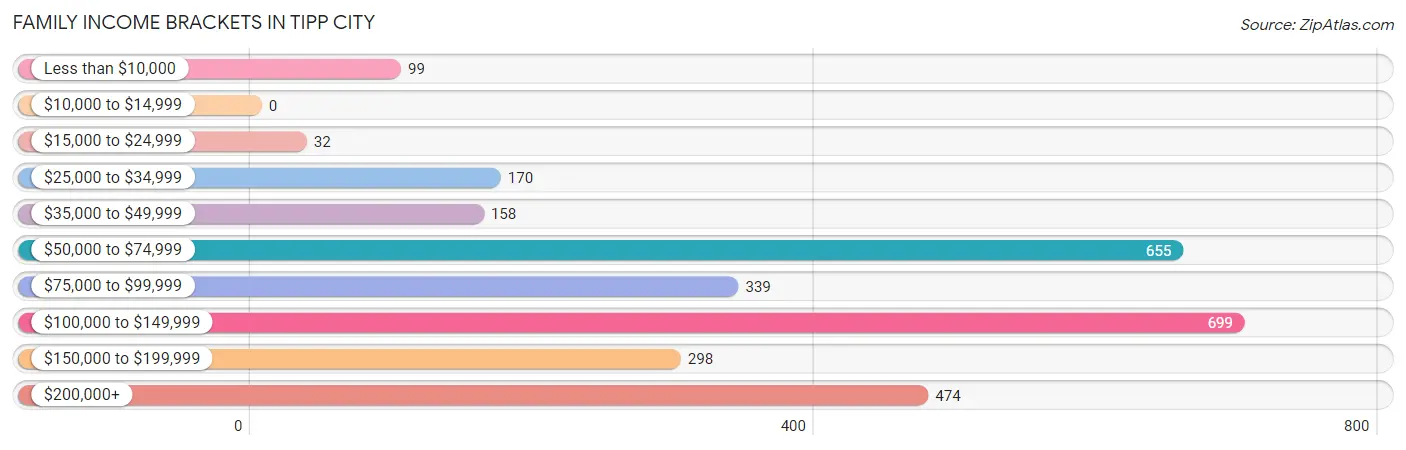
Family Income Brackets in Tipp City
According to the Tipp City family income data, there are 699 families falling into the $100,000 to $149,999 income range, which is the most common income bracket and makes up 23.9% of all families.
| Income Bracket | # Families | % Families |
| Less than $10,000 | 99 | 3.4% |
| $10,000 to $14,999 | 0 | 0.0% |
| $15,000 to $24,999 | 32 | 1.1% |
| $25,000 to $34,999 | 170 | 5.8% |
| $35,000 to $49,999 | 158 | 5.4% |
| $50,000 to $74,999 | 655 | 22.4% |
| $75,000 to $99,999 | 339 | 11.6% |
| $100,000 to $149,999 | 699 | 23.9% |
| $150,000 to $199,999 | 298 | 10.2% |
| $200,000+ | 474 | 16.2% |
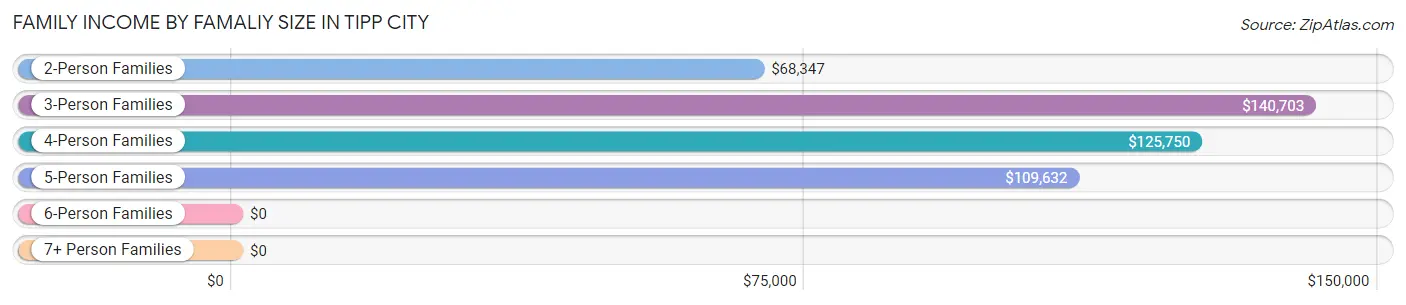
Family Income by Famaliy Size in Tipp City
3-person families (481 | 16.5%) account for the highest median family income in Tipp City with $140,703 per family, while 3-person families (481 | 16.5%) have the highest median income of $46,901 per family member.
| Income Bracket | # Families | Median Income |
| 2-Person Families | 1,538 (52.6%) | $68,347 |
| 3-Person Families | 481 (16.5%) | $140,703 |
| 4-Person Families | 592 (20.3%) | $125,750 |
| 5-Person Families | 217 (7.4%) | $109,632 |
| 6-Person Families | 96 (3.3%) | $0 |
| 7+ Person Families | 0 (0.0%) | $0 |
| Total | 2,924 (100.0%) | $101,176 |
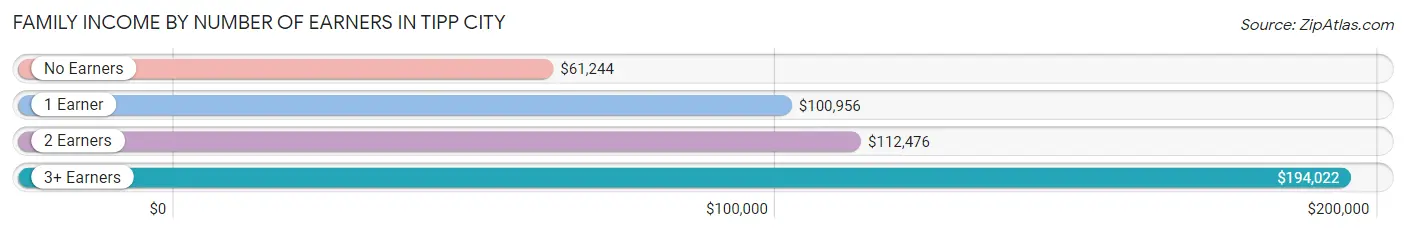
Family Income by Number of Earners in Tipp City
The median family income in Tipp City is $101,176, with families comprising 3+ earners (276) having the highest median family income of $194,022, while families with no earners (564) have the lowest median family income of $61,244, accounting for 9.4% and 19.3% of families, respectively.
| Number of Earners | # Families | Median Income |
| No Earners | 564 (19.3%) | $61,244 |
| 1 Earner | 671 (23.0%) | $100,956 |
| 2 Earners | 1,413 (48.3%) | $112,476 |
| 3+ Earners | 276 (9.4%) | $194,022 |
| Total | 2,924 (100.0%) | $101,176 |
Household Income in Tipp City
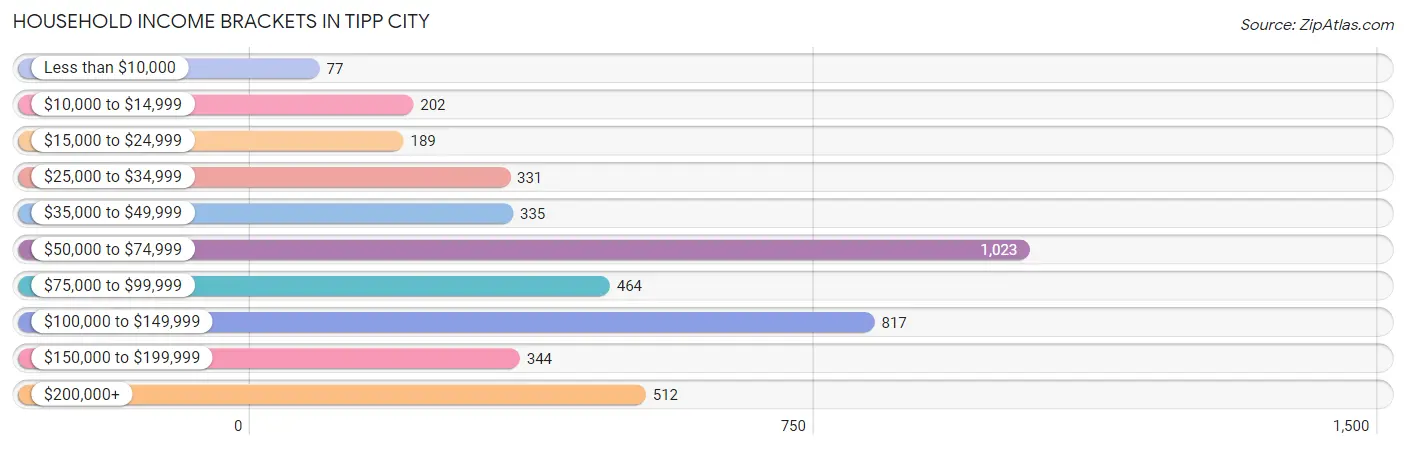
Household Income Brackets in Tipp City
With 1,023 households falling in the category, the $50,000 to $74,999 income range is the most frequent in Tipp City, accounting for 23.8% of all households. In contrast, only 77 households (1.8%) fall into the less than $10,000 income bracket, making it the least populous group.
| Income Bracket | # Households | % Households |
| Less than $10,000 | 77 | 1.8% |
| $10,000 to $14,999 | 202 | 4.7% |
| $15,000 to $24,999 | 189 | 4.4% |
| $25,000 to $34,999 | 331 | 7.7% |
| $35,000 to $49,999 | 335 | 7.8% |
| $50,000 to $74,999 | 1,023 | 23.8% |
| $75,000 to $99,999 | 464 | 10.8% |
| $100,000 to $149,999 | 817 | 19.0% |
| $150,000 to $199,999 | 344 | 8.0% |
| $200,000+ | 512 | 11.9% |
Household Income by Householder Age in Tipp City
The median household income in Tipp City is $74,178, with the highest median household income of $118,882 found in the 45 to 64 years age bracket for the primary householder. A total of 1,504 households (35.0%) fall into this category. Meanwhile, the 15 to 24 years age bracket for the primary householder has the lowest median household income of $0, with 130 households (3.0%) in this group.
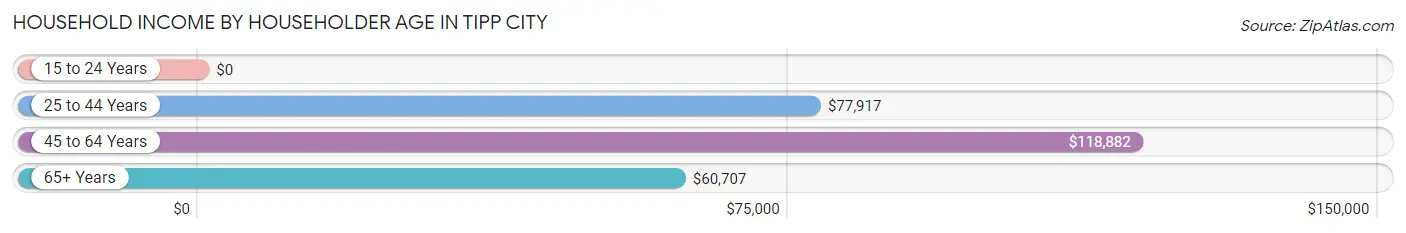
| Income Bracket | # Households | Median Income |
| 15 to 24 Years | 130 (3.0%) | $0 |
| 25 to 44 Years | 1,453 (33.8%) | $77,917 |
| 45 to 64 Years | 1,504 (35.0%) | $118,882 |
| 65+ Years | 1,212 (28.2%) | $60,707 |
| Total | 4,299 (100.0%) | $74,178 |
Poverty in Tipp City
Income Below Poverty by Sex and Age in Tipp City
With 4.1% poverty level for males and 6.4% for females among the residents of Tipp City, under 5 year old males and 25 to 34 year old females are the most vulnerable to poverty, with 101 males (43.2%) and 159 females (23.8%) in their respective age groups living below the poverty level.
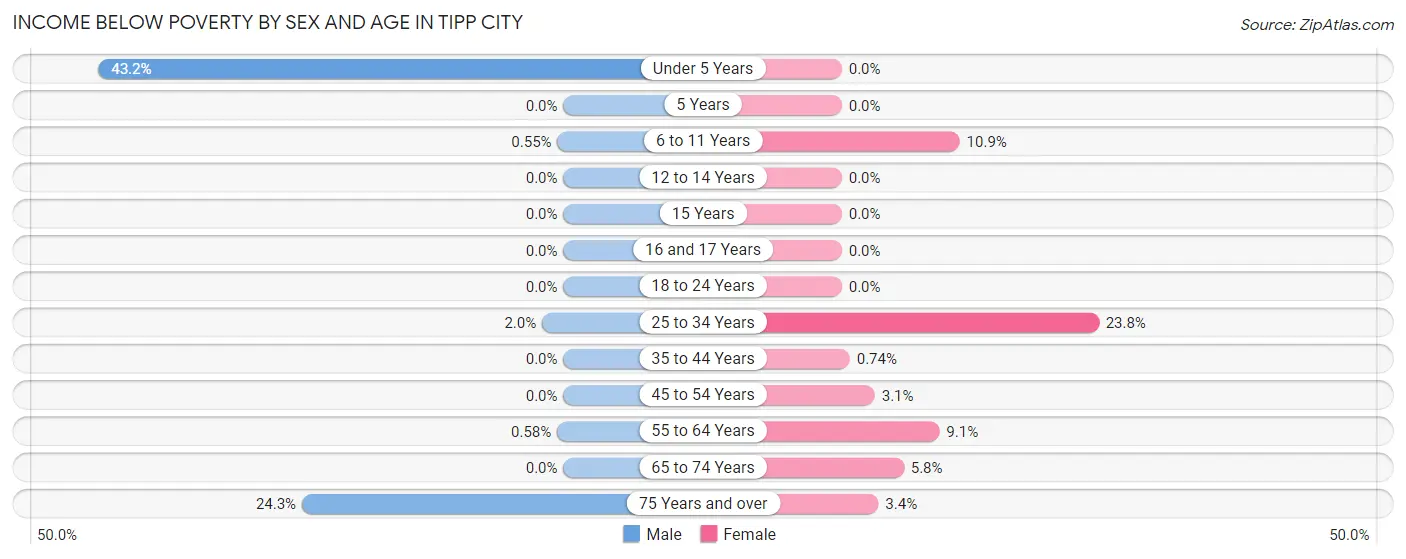
| Age Bracket | Male | Female |
| Under 5 Years | 101 (43.2%) | 0 (0.0%) |
| 5 Years | 0 (0.0%) | 0 (0.0%) |
| 6 to 11 Years | 2 (0.5%) | 51 (10.9%) |
| 12 to 14 Years | 0 (0.0%) | 0 (0.0%) |
| 15 Years | 0 (0.0%) | 0 (0.0%) |
| 16 and 17 Years | 0 (0.0%) | 0 (0.0%) |
| 18 to 24 Years | 0 (0.0%) | 0 (0.0%) |
| 25 to 34 Years | 13 (2.0%) | 159 (23.8%) |
| 35 to 44 Years | 0 (0.0%) | 5 (0.7%) |
| 45 to 54 Years | 0 (0.0%) | 20 (3.1%) |
| 55 to 64 Years | 4 (0.6%) | 50 (9.1%) |
| 65 to 74 Years | 0 (0.0%) | 32 (5.8%) |
| 75 Years and over | 82 (24.3%) | 18 (3.4%) |
| Total | 202 (4.1%) | 335 (6.4%) |
Income Above Poverty by Sex and Age in Tipp City
According to the poverty statistics in Tipp City, males aged 5 years and females aged under 5 years are the age groups that are most secure financially, with 100.0% of males and 100.0% of females in these age groups living above the poverty line.
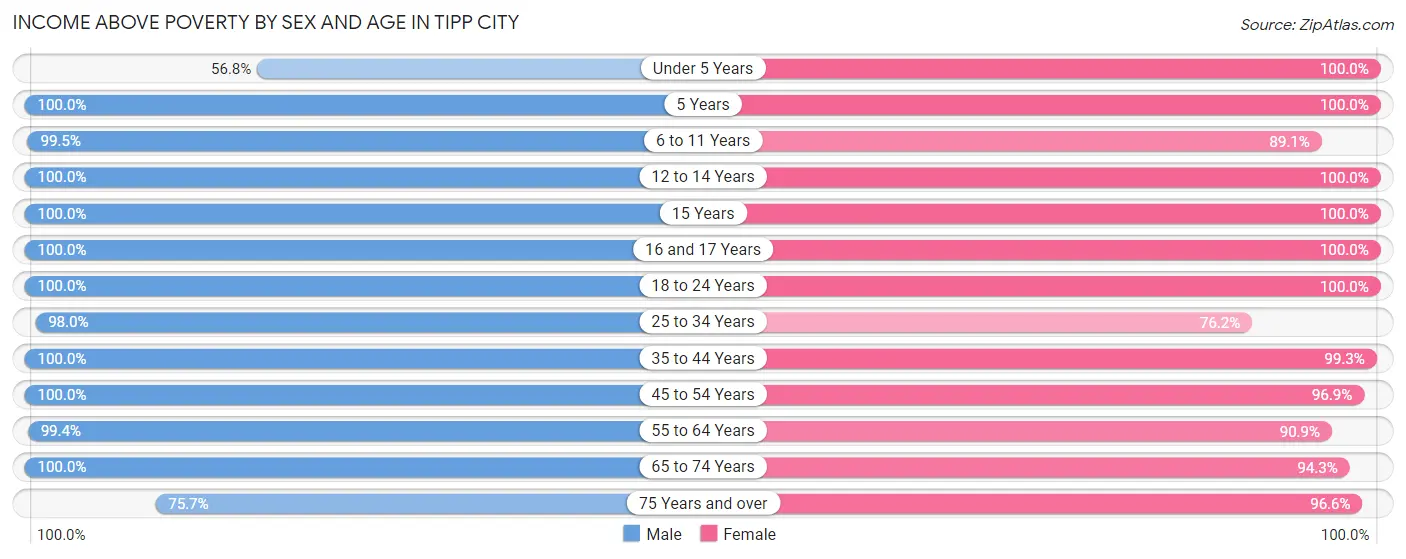
| Age Bracket | Male | Female |
| Under 5 Years | 133 (56.8%) | 225 (100.0%) |
| 5 Years | 87 (100.0%) | 59 (100.0%) |
| 6 to 11 Years | 359 (99.5%) | 415 (89.1%) |
| 12 to 14 Years | 225 (100.0%) | 253 (100.0%) |
| 15 Years | 34 (100.0%) | 99 (100.0%) |
| 16 and 17 Years | 111 (100.0%) | 137 (100.0%) |
| 18 to 24 Years | 445 (100.0%) | 330 (100.0%) |
| 25 to 34 Years | 642 (98.0%) | 508 (76.2%) |
| 35 to 44 Years | 699 (100.0%) | 671 (99.3%) |
| 45 to 54 Years | 569 (100.0%) | 633 (96.9%) |
| 55 to 64 Years | 681 (99.4%) | 502 (90.9%) |
| 65 to 74 Years | 508 (100.0%) | 525 (94.3%) |
| 75 Years and over | 256 (75.7%) | 512 (96.6%) |
| Total | 4,749 (95.9%) | 4,869 (93.6%) |
Income Below Poverty Among Married-Couple Families in Tipp City
The poverty statistics for married-couple families in Tipp City show that 0.6% or 15 of the total 2,394 families live below the poverty line. Families with no children have the highest poverty rate of 1.1%, comprising of 15 families. On the other hand, families with 1 or 2 children have the lowest poverty rate of 0.0%, which includes 0 families.
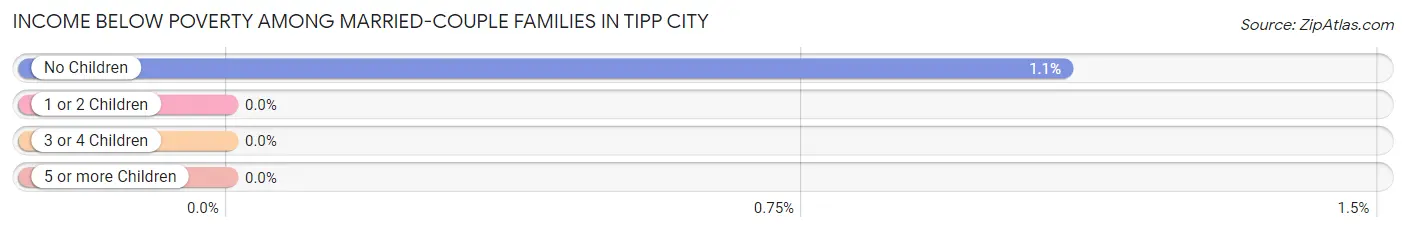
| Children | Above Poverty | Below Poverty |
| No Children | 1,360 (98.9%) | 15 (1.1%) |
| 1 or 2 Children | 727 (100.0%) | 0 (0.0%) |
| 3 or 4 Children | 292 (100.0%) | 0 (0.0%) |
| 5 or more Children | 0 (0.0%) | 0 (0.0%) |
| Total | 2,379 (99.4%) | 15 (0.6%) |
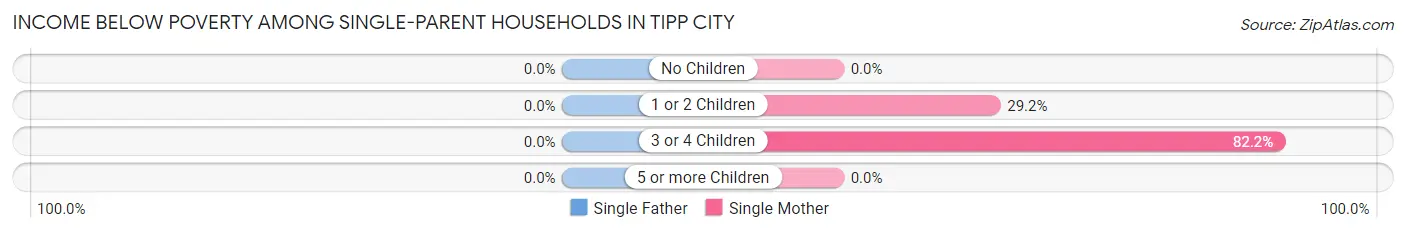
Income Below Poverty Among Single-Parent Households in Tipp City
| Children | Single Father | Single Mother |
| No Children | 0 (0.0%) | 0 (0.0%) |
| 1 or 2 Children | 0 (0.0%) | 63 (29.2%) |
| 3 or 4 Children | 0 (0.0%) | 37 (82.2%) |
| 5 or more Children | 0 (0.0%) | 0 (0.0%) |
| Total | 0 (0.0%) | 100 (24.3%) |
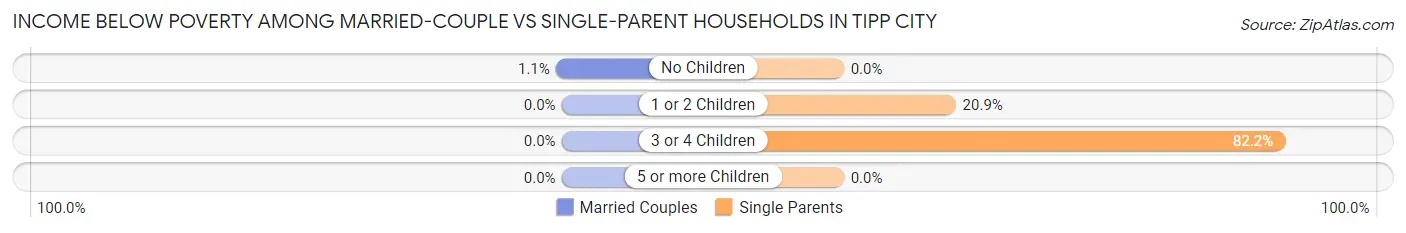
Income Below Poverty Among Married-Couple vs Single-Parent Households in Tipp City
The poverty data for Tipp City shows that 15 of the married-couple family households (0.6%) and 100 of the single-parent households (18.9%) are living below the poverty level. Within the married-couple family households, those with no children have the highest poverty rate, with 15 households (1.1%) falling below the poverty line. Among the single-parent households, those with 3 or 4 children have the highest poverty rate, with 37 household (82.2%) living below poverty.
| Children | Married-Couple Families | Single-Parent Households |
| No Children | 15 (1.1%) | 0 (0.0%) |
| 1 or 2 Children | 0 (0.0%) | 63 (20.9%) |
| 3 or 4 Children | 0 (0.0%) | 37 (82.2%) |
| 5 or more Children | 0 (0.0%) | 0 (0.0%) |
| Total | 15 (0.6%) | 100 (18.9%) |
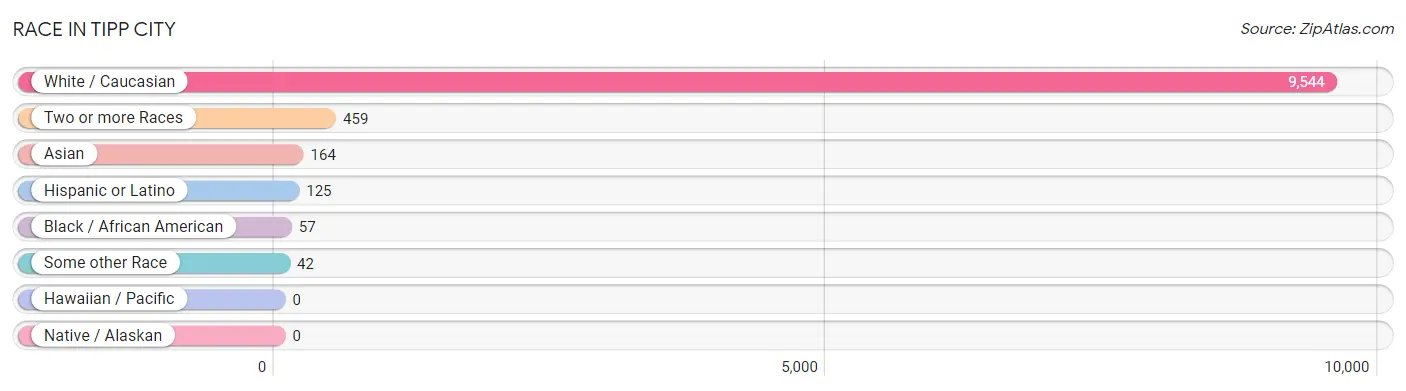
Race in Tipp City
The most populous races in Tipp City are White / Caucasian (9,544 | 93.0%), Two or more Races (459 | 4.5%), and Asian (164 | 1.6%).
| Race | # Population | % Population |
| Asian | 164 | 1.6% |
| Black / African American | 57 | 0.6% |
| Hawaiian / Pacific | 0 | 0.0% |
| Hispanic or Latino | 125 | 1.2% |
| Native / Alaskan | 0 | 0.0% |
| White / Caucasian | 9,544 | 93.0% |
| Two or more Races | 459 | 4.5% |
| Some other Race | 42 | 0.4% |
| Total | 10,266 | 100.0% |
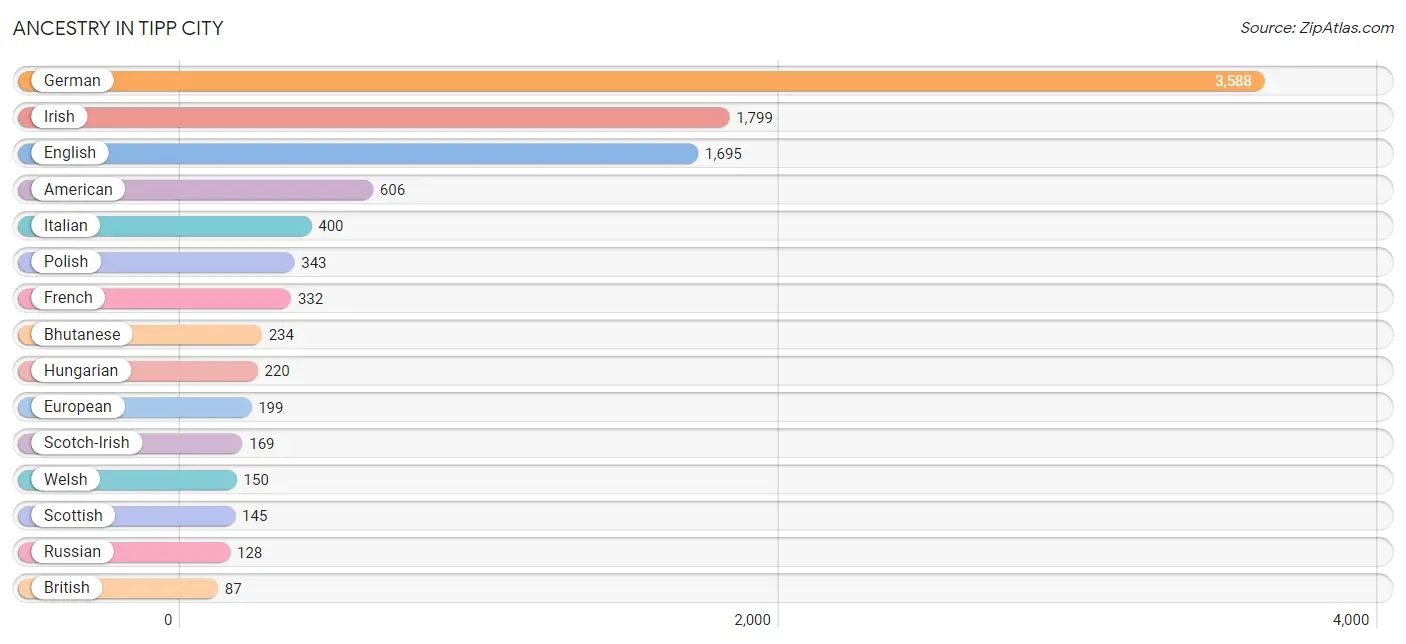
Ancestry in Tipp City
The most populous ancestries reported in Tipp City are German (3,588 | 34.9%), Irish (1,799 | 17.5%), English (1,695 | 16.5%), American (606 | 5.9%), and Italian (400 | 3.9%), together accounting for 78.8% of all Tipp City residents.
| Ancestry | # Population | % Population |
| Albanian | 23 | 0.2% |
| American | 606 | 5.9% |
| Apache | 16 | 0.2% |
| Bhutanese | 234 | 2.3% |
| Blackfeet | 70 | 0.7% |
| British | 87 | 0.9% |
| Burmese | 21 | 0.2% |
| Canadian | 9 | 0.1% |
| Cherokee | 12 | 0.1% |
| Cree | 10 | 0.1% |
| Cuban | 11 | 0.1% |
| Czech | 29 | 0.3% |
| Dutch | 72 | 0.7% |
| English | 1,695 | 16.5% |
| European | 199 | 1.9% |
| French | 332 | 3.2% |
| French Canadian | 56 | 0.5% |
| German | 3,588 | 34.9% |
| Greek | 44 | 0.4% |
| Hungarian | 220 | 2.1% |
| Indian (Asian) | 7 | 0.1% |
| Iranian | 21 | 0.2% |
| Irish | 1,799 | 17.5% |
| Italian | 400 | 3.9% |
| Jamaican | 26 | 0.3% |
| Japanese | 3 | 0.0% |
| Korean | 19 | 0.2% |
| Lithuanian | 21 | 0.2% |
| Mexican | 77 | 0.7% |
| Native Hawaiian | 26 | 0.3% |
| Northern European | 8 | 0.1% |
| Norwegian | 52 | 0.5% |
| Pennsylvania German | 19 | 0.2% |
| Peruvian | 13 | 0.1% |
| Polish | 343 | 3.3% |
| Puerto Rican | 19 | 0.2% |
| Russian | 128 | 1.3% |
| Scandinavian | 40 | 0.4% |
| Scotch-Irish | 169 | 1.7% |
| Scottish | 145 | 1.4% |
| Slovak | 24 | 0.2% |
| South American | 18 | 0.2% |
| Swedish | 46 | 0.4% |
| Swiss | 23 | 0.2% |
| Ukrainian | 18 | 0.2% |
| Venezuelan | 5 | 0.1% |
| Welsh | 150 | 1.5% | View All 47 Rows |
Immigrants in Tipp City
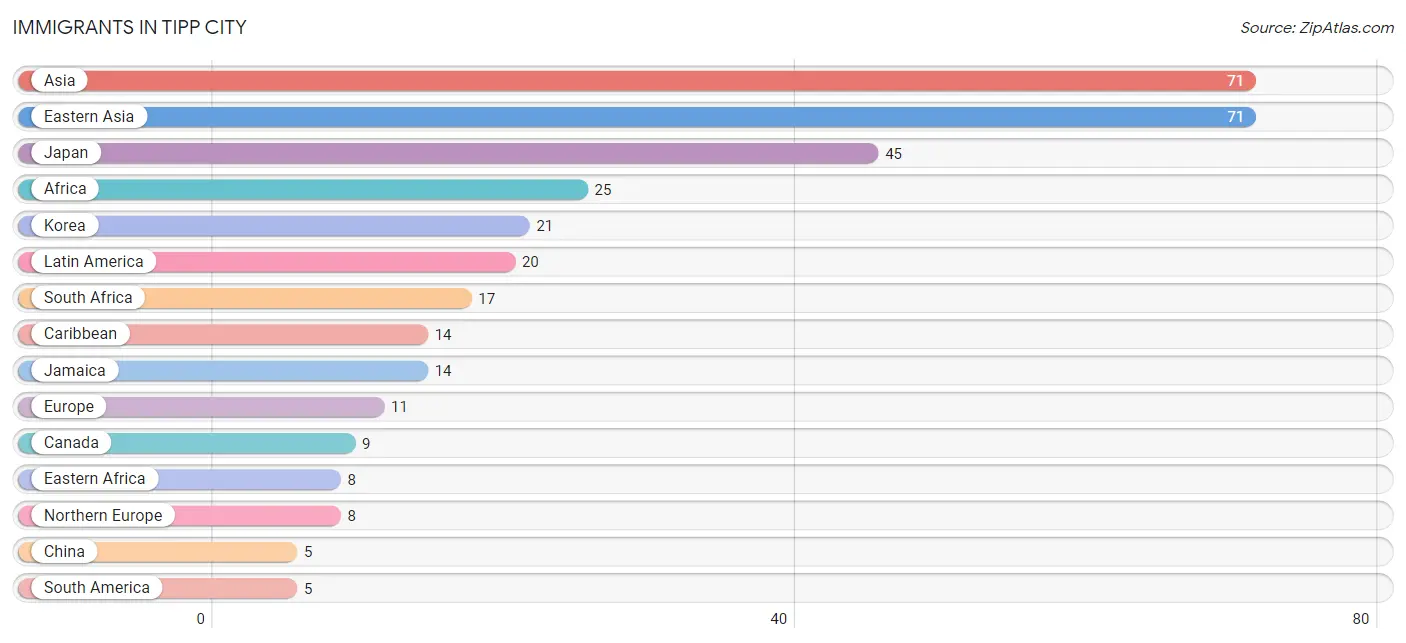
The most numerous immigrant groups reported in Tipp City came from Asia (71 | 0.7%), Eastern Asia (71 | 0.7%), Japan (45 | 0.4%), Africa (25 | 0.2%), and Korea (21 | 0.2%), together accounting for 2.3% of all Tipp City residents.
| Immigration Origin | # Population | % Population |
| Africa | 25 | 0.2% |
| Asia | 71 | 0.7% |
| Canada | 9 | 0.1% |
| Caribbean | 14 | 0.1% |
| Central America | 1 | 0.0% |
| China | 5 | 0.1% |
| Eastern Africa | 8 | 0.1% |
| Eastern Asia | 71 | 0.7% |
| Europe | 11 | 0.1% |
| Germany | 3 | 0.0% |
| Jamaica | 14 | 0.1% |
| Japan | 45 | 0.4% |
| Korea | 21 | 0.2% |
| Latin America | 20 | 0.2% |
| Mexico | 1 | 0.0% |
| Northern Europe | 8 | 0.1% |
| South Africa | 17 | 0.2% |
| South America | 5 | 0.1% |
| Venezuela | 5 | 0.1% |
| Western Europe | 3 | 0.0% | View All 20 Rows |
Sex and Age in Tipp City
Sex and Age in Tipp City
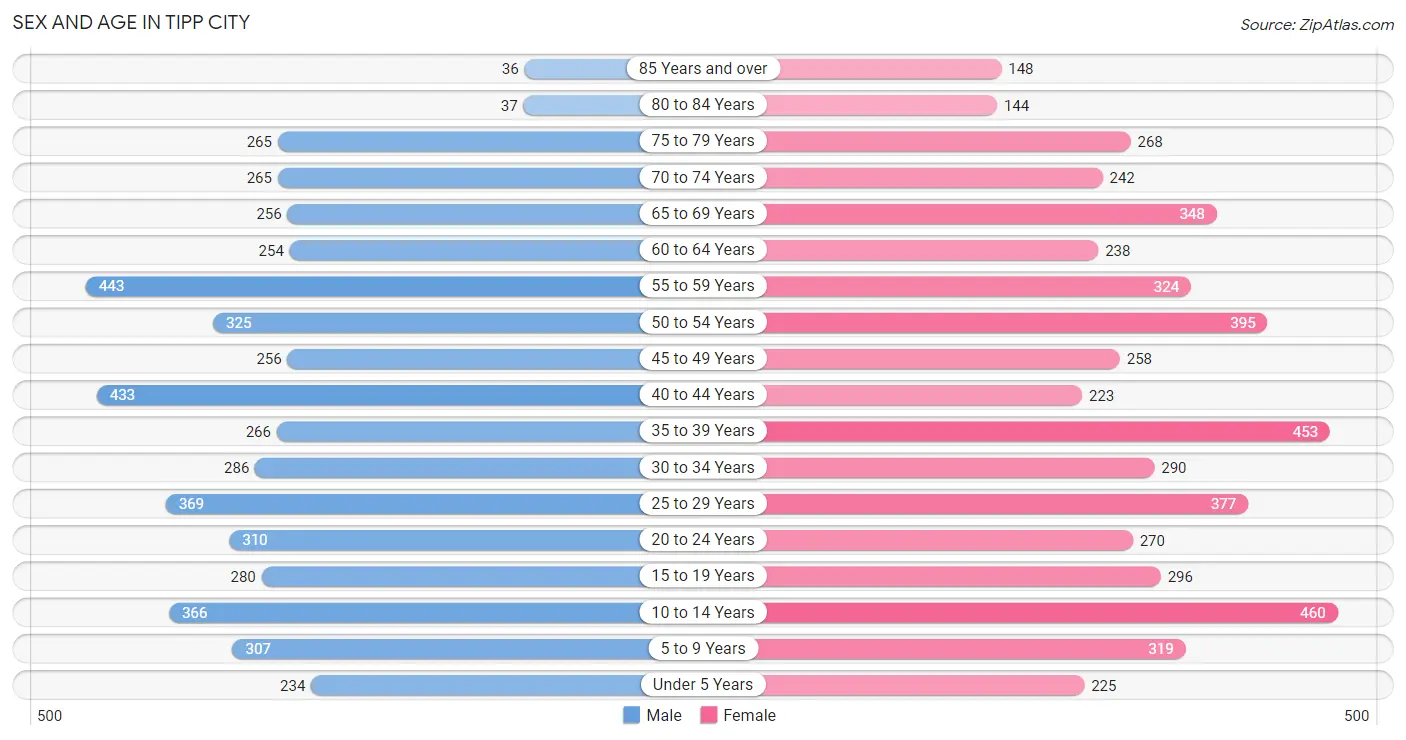
The most populous age groups in Tipp City are 55 to 59 Years (443 | 8.9%) for men and 10 to 14 Years (460 | 8.7%) for women.
| Age Bracket | Male | Female |
| Under 5 Years | 234 (4.7%) | 225 (4.3%) |
| 5 to 9 Years | 307 (6.1%) | 319 (6.0%) |
| 10 to 14 Years | 366 (7.3%) | 460 (8.7%) |
| 15 to 19 Years | 280 (5.6%) | 296 (5.6%) |
| 20 to 24 Years | 310 (6.2%) | 270 (5.1%) |
| 25 to 29 Years | 369 (7.4%) | 377 (7.1%) |
| 30 to 34 Years | 286 (5.7%) | 290 (5.5%) |
| 35 to 39 Years | 266 (5.3%) | 453 (8.6%) |
| 40 to 44 Years | 433 (8.7%) | 223 (4.2%) |
| 45 to 49 Years | 256 (5.1%) | 258 (4.9%) |
| 50 to 54 Years | 325 (6.5%) | 395 (7.5%) |
| 55 to 59 Years | 443 (8.9%) | 324 (6.1%) |
| 60 to 64 Years | 254 (5.1%) | 238 (4.5%) |
| 65 to 69 Years | 256 (5.1%) | 348 (6.6%) |
| 70 to 74 Years | 265 (5.3%) | 242 (4.6%) |
| 75 to 79 Years | 265 (5.3%) | 268 (5.1%) |
| 80 to 84 Years | 37 (0.7%) | 144 (2.7%) |
| 85 Years and over | 36 (0.7%) | 148 (2.8%) |
| Total | 4,988 (100.0%) | 5,278 (100.0%) |
Families and Households in Tipp City
Median Family Size in Tipp City
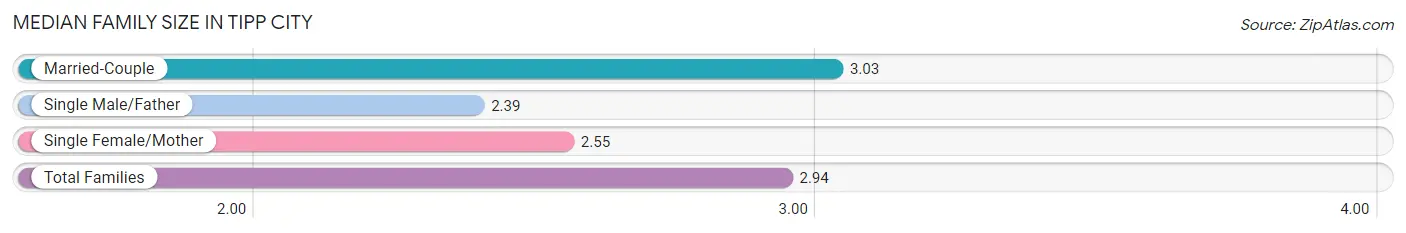
The median family size in Tipp City is 2.94 persons per family, with married-couple families (2,394 | 81.9%) accounting for the largest median family size of 3.03 persons per family. On the other hand, single male/father families (119 | 4.1%) represent the smallest median family size with 2.39 persons per family.
| Family Type | # Families | Family Size |
| Married-Couple | 2,394 (81.9%) | 3.03 |
| Single Male/Father | 119 (4.1%) | 2.39 |
| Single Female/Mother | 411 (14.1%) | 2.55 |
| Total Families | 2,924 (100.0%) | 2.94 |
Median Household Size in Tipp City
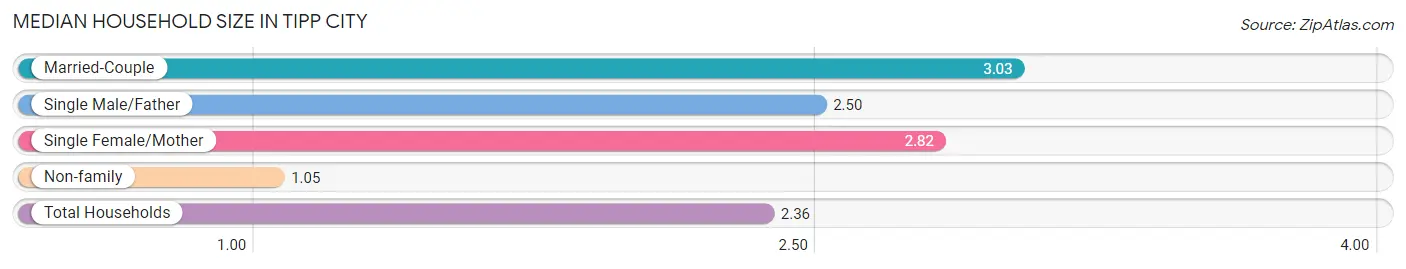
The median household size in Tipp City is 2.36 persons per household, with married-couple households (2,394 | 55.7%) accounting for the largest median household size of 3.03 persons per household. non-family households (1,375 | 32.0%) represent the smallest median household size with 1.05 persons per household.
| Household Type | # Households | Household Size |
| Married-Couple | 2,394 (55.7%) | 3.03 |
| Single Male/Father | 119 (2.8%) | 2.50 |
| Single Female/Mother | 411 (9.6%) | 2.82 |
| Non-family | 1,375 (32.0%) | 1.05 |
| Total Households | 4,299 (100.0%) | 2.36 |
Household Size by Marriage Status in Tipp City
Out of a total of 4,299 households in Tipp City, 2,924 (68.0%) are family households, while 1,375 (32.0%) are nonfamily households. The most numerous type of family households are 2-person households, comprising 1,447, and the most common type of nonfamily households are 1-person households, comprising 1,305.
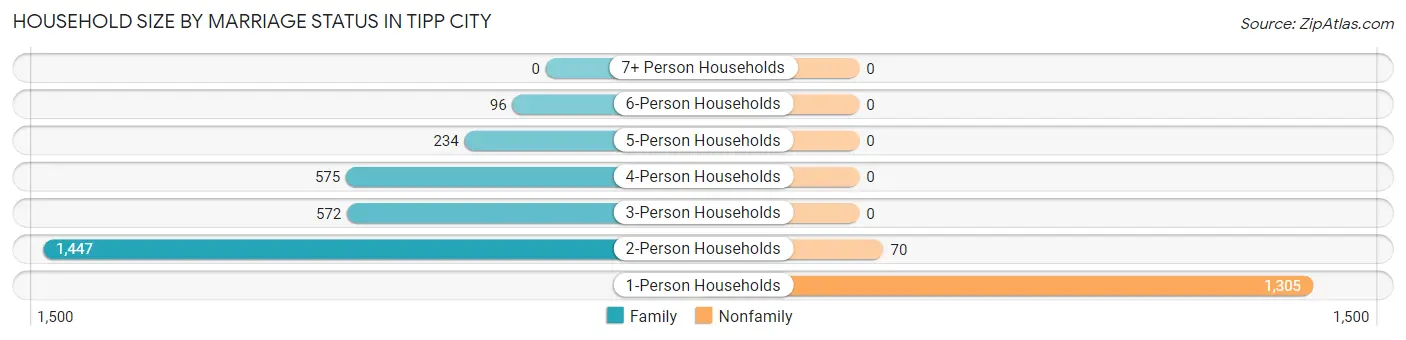
| Household Size | Family Households | Nonfamily Households |
| 1-Person Households | - | 1,305 (30.4%) |
| 2-Person Households | 1,447 (33.7%) | 70 (1.6%) |
| 3-Person Households | 572 (13.3%) | 0 (0.0%) |
| 4-Person Households | 575 (13.4%) | 0 (0.0%) |
| 5-Person Households | 234 (5.4%) | 0 (0.0%) |
| 6-Person Households | 96 (2.2%) | 0 (0.0%) |
| 7+ Person Households | 0 (0.0%) | 0 (0.0%) |
| Total | 2,924 (68.0%) | 1,375 (32.0%) |
Female Fertility in Tipp City
Fertility by Age in Tipp City
Average fertility rate in Tipp City is 37.0 births per 1,000 women. Women in the age bracket of 35 to 50 years have the highest fertility rate with 71.0 births per 1,000 women. Women in the age bracket of 35 to 50 years acount for 85.7% of all women with births.
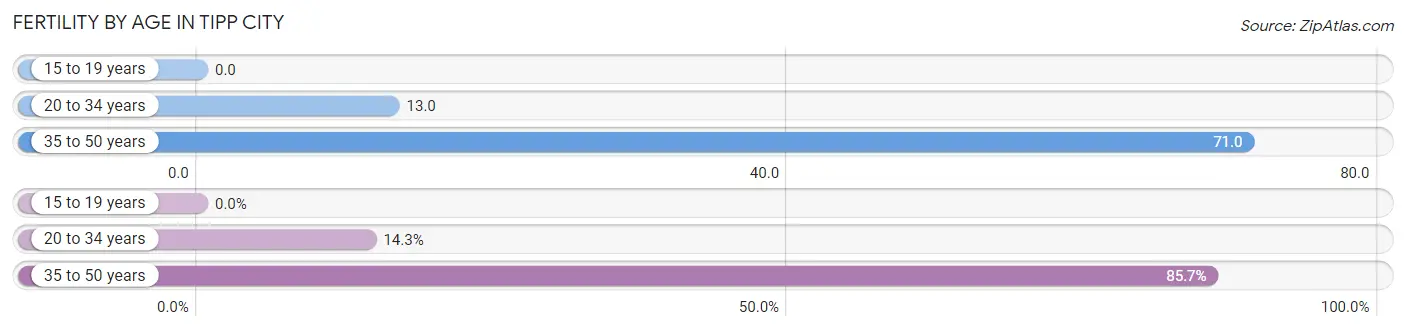
| Age Bracket | Women with Births | Births / 1,000 Women |
| 15 to 19 years | 0 (0.0%) | 0.0 |
| 20 to 34 years | 12 (14.3%) | 13.0 |
| 35 to 50 years | 72 (85.7%) | 71.0 |
| Total | 84 (100.0%) | 37.0 |
Fertility by Age by Marriage Status in Tipp City
85.7% of women with births (84) in Tipp City are married. The highest percentage of unmarried women with births falls into 20 to 34 years age bracket with 100.0% of them unmarried at the time of birth, while the lowest percentage of unmarried women with births belong to 35 to 50 years age bracket with 0.0% of them unmarried.
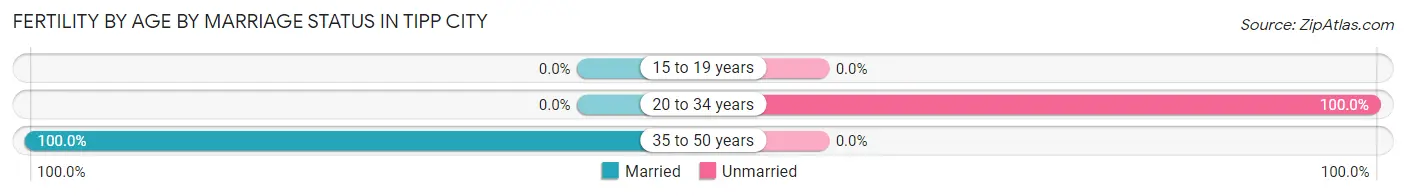
| Age Bracket | Married | Unmarried |
| 15 to 19 years | 0 (0.0%) | 0 (0.0%) |
| 20 to 34 years | 0 (0.0%) | 12 (100.0%) |
| 35 to 50 years | 72 (100.0%) | 0 (0.0%) |
| Total | 72 (85.7%) | 12 (14.3%) |
Fertility by Education in Tipp City
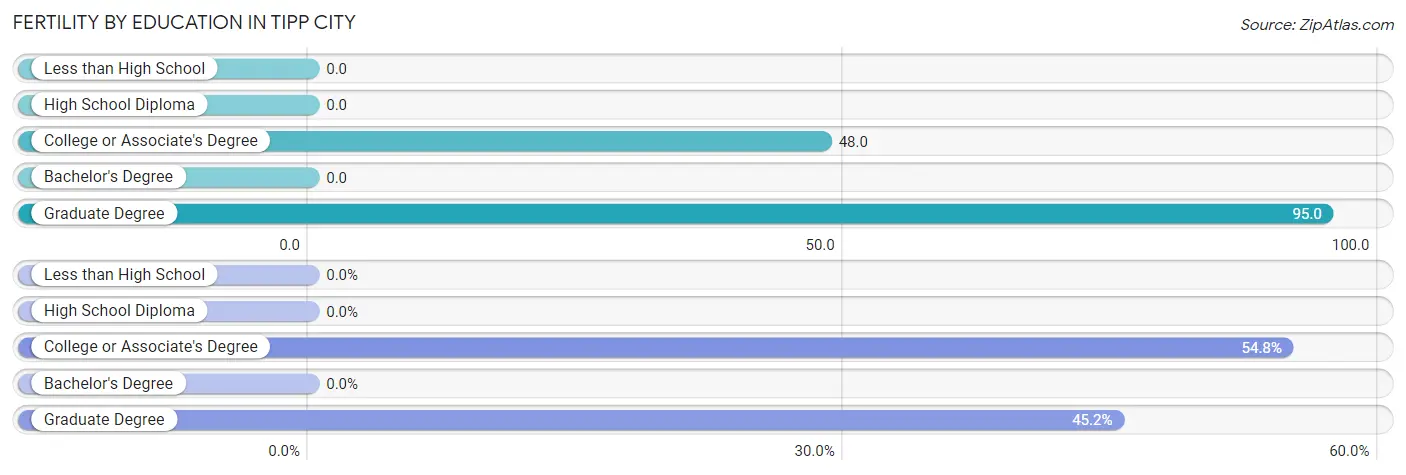
| Educational Attainment | Women with Births | Births / 1,000 Women |
| Less than High School | 0 (0.0%) | 0.0 |
| High School Diploma | 0 (0.0%) | 0.0 |
| College or Associate's Degree | 46 (54.8%) | 48.0 |
| Bachelor's Degree | 0 (0.0%) | 0.0 |
| Graduate Degree | 38 (45.2%) | 95.0 |
| Total | 84 (100.0%) | 37.0 |
Fertility by Education by Marriage Status in Tipp City
14.3% of women with births in Tipp City are unmarried. Women with the educational attainment of graduate degree are most likely to be married with 100.0% of them married at childbirth, while women with the educational attainment of college or associate's degree are least likely to be married with 26.1% of them unmarried at childbirth.
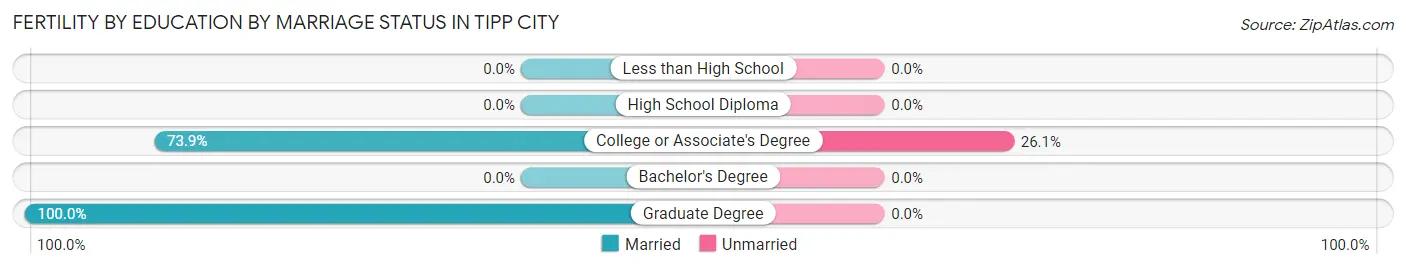
| Educational Attainment | Married | Unmarried |
| Less than High School | 0 (0.0%) | 0 (0.0%) |
| High School Diploma | 0 (0.0%) | 0 (0.0%) |
| College or Associate's Degree | 34 (73.9%) | 12 (26.1%) |
| Bachelor's Degree | 0 (0.0%) | 0 (0.0%) |
| Graduate Degree | 38 (100.0%) | 0 (0.0%) |
| Total | 72 (85.7%) | 12 (14.3%) |
Employment Characteristics in Tipp City
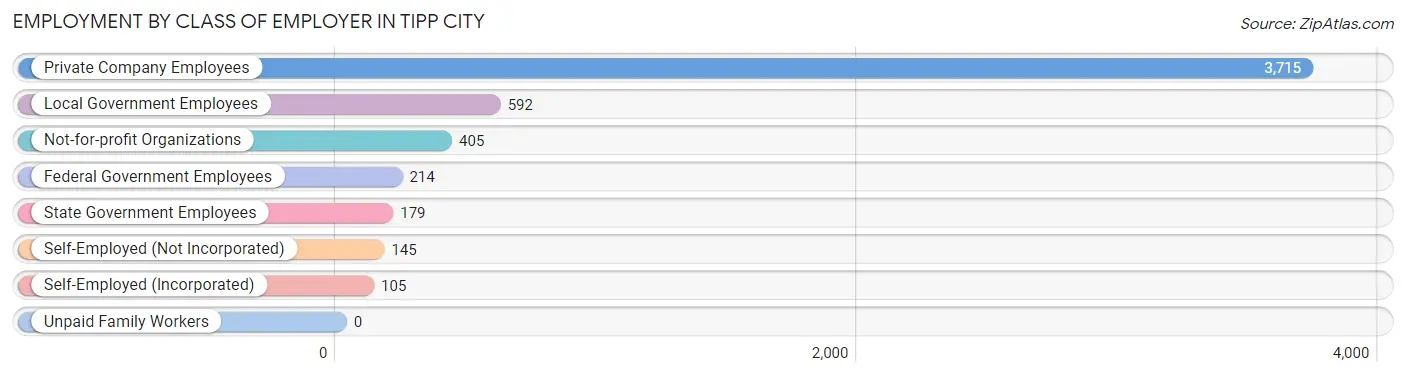
Employment by Class of Employer in Tipp City
Among the 5,355 employed individuals in Tipp City, private company employees (3,715 | 69.4%), local government employees (592 | 11.1%), and not-for-profit organizations (405 | 7.6%) make up the most common classes of employment.
| Employer Class | # Employees | % Employees |
| Private Company Employees | 3,715 | 69.4% |
| Self-Employed (Incorporated) | 105 | 2.0% |
| Self-Employed (Not Incorporated) | 145 | 2.7% |
| Not-for-profit Organizations | 405 | 7.6% |
| Local Government Employees | 592 | 11.1% |
| State Government Employees | 179 | 3.3% |
| Federal Government Employees | 214 | 4.0% |
| Unpaid Family Workers | 0 | 0.0% |
| Total | 5,355 | 100.0% |
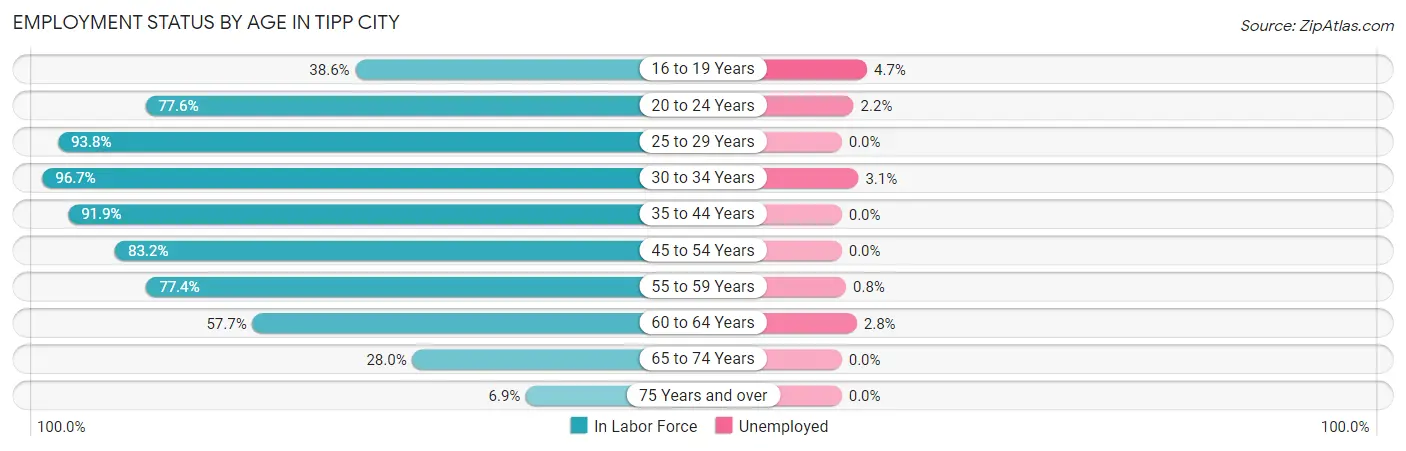
Employment Status by Age in Tipp City
According to the labor force statistics for Tipp City, out of the total population over 16 years of age (8,222), 65.9% or 5,418 individuals are in the labor force, with 0.9% or 49 of them unemployed. The age group with the highest labor force participation rate is 30 to 34 years, with 96.7% or 557 individuals in the labor force. Within the labor force, the 16 to 19 years age range has the highest percentage of unemployed individuals, with 4.7% or 8 of them being unemployed.
| Age Bracket | In Labor Force | Unemployed |
| 16 to 19 Years | 171 (38.6%) | 8 (4.7%) |
| 20 to 24 Years | 450 (77.6%) | 10 (2.2%) |
| 25 to 29 Years | 700 (93.8%) | 0 (0.0%) |
| 30 to 34 Years | 557 (96.7%) | 17 (3.1%) |
| 35 to 44 Years | 1,264 (91.9%) | 0 (0.0%) |
| 45 to 54 Years | 1,027 (83.2%) | 0 (0.0%) |
| 55 to 59 Years | 594 (77.4%) | 5 (0.8%) |
| 60 to 64 Years | 284 (57.7%) | 8 (2.8%) |
| 65 to 74 Years | 311 (28.0%) | 0 (0.0%) |
| 75 Years and over | 62 (6.9%) | 0 (0.0%) |
| Total | 5,418 (65.9%) | 49 (0.9%) |
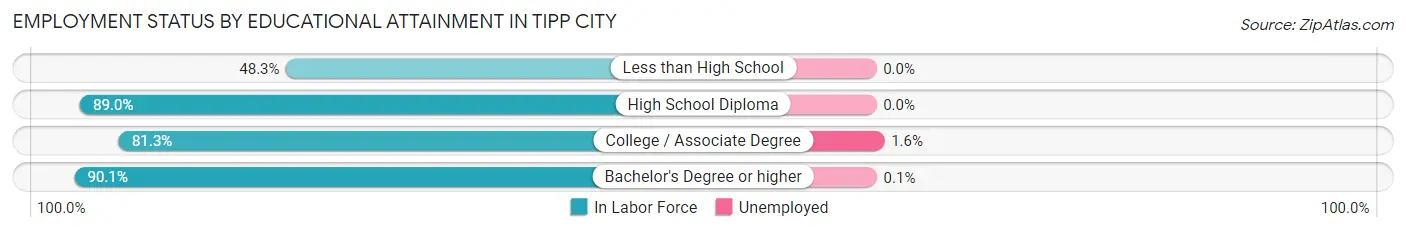
Employment Status by Educational Attainment in Tipp City
According to labor force statistics for Tipp City, 85.3% of individuals (4,427) out of the total population between 25 and 64 years of age (5,190) are in the labor force, with 0.7% or 31 of them being unemployed. The group with the highest labor force participation rate are those with the educational attainment of bachelor's degree or higher, with 90.1% or 1,801 individuals in the labor force. Within the labor force, individuals with college / associate degree education have the highest percentage of unemployment, with 1.6% or 28 of them being unemployed.
| Educational Attainment | In Labor Force | Unemployed |
| Less than High School | 58 (48.3%) | 0 (0.0%) |
| High School Diploma | 805 (89.0%) | 0 (0.0%) |
| College / Associate Degree | 1,761 (81.3%) | 35 (1.6%) |
| Bachelor's Degree or higher | 1,801 (90.1%) | 2 (0.1%) |
| Total | 4,427 (85.3%) | 36 (0.7%) |
Employment Occupations by Sex in Tipp City
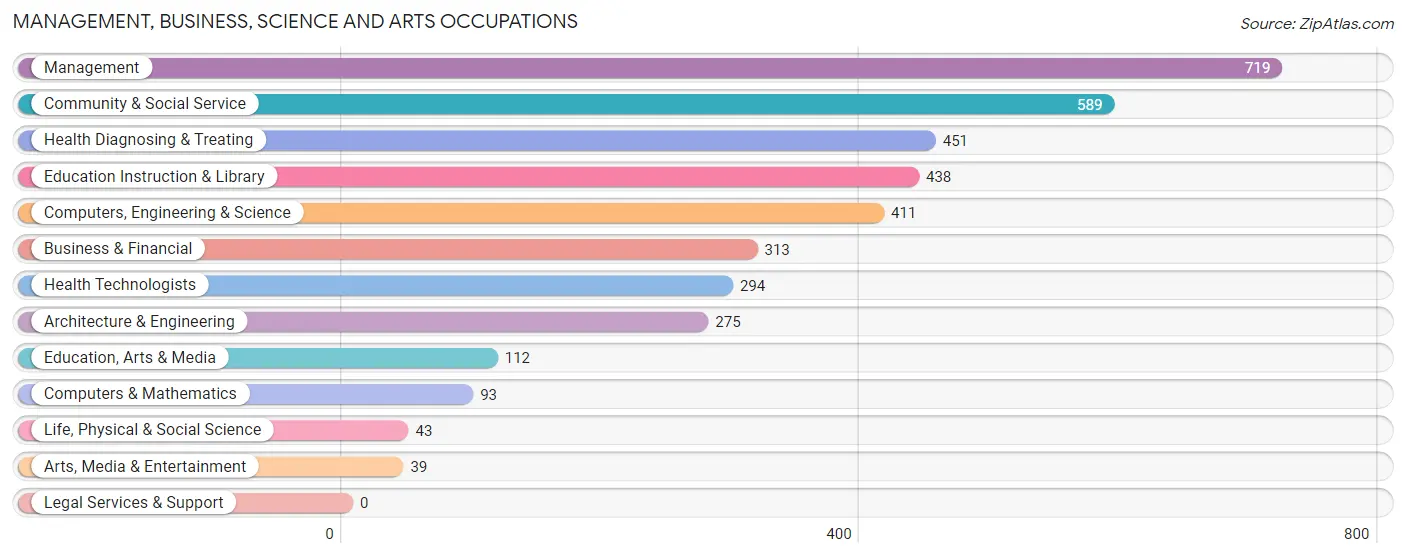
Management, Business, Science and Arts Occupations
The most common Management, Business, Science and Arts occupations in Tipp City are Management (719 | 13.4%), Community & Social Service (589 | 11.0%), Health Diagnosing & Treating (451 | 8.4%), Education Instruction & Library (438 | 8.2%), and Computers, Engineering & Science (411 | 7.6%).
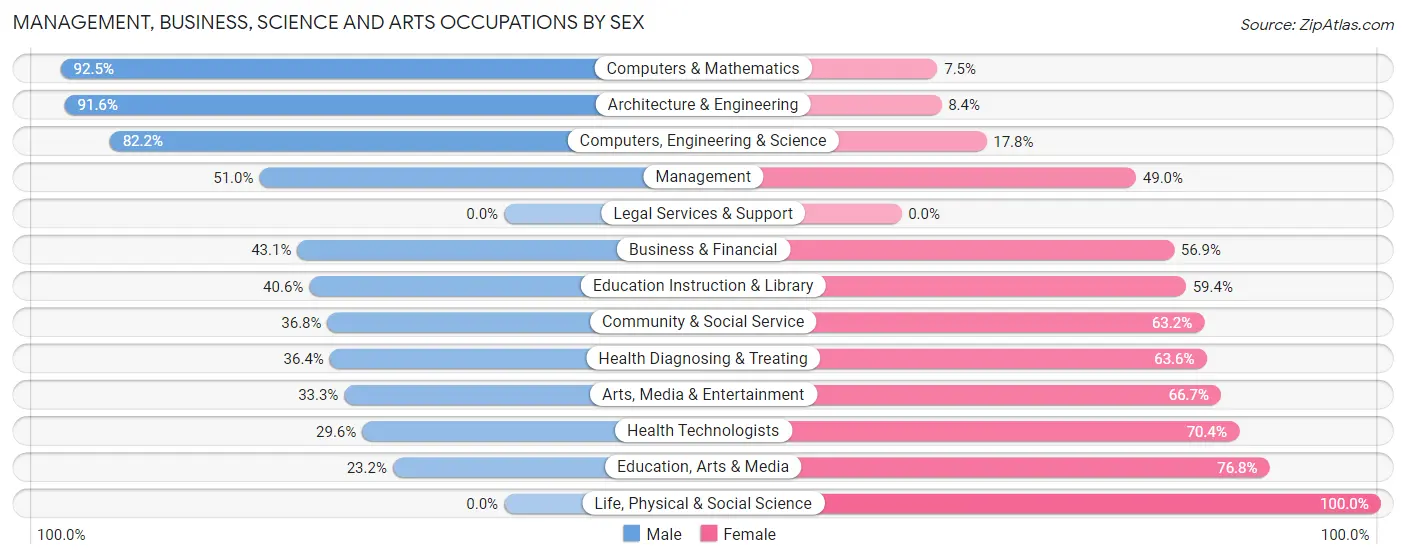
Management, Business, Science and Arts Occupations by Sex
Within the Management, Business, Science and Arts occupations in Tipp City, the most male-oriented occupations are Computers & Mathematics (92.5%), Architecture & Engineering (91.6%), and Computers, Engineering & Science (82.2%), while the most female-oriented occupations are Life, Physical & Social Science (100.0%), Education, Arts & Media (76.8%), and Health Technologists (70.4%).
| Occupation | Male | Female |
| Management | 367 (51.0%) | 352 (49.0%) |
| Business & Financial | 135 (43.1%) | 178 (56.9%) |
| Computers, Engineering & Science | 338 (82.2%) | 73 (17.8%) |
| Computers & Mathematics | 86 (92.5%) | 7 (7.5%) |
| Architecture & Engineering | 252 (91.6%) | 23 (8.4%) |
| Life, Physical & Social Science | 0 (0.0%) | 43 (100.0%) |
| Community & Social Service | 217 (36.8%) | 372 (63.2%) |
| Education, Arts & Media | 26 (23.2%) | 86 (76.8%) |
| Legal Services & Support | 0 (0.0%) | 0 (0.0%) |
| Education Instruction & Library | 178 (40.6%) | 260 (59.4%) |
| Arts, Media & Entertainment | 13 (33.3%) | 26 (66.7%) |
| Health Diagnosing & Treating | 164 (36.4%) | 287 (63.6%) |
| Health Technologists | 87 (29.6%) | 207 (70.4%) |
| Total (Category) | 1,221 (49.2%) | 1,262 (50.8%) |
| Total (Overall) | 2,923 (54.4%) | 2,449 (45.6%) |
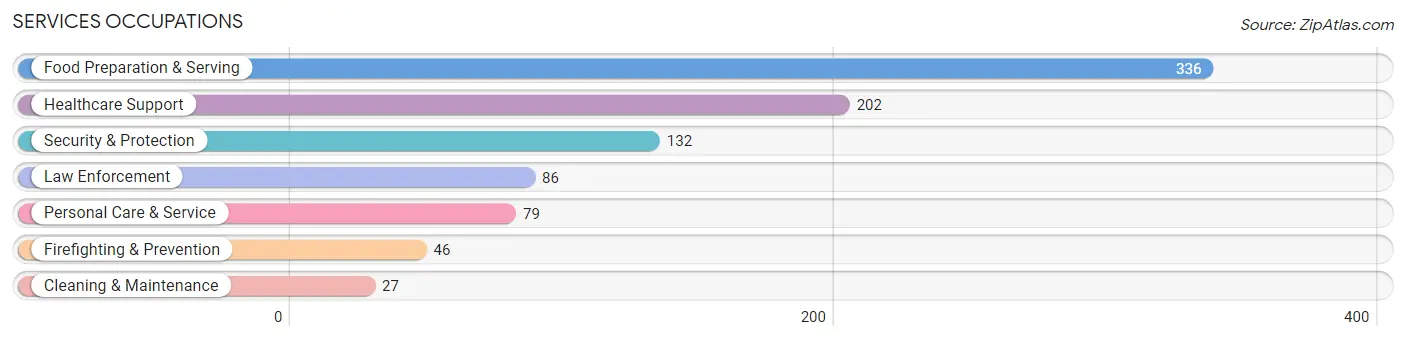
Services Occupations
The most common Services occupations in Tipp City are Food Preparation & Serving (336 | 6.2%), Healthcare Support (202 | 3.8%), Security & Protection (132 | 2.5%), Law Enforcement (86 | 1.6%), and Personal Care & Service (79 | 1.5%).
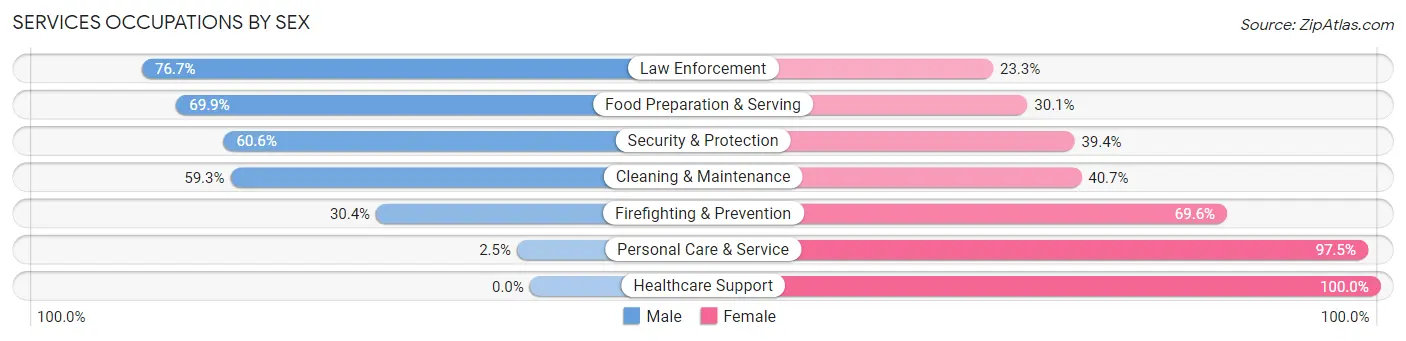
Services Occupations by Sex
Within the Services occupations in Tipp City, the most male-oriented occupations are Law Enforcement (76.7%), Food Preparation & Serving (69.9%), and Security & Protection (60.6%), while the most female-oriented occupations are Healthcare Support (100.0%), Personal Care & Service (97.5%), and Firefighting & Prevention (69.6%).
| Occupation | Male | Female |
| Healthcare Support | 0 (0.0%) | 202 (100.0%) |
| Security & Protection | 80 (60.6%) | 52 (39.4%) |
| Firefighting & Prevention | 14 (30.4%) | 32 (69.6%) |
| Law Enforcement | 66 (76.7%) | 20 (23.3%) |
| Food Preparation & Serving | 235 (69.9%) | 101 (30.1%) |
| Cleaning & Maintenance | 16 (59.3%) | 11 (40.7%) |
| Personal Care & Service | 2 (2.5%) | 77 (97.5%) |
| Total (Category) | 333 (42.9%) | 443 (57.1%) |
| Total (Overall) | 2,923 (54.4%) | 2,449 (45.6%) |
Sales and Office Occupations
The most common Sales and Office occupations in Tipp City are Office & Administration (436 | 8.1%), and Sales & Related (312 | 5.8%).
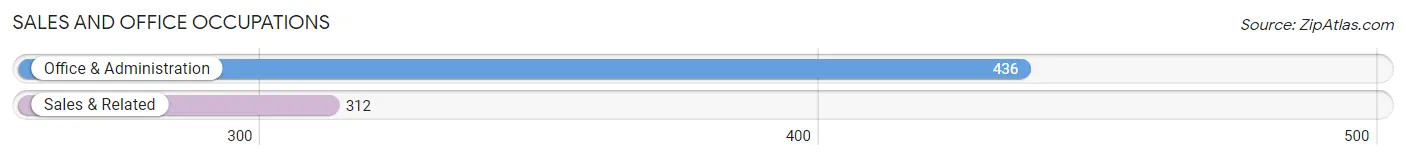
Sales and Office Occupations by Sex

| Occupation | Male | Female |
| Sales & Related | 262 (84.0%) | 50 (16.0%) |
| Office & Administration | 31 (7.1%) | 405 (92.9%) |
| Total (Category) | 293 (39.2%) | 455 (60.8%) |
| Total (Overall) | 2,923 (54.4%) | 2,449 (45.6%) |
Natural Resources, Construction and Maintenance Occupations
The most common Natural Resources, Construction and Maintenance occupations in Tipp City are Installation, Maintenance & Repair (183 | 3.4%), and Construction & Extraction (147 | 2.7%).
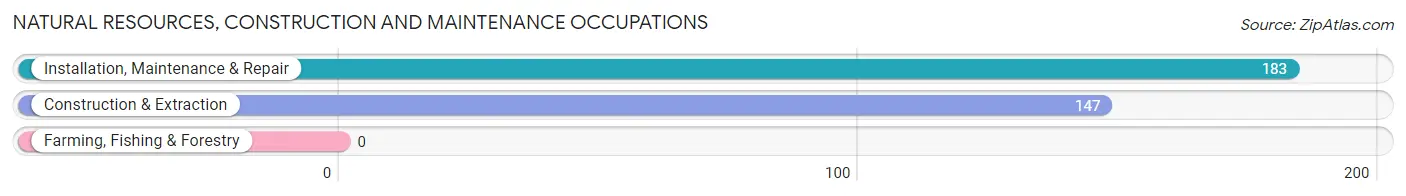
Natural Resources, Construction and Maintenance Occupations by Sex

| Occupation | Male | Female |
| Farming, Fishing & Forestry | 0 (0.0%) | 0 (0.0%) |
| Construction & Extraction | 147 (100.0%) | 0 (0.0%) |
| Installation, Maintenance & Repair | 183 (100.0%) | 0 (0.0%) |
| Total (Category) | 330 (100.0%) | 0 (0.0%) |
| Total (Overall) | 2,923 (54.4%) | 2,449 (45.6%) |
Production, Transportation and Moving Occupations
The most common Production, Transportation and Moving occupations in Tipp City are Production (726 | 13.5%), Material Moving (263 | 4.9%), and Transportation (46 | 0.9%).
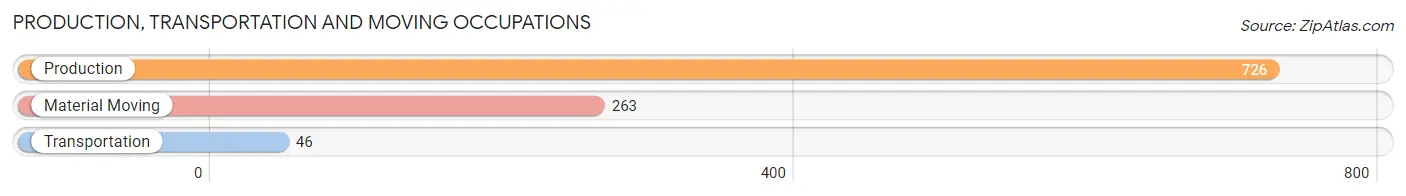
Production, Transportation and Moving Occupations by Sex
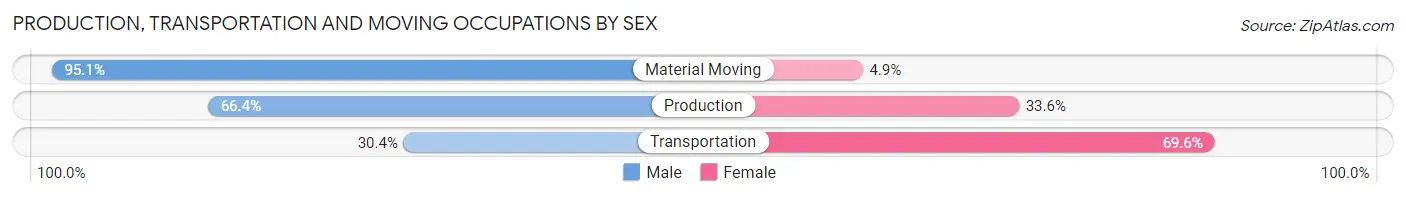
| Occupation | Male | Female |
| Production | 482 (66.4%) | 244 (33.6%) |
| Transportation | 14 (30.4%) | 32 (69.6%) |
| Material Moving | 250 (95.1%) | 13 (4.9%) |
| Total (Category) | 746 (72.1%) | 289 (27.9%) |
| Total (Overall) | 2,923 (54.4%) | 2,449 (45.6%) |
Employment Industries by Sex in Tipp City
Employment Industries in Tipp City
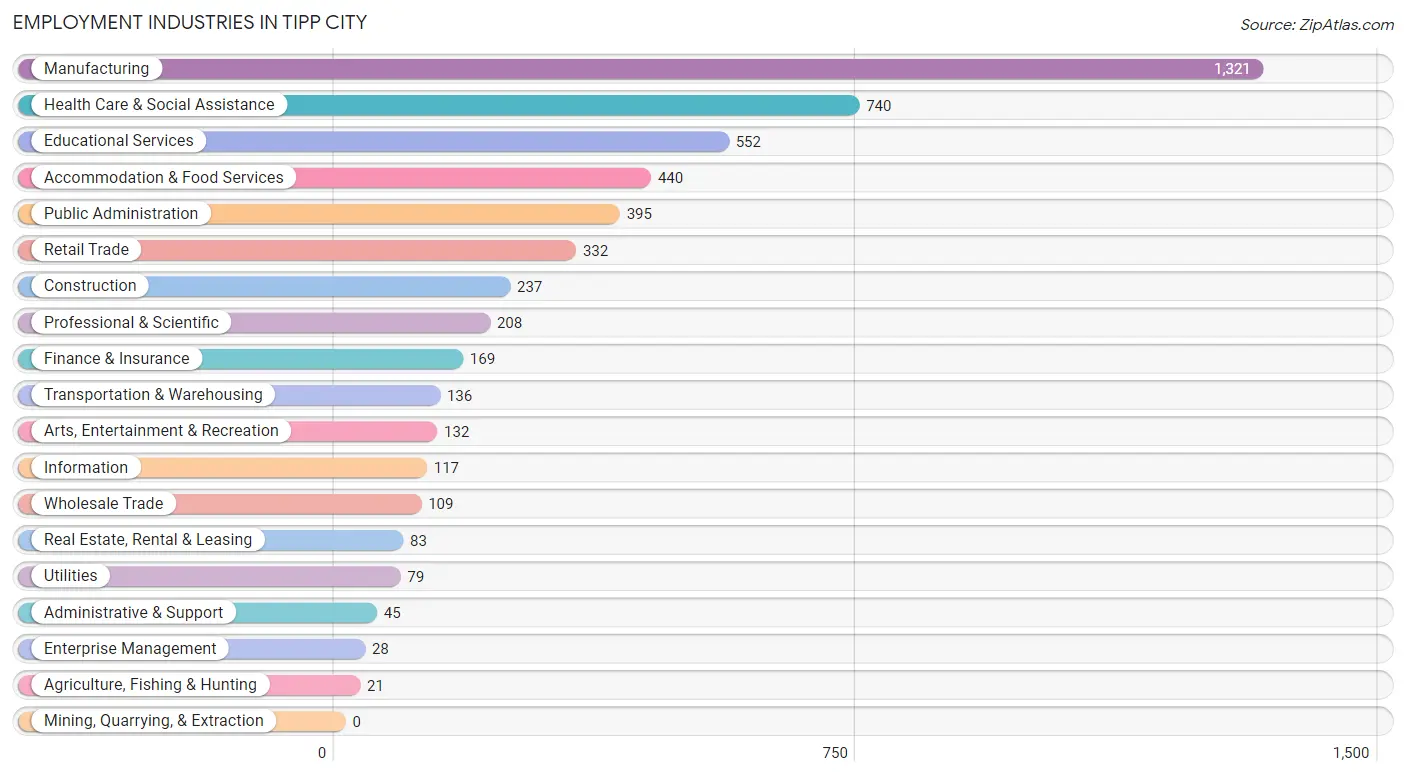
The major employment industries in Tipp City include Manufacturing (1,321 | 24.6%), Health Care & Social Assistance (740 | 13.8%), Educational Services (552 | 10.3%), Accommodation & Food Services (440 | 8.2%), and Public Administration (395 | 7.3%).
Employment Industries by Sex in Tipp City
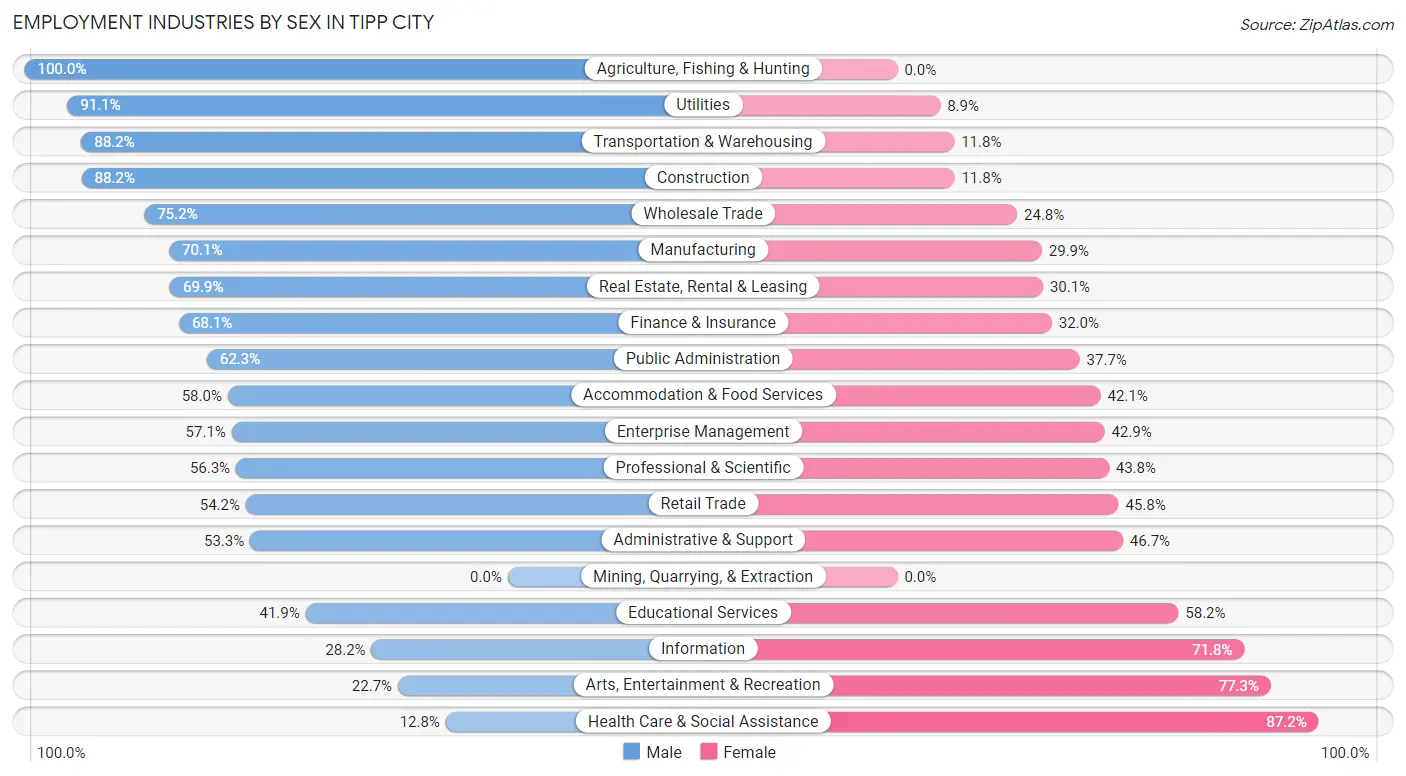
The Tipp City industries that see more men than women are Agriculture, Fishing & Hunting (100.0%), Utilities (91.1%), and Transportation & Warehousing (88.2%), whereas the industries that tend to have a higher number of women are Health Care & Social Assistance (87.2%), Arts, Entertainment & Recreation (77.3%), and Information (71.8%).
| Industry | Male | Female |
| Agriculture, Fishing & Hunting | 21 (100.0%) | 0 (0.0%) |
| Mining, Quarrying, & Extraction | 0 (0.0%) | 0 (0.0%) |
| Construction | 209 (88.2%) | 28 (11.8%) |
| Manufacturing | 926 (70.1%) | 395 (29.9%) |
| Wholesale Trade | 82 (75.2%) | 27 (24.8%) |
| Retail Trade | 180 (54.2%) | 152 (45.8%) |
| Transportation & Warehousing | 120 (88.2%) | 16 (11.8%) |
| Utilities | 72 (91.1%) | 7 (8.9%) |
| Information | 33 (28.2%) | 84 (71.8%) |
| Finance & Insurance | 115 (68.0%) | 54 (32.0%) |
| Real Estate, Rental & Leasing | 58 (69.9%) | 25 (30.1%) |
| Professional & Scientific | 117 (56.2%) | 91 (43.8%) |
| Enterprise Management | 16 (57.1%) | 12 (42.9%) |
| Administrative & Support | 24 (53.3%) | 21 (46.7%) |
| Educational Services | 231 (41.8%) | 321 (58.2%) |
| Health Care & Social Assistance | 95 (12.8%) | 645 (87.2%) |
| Arts, Entertainment & Recreation | 30 (22.7%) | 102 (77.3%) |
| Accommodation & Food Services | 255 (58.0%) | 185 (42.0%) |
| Public Administration | 246 (62.3%) | 149 (37.7%) |
| Total | 2,923 (54.4%) | 2,449 (45.6%) |
Education in Tipp City
School Enrollment in Tipp City
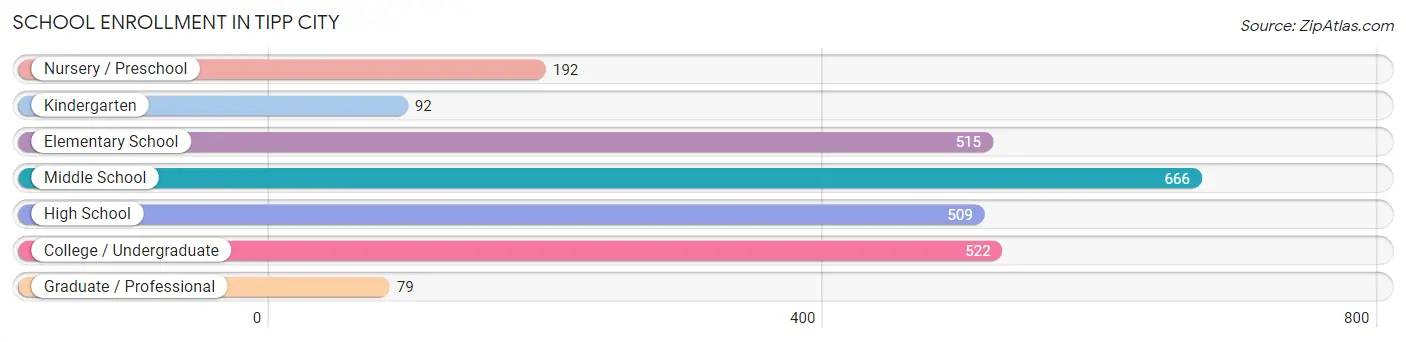
The most common levels of schooling among the 2,575 students in Tipp City are middle school (666 | 25.9%), college / undergraduate (522 | 20.3%), and elementary school (515 | 20.0%).
| School Level | # Students | % Students |
| Nursery / Preschool | 192 | 7.5% |
| Kindergarten | 92 | 3.6% |
| Elementary School | 515 | 20.0% |
| Middle School | 666 | 25.9% |
| High School | 509 | 19.8% |
| College / Undergraduate | 522 | 20.3% |
| Graduate / Professional | 79 | 3.1% |
| Total | 2,575 | 100.0% |
School Enrollment by Age by Funding Source in Tipp City
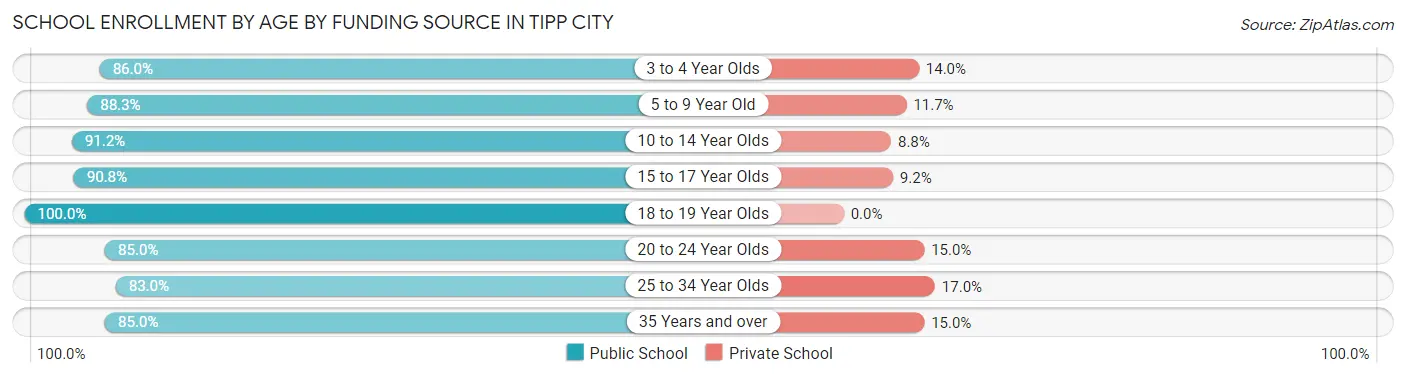
Out of a total of 2,575 students who are enrolled in schools in Tipp City, 283 (11.0%) attend a private institution, while the remaining 2,292 (89.0%) are enrolled in public schools. The age group of 25 to 34 year olds has the highest likelihood of being enrolled in private schools, with 35 (17.0% in the age bracket) enrolled. Conversely, the age group of 18 to 19 year olds has the lowest likelihood of being enrolled in a private school, with 108 (100.0% in the age bracket) attending a public institution.
| Age Bracket | Public School | Private School |
| 3 to 4 Year Olds | 86 (86.0%) | 14 (14.0%) |
| 5 to 9 Year Old | 544 (88.3%) | 72 (11.7%) |
| 10 to 14 Year Olds | 744 (91.2%) | 72 (8.8%) |
| 15 to 17 Year Olds | 317 (90.8%) | 32 (9.2%) |
| 18 to 19 Year Olds | 108 (100.0%) | 0 (0.0%) |
| 20 to 24 Year Olds | 238 (85.0%) | 42 (15.0%) |
| 25 to 34 Year Olds | 171 (83.0%) | 35 (17.0%) |
| 35 Years and over | 85 (85.0%) | 15 (15.0%) |
| Total | 2,292 (89.0%) | 283 (11.0%) |
Educational Attainment by Field of Study in Tipp City
Business (691 | 27.0%), education (435 | 17.0%), engineering (280 | 10.9%), science & technology (257 | 10.0%), and bio, nature & agricultural (189 | 7.4%) are the most common fields of study among 2,564 individuals in Tipp City who have obtained a bachelor's degree or higher.
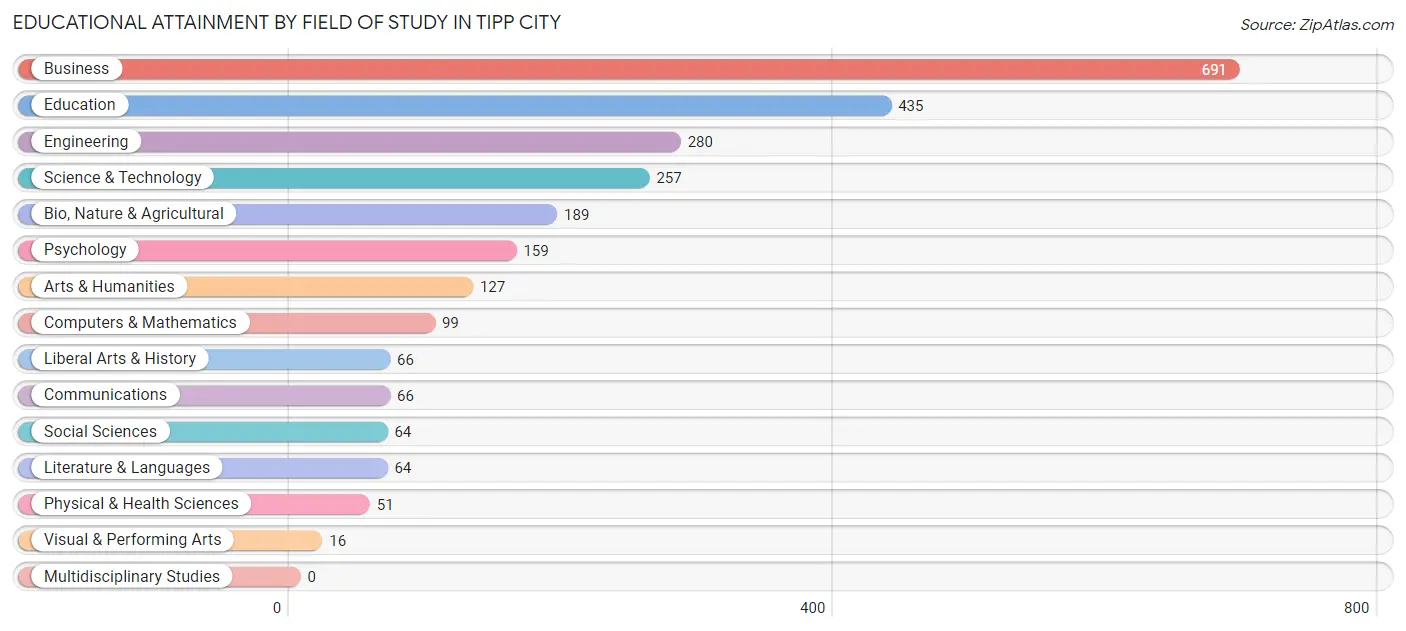
| Field of Study | # Graduates | % Graduates |
| Computers & Mathematics | 99 | 3.9% |
| Bio, Nature & Agricultural | 189 | 7.4% |
| Physical & Health Sciences | 51 | 2.0% |
| Psychology | 159 | 6.2% |
| Social Sciences | 64 | 2.5% |
| Engineering | 280 | 10.9% |
| Multidisciplinary Studies | 0 | 0.0% |
| Science & Technology | 257 | 10.0% |
| Business | 691 | 27.0% |
| Education | 435 | 17.0% |
| Literature & Languages | 64 | 2.5% |
| Liberal Arts & History | 66 | 2.6% |
| Visual & Performing Arts | 16 | 0.6% |
| Communications | 66 | 2.6% |
| Arts & Humanities | 127 | 5.0% |
| Total | 2,564 | 100.0% |
Transportation & Commute in Tipp City
Vehicle Availability by Sex in Tipp City
The most prevalent vehicle ownership categories in Tipp City are males with 2 vehicles (1,436, accounting for 49.1%) and females with 2 vehicles (1,211, making up 59.1%).
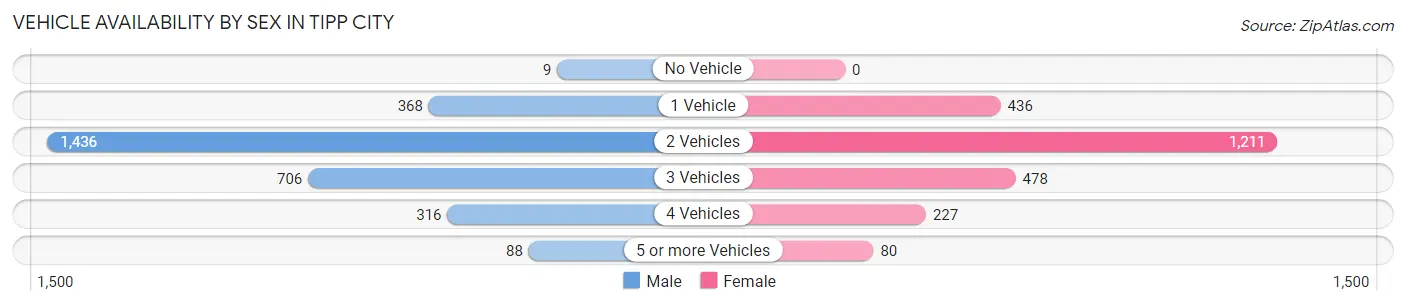
| Vehicles Available | Male | Female |
| No Vehicle | 9 (0.3%) | 0 (0.0%) |
| 1 Vehicle | 368 (12.6%) | 436 (17.9%) |
| 2 Vehicles | 1,436 (49.1%) | 1,211 (49.8%) |
| 3 Vehicles | 706 (24.1%) | 478 (19.7%) |
| 4 Vehicles | 316 (10.8%) | 227 (9.3%) |
| 5 or more Vehicles | 88 (3.0%) | 80 (3.3%) |
| Total | 2,923 (100.0%) | 2,432 (100.0%) |
Commute Time in Tipp City
The most frequently occuring commute durations in Tipp City are 10 to 14 minutes (1,031 commuters, 20.7%), 5 to 9 minutes (710 commuters, 14.2%), and 20 to 24 minutes (699 commuters, 14.0%).
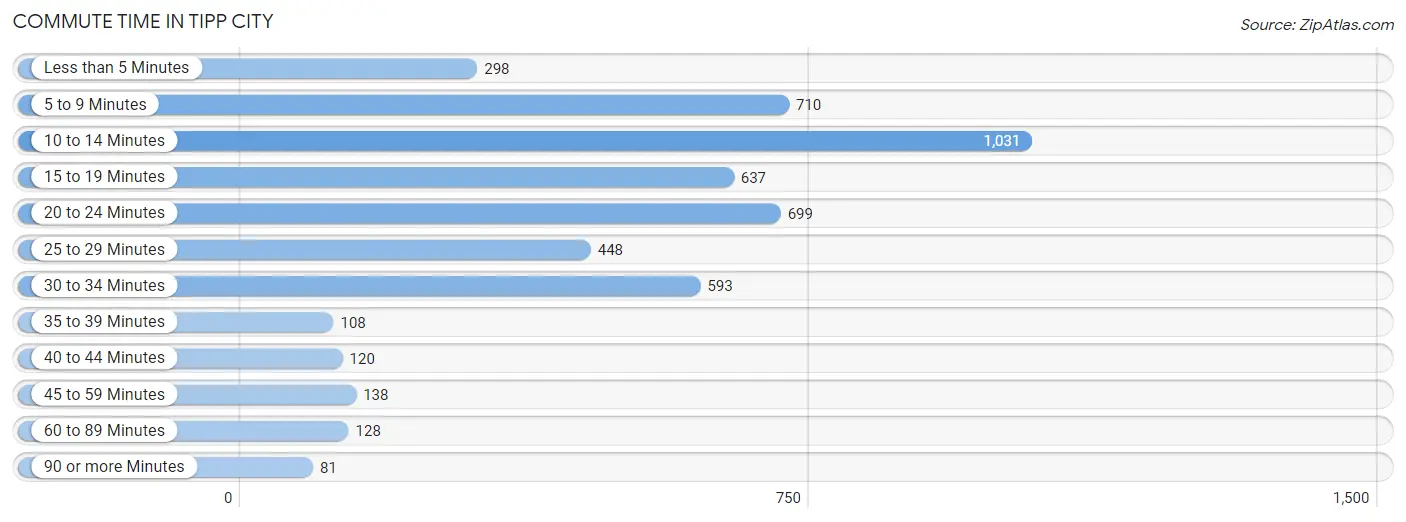
| Commute Time | # Commuters | % Commuters |
| Less than 5 Minutes | 298 | 6.0% |
| 5 to 9 Minutes | 710 | 14.2% |
| 10 to 14 Minutes | 1,031 | 20.7% |
| 15 to 19 Minutes | 637 | 12.8% |
| 20 to 24 Minutes | 699 | 14.0% |
| 25 to 29 Minutes | 448 | 9.0% |
| 30 to 34 Minutes | 593 | 11.9% |
| 35 to 39 Minutes | 108 | 2.2% |
| 40 to 44 Minutes | 120 | 2.4% |
| 45 to 59 Minutes | 138 | 2.8% |
| 60 to 89 Minutes | 128 | 2.6% |
| 90 or more Minutes | 81 | 1.6% |
Commute Time by Sex in Tipp City
The most common commute times in Tipp City are 10 to 14 minutes (528 commuters, 19.2%) for males and 10 to 14 minutes (503 commuters, 22.5%) for females.
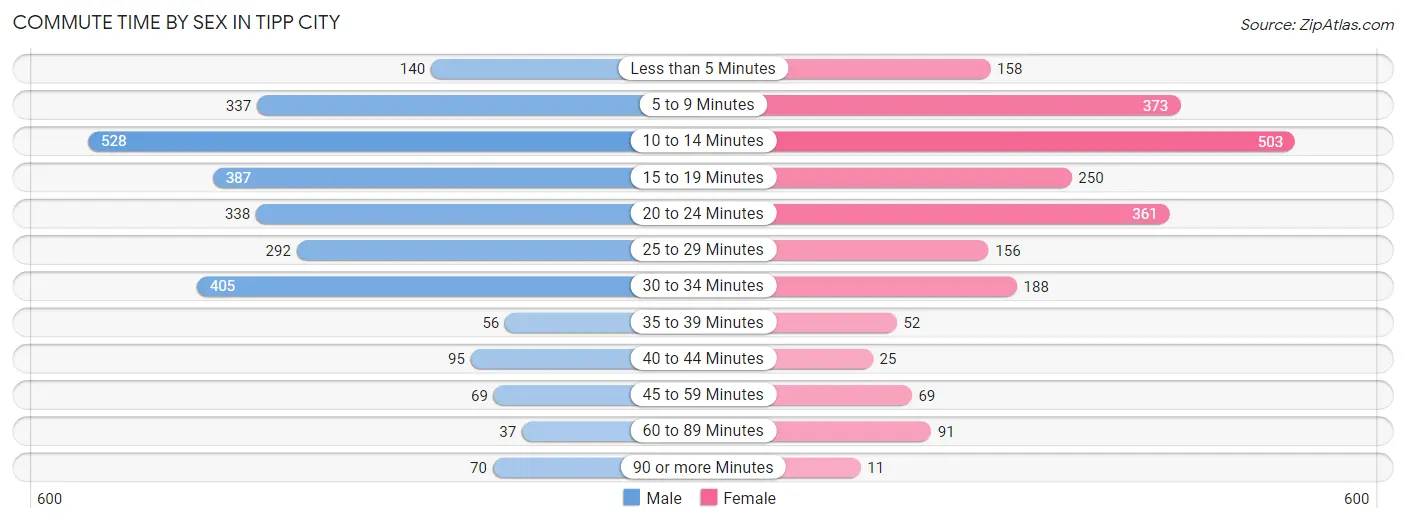
| Commute Time | Male | Female |
| Less than 5 Minutes | 140 (5.1%) | 158 (7.1%) |
| 5 to 9 Minutes | 337 (12.2%) | 373 (16.7%) |
| 10 to 14 Minutes | 528 (19.2%) | 503 (22.5%) |
| 15 to 19 Minutes | 387 (14.1%) | 250 (11.2%) |
| 20 to 24 Minutes | 338 (12.3%) | 361 (16.1%) |
| 25 to 29 Minutes | 292 (10.6%) | 156 (7.0%) |
| 30 to 34 Minutes | 405 (14.7%) | 188 (8.4%) |
| 35 to 39 Minutes | 56 (2.0%) | 52 (2.3%) |
| 40 to 44 Minutes | 95 (3.5%) | 25 (1.1%) |
| 45 to 59 Minutes | 69 (2.5%) | 69 (3.1%) |
| 60 to 89 Minutes | 37 (1.3%) | 91 (4.1%) |
| 90 or more Minutes | 70 (2.5%) | 11 (0.5%) |
Time of Departure to Work by Sex in Tipp City
The most frequent times of departure to work in Tipp City are 6:30 AM to 6:59 AM (513, 18.6%) for males and 7:00 AM to 7:29 AM (406, 18.1%) for females.
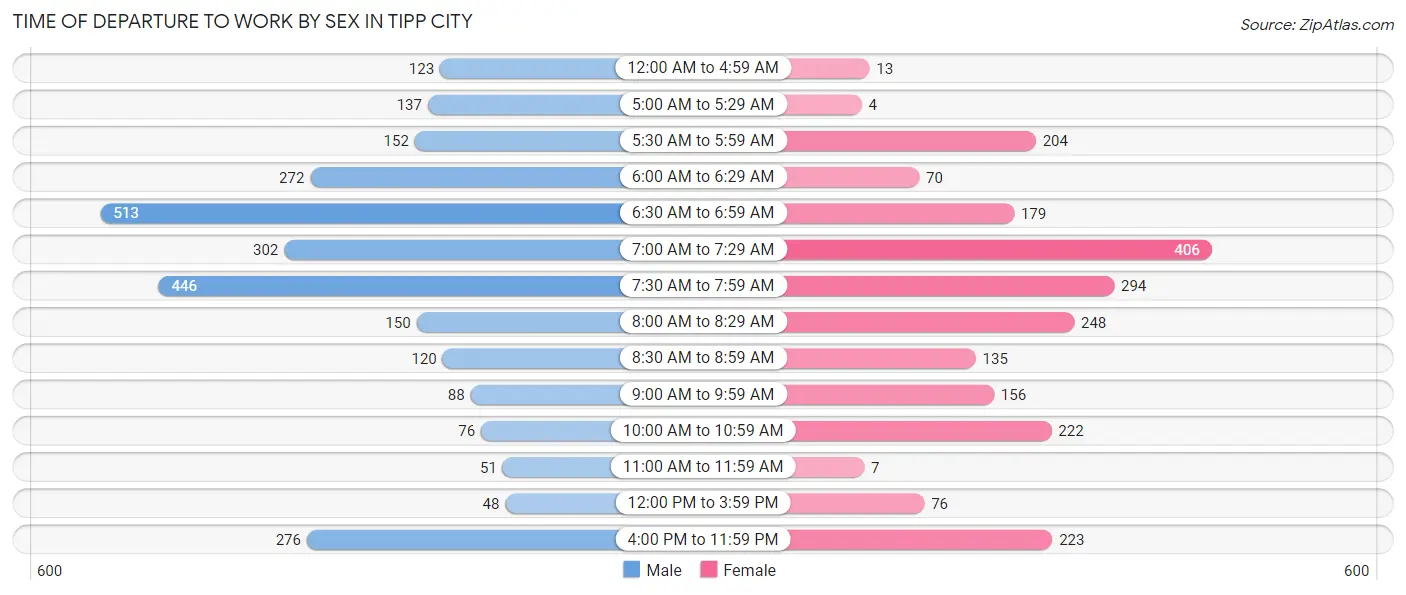
| Time of Departure | Male | Female |
| 12:00 AM to 4:59 AM | 123 (4.5%) | 13 (0.6%) |
| 5:00 AM to 5:29 AM | 137 (5.0%) | 4 (0.2%) |
| 5:30 AM to 5:59 AM | 152 (5.5%) | 204 (9.1%) |
| 6:00 AM to 6:29 AM | 272 (9.9%) | 70 (3.1%) |
| 6:30 AM to 6:59 AM | 513 (18.6%) | 179 (8.0%) |
| 7:00 AM to 7:29 AM | 302 (11.0%) | 406 (18.1%) |
| 7:30 AM to 7:59 AM | 446 (16.2%) | 294 (13.1%) |
| 8:00 AM to 8:29 AM | 150 (5.4%) | 248 (11.1%) |
| 8:30 AM to 8:59 AM | 120 (4.4%) | 135 (6.0%) |
| 9:00 AM to 9:59 AM | 88 (3.2%) | 156 (7.0%) |
| 10:00 AM to 10:59 AM | 76 (2.8%) | 222 (9.9%) |
| 11:00 AM to 11:59 AM | 51 (1.8%) | 7 (0.3%) |
| 12:00 PM to 3:59 PM | 48 (1.7%) | 76 (3.4%) |
| 4:00 PM to 11:59 PM | 276 (10.0%) | 223 (10.0%) |
| Total | 2,754 (100.0%) | 2,237 (100.0%) |
Housing Occupancy in Tipp City
Occupancy by Ownership in Tipp City
Of the total 4,299 dwellings in Tipp City, owner-occupied units account for 3,049 (70.9%), while renter-occupied units make up 1,250 (29.1%).
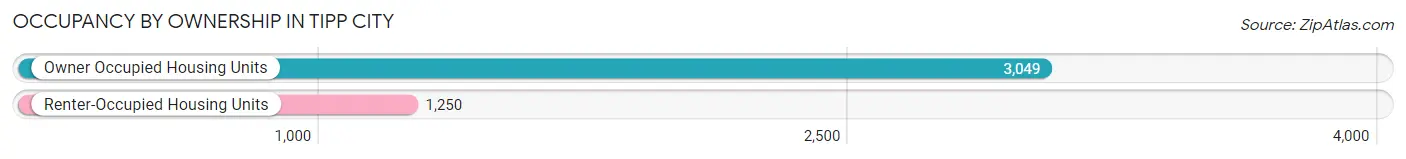
| Occupancy | # Housing Units | % Housing Units |
| Owner Occupied Housing Units | 3,049 | 70.9% |
| Renter-Occupied Housing Units | 1,250 | 29.1% |
| Total Occupied Housing Units | 4,299 | 100.0% |
Occupancy by Household Size in Tipp City
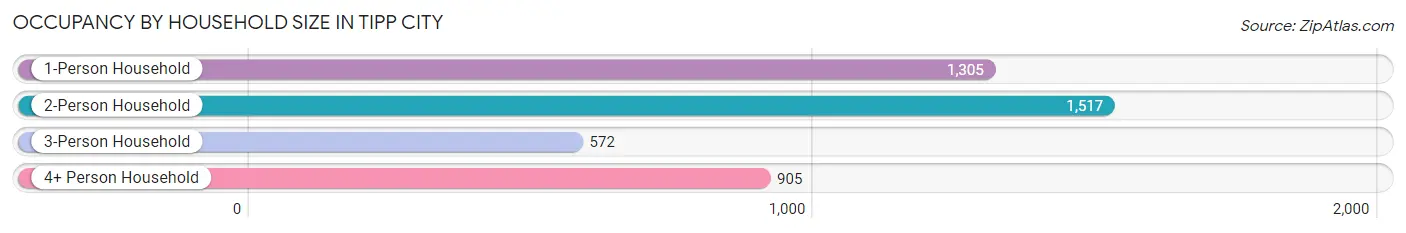
| Household Size | # Housing Units | % Housing Units |
| 1-Person Household | 1,305 | 30.4% |
| 2-Person Household | 1,517 | 35.3% |
| 3-Person Household | 572 | 13.3% |
| 4+ Person Household | 905 | 21.0% |
| Total Housing Units | 4,299 | 100.0% |
Occupancy by Ownership by Household Size in Tipp City
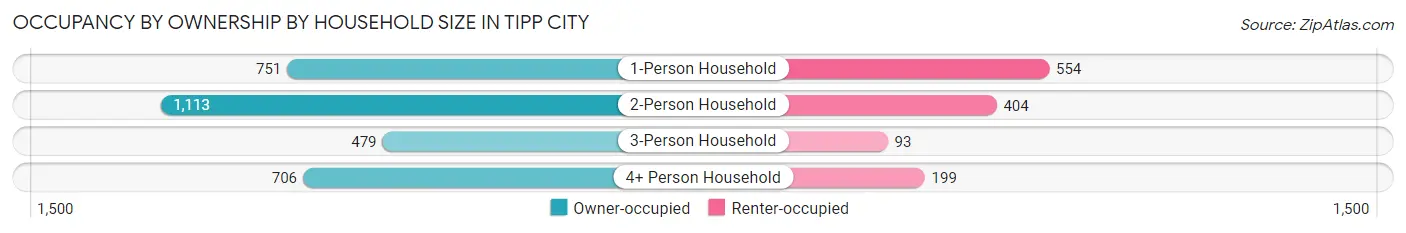
| Household Size | Owner-occupied | Renter-occupied |
| 1-Person Household | 751 (57.6%) | 554 (42.4%) |
| 2-Person Household | 1,113 (73.4%) | 404 (26.6%) |
| 3-Person Household | 479 (83.7%) | 93 (16.3%) |
| 4+ Person Household | 706 (78.0%) | 199 (22.0%) |
| Total Housing Units | 3,049 (70.9%) | 1,250 (29.1%) |
Occupancy by Educational Attainment in Tipp City
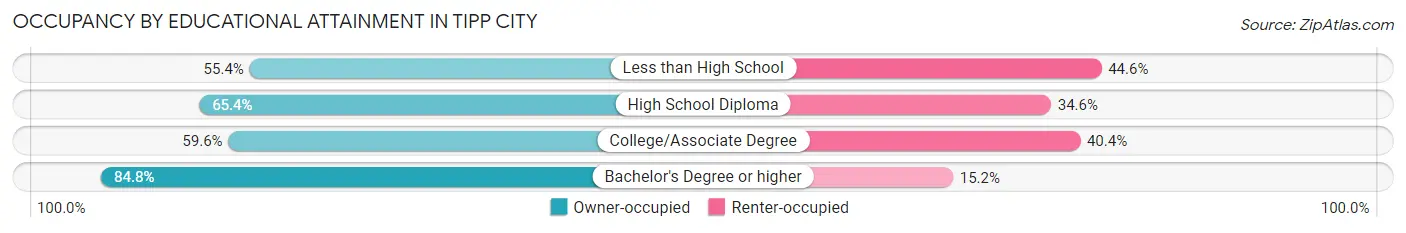
| Household Size | Owner-occupied | Renter-occupied |
| Less than High School | 36 (55.4%) | 29 (44.6%) |
| High School Diploma | 697 (65.4%) | 369 (34.6%) |
| College/Associate Degree | 876 (59.6%) | 594 (40.4%) |
| Bachelor's Degree or higher | 1,440 (84.8%) | 258 (15.2%) |
Occupancy by Age of Householder in Tipp City
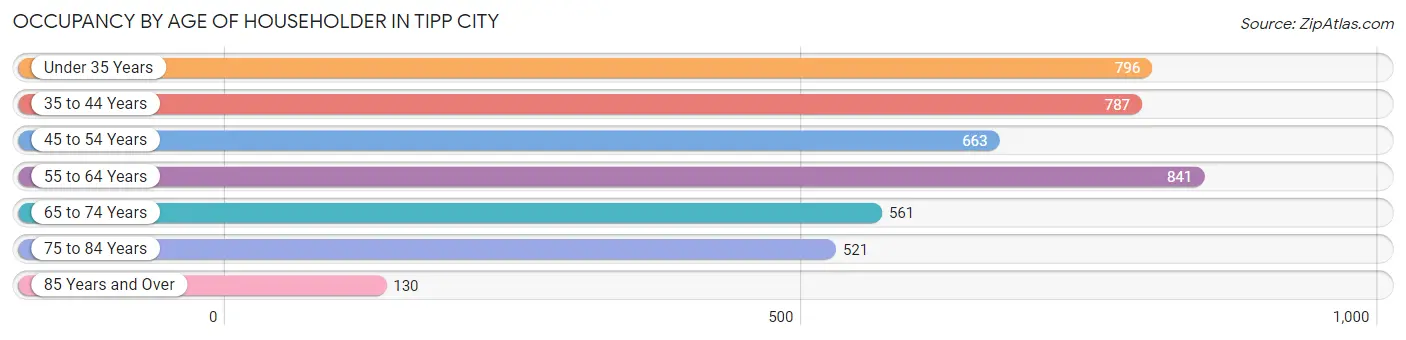
| Age Bracket | # Households | % Households |
| Under 35 Years | 796 | 18.5% |
| 35 to 44 Years | 787 | 18.3% |
| 45 to 54 Years | 663 | 15.4% |
| 55 to 64 Years | 841 | 19.6% |
| 65 to 74 Years | 561 | 13.1% |
| 75 to 84 Years | 521 | 12.1% |
| 85 Years and Over | 130 | 3.0% |
| Total | 4,299 | 100.0% |
Housing Finances in Tipp City
Median Income by Occupancy in Tipp City
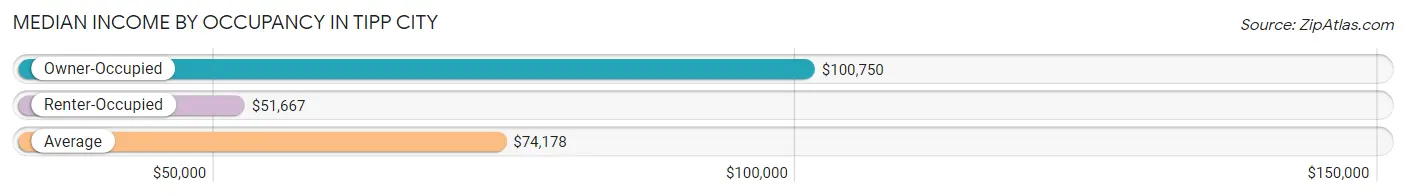
| Occupancy Type | # Households | Median Income |
| Owner-Occupied | 3,049 (70.9%) | $100,750 |
| Renter-Occupied | 1,250 (29.1%) | $51,667 |
| Average | 4,299 (100.0%) | $74,178 |
Occupancy by Householder Income Bracket in Tipp City
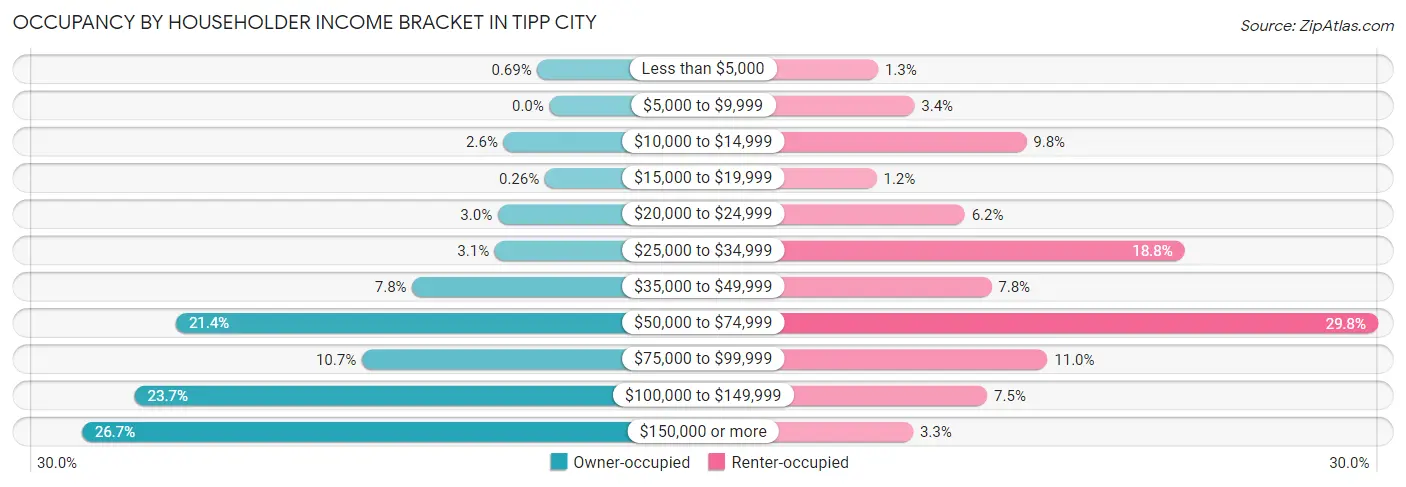
| Income Bracket | Owner-occupied | Renter-occupied |
| Less than $5,000 | 21 (0.7%) | 16 (1.3%) |
| $5,000 to $9,999 | 0 (0.0%) | 42 (3.4%) |
| $10,000 to $14,999 | 80 (2.6%) | 122 (9.8%) |
| $15,000 to $19,999 | 8 (0.3%) | 15 (1.2%) |
| $20,000 to $24,999 | 90 (2.9%) | 78 (6.2%) |
| $25,000 to $34,999 | 95 (3.1%) | 235 (18.8%) |
| $35,000 to $49,999 | 239 (7.8%) | 97 (7.8%) |
| $50,000 to $74,999 | 651 (21.3%) | 373 (29.8%) |
| $75,000 to $99,999 | 327 (10.7%) | 137 (11.0%) |
| $100,000 to $149,999 | 723 (23.7%) | 94 (7.5%) |
| $150,000 or more | 815 (26.7%) | 41 (3.3%) |
| Total | 3,049 (100.0%) | 1,250 (100.0%) |
Monthly Housing Cost Tiers in Tipp City
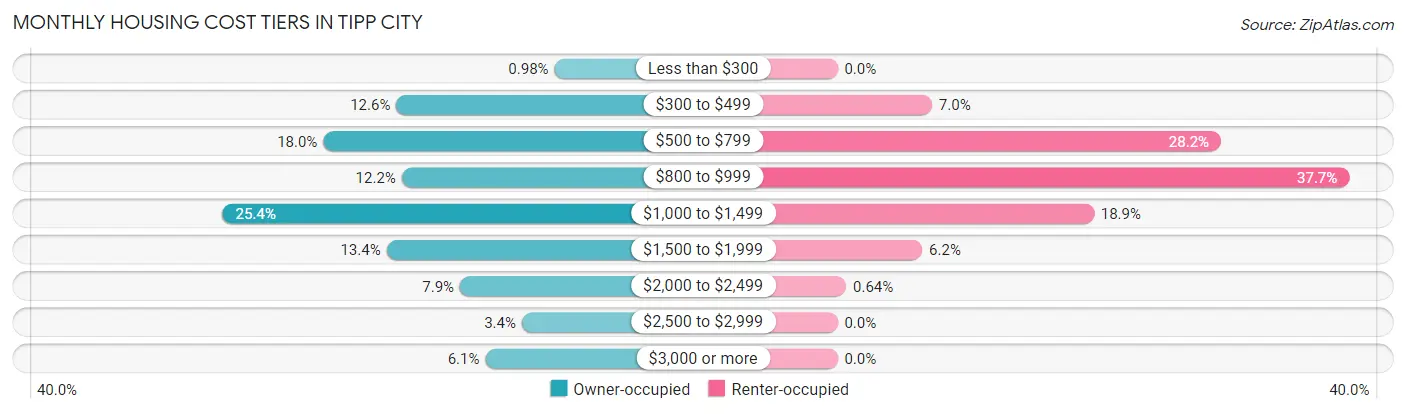
| Monthly Cost | Owner-occupied | Renter-occupied |
| Less than $300 | 30 (1.0%) | 0 (0.0%) |
| $300 to $499 | 385 (12.6%) | 87 (7.0%) |
| $500 to $799 | 549 (18.0%) | 353 (28.2%) |
| $800 to $999 | 373 (12.2%) | 471 (37.7%) |
| $1,000 to $1,499 | 775 (25.4%) | 236 (18.9%) |
| $1,500 to $1,999 | 407 (13.4%) | 78 (6.2%) |
| $2,000 to $2,499 | 242 (7.9%) | 8 (0.6%) |
| $2,500 to $2,999 | 103 (3.4%) | 0 (0.0%) |
| $3,000 or more | 185 (6.1%) | 0 (0.0%) |
| Total | 3,049 (100.0%) | 1,250 (100.0%) |
Physical Housing Characteristics in Tipp City
Housing Structures in Tipp City
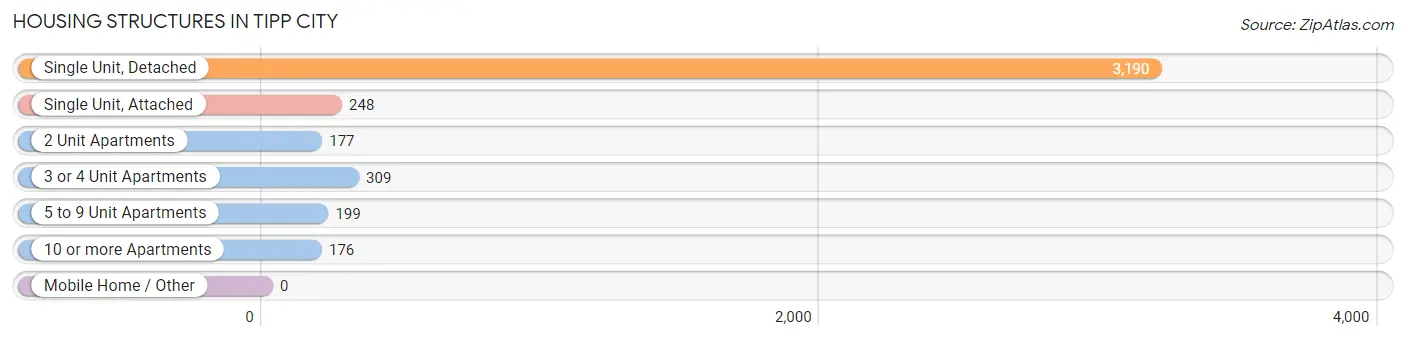
| Structure Type | # Housing Units | % Housing Units |
| Single Unit, Detached | 3,190 | 74.2% |
| Single Unit, Attached | 248 | 5.8% |
| 2 Unit Apartments | 177 | 4.1% |
| 3 or 4 Unit Apartments | 309 | 7.2% |
| 5 to 9 Unit Apartments | 199 | 4.6% |
| 10 or more Apartments | 176 | 4.1% |
| Mobile Home / Other | 0 | 0.0% |
| Total | 4,299 | 100.0% |
Housing Structures by Occupancy in Tipp City
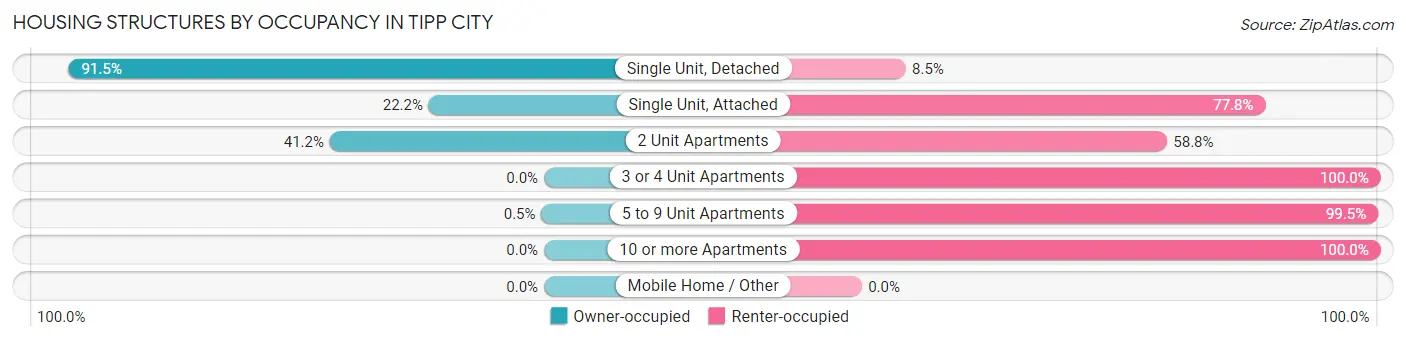
| Structure Type | Owner-occupied | Renter-occupied |
| Single Unit, Detached | 2,920 (91.5%) | 270 (8.5%) |
| Single Unit, Attached | 55 (22.2%) | 193 (77.8%) |
| 2 Unit Apartments | 73 (41.2%) | 104 (58.8%) |
| 3 or 4 Unit Apartments | 0 (0.0%) | 309 (100.0%) |
| 5 to 9 Unit Apartments | 1 (0.5%) | 198 (99.5%) |
| 10 or more Apartments | 0 (0.0%) | 176 (100.0%) |
| Mobile Home / Other | 0 (0.0%) | 0 (0.0%) |
| Total | 3,049 (70.9%) | 1,250 (29.1%) |
Housing Structures by Number of Rooms in Tipp City
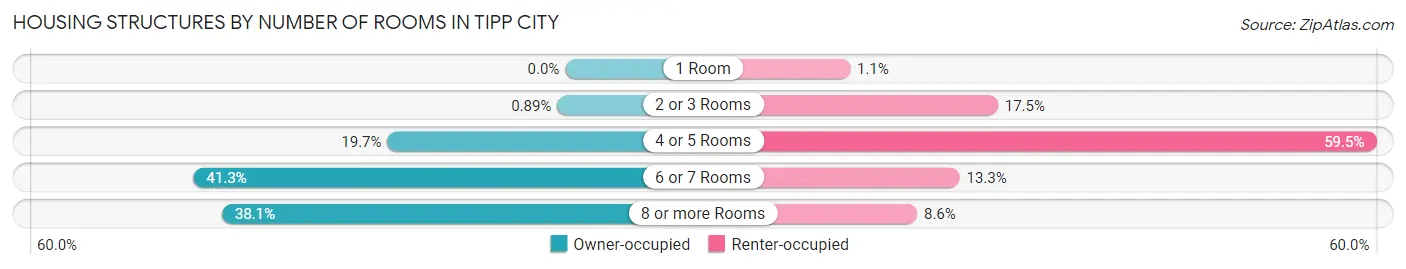
| Number of Rooms | Owner-occupied | Renter-occupied |
| 1 Room | 0 (0.0%) | 14 (1.1%) |
| 2 or 3 Rooms | 27 (0.9%) | 219 (17.5%) |
| 4 or 5 Rooms | 602 (19.7%) | 744 (59.5%) |
| 6 or 7 Rooms | 1,258 (41.3%) | 166 (13.3%) |
| 8 or more Rooms | 1,162 (38.1%) | 107 (8.6%) |
| Total | 3,049 (100.0%) | 1,250 (100.0%) |
Housing Structure by Heating Type in Tipp City
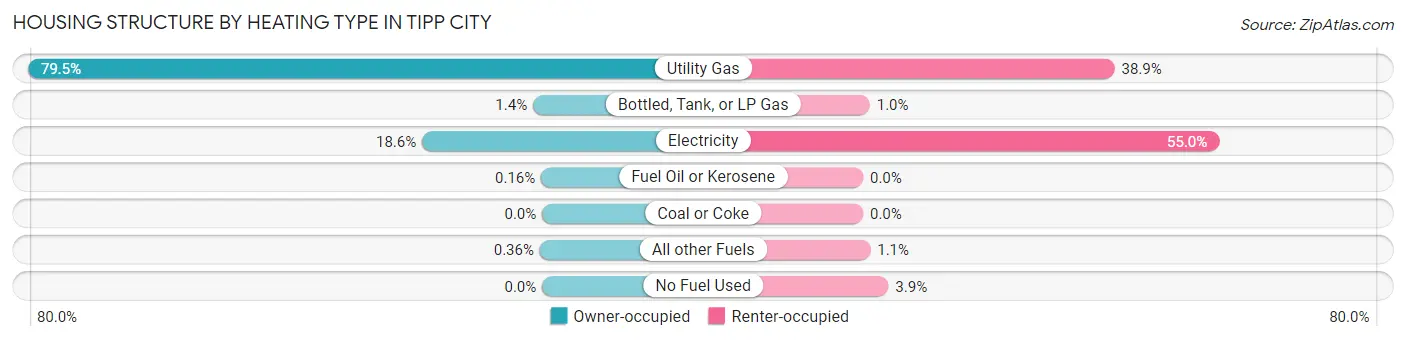
| Heating Type | Owner-occupied | Renter-occupied |
| Utility Gas | 2,424 (79.5%) | 486 (38.9%) |
| Bottled, Tank, or LP Gas | 43 (1.4%) | 13 (1.0%) |
| Electricity | 566 (18.6%) | 688 (55.0%) |
| Fuel Oil or Kerosene | 5 (0.2%) | 0 (0.0%) |
| Coal or Coke | 0 (0.0%) | 0 (0.0%) |
| All other Fuels | 11 (0.4%) | 14 (1.1%) |
| No Fuel Used | 0 (0.0%) | 49 (3.9%) |
| Total | 3,049 (100.0%) | 1,250 (100.0%) |
Household Vehicle Usage in Tipp City
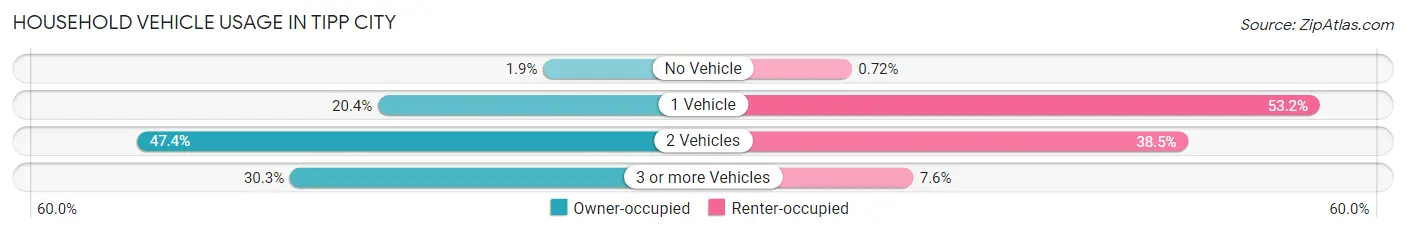
| Vehicles per Household | Owner-occupied | Renter-occupied |
| No Vehicle | 58 (1.9%) | 9 (0.7%) |
| 1 Vehicle | 622 (20.4%) | 665 (53.2%) |
| 2 Vehicles | 1,446 (47.4%) | 481 (38.5%) |
| 3 or more Vehicles | 923 (30.3%) | 95 (7.6%) |
| Total | 3,049 (100.0%) | 1,250 (100.0%) |
Real Estate & Mortgages in Tipp City
Real Estate and Mortgage Overview in Tipp City
| Characteristic | Without Mortgage | With Mortgage |
| Housing Units | 1,208 | 1,841 |
| Median Property Value | $186,900 | $239,000 |
| Median Household Income | $74,107 | $590 |
| Monthly Housing Costs | $590 | $185 |
| Real Estate Taxes | $2,742 | $27 |
Property Value by Mortgage Status in Tipp City
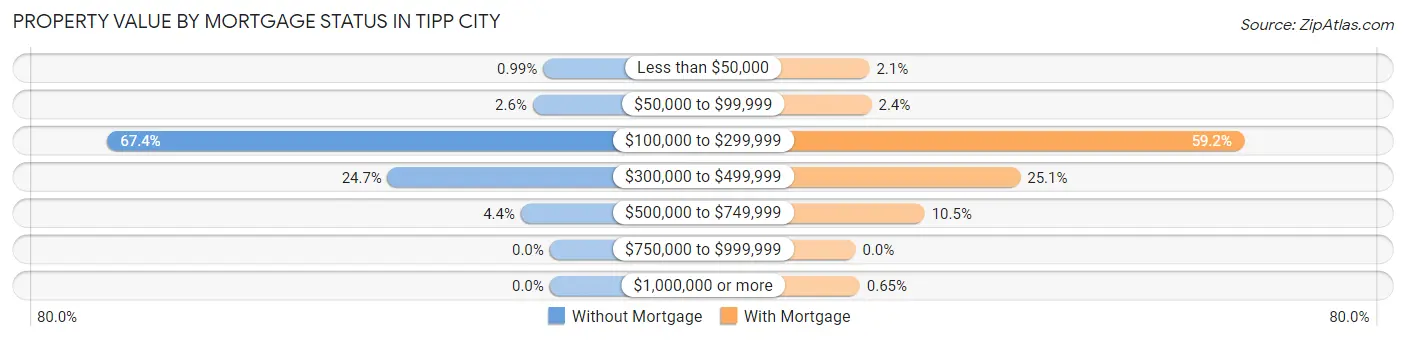
| Property Value | Without Mortgage | With Mortgage |
| Less than $50,000 | 12 (1.0%) | 39 (2.1%) |
| $50,000 to $99,999 | 31 (2.6%) | 45 (2.4%) |
| $100,000 to $299,999 | 814 (67.4%) | 1,089 (59.2%) |
| $300,000 to $499,999 | 298 (24.7%) | 462 (25.1%) |
| $500,000 to $749,999 | 53 (4.4%) | 194 (10.5%) |
| $750,000 to $999,999 | 0 (0.0%) | 0 (0.0%) |
| $1,000,000 or more | 0 (0.0%) | 12 (0.6%) |
| Total | 1,208 (100.0%) | 1,841 (100.0%) |
Household Income by Mortgage Status in Tipp City
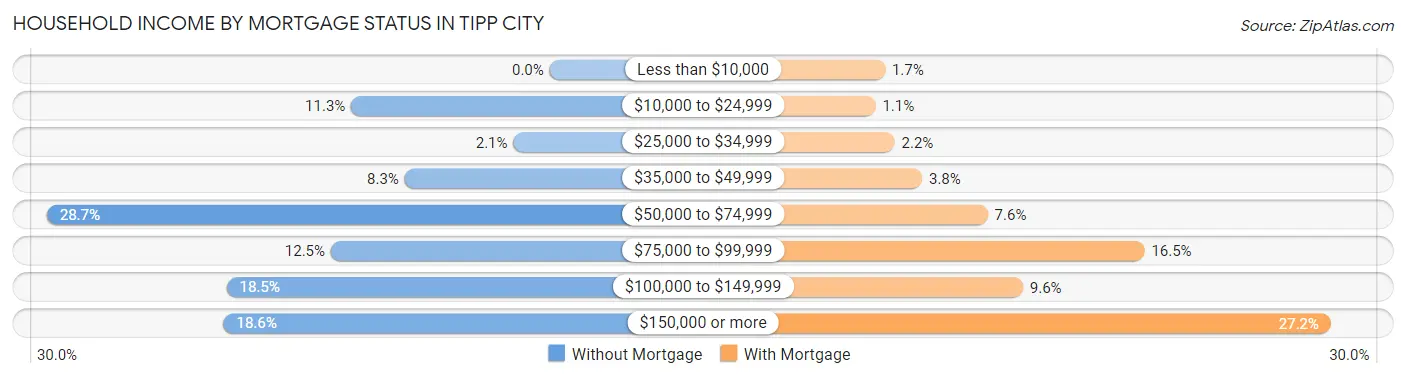
| Household Income | Without Mortgage | With Mortgage |
| Less than $10,000 | 0 (0.0%) | 31 (1.7%) |
| $10,000 to $24,999 | 137 (11.3%) | 21 (1.1%) |
| $25,000 to $34,999 | 25 (2.1%) | 41 (2.2%) |
| $35,000 to $49,999 | 100 (8.3%) | 70 (3.8%) |
| $50,000 to $74,999 | 347 (28.7%) | 139 (7.5%) |
| $75,000 to $99,999 | 151 (12.5%) | 304 (16.5%) |
| $100,000 to $149,999 | 223 (18.5%) | 176 (9.6%) |
| $150,000 or more | 225 (18.6%) | 500 (27.2%) |
| Total | 1,208 (100.0%) | 1,841 (100.0%) |
Property Value to Household Income Ratio in Tipp City
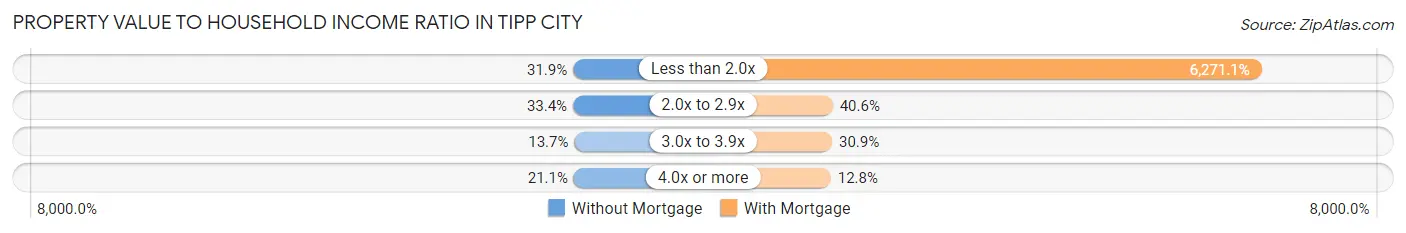
| Value-to-Income Ratio | Without Mortgage | With Mortgage |
| Less than 2.0x | 385 (31.9%) | 115,450 (6,271.1%) |
| 2.0x to 2.9x | 403 (33.4%) | 748 (40.6%) |
| 3.0x to 3.9x | 165 (13.7%) | 569 (30.9%) |
| 4.0x or more | 255 (21.1%) | 235 (12.8%) |
| Total | 1,208 (100.0%) | 1,841 (100.0%) |
Real Estate Taxes by Mortgage Status in Tipp City
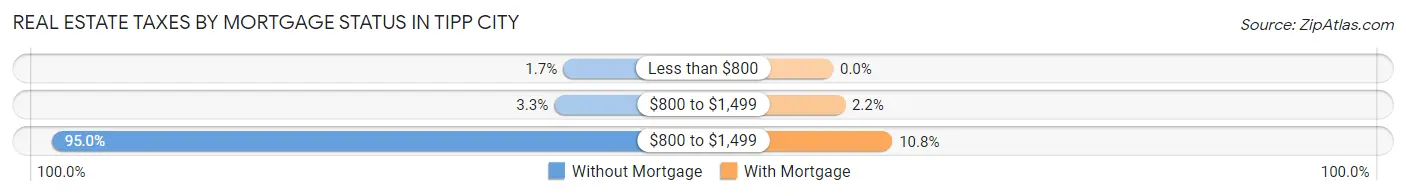
| Property Taxes | Without Mortgage | With Mortgage |
| Less than $800 | 20 (1.7%) | 0 (0.0%) |
| $800 to $1,499 | 40 (3.3%) | 40 (2.2%) |
| $800 to $1,499 | 1,148 (95.0%) | 199 (10.8%) |
| Total | 1,208 (100.0%) | 1,841 (100.0%) |
Health & Disability in Tipp City
Health Insurance Coverage by Age in Tipp City
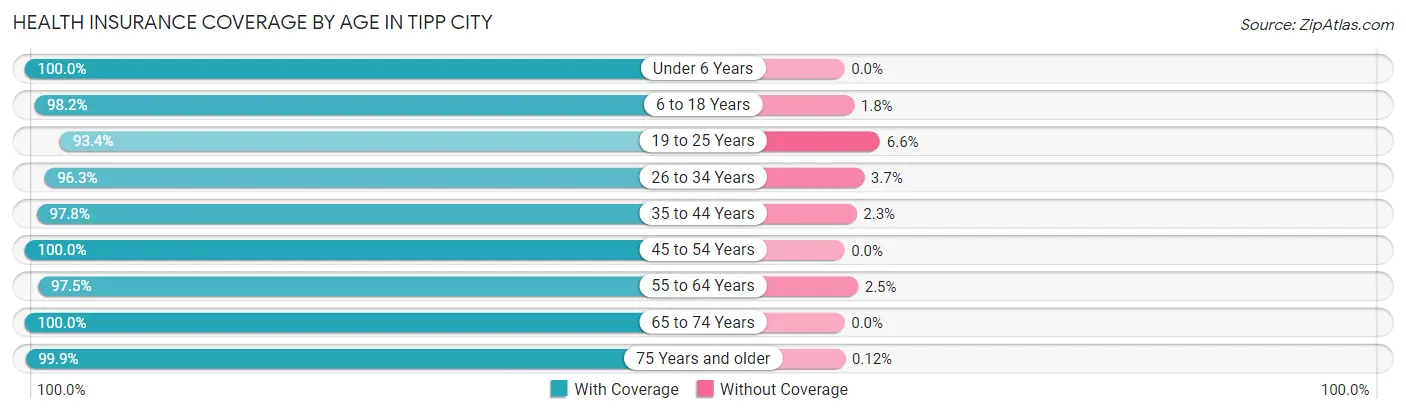
| Age Bracket | With Coverage | Without Coverage |
| Under 6 Years | 605 (100.0%) | 0 (0.0%) |
| 6 to 18 Years | 1,818 (98.2%) | 33 (1.8%) |
| 19 to 25 Years | 732 (93.4%) | 52 (6.6%) |
| 26 to 34 Years | 1,107 (96.3%) | 42 (3.7%) |
| 35 to 44 Years | 1,344 (97.8%) | 31 (2.2%) |
| 45 to 54 Years | 1,222 (100.0%) | 0 (0.0%) |
| 55 to 64 Years | 1,206 (97.5%) | 31 (2.5%) |
| 65 to 74 Years | 1,065 (100.0%) | 0 (0.0%) |
| 75 Years and older | 867 (99.9%) | 1 (0.1%) |
| Total | 9,966 (98.1%) | 190 (1.9%) |
Health Insurance Coverage by Citizenship Status in Tipp City
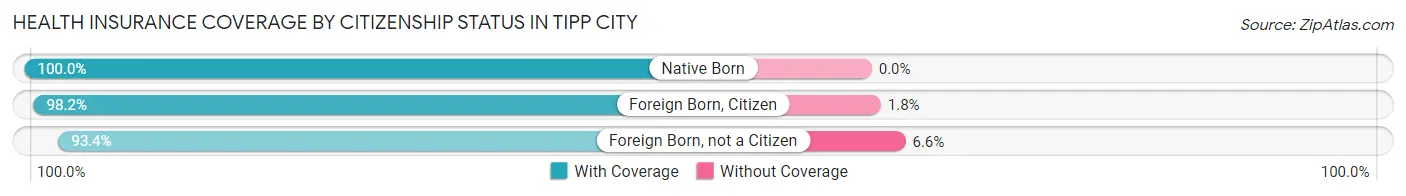
| Citizenship Status | With Coverage | Without Coverage |
| Native Born | 605 (100.0%) | 0 (0.0%) |
| Foreign Born, Citizen | 1,818 (98.2%) | 33 (1.8%) |
| Foreign Born, not a Citizen | 732 (93.4%) | 52 (6.6%) |
Health Insurance Coverage by Household Income in Tipp City
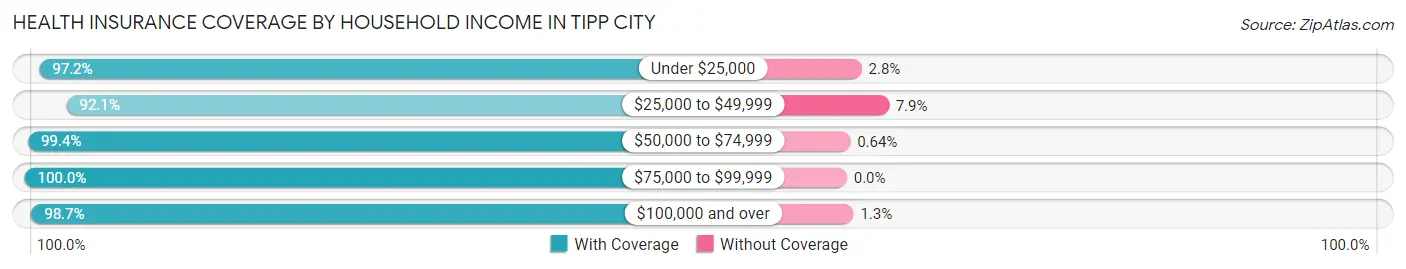
| Household Income | With Coverage | Without Coverage |
| Under $25,000 | 596 (97.2%) | 17 (2.8%) |
| $25,000 to $49,999 | 1,113 (92.1%) | 95 (7.9%) |
| $50,000 to $74,999 | 1,868 (99.4%) | 12 (0.6%) |
| $75,000 to $99,999 | 1,229 (100.0%) | 0 (0.0%) |
| $100,000 and over | 5,160 (98.7%) | 66 (1.3%) |
Public vs Private Health Insurance Coverage by Age in Tipp City
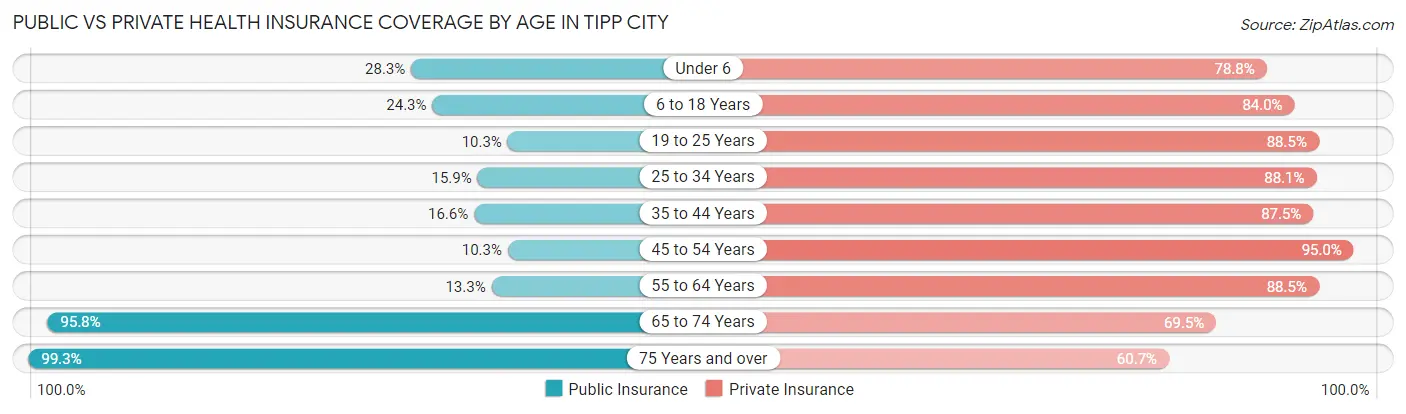
| Age Bracket | Public Insurance | Private Insurance |
| Under 6 | 171 (28.3%) | 477 (78.8%) |
| 6 to 18 Years | 450 (24.3%) | 1,555 (84.0%) |
| 19 to 25 Years | 81 (10.3%) | 694 (88.5%) |
| 25 to 34 Years | 183 (15.9%) | 1,012 (88.1%) |
| 35 to 44 Years | 228 (16.6%) | 1,203 (87.5%) |
| 45 to 54 Years | 126 (10.3%) | 1,161 (95.0%) |
| 55 to 64 Years | 165 (13.3%) | 1,095 (88.5%) |
| 65 to 74 Years | 1,020 (95.8%) | 740 (69.5%) |
| 75 Years and over | 862 (99.3%) | 527 (60.7%) |
| Total | 3,286 (32.4%) | 8,464 (83.3%) |
Disability Status by Sex by Age in Tipp City
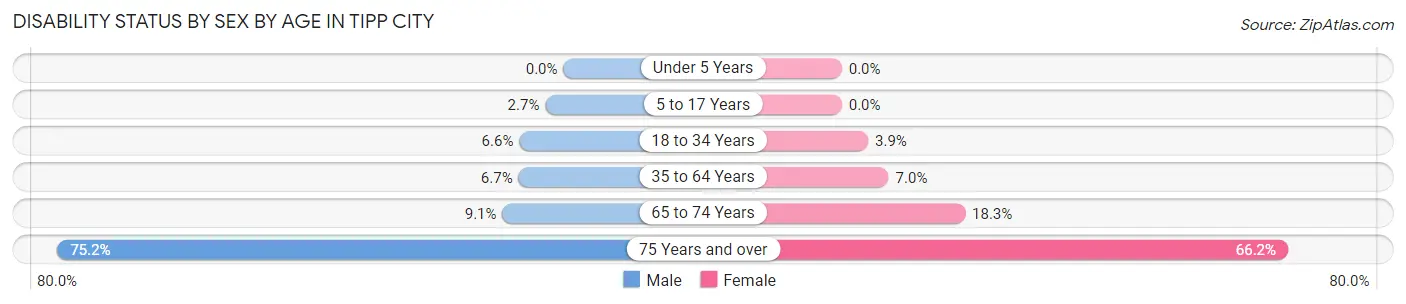
| Age Bracket | Male | Female |
| Under 5 Years | 0 (0.0%) | 0 (0.0%) |
| 5 to 17 Years | 22 (2.7%) | 0 (0.0%) |
| 18 to 34 Years | 72 (6.6%) | 39 (3.9%) |
| 35 to 64 Years | 130 (6.7%) | 131 (7.0%) |
| 65 to 74 Years | 46 (9.1%) | 102 (18.3%) |
| 75 Years and over | 254 (75.1%) | 351 (66.2%) |
Disability Class by Sex by Age in Tipp City
Disability Class: Hearing Difficulty
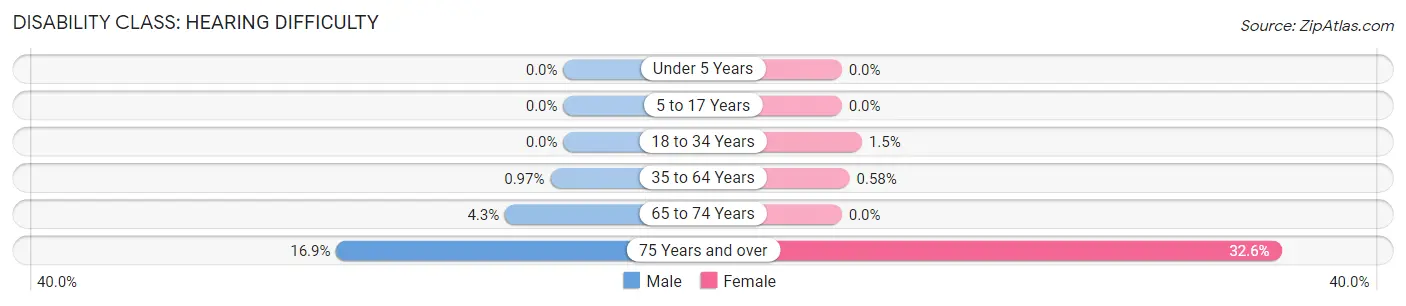
| Age Bracket | Male | Female |
| Under 5 Years | 0 (0.0%) | 0 (0.0%) |
| 5 to 17 Years | 0 (0.0%) | 0 (0.0%) |
| 18 to 34 Years | 0 (0.0%) | 15 (1.5%) |
| 35 to 64 Years | 19 (1.0%) | 11 (0.6%) |
| 65 to 74 Years | 22 (4.3%) | 0 (0.0%) |
| 75 Years and over | 57 (16.9%) | 173 (32.6%) |
Disability Class: Vision Difficulty
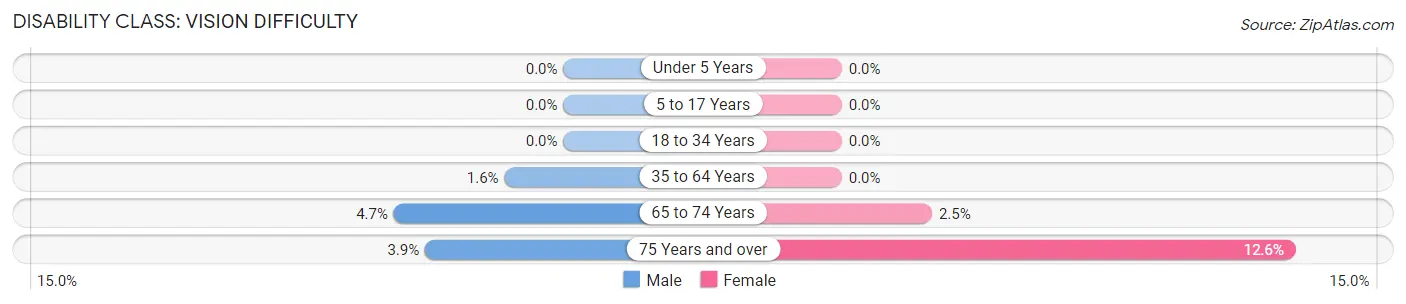
| Age Bracket | Male | Female |
| Under 5 Years | 0 (0.0%) | 0 (0.0%) |
| 5 to 17 Years | 0 (0.0%) | 0 (0.0%) |
| 18 to 34 Years | 0 (0.0%) | 0 (0.0%) |
| 35 to 64 Years | 32 (1.6%) | 0 (0.0%) |
| 65 to 74 Years | 24 (4.7%) | 14 (2.5%) |
| 75 Years and over | 13 (3.8%) | 67 (12.6%) |
Disability Class: Cognitive Difficulty
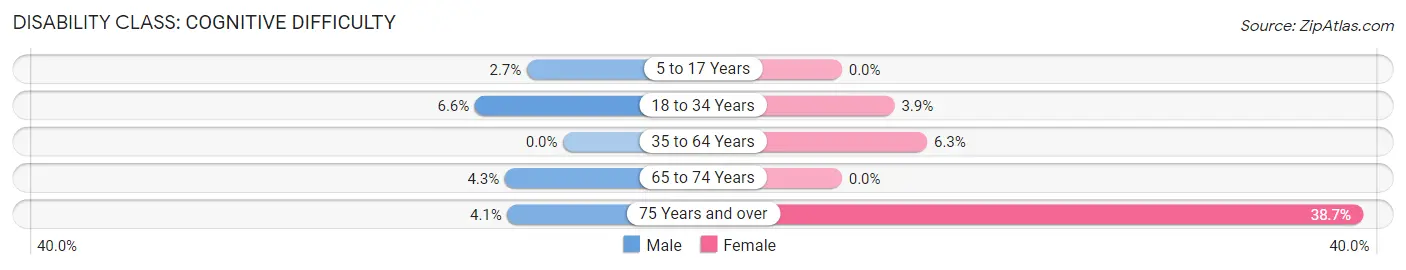
| Age Bracket | Male | Female |
| 5 to 17 Years | 22 (2.7%) | 0 (0.0%) |
| 18 to 34 Years | 72 (6.6%) | 39 (3.9%) |
| 35 to 64 Years | 0 (0.0%) | 119 (6.3%) |
| 65 to 74 Years | 22 (4.3%) | 0 (0.0%) |
| 75 Years and over | 14 (4.1%) | 205 (38.7%) |
Disability Class: Ambulatory Difficulty
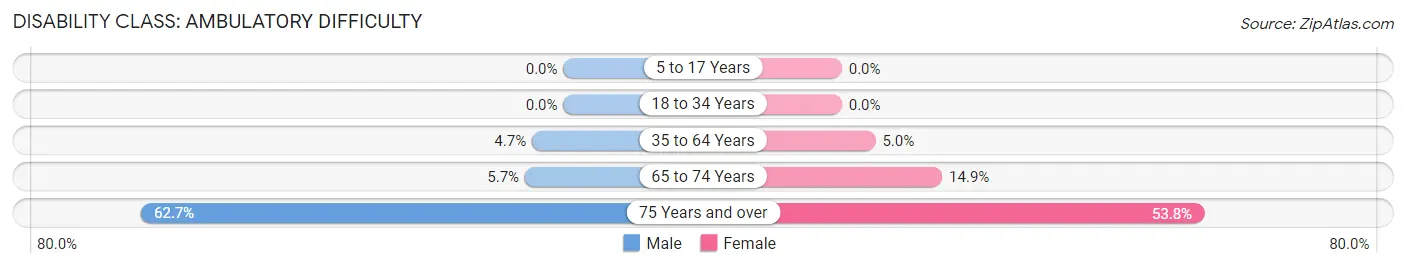
| Age Bracket | Male | Female |
| 5 to 17 Years | 0 (0.0%) | 0 (0.0%) |
| 18 to 34 Years | 0 (0.0%) | 0 (0.0%) |
| 35 to 64 Years | 91 (4.7%) | 94 (5.0%) |
| 65 to 74 Years | 29 (5.7%) | 83 (14.9%) |
| 75 Years and over | 212 (62.7%) | 285 (53.8%) |
Disability Class: Self-Care Difficulty
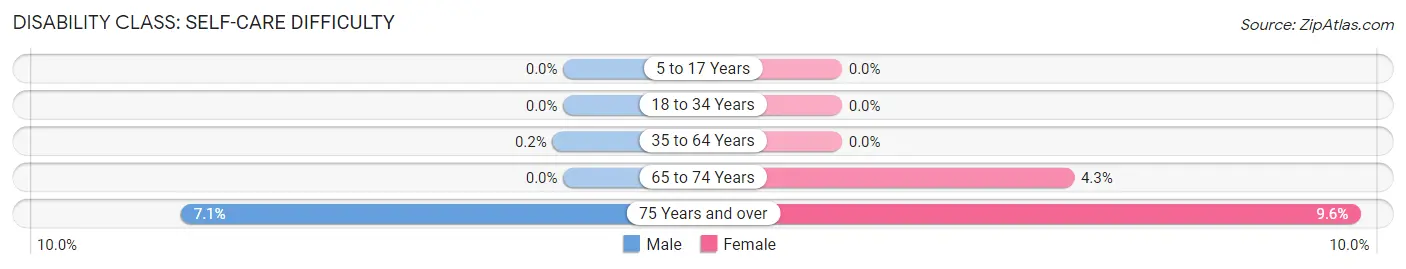
| Age Bracket | Male | Female |
| 5 to 17 Years | 0 (0.0%) | 0 (0.0%) |
| 18 to 34 Years | 0 (0.0%) | 0 (0.0%) |
| 35 to 64 Years | 4 (0.2%) | 0 (0.0%) |
| 65 to 74 Years | 0 (0.0%) | 24 (4.3%) |
| 75 Years and over | 24 (7.1%) | 51 (9.6%) |
Technology Access in Tipp City
Computing Device Access in Tipp City
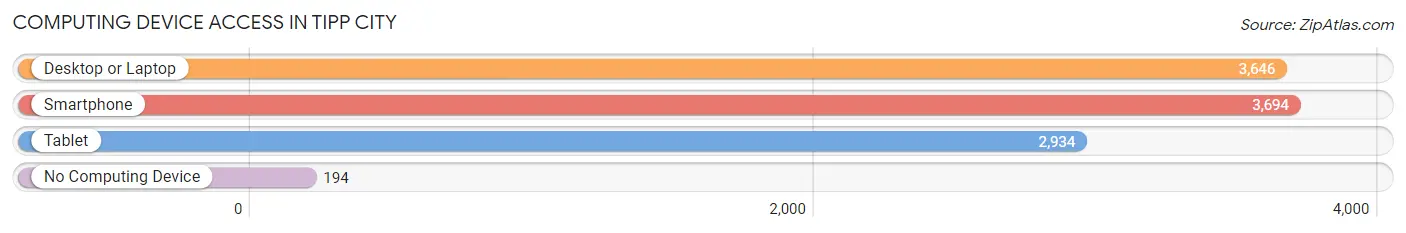
| Device Type | # Households | % Households |
| Desktop or Laptop | 3,646 | 84.8% |
| Smartphone | 3,694 | 85.9% |
| Tablet | 2,934 | 68.2% |
| No Computing Device | 194 | 4.5% |
| Total | 4,299 | 100.0% |
Internet Access in Tipp City
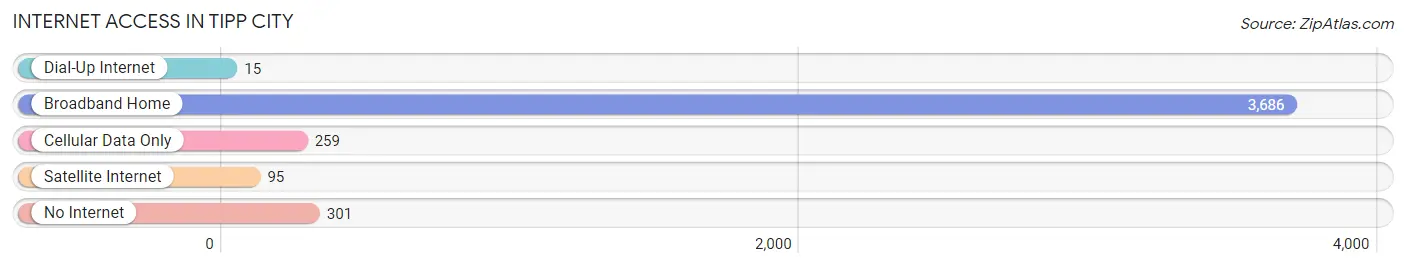
| Internet Type | # Households | % Households |
| Dial-Up Internet | 15 | 0.4% |
| Broadband Home | 3,686 | 85.7% |
| Cellular Data Only | 259 | 6.0% |
| Satellite Internet | 95 | 2.2% |
| No Internet | 301 | 7.0% |
| Total | 4,299 | 100.0% |
Tipp City Summary
Tipp City is a small city located in Miami County, Ohio, United States. It is situated along the Great Miami River, approximately 20 miles north of Dayton. The city was founded in 1840 and incorporated in 1841. As of the 2010 census, the city had a population of 9,689.
Geography
Tipp City is located at 39°56'45" North, 84°10'45" West (39.94583, -84.17917). According to the United States Census Bureau, the city has a total area of 4.3 square miles, all of it land.
The city is located in the Miami Valley region of Ohio, and is part of the Dayton Metropolitan Statistical Area. It is situated along the Great Miami River, approximately 20 miles north of Dayton.
History
Tipp City was founded in 1840 by John Tippecanoe, a local landowner. The city was named after him, and was incorporated in 1841.
The city was originally a farming community, but in the late 19th century, it became a manufacturing center. The city was home to several factories, including a paper mill, a flour mill, a sawmill, and a brickyard.
In the early 20th century, the city experienced a period of growth and prosperity. The city was home to several businesses, including a bank, a hotel, a movie theater, and a variety of stores.
Economy
Tipp City is home to a variety of businesses, including manufacturing, retail, and service industries. The city is home to several large employers, including Hobart Corporation, a manufacturer of food service equipment, and Emerson Climate Technologies, a manufacturer of heating and cooling systems.
The city is also home to several small businesses, including restaurants, shops, and professional services.
Demographics
As of the 2010 census, the city had a population of 9,689. The racial makeup of the city was 94.2% White, 1.7% African American, 0.3% Native American, 0.9% Asian, 0.1% Pacific Islander, 1.2% from other races, and 1.6% from two or more races. Hispanic or Latino of any race were 3.2% of the population.
The median income for a household in the city was $50,945, and the median income for a family was $60,945. The per capita income for the city was $25,845. About 5.2% of families and 6.7% of the population were below the poverty line, including 8.2% of those under age 18 and 5.2% of those age 65 or over.
Tipp City is served by the Tipp City Exempted Village School District. The district has one elementary school, one middle school, and one high school. The city is also home to several private schools, including St. John's Lutheran School and Tippecanoe Christian School.
Common Questions
What is Per Capita Income in Tipp City?
Per Capita income in Tipp City is $46,391.
What is the Median Family Income in Tipp City?
Median Family Income in Tipp City is $101,176.
What is the Median Household income in Tipp City?
Median Household Income in Tipp City is $74,178.
What is Income or Wage Gap in Tipp City?
Income or Wage Gap in Tipp City is 43.4%.
Women in Tipp City earn 56.6 cents for every dollar earned by a man.
What is Inequality or Gini Index in Tipp City?
Inequality or Gini Index in Tipp City is 0.44.
What is the Total Population of Tipp City?
Total Population of Tipp City is 10,266.
What is the Total Male Population of Tipp City?
Total Male Population of Tipp City is 4,988.
What is the Total Female Population of Tipp City?
Total Female Population of Tipp City is 5,278.
What is the Ratio of Males per 100 Females in Tipp City?
There are 94.51 Males per 100 Females in Tipp City.
What is the Ratio of Females per 100 Males in Tipp City?
There are 105.81 Females per 100 Males in Tipp City.
What is the Median Population Age in Tipp City?
Median Population Age in Tipp City is 40.1 Years.
What is the Average Family Size in Tipp City
Average Family Size in Tipp City is 2.9 People.
What is the Average Household Size in Tipp City
Average Household Size in Tipp City is 2.4 People.
How Large is the Labor Force in Tipp City?
There are 5,418 People in the Labor Forcein in Tipp City.
What is the Percentage of People in the Labor Force in Tipp City?
65.9% of People are in the Labor Force in Tipp City.
What is the Unemployment Rate in Tipp City?
Unemployment Rate in Tipp City is 0.9%.