Sidney, OH Map & Demographics
Sidney Map
Sidney Overview
$32,905
PER CAPITA INCOME
$83,404
AVG FAMILY INCOME
$63,851
AVG HOUSEHOLD INCOME
39.6%
WAGE / INCOME GAP [ % ]
60.4¢/ $1
WAGE / INCOME GAP [ $ ]
0.40
INEQUALITY / GINI INDEX
20,350
TOTAL POPULATION
9,849
MALE POPULATION
10,501
FEMALE POPULATION
93.79
MALES / 100 FEMALES
106.62
FEMALES / 100 MALES
40.2
MEDIAN AGE
3.0
AVG FAMILY SIZE
2.4
AVG HOUSEHOLD SIZE
10,659
LABOR FORCE [ PEOPLE ]
65.9%
PERCENT IN LABOR FORCE
6.6%
UNEMPLOYMENT RATE
Sidney Zip Codes
Sidney Area Codes
Income in Sidney
Income Overview in Sidney
Per Capita Income in Sidney is $32,905, while median incomes of families and households are $83,404 and $63,851 respectively.
| Characteristic | Number | Measure |
| Per Capita Income | 20,350 | $32,905 |
| Median Family Income | 5,162 | $83,404 |
| Mean Family Income | 5,162 | $94,698 |
| Median Household Income | 8,343 | $63,851 |
| Mean Household Income | 8,343 | $79,494 |
| Income Deficit | 5,162 | $0 |
| Wage / Income Gap (%) | 20,350 | 39.57% |
| Wage / Income Gap ($) | 20,350 | 60.43¢ per $1 |
| Gini / Inequality Index | 20,350 | 0.40 |
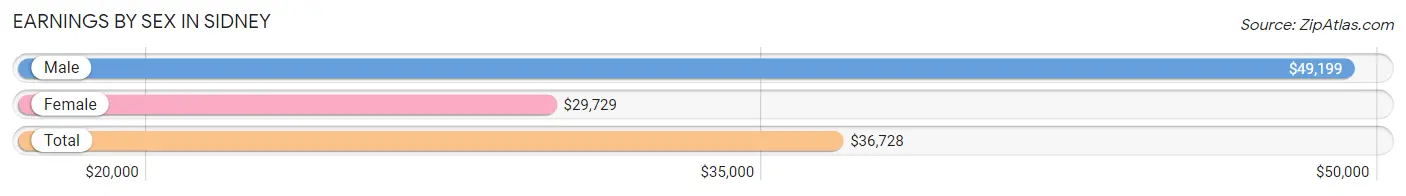
Earnings by Sex in Sidney
Average Earnings in Sidney are $36,728, $49,199 for men and $29,729 for women, a difference of 39.6%.
| Sex | Number | Average Earnings |
| Male | 5,572 (50.1%) | $49,199 |
| Female | 5,539 (49.8%) | $29,729 |
| Total | 11,111 (100.0%) | $36,728 |
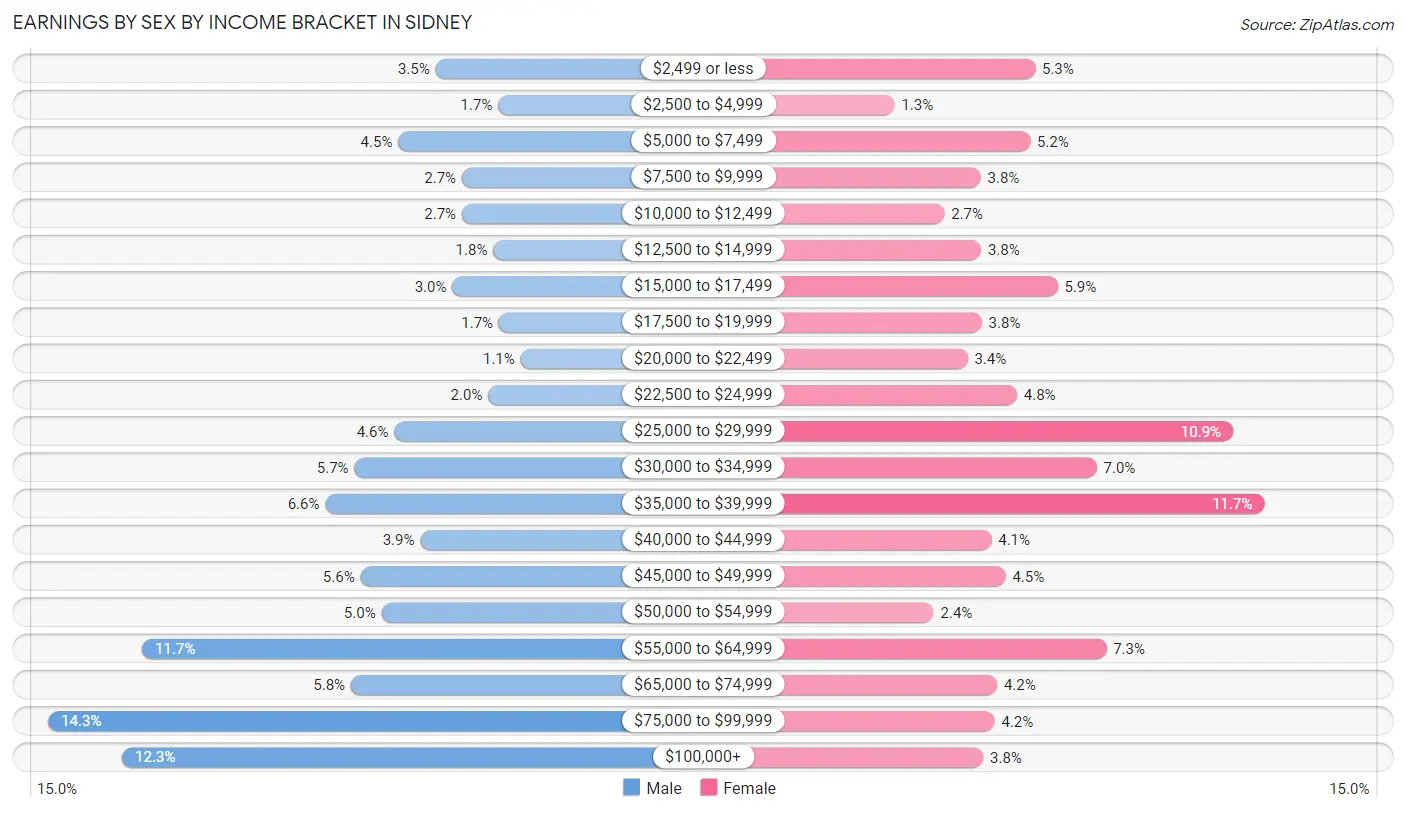
Earnings by Sex by Income Bracket in Sidney
The most common earnings brackets in Sidney are $75,000 to $99,999 for men (799 | 14.3%) and $35,000 to $39,999 for women (650 | 11.7%).
| Income | Male | Female |
| $2,499 or less | 192 (3.5%) | 293 (5.3%) |
| $2,500 to $4,999 | 94 (1.7%) | 74 (1.3%) |
| $5,000 to $7,499 | 251 (4.5%) | 285 (5.1%) |
| $7,500 to $9,999 | 151 (2.7%) | 208 (3.8%) |
| $10,000 to $12,499 | 151 (2.7%) | 152 (2.7%) |
| $12,500 to $14,999 | 102 (1.8%) | 209 (3.8%) |
| $15,000 to $17,499 | 166 (3.0%) | 328 (5.9%) |
| $17,500 to $19,999 | 93 (1.7%) | 210 (3.8%) |
| $20,000 to $22,499 | 59 (1.1%) | 188 (3.4%) |
| $22,500 to $24,999 | 110 (2.0%) | 265 (4.8%) |
| $25,000 to $29,999 | 257 (4.6%) | 601 (10.8%) |
| $30,000 to $34,999 | 319 (5.7%) | 389 (7.0%) |
| $35,000 to $39,999 | 365 (6.6%) | 650 (11.7%) |
| $40,000 to $44,999 | 216 (3.9%) | 225 (4.1%) |
| $45,000 to $49,999 | 310 (5.6%) | 247 (4.5%) |
| $50,000 to $54,999 | 277 (5.0%) | 135 (2.4%) |
| $55,000 to $64,999 | 652 (11.7%) | 404 (7.3%) |
| $65,000 to $74,999 | 325 (5.8%) | 234 (4.2%) |
| $75,000 to $99,999 | 799 (14.3%) | 230 (4.2%) |
| $100,000+ | 683 (12.3%) | 212 (3.8%) |
| Total | 5,572 (100.0%) | 5,539 (100.0%) |
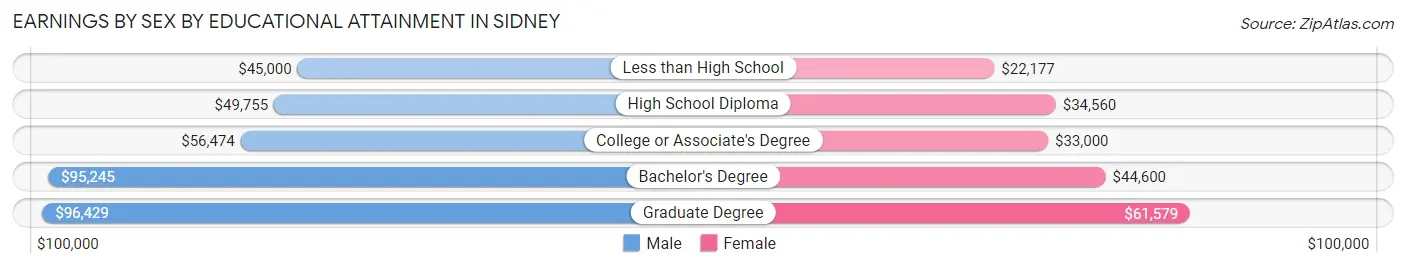
Earnings by Sex by Educational Attainment in Sidney
Average earnings in Sidney are $56,375 for men and $35,052 for women, a difference of 37.8%. Men with an educational attainment of graduate degree enjoy the highest average annual earnings of $96,429, while those with less than high school education earn the least with $45,000. Women with an educational attainment of graduate degree earn the most with the average annual earnings of $61,579, while those with less than high school education have the smallest earnings of $22,177.
| Educational Attainment | Male Income | Female Income |
| Less than High School | $45,000 | $22,177 |
| High School Diploma | $49,755 | $34,560 |
| College or Associate's Degree | $56,474 | $33,000 |
| Bachelor's Degree | $95,245 | $44,600 |
| Graduate Degree | $96,429 | $61,579 |
| Total | $56,375 | $35,052 |
Family Income in Sidney
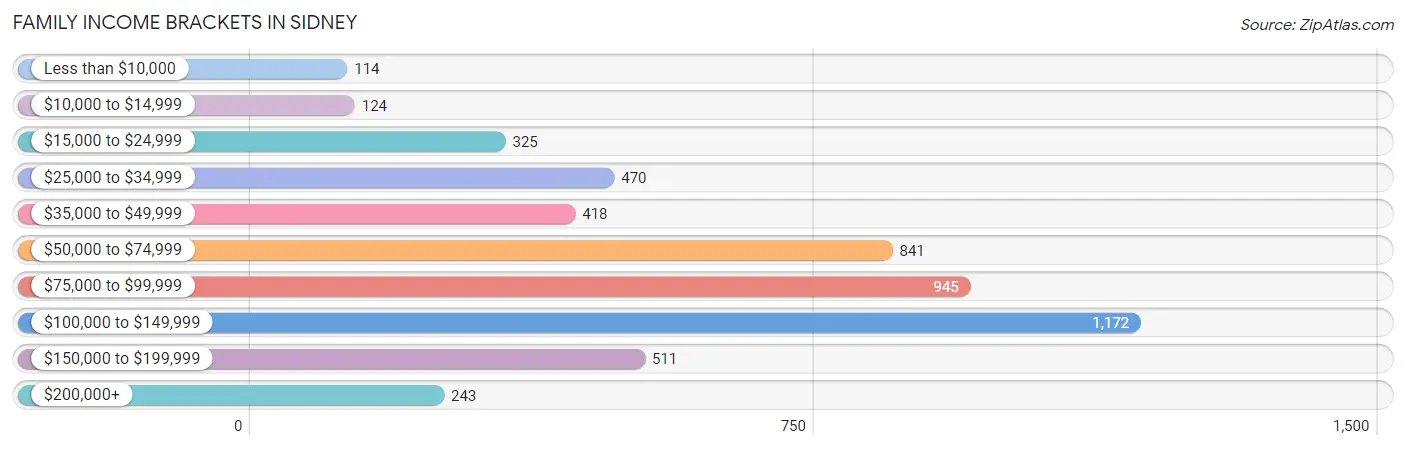
Family Income Brackets in Sidney
According to the Sidney family income data, there are 1,172 families falling into the $100,000 to $149,999 income range, which is the most common income bracket and makes up 22.7% of all families. Conversely, the less than $10,000 income bracket is the least frequent group with only 114 families (2.2%) belonging to this category.
| Income Bracket | # Families | % Families |
| Less than $10,000 | 114 | 2.2% |
| $10,000 to $14,999 | 124 | 2.4% |
| $15,000 to $24,999 | 325 | 6.3% |
| $25,000 to $34,999 | 470 | 9.1% |
| $35,000 to $49,999 | 418 | 8.1% |
| $50,000 to $74,999 | 841 | 16.3% |
| $75,000 to $99,999 | 945 | 18.3% |
| $100,000 to $149,999 | 1,172 | 22.7% |
| $150,000 to $199,999 | 511 | 9.9% |
| $200,000+ | 243 | 4.7% |
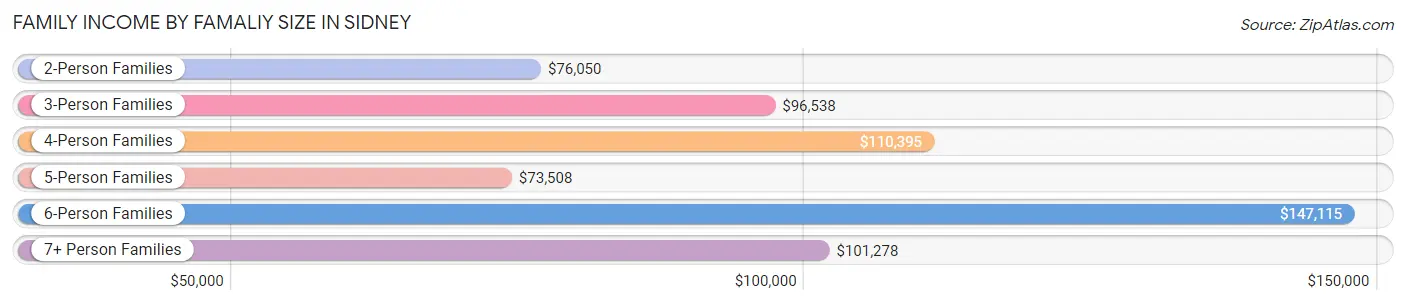
Family Income by Famaliy Size in Sidney
6-person families (98 | 1.9%) account for the highest median family income in Sidney with $147,115 per family, while 2-person families (2,685 | 52.0%) have the highest median income of $38,025 per family member.
| Income Bracket | # Families | Median Income |
| 2-Person Families | 2,685 (52.0%) | $76,050 |
| 3-Person Families | 1,076 (20.8%) | $96,538 |
| 4-Person Families | 752 (14.6%) | $110,395 |
| 5-Person Families | 412 (8.0%) | $73,508 |
| 6-Person Families | 98 (1.9%) | $147,115 |
| 7+ Person Families | 139 (2.7%) | $101,278 |
| Total | 5,162 (100.0%) | $83,404 |
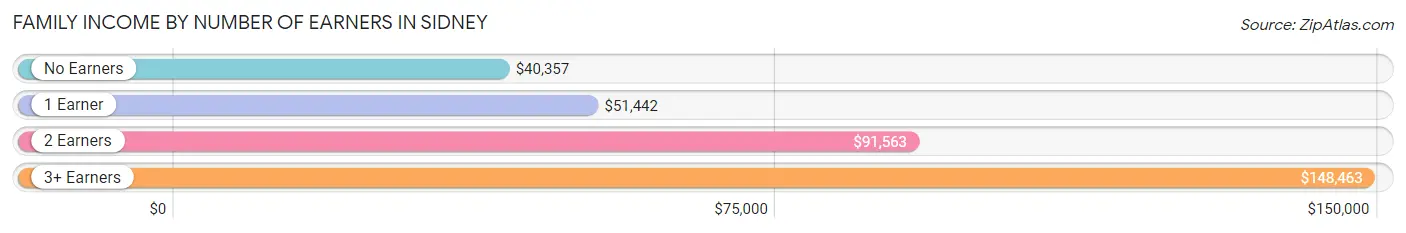
Family Income by Number of Earners in Sidney
The median family income in Sidney is $83,404, with families comprising 3+ earners (763) having the highest median family income of $148,463, while families with no earners (896) have the lowest median family income of $40,357, accounting for 14.8% and 17.4% of families, respectively.
| Number of Earners | # Families | Median Income |
| No Earners | 896 (17.4%) | $40,357 |
| 1 Earner | 1,366 (26.5%) | $51,442 |
| 2 Earners | 2,137 (41.4%) | $91,563 |
| 3+ Earners | 763 (14.8%) | $148,463 |
| Total | 5,162 (100.0%) | $83,404 |
Household Income in Sidney
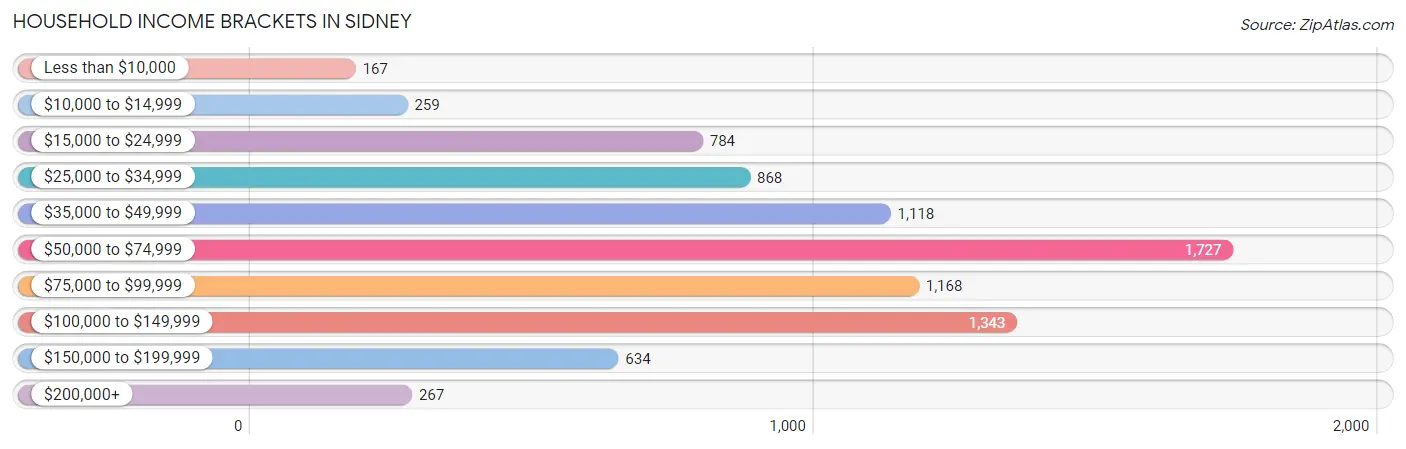
Household Income Brackets in Sidney
With 1,727 households falling in the category, the $50,000 to $74,999 income range is the most frequent in Sidney, accounting for 20.7% of all households. In contrast, only 167 households (2.0%) fall into the less than $10,000 income bracket, making it the least populous group.
| Income Bracket | # Households | % Households |
| Less than $10,000 | 167 | 2.0% |
| $10,000 to $14,999 | 259 | 3.1% |
| $15,000 to $24,999 | 784 | 9.4% |
| $25,000 to $34,999 | 868 | 10.4% |
| $35,000 to $49,999 | 1,118 | 13.4% |
| $50,000 to $74,999 | 1,727 | 20.7% |
| $75,000 to $99,999 | 1,168 | 14.0% |
| $100,000 to $149,999 | 1,343 | 16.1% |
| $150,000 to $199,999 | 634 | 7.6% |
| $200,000+ | 267 | 3.2% |
Household Income by Householder Age in Sidney
The median household income in Sidney is $63,851, with the highest median household income of $72,476 found in the 25 to 44 years age bracket for the primary householder. A total of 2,191 households (26.3%) fall into this category. Meanwhile, the 65+ years age bracket for the primary householder has the lowest median household income of $47,031, with 2,334 households (28.0%) in this group.
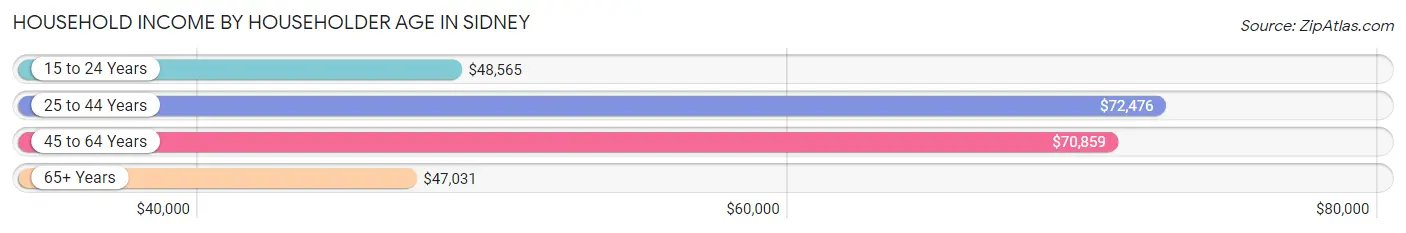
| Income Bracket | # Households | Median Income |
| 15 to 24 Years | 541 (6.5%) | $48,565 |
| 25 to 44 Years | 2,191 (26.3%) | $72,476 |
| 45 to 64 Years | 3,277 (39.3%) | $70,859 |
| 65+ Years | 2,334 (28.0%) | $47,031 |
| Total | 8,343 (100.0%) | $63,851 |
Poverty in Sidney
Income Below Poverty by Sex and Age in Sidney
With 13.3% poverty level for males and 13.7% for females among the residents of Sidney, 6 to 11 year old males and under 5 year old females are the most vulnerable to poverty, with 302 males (35.8%) and 211 females (34.1%) in their respective age groups living below the poverty level.
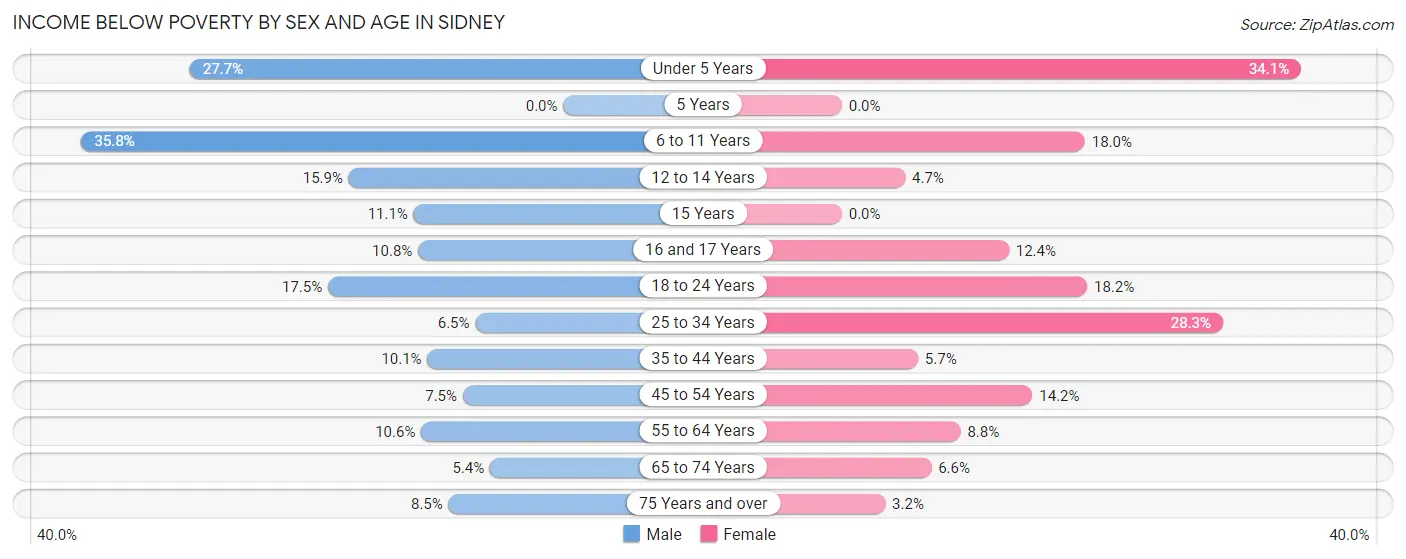
| Age Bracket | Male | Female |
| Under 5 Years | 188 (27.7%) | 211 (34.1%) |
| 5 Years | 0 (0.0%) | 0 (0.0%) |
| 6 to 11 Years | 302 (35.8%) | 112 (18.0%) |
| 12 to 14 Years | 90 (15.9%) | 18 (4.7%) |
| 15 Years | 18 (11.1%) | 0 (0.0%) |
| 16 and 17 Years | 40 (10.8%) | 31 (12.4%) |
| 18 to 24 Years | 137 (17.5%) | 238 (18.2%) |
| 25 to 34 Years | 66 (6.5%) | 333 (28.3%) |
| 35 to 44 Years | 126 (10.1%) | 63 (5.7%) |
| 45 to 54 Years | 87 (7.5%) | 184 (14.1%) |
| 55 to 64 Years | 150 (10.5%) | 123 (8.8%) |
| 65 to 74 Years | 51 (5.4%) | 74 (6.6%) |
| 75 Years and over | 49 (8.5%) | 27 (3.2%) |
| Total | 1,304 (13.3%) | 1,414 (13.7%) |
Income Above Poverty by Sex and Age in Sidney
According to the poverty statistics in Sidney, males aged 5 years and females aged 5 years are the age groups that are most secure financially, with 100.0% of males and 100.0% of females in these age groups living above the poverty line.
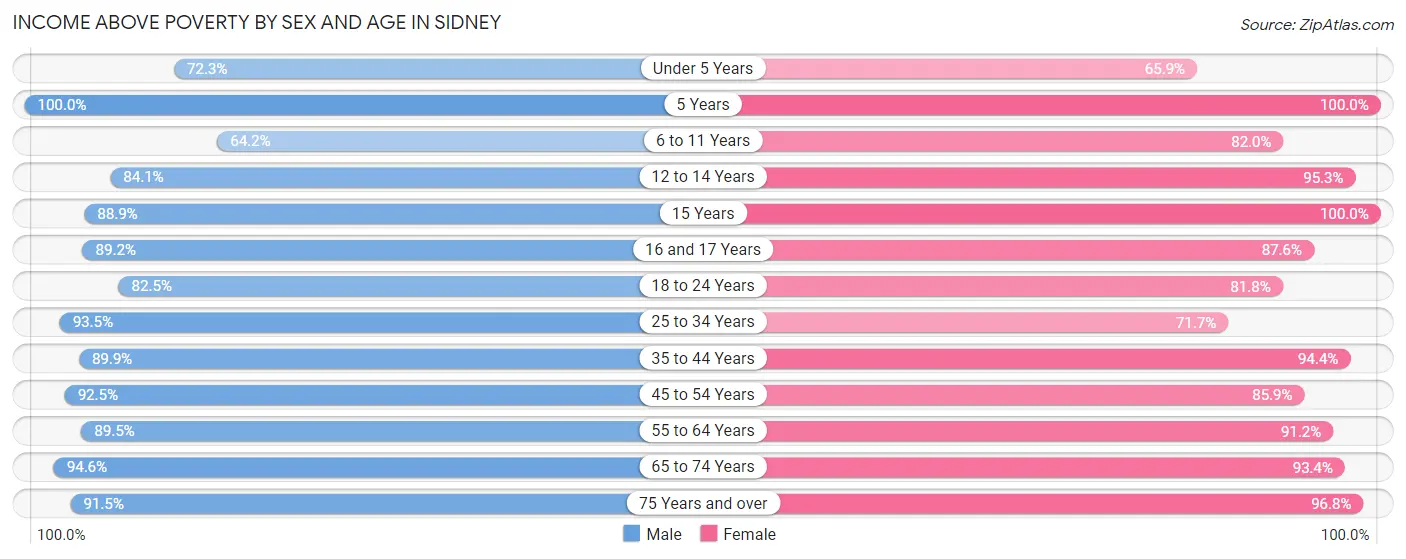
| Age Bracket | Male | Female |
| Under 5 Years | 490 (72.3%) | 408 (65.9%) |
| 5 Years | 17 (100.0%) | 100 (100.0%) |
| 6 to 11 Years | 542 (64.2%) | 509 (82.0%) |
| 12 to 14 Years | 475 (84.1%) | 365 (95.3%) |
| 15 Years | 144 (88.9%) | 126 (100.0%) |
| 16 and 17 Years | 331 (89.2%) | 219 (87.6%) |
| 18 to 24 Years | 647 (82.5%) | 1,069 (81.8%) |
| 25 to 34 Years | 944 (93.5%) | 844 (71.7%) |
| 35 to 44 Years | 1,123 (89.9%) | 1,052 (94.4%) |
| 45 to 54 Years | 1,080 (92.5%) | 1,116 (85.9%) |
| 55 to 64 Years | 1,272 (89.4%) | 1,273 (91.2%) |
| 65 to 74 Years | 887 (94.6%) | 1,040 (93.4%) |
| 75 Years and over | 526 (91.5%) | 811 (96.8%) |
| Total | 8,478 (86.7%) | 8,932 (86.3%) |
Income Below Poverty Among Married-Couple Families in Sidney
The poverty statistics for married-couple families in Sidney show that 2.5% or 91 of the total 3,683 families live below the poverty line. Families with 3 or 4 children have the highest poverty rate of 10.2%, comprising of 43 families. On the other hand, families with 5 or more children have the lowest poverty rate of 0.0%, which includes 0 families.
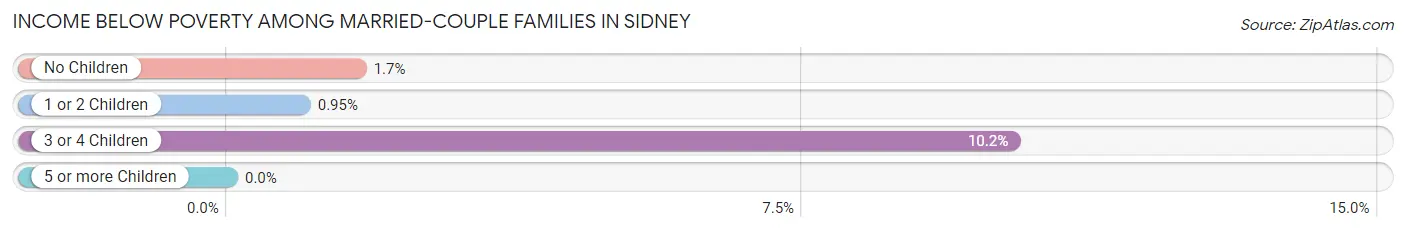
| Children | Above Poverty | Below Poverty |
| No Children | 2,346 (98.3%) | 40 (1.7%) |
| 1 or 2 Children | 832 (99.1%) | 8 (0.9%) |
| 3 or 4 Children | 378 (89.8%) | 43 (10.2%) |
| 5 or more Children | 36 (100.0%) | 0 (0.0%) |
| Total | 3,592 (97.5%) | 91 (2.5%) |
Income Below Poverty Among Single-Parent Households in Sidney
According to the poverty data in Sidney, 13.3% or 48 single-father households and 36.3% or 406 single-mother households are living below the poverty line. Among single-father households, those with 3 or 4 children have the highest poverty rate, with 24 households (22.4%) experiencing poverty. Likewise, among single-mother households, those with 3 or 4 children have the highest poverty rate, with 68 households (89.5%) falling below the poverty line.
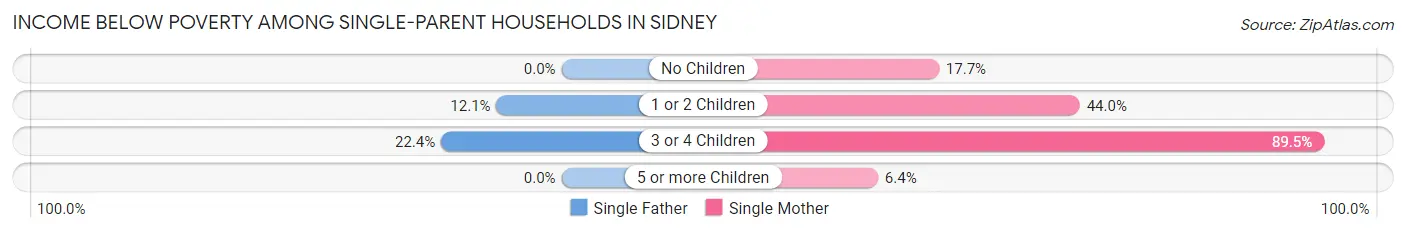
| Children | Single Father | Single Mother |
| No Children | 0 (0.0%) | 69 (17.7%) |
| 1 or 2 Children | 24 (12.1%) | 266 (44.0%) |
| 3 or 4 Children | 24 (22.4%) | 68 (89.5%) |
| 5 or more Children | 0 (0.0%) | 3 (6.4%) |
| Total | 48 (13.3%) | 406 (36.3%) |
Income Below Poverty Among Married-Couple vs Single-Parent Households in Sidney
The poverty data for Sidney shows that 91 of the married-couple family households (2.5%) and 454 of the single-parent households (30.7%) are living below the poverty level. Within the married-couple family households, those with 3 or 4 children have the highest poverty rate, with 43 households (10.2%) falling below the poverty line. Among the single-parent households, those with 3 or 4 children have the highest poverty rate, with 92 household (50.3%) living below poverty.
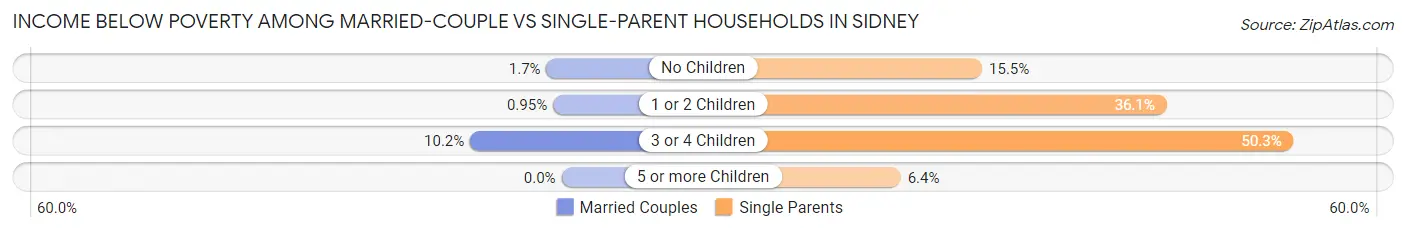
| Children | Married-Couple Families | Single-Parent Households |
| No Children | 40 (1.7%) | 69 (15.5%) |
| 1 or 2 Children | 8 (0.9%) | 290 (36.1%) |
| 3 or 4 Children | 43 (10.2%) | 92 (50.3%) |
| 5 or more Children | 0 (0.0%) | 3 (6.4%) |
| Total | 91 (2.5%) | 454 (30.7%) |
Race in Sidney
The most populous races in Sidney are White / Caucasian (17,796 | 87.5%), Two or more Races (1,179 | 5.8%), and Black / African American (926 | 4.5%).
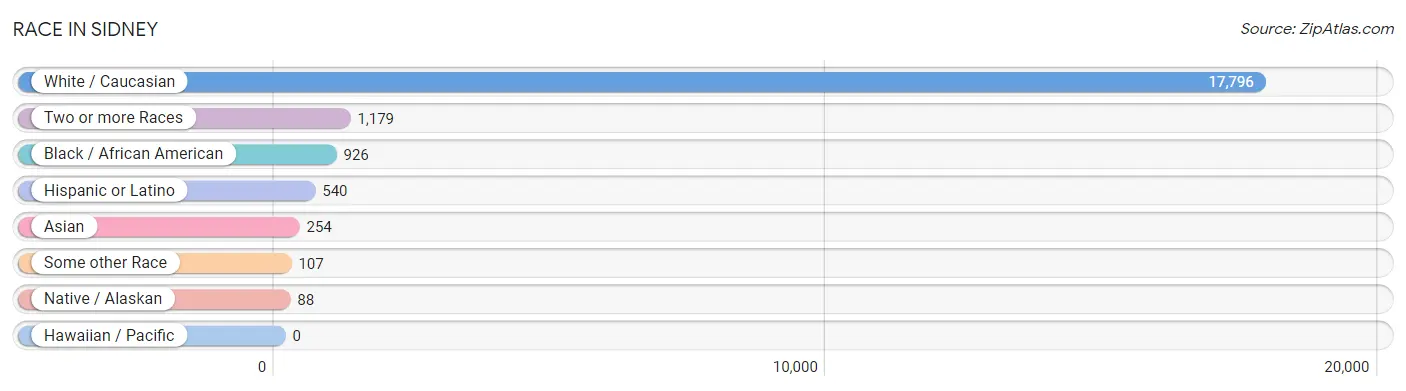
| Race | # Population | % Population |
| Asian | 254 | 1.3% |
| Black / African American | 926 | 4.5% |
| Hawaiian / Pacific | 0 | 0.0% |
| Hispanic or Latino | 540 | 2.6% |
| Native / Alaskan | 88 | 0.4% |
| White / Caucasian | 17,796 | 87.5% |
| Two or more Races | 1,179 | 5.8% |
| Some other Race | 107 | 0.5% |
| Total | 20,350 | 100.0% |
Ancestry in Sidney
The most populous ancestries reported in Sidney are German (5,373 | 26.4%), Irish (2,309 | 11.4%), English (1,342 | 6.6%), American (1,338 | 6.6%), and Italian (576 | 2.8%), together accounting for 53.7% of all Sidney residents.
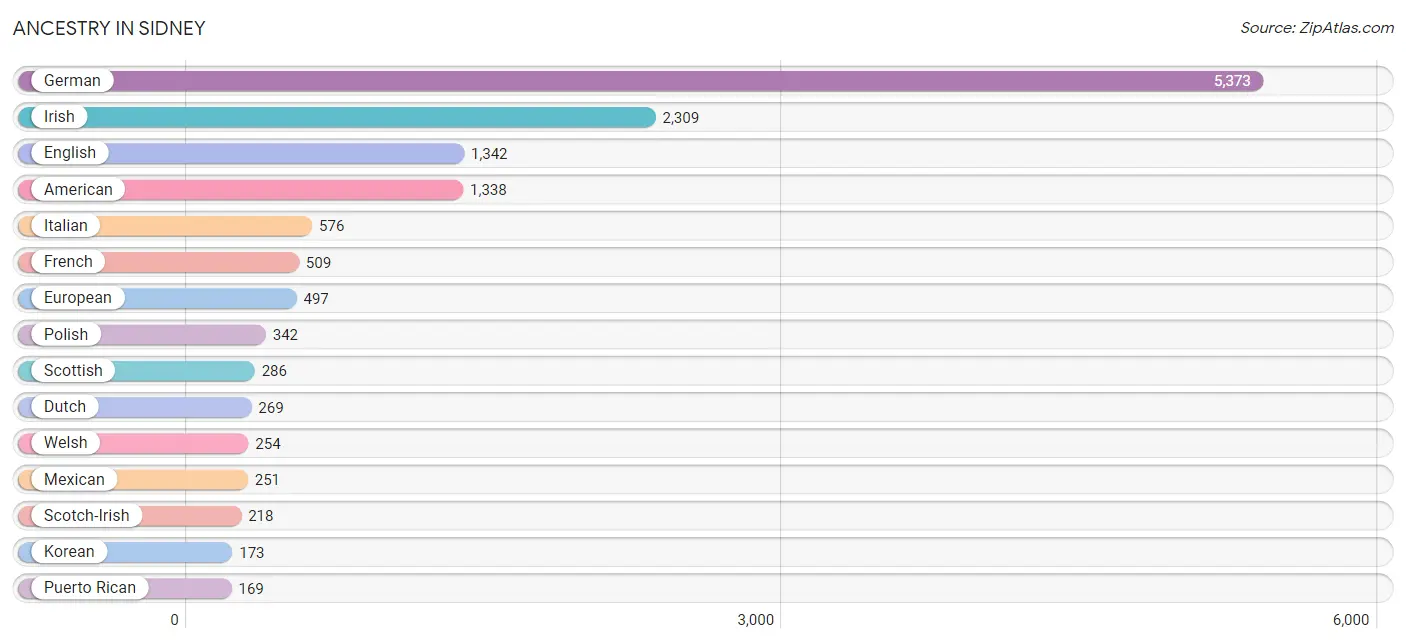
| Ancestry | # Population | % Population |
| American | 1,338 | 6.6% |
| Arab | 52 | 0.3% |
| Austrian | 31 | 0.2% |
| Bhutanese | 114 | 0.6% |
| Blackfeet | 10 | 0.1% |
| British | 17 | 0.1% |
| Burmese | 27 | 0.1% |
| Canadian | 19 | 0.1% |
| Central American | 9 | 0.0% |
| Cherokee | 108 | 0.5% |
| Colombian | 33 | 0.2% |
| Creek | 6 | 0.0% |
| Czech | 19 | 0.1% |
| Danish | 30 | 0.2% |
| Dutch | 269 | 1.3% |
| English | 1,342 | 6.6% |
| European | 497 | 2.4% |
| Finnish | 45 | 0.2% |
| French | 509 | 2.5% |
| French American Indian | 15 | 0.1% |
| French Canadian | 14 | 0.1% |
| German | 5,373 | 26.4% |
| Greek | 13 | 0.1% |
| Hungarian | 33 | 0.2% |
| Indian (Asian) | 68 | 0.3% |
| Irish | 2,309 | 11.4% |
| Italian | 576 | 2.8% |
| Jamaican | 23 | 0.1% |
| Korean | 173 | 0.9% |
| Lithuanian | 40 | 0.2% |
| Macedonian | 17 | 0.1% |
| Mexican | 251 | 1.2% |
| Mexican American Indian | 6 | 0.0% |
| Norwegian | 64 | 0.3% |
| Pakistani | 41 | 0.2% |
| Polish | 342 | 1.7% |
| Portuguese | 19 | 0.1% |
| Puerto Rican | 169 | 0.8% |
| Russian | 56 | 0.3% |
| Salvadoran | 9 | 0.0% |
| Scotch-Irish | 218 | 1.1% |
| Scottish | 286 | 1.4% |
| Slavic | 47 | 0.2% |
| Slovene | 13 | 0.1% |
| South American | 105 | 0.5% |
| Spaniard | 6 | 0.0% |
| Sri Lankan | 27 | 0.1% |
| Subsaharan African | 77 | 0.4% |
| Swedish | 137 | 0.7% |
| Thai | 141 | 0.7% |
| Turkish | 15 | 0.1% |
| Venezuelan | 72 | 0.4% |
| Welsh | 254 | 1.3% | View All 53 Rows |
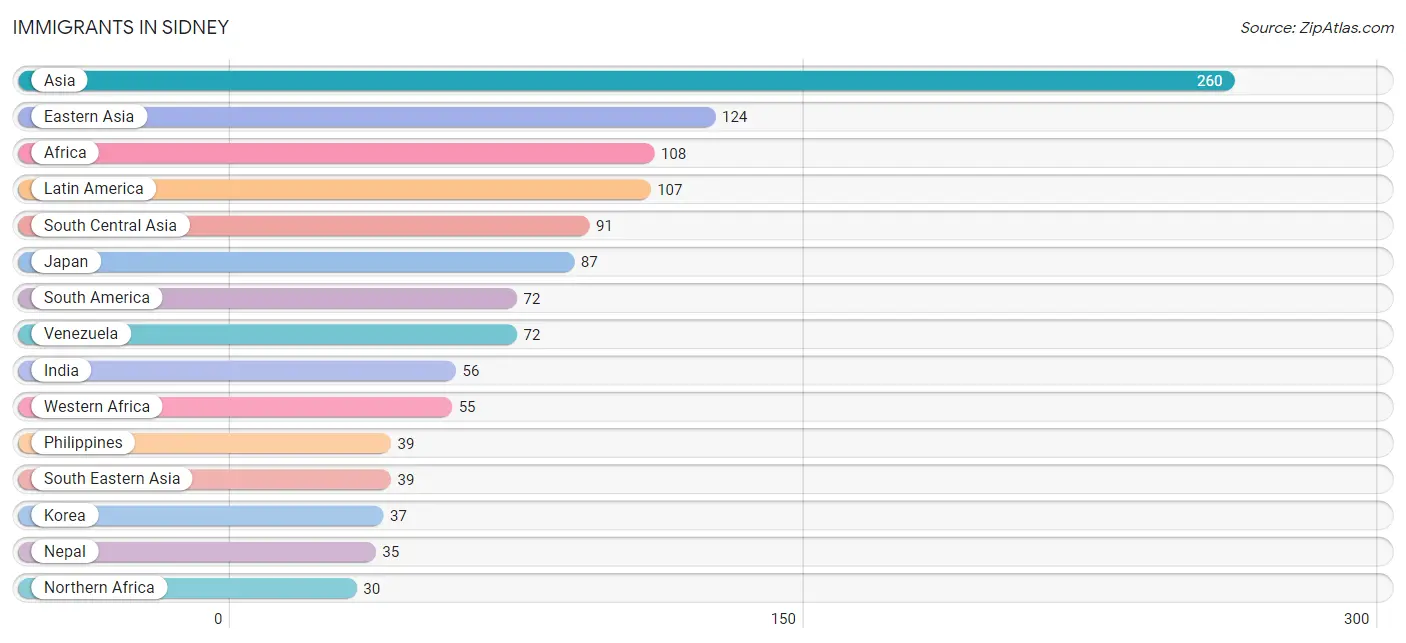
Immigrants in Sidney
The most numerous immigrant groups reported in Sidney came from Asia (260 | 1.3%), Eastern Asia (124 | 0.6%), Africa (108 | 0.5%), Latin America (107 | 0.5%), and South Central Asia (91 | 0.4%), together accounting for 3.4% of all Sidney residents.
| Immigration Origin | # Population | % Population |
| Africa | 108 | 0.5% |
| Asia | 260 | 1.3% |
| Caribbean | 8 | 0.0% |
| Central America | 27 | 0.1% |
| Congo | 23 | 0.1% |
| Eastern Asia | 124 | 0.6% |
| Eastern Europe | 6 | 0.0% |
| Europe | 18 | 0.1% |
| France | 12 | 0.1% |
| India | 56 | 0.3% |
| Jamaica | 8 | 0.0% |
| Japan | 87 | 0.4% |
| Jordan | 6 | 0.0% |
| Korea | 37 | 0.2% |
| Latin America | 107 | 0.5% |
| Mexico | 27 | 0.1% |
| Middle Africa | 23 | 0.1% |
| Nepal | 35 | 0.2% |
| Northern Africa | 30 | 0.2% |
| Philippines | 39 | 0.2% |
| South America | 72 | 0.4% |
| South Central Asia | 91 | 0.4% |
| South Eastern Asia | 39 | 0.2% |
| Venezuela | 72 | 0.4% |
| Western Africa | 55 | 0.3% |
| Western Asia | 6 | 0.0% |
| Western Europe | 12 | 0.1% | View All 27 Rows |
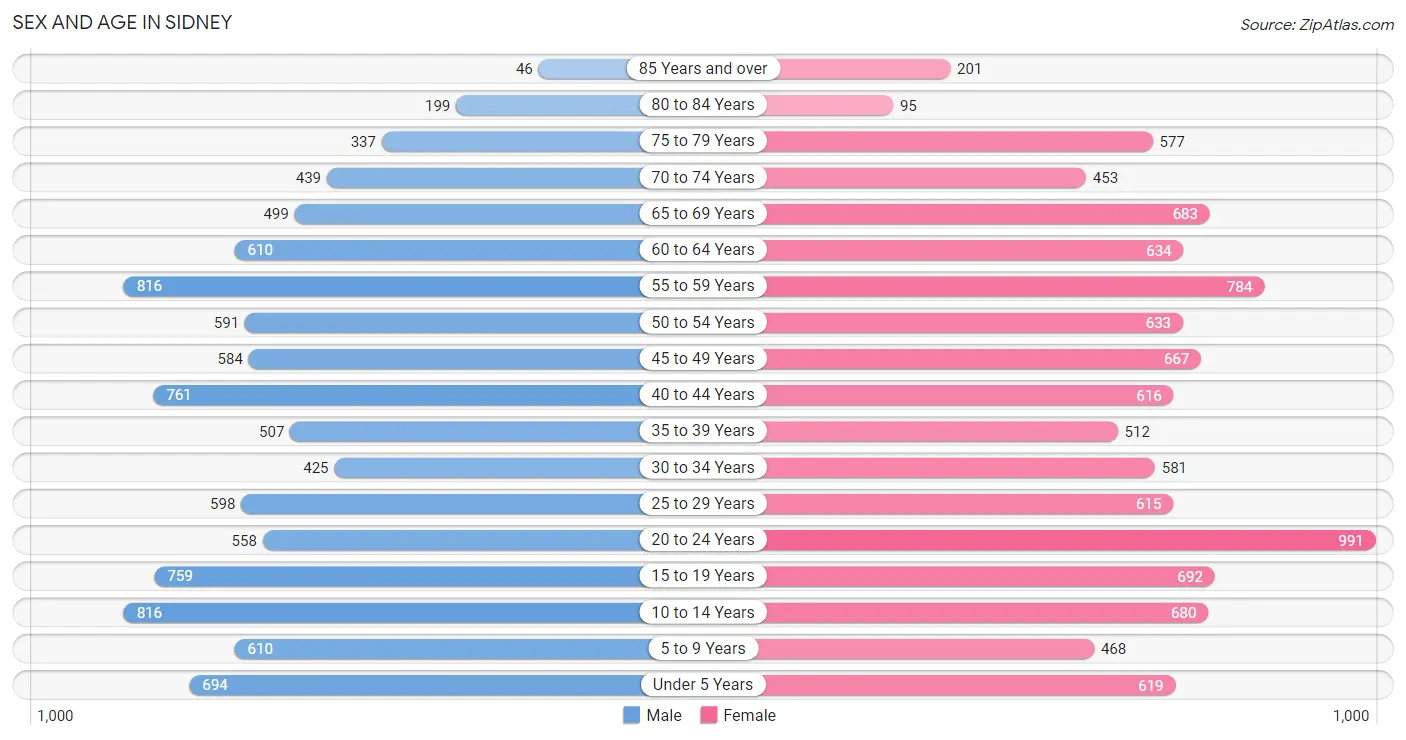
Sex and Age in Sidney
Sex and Age in Sidney
The most populous age groups in Sidney are 10 to 14 Years (816 | 8.3%) for men and 20 to 24 Years (991 | 9.4%) for women.
| Age Bracket | Male | Female |
| Under 5 Years | 694 (7.0%) | 619 (5.9%) |
| 5 to 9 Years | 610 (6.2%) | 468 (4.5%) |
| 10 to 14 Years | 816 (8.3%) | 680 (6.5%) |
| 15 to 19 Years | 759 (7.7%) | 692 (6.6%) |
| 20 to 24 Years | 558 (5.7%) | 991 (9.4%) |
| 25 to 29 Years | 598 (6.1%) | 615 (5.9%) |
| 30 to 34 Years | 425 (4.3%) | 581 (5.5%) |
| 35 to 39 Years | 507 (5.1%) | 512 (4.9%) |
| 40 to 44 Years | 761 (7.7%) | 616 (5.9%) |
| 45 to 49 Years | 584 (5.9%) | 667 (6.4%) |
| 50 to 54 Years | 591 (6.0%) | 633 (6.0%) |
| 55 to 59 Years | 816 (8.3%) | 784 (7.5%) |
| 60 to 64 Years | 610 (6.2%) | 634 (6.0%) |
| 65 to 69 Years | 499 (5.1%) | 683 (6.5%) |
| 70 to 74 Years | 439 (4.5%) | 453 (4.3%) |
| 75 to 79 Years | 337 (3.4%) | 577 (5.5%) |
| 80 to 84 Years | 199 (2.0%) | 95 (0.9%) |
| 85 Years and over | 46 (0.5%) | 201 (1.9%) |
| Total | 9,849 (100.0%) | 10,501 (100.0%) |
Families and Households in Sidney
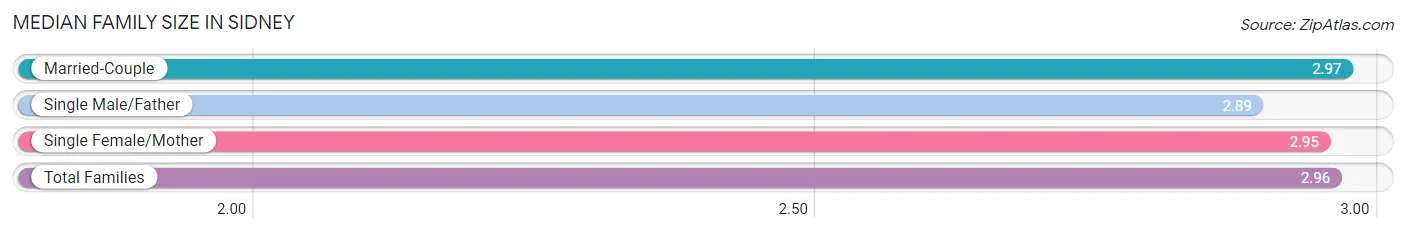
Median Family Size in Sidney
The median family size in Sidney is 2.96 persons per family, with married-couple families (3,683 | 71.4%) accounting for the largest median family size of 2.97 persons per family. On the other hand, single male/father families (362 | 7.0%) represent the smallest median family size with 2.89 persons per family.
| Family Type | # Families | Family Size |
| Married-Couple | 3,683 (71.4%) | 2.97 |
| Single Male/Father | 362 (7.0%) | 2.89 |
| Single Female/Mother | 1,117 (21.6%) | 2.95 |
| Total Families | 5,162 (100.0%) | 2.96 |
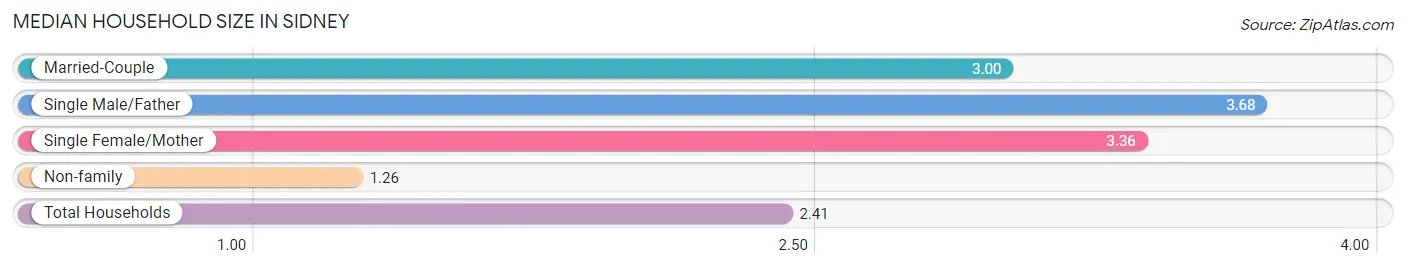
Median Household Size in Sidney
The median household size in Sidney is 2.41 persons per household, with single male/father households (362 | 4.3%) accounting for the largest median household size of 3.68 persons per household. non-family households (3,181 | 38.1%) represent the smallest median household size with 1.26 persons per household.
| Household Type | # Households | Household Size |
| Married-Couple | 3,683 (44.1%) | 3.00 |
| Single Male/Father | 362 (4.3%) | 3.68 |
| Single Female/Mother | 1,117 (13.4%) | 3.36 |
| Non-family | 3,181 (38.1%) | 1.26 |
| Total Households | 8,343 (100.0%) | 2.41 |
Household Size by Marriage Status in Sidney
Out of a total of 8,343 households in Sidney, 5,162 (61.9%) are family households, while 3,181 (38.1%) are nonfamily households. The most numerous type of family households are 2-person households, comprising 2,354, and the most common type of nonfamily households are 1-person households, comprising 2,538.
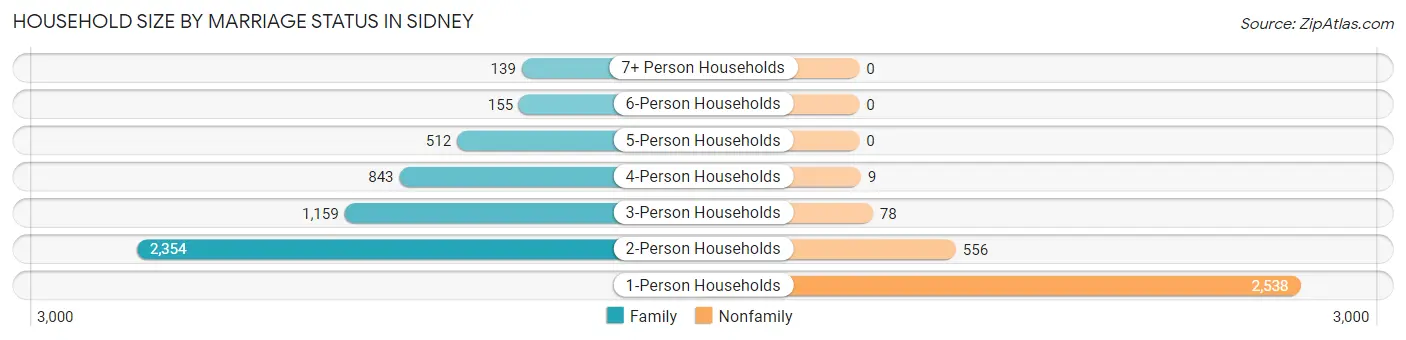
| Household Size | Family Households | Nonfamily Households |
| 1-Person Households | - | 2,538 (30.4%) |
| 2-Person Households | 2,354 (28.2%) | 556 (6.7%) |
| 3-Person Households | 1,159 (13.9%) | 78 (0.9%) |
| 4-Person Households | 843 (10.1%) | 9 (0.1%) |
| 5-Person Households | 512 (6.1%) | 0 (0.0%) |
| 6-Person Households | 155 (1.9%) | 0 (0.0%) |
| 7+ Person Households | 139 (1.7%) | 0 (0.0%) |
| Total | 5,162 (61.9%) | 3,181 (38.1%) |
Female Fertility in Sidney
Fertility by Age in Sidney
Average fertility rate in Sidney is 103.0 births per 1,000 women. Women in the age bracket of 20 to 34 years have the highest fertility rate with 214.0 births per 1,000 women. Women in the age bracket of 20 to 34 years acount for 95.1% of all women with births.
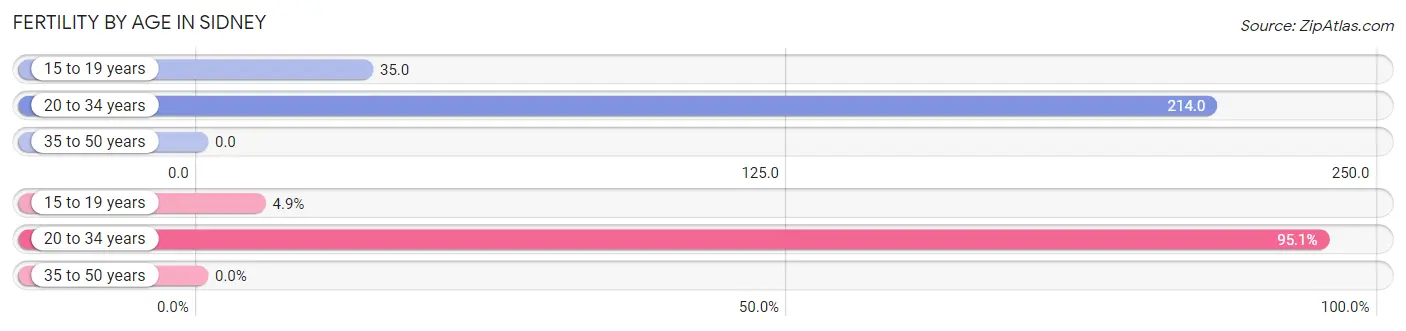
| Age Bracket | Women with Births | Births / 1,000 Women |
| 15 to 19 years | 24 (4.9%) | 35.0 |
| 20 to 34 years | 468 (95.1%) | 214.0 |
| 35 to 50 years | 0 (0.0%) | 0.0 |
| Total | 492 (100.0%) | 103.0 |
Fertility by Age by Marriage Status in Sidney
32.1% of women with births (492) in Sidney are married. The highest percentage of unmarried women with births falls into 15 to 19 years age bracket with 100.0% of them unmarried at the time of birth, while the lowest percentage of unmarried women with births belong to 20 to 34 years age bracket with 66.2% of them unmarried.
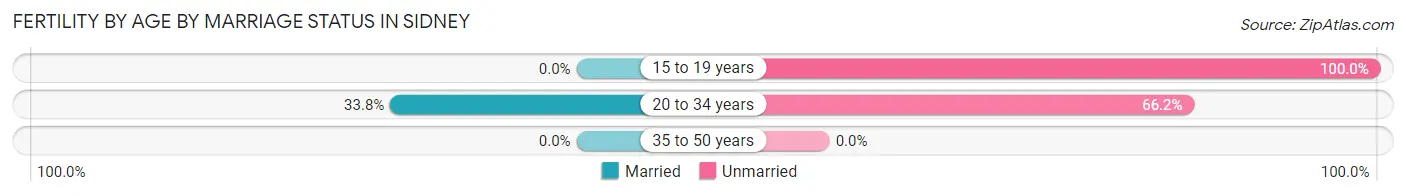
| Age Bracket | Married | Unmarried |
| 15 to 19 years | 0 (0.0%) | 24 (100.0%) |
| 20 to 34 years | 158 (33.8%) | 310 (66.2%) |
| 35 to 50 years | 0 (0.0%) | 0 (0.0%) |
| Total | 158 (32.1%) | 334 (67.9%) |
Fertility by Education in Sidney
Average fertility rate in Sidney is 103.0 births per 1,000 women. Women with the education attainment of less than high school have the highest fertility rate of 162.0 births per 1,000 women, while women with the education attainment of college or associate's degree have the lowest fertility at 65.0 births per 1,000 women. Women with the education attainment of high school diploma represent 36.2% of all women with births.
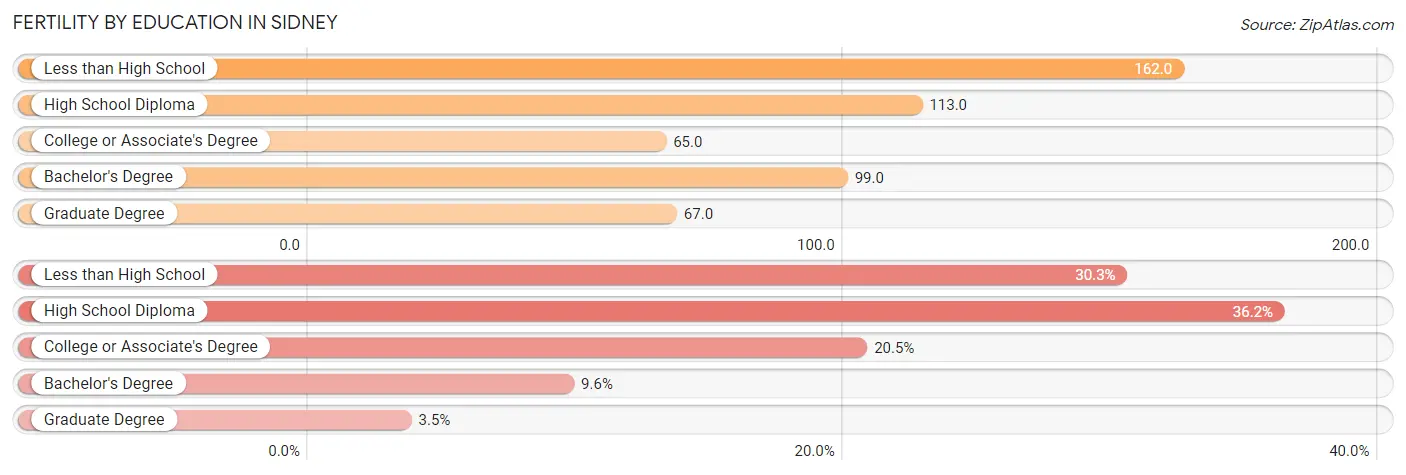
| Educational Attainment | Women with Births | Births / 1,000 Women |
| Less than High School | 149 (30.3%) | 162.0 |
| High School Diploma | 178 (36.2%) | 113.0 |
| College or Associate's Degree | 101 (20.5%) | 65.0 |
| Bachelor's Degree | 47 (9.6%) | 99.0 |
| Graduate Degree | 17 (3.5%) | 67.0 |
| Total | 492 (100.0%) | 103.0 |
Fertility by Education by Marriage Status in Sidney
67.9% of women with births in Sidney are unmarried. Women with the educational attainment of graduate degree are most likely to be married with 100.0% of them married at childbirth, while women with the educational attainment of less than high school are least likely to be married with 100.0% of them unmarried at childbirth.
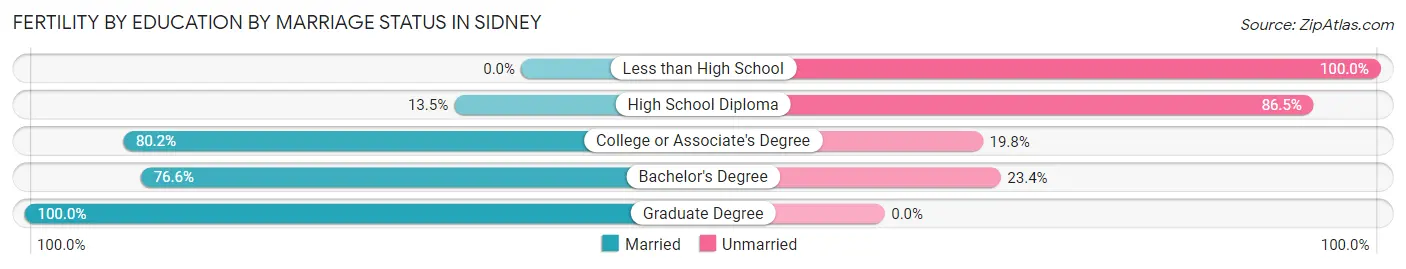
| Educational Attainment | Married | Unmarried |
| Less than High School | 0 (0.0%) | 149 (100.0%) |
| High School Diploma | 24 (13.5%) | 154 (86.5%) |
| College or Associate's Degree | 81 (80.2%) | 20 (19.8%) |
| Bachelor's Degree | 36 (76.6%) | 11 (23.4%) |
| Graduate Degree | 17 (100.0%) | 0 (0.0%) |
| Total | 158 (32.1%) | 334 (67.9%) |
Employment Characteristics in Sidney
Employment by Class of Employer in Sidney
Among the 9,637 employed individuals in Sidney, private company employees (7,672 | 79.6%), not-for-profit organizations (638 | 6.6%), and local government employees (593 | 6.1%) make up the most common classes of employment.
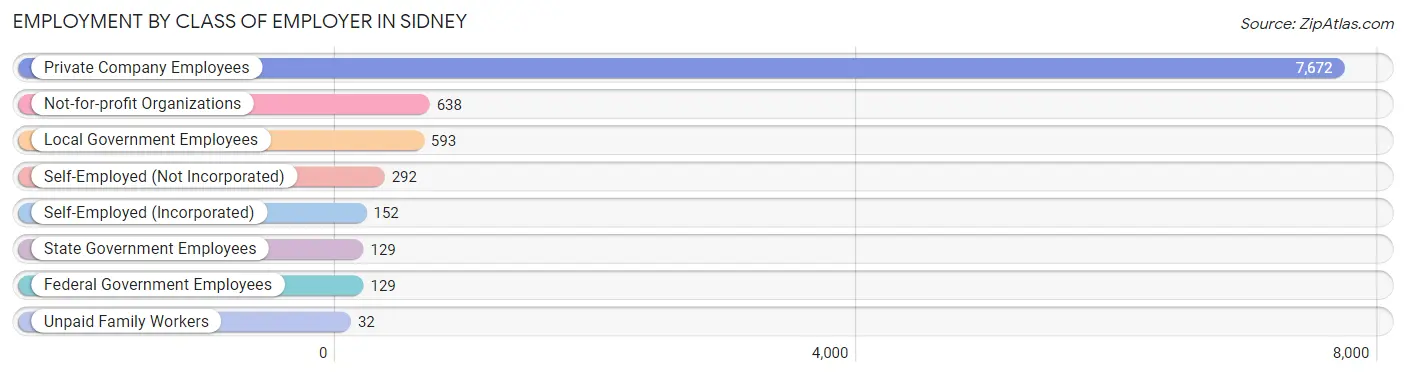
| Employer Class | # Employees | % Employees |
| Private Company Employees | 7,672 | 79.6% |
| Self-Employed (Incorporated) | 152 | 1.6% |
| Self-Employed (Not Incorporated) | 292 | 3.0% |
| Not-for-profit Organizations | 638 | 6.6% |
| Local Government Employees | 593 | 6.1% |
| State Government Employees | 129 | 1.3% |
| Federal Government Employees | 129 | 1.3% |
| Unpaid Family Workers | 32 | 0.3% |
| Total | 9,637 | 100.0% |
Employment Status by Age in Sidney
According to the labor force statistics for Sidney, out of the total population over 16 years of age (16,175), 65.9% or 10,659 individuals are in the labor force, with 6.6% or 703 of them unemployed. The age group with the highest labor force participation rate is 20 to 24 years, with 90.2% or 1,397 individuals in the labor force. Within the labor force, the 16 to 19 years age range has the highest percentage of unemployed individuals, with 23.1% or 165 of them being unemployed.
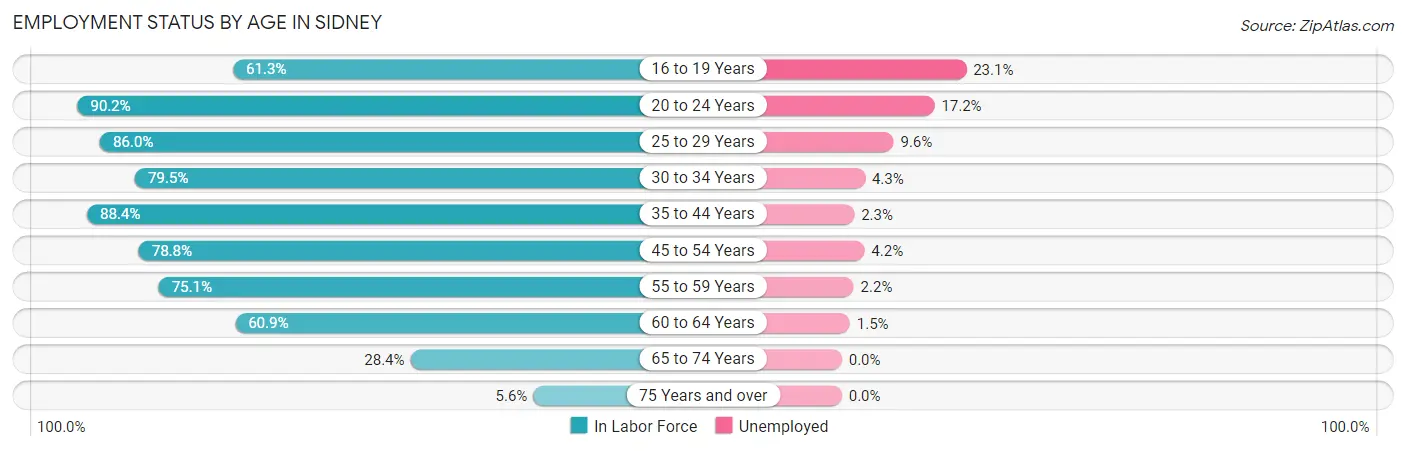
| Age Bracket | In Labor Force | Unemployed |
| 16 to 19 Years | 713 (61.3%) | 165 (23.1%) |
| 20 to 24 Years | 1,397 (90.2%) | 240 (17.2%) |
| 25 to 29 Years | 1,043 (86.0%) | 100 (9.6%) |
| 30 to 34 Years | 800 (79.5%) | 34 (4.3%) |
| 35 to 44 Years | 2,118 (88.4%) | 49 (2.3%) |
| 45 to 54 Years | 1,950 (78.8%) | 82 (4.2%) |
| 55 to 59 Years | 1,202 (75.1%) | 26 (2.2%) |
| 60 to 64 Years | 758 (60.9%) | 11 (1.5%) |
| 65 to 74 Years | 589 (28.4%) | 0 (0.0%) |
| 75 Years and over | 81 (5.6%) | 0 (0.0%) |
| Total | 10,659 (65.9%) | 703 (6.6%) |
Employment Status by Educational Attainment in Sidney
According to labor force statistics for Sidney, 79.2% of individuals (7,868) out of the total population between 25 and 64 years of age (9,934) are in the labor force, with 3.8% or 299 of them being unemployed. The group with the highest labor force participation rate are those with the educational attainment of bachelor's degree or higher, with 85.4% or 1,519 individuals in the labor force. Within the labor force, individuals with less than high school education have the highest percentage of unemployment, with 8.7% or 62 of them being unemployed.
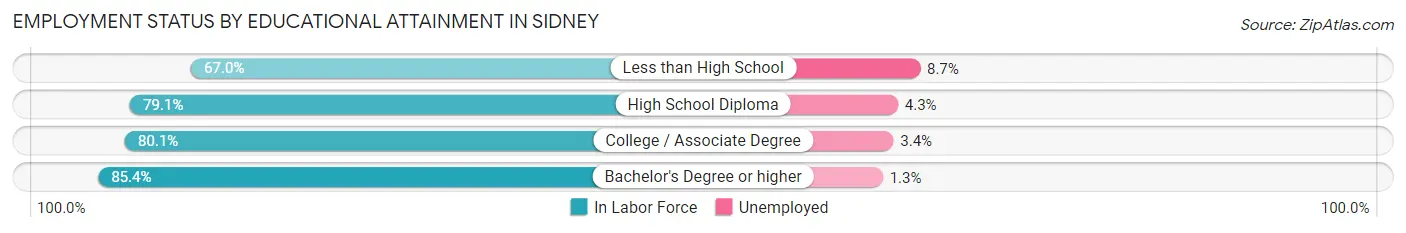
| Educational Attainment | In Labor Force | Unemployed |
| Less than High School | 712 (67.0%) | 92 (8.7%) |
| High School Diploma | 3,147 (79.1%) | 171 (4.3%) |
| College / Associate Degree | 2,494 (80.1%) | 106 (3.4%) |
| Bachelor's Degree or higher | 1,519 (85.4%) | 23 (1.3%) |
| Total | 7,868 (79.2%) | 377 (3.8%) |
Employment Occupations by Sex in Sidney
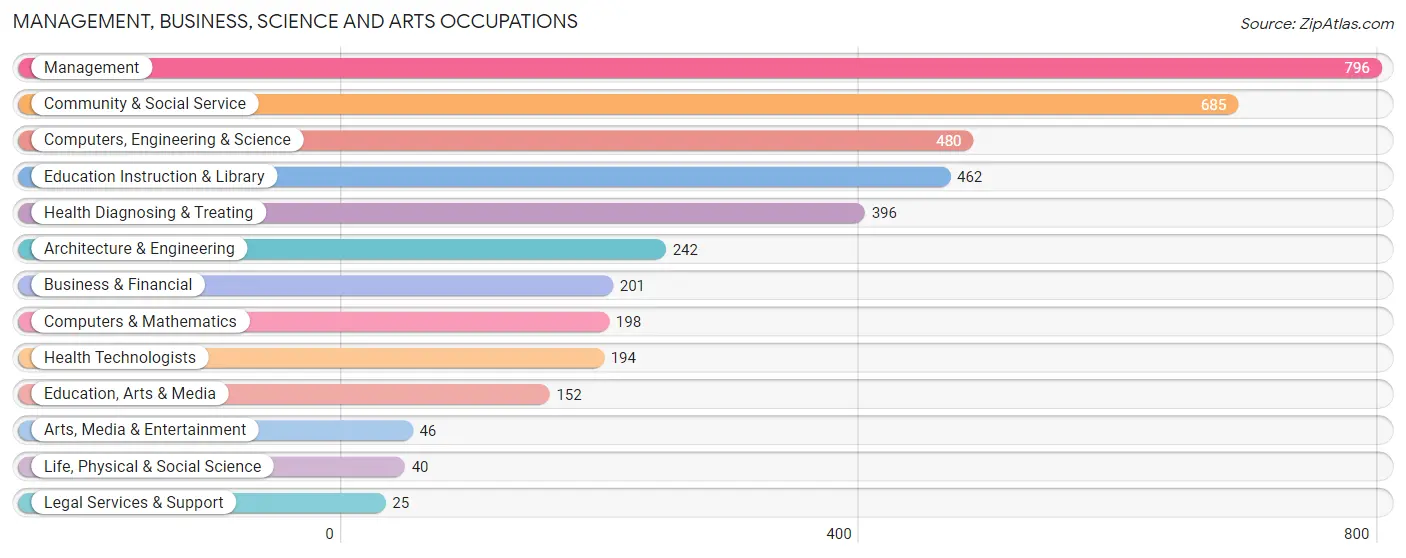
Management, Business, Science and Arts Occupations
The most common Management, Business, Science and Arts occupations in Sidney are Management (796 | 8.0%), Community & Social Service (685 | 6.9%), Computers, Engineering & Science (480 | 4.8%), Education Instruction & Library (462 | 4.6%), and Health Diagnosing & Treating (396 | 4.0%).
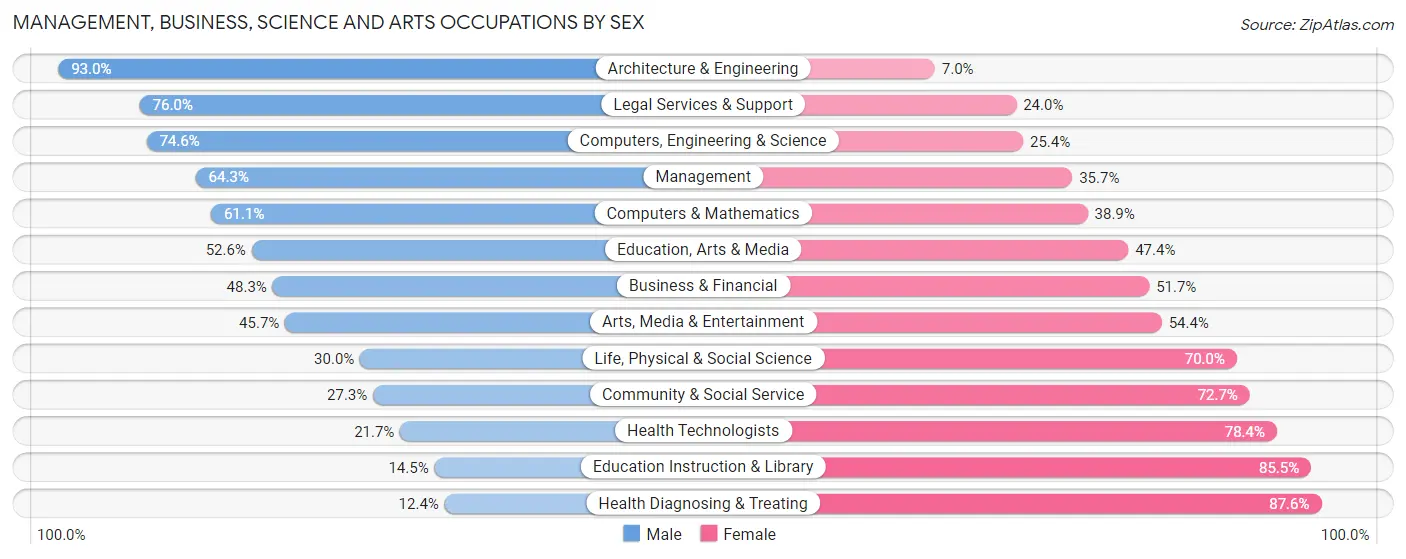
Management, Business, Science and Arts Occupations by Sex
Within the Management, Business, Science and Arts occupations in Sidney, the most male-oriented occupations are Architecture & Engineering (93.0%), Legal Services & Support (76.0%), and Computers, Engineering & Science (74.6%), while the most female-oriented occupations are Health Diagnosing & Treating (87.6%), Education Instruction & Library (85.5%), and Health Technologists (78.3%).
| Occupation | Male | Female |
| Management | 512 (64.3%) | 284 (35.7%) |
| Business & Financial | 97 (48.3%) | 104 (51.7%) |
| Computers, Engineering & Science | 358 (74.6%) | 122 (25.4%) |
| Computers & Mathematics | 121 (61.1%) | 77 (38.9%) |
| Architecture & Engineering | 225 (93.0%) | 17 (7.0%) |
| Life, Physical & Social Science | 12 (30.0%) | 28 (70.0%) |
| Community & Social Service | 187 (27.3%) | 498 (72.7%) |
| Education, Arts & Media | 80 (52.6%) | 72 (47.4%) |
| Legal Services & Support | 19 (76.0%) | 6 (24.0%) |
| Education Instruction & Library | 67 (14.5%) | 395 (85.5%) |
| Arts, Media & Entertainment | 21 (45.7%) | 25 (54.3%) |
| Health Diagnosing & Treating | 49 (12.4%) | 347 (87.6%) |
| Health Technologists | 42 (21.6%) | 152 (78.3%) |
| Total (Category) | 1,203 (47.0%) | 1,355 (53.0%) |
| Total (Overall) | 4,963 (49.9%) | 4,983 (50.1%) |
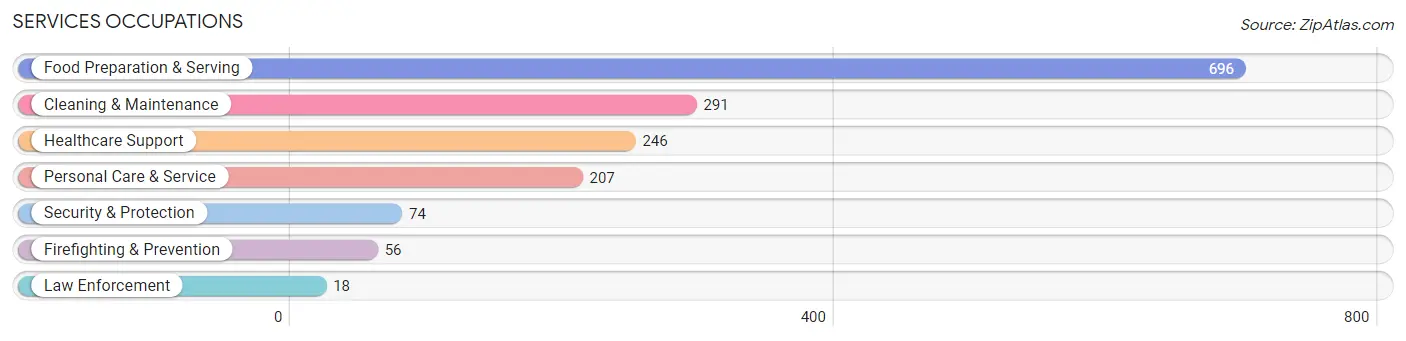
Services Occupations
The most common Services occupations in Sidney are Food Preparation & Serving (696 | 7.0%), Cleaning & Maintenance (291 | 2.9%), Healthcare Support (246 | 2.5%), Personal Care & Service (207 | 2.1%), and Security & Protection (74 | 0.7%).
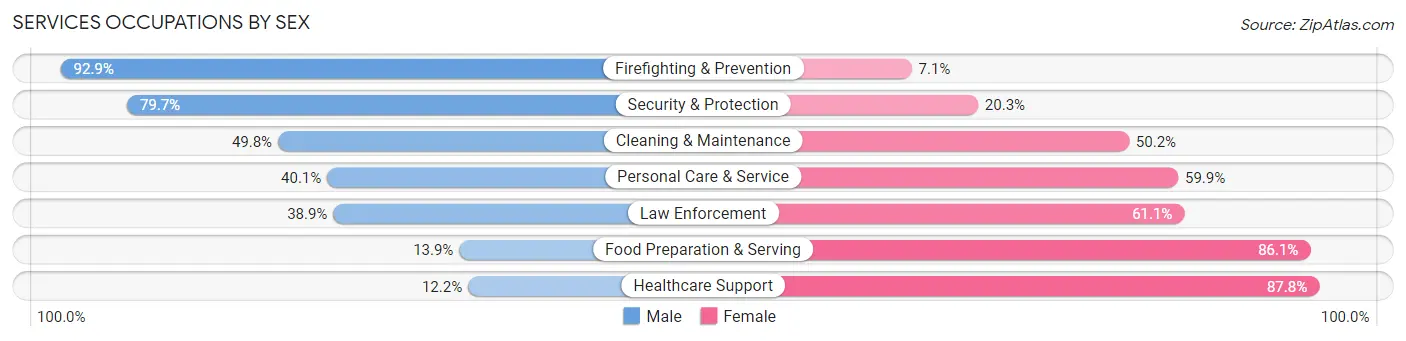
Services Occupations by Sex
Within the Services occupations in Sidney, the most male-oriented occupations are Firefighting & Prevention (92.9%), Security & Protection (79.7%), and Cleaning & Maintenance (49.8%), while the most female-oriented occupations are Healthcare Support (87.8%), Food Preparation & Serving (86.1%), and Law Enforcement (61.1%).
| Occupation | Male | Female |
| Healthcare Support | 30 (12.2%) | 216 (87.8%) |
| Security & Protection | 59 (79.7%) | 15 (20.3%) |
| Firefighting & Prevention | 52 (92.9%) | 4 (7.1%) |
| Law Enforcement | 7 (38.9%) | 11 (61.1%) |
| Food Preparation & Serving | 97 (13.9%) | 599 (86.1%) |
| Cleaning & Maintenance | 145 (49.8%) | 146 (50.2%) |
| Personal Care & Service | 83 (40.1%) | 124 (59.9%) |
| Total (Category) | 414 (27.3%) | 1,100 (72.7%) |
| Total (Overall) | 4,963 (49.9%) | 4,983 (50.1%) |
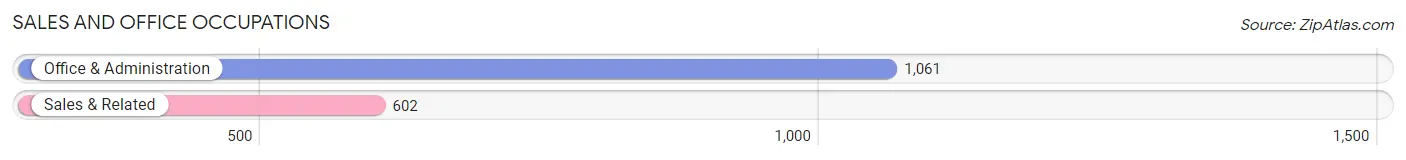
Sales and Office Occupations
The most common Sales and Office occupations in Sidney are Office & Administration (1,061 | 10.7%), and Sales & Related (602 | 6.0%).
Sales and Office Occupations by Sex
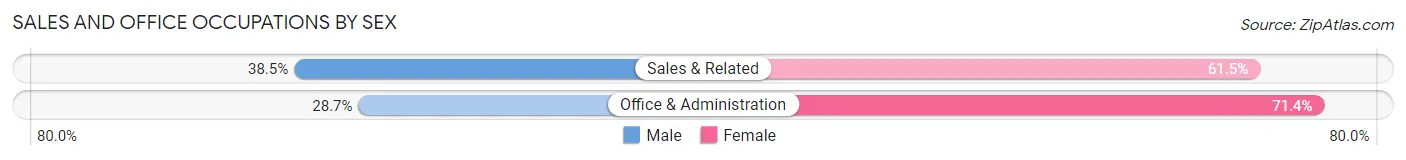
| Occupation | Male | Female |
| Sales & Related | 232 (38.5%) | 370 (61.5%) |
| Office & Administration | 304 (28.6%) | 757 (71.4%) |
| Total (Category) | 536 (32.2%) | 1,127 (67.8%) |
| Total (Overall) | 4,963 (49.9%) | 4,983 (50.1%) |
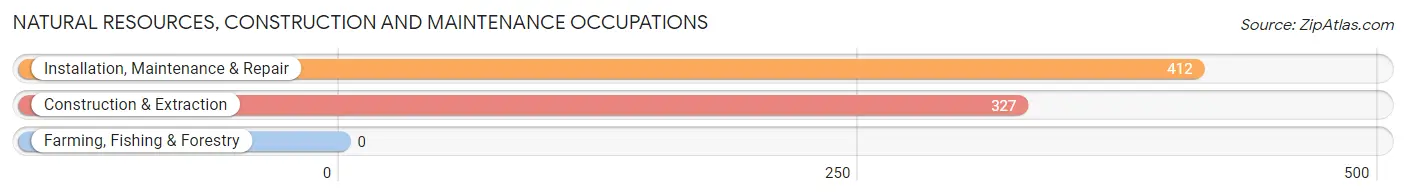
Natural Resources, Construction and Maintenance Occupations
The most common Natural Resources, Construction and Maintenance occupations in Sidney are Installation, Maintenance & Repair (412 | 4.1%), and Construction & Extraction (327 | 3.3%).
Natural Resources, Construction and Maintenance Occupations by Sex
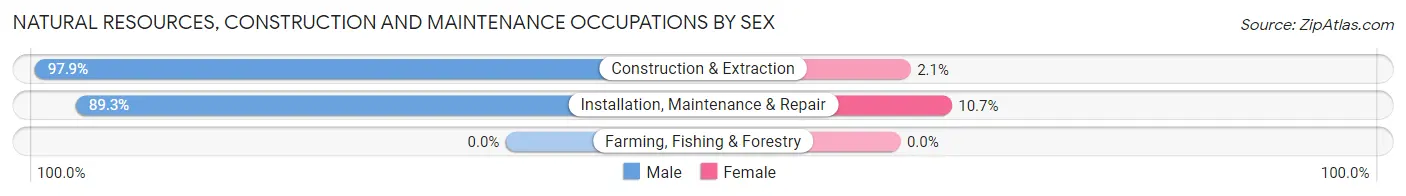
| Occupation | Male | Female |
| Farming, Fishing & Forestry | 0 (0.0%) | 0 (0.0%) |
| Construction & Extraction | 320 (97.9%) | 7 (2.1%) |
| Installation, Maintenance & Repair | 368 (89.3%) | 44 (10.7%) |
| Total (Category) | 688 (93.1%) | 51 (6.9%) |
| Total (Overall) | 4,963 (49.9%) | 4,983 (50.1%) |
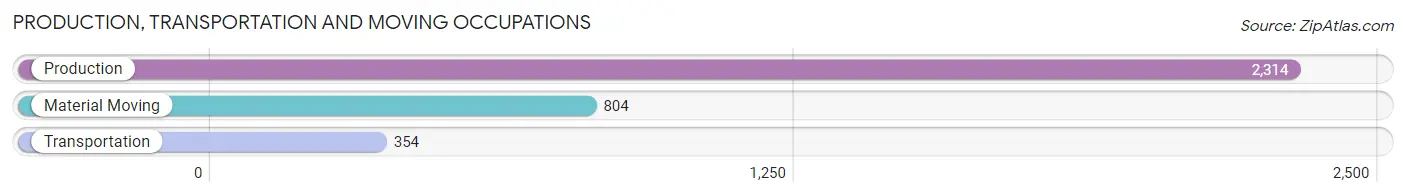
Production, Transportation and Moving Occupations
The most common Production, Transportation and Moving occupations in Sidney are Production (2,314 | 23.3%), Material Moving (804 | 8.1%), and Transportation (354 | 3.6%).
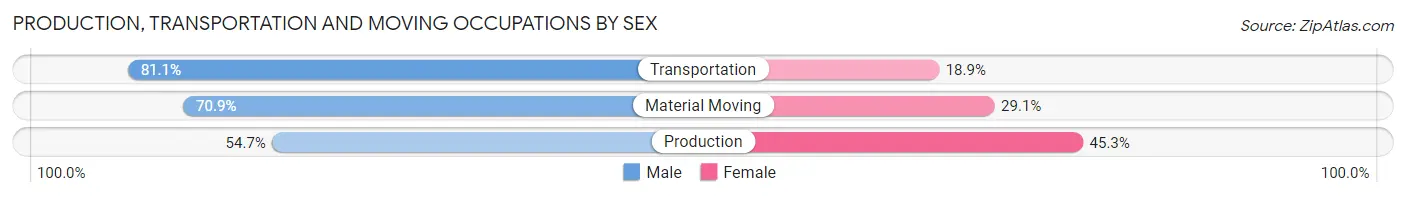
Production, Transportation and Moving Occupations by Sex
| Occupation | Male | Female |
| Production | 1,265 (54.7%) | 1,049 (45.3%) |
| Transportation | 287 (81.1%) | 67 (18.9%) |
| Material Moving | 570 (70.9%) | 234 (29.1%) |
| Total (Category) | 2,122 (61.1%) | 1,350 (38.9%) |
| Total (Overall) | 4,963 (49.9%) | 4,983 (50.1%) |
Employment Industries by Sex in Sidney
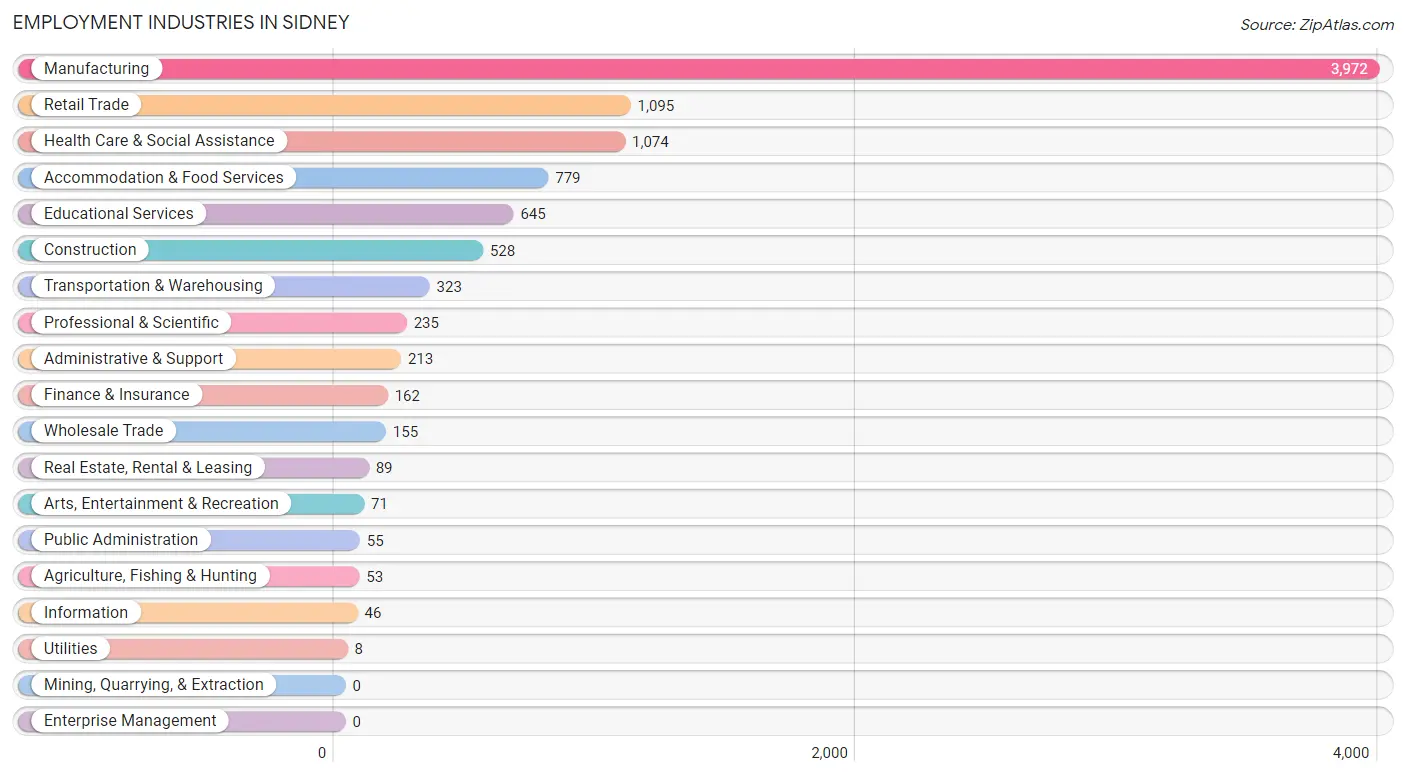
Employment Industries in Sidney
The major employment industries in Sidney include Manufacturing (3,972 | 39.9%), Retail Trade (1,095 | 11.0%), Health Care & Social Assistance (1,074 | 10.8%), Accommodation & Food Services (779 | 7.8%), and Educational Services (645 | 6.5%).
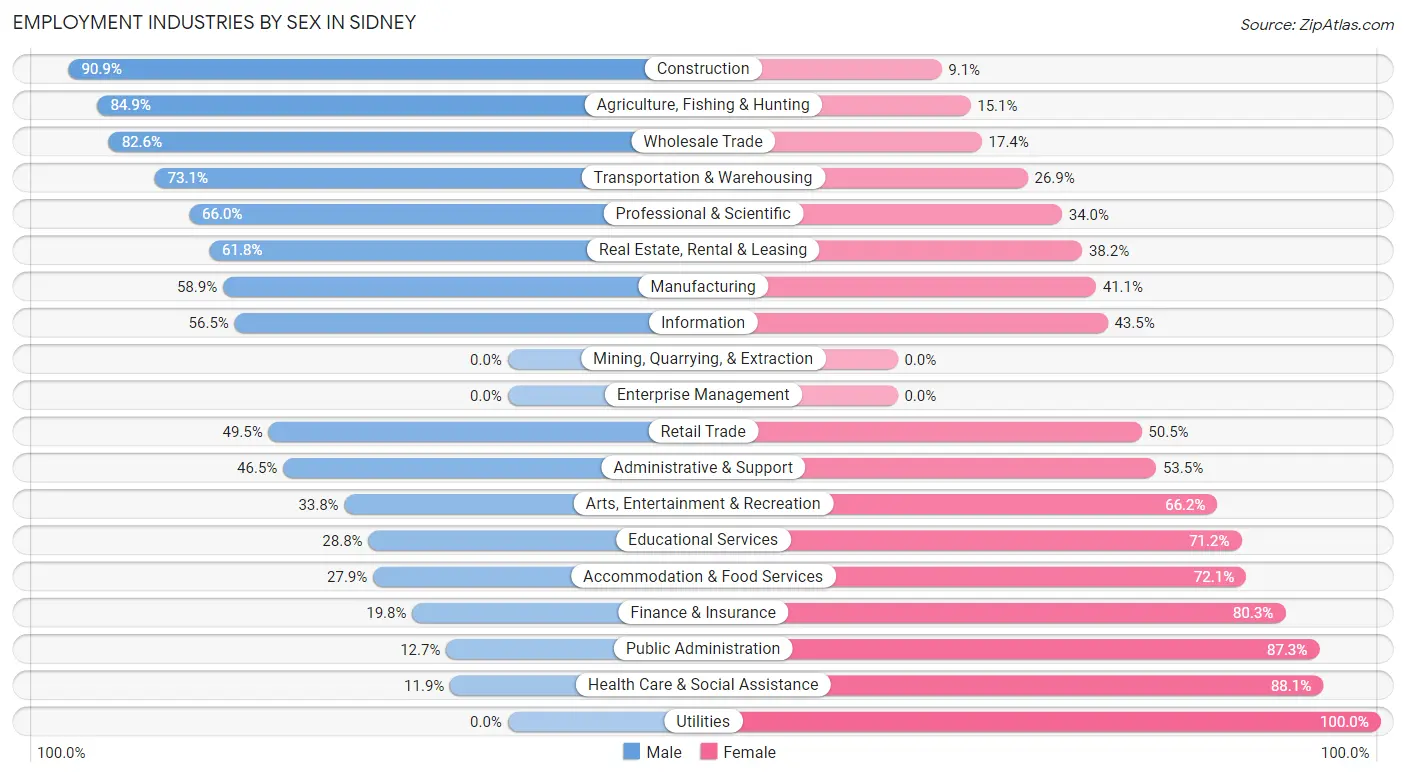
Employment Industries by Sex in Sidney
The Sidney industries that see more men than women are Construction (90.9%), Agriculture, Fishing & Hunting (84.9%), and Wholesale Trade (82.6%), whereas the industries that tend to have a higher number of women are Utilities (100.0%), Health Care & Social Assistance (88.1%), and Public Administration (87.3%).
| Industry | Male | Female |
| Agriculture, Fishing & Hunting | 45 (84.9%) | 8 (15.1%) |
| Mining, Quarrying, & Extraction | 0 (0.0%) | 0 (0.0%) |
| Construction | 480 (90.9%) | 48 (9.1%) |
| Manufacturing | 2,341 (58.9%) | 1,631 (41.1%) |
| Wholesale Trade | 128 (82.6%) | 27 (17.4%) |
| Retail Trade | 542 (49.5%) | 553 (50.5%) |
| Transportation & Warehousing | 236 (73.1%) | 87 (26.9%) |
| Utilities | 0 (0.0%) | 8 (100.0%) |
| Information | 26 (56.5%) | 20 (43.5%) |
| Finance & Insurance | 32 (19.8%) | 130 (80.2%) |
| Real Estate, Rental & Leasing | 55 (61.8%) | 34 (38.2%) |
| Professional & Scientific | 155 (66.0%) | 80 (34.0%) |
| Enterprise Management | 0 (0.0%) | 0 (0.0%) |
| Administrative & Support | 99 (46.5%) | 114 (53.5%) |
| Educational Services | 186 (28.8%) | 459 (71.2%) |
| Health Care & Social Assistance | 128 (11.9%) | 946 (88.1%) |
| Arts, Entertainment & Recreation | 24 (33.8%) | 47 (66.2%) |
| Accommodation & Food Services | 217 (27.9%) | 562 (72.1%) |
| Public Administration | 7 (12.7%) | 48 (87.3%) |
| Total | 4,963 (49.9%) | 4,983 (50.1%) |
Education in Sidney
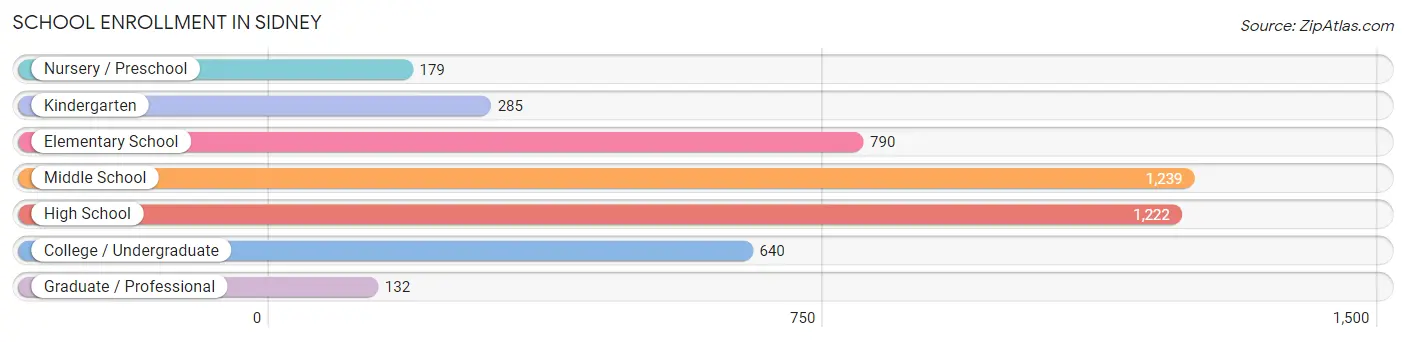
School Enrollment in Sidney
The most common levels of schooling among the 4,487 students in Sidney are middle school (1,239 | 27.6%), high school (1,222 | 27.2%), and elementary school (790 | 17.6%).
| School Level | # Students | % Students |
| Nursery / Preschool | 179 | 4.0% |
| Kindergarten | 285 | 6.4% |
| Elementary School | 790 | 17.6% |
| Middle School | 1,239 | 27.6% |
| High School | 1,222 | 27.2% |
| College / Undergraduate | 640 | 14.3% |
| Graduate / Professional | 132 | 2.9% |
| Total | 4,487 | 100.0% |
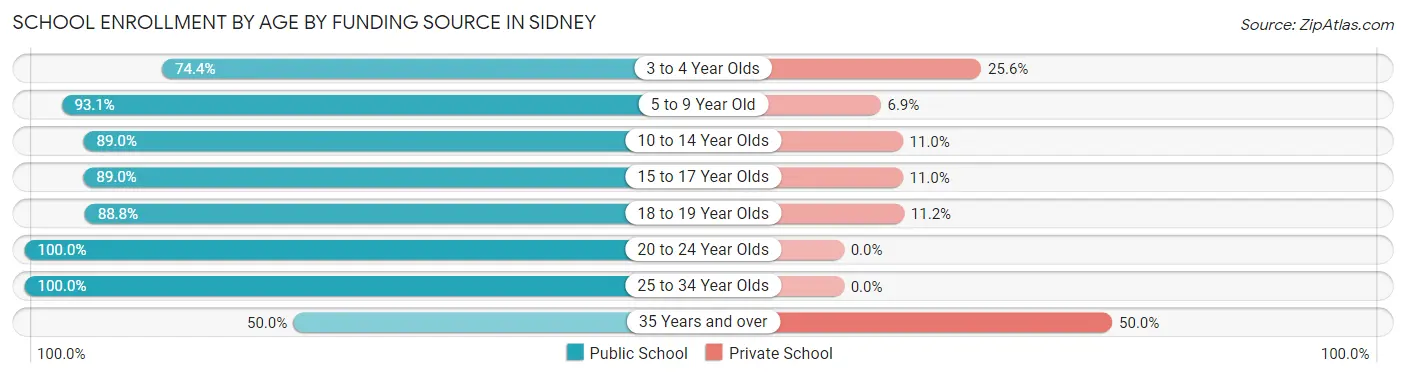
School Enrollment by Age by Funding Source in Sidney
Out of a total of 4,487 students who are enrolled in schools in Sidney, 507 (11.3%) attend a private institution, while the remaining 3,980 (88.7%) are enrolled in public schools. The age group of 35 years and over has the highest likelihood of being enrolled in private schools, with 119 (50.0% in the age bracket) enrolled. Conversely, the age group of 20 to 24 year olds has the lowest likelihood of being enrolled in a private school, with 206 (100.0% in the age bracket) attending a public institution.
| Age Bracket | Public School | Private School |
| 3 to 4 Year Olds | 61 (74.4%) | 21 (25.6%) |
| 5 to 9 Year Old | 908 (93.1%) | 67 (6.9%) |
| 10 to 14 Year Olds | 1,321 (89.0%) | 163 (11.0%) |
| 15 to 17 Year Olds | 772 (89.0%) | 95 (11.0%) |
| 18 to 19 Year Olds | 348 (88.8%) | 44 (11.2%) |
| 20 to 24 Year Olds | 206 (100.0%) | 0 (0.0%) |
| 25 to 34 Year Olds | 243 (100.0%) | 0 (0.0%) |
| 35 Years and over | 119 (50.0%) | 119 (50.0%) |
| Total | 3,980 (88.7%) | 507 (11.3%) |
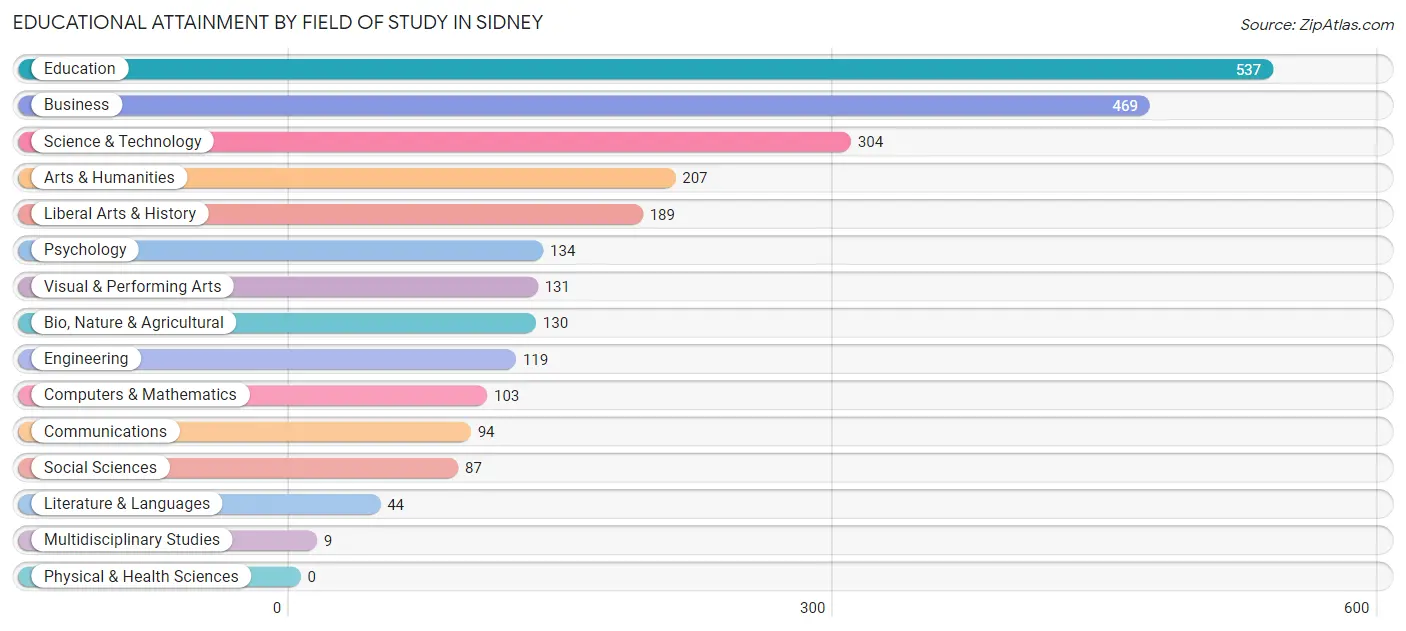
Educational Attainment by Field of Study in Sidney
Education (537 | 21.0%), business (469 | 18.3%), science & technology (304 | 11.9%), arts & humanities (207 | 8.1%), and liberal arts & history (189 | 7.4%) are the most common fields of study among 2,557 individuals in Sidney who have obtained a bachelor's degree or higher.
| Field of Study | # Graduates | % Graduates |
| Computers & Mathematics | 103 | 4.0% |
| Bio, Nature & Agricultural | 130 | 5.1% |
| Physical & Health Sciences | 0 | 0.0% |
| Psychology | 134 | 5.2% |
| Social Sciences | 87 | 3.4% |
| Engineering | 119 | 4.6% |
| Multidisciplinary Studies | 9 | 0.4% |
| Science & Technology | 304 | 11.9% |
| Business | 469 | 18.3% |
| Education | 537 | 21.0% |
| Literature & Languages | 44 | 1.7% |
| Liberal Arts & History | 189 | 7.4% |
| Visual & Performing Arts | 131 | 5.1% |
| Communications | 94 | 3.7% |
| Arts & Humanities | 207 | 8.1% |
| Total | 2,557 | 100.0% |
Transportation & Commute in Sidney
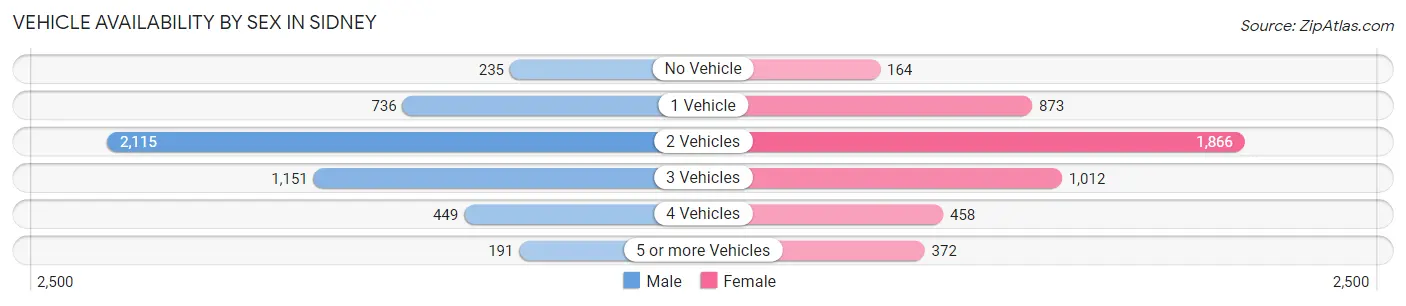
Vehicle Availability by Sex in Sidney
The most prevalent vehicle ownership categories in Sidney are males with 2 vehicles (2,115, accounting for 43.4%) and females with 2 vehicles (1,866, making up 44.6%).
| Vehicles Available | Male | Female |
| No Vehicle | 235 (4.8%) | 164 (3.5%) |
| 1 Vehicle | 736 (15.1%) | 873 (18.4%) |
| 2 Vehicles | 2,115 (43.4%) | 1,866 (39.3%) |
| 3 Vehicles | 1,151 (23.6%) | 1,012 (21.3%) |
| 4 Vehicles | 449 (9.2%) | 458 (9.7%) |
| 5 or more Vehicles | 191 (3.9%) | 372 (7.8%) |
| Total | 4,877 (100.0%) | 4,745 (100.0%) |
Commute Time in Sidney
The most frequently occuring commute durations in Sidney are 5 to 9 minutes (2,749 commuters, 29.8%), 10 to 14 minutes (2,002 commuters, 21.7%), and 15 to 19 minutes (1,327 commuters, 14.4%).
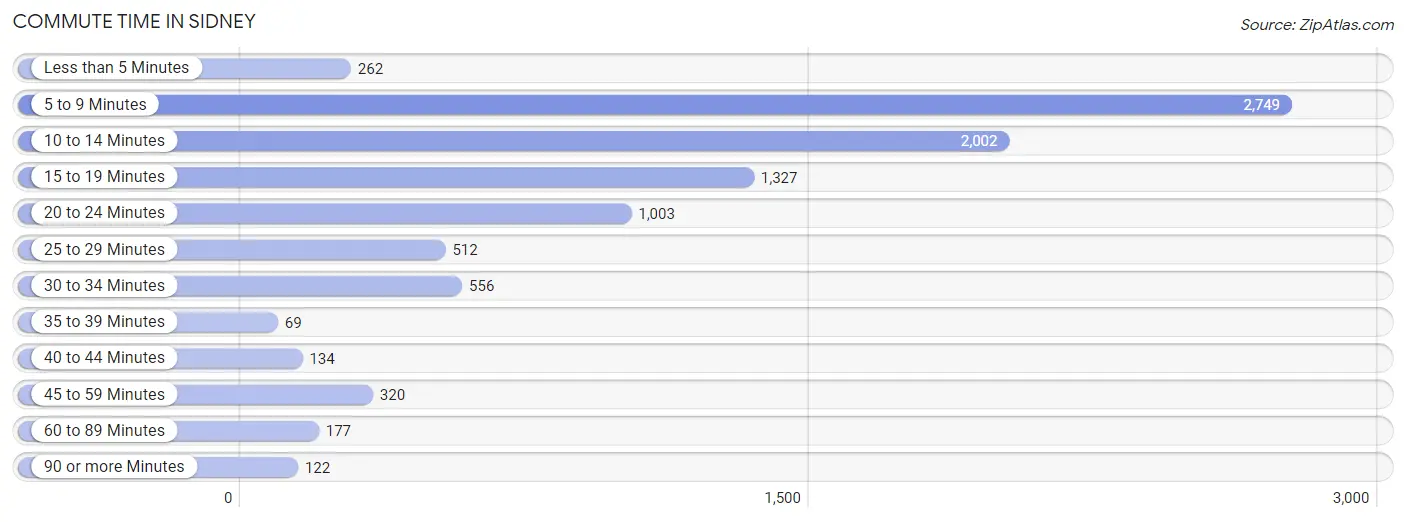
| Commute Time | # Commuters | % Commuters |
| Less than 5 Minutes | 262 | 2.8% |
| 5 to 9 Minutes | 2,749 | 29.8% |
| 10 to 14 Minutes | 2,002 | 21.7% |
| 15 to 19 Minutes | 1,327 | 14.4% |
| 20 to 24 Minutes | 1,003 | 10.9% |
| 25 to 29 Minutes | 512 | 5.6% |
| 30 to 34 Minutes | 556 | 6.0% |
| 35 to 39 Minutes | 69 | 0.7% |
| 40 to 44 Minutes | 134 | 1.5% |
| 45 to 59 Minutes | 320 | 3.5% |
| 60 to 89 Minutes | 177 | 1.9% |
| 90 or more Minutes | 122 | 1.3% |
Commute Time by Sex in Sidney
The most common commute times in Sidney are 5 to 9 minutes (1,192 commuters, 25.5%) for males and 5 to 9 minutes (1,557 commuters, 34.2%) for females.
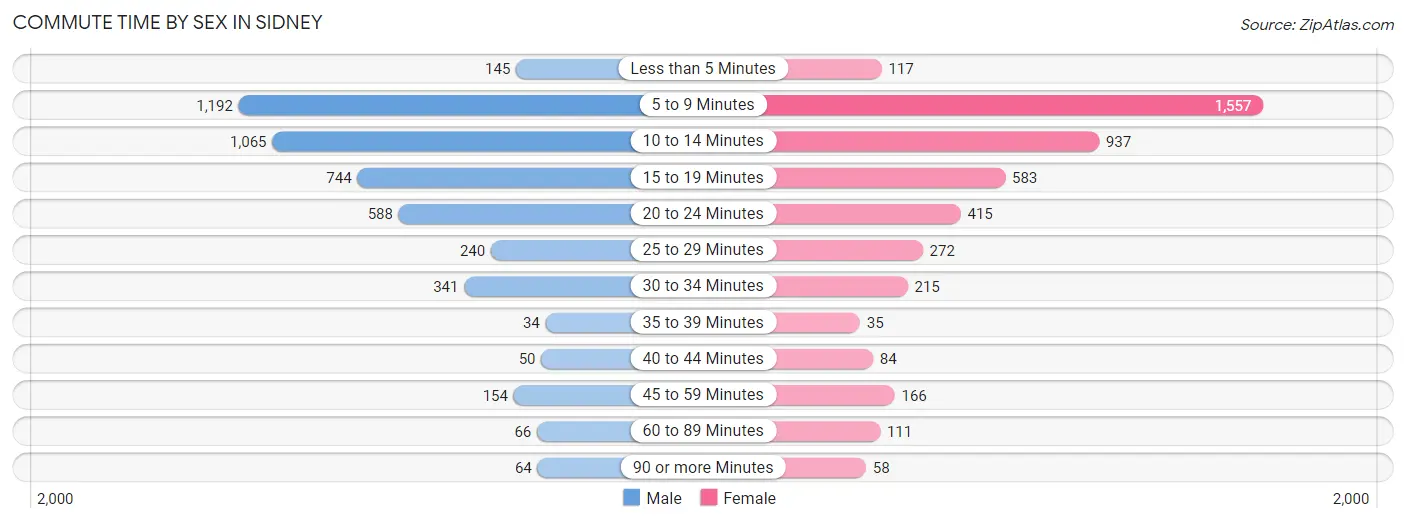
| Commute Time | Male | Female |
| Less than 5 Minutes | 145 (3.1%) | 117 (2.6%) |
| 5 to 9 Minutes | 1,192 (25.5%) | 1,557 (34.2%) |
| 10 to 14 Minutes | 1,065 (22.7%) | 937 (20.6%) |
| 15 to 19 Minutes | 744 (15.9%) | 583 (12.8%) |
| 20 to 24 Minutes | 588 (12.6%) | 415 (9.1%) |
| 25 to 29 Minutes | 240 (5.1%) | 272 (6.0%) |
| 30 to 34 Minutes | 341 (7.3%) | 215 (4.7%) |
| 35 to 39 Minutes | 34 (0.7%) | 35 (0.8%) |
| 40 to 44 Minutes | 50 (1.1%) | 84 (1.8%) |
| 45 to 59 Minutes | 154 (3.3%) | 166 (3.6%) |
| 60 to 89 Minutes | 66 (1.4%) | 111 (2.4%) |
| 90 or more Minutes | 64 (1.4%) | 58 (1.3%) |
Time of Departure to Work by Sex in Sidney
The most frequent times of departure to work in Sidney are 4:00 PM to 11:59 PM (703, 15.0%) for males and 7:30 AM to 7:59 AM (651, 14.3%) for females.
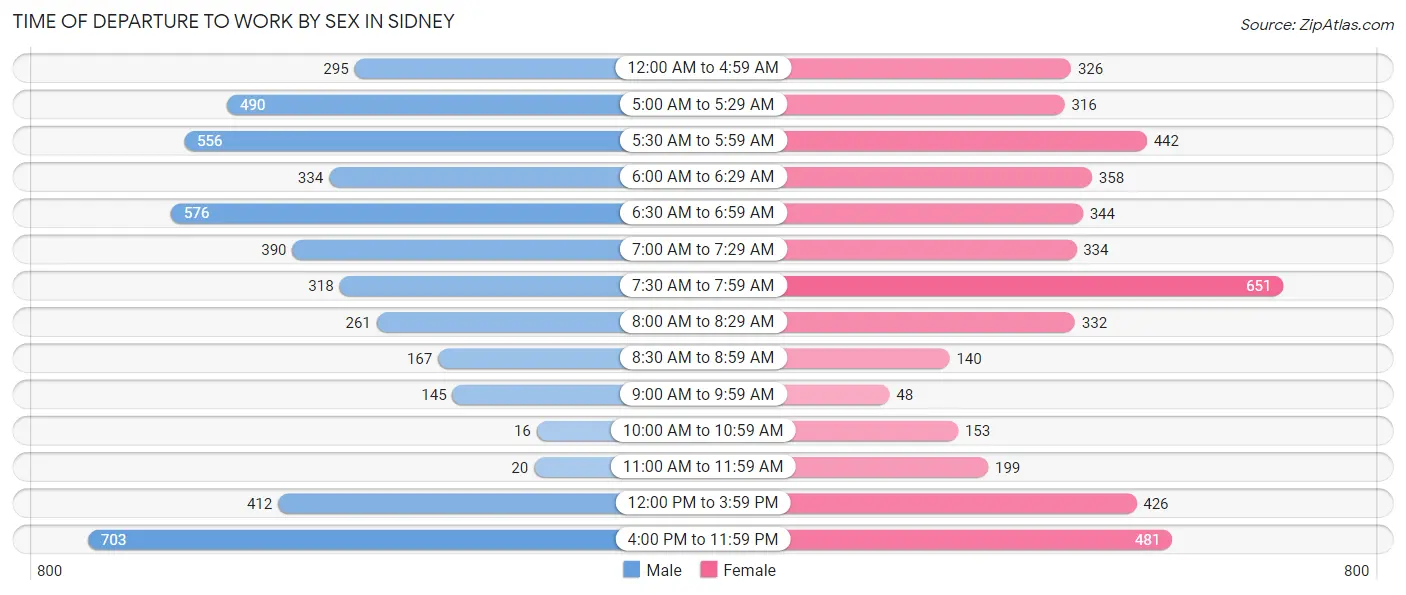
| Time of Departure | Male | Female |
| 12:00 AM to 4:59 AM | 295 (6.3%) | 326 (7.2%) |
| 5:00 AM to 5:29 AM | 490 (10.5%) | 316 (7.0%) |
| 5:30 AM to 5:59 AM | 556 (11.9%) | 442 (9.7%) |
| 6:00 AM to 6:29 AM | 334 (7.1%) | 358 (7.9%) |
| 6:30 AM to 6:59 AM | 576 (12.3%) | 344 (7.6%) |
| 7:00 AM to 7:29 AM | 390 (8.3%) | 334 (7.3%) |
| 7:30 AM to 7:59 AM | 318 (6.8%) | 651 (14.3%) |
| 8:00 AM to 8:29 AM | 261 (5.6%) | 332 (7.3%) |
| 8:30 AM to 8:59 AM | 167 (3.6%) | 140 (3.1%) |
| 9:00 AM to 9:59 AM | 145 (3.1%) | 48 (1.1%) |
| 10:00 AM to 10:59 AM | 16 (0.3%) | 153 (3.4%) |
| 11:00 AM to 11:59 AM | 20 (0.4%) | 199 (4.4%) |
| 12:00 PM to 3:59 PM | 412 (8.8%) | 426 (9.4%) |
| 4:00 PM to 11:59 PM | 703 (15.0%) | 481 (10.6%) |
| Total | 4,683 (100.0%) | 4,550 (100.0%) |
Housing Occupancy in Sidney
Occupancy by Ownership in Sidney
Of the total 8,343 dwellings in Sidney, owner-occupied units account for 5,319 (63.7%), while renter-occupied units make up 3,024 (36.2%).
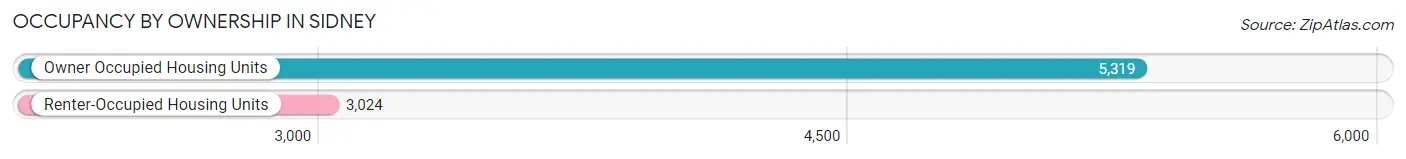
| Occupancy | # Housing Units | % Housing Units |
| Owner Occupied Housing Units | 5,319 | 63.7% |
| Renter-Occupied Housing Units | 3,024 | 36.2% |
| Total Occupied Housing Units | 8,343 | 100.0% |
Occupancy by Household Size in Sidney
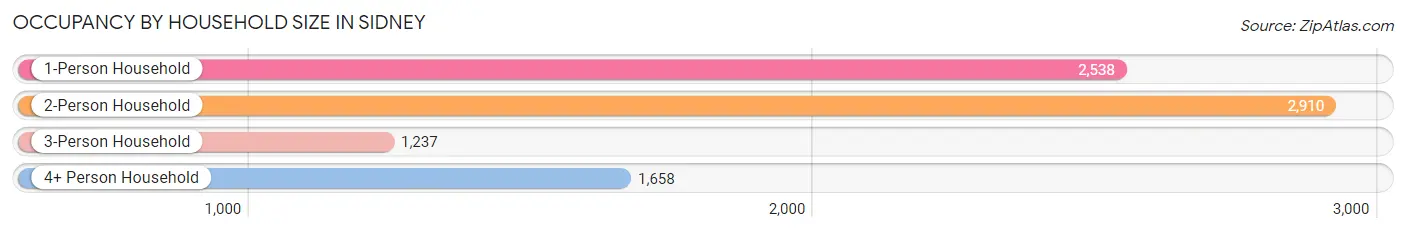
| Household Size | # Housing Units | % Housing Units |
| 1-Person Household | 2,538 | 30.4% |
| 2-Person Household | 2,910 | 34.9% |
| 3-Person Household | 1,237 | 14.8% |
| 4+ Person Household | 1,658 | 19.9% |
| Total Housing Units | 8,343 | 100.0% |
Occupancy by Ownership by Household Size in Sidney
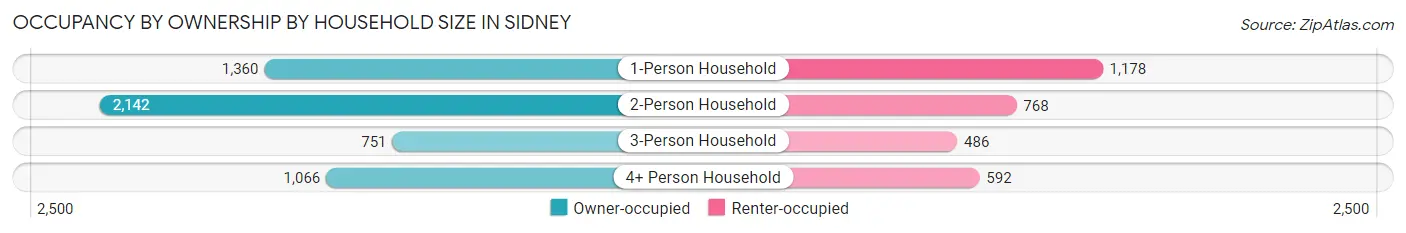
| Household Size | Owner-occupied | Renter-occupied |
| 1-Person Household | 1,360 (53.6%) | 1,178 (46.4%) |
| 2-Person Household | 2,142 (73.6%) | 768 (26.4%) |
| 3-Person Household | 751 (60.7%) | 486 (39.3%) |
| 4+ Person Household | 1,066 (64.3%) | 592 (35.7%) |
| Total Housing Units | 5,319 (63.7%) | 3,024 (36.2%) |
Occupancy by Educational Attainment in Sidney
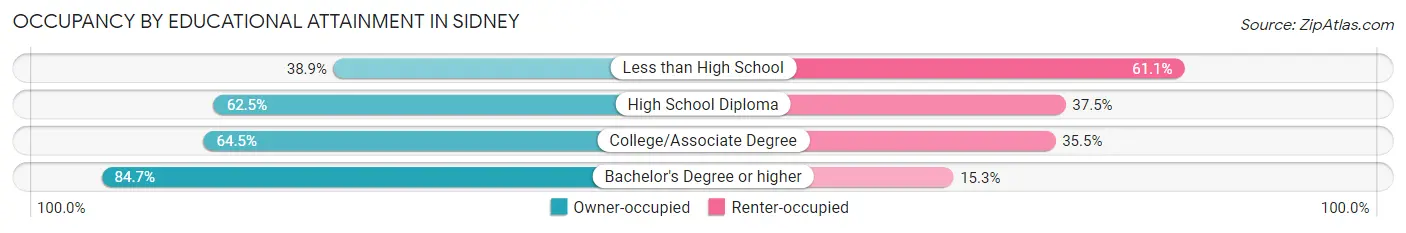
| Household Size | Owner-occupied | Renter-occupied |
| Less than High School | 389 (38.9%) | 611 (61.1%) |
| High School Diploma | 2,150 (62.5%) | 1,291 (37.5%) |
| College/Associate Degree | 1,677 (64.5%) | 923 (35.5%) |
| Bachelor's Degree or higher | 1,103 (84.7%) | 199 (15.3%) |
Occupancy by Age of Householder in Sidney
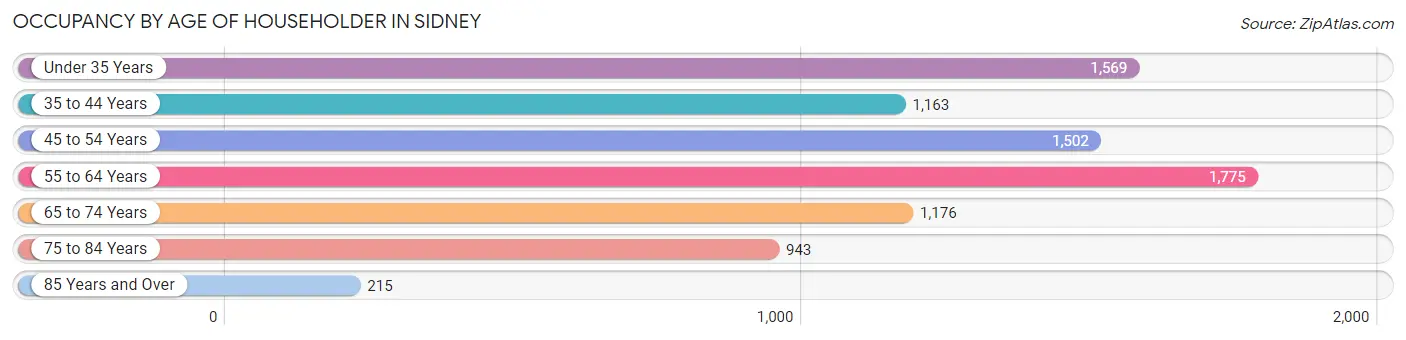
| Age Bracket | # Households | % Households |
| Under 35 Years | 1,569 | 18.8% |
| 35 to 44 Years | 1,163 | 13.9% |
| 45 to 54 Years | 1,502 | 18.0% |
| 55 to 64 Years | 1,775 | 21.3% |
| 65 to 74 Years | 1,176 | 14.1% |
| 75 to 84 Years | 943 | 11.3% |
| 85 Years and Over | 215 | 2.6% |
| Total | 8,343 | 100.0% |
Housing Finances in Sidney
Median Income by Occupancy in Sidney
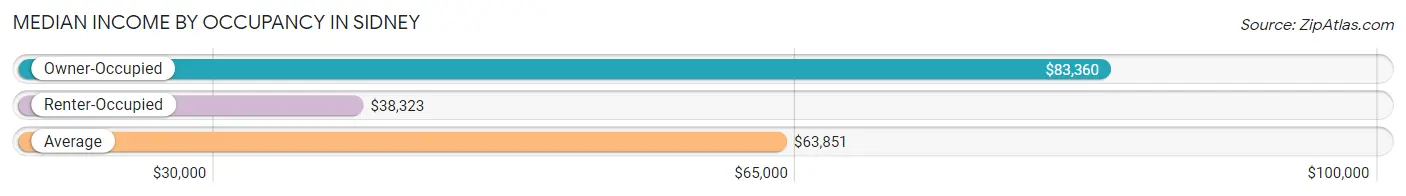
| Occupancy Type | # Households | Median Income |
| Owner-Occupied | 5,319 (63.7%) | $83,360 |
| Renter-Occupied | 3,024 (36.2%) | $38,323 |
| Average | 8,343 (100.0%) | $63,851 |
Occupancy by Householder Income Bracket in Sidney
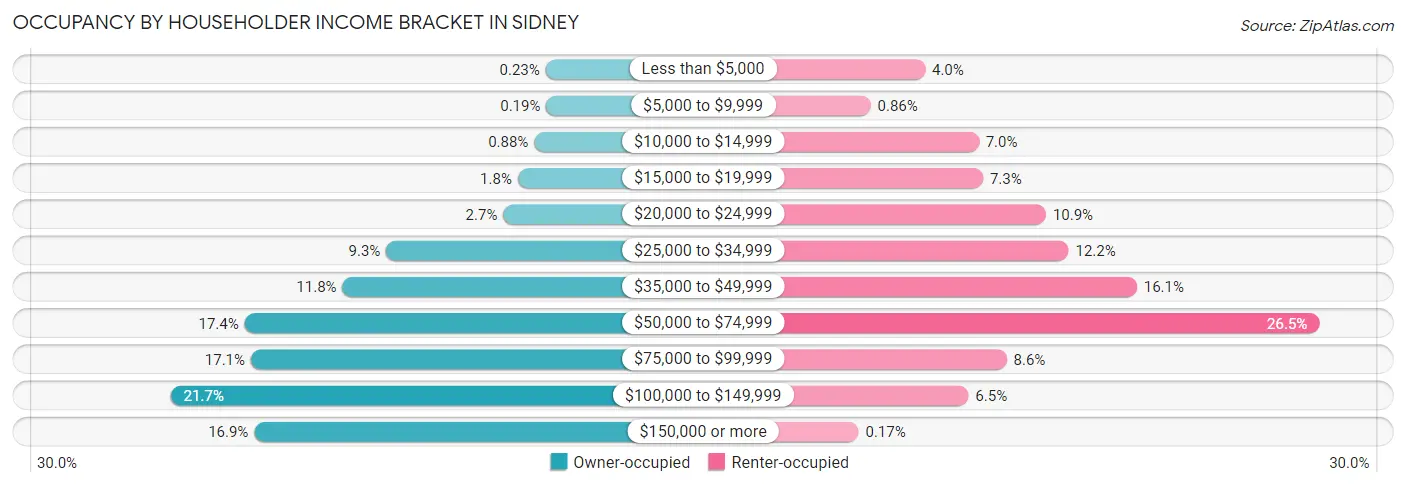
| Income Bracket | Owner-occupied | Renter-occupied |
| Less than $5,000 | 12 (0.2%) | 120 (4.0%) |
| $5,000 to $9,999 | 10 (0.2%) | 26 (0.9%) |
| $10,000 to $14,999 | 47 (0.9%) | 213 (7.0%) |
| $15,000 to $19,999 | 97 (1.8%) | 220 (7.3%) |
| $20,000 to $24,999 | 141 (2.6%) | 329 (10.9%) |
| $25,000 to $34,999 | 497 (9.3%) | 368 (12.2%) |
| $35,000 to $49,999 | 630 (11.8%) | 486 (16.1%) |
| $50,000 to $74,999 | 927 (17.4%) | 801 (26.5%) |
| $75,000 to $99,999 | 908 (17.1%) | 261 (8.6%) |
| $100,000 to $149,999 | 1,152 (21.7%) | 195 (6.5%) |
| $150,000 or more | 898 (16.9%) | 5 (0.2%) |
| Total | 5,319 (100.0%) | 3,024 (100.0%) |
Monthly Housing Cost Tiers in Sidney
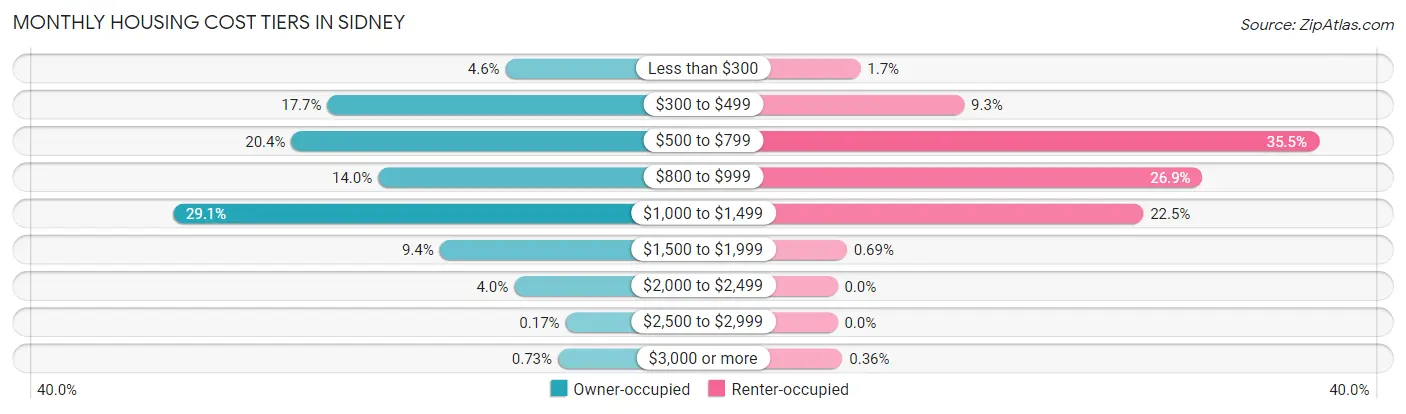
| Monthly Cost | Owner-occupied | Renter-occupied |
| Less than $300 | 244 (4.6%) | 51 (1.7%) |
| $300 to $499 | 942 (17.7%) | 282 (9.3%) |
| $500 to $799 | 1,083 (20.4%) | 1,072 (35.4%) |
| $800 to $999 | 743 (14.0%) | 813 (26.9%) |
| $1,000 to $1,499 | 1,547 (29.1%) | 681 (22.5%) |
| $1,500 to $1,999 | 502 (9.4%) | 21 (0.7%) |
| $2,000 to $2,499 | 210 (4.0%) | 0 (0.0%) |
| $2,500 to $2,999 | 9 (0.2%) | 0 (0.0%) |
| $3,000 or more | 39 (0.7%) | 11 (0.4%) |
| Total | 5,319 (100.0%) | 3,024 (100.0%) |
Physical Housing Characteristics in Sidney
Housing Structures in Sidney
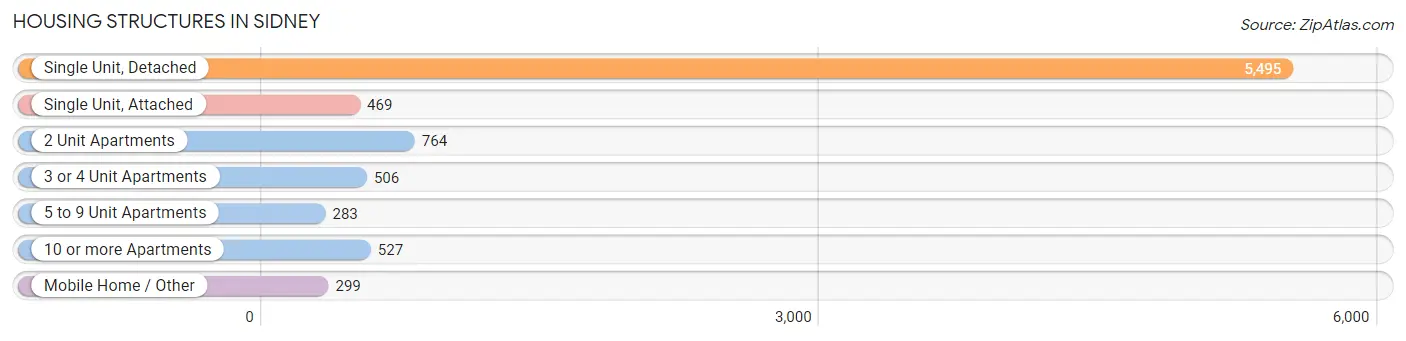
| Structure Type | # Housing Units | % Housing Units |
| Single Unit, Detached | 5,495 | 65.9% |
| Single Unit, Attached | 469 | 5.6% |
| 2 Unit Apartments | 764 | 9.2% |
| 3 or 4 Unit Apartments | 506 | 6.1% |
| 5 to 9 Unit Apartments | 283 | 3.4% |
| 10 or more Apartments | 527 | 6.3% |
| Mobile Home / Other | 299 | 3.6% |
| Total | 8,343 | 100.0% |
Housing Structures by Occupancy in Sidney
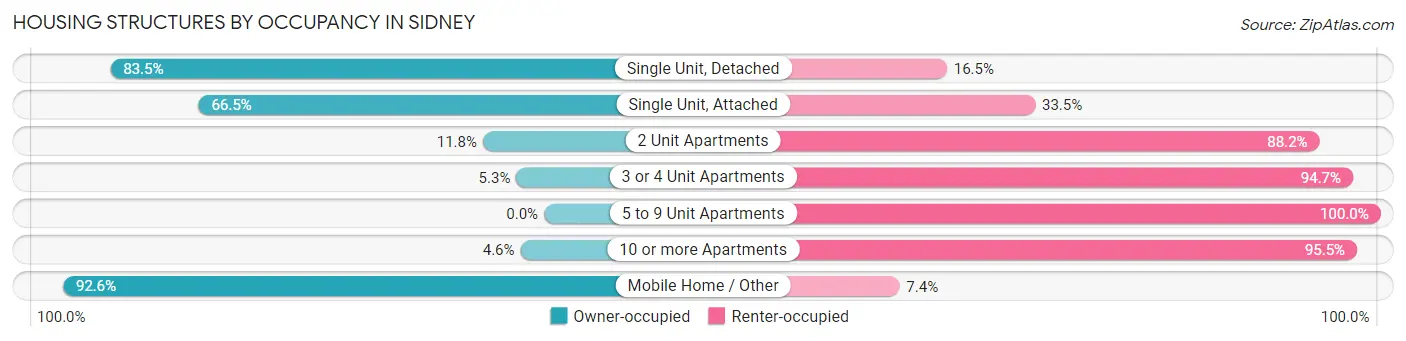
| Structure Type | Owner-occupied | Renter-occupied |
| Single Unit, Detached | 4,589 (83.5%) | 906 (16.5%) |
| Single Unit, Attached | 312 (66.5%) | 157 (33.5%) |
| 2 Unit Apartments | 90 (11.8%) | 674 (88.2%) |
| 3 or 4 Unit Apartments | 27 (5.3%) | 479 (94.7%) |
| 5 to 9 Unit Apartments | 0 (0.0%) | 283 (100.0%) |
| 10 or more Apartments | 24 (4.5%) | 503 (95.5%) |
| Mobile Home / Other | 277 (92.6%) | 22 (7.4%) |
| Total | 5,319 (63.7%) | 3,024 (36.2%) |
Housing Structures by Number of Rooms in Sidney
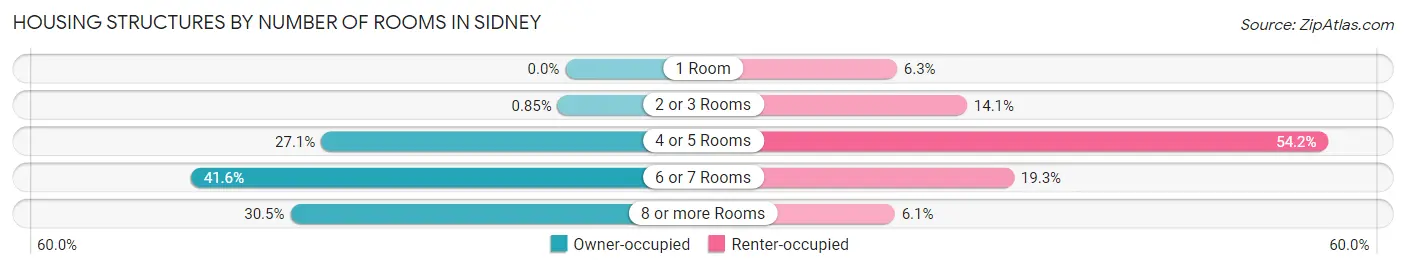
| Number of Rooms | Owner-occupied | Renter-occupied |
| 1 Room | 0 (0.0%) | 191 (6.3%) |
| 2 or 3 Rooms | 45 (0.9%) | 426 (14.1%) |
| 4 or 5 Rooms | 1,441 (27.1%) | 1,639 (54.2%) |
| 6 or 7 Rooms | 2,210 (41.5%) | 584 (19.3%) |
| 8 or more Rooms | 1,623 (30.5%) | 184 (6.1%) |
| Total | 5,319 (100.0%) | 3,024 (100.0%) |
Housing Structure by Heating Type in Sidney
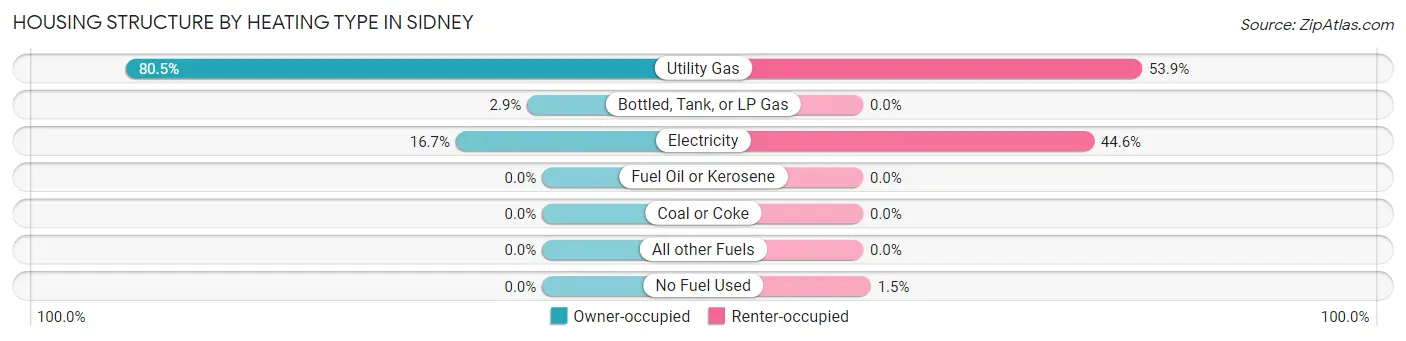
| Heating Type | Owner-occupied | Renter-occupied |
| Utility Gas | 4,279 (80.4%) | 1,630 (53.9%) |
| Bottled, Tank, or LP Gas | 153 (2.9%) | 0 (0.0%) |
| Electricity | 887 (16.7%) | 1,349 (44.6%) |
| Fuel Oil or Kerosene | 0 (0.0%) | 0 (0.0%) |
| Coal or Coke | 0 (0.0%) | 0 (0.0%) |
| All other Fuels | 0 (0.0%) | 0 (0.0%) |
| No Fuel Used | 0 (0.0%) | 45 (1.5%) |
| Total | 5,319 (100.0%) | 3,024 (100.0%) |
Household Vehicle Usage in Sidney
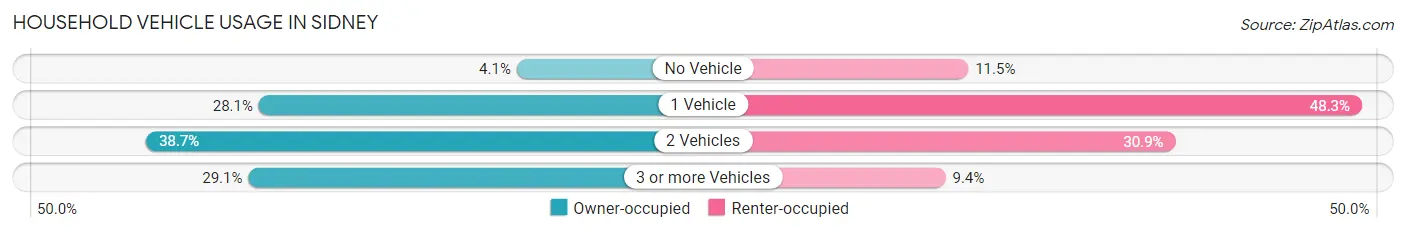
| Vehicles per Household | Owner-occupied | Renter-occupied |
| No Vehicle | 216 (4.1%) | 348 (11.5%) |
| 1 Vehicle | 1,497 (28.1%) | 1,459 (48.2%) |
| 2 Vehicles | 2,057 (38.7%) | 933 (30.8%) |
| 3 or more Vehicles | 1,549 (29.1%) | 284 (9.4%) |
| Total | 5,319 (100.0%) | 3,024 (100.0%) |
Real Estate & Mortgages in Sidney
Real Estate and Mortgage Overview in Sidney
| Characteristic | Without Mortgage | With Mortgage |
| Housing Units | 2,031 | 3,288 |
| Median Property Value | $124,400 | $154,600 |
| Median Household Income | $69,676 | $624 |
| Monthly Housing Costs | $471 | $39 |
| Real Estate Taxes | $1,469 | $125 |
Property Value by Mortgage Status in Sidney
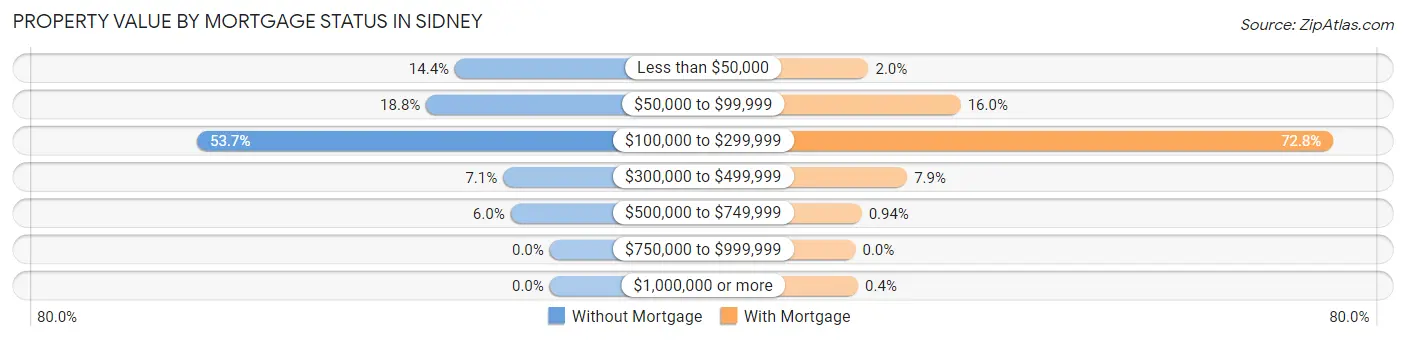
| Property Value | Without Mortgage | With Mortgage |
| Less than $50,000 | 293 (14.4%) | 65 (2.0%) |
| $50,000 to $99,999 | 382 (18.8%) | 527 (16.0%) |
| $100,000 to $299,999 | 1,091 (53.7%) | 2,393 (72.8%) |
| $300,000 to $499,999 | 144 (7.1%) | 259 (7.9%) |
| $500,000 to $749,999 | 121 (6.0%) | 31 (0.9%) |
| $750,000 to $999,999 | 0 (0.0%) | 0 (0.0%) |
| $1,000,000 or more | 0 (0.0%) | 13 (0.4%) |
| Total | 2,031 (100.0%) | 3,288 (100.0%) |
Household Income by Mortgage Status in Sidney
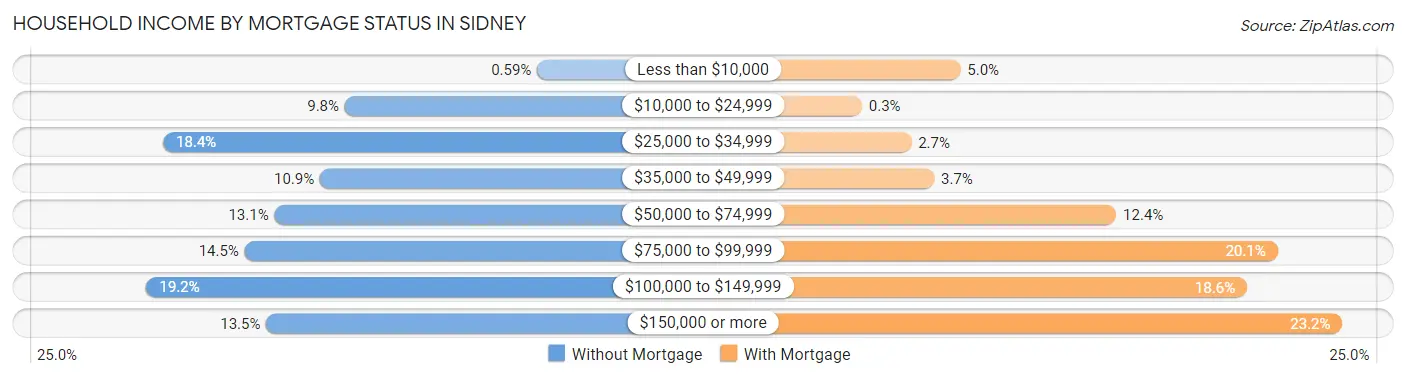
| Household Income | Without Mortgage | With Mortgage |
| Less than $10,000 | 12 (0.6%) | 164 (5.0%) |
| $10,000 to $24,999 | 198 (9.8%) | 10 (0.3%) |
| $25,000 to $34,999 | 374 (18.4%) | 87 (2.6%) |
| $35,000 to $49,999 | 222 (10.9%) | 123 (3.7%) |
| $50,000 to $74,999 | 266 (13.1%) | 408 (12.4%) |
| $75,000 to $99,999 | 295 (14.5%) | 661 (20.1%) |
| $100,000 to $149,999 | 390 (19.2%) | 613 (18.6%) |
| $150,000 or more | 274 (13.5%) | 762 (23.2%) |
| Total | 2,031 (100.0%) | 3,288 (100.0%) |
Property Value to Household Income Ratio in Sidney
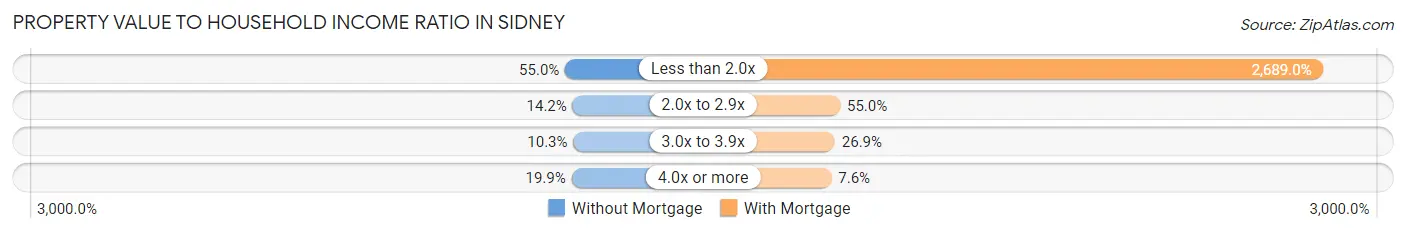
| Value-to-Income Ratio | Without Mortgage | With Mortgage |
| Less than 2.0x | 1,117 (55.0%) | 88,414 (2,689.0%) |
| 2.0x to 2.9x | 288 (14.2%) | 1,809 (55.0%) |
| 3.0x to 3.9x | 209 (10.3%) | 883 (26.9%) |
| 4.0x or more | 405 (19.9%) | 249 (7.6%) |
| Total | 2,031 (100.0%) | 3,288 (100.0%) |
Real Estate Taxes by Mortgage Status in Sidney
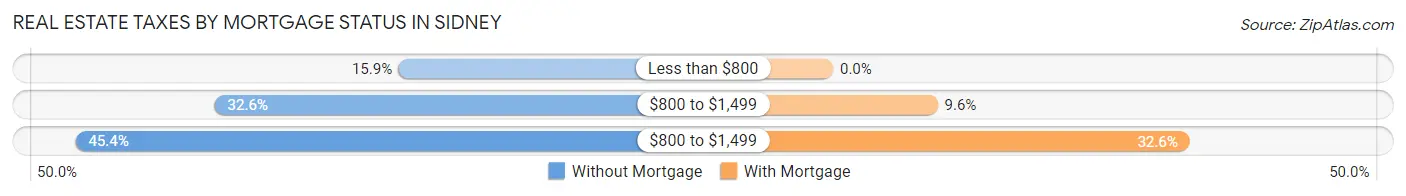
| Property Taxes | Without Mortgage | With Mortgage |
| Less than $800 | 323 (15.9%) | 0 (0.0%) |
| $800 to $1,499 | 663 (32.6%) | 314 (9.6%) |
| $800 to $1,499 | 921 (45.4%) | 1,071 (32.6%) |
| Total | 2,031 (100.0%) | 3,288 (100.0%) |
Health & Disability in Sidney
Health Insurance Coverage by Age in Sidney
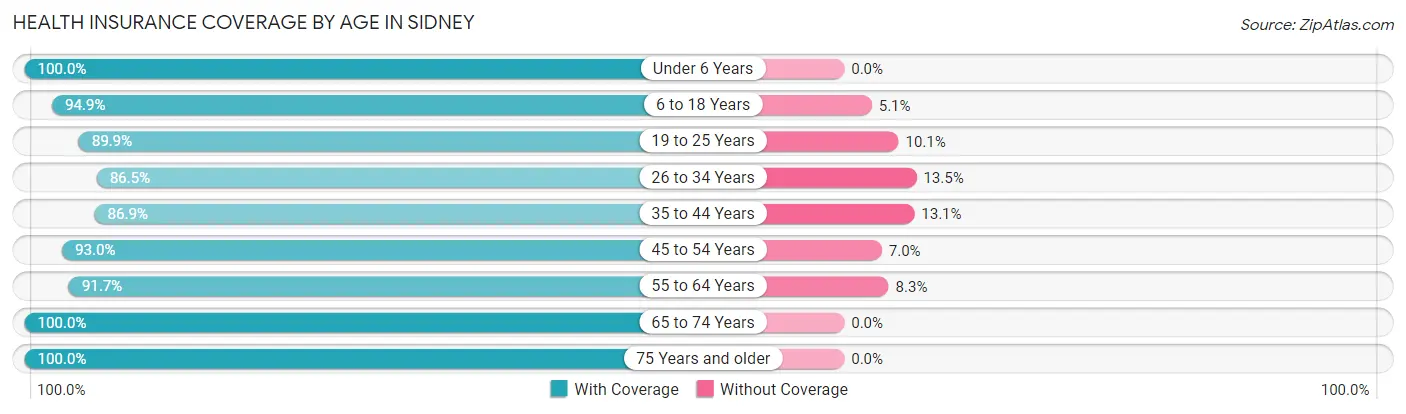
| Age Bracket | With Coverage | Without Coverage |
| Under 6 Years | 1,430 (100.0%) | 0 (0.0%) |
| 6 to 18 Years | 3,584 (94.9%) | 194 (5.1%) |
| 19 to 25 Years | 1,705 (89.9%) | 192 (10.1%) |
| 26 to 34 Years | 1,704 (86.5%) | 265 (13.5%) |
| 35 to 44 Years | 2,055 (86.9%) | 309 (13.1%) |
| 45 to 54 Years | 2,294 (93.0%) | 173 (7.0%) |
| 55 to 64 Years | 2,585 (91.7%) | 233 (8.3%) |
| 65 to 74 Years | 2,052 (100.0%) | 0 (0.0%) |
| 75 Years and older | 1,413 (100.0%) | 0 (0.0%) |
| Total | 18,822 (93.2%) | 1,366 (6.8%) |
Health Insurance Coverage by Citizenship Status in Sidney
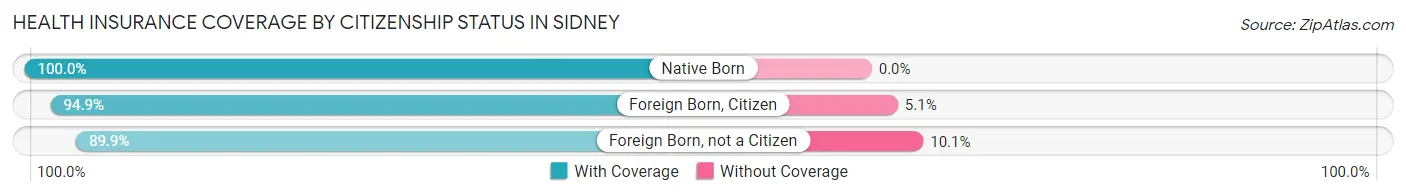
| Citizenship Status | With Coverage | Without Coverage |
| Native Born | 1,430 (100.0%) | 0 (0.0%) |
| Foreign Born, Citizen | 3,584 (94.9%) | 194 (5.1%) |
| Foreign Born, not a Citizen | 1,705 (89.9%) | 192 (10.1%) |
Health Insurance Coverage by Household Income in Sidney
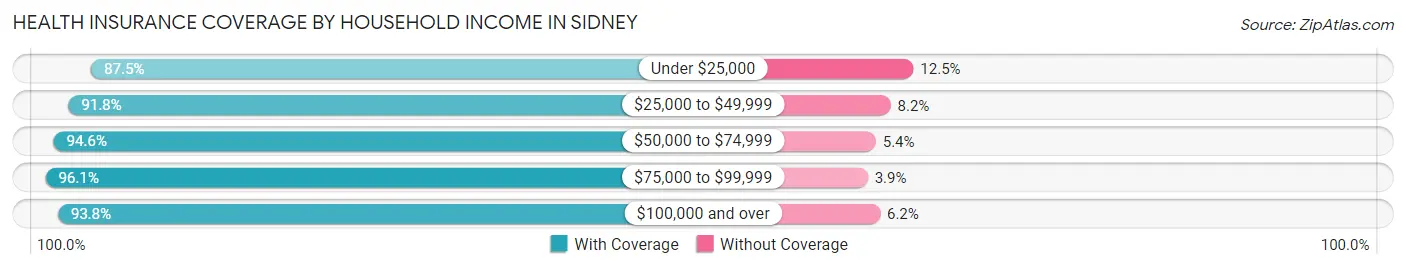
| Household Income | With Coverage | Without Coverage |
| Under $25,000 | 1,824 (87.5%) | 260 (12.5%) |
| $25,000 to $49,999 | 3,677 (91.8%) | 329 (8.2%) |
| $50,000 to $74,999 | 4,092 (94.6%) | 235 (5.4%) |
| $75,000 to $99,999 | 2,718 (96.1%) | 111 (3.9%) |
| $100,000 and over | 6,468 (93.8%) | 430 (6.2%) |
Public vs Private Health Insurance Coverage by Age in Sidney
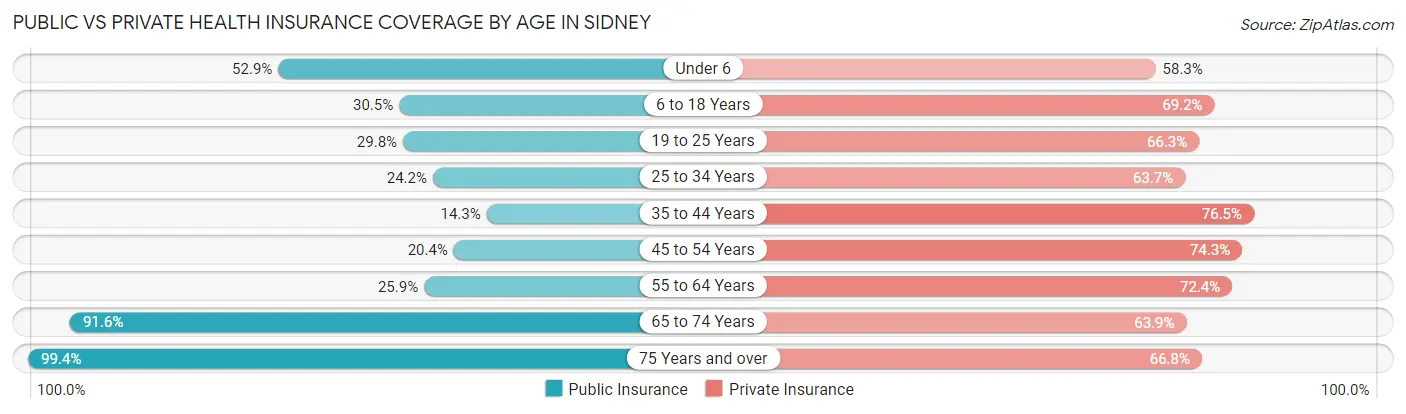
| Age Bracket | Public Insurance | Private Insurance |
| Under 6 | 757 (52.9%) | 833 (58.3%) |
| 6 to 18 Years | 1,152 (30.5%) | 2,613 (69.2%) |
| 19 to 25 Years | 565 (29.8%) | 1,258 (66.3%) |
| 25 to 34 Years | 477 (24.2%) | 1,254 (63.7%) |
| 35 to 44 Years | 337 (14.3%) | 1,808 (76.5%) |
| 45 to 54 Years | 502 (20.3%) | 1,833 (74.3%) |
| 55 to 64 Years | 729 (25.9%) | 2,041 (72.4%) |
| 65 to 74 Years | 1,879 (91.6%) | 1,312 (63.9%) |
| 75 Years and over | 1,404 (99.4%) | 944 (66.8%) |
| Total | 7,802 (38.7%) | 13,896 (68.8%) |
Disability Status by Sex by Age in Sidney
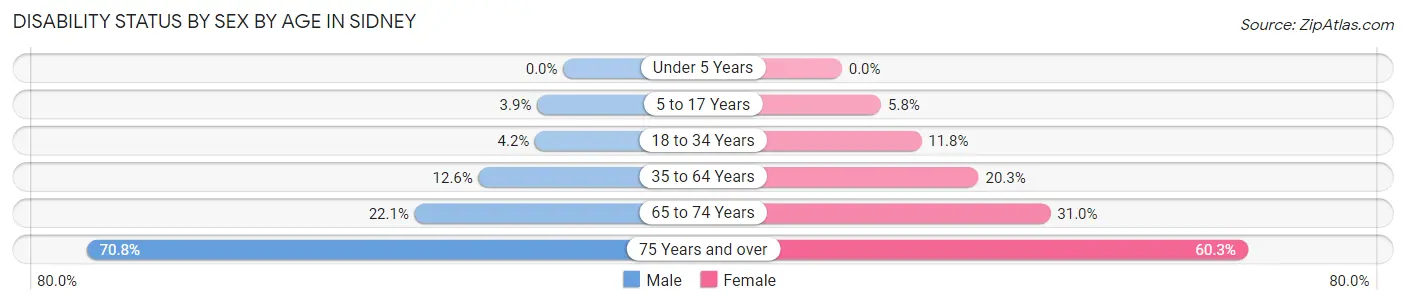
| Age Bracket | Male | Female |
| Under 5 Years | 0 (0.0%) | 0 (0.0%) |
| 5 to 17 Years | 76 (3.9%) | 89 (5.8%) |
| 18 to 34 Years | 75 (4.2%) | 293 (11.8%) |
| 35 to 64 Years | 483 (12.6%) | 774 (20.3%) |
| 65 to 74 Years | 207 (22.1%) | 345 (31.0%) |
| 75 Years and over | 407 (70.8%) | 505 (60.3%) |
Disability Class by Sex by Age in Sidney
Disability Class: Hearing Difficulty
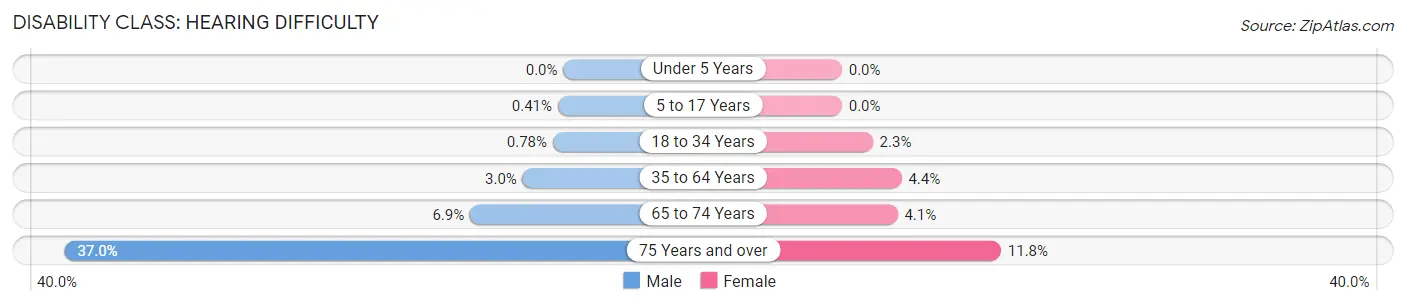
| Age Bracket | Male | Female |
| Under 5 Years | 0 (0.0%) | 0 (0.0%) |
| 5 to 17 Years | 8 (0.4%) | 0 (0.0%) |
| 18 to 34 Years | 14 (0.8%) | 57 (2.3%) |
| 35 to 64 Years | 116 (3.0%) | 169 (4.4%) |
| 65 to 74 Years | 65 (6.9%) | 46 (4.1%) |
| 75 Years and over | 213 (37.0%) | 99 (11.8%) |
Disability Class: Vision Difficulty
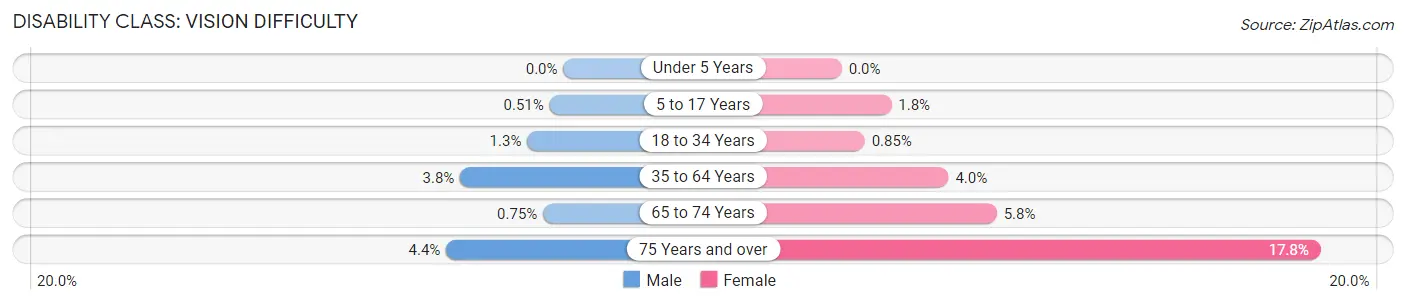
| Age Bracket | Male | Female |
| Under 5 Years | 0 (0.0%) | 0 (0.0%) |
| 5 to 17 Years | 10 (0.5%) | 28 (1.8%) |
| 18 to 34 Years | 24 (1.3%) | 21 (0.9%) |
| 35 to 64 Years | 147 (3.8%) | 151 (4.0%) |
| 65 to 74 Years | 7 (0.7%) | 64 (5.8%) |
| 75 Years and over | 25 (4.3%) | 149 (17.8%) |
Disability Class: Cognitive Difficulty
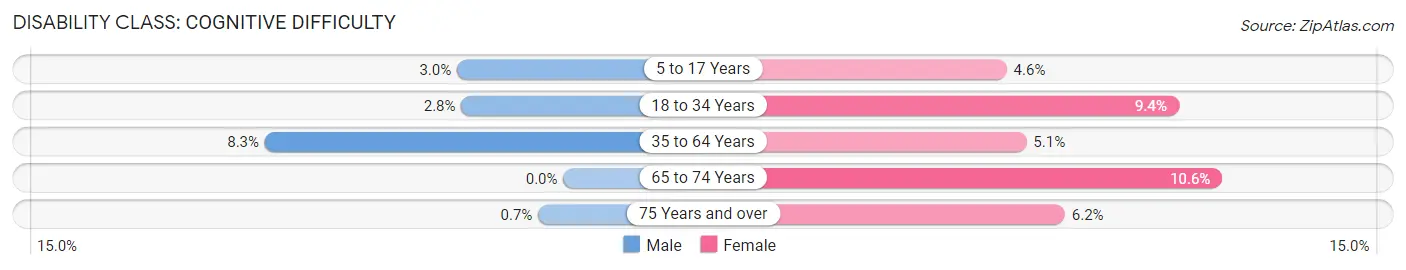
| Age Bracket | Male | Female |
| 5 to 17 Years | 58 (3.0%) | 70 (4.6%) |
| 18 to 34 Years | 51 (2.8%) | 233 (9.4%) |
| 35 to 64 Years | 319 (8.3%) | 196 (5.1%) |
| 65 to 74 Years | 0 (0.0%) | 118 (10.6%) |
| 75 Years and over | 4 (0.7%) | 52 (6.2%) |
Disability Class: Ambulatory Difficulty
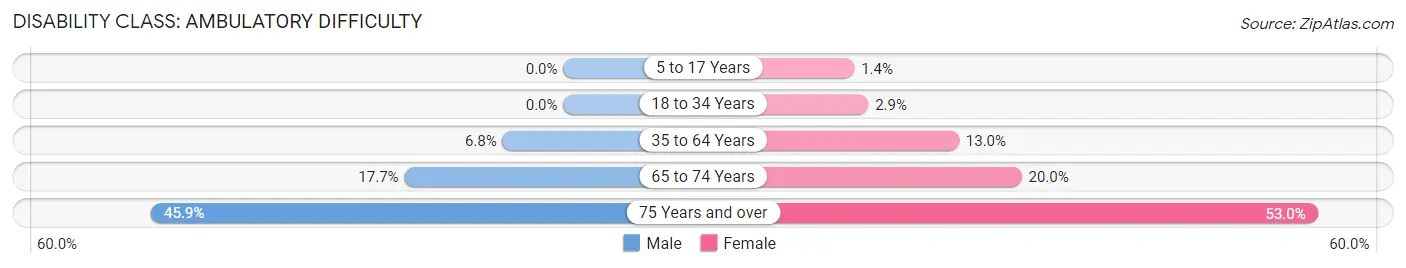
| Age Bracket | Male | Female |
| 5 to 17 Years | 0 (0.0%) | 21 (1.4%) |
| 18 to 34 Years | 0 (0.0%) | 73 (2.9%) |
| 35 to 64 Years | 260 (6.8%) | 497 (13.0%) |
| 65 to 74 Years | 166 (17.7%) | 223 (20.0%) |
| 75 Years and over | 264 (45.9%) | 444 (53.0%) |
Disability Class: Self-Care Difficulty
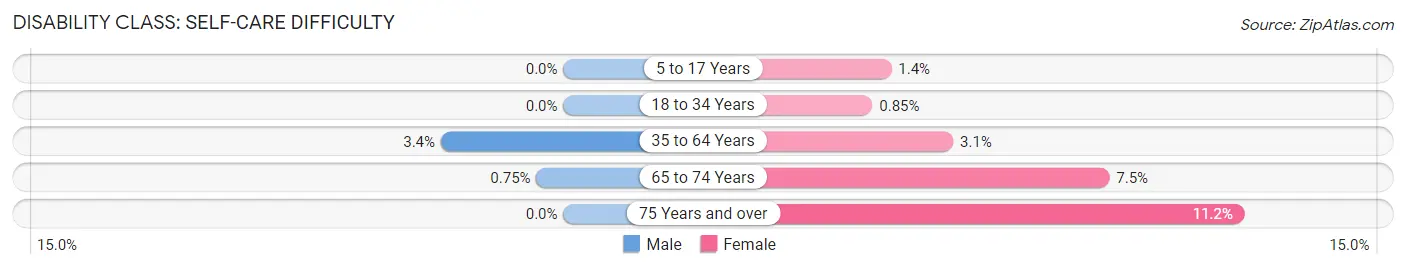
| Age Bracket | Male | Female |
| 5 to 17 Years | 0 (0.0%) | 21 (1.4%) |
| 18 to 34 Years | 0 (0.0%) | 21 (0.9%) |
| 35 to 64 Years | 131 (3.4%) | 118 (3.1%) |
| 65 to 74 Years | 7 (0.7%) | 83 (7.4%) |
| 75 Years and over | 0 (0.0%) | 94 (11.2%) |
Technology Access in Sidney
Computing Device Access in Sidney
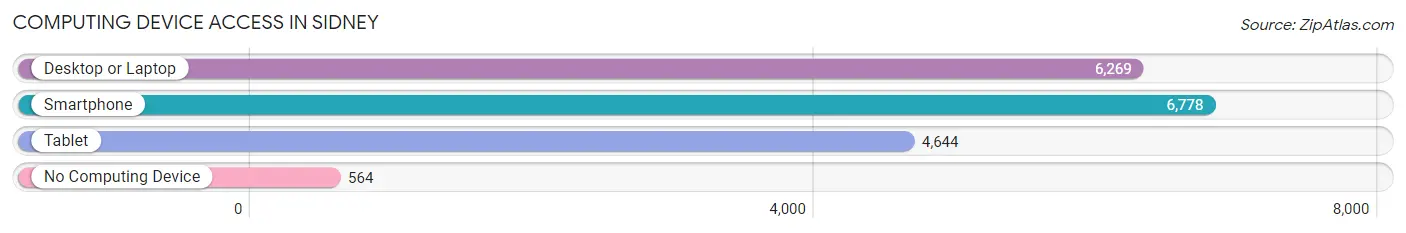
| Device Type | # Households | % Households |
| Desktop or Laptop | 6,269 | 75.1% |
| Smartphone | 6,778 | 81.2% |
| Tablet | 4,644 | 55.7% |
| No Computing Device | 564 | 6.8% |
| Total | 8,343 | 100.0% |
Internet Access in Sidney
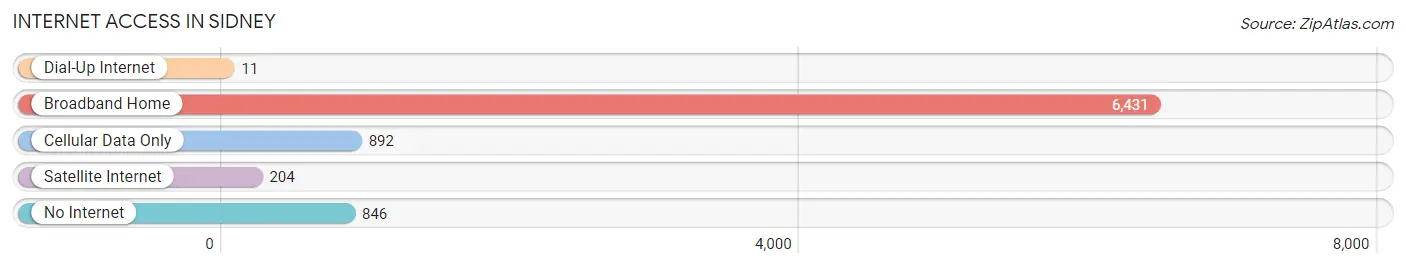
| Internet Type | # Households | % Households |
| Dial-Up Internet | 11 | 0.1% |
| Broadband Home | 6,431 | 77.1% |
| Cellular Data Only | 892 | 10.7% |
| Satellite Internet | 204 | 2.5% |
| No Internet | 846 | 10.1% |
| Total | 8,343 | 100.0% |
Sidney Summary
Sidney, Ohio is a city located in Shelby County, Ohio, United States. It is the county seat of Shelby County and is located approximately 40 miles north of Dayton. The city has a population of approximately 20,000 people and is the largest city in Shelby County.
History
Sidney was founded in 1820 by John Johnston, a Revolutionary War veteran. Johnston named the city after his son, Sidney. The city was incorporated in 1838 and was named the county seat of Shelby County in 1819.
The city was an important stop on the Miami and Erie Canal, which was built in the 1830s. The canal was a major transportation route for goods and people in the area. The canal was eventually replaced by the railroad in the late 19th century.
The city was also an important stop on the Underground Railroad, which was used by escaped slaves to travel to freedom in the northern states.
Geography
Sidney is located in western Ohio, approximately 40 miles north of Dayton. The city is situated on the Great Miami River and is surrounded by farmland. The city has a total area of 8.3 square miles, of which 8.2 square miles is land and 0.1 square miles is water.
The city has a humid continental climate, with hot summers and cold winters. The average temperature in the summer is around 75 degrees Fahrenheit, and the average temperature in the winter is around 30 degrees Fahrenheit.
Economy
Sidney is home to several major employers, including Emerson Climate Technologies, Honda of America Manufacturing, and Whirlpool Corporation. The city also has a strong manufacturing base, with companies such as Emerson, Honda, and Whirlpool all having major operations in the city.
The city also has a strong agricultural sector, with many farms located in the surrounding area. The city is also home to several retail stores, restaurants, and other businesses.
Demographics
As of the 2010 census, the population of Sidney was 20,211. The racial makeup of the city was 90.2% White, 4.3% African American, 0.3% Native American, 1.2% Asian, 0.1% Pacific Islander, 1.3% from other races, and 2.7% from two or more races. Hispanic or Latino of any race were 3.3% of the population.
The median income for a household in the city was $41,945, and the median income for a family was $50,945. The per capita income for the city was $20,945. About 11.2% of families and 14.2% of the population were below the poverty line, including 19.2% of those under age 18 and 8.2% of those age 65 or over.
Sidney is a diverse city, with a variety of cultures and backgrounds represented. The city is home to a large number of immigrants, with many coming from Mexico, India, and other countries. The city also has a large Amish population, with many Amish families living in the surrounding area.
Common Questions
What is Per Capita Income in Sidney?
Per Capita income in Sidney is $32,905.
What is the Median Family Income in Sidney?
Median Family Income in Sidney is $83,404.
What is the Median Household income in Sidney?
Median Household Income in Sidney is $63,851.
What is Income or Wage Gap in Sidney?
Income or Wage Gap in Sidney is 39.6%.
Women in Sidney earn 60.4 cents for every dollar earned by a man.
What is Inequality or Gini Index in Sidney?
Inequality or Gini Index in Sidney is 0.40.
What is the Total Population of Sidney?
Total Population of Sidney is 20,350.
What is the Total Male Population of Sidney?
Total Male Population of Sidney is 9,849.
What is the Total Female Population of Sidney?
Total Female Population of Sidney is 10,501.
What is the Ratio of Males per 100 Females in Sidney?
There are 93.79 Males per 100 Females in Sidney.
What is the Ratio of Females per 100 Males in Sidney?
There are 106.62 Females per 100 Males in Sidney.
What is the Median Population Age in Sidney?
Median Population Age in Sidney is 40.2 Years.
What is the Average Family Size in Sidney
Average Family Size in Sidney is 3.0 People.
What is the Average Household Size in Sidney
Average Household Size in Sidney is 2.4 People.
How Large is the Labor Force in Sidney?
There are 10,659 People in the Labor Forcein in Sidney.
What is the Percentage of People in the Labor Force in Sidney?
65.9% of People are in the Labor Force in Sidney.
What is the Unemployment Rate in Sidney?
Unemployment Rate in Sidney is 6.6%.