Troy, OH Map & Demographics
Troy Map
Troy Overview
$36,026
PER CAPITA INCOME
$91,732
AVG FAMILY INCOME
$69,730
AVG HOUSEHOLD INCOME
34.8%
WAGE / INCOME GAP [ % ]
65.2¢/ $1
WAGE / INCOME GAP [ $ ]
$11,806
FAMILY INCOME DEFICIT
0.41
INEQUALITY / GINI INDEX
26,494
TOTAL POPULATION
12,822
MALE POPULATION
13,672
FEMALE POPULATION
93.78
MALES / 100 FEMALES
106.63
FEMALES / 100 MALES
38.2
MEDIAN AGE
3.0
AVG FAMILY SIZE
2.4
AVG HOUSEHOLD SIZE
14,113
LABOR FORCE [ PEOPLE ]
67.4%
PERCENT IN LABOR FORCE
5.0%
UNEMPLOYMENT RATE
Troy Zip Codes
Troy Area Codes
Income in Troy
Income Overview in Troy
Per Capita Income in Troy is $36,026, while median incomes of families and households are $91,732 and $69,730 respectively.
| Characteristic | Number | Measure |
| Per Capita Income | 26,494 | $36,026 |
| Median Family Income | 6,878 | $91,732 |
| Mean Family Income | 6,878 | $105,599 |
| Median Household Income | 10,874 | $69,730 |
| Mean Household Income | 10,874 | $85,744 |
| Income Deficit | 6,878 | $11,806 |
| Wage / Income Gap (%) | 26,494 | 34.77% |
| Wage / Income Gap ($) | 26,494 | 65.23¢ per $1 |
| Gini / Inequality Index | 26,494 | 0.41 |
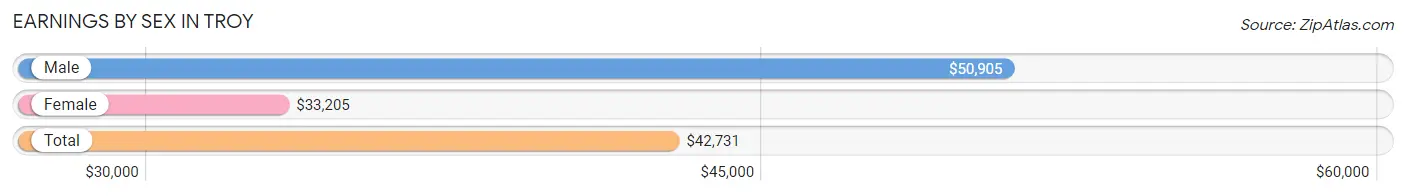
Earnings by Sex in Troy
Average Earnings in Troy are $42,731, $50,905 for men and $33,205 for women, a difference of 34.8%.
| Sex | Number | Average Earnings |
| Male | 7,748 (52.6%) | $50,905 |
| Female | 6,971 (47.4%) | $33,205 |
| Total | 14,719 (100.0%) | $42,731 |
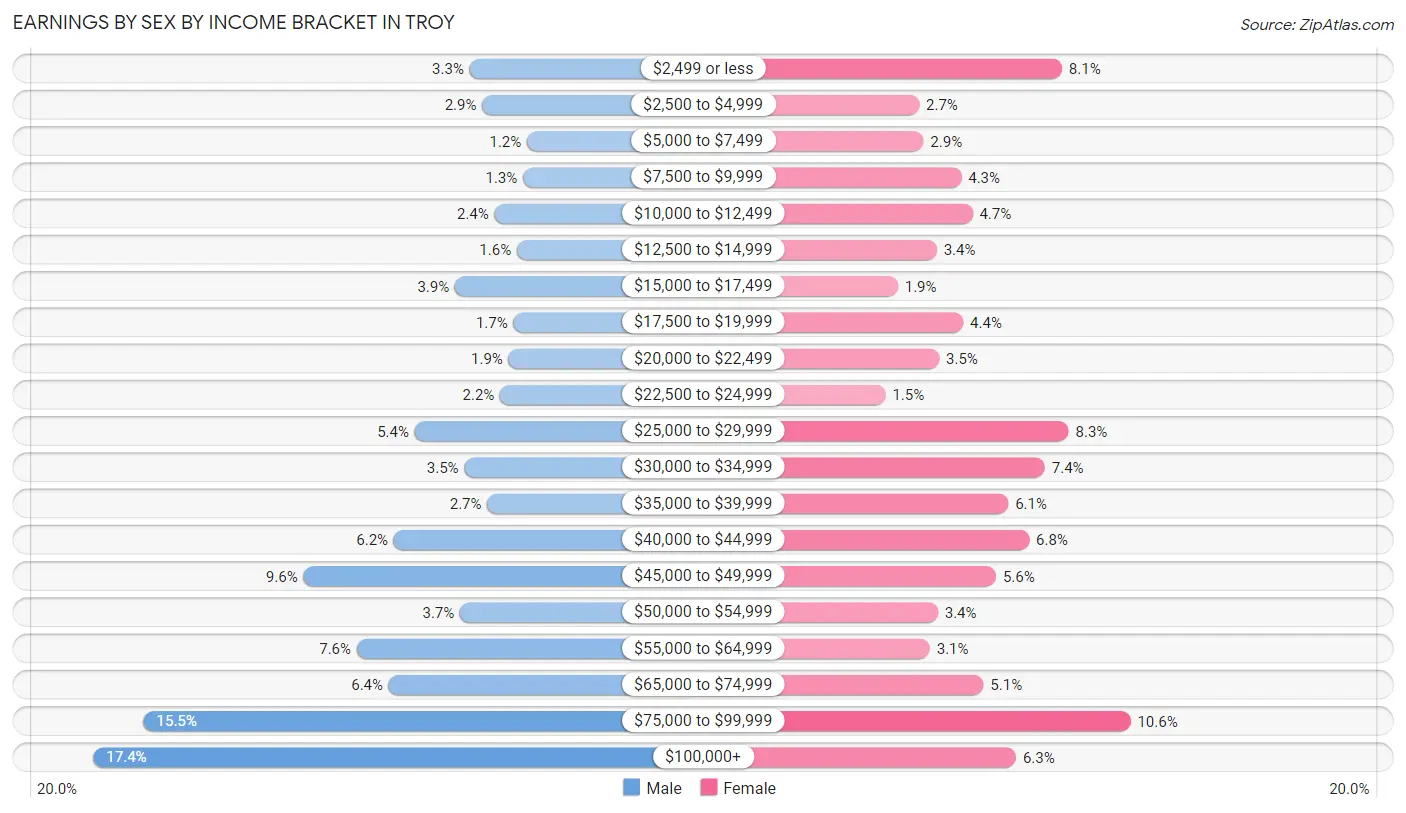
Earnings by Sex by Income Bracket in Troy
The most common earnings brackets in Troy are $100,000+ for men (1,350 | 17.4%) and $75,000 to $99,999 for women (741 | 10.6%).
| Income | Male | Female |
| $2,499 or less | 257 (3.3%) | 562 (8.1%) |
| $2,500 to $4,999 | 221 (2.9%) | 189 (2.7%) |
| $5,000 to $7,499 | 91 (1.2%) | 200 (2.9%) |
| $7,500 to $9,999 | 102 (1.3%) | 299 (4.3%) |
| $10,000 to $12,499 | 185 (2.4%) | 328 (4.7%) |
| $12,500 to $14,999 | 120 (1.5%) | 235 (3.4%) |
| $15,000 to $17,499 | 300 (3.9%) | 133 (1.9%) |
| $17,500 to $19,999 | 130 (1.7%) | 304 (4.4%) |
| $20,000 to $22,499 | 144 (1.9%) | 241 (3.5%) |
| $22,500 to $24,999 | 169 (2.2%) | 101 (1.5%) |
| $25,000 to $29,999 | 417 (5.4%) | 579 (8.3%) |
| $30,000 to $34,999 | 273 (3.5%) | 517 (7.4%) |
| $35,000 to $39,999 | 206 (2.7%) | 422 (6.0%) |
| $40,000 to $44,999 | 477 (6.2%) | 476 (6.8%) |
| $45,000 to $49,999 | 740 (9.6%) | 390 (5.6%) |
| $50,000 to $54,999 | 285 (3.7%) | 238 (3.4%) |
| $55,000 to $64,999 | 585 (7.5%) | 217 (3.1%) |
| $65,000 to $74,999 | 492 (6.4%) | 357 (5.1%) |
| $75,000 to $99,999 | 1,204 (15.5%) | 741 (10.6%) |
| $100,000+ | 1,350 (17.4%) | 442 (6.3%) |
| Total | 7,748 (100.0%) | 6,971 (100.0%) |
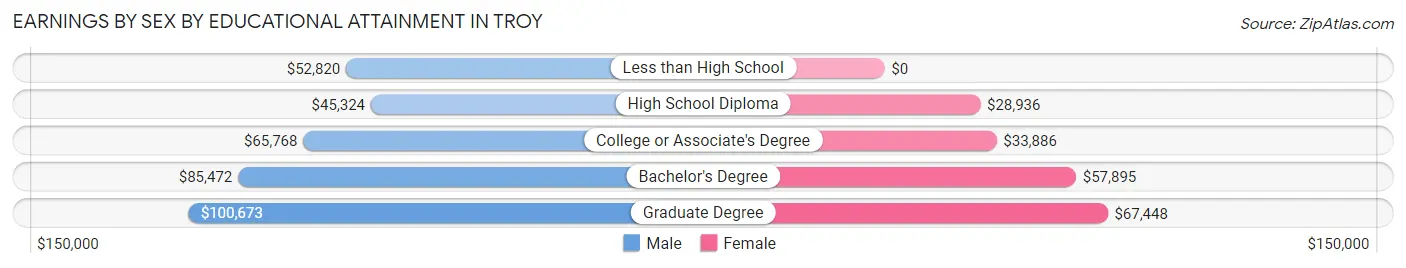
Earnings by Sex by Educational Attainment in Troy
Average earnings in Troy are $62,208 for men and $37,202 for women, a difference of 40.2%. Men with an educational attainment of graduate degree enjoy the highest average annual earnings of $100,673, while those with high school diploma education earn the least with $45,324. Women with an educational attainment of graduate degree earn the most with the average annual earnings of $67,448, while those with high school diploma education have the smallest earnings of $28,936.
| Educational Attainment | Male Income | Female Income |
| Less than High School | $52,820 | $0 |
| High School Diploma | $45,324 | $28,936 |
| College or Associate's Degree | $65,768 | $33,886 |
| Bachelor's Degree | $85,472 | $57,895 |
| Graduate Degree | $100,673 | $67,448 |
| Total | $62,208 | $37,202 |
Family Income in Troy
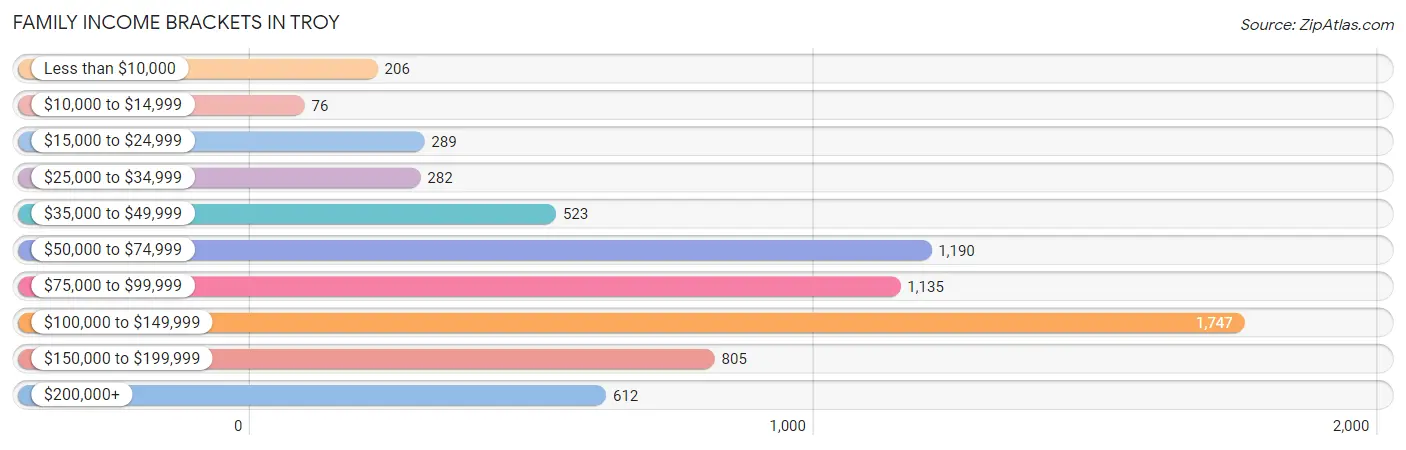
Family Income Brackets in Troy
According to the Troy family income data, there are 1,747 families falling into the $100,000 to $149,999 income range, which is the most common income bracket and makes up 25.4% of all families. Conversely, the $10,000 to $14,999 income bracket is the least frequent group with only 76 families (1.1%) belonging to this category.
| Income Bracket | # Families | % Families |
| Less than $10,000 | 206 | 3.0% |
| $10,000 to $14,999 | 76 | 1.1% |
| $15,000 to $24,999 | 289 | 4.2% |
| $25,000 to $34,999 | 282 | 4.1% |
| $35,000 to $49,999 | 523 | 7.6% |
| $50,000 to $74,999 | 1,190 | 17.3% |
| $75,000 to $99,999 | 1,135 | 16.5% |
| $100,000 to $149,999 | 1,747 | 25.4% |
| $150,000 to $199,999 | 805 | 11.7% |
| $200,000+ | 612 | 8.9% |
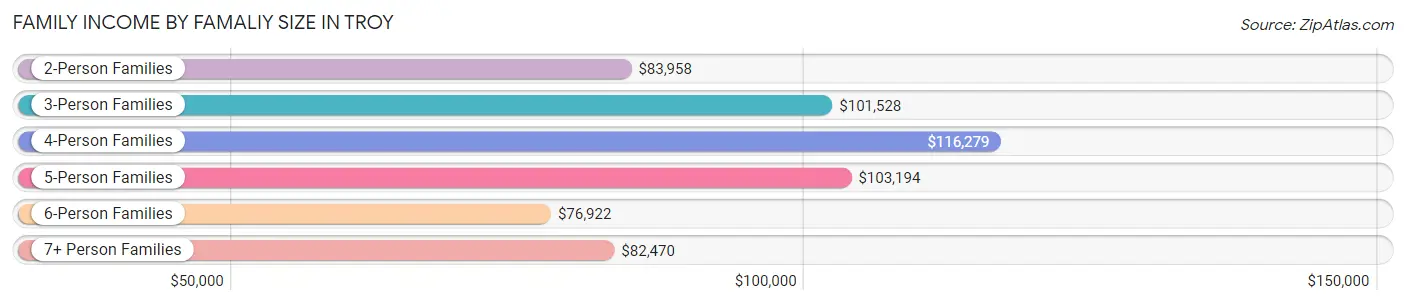
Family Income by Famaliy Size in Troy
4-person families (1,113 | 16.2%) account for the highest median family income in Troy with $116,279 per family, while 2-person families (3,081 | 44.8%) have the highest median income of $41,979 per family member.
| Income Bracket | # Families | Median Income |
| 2-Person Families | 3,081 (44.8%) | $83,958 |
| 3-Person Families | 1,906 (27.7%) | $101,528 |
| 4-Person Families | 1,113 (16.2%) | $116,279 |
| 5-Person Families | 318 (4.6%) | $103,194 |
| 6-Person Families | 379 (5.5%) | $76,922 |
| 7+ Person Families | 81 (1.2%) | $82,470 |
| Total | 6,878 (100.0%) | $91,732 |
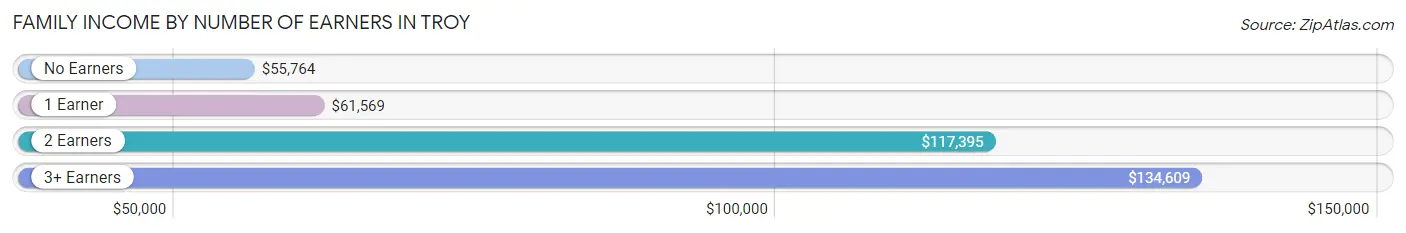
Family Income by Number of Earners in Troy
The median family income in Troy is $91,732, with families comprising 3+ earners (889) having the highest median family income of $134,609, while families with no earners (955) have the lowest median family income of $55,764, accounting for 12.9% and 13.9% of families, respectively.
| Number of Earners | # Families | Median Income |
| No Earners | 955 (13.9%) | $55,764 |
| 1 Earner | 2,037 (29.6%) | $61,569 |
| 2 Earners | 2,997 (43.6%) | $117,395 |
| 3+ Earners | 889 (12.9%) | $134,609 |
| Total | 6,878 (100.0%) | $91,732 |
Household Income in Troy
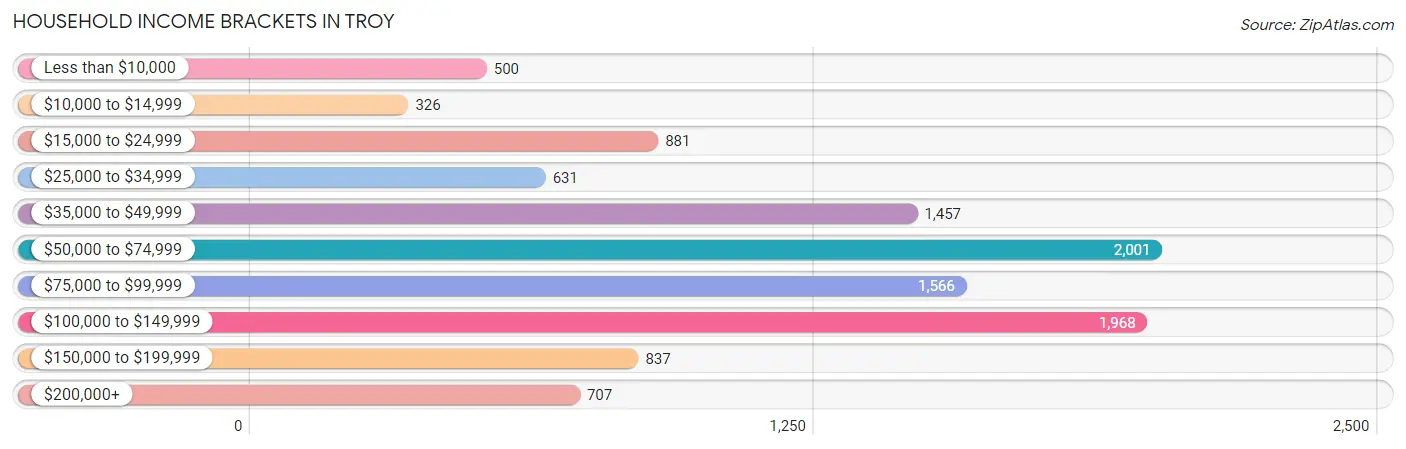
Household Income Brackets in Troy
With 2,001 households falling in the category, the $50,000 to $74,999 income range is the most frequent in Troy, accounting for 18.4% of all households. In contrast, only 326 households (3.0%) fall into the $10,000 to $14,999 income bracket, making it the least populous group.
| Income Bracket | # Households | % Households |
| Less than $10,000 | 500 | 4.6% |
| $10,000 to $14,999 | 326 | 3.0% |
| $15,000 to $24,999 | 881 | 8.1% |
| $25,000 to $34,999 | 631 | 5.8% |
| $35,000 to $49,999 | 1,457 | 13.4% |
| $50,000 to $74,999 | 2,001 | 18.4% |
| $75,000 to $99,999 | 1,566 | 14.4% |
| $100,000 to $149,999 | 1,968 | 18.1% |
| $150,000 to $199,999 | 837 | 7.7% |
| $200,000+ | 707 | 6.5% |
Household Income by Householder Age in Troy
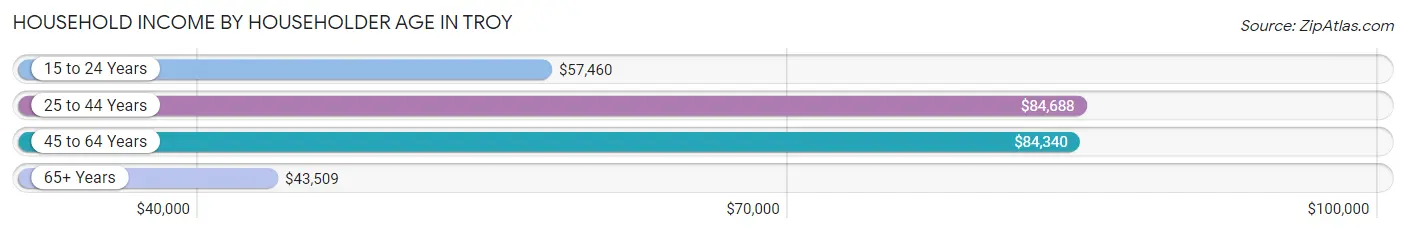
The median household income in Troy is $69,730, with the highest median household income of $84,688 found in the 25 to 44 years age bracket for the primary householder. A total of 3,711 households (34.1%) fall into this category. Meanwhile, the 65+ years age bracket for the primary householder has the lowest median household income of $43,509, with 2,852 households (26.2%) in this group.
| Income Bracket | # Households | Median Income |
| 15 to 24 Years | 441 (4.1%) | $57,460 |
| 25 to 44 Years | 3,711 (34.1%) | $84,688 |
| 45 to 64 Years | 3,870 (35.6%) | $84,340 |
| 65+ Years | 2,852 (26.2%) | $43,509 |
| Total | 10,874 (100.0%) | $69,730 |
Poverty in Troy
Income Below Poverty by Sex and Age in Troy
With 8.4% poverty level for males and 11.3% for females among the residents of Troy, under 5 year old males and 5 year old females are the most vulnerable to poverty, with 140 males (22.2%) and 40 females (44.4%) in their respective age groups living below the poverty level.
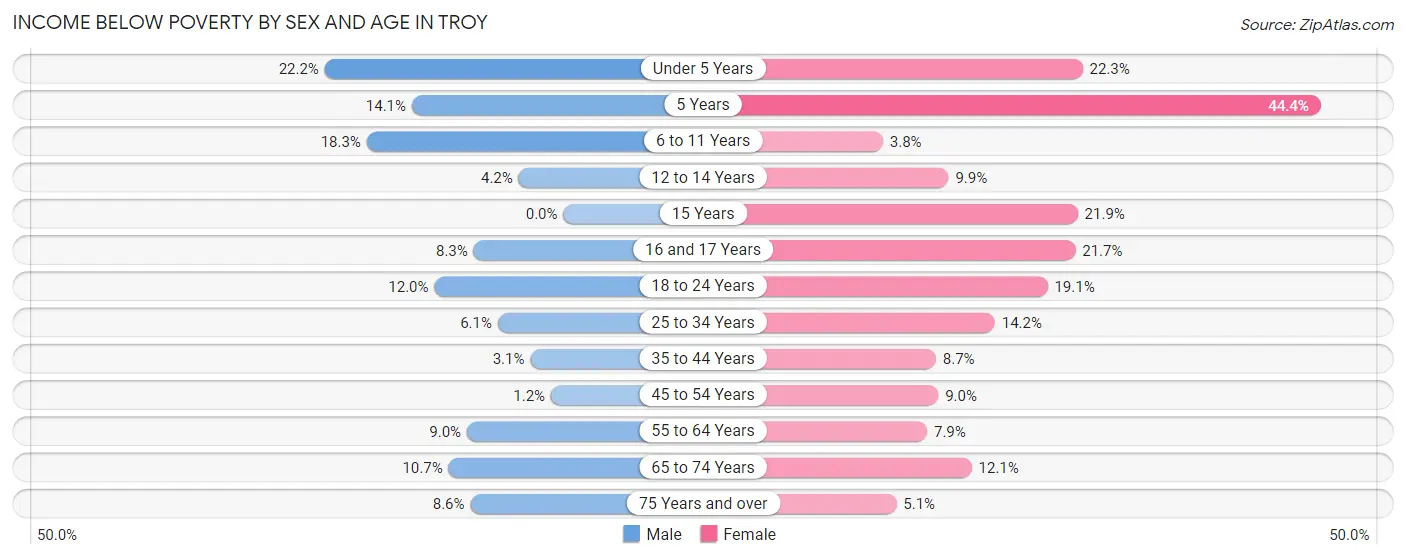
| Age Bracket | Male | Female |
| Under 5 Years | 140 (22.2%) | 174 (22.3%) |
| 5 Years | 61 (14.1%) | 40 (44.4%) |
| 6 to 11 Years | 190 (18.2%) | 36 (3.8%) |
| 12 to 14 Years | 17 (4.2%) | 83 (9.9%) |
| 15 Years | 0 (0.0%) | 37 (21.9%) |
| 16 and 17 Years | 43 (8.3%) | 70 (21.7%) |
| 18 to 24 Years | 150 (12.0%) | 192 (19.1%) |
| 25 to 34 Years | 99 (6.1%) | 224 (14.2%) |
| 35 to 44 Years | 59 (3.1%) | 168 (8.7%) |
| 45 to 54 Years | 19 (1.1%) | 153 (8.9%) |
| 55 to 64 Years | 110 (8.9%) | 136 (7.9%) |
| 65 to 74 Years | 95 (10.7%) | 159 (12.0%) |
| 75 Years and over | 76 (8.6%) | 59 (5.1%) |
| Total | 1,059 (8.4%) | 1,531 (11.3%) |
Income Above Poverty by Sex and Age in Troy
According to the poverty statistics in Troy, males aged 15 years and females aged 6 to 11 years are the age groups that are most secure financially, with 100.0% of males and 96.2% of females in these age groups living above the poverty line.
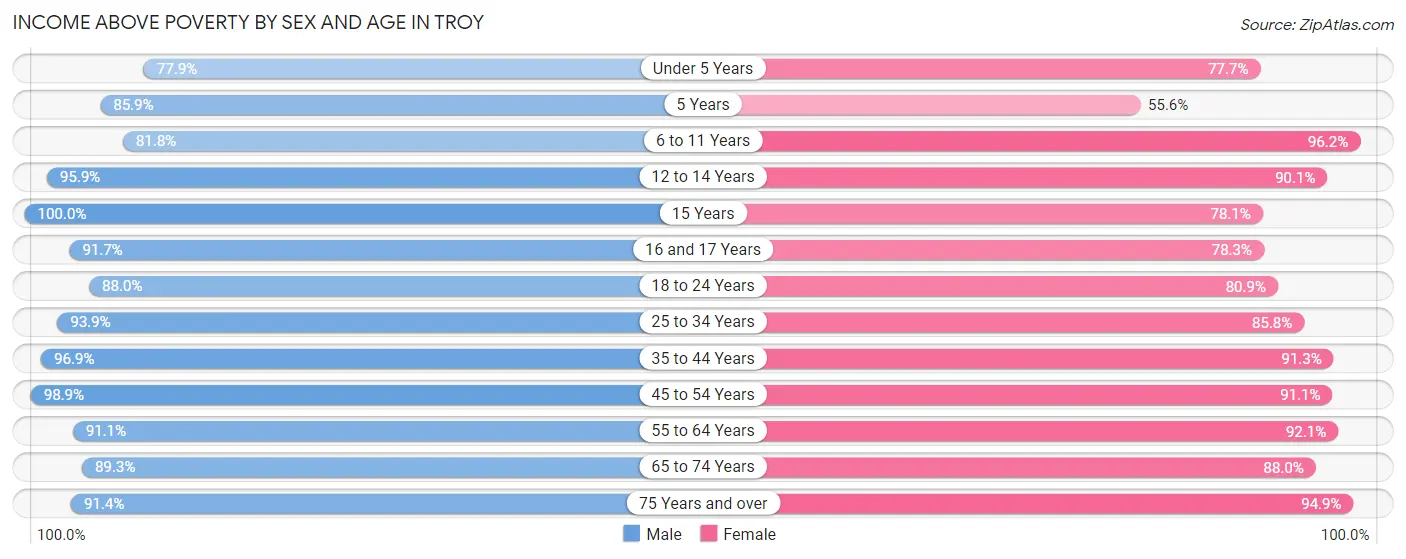
| Age Bracket | Male | Female |
| Under 5 Years | 492 (77.8%) | 605 (77.7%) |
| 5 Years | 373 (85.9%) | 50 (55.6%) |
| 6 to 11 Years | 851 (81.8%) | 909 (96.2%) |
| 12 to 14 Years | 393 (95.9%) | 755 (90.1%) |
| 15 Years | 153 (100.0%) | 132 (78.1%) |
| 16 and 17 Years | 473 (91.7%) | 253 (78.3%) |
| 18 to 24 Years | 1,103 (88.0%) | 814 (80.9%) |
| 25 to 34 Years | 1,530 (93.9%) | 1,353 (85.8%) |
| 35 to 44 Years | 1,861 (96.9%) | 1,757 (91.3%) |
| 45 to 54 Years | 1,639 (98.9%) | 1,556 (91.0%) |
| 55 to 64 Years | 1,119 (91.0%) | 1,584 (92.1%) |
| 65 to 74 Years | 796 (89.3%) | 1,160 (87.9%) |
| 75 Years and over | 805 (91.4%) | 1,106 (94.9%) |
| Total | 11,588 (91.6%) | 12,034 (88.7%) |
Income Below Poverty Among Married-Couple Families in Troy
The poverty statistics for married-couple families in Troy show that 2.5% or 130 of the total 5,110 families live below the poverty line. Families with 3 or 4 children have the highest poverty rate of 7.4%, comprising of 37 families. On the other hand, families with 5 or more children have the lowest poverty rate of 0.0%, which includes 0 families.
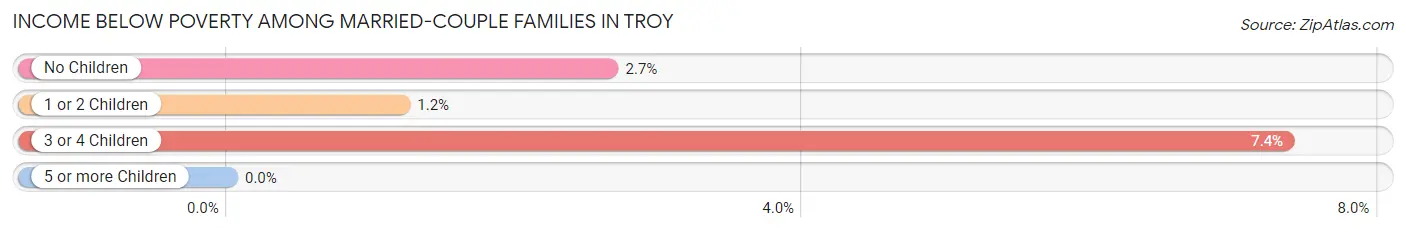
| Children | Above Poverty | Below Poverty |
| No Children | 2,532 (97.4%) | 69 (2.6%) |
| 1 or 2 Children | 1,971 (98.8%) | 24 (1.2%) |
| 3 or 4 Children | 466 (92.6%) | 37 (7.4%) |
| 5 or more Children | 11 (100.0%) | 0 (0.0%) |
| Total | 4,980 (97.5%) | 130 (2.5%) |
Income Below Poverty Among Single-Parent Households in Troy
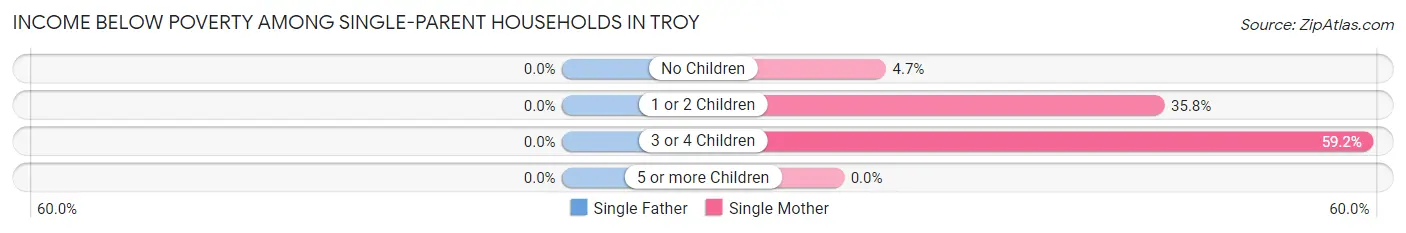
| Children | Single Father | Single Mother |
| No Children | 0 (0.0%) | 21 (4.7%) |
| 1 or 2 Children | 0 (0.0%) | 246 (35.8%) |
| 3 or 4 Children | 0 (0.0%) | 77 (59.2%) |
| 5 or more Children | 0 (0.0%) | 0 (0.0%) |
| Total | 0 (0.0%) | 344 (27.2%) |
Income Below Poverty Among Married-Couple vs Single-Parent Households in Troy
The poverty data for Troy shows that 130 of the married-couple family households (2.5%) and 344 of the single-parent households (19.5%) are living below the poverty level. Within the married-couple family households, those with 3 or 4 children have the highest poverty rate, with 37 households (7.4%) falling below the poverty line. Among the single-parent households, those with 3 or 4 children have the highest poverty rate, with 77 household (43.5%) living below poverty.
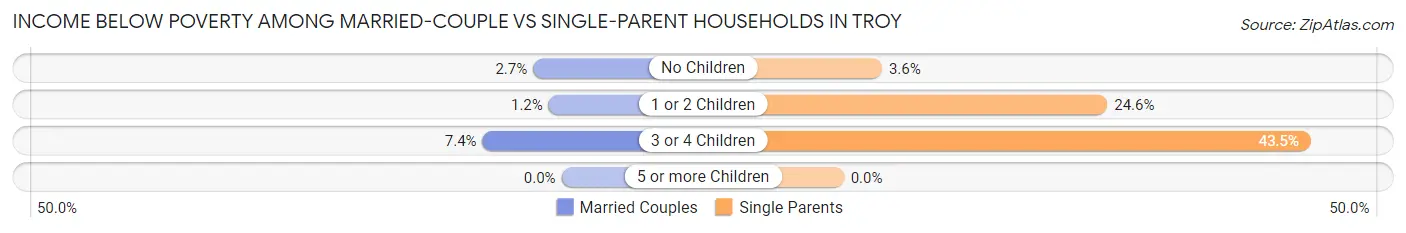
| Children | Married-Couple Families | Single-Parent Households |
| No Children | 69 (2.6%) | 21 (3.6%) |
| 1 or 2 Children | 24 (1.2%) | 246 (24.5%) |
| 3 or 4 Children | 37 (7.4%) | 77 (43.5%) |
| 5 or more Children | 0 (0.0%) | 0 (0.0%) |
| Total | 130 (2.5%) | 344 (19.5%) |
Race in Troy
The most populous races in Troy are White / Caucasian (22,720 | 85.8%), Two or more Races (1,625 | 6.1%), and Asian (1,209 | 4.6%).
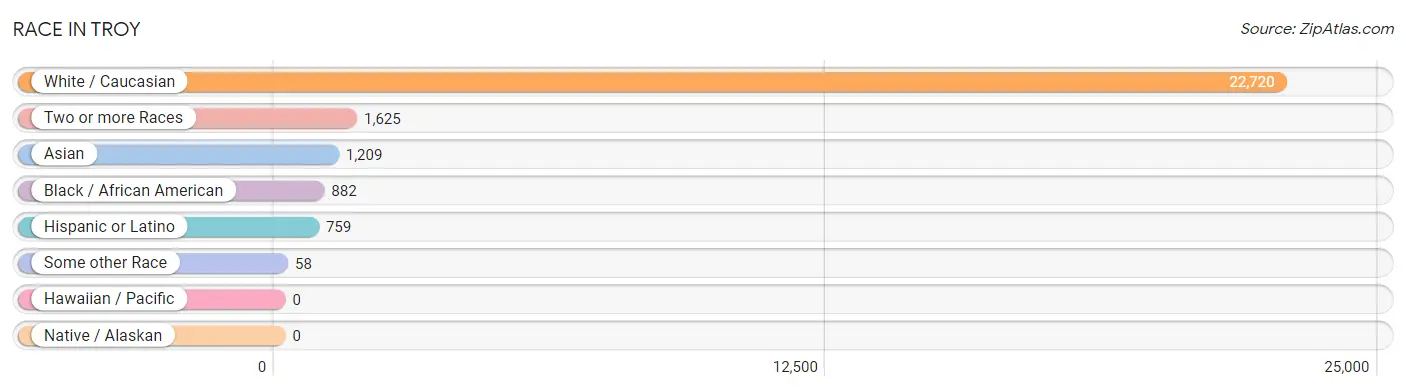
| Race | # Population | % Population |
| Asian | 1,209 | 4.6% |
| Black / African American | 882 | 3.3% |
| Hawaiian / Pacific | 0 | 0.0% |
| Hispanic or Latino | 759 | 2.9% |
| Native / Alaskan | 0 | 0.0% |
| White / Caucasian | 22,720 | 85.8% |
| Two or more Races | 1,625 | 6.1% |
| Some other Race | 58 | 0.2% |
| Total | 26,494 | 100.0% |
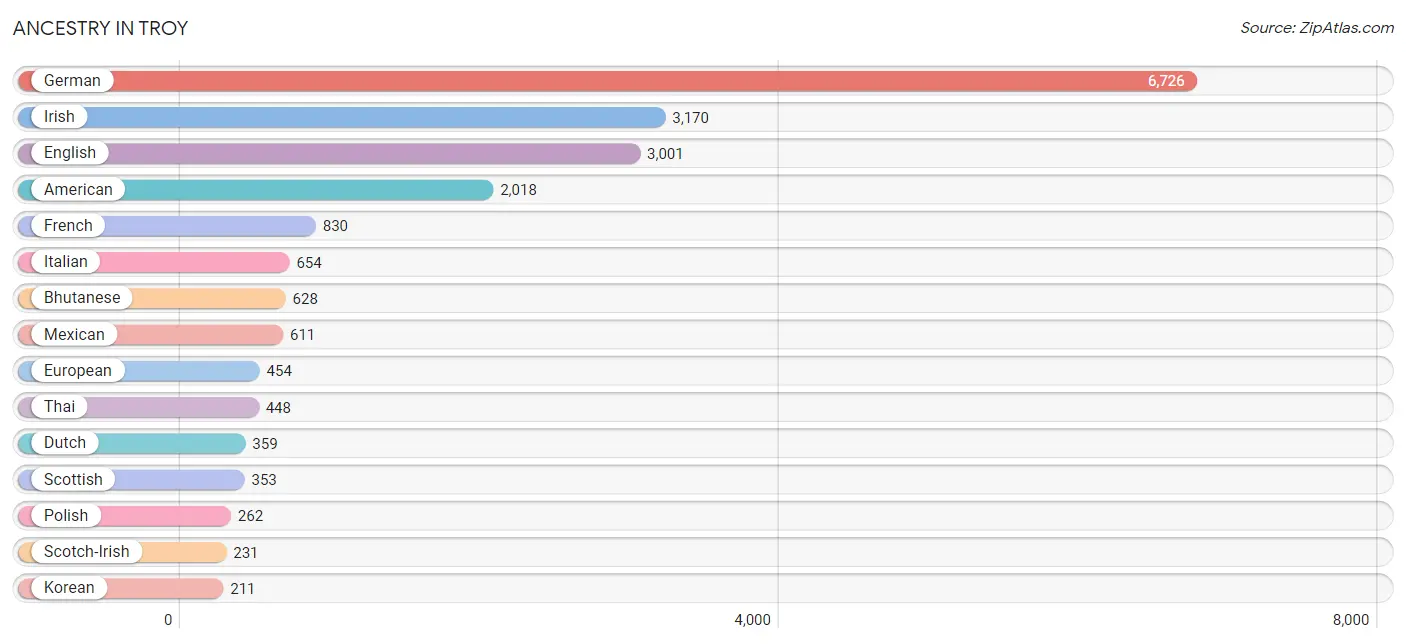
Ancestry in Troy
The most populous ancestries reported in Troy are German (6,726 | 25.4%), Irish (3,170 | 12.0%), English (3,001 | 11.3%), American (2,018 | 7.6%), and French (830 | 3.1%), together accounting for 59.4% of all Troy residents.
| Ancestry | # Population | % Population |
| African | 31 | 0.1% |
| American | 2,018 | 7.6% |
| Arab | 24 | 0.1% |
| Australian | 10 | 0.0% |
| Austrian | 24 | 0.1% |
| Belgian | 21 | 0.1% |
| Bhutanese | 628 | 2.4% |
| Blackfeet | 11 | 0.0% |
| British | 52 | 0.2% |
| Burmese | 15 | 0.1% |
| Canadian | 9 | 0.0% |
| Celtic | 12 | 0.1% |
| Central American | 47 | 0.2% |
| Cherokee | 4 | 0.0% |
| Chippewa | 1 | 0.0% |
| Colombian | 12 | 0.1% |
| Croatian | 19 | 0.1% |
| Czech | 26 | 0.1% |
| Czechoslovakian | 9 | 0.0% |
| Danish | 18 | 0.1% |
| Dutch | 359 | 1.4% |
| Eastern European | 26 | 0.1% |
| English | 3,001 | 11.3% |
| Ethiopian | 36 | 0.1% |
| European | 454 | 1.7% |
| French | 830 | 3.1% |
| French Canadian | 80 | 0.3% |
| German | 6,726 | 25.4% |
| Greek | 5 | 0.0% |
| Guamanian / Chamorro | 5 | 0.0% |
| Hungarian | 83 | 0.3% |
| Indian (Asian) | 69 | 0.3% |
| Irish | 3,170 | 12.0% |
| Italian | 654 | 2.5% |
| Jamaican | 9 | 0.0% |
| Korean | 211 | 0.8% |
| Lithuanian | 36 | 0.1% |
| Mexican | 611 | 2.3% |
| Nigerian | 58 | 0.2% |
| Norwegian | 73 | 0.3% |
| Ottawa | 21 | 0.1% |
| Pakistani | 50 | 0.2% |
| Palestinian | 24 | 0.1% |
| Pennsylvania German | 15 | 0.1% |
| Polish | 262 | 1.0% |
| Portuguese | 191 | 0.7% |
| Puerto Rican | 77 | 0.3% |
| Romanian | 18 | 0.1% |
| Russian | 57 | 0.2% |
| Salvadoran | 47 | 0.2% |
| Scandinavian | 77 | 0.3% |
| Scotch-Irish | 231 | 0.9% |
| Scottish | 353 | 1.3% |
| Serbian | 14 | 0.1% |
| Slavic | 5 | 0.0% |
| Slovak | 29 | 0.1% |
| South American | 12 | 0.1% |
| Subsaharan African | 125 | 0.5% |
| Swedish | 80 | 0.3% |
| Swiss | 73 | 0.3% |
| Thai | 448 | 1.7% |
| Ukrainian | 42 | 0.2% |
| Welsh | 164 | 0.6% | View All 63 Rows |
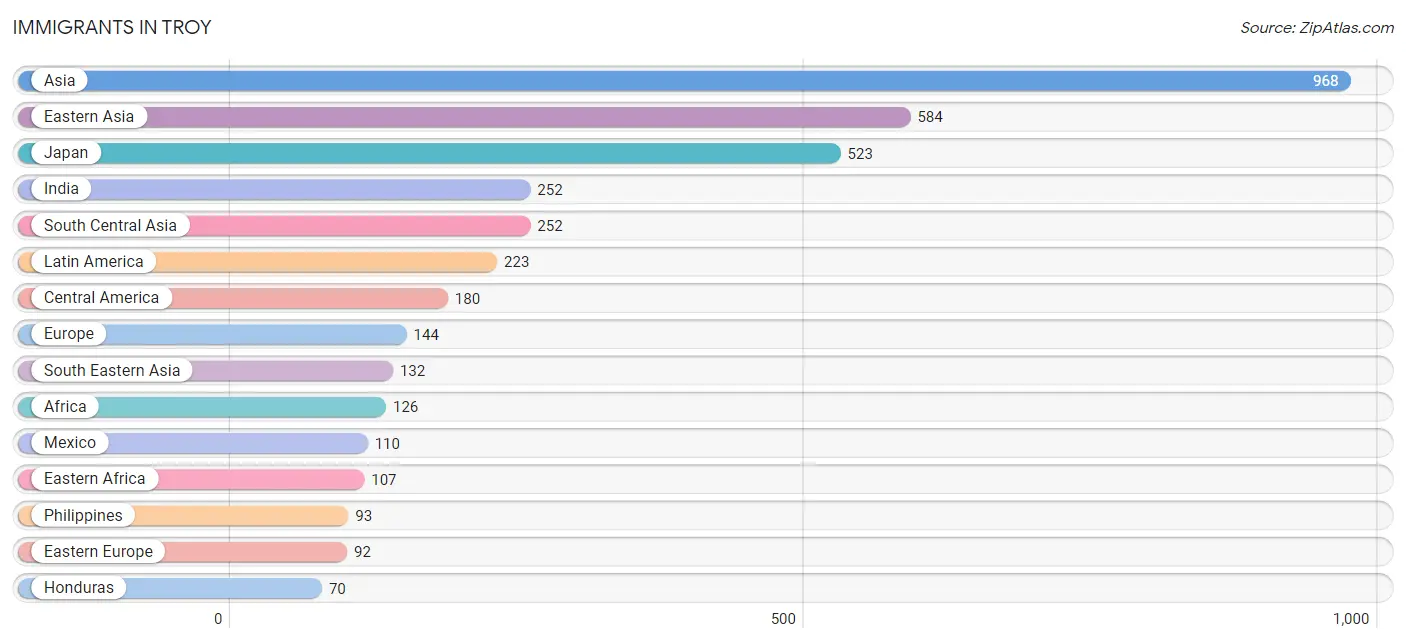
Immigrants in Troy
The most numerous immigrant groups reported in Troy came from Asia (968 | 3.6%), Eastern Asia (584 | 2.2%), Japan (523 | 2.0%), India (252 | 0.9%), and South Central Asia (252 | 0.9%), together accounting for 9.7% of all Troy residents.
| Immigration Origin | # Population | % Population |
| Africa | 126 | 0.5% |
| Asia | 968 | 3.6% |
| Canada | 59 | 0.2% |
| Caribbean | 31 | 0.1% |
| Central America | 180 | 0.7% |
| China | 61 | 0.2% |
| Colombia | 12 | 0.1% |
| Eastern Africa | 107 | 0.4% |
| Eastern Asia | 584 | 2.2% |
| Eastern Europe | 92 | 0.4% |
| Ethiopia | 36 | 0.1% |
| Europe | 144 | 0.5% |
| Honduras | 70 | 0.3% |
| Hong Kong | 30 | 0.1% |
| India | 252 | 0.9% |
| Jamaica | 31 | 0.1% |
| Japan | 523 | 2.0% |
| Kenya | 24 | 0.1% |
| Latin America | 223 | 0.8% |
| Mexico | 110 | 0.4% |
| Nigeria | 19 | 0.1% |
| Philippines | 93 | 0.4% |
| Poland | 26 | 0.1% |
| Portugal | 52 | 0.2% |
| Russia | 57 | 0.2% |
| Serbia | 9 | 0.0% |
| South America | 12 | 0.1% |
| South Central Asia | 252 | 0.9% |
| South Eastern Asia | 132 | 0.5% |
| Southern Europe | 52 | 0.2% |
| Thailand | 39 | 0.2% |
| Western Africa | 19 | 0.1% | View All 32 Rows |
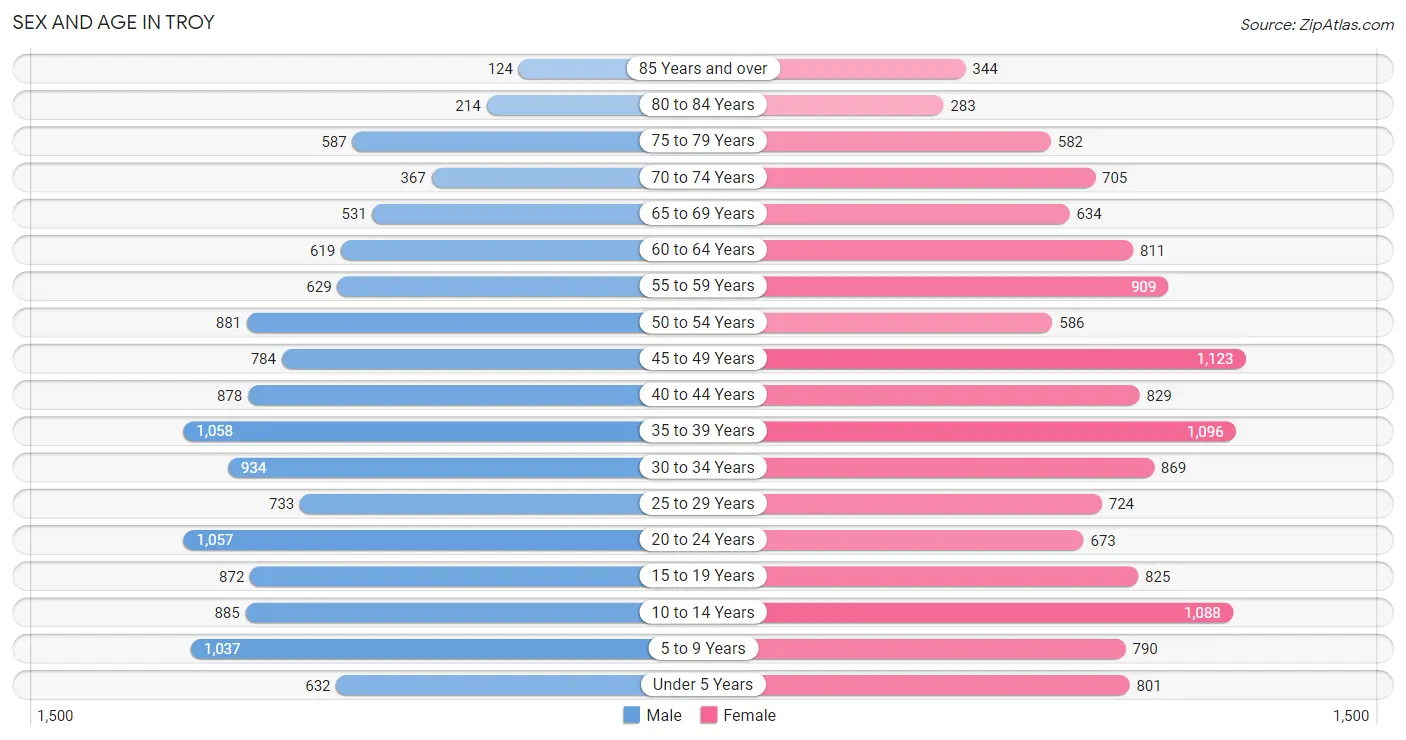
Sex and Age in Troy
Sex and Age in Troy
The most populous age groups in Troy are 35 to 39 Years (1,058 | 8.3%) for men and 45 to 49 Years (1,123 | 8.2%) for women.
| Age Bracket | Male | Female |
| Under 5 Years | 632 (4.9%) | 801 (5.9%) |
| 5 to 9 Years | 1,037 (8.1%) | 790 (5.8%) |
| 10 to 14 Years | 885 (6.9%) | 1,088 (8.0%) |
| 15 to 19 Years | 872 (6.8%) | 825 (6.0%) |
| 20 to 24 Years | 1,057 (8.2%) | 673 (4.9%) |
| 25 to 29 Years | 733 (5.7%) | 724 (5.3%) |
| 30 to 34 Years | 934 (7.3%) | 869 (6.4%) |
| 35 to 39 Years | 1,058 (8.3%) | 1,096 (8.0%) |
| 40 to 44 Years | 878 (6.9%) | 829 (6.1%) |
| 45 to 49 Years | 784 (6.1%) | 1,123 (8.2%) |
| 50 to 54 Years | 881 (6.9%) | 586 (4.3%) |
| 55 to 59 Years | 629 (4.9%) | 909 (6.7%) |
| 60 to 64 Years | 619 (4.8%) | 811 (5.9%) |
| 65 to 69 Years | 531 (4.1%) | 634 (4.6%) |
| 70 to 74 Years | 367 (2.9%) | 705 (5.2%) |
| 75 to 79 Years | 587 (4.6%) | 582 (4.3%) |
| 80 to 84 Years | 214 (1.7%) | 283 (2.1%) |
| 85 Years and over | 124 (1.0%) | 344 (2.5%) |
| Total | 12,822 (100.0%) | 13,672 (100.0%) |
Families and Households in Troy
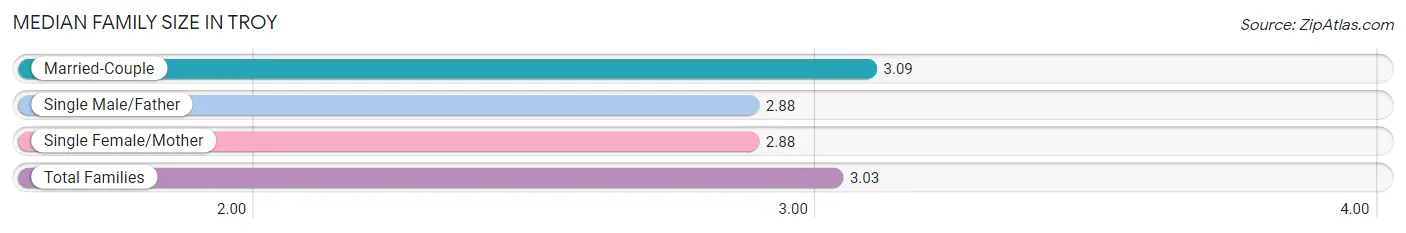
Median Family Size in Troy
The median family size in Troy is 3.03 persons per family, with married-couple families (5,110 | 74.3%) accounting for the largest median family size of 3.09 persons per family. On the other hand, single male/father families (503 | 7.3%) represent the smallest median family size with 2.88 persons per family.
| Family Type | # Families | Family Size |
| Married-Couple | 5,110 (74.3%) | 3.09 |
| Single Male/Father | 503 (7.3%) | 2.88 |
| Single Female/Mother | 1,265 (18.4%) | 2.88 |
| Total Families | 6,878 (100.0%) | 3.03 |
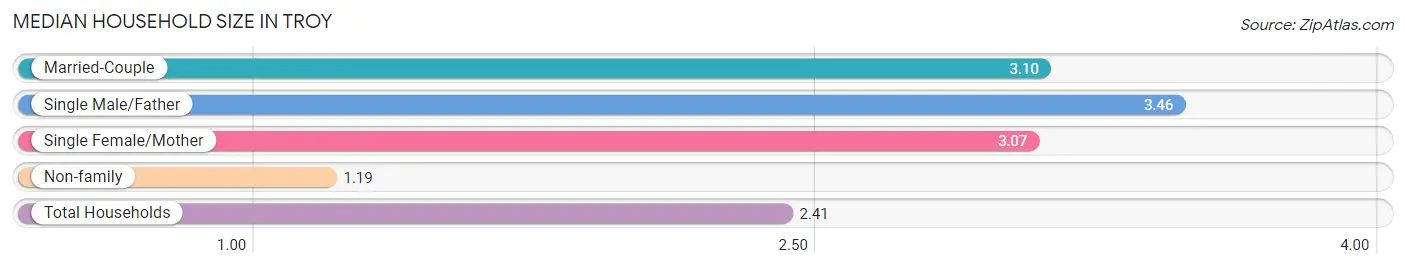
Median Household Size in Troy
The median household size in Troy is 2.41 persons per household, with single male/father households (503 | 4.6%) accounting for the largest median household size of 3.46 persons per household. non-family households (3,996 | 36.7%) represent the smallest median household size with 1.19 persons per household.
| Household Type | # Households | Household Size |
| Married-Couple | 5,110 (47.0%) | 3.10 |
| Single Male/Father | 503 (4.6%) | 3.46 |
| Single Female/Mother | 1,265 (11.6%) | 3.07 |
| Non-family | 3,996 (36.7%) | 1.19 |
| Total Households | 10,874 (100.0%) | 2.41 |
Household Size by Marriage Status in Troy
Out of a total of 10,874 households in Troy, 6,878 (63.2%) are family households, while 3,996 (36.7%) are nonfamily households. The most numerous type of family households are 2-person households, comprising 2,839, and the most common type of nonfamily households are 1-person households, comprising 3,321.
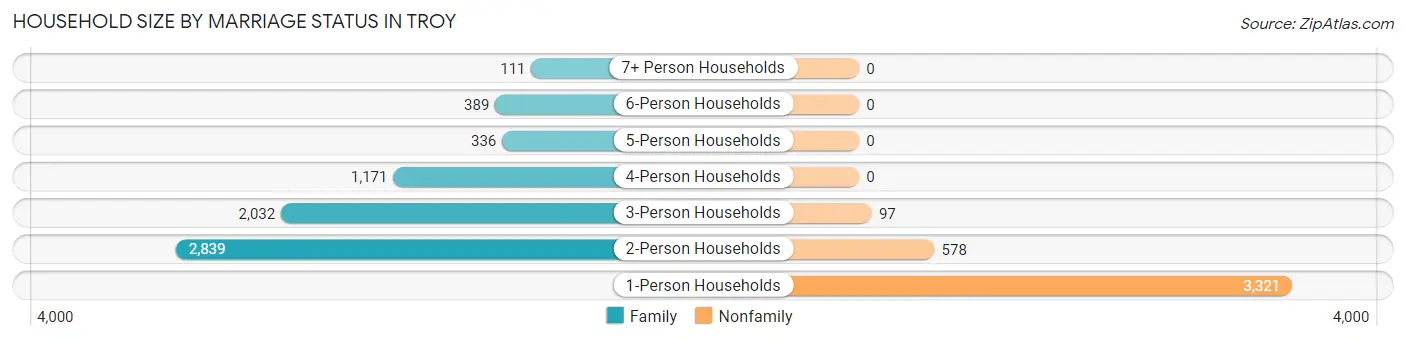
| Household Size | Family Households | Nonfamily Households |
| 1-Person Households | - | 3,321 (30.5%) |
| 2-Person Households | 2,839 (26.1%) | 578 (5.3%) |
| 3-Person Households | 2,032 (18.7%) | 97 (0.9%) |
| 4-Person Households | 1,171 (10.8%) | 0 (0.0%) |
| 5-Person Households | 336 (3.1%) | 0 (0.0%) |
| 6-Person Households | 389 (3.6%) | 0 (0.0%) |
| 7+ Person Households | 111 (1.0%) | 0 (0.0%) |
| Total | 6,878 (63.2%) | 3,996 (36.7%) |
Female Fertility in Troy
Fertility by Age in Troy
Average fertility rate in Troy is 84.0 births per 1,000 women. Women in the age bracket of 20 to 34 years have the highest fertility rate with 149.0 births per 1,000 women. Women in the age bracket of 20 to 34 years acount for 64.0% of all women with births.
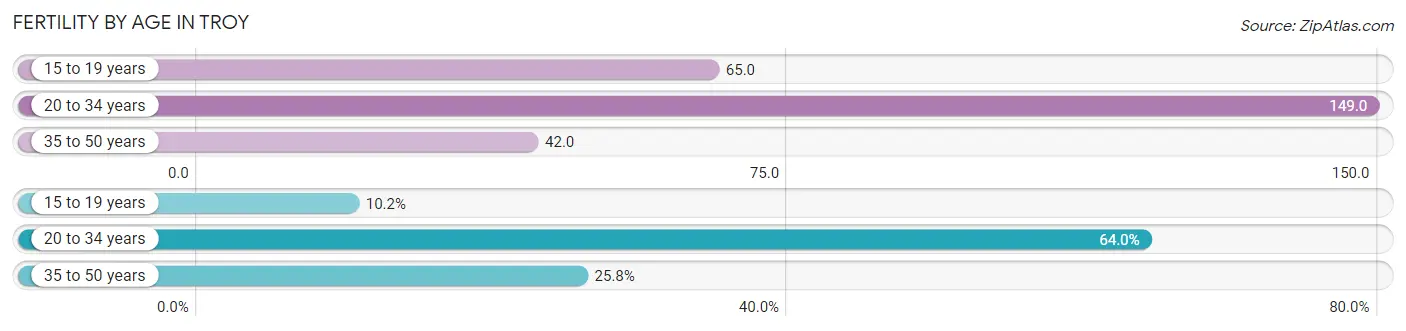
| Age Bracket | Women with Births | Births / 1,000 Women |
| 15 to 19 years | 54 (10.2%) | 65.0 |
| 20 to 34 years | 338 (64.0%) | 149.0 |
| 35 to 50 years | 136 (25.8%) | 42.0 |
| Total | 528 (100.0%) | 84.0 |
Fertility by Age by Marriage Status in Troy
65.3% of women with births (528) in Troy are married. The highest percentage of unmarried women with births falls into 15 to 19 years age bracket with 100.0% of them unmarried at the time of birth, while the lowest percentage of unmarried women with births belong to 35 to 50 years age bracket with 27.2% of them unmarried.
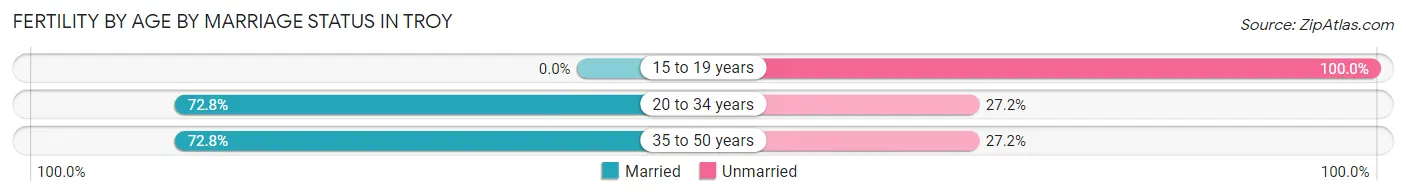
| Age Bracket | Married | Unmarried |
| 15 to 19 years | 0 (0.0%) | 54 (100.0%) |
| 20 to 34 years | 246 (72.8%) | 92 (27.2%) |
| 35 to 50 years | 99 (72.8%) | 37 (27.2%) |
| Total | 345 (65.3%) | 183 (34.7%) |
Fertility by Education in Troy
Average fertility rate in Troy is 84.0 births per 1,000 women. Women with the education attainment of high school diploma have the highest fertility rate of 173.0 births per 1,000 women, while women with the education attainment of college or associate's degree have the lowest fertility at 14.0 births per 1,000 women. Women with the education attainment of high school diploma represent 42.4% of all women with births.
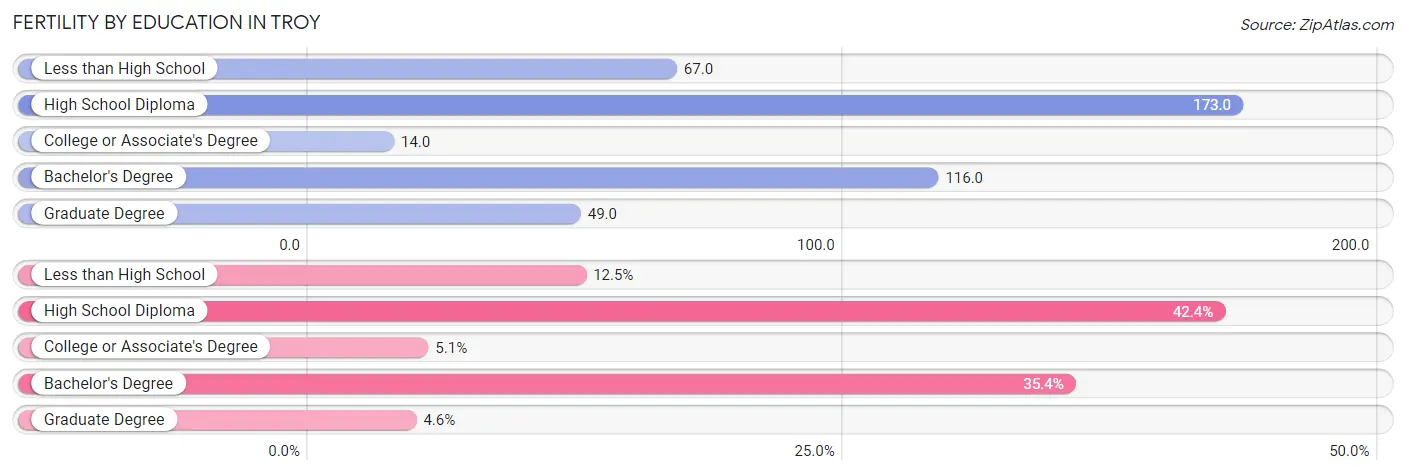
| Educational Attainment | Women with Births | Births / 1,000 Women |
| Less than High School | 66 (12.5%) | 67.0 |
| High School Diploma | 224 (42.4%) | 173.0 |
| College or Associate's Degree | 27 (5.1%) | 14.0 |
| Bachelor's Degree | 187 (35.4%) | 116.0 |
| Graduate Degree | 24 (4.5%) | 49.0 |
| Total | 528 (100.0%) | 84.0 |
Fertility by Education by Marriage Status in Troy
34.7% of women with births in Troy are unmarried. Women with the educational attainment of graduate degree are most likely to be married with 100.0% of them married at childbirth, while women with the educational attainment of college or associate's degree are least likely to be married with 66.7% of them unmarried at childbirth.
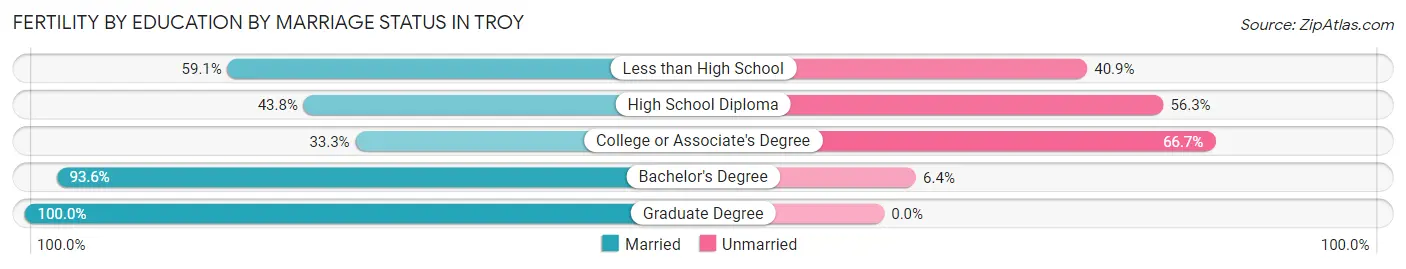
| Educational Attainment | Married | Unmarried |
| Less than High School | 39 (59.1%) | 27 (40.9%) |
| High School Diploma | 98 (43.8%) | 126 (56.2%) |
| College or Associate's Degree | 9 (33.3%) | 18 (66.7%) |
| Bachelor's Degree | 175 (93.6%) | 12 (6.4%) |
| Graduate Degree | 24 (100.0%) | 0 (0.0%) |
| Total | 345 (65.3%) | 183 (34.7%) |
Employment Characteristics in Troy
Employment by Class of Employer in Troy
Among the 13,233 employed individuals in Troy, private company employees (10,051 | 75.9%), not-for-profit organizations (1,047 | 7.9%), and local government employees (1,031 | 7.8%) make up the most common classes of employment.
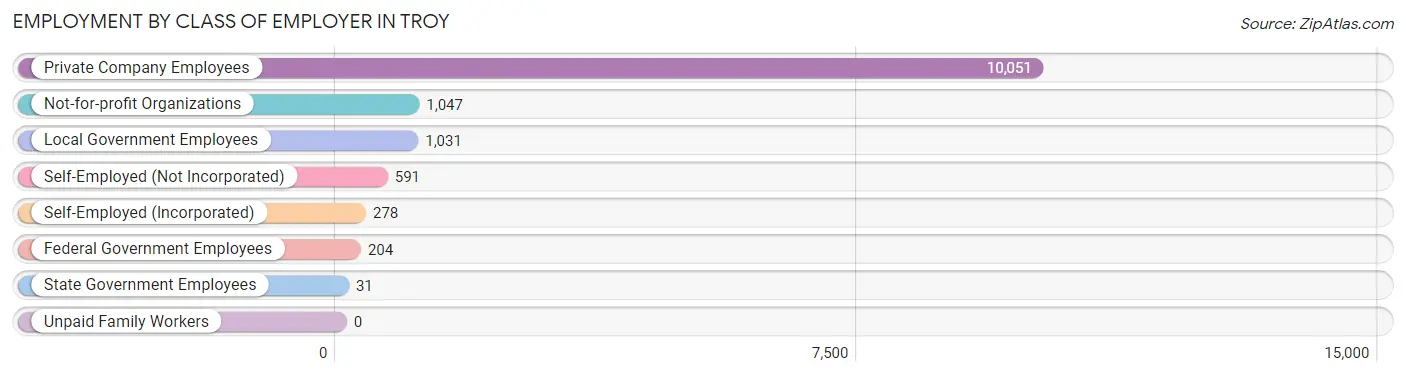
| Employer Class | # Employees | % Employees |
| Private Company Employees | 10,051 | 75.9% |
| Self-Employed (Incorporated) | 278 | 2.1% |
| Self-Employed (Not Incorporated) | 591 | 4.5% |
| Not-for-profit Organizations | 1,047 | 7.9% |
| Local Government Employees | 1,031 | 7.8% |
| State Government Employees | 31 | 0.2% |
| Federal Government Employees | 204 | 1.5% |
| Unpaid Family Workers | 0 | 0.0% |
| Total | 13,233 | 100.0% |
Employment Status by Age in Troy
According to the labor force statistics for Troy, out of the total population over 16 years of age (20,939), 67.4% or 14,113 individuals are in the labor force, with 5.0% or 706 of them unemployed. The age group with the highest labor force participation rate is 45 to 54 years, with 90.2% or 3,043 individuals in the labor force. Within the labor force, the 20 to 24 years age range has the highest percentage of unemployed individuals, with 12.2% or 186 of them being unemployed.
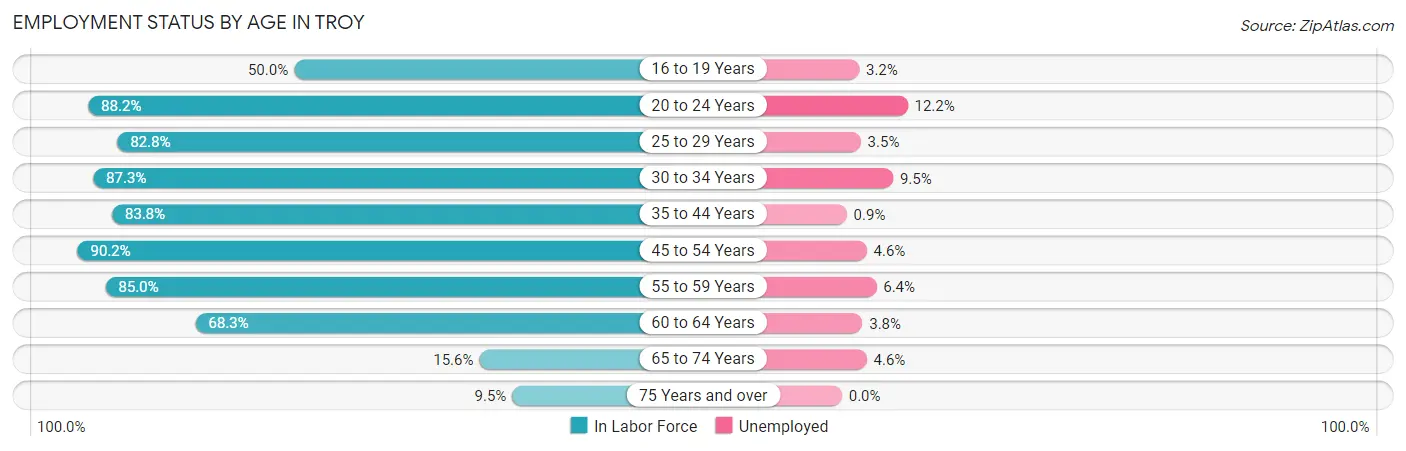
| Age Bracket | In Labor Force | Unemployed |
| 16 to 19 Years | 688 (50.0%) | 22 (3.2%) |
| 20 to 24 Years | 1,526 (88.2%) | 186 (12.2%) |
| 25 to 29 Years | 1,206 (82.8%) | 42 (3.5%) |
| 30 to 34 Years | 1,574 (87.3%) | 150 (9.5%) |
| 35 to 44 Years | 3,236 (83.8%) | 29 (0.9%) |
| 45 to 54 Years | 3,043 (90.2%) | 140 (4.6%) |
| 55 to 59 Years | 1,307 (85.0%) | 84 (6.4%) |
| 60 to 64 Years | 977 (68.3%) | 37 (3.8%) |
| 65 to 74 Years | 349 (15.6%) | 16 (4.6%) |
| 75 Years and over | 203 (9.5%) | 0 (0.0%) |
| Total | 14,113 (67.4%) | 706 (5.0%) |
Employment Status by Educational Attainment in Troy
According to labor force statistics for Troy, 84.2% of individuals (11,336) out of the total population between 25 and 64 years of age (13,463) are in the labor force, with 4.2% or 476 of them being unemployed. The group with the highest labor force participation rate are those with the educational attainment of college / associate degree, with 89.1% or 3,801 individuals in the labor force. Within the labor force, individuals with high school diploma education have the highest percentage of unemployment, with 8.3% or 244 of them being unemployed.
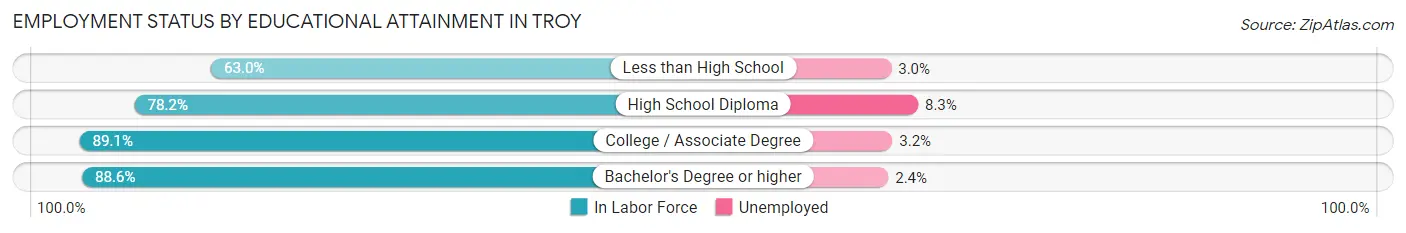
| Educational Attainment | In Labor Force | Unemployed |
| Less than High School | 531 (63.0%) | 25 (3.0%) |
| High School Diploma | 2,938 (78.2%) | 312 (8.3%) |
| College / Associate Degree | 3,801 (89.1%) | 137 (3.2%) |
| Bachelor's Degree or higher | 4,073 (88.6%) | 110 (2.4%) |
| Total | 11,336 (84.2%) | 565 (4.2%) |
Employment Occupations by Sex in Troy
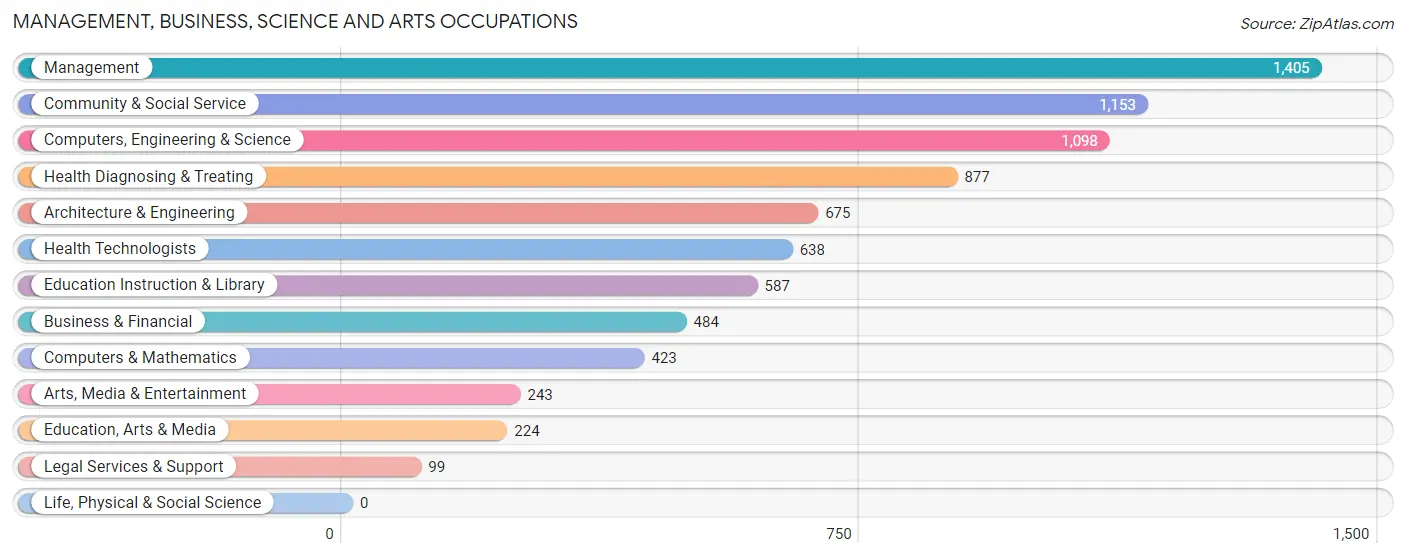
Management, Business, Science and Arts Occupations
The most common Management, Business, Science and Arts occupations in Troy are Management (1,405 | 10.5%), Community & Social Service (1,153 | 8.7%), Computers, Engineering & Science (1,098 | 8.2%), Health Diagnosing & Treating (877 | 6.6%), and Architecture & Engineering (675 | 5.1%).
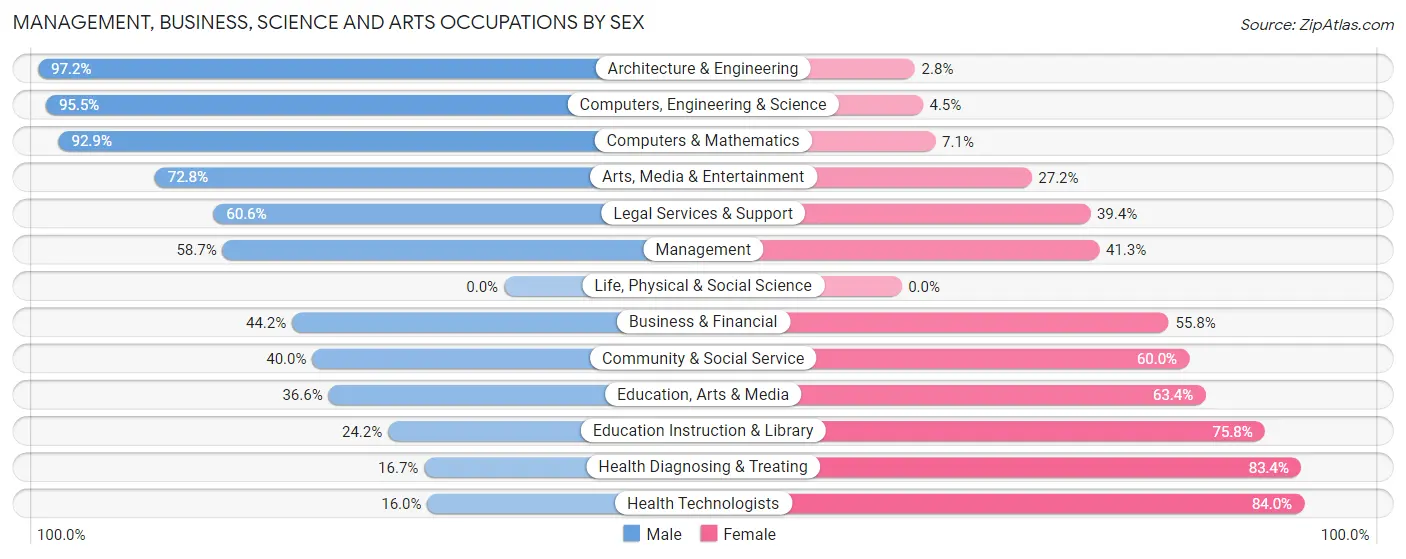
Management, Business, Science and Arts Occupations by Sex
Within the Management, Business, Science and Arts occupations in Troy, the most male-oriented occupations are Architecture & Engineering (97.2%), Computers, Engineering & Science (95.5%), and Computers & Mathematics (92.9%), while the most female-oriented occupations are Health Technologists (84.0%), Health Diagnosing & Treating (83.4%), and Education Instruction & Library (75.8%).
| Occupation | Male | Female |
| Management | 825 (58.7%) | 580 (41.3%) |
| Business & Financial | 214 (44.2%) | 270 (55.8%) |
| Computers, Engineering & Science | 1,049 (95.5%) | 49 (4.5%) |
| Computers & Mathematics | 393 (92.9%) | 30 (7.1%) |
| Architecture & Engineering | 656 (97.2%) | 19 (2.8%) |
| Life, Physical & Social Science | 0 (0.0%) | 0 (0.0%) |
| Community & Social Service | 461 (40.0%) | 692 (60.0%) |
| Education, Arts & Media | 82 (36.6%) | 142 (63.4%) |
| Legal Services & Support | 60 (60.6%) | 39 (39.4%) |
| Education Instruction & Library | 142 (24.2%) | 445 (75.8%) |
| Arts, Media & Entertainment | 177 (72.8%) | 66 (27.2%) |
| Health Diagnosing & Treating | 146 (16.7%) | 731 (83.4%) |
| Health Technologists | 102 (16.0%) | 536 (84.0%) |
| Total (Category) | 2,695 (53.7%) | 2,322 (46.3%) |
| Total (Overall) | 7,128 (53.5%) | 6,192 (46.5%) |
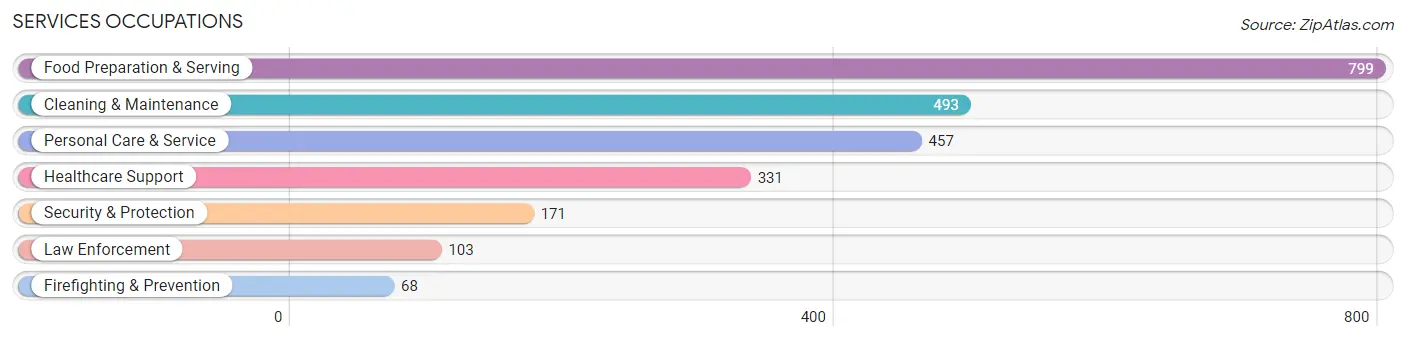
Services Occupations
The most common Services occupations in Troy are Food Preparation & Serving (799 | 6.0%), Cleaning & Maintenance (493 | 3.7%), Personal Care & Service (457 | 3.4%), Healthcare Support (331 | 2.5%), and Security & Protection (171 | 1.3%).
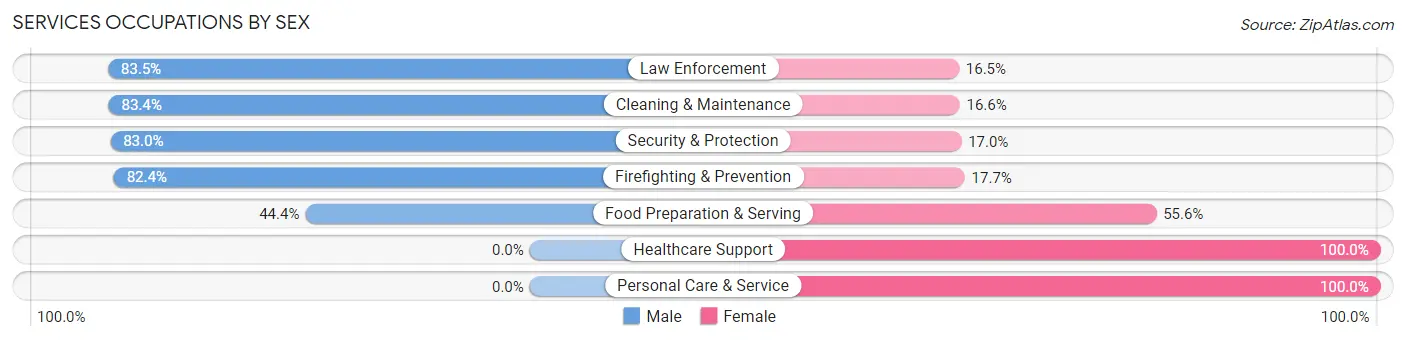
Services Occupations by Sex
Within the Services occupations in Troy, the most male-oriented occupations are Law Enforcement (83.5%), Cleaning & Maintenance (83.4%), and Security & Protection (83.0%), while the most female-oriented occupations are Healthcare Support (100.0%), Personal Care & Service (100.0%), and Food Preparation & Serving (55.6%).
| Occupation | Male | Female |
| Healthcare Support | 0 (0.0%) | 331 (100.0%) |
| Security & Protection | 142 (83.0%) | 29 (17.0%) |
| Firefighting & Prevention | 56 (82.4%) | 12 (17.6%) |
| Law Enforcement | 86 (83.5%) | 17 (16.5%) |
| Food Preparation & Serving | 355 (44.4%) | 444 (55.6%) |
| Cleaning & Maintenance | 411 (83.4%) | 82 (16.6%) |
| Personal Care & Service | 0 (0.0%) | 457 (100.0%) |
| Total (Category) | 908 (40.3%) | 1,343 (59.7%) |
| Total (Overall) | 7,128 (53.5%) | 6,192 (46.5%) |
Sales and Office Occupations
The most common Sales and Office occupations in Troy are Office & Administration (1,600 | 12.0%), and Sales & Related (1,026 | 7.7%).
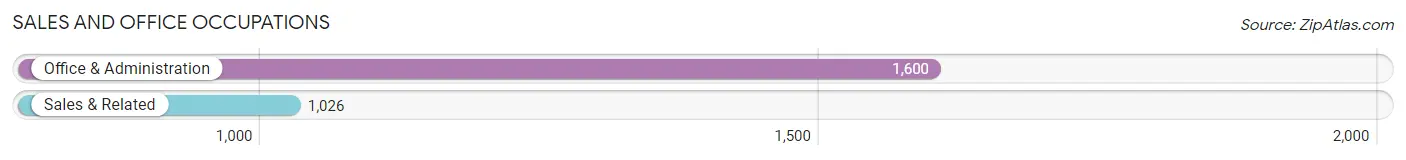
Sales and Office Occupations by Sex
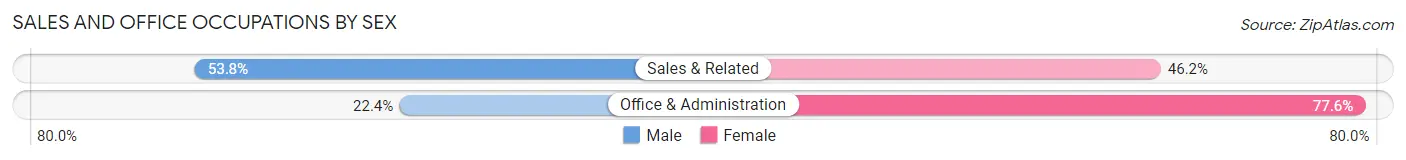
| Occupation | Male | Female |
| Sales & Related | 552 (53.8%) | 474 (46.2%) |
| Office & Administration | 358 (22.4%) | 1,242 (77.6%) |
| Total (Category) | 910 (34.6%) | 1,716 (65.3%) |
| Total (Overall) | 7,128 (53.5%) | 6,192 (46.5%) |
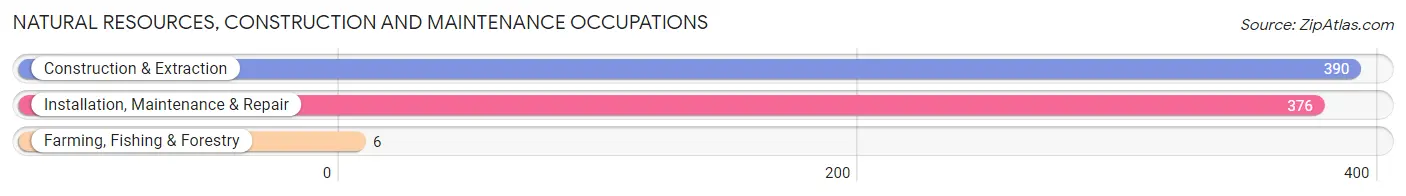
Natural Resources, Construction and Maintenance Occupations
The most common Natural Resources, Construction and Maintenance occupations in Troy are Construction & Extraction (390 | 2.9%), Installation, Maintenance & Repair (376 | 2.8%), and Farming, Fishing & Forestry (6 | 0.1%).
Natural Resources, Construction and Maintenance Occupations by Sex

| Occupation | Male | Female |
| Farming, Fishing & Forestry | 6 (100.0%) | 0 (0.0%) |
| Construction & Extraction | 263 (67.4%) | 127 (32.6%) |
| Installation, Maintenance & Repair | 376 (100.0%) | 0 (0.0%) |
| Total (Category) | 645 (83.6%) | 127 (16.5%) |
| Total (Overall) | 7,128 (53.5%) | 6,192 (46.5%) |
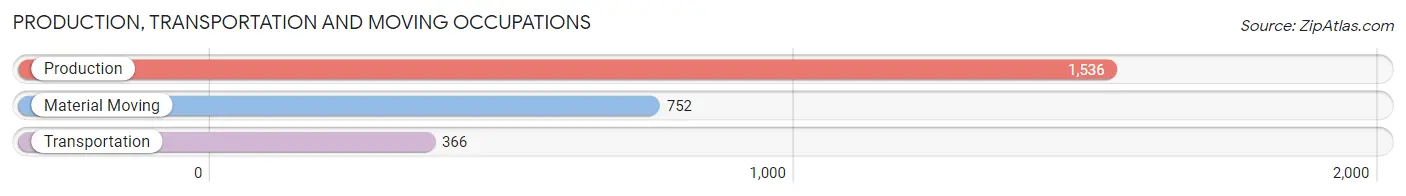
Production, Transportation and Moving Occupations
The most common Production, Transportation and Moving occupations in Troy are Production (1,536 | 11.5%), Material Moving (752 | 5.7%), and Transportation (366 | 2.8%).
Production, Transportation and Moving Occupations by Sex
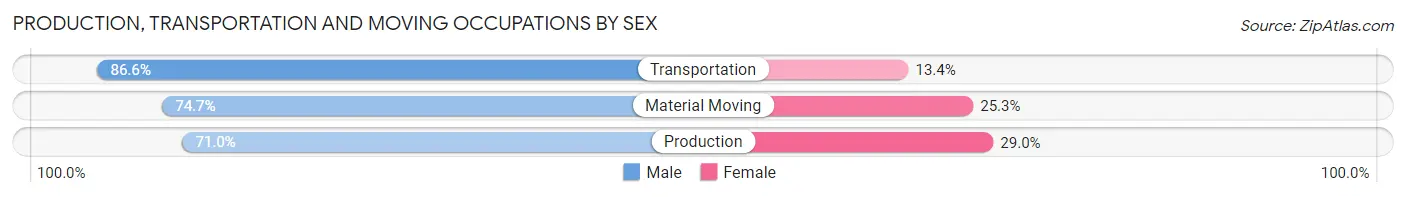
| Occupation | Male | Female |
| Production | 1,091 (71.0%) | 445 (29.0%) |
| Transportation | 317 (86.6%) | 49 (13.4%) |
| Material Moving | 562 (74.7%) | 190 (25.3%) |
| Total (Category) | 1,970 (74.2%) | 684 (25.8%) |
| Total (Overall) | 7,128 (53.5%) | 6,192 (46.5%) |
Employment Industries by Sex in Troy
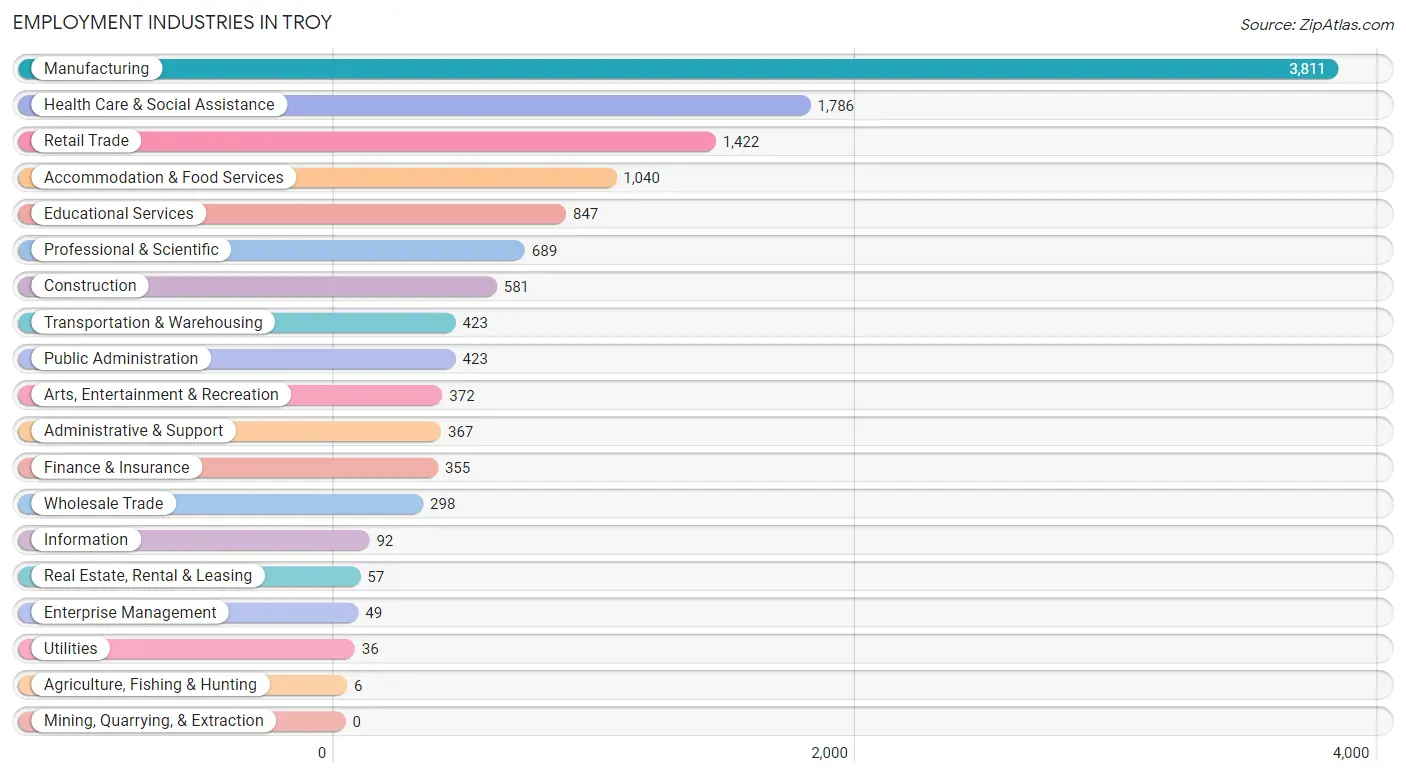
Employment Industries in Troy
The major employment industries in Troy include Manufacturing (3,811 | 28.6%), Health Care & Social Assistance (1,786 | 13.4%), Retail Trade (1,422 | 10.7%), Accommodation & Food Services (1,040 | 7.8%), and Educational Services (847 | 6.4%).
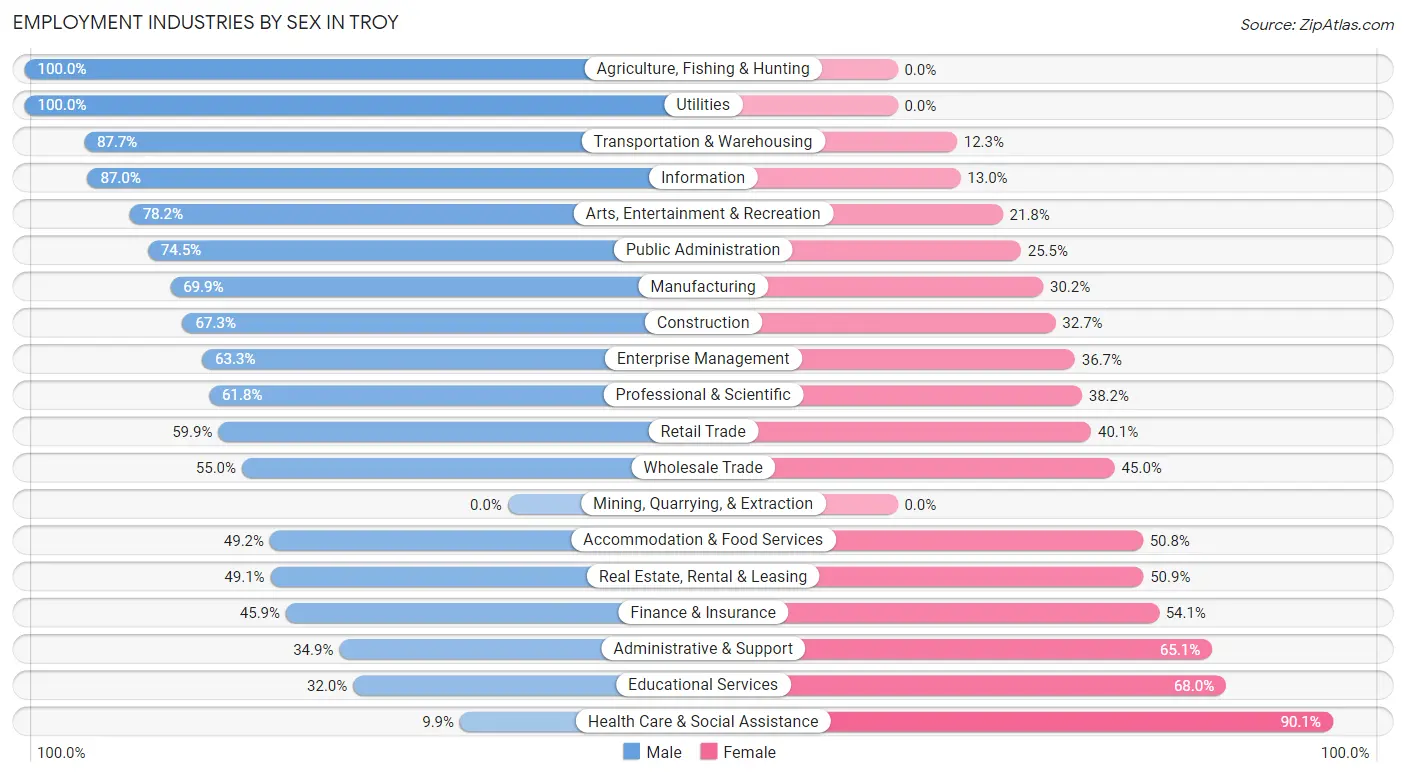
Employment Industries by Sex in Troy
The Troy industries that see more men than women are Agriculture, Fishing & Hunting (100.0%), Utilities (100.0%), and Transportation & Warehousing (87.7%), whereas the industries that tend to have a higher number of women are Health Care & Social Assistance (90.1%), Educational Services (68.0%), and Administrative & Support (65.1%).
| Industry | Male | Female |
| Agriculture, Fishing & Hunting | 6 (100.0%) | 0 (0.0%) |
| Mining, Quarrying, & Extraction | 0 (0.0%) | 0 (0.0%) |
| Construction | 391 (67.3%) | 190 (32.7%) |
| Manufacturing | 2,662 (69.9%) | 1,149 (30.1%) |
| Wholesale Trade | 164 (55.0%) | 134 (45.0%) |
| Retail Trade | 852 (59.9%) | 570 (40.1%) |
| Transportation & Warehousing | 371 (87.7%) | 52 (12.3%) |
| Utilities | 36 (100.0%) | 0 (0.0%) |
| Information | 80 (87.0%) | 12 (13.0%) |
| Finance & Insurance | 163 (45.9%) | 192 (54.1%) |
| Real Estate, Rental & Leasing | 28 (49.1%) | 29 (50.9%) |
| Professional & Scientific | 426 (61.8%) | 263 (38.2%) |
| Enterprise Management | 31 (63.3%) | 18 (36.7%) |
| Administrative & Support | 128 (34.9%) | 239 (65.1%) |
| Educational Services | 271 (32.0%) | 576 (68.0%) |
| Health Care & Social Assistance | 177 (9.9%) | 1,609 (90.1%) |
| Arts, Entertainment & Recreation | 291 (78.2%) | 81 (21.8%) |
| Accommodation & Food Services | 512 (49.2%) | 528 (50.8%) |
| Public Administration | 315 (74.5%) | 108 (25.5%) |
| Total | 7,128 (53.5%) | 6,192 (46.5%) |
Education in Troy
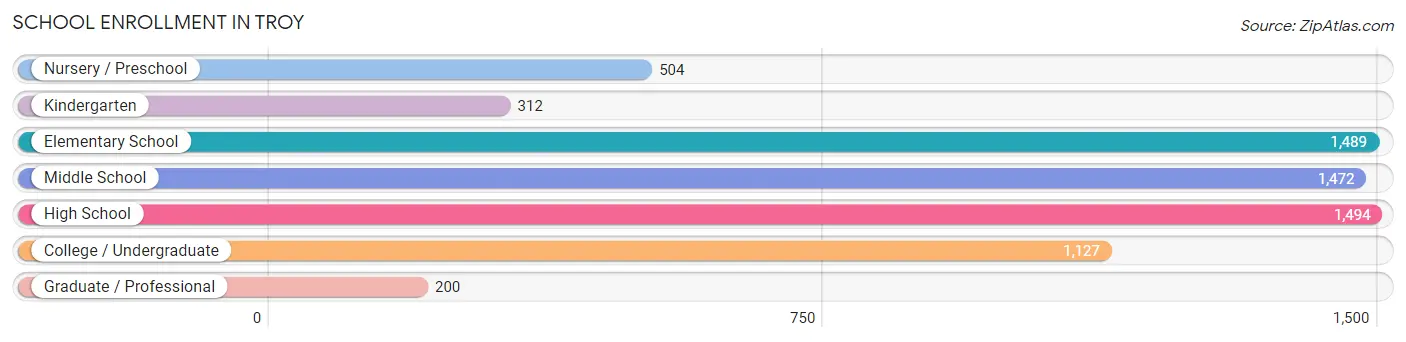
School Enrollment in Troy
The most common levels of schooling among the 6,598 students in Troy are high school (1,494 | 22.6%), elementary school (1,489 | 22.6%), and middle school (1,472 | 22.3%).
| School Level | # Students | % Students |
| Nursery / Preschool | 504 | 7.6% |
| Kindergarten | 312 | 4.7% |
| Elementary School | 1,489 | 22.6% |
| Middle School | 1,472 | 22.3% |
| High School | 1,494 | 22.6% |
| College / Undergraduate | 1,127 | 17.1% |
| Graduate / Professional | 200 | 3.0% |
| Total | 6,598 | 100.0% |
School Enrollment by Age by Funding Source in Troy
Out of a total of 6,598 students who are enrolled in schools in Troy, 779 (11.8%) attend a private institution, while the remaining 5,819 (88.2%) are enrolled in public schools. The age group of 3 to 4 year olds has the highest likelihood of being enrolled in private schools, with 90 (33.5% in the age bracket) enrolled. Conversely, the age group of 20 to 24 year olds has the lowest likelihood of being enrolled in a private school, with 525 (100.0% in the age bracket) attending a public institution.
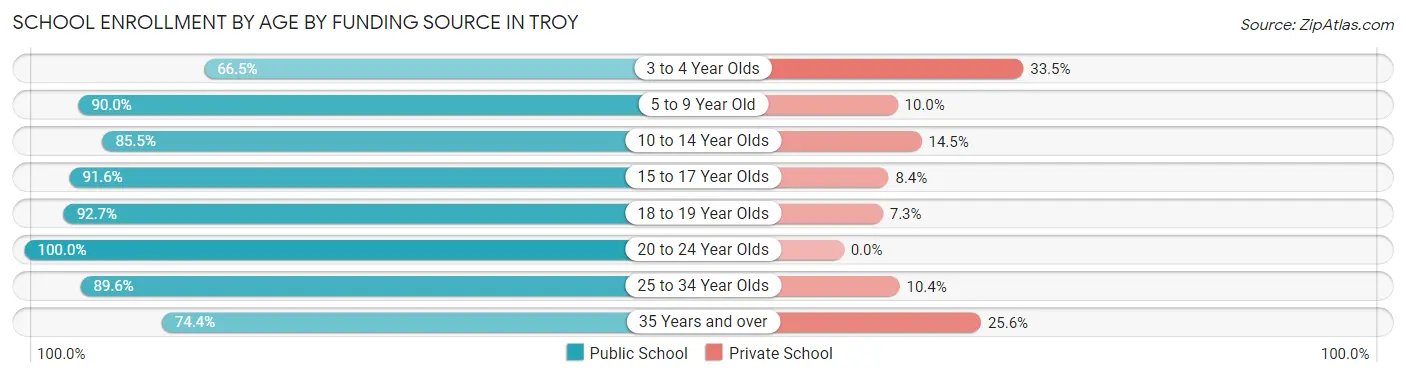
| Age Bracket | Public School | Private School |
| 3 to 4 Year Olds | 179 (66.5%) | 90 (33.5%) |
| 5 to 9 Year Old | 1,559 (90.0%) | 174 (10.0%) |
| 10 to 14 Year Olds | 1,655 (85.5%) | 281 (14.5%) |
| 15 to 17 Year Olds | 1,041 (91.6%) | 95 (8.4%) |
| 18 to 19 Year Olds | 394 (92.7%) | 31 (7.3%) |
| 20 to 24 Year Olds | 525 (100.0%) | 0 (0.0%) |
| 25 to 34 Year Olds | 241 (89.6%) | 28 (10.4%) |
| 35 Years and over | 227 (74.4%) | 78 (25.6%) |
| Total | 5,819 (88.2%) | 779 (11.8%) |
Educational Attainment by Field of Study in Troy
Business (1,292 | 21.6%), education (894 | 15.0%), engineering (767 | 12.8%), science & technology (665 | 11.1%), and arts & humanities (359 | 6.0%) are the most common fields of study among 5,972 individuals in Troy who have obtained a bachelor's degree or higher.
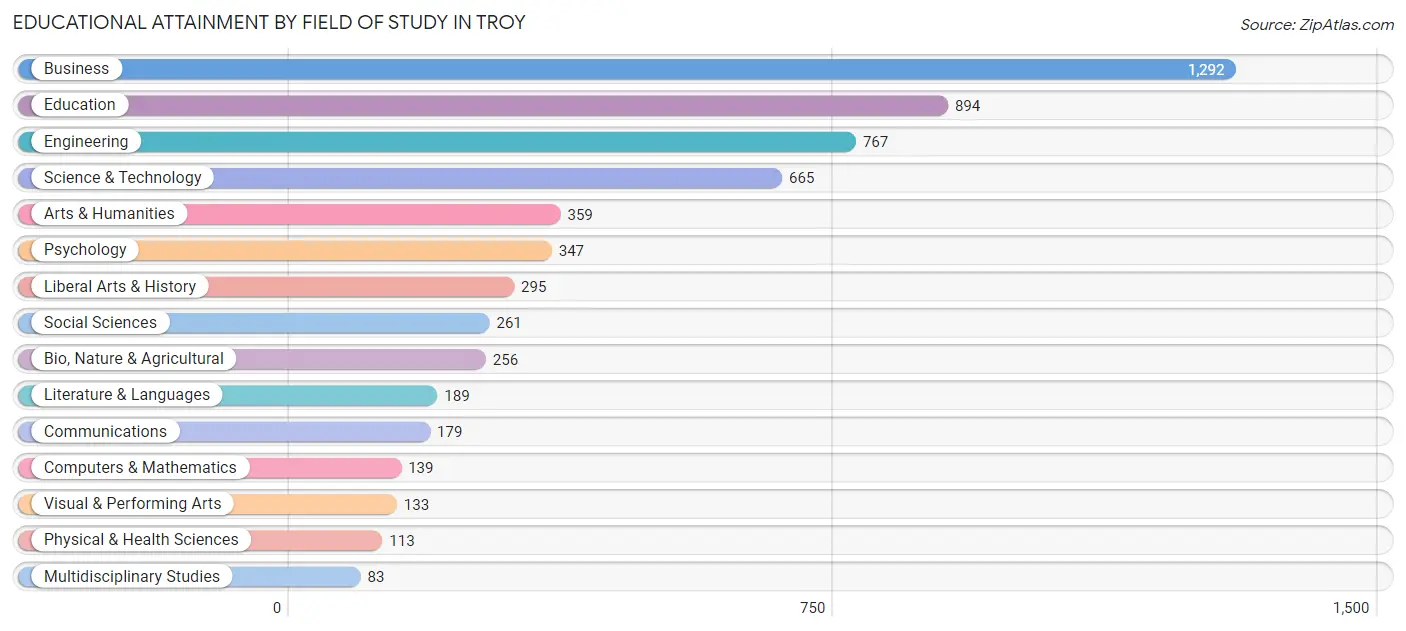
| Field of Study | # Graduates | % Graduates |
| Computers & Mathematics | 139 | 2.3% |
| Bio, Nature & Agricultural | 256 | 4.3% |
| Physical & Health Sciences | 113 | 1.9% |
| Psychology | 347 | 5.8% |
| Social Sciences | 261 | 4.4% |
| Engineering | 767 | 12.8% |
| Multidisciplinary Studies | 83 | 1.4% |
| Science & Technology | 665 | 11.1% |
| Business | 1,292 | 21.6% |
| Education | 894 | 15.0% |
| Literature & Languages | 189 | 3.2% |
| Liberal Arts & History | 295 | 4.9% |
| Visual & Performing Arts | 133 | 2.2% |
| Communications | 179 | 3.0% |
| Arts & Humanities | 359 | 6.0% |
| Total | 5,972 | 100.0% |
Transportation & Commute in Troy
Vehicle Availability by Sex in Troy
The most prevalent vehicle ownership categories in Troy are males with 2 vehicles (3,111, accounting for 43.5%) and females with 2 vehicles (2,687, making up 51.2%).
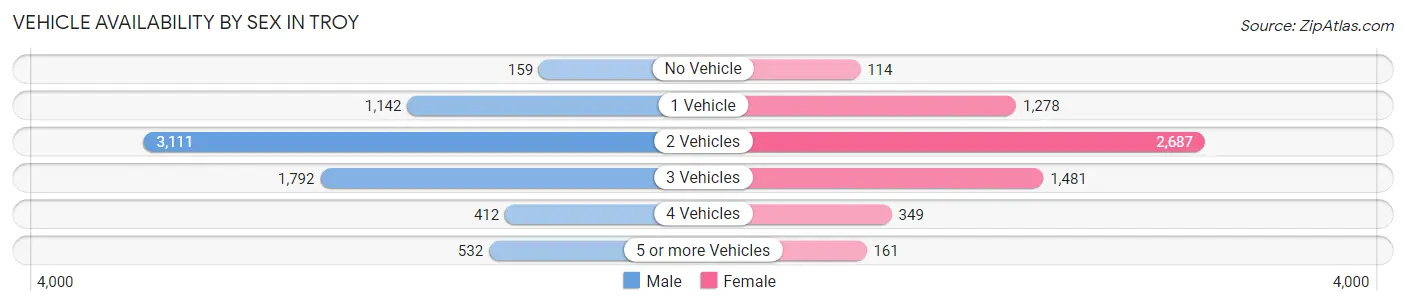
| Vehicles Available | Male | Female |
| No Vehicle | 159 (2.2%) | 114 (1.9%) |
| 1 Vehicle | 1,142 (16.0%) | 1,278 (21.0%) |
| 2 Vehicles | 3,111 (43.5%) | 2,687 (44.3%) |
| 3 Vehicles | 1,792 (25.1%) | 1,481 (24.4%) |
| 4 Vehicles | 412 (5.8%) | 349 (5.8%) |
| 5 or more Vehicles | 532 (7.4%) | 161 (2.6%) |
| Total | 7,148 (100.0%) | 6,070 (100.0%) |
Commute Time in Troy
The most frequently occuring commute durations in Troy are 15 to 19 minutes (2,276 commuters, 18.9%), 10 to 14 minutes (2,248 commuters, 18.7%), and 5 to 9 minutes (1,895 commuters, 15.7%).
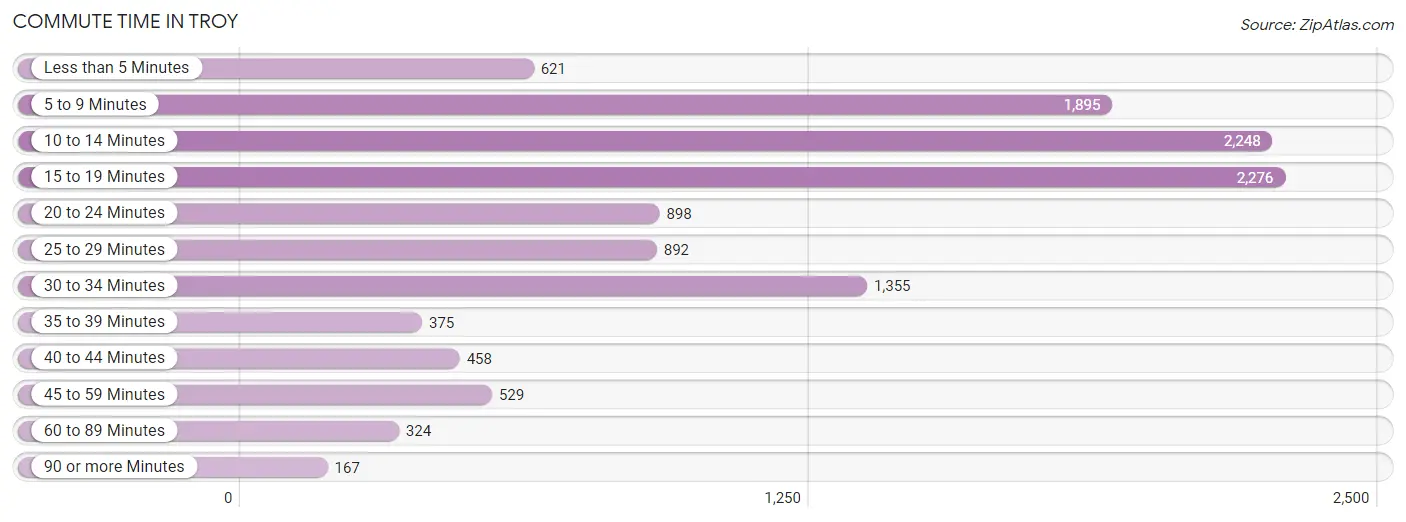
| Commute Time | # Commuters | % Commuters |
| Less than 5 Minutes | 621 | 5.2% |
| 5 to 9 Minutes | 1,895 | 15.7% |
| 10 to 14 Minutes | 2,248 | 18.7% |
| 15 to 19 Minutes | 2,276 | 18.9% |
| 20 to 24 Minutes | 898 | 7.5% |
| 25 to 29 Minutes | 892 | 7.4% |
| 30 to 34 Minutes | 1,355 | 11.3% |
| 35 to 39 Minutes | 375 | 3.1% |
| 40 to 44 Minutes | 458 | 3.8% |
| 45 to 59 Minutes | 529 | 4.4% |
| 60 to 89 Minutes | 324 | 2.7% |
| 90 or more Minutes | 167 | 1.4% |
Commute Time by Sex in Troy
The most common commute times in Troy are 15 to 19 minutes (1,275 commuters, 19.5%) for males and 10 to 14 minutes (1,092 commuters, 19.9%) for females.
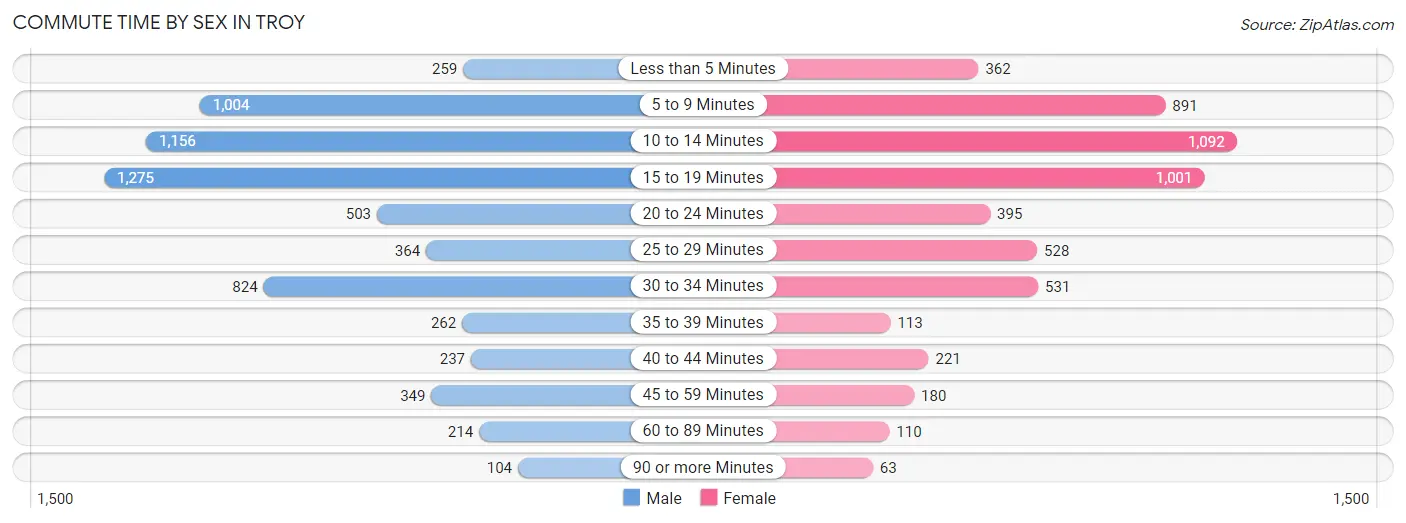
| Commute Time | Male | Female |
| Less than 5 Minutes | 259 (4.0%) | 362 (6.6%) |
| 5 to 9 Minutes | 1,004 (15.3%) | 891 (16.2%) |
| 10 to 14 Minutes | 1,156 (17.6%) | 1,092 (19.9%) |
| 15 to 19 Minutes | 1,275 (19.5%) | 1,001 (18.2%) |
| 20 to 24 Minutes | 503 (7.7%) | 395 (7.2%) |
| 25 to 29 Minutes | 364 (5.6%) | 528 (9.6%) |
| 30 to 34 Minutes | 824 (12.6%) | 531 (9.7%) |
| 35 to 39 Minutes | 262 (4.0%) | 113 (2.1%) |
| 40 to 44 Minutes | 237 (3.6%) | 221 (4.0%) |
| 45 to 59 Minutes | 349 (5.3%) | 180 (3.3%) |
| 60 to 89 Minutes | 214 (3.3%) | 110 (2.0%) |
| 90 or more Minutes | 104 (1.6%) | 63 (1.1%) |
Time of Departure to Work by Sex in Troy
The most frequent times of departure to work in Troy are 6:30 AM to 6:59 AM (922, 14.1%) for males and 7:30 AM to 7:59 AM (973, 17.7%) for females.
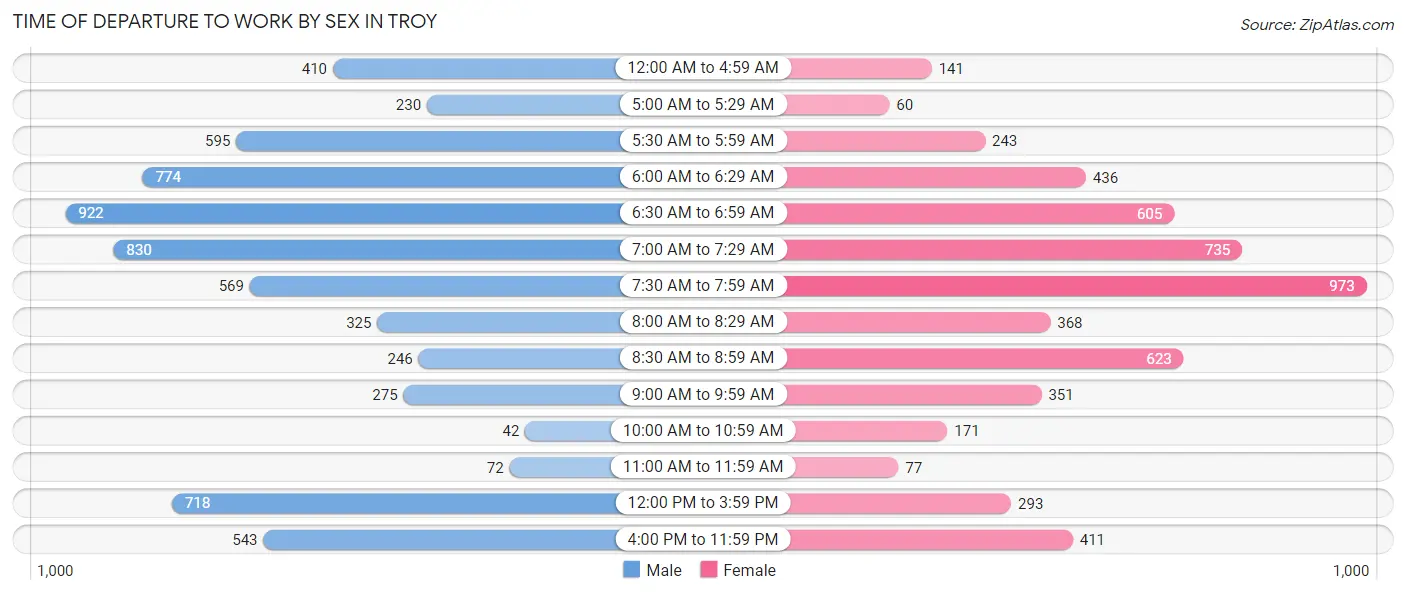
| Time of Departure | Male | Female |
| 12:00 AM to 4:59 AM | 410 (6.3%) | 141 (2.6%) |
| 5:00 AM to 5:29 AM | 230 (3.5%) | 60 (1.1%) |
| 5:30 AM to 5:59 AM | 595 (9.1%) | 243 (4.4%) |
| 6:00 AM to 6:29 AM | 774 (11.8%) | 436 (8.0%) |
| 6:30 AM to 6:59 AM | 922 (14.1%) | 605 (11.0%) |
| 7:00 AM to 7:29 AM | 830 (12.7%) | 735 (13.4%) |
| 7:30 AM to 7:59 AM | 569 (8.7%) | 973 (17.7%) |
| 8:00 AM to 8:29 AM | 325 (5.0%) | 368 (6.7%) |
| 8:30 AM to 8:59 AM | 246 (3.8%) | 623 (11.4%) |
| 9:00 AM to 9:59 AM | 275 (4.2%) | 351 (6.4%) |
| 10:00 AM to 10:59 AM | 42 (0.6%) | 171 (3.1%) |
| 11:00 AM to 11:59 AM | 72 (1.1%) | 77 (1.4%) |
| 12:00 PM to 3:59 PM | 718 (11.0%) | 293 (5.3%) |
| 4:00 PM to 11:59 PM | 543 (8.3%) | 411 (7.5%) |
| Total | 6,551 (100.0%) | 5,487 (100.0%) |
Housing Occupancy in Troy
Occupancy by Ownership in Troy
Of the total 10,874 dwellings in Troy, owner-occupied units account for 7,078 (65.1%), while renter-occupied units make up 3,796 (34.9%).
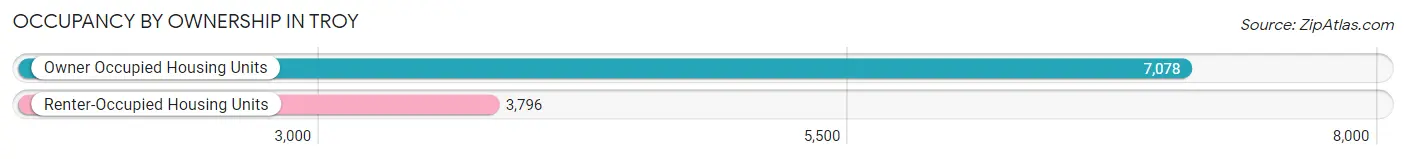
| Occupancy | # Housing Units | % Housing Units |
| Owner Occupied Housing Units | 7,078 | 65.1% |
| Renter-Occupied Housing Units | 3,796 | 34.9% |
| Total Occupied Housing Units | 10,874 | 100.0% |
Occupancy by Household Size in Troy
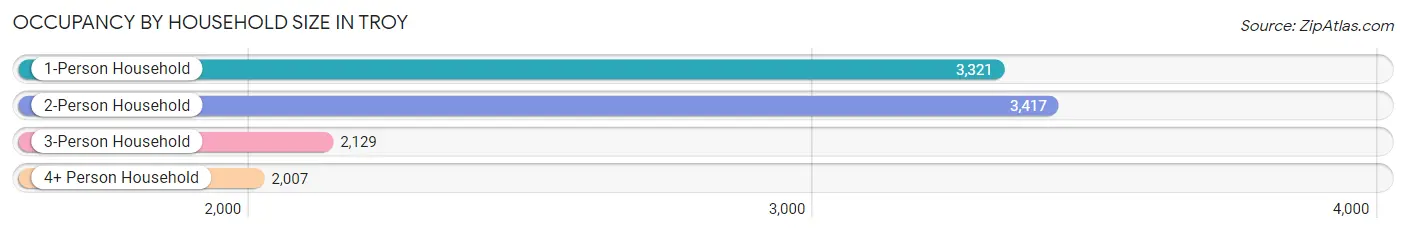
| Household Size | # Housing Units | % Housing Units |
| 1-Person Household | 3,321 | 30.5% |
| 2-Person Household | 3,417 | 31.4% |
| 3-Person Household | 2,129 | 19.6% |
| 4+ Person Household | 2,007 | 18.5% |
| Total Housing Units | 10,874 | 100.0% |
Occupancy by Ownership by Household Size in Troy
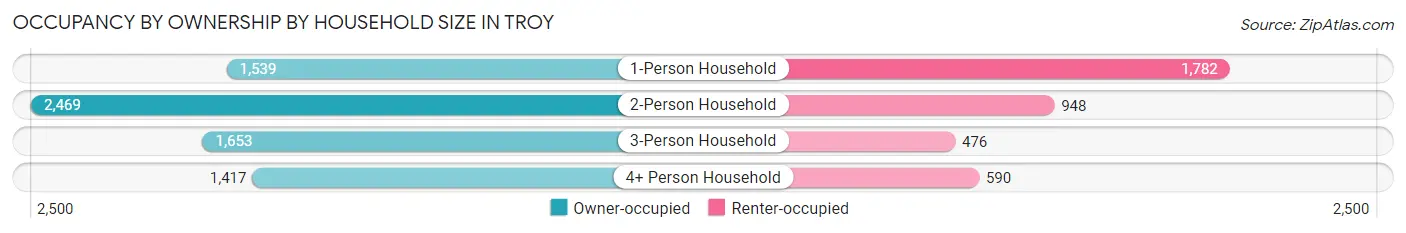
| Household Size | Owner-occupied | Renter-occupied |
| 1-Person Household | 1,539 (46.3%) | 1,782 (53.7%) |
| 2-Person Household | 2,469 (72.3%) | 948 (27.7%) |
| 3-Person Household | 1,653 (77.6%) | 476 (22.4%) |
| 4+ Person Household | 1,417 (70.6%) | 590 (29.4%) |
| Total Housing Units | 7,078 (65.1%) | 3,796 (34.9%) |
Occupancy by Educational Attainment in Troy
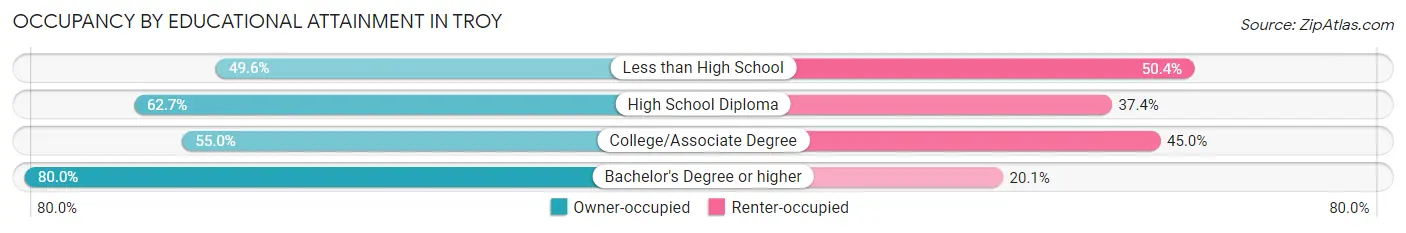
| Household Size | Owner-occupied | Renter-occupied |
| Less than High School | 322 (49.6%) | 327 (50.4%) |
| High School Diploma | 2,008 (62.6%) | 1,197 (37.3%) |
| College/Associate Degree | 1,901 (55.0%) | 1,558 (45.0%) |
| Bachelor's Degree or higher | 2,847 (79.9%) | 714 (20.1%) |
Occupancy by Age of Householder in Troy
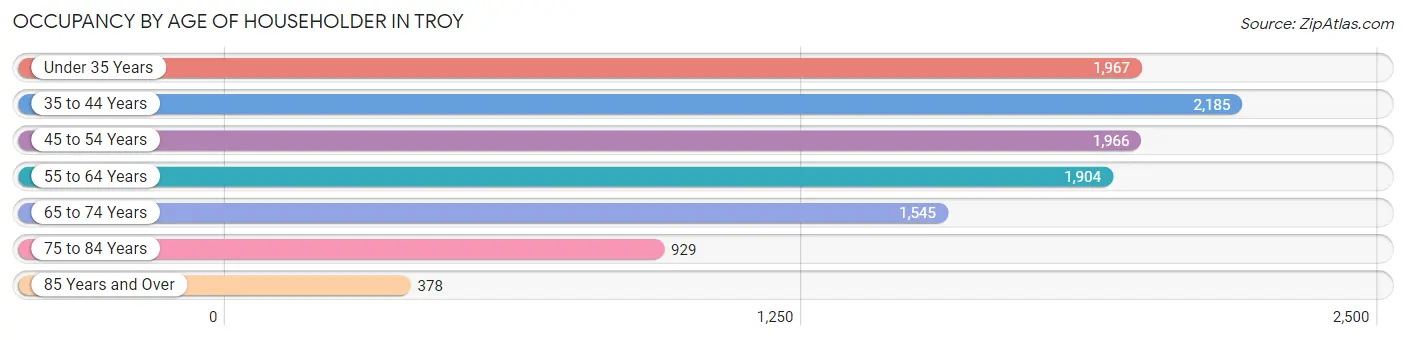
| Age Bracket | # Households | % Households |
| Under 35 Years | 1,967 | 18.1% |
| 35 to 44 Years | 2,185 | 20.1% |
| 45 to 54 Years | 1,966 | 18.1% |
| 55 to 64 Years | 1,904 | 17.5% |
| 65 to 74 Years | 1,545 | 14.2% |
| 75 to 84 Years | 929 | 8.5% |
| 85 Years and Over | 378 | 3.5% |
| Total | 10,874 | 100.0% |
Housing Finances in Troy
Median Income by Occupancy in Troy
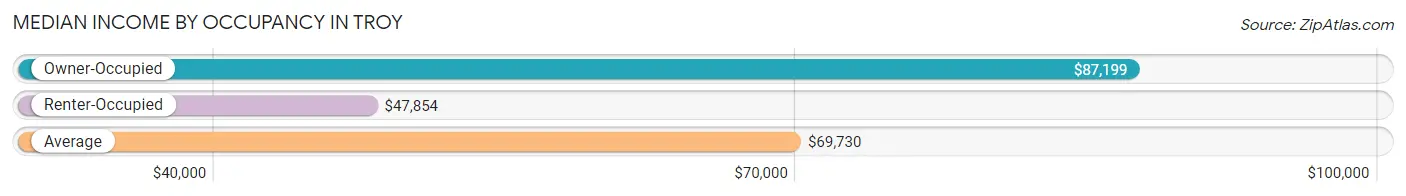
| Occupancy Type | # Households | Median Income |
| Owner-Occupied | 7,078 (65.1%) | $87,199 |
| Renter-Occupied | 3,796 (34.9%) | $47,854 |
| Average | 10,874 (100.0%) | $69,730 |
Occupancy by Householder Income Bracket in Troy
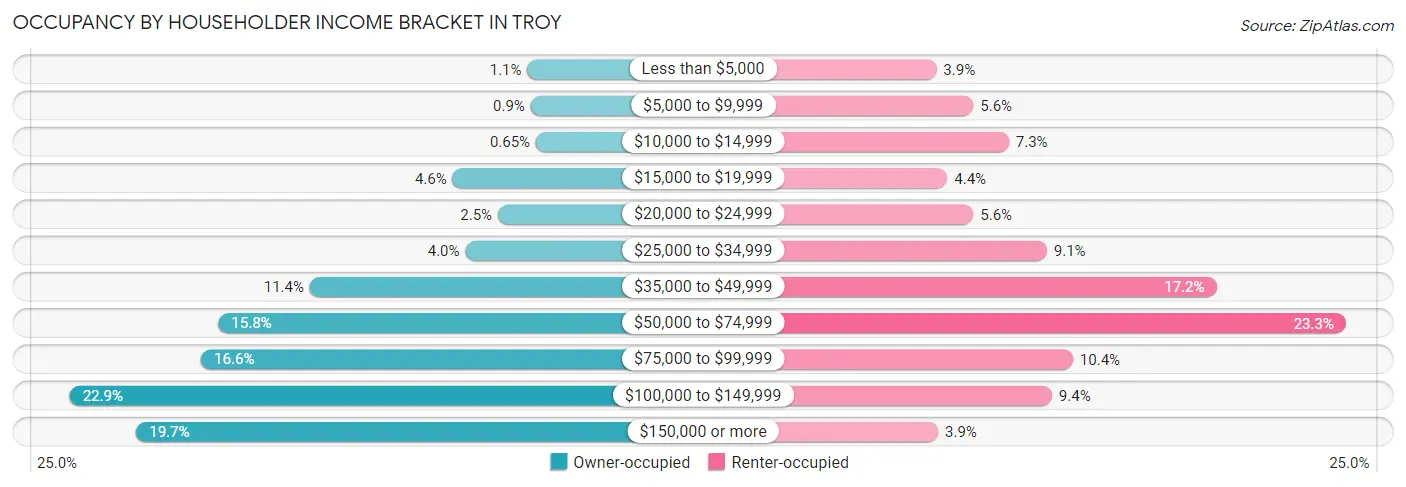
| Income Bracket | Owner-occupied | Renter-occupied |
| Less than $5,000 | 75 (1.1%) | 146 (3.8%) |
| $5,000 to $9,999 | 64 (0.9%) | 213 (5.6%) |
| $10,000 to $14,999 | 46 (0.6%) | 277 (7.3%) |
| $15,000 to $19,999 | 327 (4.6%) | 166 (4.4%) |
| $20,000 to $24,999 | 174 (2.5%) | 213 (5.6%) |
| $25,000 to $34,999 | 284 (4.0%) | 346 (9.1%) |
| $35,000 to $49,999 | 808 (11.4%) | 652 (17.2%) |
| $50,000 to $74,999 | 1,116 (15.8%) | 886 (23.3%) |
| $75,000 to $99,999 | 1,174 (16.6%) | 393 (10.3%) |
| $100,000 to $149,999 | 1,617 (22.9%) | 355 (9.3%) |
| $150,000 or more | 1,393 (19.7%) | 149 (3.9%) |
| Total | 7,078 (100.0%) | 3,796 (100.0%) |
Monthly Housing Cost Tiers in Troy
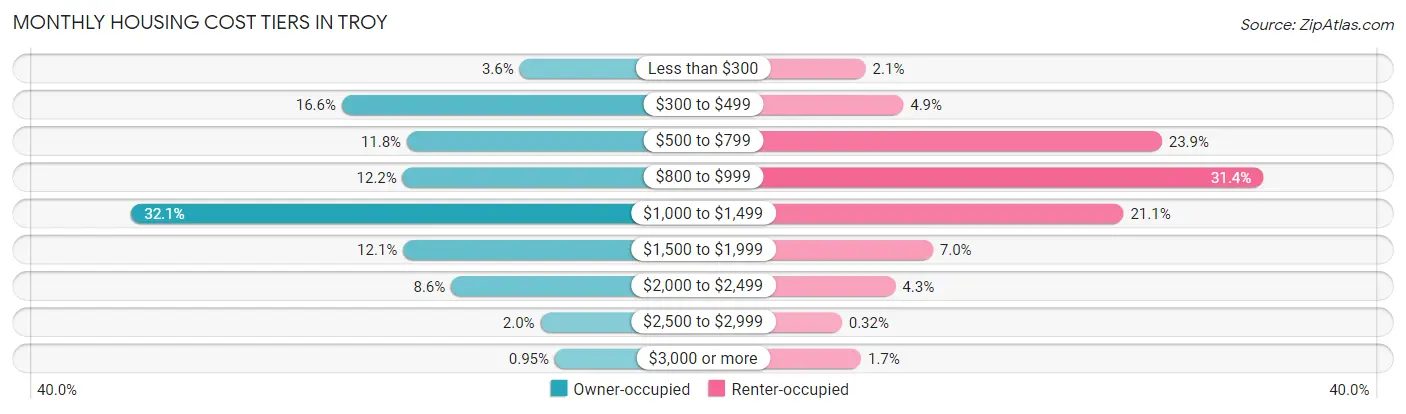
| Monthly Cost | Owner-occupied | Renter-occupied |
| Less than $300 | 251 (3.5%) | 79 (2.1%) |
| $300 to $499 | 1,178 (16.6%) | 184 (4.9%) |
| $500 to $799 | 838 (11.8%) | 907 (23.9%) |
| $800 to $999 | 861 (12.2%) | 1,190 (31.4%) |
| $1,000 to $1,499 | 2,275 (32.1%) | 800 (21.1%) |
| $1,500 to $1,999 | 858 (12.1%) | 267 (7.0%) |
| $2,000 to $2,499 | 608 (8.6%) | 162 (4.3%) |
| $2,500 to $2,999 | 142 (2.0%) | 12 (0.3%) |
| $3,000 or more | 67 (0.9%) | 66 (1.7%) |
| Total | 7,078 (100.0%) | 3,796 (100.0%) |
Physical Housing Characteristics in Troy
Housing Structures in Troy
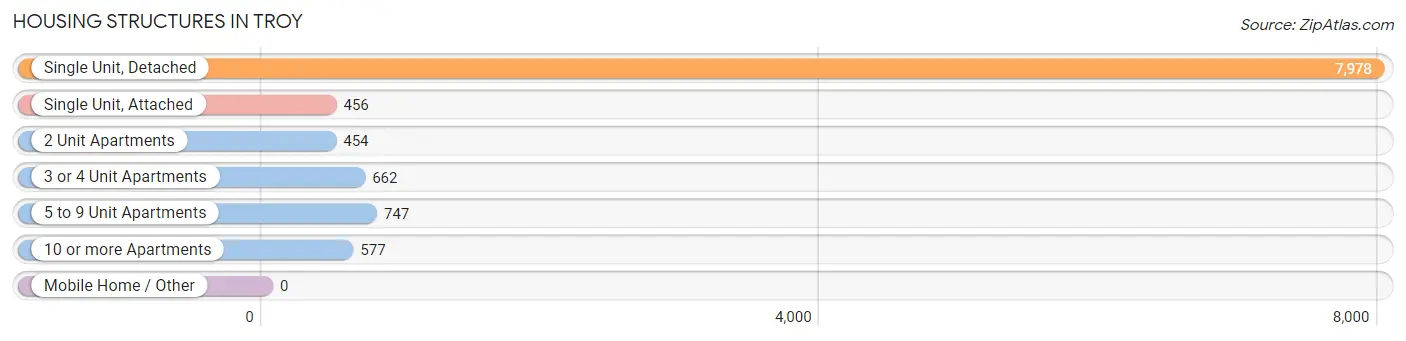
| Structure Type | # Housing Units | % Housing Units |
| Single Unit, Detached | 7,978 | 73.4% |
| Single Unit, Attached | 456 | 4.2% |
| 2 Unit Apartments | 454 | 4.2% |
| 3 or 4 Unit Apartments | 662 | 6.1% |
| 5 to 9 Unit Apartments | 747 | 6.9% |
| 10 or more Apartments | 577 | 5.3% |
| Mobile Home / Other | 0 | 0.0% |
| Total | 10,874 | 100.0% |
Housing Structures by Occupancy in Troy
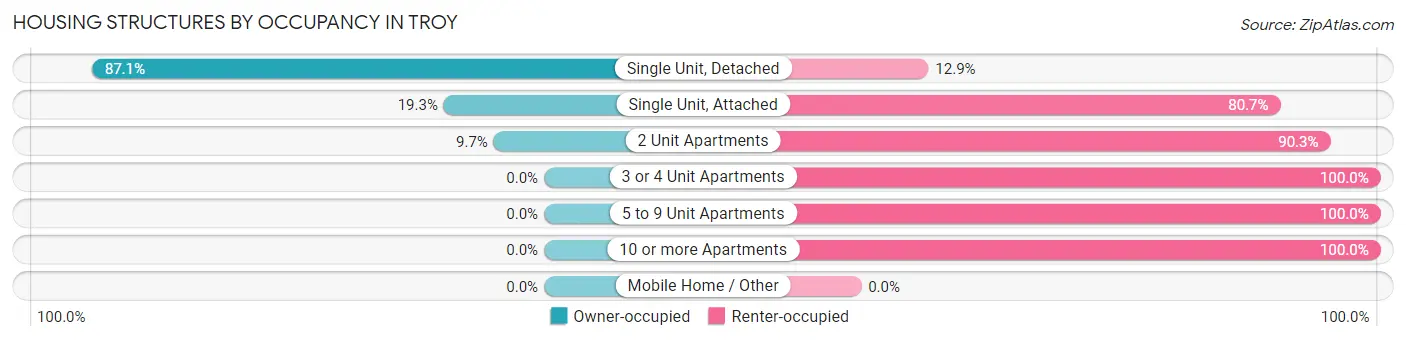
| Structure Type | Owner-occupied | Renter-occupied |
| Single Unit, Detached | 6,946 (87.1%) | 1,032 (12.9%) |
| Single Unit, Attached | 88 (19.3%) | 368 (80.7%) |
| 2 Unit Apartments | 44 (9.7%) | 410 (90.3%) |
| 3 or 4 Unit Apartments | 0 (0.0%) | 662 (100.0%) |
| 5 to 9 Unit Apartments | 0 (0.0%) | 747 (100.0%) |
| 10 or more Apartments | 0 (0.0%) | 577 (100.0%) |
| Mobile Home / Other | 0 (0.0%) | 0 (0.0%) |
| Total | 7,078 (65.1%) | 3,796 (34.9%) |
Housing Structures by Number of Rooms in Troy
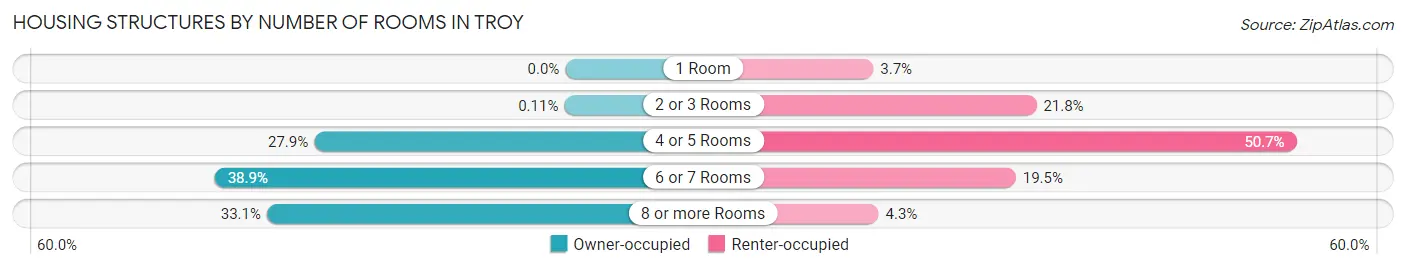
| Number of Rooms | Owner-occupied | Renter-occupied |
| 1 Room | 0 (0.0%) | 141 (3.7%) |
| 2 or 3 Rooms | 8 (0.1%) | 828 (21.8%) |
| 4 or 5 Rooms | 1,973 (27.9%) | 1,923 (50.7%) |
| 6 or 7 Rooms | 2,753 (38.9%) | 741 (19.5%) |
| 8 or more Rooms | 2,344 (33.1%) | 163 (4.3%) |
| Total | 7,078 (100.0%) | 3,796 (100.0%) |
Housing Structure by Heating Type in Troy
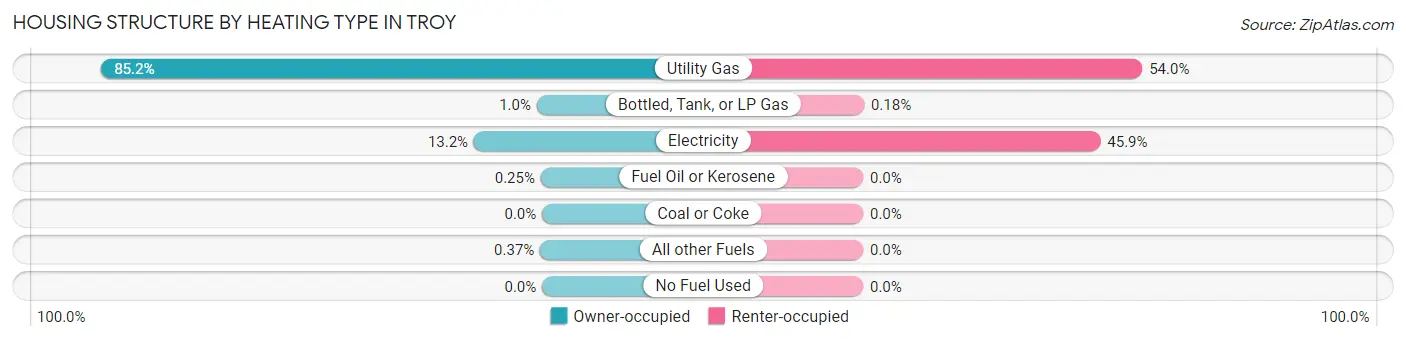
| Heating Type | Owner-occupied | Renter-occupied |
| Utility Gas | 6,030 (85.2%) | 2,048 (53.9%) |
| Bottled, Tank, or LP Gas | 72 (1.0%) | 7 (0.2%) |
| Electricity | 932 (13.2%) | 1,741 (45.9%) |
| Fuel Oil or Kerosene | 18 (0.3%) | 0 (0.0%) |
| Coal or Coke | 0 (0.0%) | 0 (0.0%) |
| All other Fuels | 26 (0.4%) | 0 (0.0%) |
| No Fuel Used | 0 (0.0%) | 0 (0.0%) |
| Total | 7,078 (100.0%) | 3,796 (100.0%) |
Household Vehicle Usage in Troy
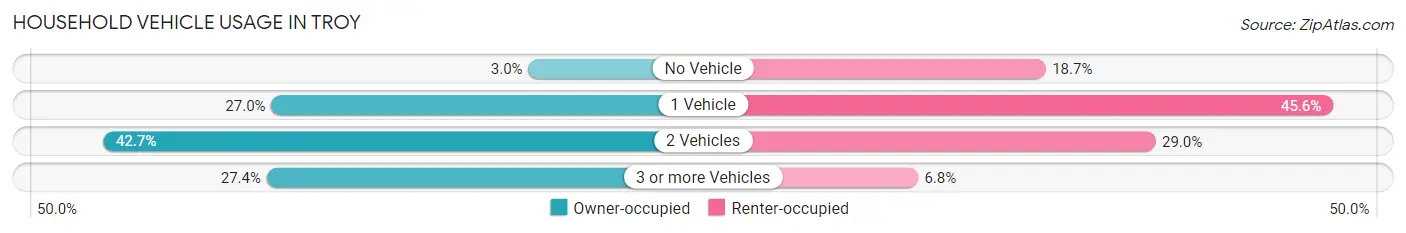
| Vehicles per Household | Owner-occupied | Renter-occupied |
| No Vehicle | 210 (3.0%) | 710 (18.7%) |
| 1 Vehicle | 1,908 (27.0%) | 1,730 (45.6%) |
| 2 Vehicles | 3,021 (42.7%) | 1,099 (28.9%) |
| 3 or more Vehicles | 1,939 (27.4%) | 257 (6.8%) |
| Total | 7,078 (100.0%) | 3,796 (100.0%) |
Real Estate & Mortgages in Troy
Real Estate and Mortgage Overview in Troy
| Characteristic | Without Mortgage | With Mortgage |
| Housing Units | 1,682 | 5,396 |
| Median Property Value | $157,200 | $183,200 |
| Median Household Income | $54,632 | $1,284 |
| Monthly Housing Costs | $397 | $67 |
| Real Estate Taxes | $1,351 | $14 |
Property Value by Mortgage Status in Troy
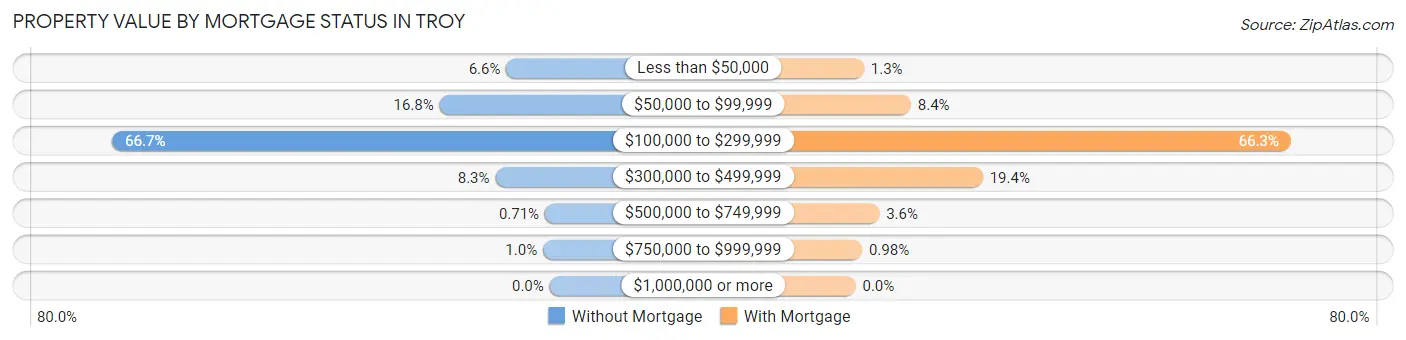
| Property Value | Without Mortgage | With Mortgage |
| Less than $50,000 | 111 (6.6%) | 68 (1.3%) |
| $50,000 to $99,999 | 282 (16.8%) | 455 (8.4%) |
| $100,000 to $299,999 | 1,121 (66.6%) | 3,579 (66.3%) |
| $300,000 to $499,999 | 139 (8.3%) | 1,046 (19.4%) |
| $500,000 to $749,999 | 12 (0.7%) | 195 (3.6%) |
| $750,000 to $999,999 | 17 (1.0%) | 53 (1.0%) |
| $1,000,000 or more | 0 (0.0%) | 0 (0.0%) |
| Total | 1,682 (100.0%) | 5,396 (100.0%) |
Household Income by Mortgage Status in Troy
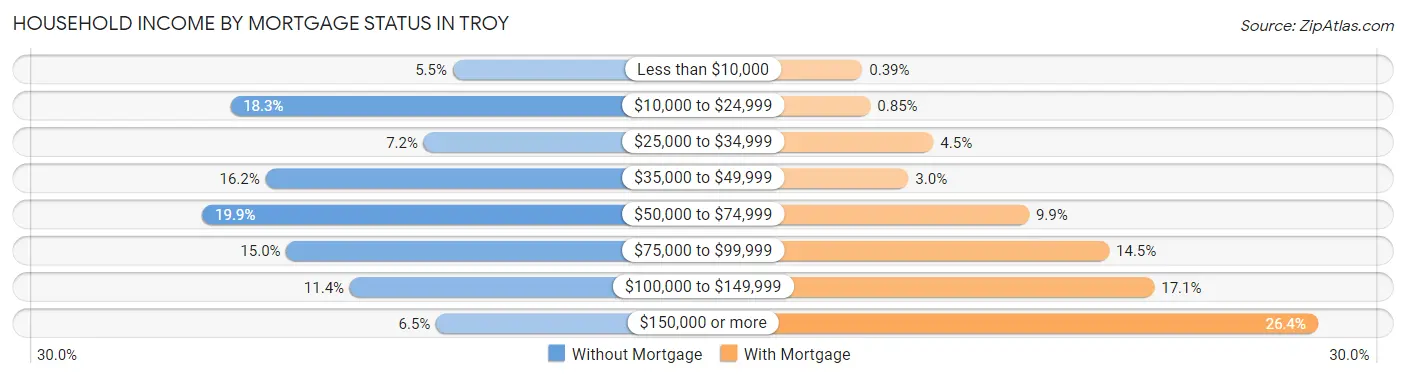
| Household Income | Without Mortgage | With Mortgage |
| Less than $10,000 | 93 (5.5%) | 21 (0.4%) |
| $10,000 to $24,999 | 307 (18.2%) | 46 (0.9%) |
| $25,000 to $34,999 | 121 (7.2%) | 240 (4.4%) |
| $35,000 to $49,999 | 273 (16.2%) | 163 (3.0%) |
| $50,000 to $74,999 | 334 (19.9%) | 535 (9.9%) |
| $75,000 to $99,999 | 253 (15.0%) | 782 (14.5%) |
| $100,000 to $149,999 | 192 (11.4%) | 921 (17.1%) |
| $150,000 or more | 109 (6.5%) | 1,425 (26.4%) |
| Total | 1,682 (100.0%) | 5,396 (100.0%) |
Property Value to Household Income Ratio in Troy
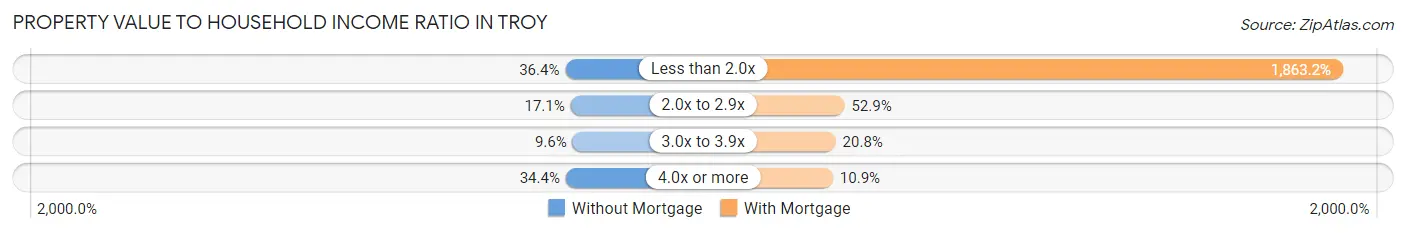
| Value-to-Income Ratio | Without Mortgage | With Mortgage |
| Less than 2.0x | 612 (36.4%) | 100,539 (1,863.2%) |
| 2.0x to 2.9x | 288 (17.1%) | 2,855 (52.9%) |
| 3.0x to 3.9x | 162 (9.6%) | 1,122 (20.8%) |
| 4.0x or more | 579 (34.4%) | 588 (10.9%) |
| Total | 1,682 (100.0%) | 5,396 (100.0%) |
Real Estate Taxes by Mortgage Status in Troy
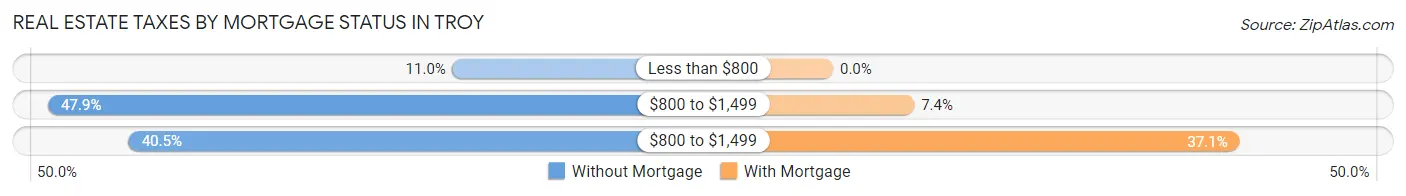
| Property Taxes | Without Mortgage | With Mortgage |
| Less than $800 | 185 (11.0%) | 0 (0.0%) |
| $800 to $1,499 | 805 (47.9%) | 400 (7.4%) |
| $800 to $1,499 | 681 (40.5%) | 2,003 (37.1%) |
| Total | 1,682 (100.0%) | 5,396 (100.0%) |
Health & Disability in Troy
Health Insurance Coverage by Age in Troy
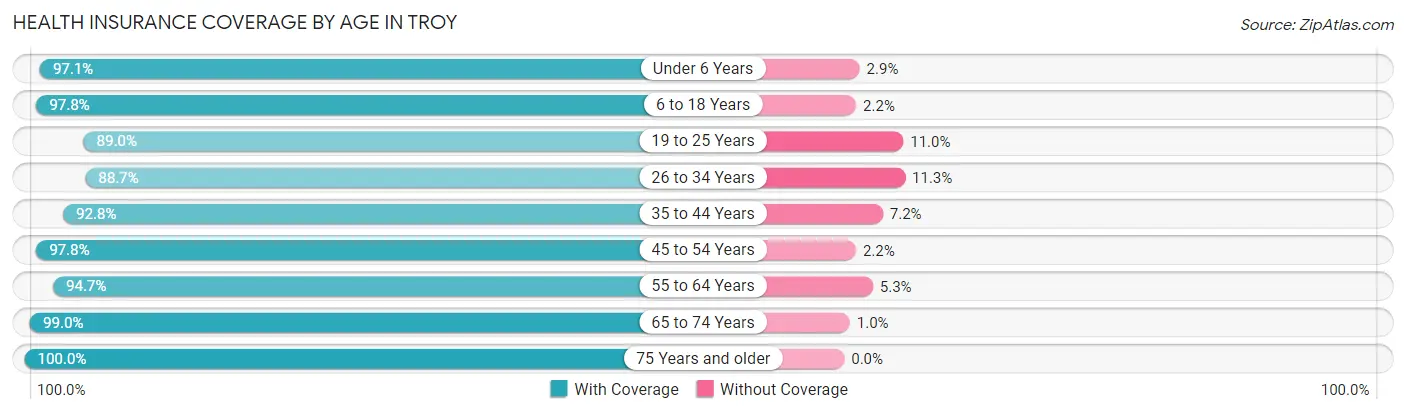
| Age Bracket | With Coverage | Without Coverage |
| Under 6 Years | 1,926 (97.1%) | 57 (2.9%) |
| 6 to 18 Years | 4,504 (97.8%) | 102 (2.2%) |
| 19 to 25 Years | 2,109 (89.0%) | 261 (11.0%) |
| 26 to 34 Years | 2,571 (88.7%) | 329 (11.3%) |
| 35 to 44 Years | 3,512 (92.8%) | 272 (7.2%) |
| 45 to 54 Years | 3,270 (97.8%) | 73 (2.2%) |
| 55 to 64 Years | 2,792 (94.7%) | 157 (5.3%) |
| 65 to 74 Years | 2,187 (99.0%) | 23 (1.0%) |
| 75 Years and older | 2,046 (100.0%) | 0 (0.0%) |
| Total | 24,917 (95.1%) | 1,274 (4.9%) |
Health Insurance Coverage by Citizenship Status in Troy
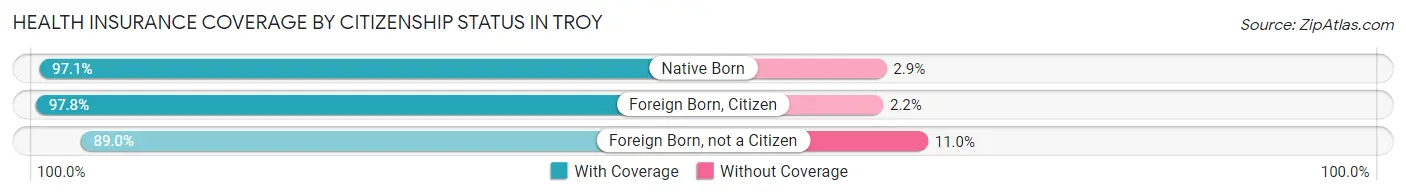
| Citizenship Status | With Coverage | Without Coverage |
| Native Born | 1,926 (97.1%) | 57 (2.9%) |
| Foreign Born, Citizen | 4,504 (97.8%) | 102 (2.2%) |
| Foreign Born, not a Citizen | 2,109 (89.0%) | 261 (11.0%) |
Health Insurance Coverage by Household Income in Troy
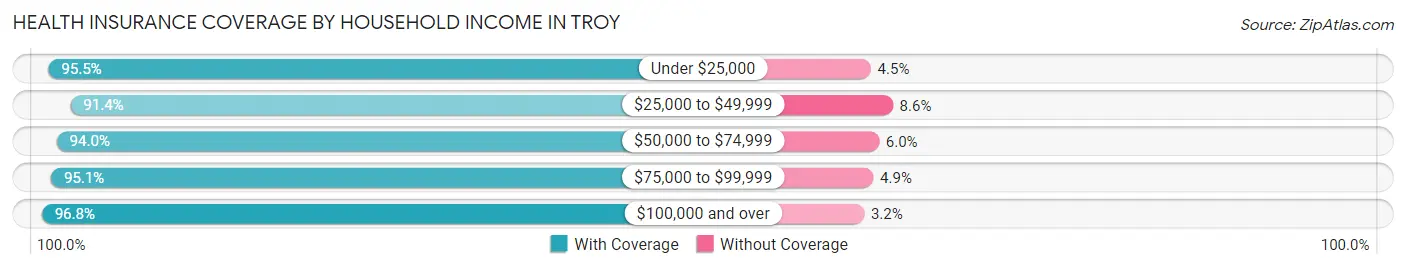
| Household Income | With Coverage | Without Coverage |
| Under $25,000 | 2,735 (95.5%) | 128 (4.5%) |
| $25,000 to $49,999 | 3,141 (91.4%) | 295 (8.6%) |
| $50,000 to $74,999 | 4,397 (94.0%) | 281 (6.0%) |
| $75,000 to $99,999 | 4,441 (95.1%) | 231 (4.9%) |
| $100,000 and over | 10,159 (96.8%) | 337 (3.2%) |
Public vs Private Health Insurance Coverage by Age in Troy
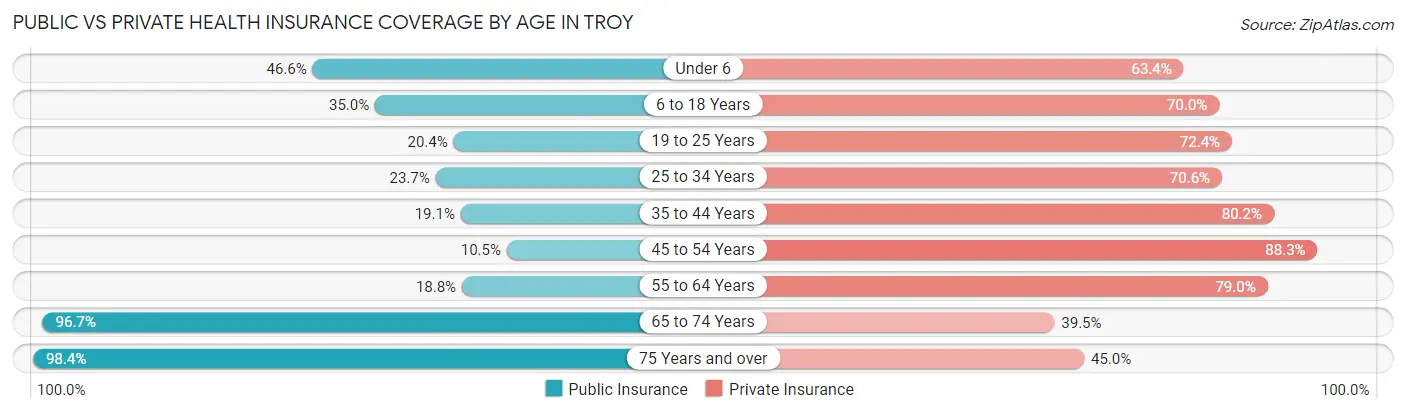
| Age Bracket | Public Insurance | Private Insurance |
| Under 6 | 923 (46.6%) | 1,258 (63.4%) |
| 6 to 18 Years | 1,610 (34.9%) | 3,226 (70.0%) |
| 19 to 25 Years | 483 (20.4%) | 1,716 (72.4%) |
| 25 to 34 Years | 688 (23.7%) | 2,046 (70.6%) |
| 35 to 44 Years | 721 (19.1%) | 3,034 (80.2%) |
| 45 to 54 Years | 351 (10.5%) | 2,951 (88.3%) |
| 55 to 64 Years | 555 (18.8%) | 2,330 (79.0%) |
| 65 to 74 Years | 2,136 (96.7%) | 872 (39.5%) |
| 75 Years and over | 2,014 (98.4%) | 920 (45.0%) |
| Total | 9,481 (36.2%) | 18,353 (70.1%) |
Disability Status by Sex by Age in Troy
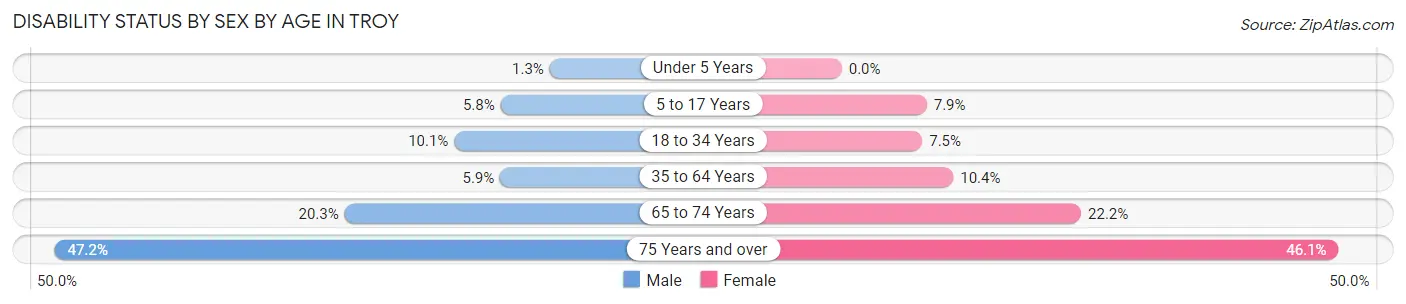
| Age Bracket | Male | Female |
| Under 5 Years | 8 (1.3%) | 0 (0.0%) |
| 5 to 17 Years | 151 (5.8%) | 187 (7.9%) |
| 18 to 34 Years | 292 (10.1%) | 193 (7.5%) |
| 35 to 64 Years | 277 (5.9%) | 554 (10.3%) |
| 65 to 74 Years | 181 (20.3%) | 293 (22.2%) |
| 75 Years and over | 416 (47.2%) | 537 (46.1%) |
Disability Class by Sex by Age in Troy
Disability Class: Hearing Difficulty
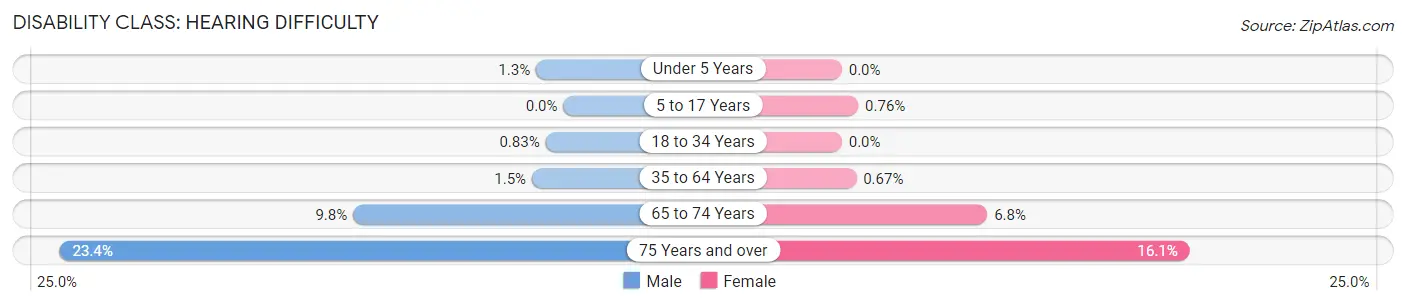
| Age Bracket | Male | Female |
| Under 5 Years | 8 (1.3%) | 0 (0.0%) |
| 5 to 17 Years | 0 (0.0%) | 18 (0.8%) |
| 18 to 34 Years | 24 (0.8%) | 0 (0.0%) |
| 35 to 64 Years | 69 (1.5%) | 36 (0.7%) |
| 65 to 74 Years | 87 (9.8%) | 89 (6.8%) |
| 75 Years and over | 206 (23.4%) | 188 (16.1%) |
Disability Class: Vision Difficulty
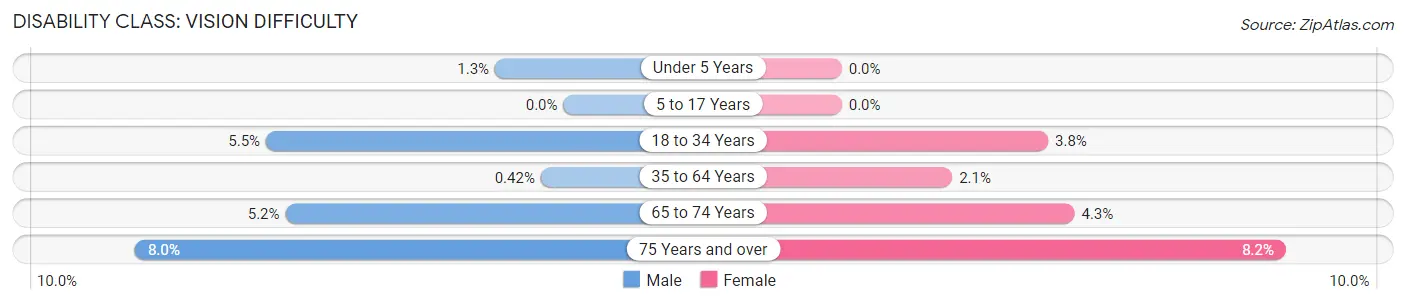
| Age Bracket | Male | Female |
| Under 5 Years | 8 (1.3%) | 0 (0.0%) |
| 5 to 17 Years | 0 (0.0%) | 0 (0.0%) |
| 18 to 34 Years | 159 (5.5%) | 99 (3.8%) |
| 35 to 64 Years | 20 (0.4%) | 110 (2.1%) |
| 65 to 74 Years | 46 (5.2%) | 57 (4.3%) |
| 75 Years and over | 70 (8.0%) | 96 (8.2%) |
Disability Class: Cognitive Difficulty
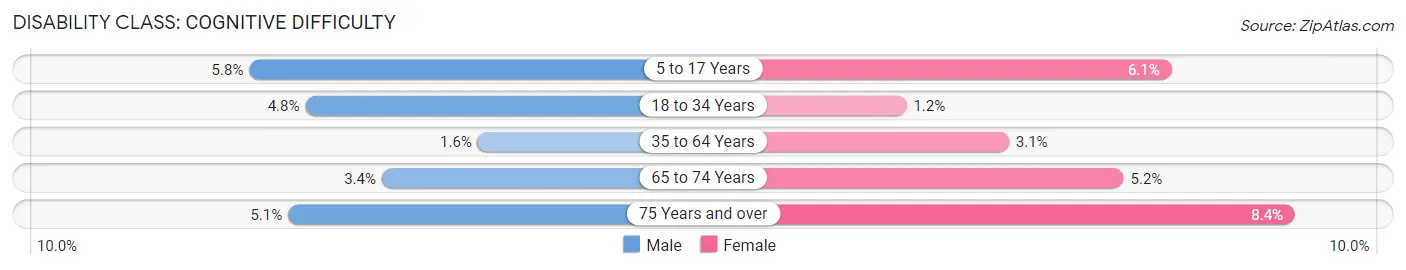
| Age Bracket | Male | Female |
| 5 to 17 Years | 151 (5.8%) | 145 (6.1%) |
| 18 to 34 Years | 138 (4.8%) | 31 (1.2%) |
| 35 to 64 Years | 75 (1.6%) | 166 (3.1%) |
| 65 to 74 Years | 30 (3.4%) | 69 (5.2%) |
| 75 Years and over | 45 (5.1%) | 98 (8.4%) |
Disability Class: Ambulatory Difficulty
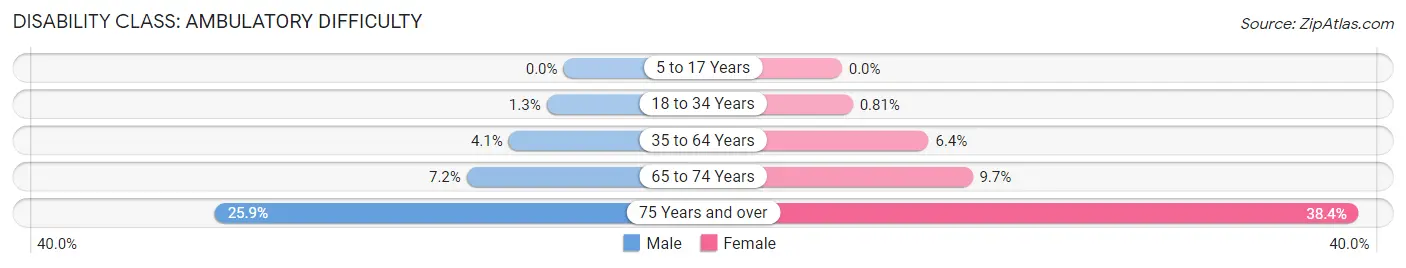
| Age Bracket | Male | Female |
| 5 to 17 Years | 0 (0.0%) | 0 (0.0%) |
| 18 to 34 Years | 36 (1.3%) | 21 (0.8%) |
| 35 to 64 Years | 192 (4.1%) | 345 (6.4%) |
| 65 to 74 Years | 64 (7.2%) | 128 (9.7%) |
| 75 Years and over | 228 (25.9%) | 447 (38.4%) |
Disability Class: Self-Care Difficulty
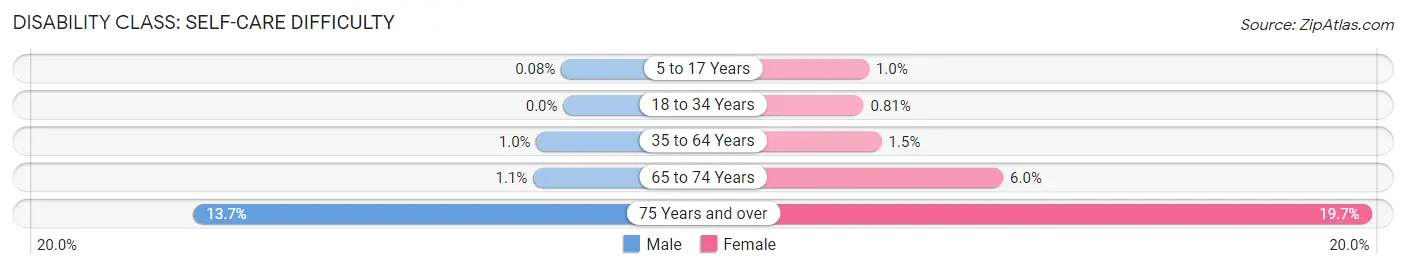
| Age Bracket | Male | Female |
| 5 to 17 Years | 2 (0.1%) | 24 (1.0%) |
| 18 to 34 Years | 0 (0.0%) | 21 (0.8%) |
| 35 to 64 Years | 47 (1.0%) | 79 (1.5%) |
| 65 to 74 Years | 10 (1.1%) | 79 (6.0%) |
| 75 Years and over | 121 (13.7%) | 229 (19.7%) |
Technology Access in Troy
Computing Device Access in Troy
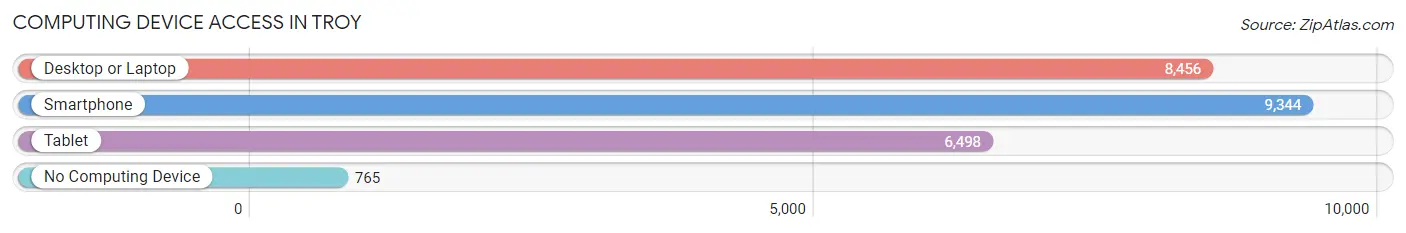
| Device Type | # Households | % Households |
| Desktop or Laptop | 8,456 | 77.8% |
| Smartphone | 9,344 | 85.9% |
| Tablet | 6,498 | 59.8% |
| No Computing Device | 765 | 7.0% |
| Total | 10,874 | 100.0% |
Internet Access in Troy
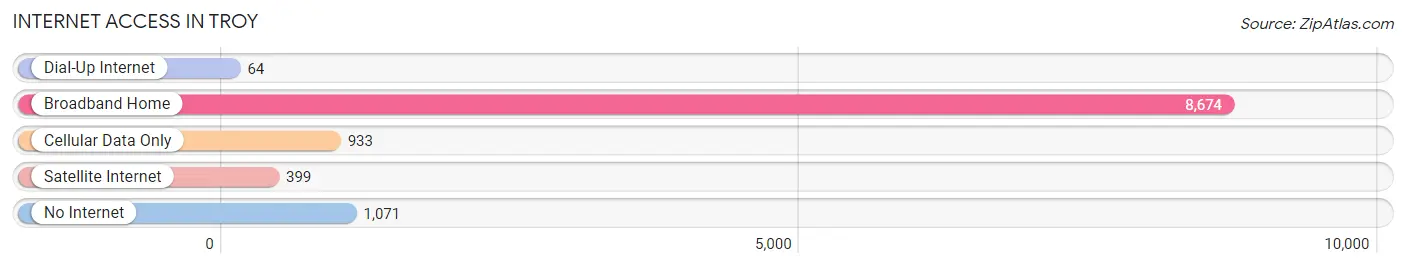
| Internet Type | # Households | % Households |
| Dial-Up Internet | 64 | 0.6% |
| Broadband Home | 8,674 | 79.8% |
| Cellular Data Only | 933 | 8.6% |
| Satellite Internet | 399 | 3.7% |
| No Internet | 1,071 | 9.9% |
| Total | 10,874 | 100.0% |
Troy Summary
Troy, Ohio is a city located in Miami County, Ohio, United States. It is part of the Dayton Metropolitan Statistical Area. The population was 25,058 at the 2010 census, making it the largest city in Miami County.
History
Troy was founded in 1807 by William H. Van Cleve, a Revolutionary War veteran. The city was named after the ancient city of Troy, located in what is now Turkey. The city was incorporated in 1816 and was the county seat of Miami County until 1840, when it was moved to nearby Piqua.
Troy was an important stop on the Miami and Erie Canal, which connected the Great Lakes to the Ohio River. The canal was completed in 1845 and provided a major boost to the local economy. The city was also a major stop on the Underground Railroad, with many former slaves settling in the area.
Troy was also an important center of industry in the late 19th and early 20th centuries. The city was home to several factories, including the Troy Manufacturing Company, which produced agricultural equipment, and the Troy Iron Works, which produced iron and steel products.
Geography
Troy is located at 40°3′25″N 84°13′25″W (40.056944, -84.223611). According to the United States Census Bureau, the city has a total area of 8.7 square miles (22.5 km2), of which 8.6 square miles (22.3 km2) is land and 0.1 square miles (0.2 km2) is water.
Economy
Troy is home to several major employers, including Hobart Corporation, a manufacturer of food service equipment, and Hobart Brothers, a manufacturer of welding products. The city is also home to several smaller businesses, including several restaurants, retail stores, and professional services.
Demographics
As of the 2010 census, there were 25,058 people, 9,945 households, and 6,717 families residing in the city. The population density was 2,902.3 people per square mile (1,122.2/km2). There were 10,717 housing units at an average density of 1,241.3 per square mile (478.2/km2). The racial makeup of the city was 94.2% White, 1.7% African American, 0.3% Native American, 0.7% Asian, 0.1% Pacific Islander, 1.2% from other races, and 1.9% from two or more races. Hispanic or Latino of any race were 3.2% of the population.
There were 9,945 households, out of which 32.2% had children under the age of 18 living with them, 51.2% were married couples living together, 12.3% had a female householder with no husband present, and 32.2% were non-families. 27.2% of all households were made up of individuals, and 10.3% had someone living alone who was 65 years of age or older. The average household size was 2.45 and the average family size was 2.97.
In the city, the population was spread out, with 24.7% under the age of 18, 8.3% from 18 to 24, 29.2% from 25 to 44, 23.2% from 45 to 64, and 14.6% who were 65 years of age or older. The median age was 37 years. For every 100 females, there were 93.2 males. For every 100 females age 18 and over, there were 89.7 males.
The median income for a household in the city was $45,837, and the median income for a family was $54,844. Males had a median income of $41,845 versus $27,945 for females. The per capita income for the city was $22,845. About 5.2% of families and 7.2% of the population were below the poverty line, including 9.2% of those under age 18 and 6.2% of those age 65 or over.
Common Questions
What is Per Capita Income in Troy?
Per Capita income in Troy is $36,026.
What is the Median Family Income in Troy?
Median Family Income in Troy is $91,732.
What is the Median Household income in Troy?
Median Household Income in Troy is $69,730.
What is Income or Wage Gap in Troy?
Income or Wage Gap in Troy is 34.8%.
Women in Troy earn 65.2 cents for every dollar earned by a man.
What is Family Income Deficit in Troy?
Family Income Deficit in Troy is $11,806.
Families that are below poverty line in Troy earn $11,806 less on average than the poverty threshold level.
What is Inequality or Gini Index in Troy?
Inequality or Gini Index in Troy is 0.41.
What is the Total Population of Troy?
Total Population of Troy is 26,494.
What is the Total Male Population of Troy?
Total Male Population of Troy is 12,822.
What is the Total Female Population of Troy?
Total Female Population of Troy is 13,672.
What is the Ratio of Males per 100 Females in Troy?
There are 93.78 Males per 100 Females in Troy.
What is the Ratio of Females per 100 Males in Troy?
There are 106.63 Females per 100 Males in Troy.
What is the Median Population Age in Troy?
Median Population Age in Troy is 38.2 Years.
What is the Average Family Size in Troy
Average Family Size in Troy is 3.0 People.
What is the Average Household Size in Troy
Average Household Size in Troy is 2.4 People.
How Large is the Labor Force in Troy?
There are 14,113 People in the Labor Forcein in Troy.
What is the Percentage of People in the Labor Force in Troy?
67.4% of People are in the Labor Force in Troy.
What is the Unemployment Rate in Troy?
Unemployment Rate in Troy is 5.0%.