Findlay, OH Map & Demographics
Findlay Map
Findlay Overview
$36,029
PER CAPITA INCOME
$76,220
AVG FAMILY INCOME
$54,986
AVG HOUSEHOLD INCOME
32.7%
WAGE / INCOME GAP [ % ]
67.3¢/ $1
WAGE / INCOME GAP [ $ ]
0.48
INEQUALITY / GINI INDEX
40,408
TOTAL POPULATION
19,412
MALE POPULATION
20,996
FEMALE POPULATION
92.46
MALES / 100 FEMALES
108.16
FEMALES / 100 MALES
38.1
MEDIAN AGE
2.9
AVG FAMILY SIZE
2.2
AVG HOUSEHOLD SIZE
20,882
LABOR FORCE [ PEOPLE ]
63.3%
PERCENT IN LABOR FORCE
4.3%
UNEMPLOYMENT RATE
Findlay Zip Codes
Income in Findlay
Income Overview in Findlay
Per Capita Income in Findlay is $36,029, while median incomes of families and households are $76,220 and $54,986 respectively.
| Characteristic | Number | Measure |
| Per Capita Income | 40,408 | $36,029 |
| Median Family Income | 9,394 | $76,220 |
| Mean Family Income | 9,394 | $103,267 |
| Median Household Income | 17,747 | $54,986 |
| Mean Household Income | 17,747 | $79,551 |
| Income Deficit | 9,394 | $0 |
| Wage / Income Gap (%) | 40,408 | 32.67% |
| Wage / Income Gap ($) | 40,408 | 67.33¢ per $1 |
| Gini / Inequality Index | 40,408 | 0.48 |
Earnings by Sex in Findlay
Average Earnings in Findlay are $36,011, $42,506 for men and $28,621 for women, a difference of 32.7%.

| Sex | Number | Average Earnings |
| Male | 11,294 (51.1%) | $42,506 |
| Female | 10,817 (48.9%) | $28,621 |
| Total | 22,111 (100.0%) | $36,011 |
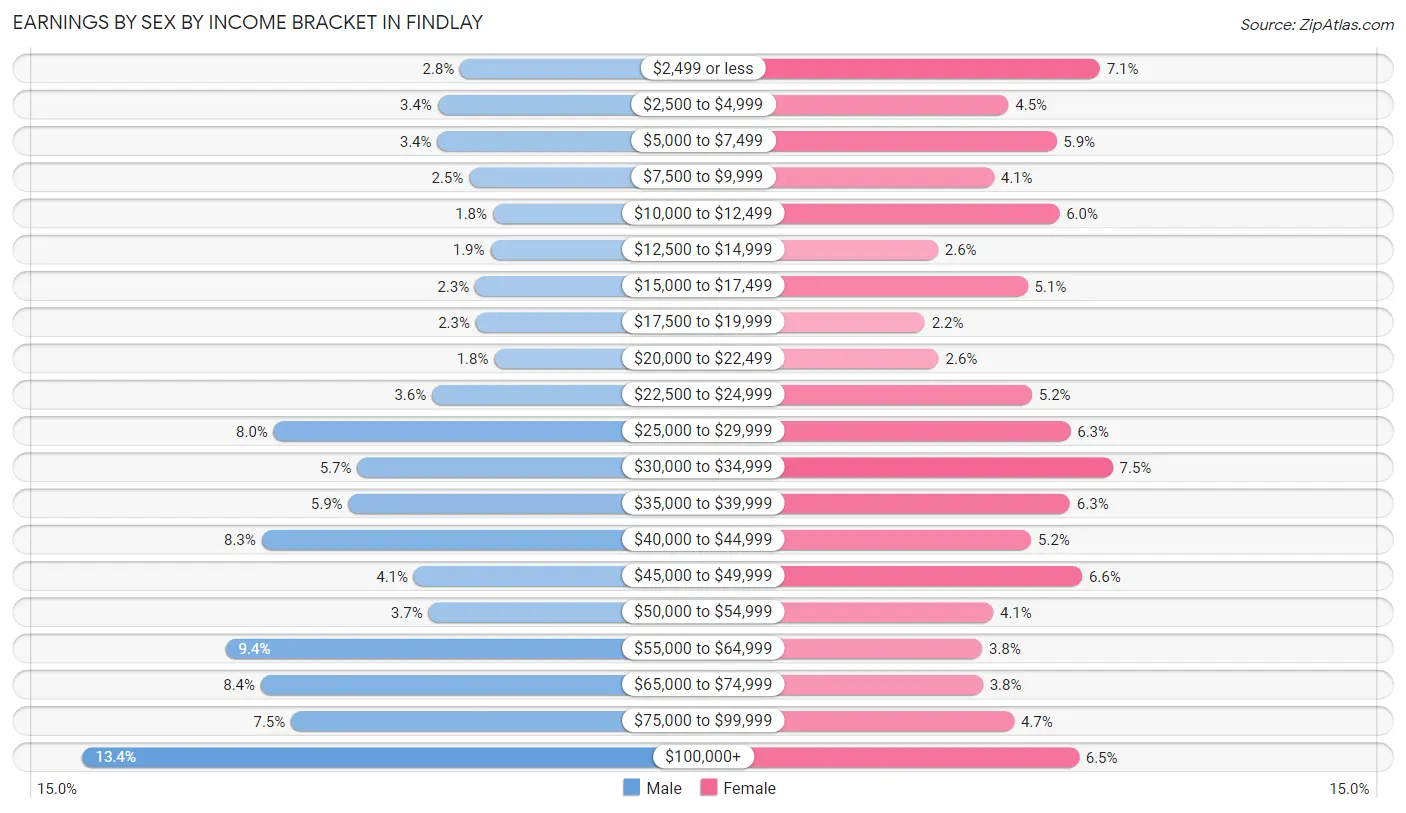
Earnings by Sex by Income Bracket in Findlay
The most common earnings brackets in Findlay are $100,000+ for men (1,510 | 13.4%) and $30,000 to $34,999 for women (808 | 7.5%).
| Income | Male | Female |
| $2,499 or less | 312 (2.8%) | 769 (7.1%) |
| $2,500 to $4,999 | 383 (3.4%) | 491 (4.5%) |
| $5,000 to $7,499 | 384 (3.4%) | 637 (5.9%) |
| $7,500 to $9,999 | 283 (2.5%) | 447 (4.1%) |
| $10,000 to $12,499 | 208 (1.8%) | 646 (6.0%) |
| $12,500 to $14,999 | 216 (1.9%) | 277 (2.6%) |
| $15,000 to $17,499 | 264 (2.3%) | 549 (5.1%) |
| $17,500 to $19,999 | 262 (2.3%) | 237 (2.2%) |
| $20,000 to $22,499 | 203 (1.8%) | 279 (2.6%) |
| $22,500 to $24,999 | 401 (3.5%) | 563 (5.2%) |
| $25,000 to $29,999 | 904 (8.0%) | 679 (6.3%) |
| $30,000 to $34,999 | 638 (5.7%) | 808 (7.5%) |
| $35,000 to $39,999 | 666 (5.9%) | 678 (6.3%) |
| $40,000 to $44,999 | 942 (8.3%) | 560 (5.2%) |
| $45,000 to $49,999 | 458 (4.1%) | 715 (6.6%) |
| $50,000 to $54,999 | 412 (3.6%) | 445 (4.1%) |
| $55,000 to $64,999 | 1,056 (9.3%) | 411 (3.8%) |
| $65,000 to $74,999 | 944 (8.4%) | 413 (3.8%) |
| $75,000 to $99,999 | 848 (7.5%) | 508 (4.7%) |
| $100,000+ | 1,510 (13.4%) | 705 (6.5%) |
| Total | 11,294 (100.0%) | 10,817 (100.0%) |
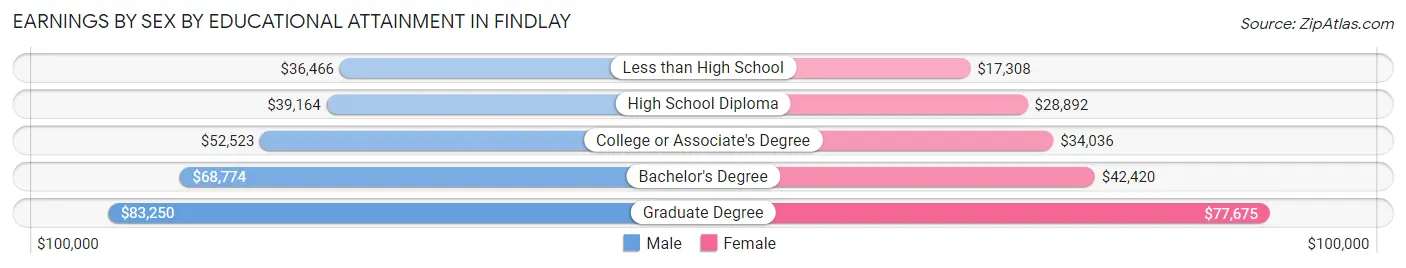
Earnings by Sex by Educational Attainment in Findlay
Average earnings in Findlay are $50,340 for men and $37,031 for women, a difference of 26.4%. Men with an educational attainment of graduate degree enjoy the highest average annual earnings of $83,250, while those with less than high school education earn the least with $36,466. Women with an educational attainment of graduate degree earn the most with the average annual earnings of $77,675, while those with less than high school education have the smallest earnings of $17,308.
| Educational Attainment | Male Income | Female Income |
| Less than High School | $36,466 | $17,308 |
| High School Diploma | $39,164 | $28,892 |
| College or Associate's Degree | $52,523 | $34,036 |
| Bachelor's Degree | $68,774 | $42,420 |
| Graduate Degree | $83,250 | $77,675 |
| Total | $50,340 | $37,031 |
Family Income in Findlay
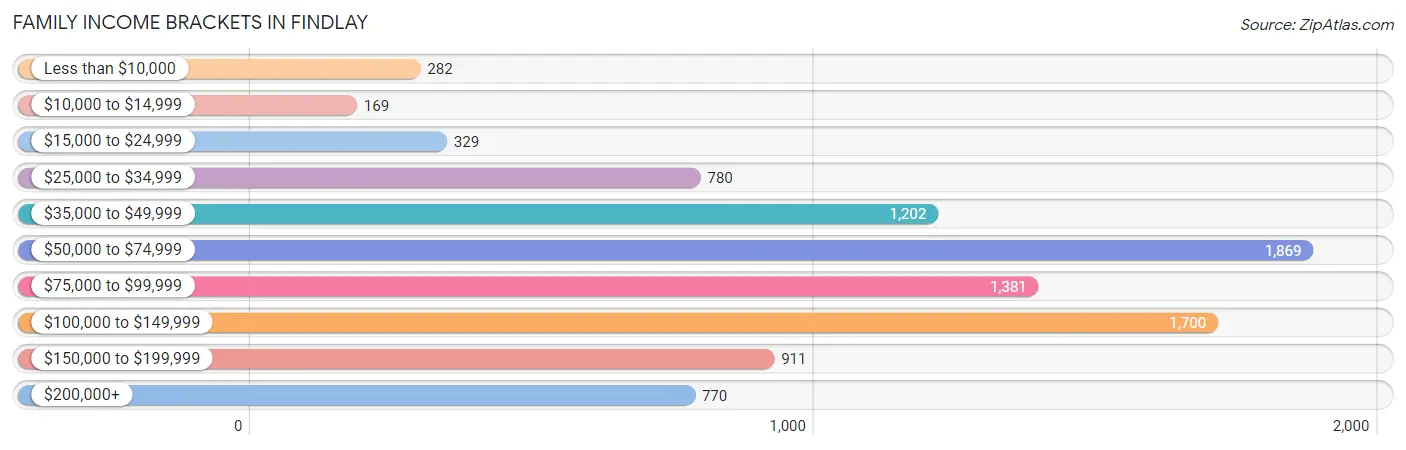
Family Income Brackets in Findlay
According to the Findlay family income data, there are 1,869 families falling into the $50,000 to $74,999 income range, which is the most common income bracket and makes up 19.9% of all families. Conversely, the $10,000 to $14,999 income bracket is the least frequent group with only 169 families (1.8%) belonging to this category.
| Income Bracket | # Families | % Families |
| Less than $10,000 | 282 | 3.0% |
| $10,000 to $14,999 | 169 | 1.8% |
| $15,000 to $24,999 | 329 | 3.5% |
| $25,000 to $34,999 | 780 | 8.3% |
| $35,000 to $49,999 | 1,202 | 12.8% |
| $50,000 to $74,999 | 1,869 | 19.9% |
| $75,000 to $99,999 | 1,381 | 14.7% |
| $100,000 to $149,999 | 1,700 | 18.1% |
| $150,000 to $199,999 | 911 | 9.7% |
| $200,000+ | 770 | 8.2% |
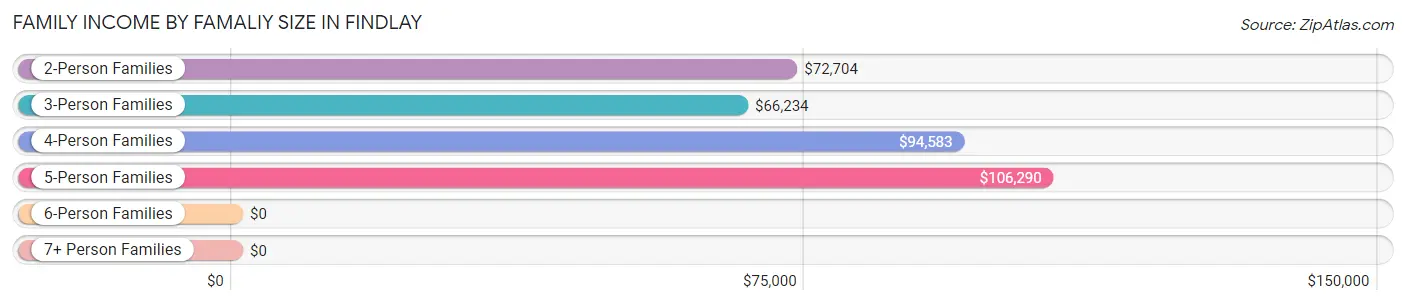
Family Income by Famaliy Size in Findlay
5-person families (801 | 8.5%) account for the highest median family income in Findlay with $106,290 per family, while 2-person families (4,835 | 51.5%) have the highest median income of $36,352 per family member.
| Income Bracket | # Families | Median Income |
| 2-Person Families | 4,835 (51.5%) | $72,704 |
| 3-Person Families | 2,085 (22.2%) | $66,234 |
| 4-Person Families | 1,474 (15.7%) | $94,583 |
| 5-Person Families | 801 (8.5%) | $106,290 |
| 6-Person Families | 142 (1.5%) | $0 |
| 7+ Person Families | 57 (0.6%) | $0 |
| Total | 9,394 (100.0%) | $76,220 |
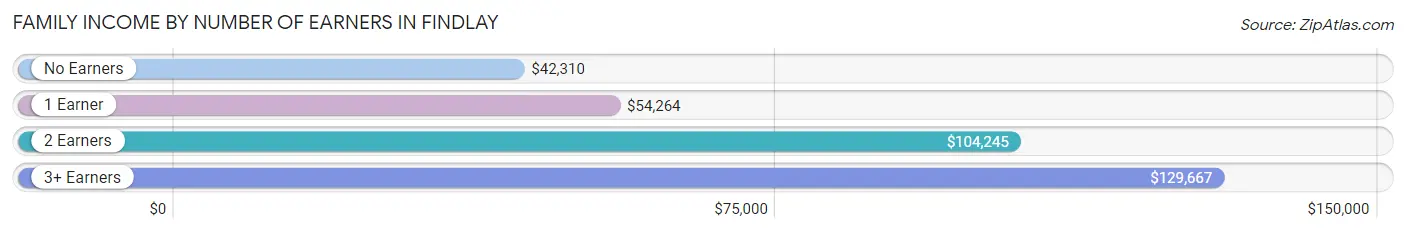
Family Income by Number of Earners in Findlay
The median family income in Findlay is $76,220, with families comprising 3+ earners (972) having the highest median family income of $129,667, while families with no earners (1,515) have the lowest median family income of $42,310, accounting for 10.3% and 16.1% of families, respectively.
| Number of Earners | # Families | Median Income |
| No Earners | 1,515 (16.1%) | $42,310 |
| 1 Earner | 3,307 (35.2%) | $54,264 |
| 2 Earners | 3,600 (38.3%) | $104,245 |
| 3+ Earners | 972 (10.3%) | $129,667 |
| Total | 9,394 (100.0%) | $76,220 |
Household Income in Findlay
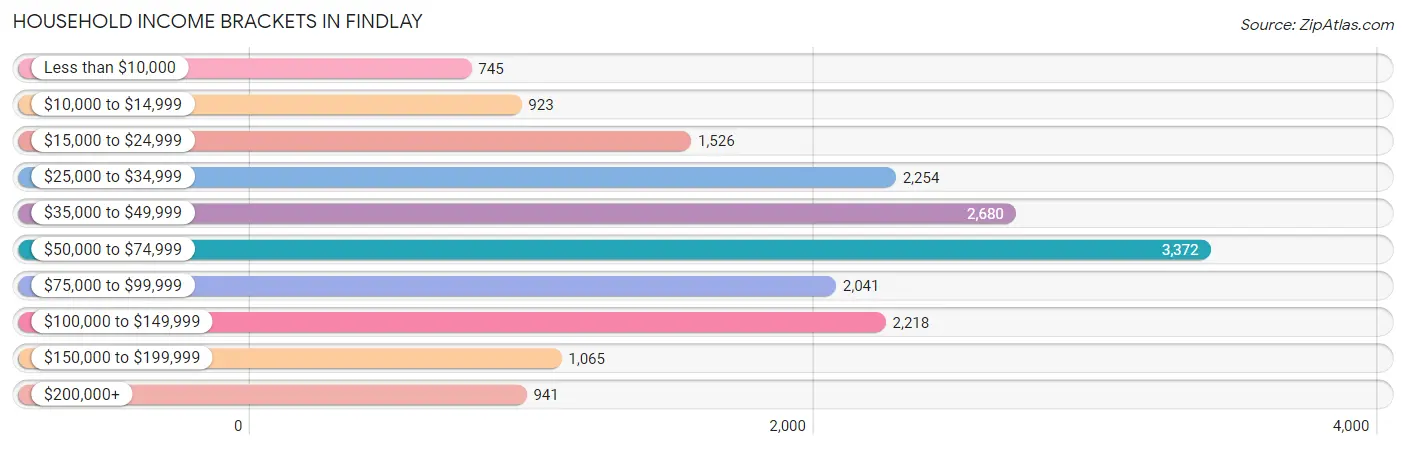
Household Income Brackets in Findlay
With 3,372 households falling in the category, the $50,000 to $74,999 income range is the most frequent in Findlay, accounting for 19.0% of all households. In contrast, only 745 households (4.2%) fall into the less than $10,000 income bracket, making it the least populous group.
| Income Bracket | # Households | % Households |
| Less than $10,000 | 745 | 4.2% |
| $10,000 to $14,999 | 923 | 5.2% |
| $15,000 to $24,999 | 1,526 | 8.6% |
| $25,000 to $34,999 | 2,254 | 12.7% |
| $35,000 to $49,999 | 2,680 | 15.1% |
| $50,000 to $74,999 | 3,372 | 19.0% |
| $75,000 to $99,999 | 2,041 | 11.5% |
| $100,000 to $149,999 | 2,218 | 12.5% |
| $150,000 to $199,999 | 1,065 | 6.0% |
| $200,000+ | 941 | 5.3% |
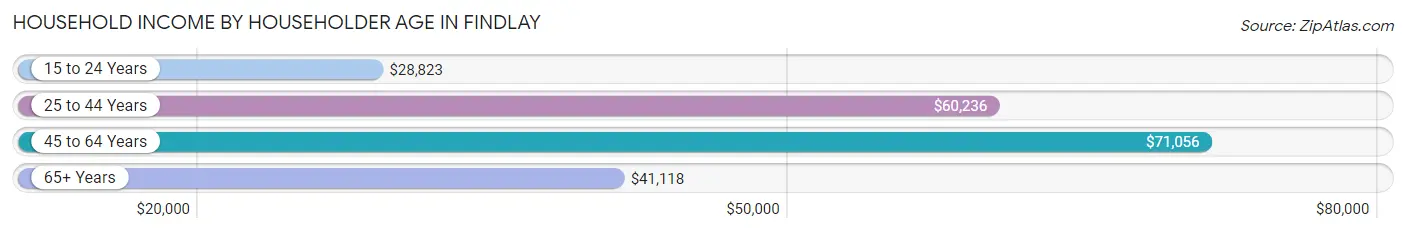
Household Income by Householder Age in Findlay
The median household income in Findlay is $54,986, with the highest median household income of $71,056 found in the 45 to 64 years age bracket for the primary householder. A total of 5,594 households (31.5%) fall into this category. Meanwhile, the 15 to 24 years age bracket for the primary householder has the lowest median household income of $28,823, with 1,367 households (7.7%) in this group.
| Income Bracket | # Households | Median Income |
| 15 to 24 Years | 1,367 (7.7%) | $28,823 |
| 25 to 44 Years | 5,778 (32.6%) | $60,236 |
| 45 to 64 Years | 5,594 (31.5%) | $71,056 |
| 65+ Years | 5,008 (28.2%) | $41,118 |
| Total | 17,747 (100.0%) | $54,986 |
Poverty in Findlay
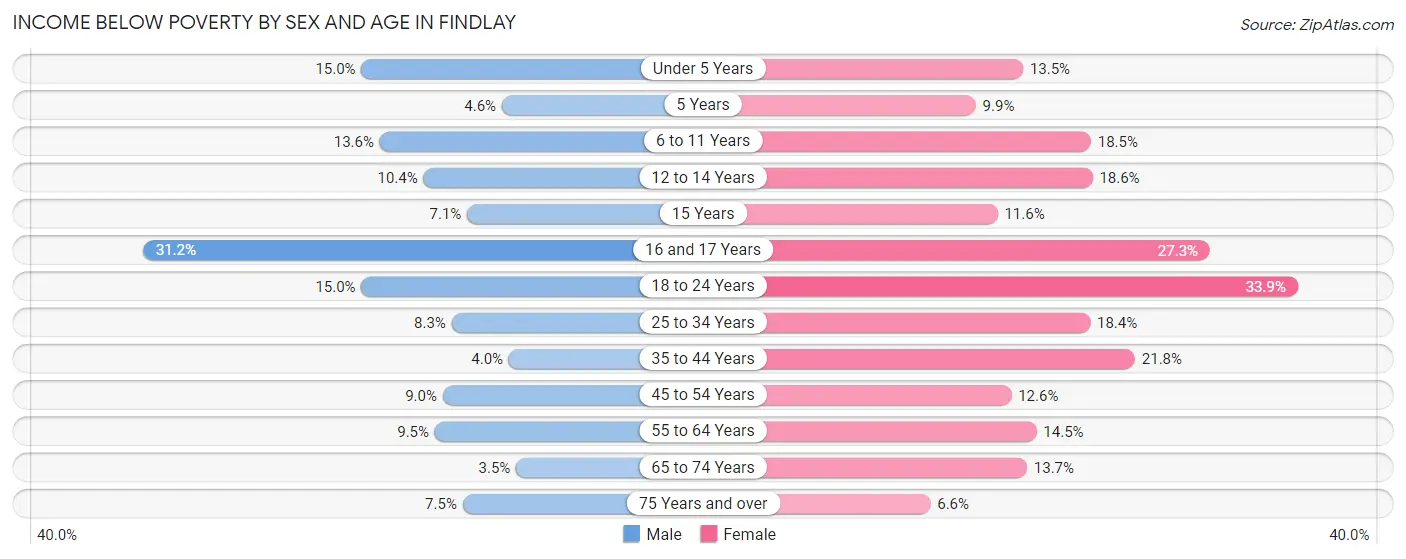
Income Below Poverty by Sex and Age in Findlay
With 9.5% poverty level for males and 17.0% for females among the residents of Findlay, 16 and 17 year old males and 18 to 24 year old females are the most vulnerable to poverty, with 113 males (31.2%) and 636 females (33.9%) in their respective age groups living below the poverty level.
| Age Bracket | Male | Female |
| Under 5 Years | 177 (15.0%) | 166 (13.5%) |
| 5 Years | 11 (4.6%) | 34 (9.9%) |
| 6 to 11 Years | 193 (13.6%) | 194 (18.5%) |
| 12 to 14 Years | 77 (10.4%) | 115 (18.6%) |
| 15 Years | 18 (7.1%) | 26 (11.6%) |
| 16 and 17 Years | 113 (31.2%) | 88 (27.3%) |
| 18 to 24 Years | 267 (15.0%) | 636 (33.9%) |
| 25 to 34 Years | 275 (8.3%) | 541 (18.4%) |
| 35 to 44 Years | 87 (4.0%) | 498 (21.8%) |
| 45 to 54 Years | 183 (8.9%) | 295 (12.6%) |
| 55 to 64 Years | 234 (9.5%) | 356 (14.4%) |
| 65 to 74 Years | 61 (3.5%) | 287 (13.7%) |
| 75 Years and over | 91 (7.5%) | 131 (6.6%) |
| Total | 1,787 (9.5%) | 3,367 (17.0%) |
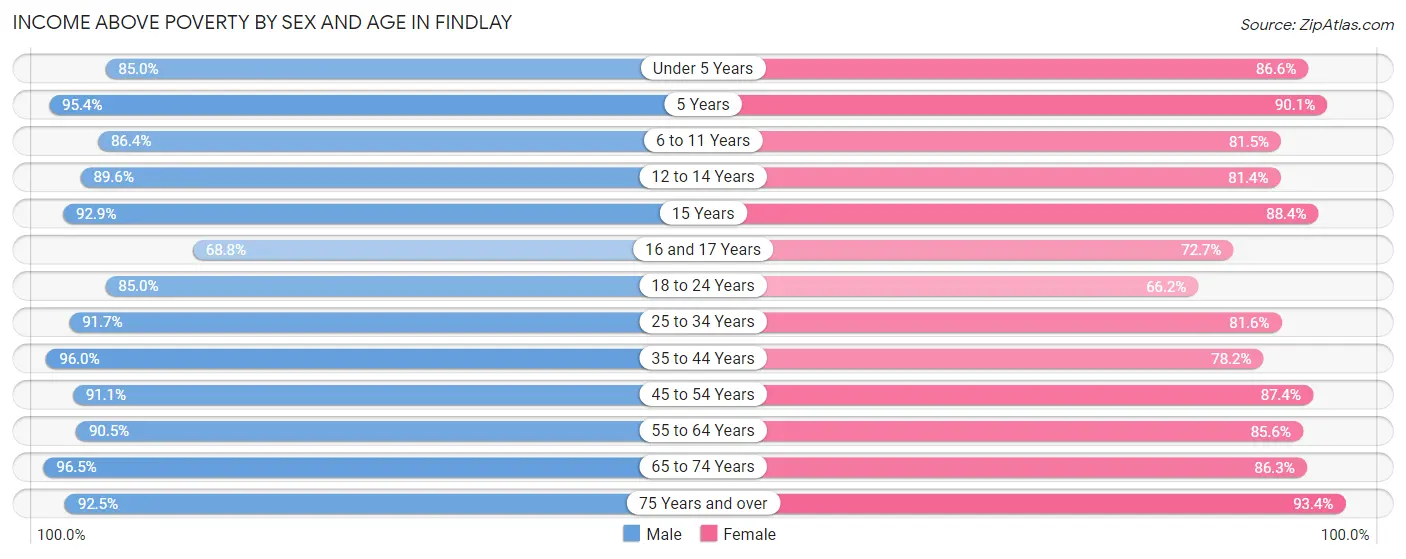
Income Above Poverty by Sex and Age in Findlay
According to the poverty statistics in Findlay, males aged 65 to 74 years and females aged 75 years and over are the age groups that are most secure financially, with 96.5% of males and 93.4% of females in these age groups living above the poverty line.
| Age Bracket | Male | Female |
| Under 5 Years | 1,004 (85.0%) | 1,068 (86.6%) |
| 5 Years | 230 (95.4%) | 308 (90.1%) |
| 6 to 11 Years | 1,223 (86.4%) | 855 (81.5%) |
| 12 to 14 Years | 665 (89.6%) | 503 (81.4%) |
| 15 Years | 234 (92.9%) | 199 (88.4%) |
| 16 and 17 Years | 249 (68.8%) | 234 (72.7%) |
| 18 to 24 Years | 1,514 (85.0%) | 1,243 (66.1%) |
| 25 to 34 Years | 3,044 (91.7%) | 2,395 (81.6%) |
| 35 to 44 Years | 2,065 (96.0%) | 1,791 (78.2%) |
| 45 to 54 Years | 1,862 (91.0%) | 2,050 (87.4%) |
| 55 to 64 Years | 2,220 (90.5%) | 2,108 (85.6%) |
| 65 to 74 Years | 1,684 (96.5%) | 1,802 (86.3%) |
| 75 Years and over | 1,127 (92.5%) | 1,862 (93.4%) |
| Total | 17,121 (90.5%) | 16,418 (83.0%) |
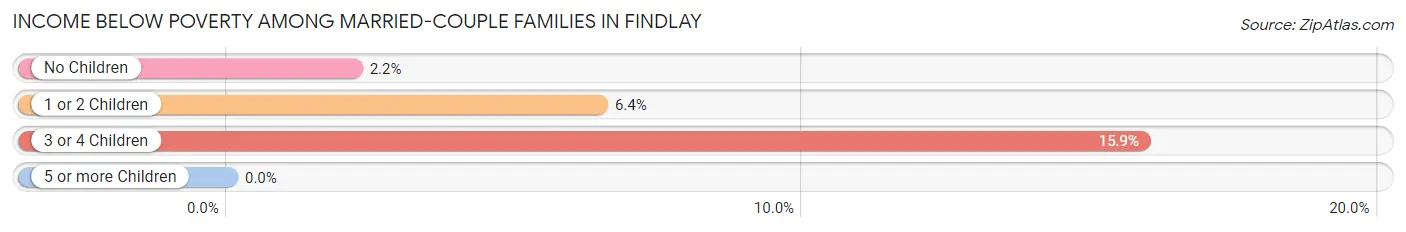
Income Below Poverty Among Married-Couple Families in Findlay
The poverty statistics for married-couple families in Findlay show that 4.9% or 323 of the total 6,654 families live below the poverty line. Families with 3 or 4 children have the highest poverty rate of 15.9%, comprising of 112 families. On the other hand, families with 5 or more children have the lowest poverty rate of 0.0%, which includes 0 families.
| Children | Above Poverty | Below Poverty |
| No Children | 3,918 (97.8%) | 87 (2.2%) |
| 1 or 2 Children | 1,801 (93.6%) | 124 (6.4%) |
| 3 or 4 Children | 593 (84.1%) | 112 (15.9%) |
| 5 or more Children | 19 (100.0%) | 0 (0.0%) |
| Total | 6,331 (95.2%) | 323 (4.9%) |
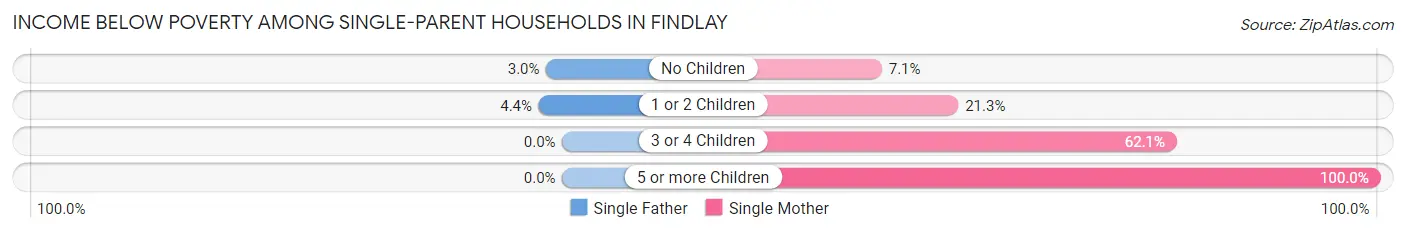
Income Below Poverty Among Single-Parent Households in Findlay
According to the poverty data in Findlay, 3.7% or 25 single-father households and 21.1% or 436 single-mother households are living below the poverty line. Among single-father households, those with 1 or 2 children have the highest poverty rate, with 19 households (4.4%) experiencing poverty. Likewise, among single-mother households, those with 5 or more children have the highest poverty rate, with 9 households (100.0%) falling below the poverty line.
| Children | Single Father | Single Mother |
| No Children | 6 (3.0%) | 45 (7.1%) |
| 1 or 2 Children | 19 (4.4%) | 261 (21.3%) |
| 3 or 4 Children | 0 (0.0%) | 121 (62.1%) |
| 5 or more Children | 0 (0.0%) | 9 (100.0%) |
| Total | 25 (3.7%) | 436 (21.1%) |
Income Below Poverty Among Married-Couple vs Single-Parent Households in Findlay
The poverty data for Findlay shows that 323 of the married-couple family households (4.9%) and 461 of the single-parent households (16.8%) are living below the poverty level. Within the married-couple family households, those with 3 or 4 children have the highest poverty rate, with 112 households (15.9%) falling below the poverty line. Among the single-parent households, those with 5 or more children have the highest poverty rate, with 9 household (100.0%) living below poverty.
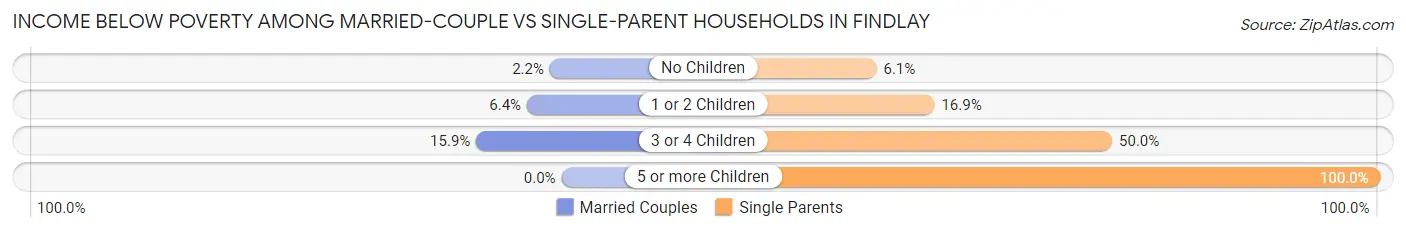
| Children | Married-Couple Families | Single-Parent Households |
| No Children | 87 (2.2%) | 51 (6.1%) |
| 1 or 2 Children | 124 (6.4%) | 280 (16.9%) |
| 3 or 4 Children | 112 (15.9%) | 121 (50.0%) |
| 5 or more Children | 0 (0.0%) | 9 (100.0%) |
| Total | 323 (4.9%) | 461 (16.8%) |
Race in Findlay
The most populous races in Findlay are White / Caucasian (35,654 | 88.2%), Hispanic or Latino (3,300 | 8.2%), and Two or more Races (1,510 | 3.7%).
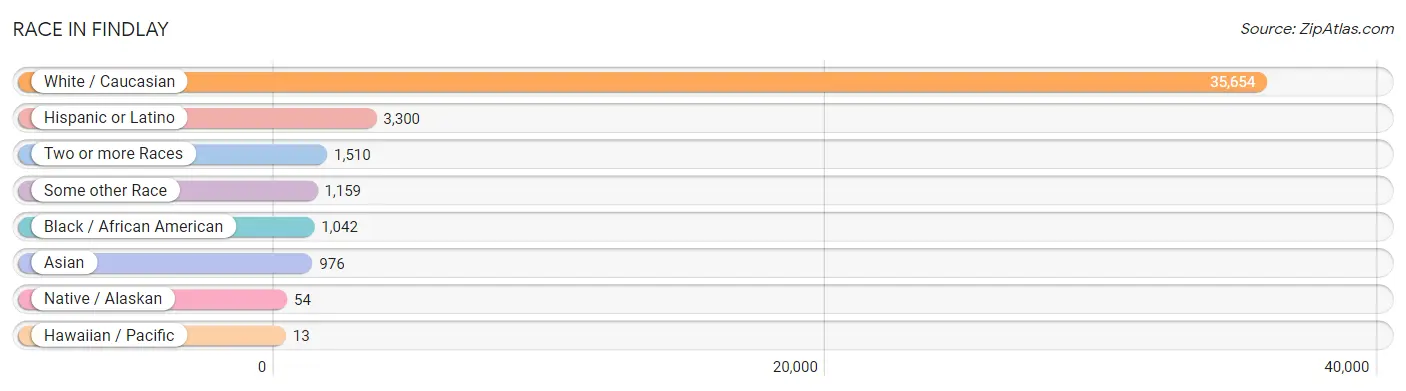
| Race | # Population | % Population |
| Asian | 976 | 2.4% |
| Black / African American | 1,042 | 2.6% |
| Hawaiian / Pacific | 13 | 0.0% |
| Hispanic or Latino | 3,300 | 8.2% |
| Native / Alaskan | 54 | 0.1% |
| White / Caucasian | 35,654 | 88.2% |
| Two or more Races | 1,510 | 3.7% |
| Some other Race | 1,159 | 2.9% |
| Total | 40,408 | 100.0% |
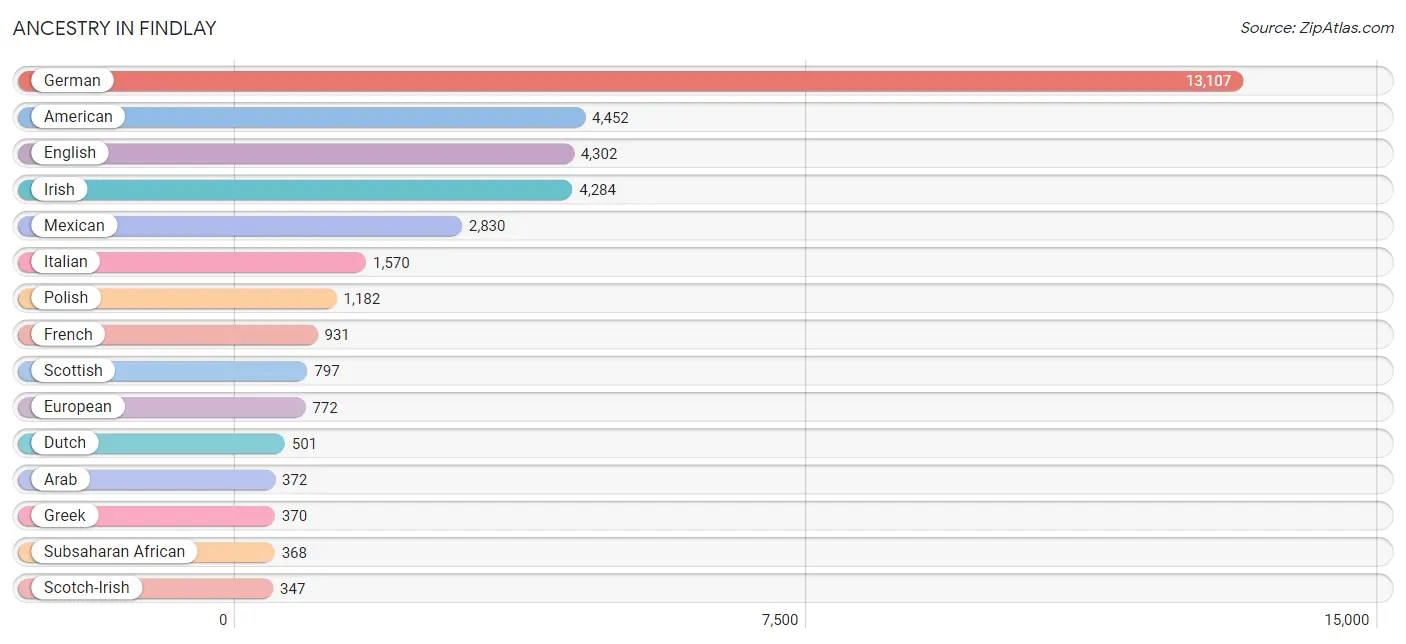
Ancestry in Findlay
The most populous ancestries reported in Findlay are German (13,107 | 32.4%), American (4,452 | 11.0%), English (4,302 | 10.6%), Irish (4,284 | 10.6%), and Mexican (2,830 | 7.0%), together accounting for 71.7% of all Findlay residents.
| Ancestry | # Population | % Population |
| African | 172 | 0.4% |
| American | 4,452 | 11.0% |
| Arab | 372 | 0.9% |
| Austrian | 11 | 0.0% |
| Barbadian | 9 | 0.0% |
| Belgian | 97 | 0.2% |
| Bhutanese | 343 | 0.9% |
| Blackfeet | 20 | 0.1% |
| British | 207 | 0.5% |
| British West Indian | 21 | 0.1% |
| Bulgarian | 15 | 0.0% |
| Burmese | 21 | 0.1% |
| Canadian | 29 | 0.1% |
| Carpatho Rusyn | 23 | 0.1% |
| Central American | 30 | 0.1% |
| Cherokee | 68 | 0.2% |
| Chilean | 4 | 0.0% |
| Chippewa | 16 | 0.0% |
| Choctaw | 10 | 0.0% |
| Croatian | 19 | 0.1% |
| Czech | 91 | 0.2% |
| Czechoslovakian | 14 | 0.0% |
| Danish | 205 | 0.5% |
| Dutch | 501 | 1.2% |
| Eastern European | 100 | 0.3% |
| Ecuadorian | 35 | 0.1% |
| English | 4,302 | 10.6% |
| Ethiopian | 3 | 0.0% |
| European | 772 | 1.9% |
| Filipino | 11 | 0.0% |
| Finnish | 40 | 0.1% |
| French | 931 | 2.3% |
| French Canadian | 68 | 0.2% |
| German | 13,107 | 32.4% |
| Greek | 370 | 0.9% |
| Guyanese | 8 | 0.0% |
| Honduran | 30 | 0.1% |
| Hungarian | 173 | 0.4% |
| Indian (Asian) | 288 | 0.7% |
| Irish | 4,284 | 10.6% |
| Iroquois | 32 | 0.1% |
| Italian | 1,570 | 3.9% |
| Jamaican | 11 | 0.0% |
| Jordanian | 54 | 0.1% |
| Kenyan | 25 | 0.1% |
| Korean | 70 | 0.2% |
| Lebanese | 49 | 0.1% |
| Liberian | 168 | 0.4% |
| Lithuanian | 52 | 0.1% |
| Lumbee | 16 | 0.0% |
| Malaysian | 74 | 0.2% |
| Mexican | 2,830 | 7.0% |
| Mongolian | 21 | 0.1% |
| Northern European | 28 | 0.1% |
| Norwegian | 96 | 0.2% |
| Palestinian | 6 | 0.0% |
| Pennsylvania German | 15 | 0.0% |
| Peruvian | 21 | 0.1% |
| Polish | 1,182 | 2.9% |
| Portuguese | 30 | 0.1% |
| Puerto Rican | 273 | 0.7% |
| Romanian | 60 | 0.2% |
| Russian | 56 | 0.1% |
| Scandinavian | 90 | 0.2% |
| Scotch-Irish | 347 | 0.9% |
| Scottish | 797 | 2.0% |
| Serbian | 28 | 0.1% |
| Slovak | 202 | 0.5% |
| Slovene | 8 | 0.0% |
| South American | 60 | 0.2% |
| Spanish | 87 | 0.2% |
| Sri Lankan | 139 | 0.3% |
| Subsaharan African | 368 | 0.9% |
| Swedish | 207 | 0.5% |
| Swiss | 295 | 0.7% |
| Syrian | 9 | 0.0% |
| Thai | 142 | 0.4% |
| Tohono O'Odham | 1 | 0.0% |
| Tongan | 13 | 0.0% |
| Ukrainian | 57 | 0.1% |
| Welsh | 344 | 0.9% | View All 81 Rows |
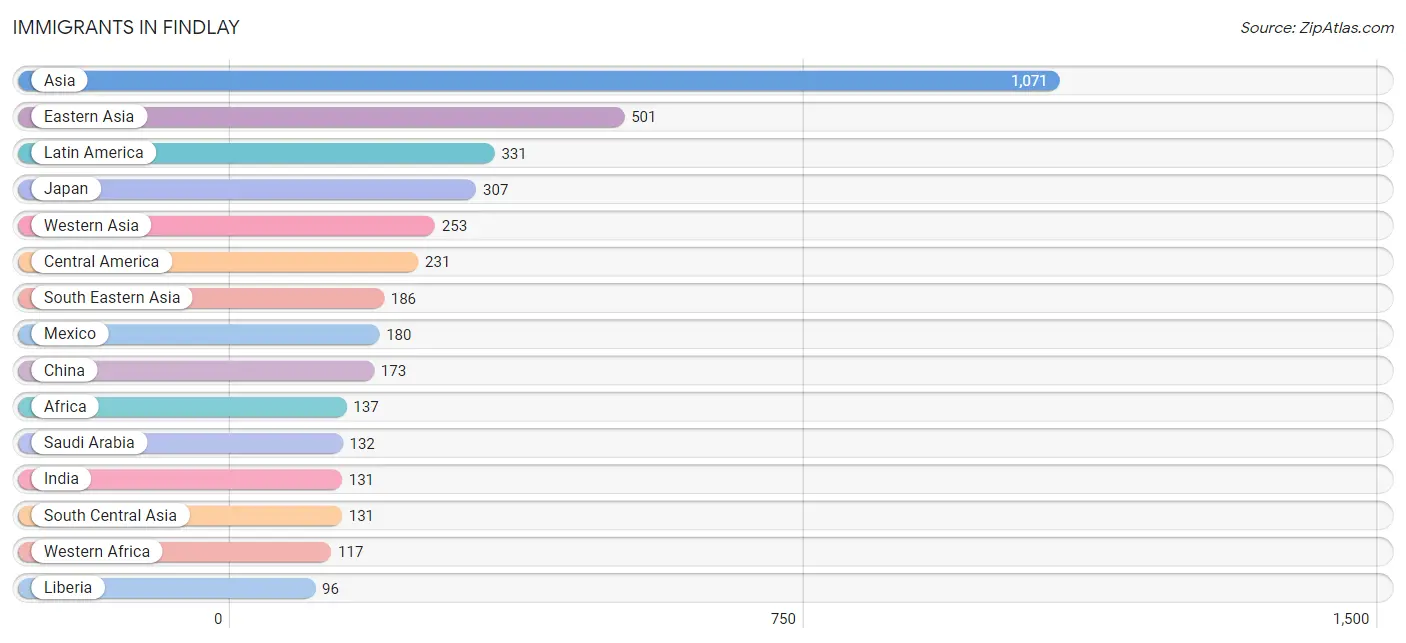
Immigrants in Findlay
The most numerous immigrant groups reported in Findlay came from Asia (1,071 | 2.6%), Eastern Asia (501 | 1.2%), Latin America (331 | 0.8%), Japan (307 | 0.8%), and Western Asia (253 | 0.6%), together accounting for 6.1% of all Findlay residents.
| Immigration Origin | # Population | % Population |
| Africa | 137 | 0.3% |
| Asia | 1,071 | 2.6% |
| Barbados | 9 | 0.0% |
| Belize | 21 | 0.1% |
| Brazil | 39 | 0.1% |
| Canada | 13 | 0.0% |
| Caribbean | 9 | 0.0% |
| Central America | 231 | 0.6% |
| China | 173 | 0.4% |
| Eastern Africa | 9 | 0.0% |
| Eastern Asia | 501 | 1.2% |
| Eastern Europe | 6 | 0.0% |
| Ecuador | 35 | 0.1% |
| England | 2 | 0.0% |
| Ethiopia | 3 | 0.0% |
| Europe | 50 | 0.1% |
| Germany | 27 | 0.1% |
| Honduras | 30 | 0.1% |
| Hong Kong | 8 | 0.0% |
| India | 131 | 0.3% |
| Iraq | 81 | 0.2% |
| Japan | 307 | 0.8% |
| Kenya | 6 | 0.0% |
| Korea | 21 | 0.1% |
| Kuwait | 15 | 0.0% |
| Laos | 77 | 0.2% |
| Latin America | 331 | 0.8% |
| Lebanon | 25 | 0.1% |
| Liberia | 96 | 0.2% |
| Mexico | 180 | 0.4% |
| Northern Africa | 11 | 0.0% |
| Northern Europe | 17 | 0.0% |
| Peru | 17 | 0.0% |
| Philippines | 38 | 0.1% |
| Russia | 6 | 0.0% |
| Saudi Arabia | 132 | 0.3% |
| Scotland | 15 | 0.0% |
| Sierra Leone | 21 | 0.1% |
| South America | 91 | 0.2% |
| South Central Asia | 131 | 0.3% |
| South Eastern Asia | 186 | 0.5% |
| Vietnam | 71 | 0.2% |
| Western Africa | 117 | 0.3% |
| Western Asia | 253 | 0.6% |
| Western Europe | 27 | 0.1% | View All 45 Rows |
Sex and Age in Findlay
Sex and Age in Findlay
The most populous age groups in Findlay are 25 to 29 Years (1,788 | 9.2%) for men and 20 to 24 Years (1,809 | 8.6%) for women.
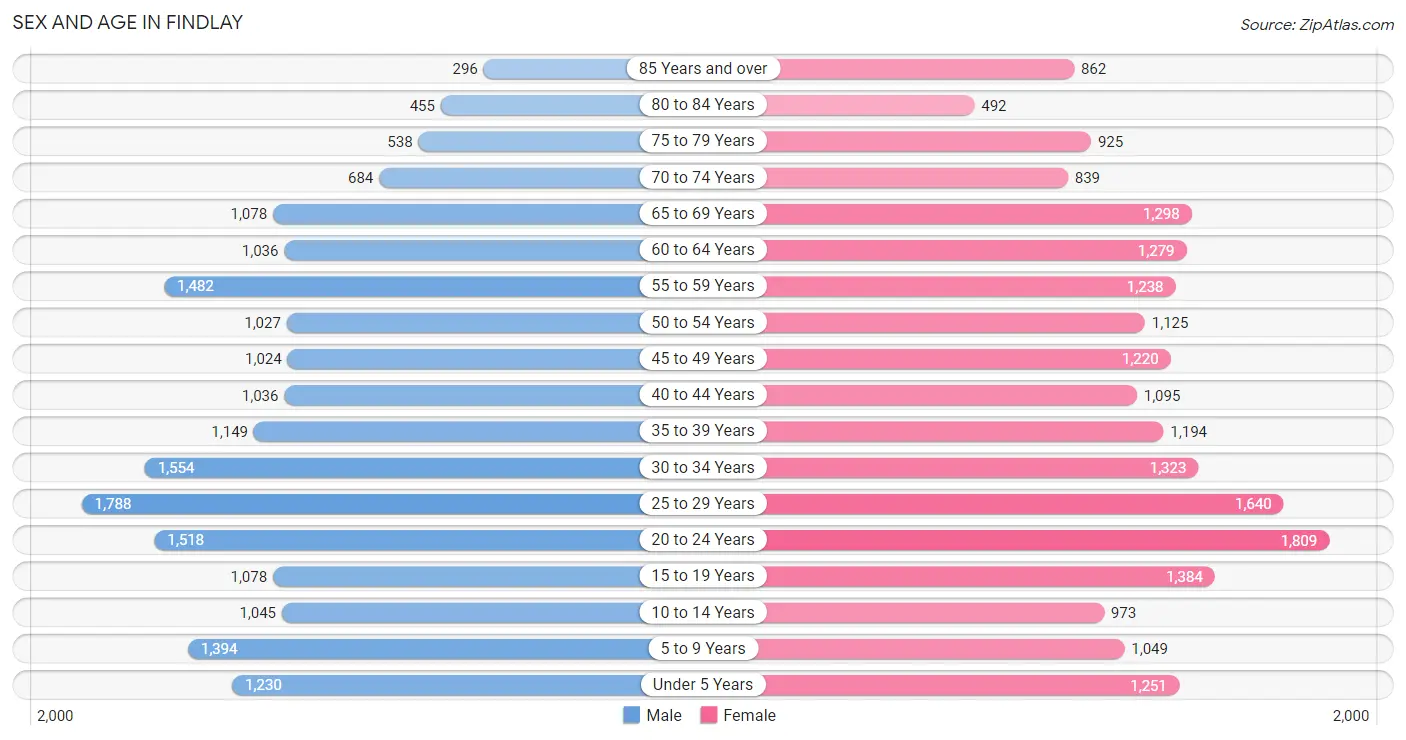
| Age Bracket | Male | Female |
| Under 5 Years | 1,230 (6.3%) | 1,251 (6.0%) |
| 5 to 9 Years | 1,394 (7.2%) | 1,049 (5.0%) |
| 10 to 14 Years | 1,045 (5.4%) | 973 (4.6%) |
| 15 to 19 Years | 1,078 (5.6%) | 1,384 (6.6%) |
| 20 to 24 Years | 1,518 (7.8%) | 1,809 (8.6%) |
| 25 to 29 Years | 1,788 (9.2%) | 1,640 (7.8%) |
| 30 to 34 Years | 1,554 (8.0%) | 1,323 (6.3%) |
| 35 to 39 Years | 1,149 (5.9%) | 1,194 (5.7%) |
| 40 to 44 Years | 1,036 (5.3%) | 1,095 (5.2%) |
| 45 to 49 Years | 1,024 (5.3%) | 1,220 (5.8%) |
| 50 to 54 Years | 1,027 (5.3%) | 1,125 (5.4%) |
| 55 to 59 Years | 1,482 (7.6%) | 1,238 (5.9%) |
| 60 to 64 Years | 1,036 (5.3%) | 1,279 (6.1%) |
| 65 to 69 Years | 1,078 (5.6%) | 1,298 (6.2%) |
| 70 to 74 Years | 684 (3.5%) | 839 (4.0%) |
| 75 to 79 Years | 538 (2.8%) | 925 (4.4%) |
| 80 to 84 Years | 455 (2.3%) | 492 (2.3%) |
| 85 Years and over | 296 (1.5%) | 862 (4.1%) |
| Total | 19,412 (100.0%) | 20,996 (100.0%) |
Families and Households in Findlay
Median Family Size in Findlay
The median family size in Findlay is 2.92 persons per family, with married-couple families (6,654 | 70.8%) accounting for the largest median family size of 3.08 persons per family. On the other hand, single female/mother families (2,061 | 21.9%) represent the smallest median family size with 2.48 persons per family.
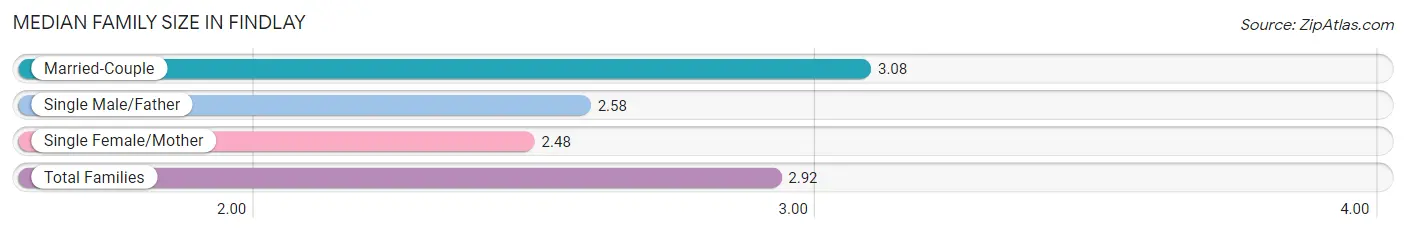
| Family Type | # Families | Family Size |
| Married-Couple | 6,654 (70.8%) | 3.08 |
| Single Male/Father | 679 (7.2%) | 2.58 |
| Single Female/Mother | 2,061 (21.9%) | 2.48 |
| Total Families | 9,394 (100.0%) | 2.92 |
Median Household Size in Findlay
The median household size in Findlay is 2.18 persons per household, with married-couple households (6,654 | 37.5%) accounting for the largest median household size of 3.11 persons per household. non-family households (8,353 | 47.1%) represent the smallest median household size with 1.24 persons per household.
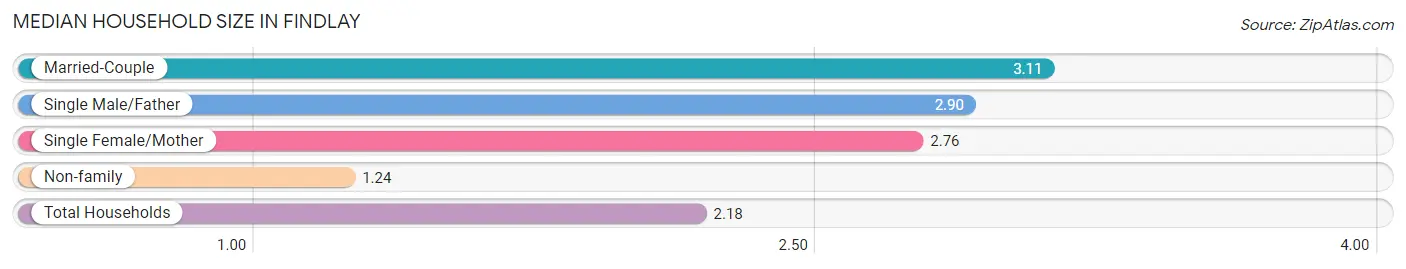
| Household Type | # Households | Household Size |
| Married-Couple | 6,654 (37.5%) | 3.11 |
| Single Male/Father | 679 (3.8%) | 2.90 |
| Single Female/Mother | 2,061 (11.6%) | 2.76 |
| Non-family | 8,353 (47.1%) | 1.24 |
| Total Households | 17,747 (100.0%) | 2.18 |
Household Size by Marriage Status in Findlay
Out of a total of 17,747 households in Findlay, 9,394 (52.9%) are family households, while 8,353 (47.1%) are nonfamily households. The most numerous type of family households are 2-person households, comprising 4,593, and the most common type of nonfamily households are 1-person households, comprising 6,859.
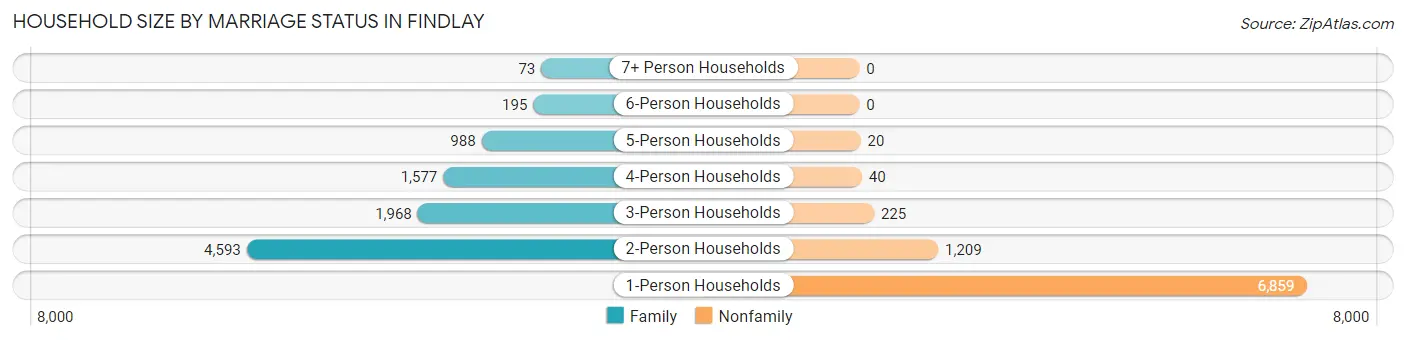
| Household Size | Family Households | Nonfamily Households |
| 1-Person Households | - | 6,859 (38.7%) |
| 2-Person Households | 4,593 (25.9%) | 1,209 (6.8%) |
| 3-Person Households | 1,968 (11.1%) | 225 (1.3%) |
| 4-Person Households | 1,577 (8.9%) | 40 (0.2%) |
| 5-Person Households | 988 (5.6%) | 20 (0.1%) |
| 6-Person Households | 195 (1.1%) | 0 (0.0%) |
| 7+ Person Households | 73 (0.4%) | 0 (0.0%) |
| Total | 9,394 (52.9%) | 8,353 (47.1%) |
Female Fertility in Findlay
Fertility by Age in Findlay
Average fertility rate in Findlay is 37.0 births per 1,000 women. Women in the age bracket of 20 to 34 years have the highest fertility rate with 66.0 births per 1,000 women. Women in the age bracket of 20 to 34 years acount for 87.1% of all women with births.
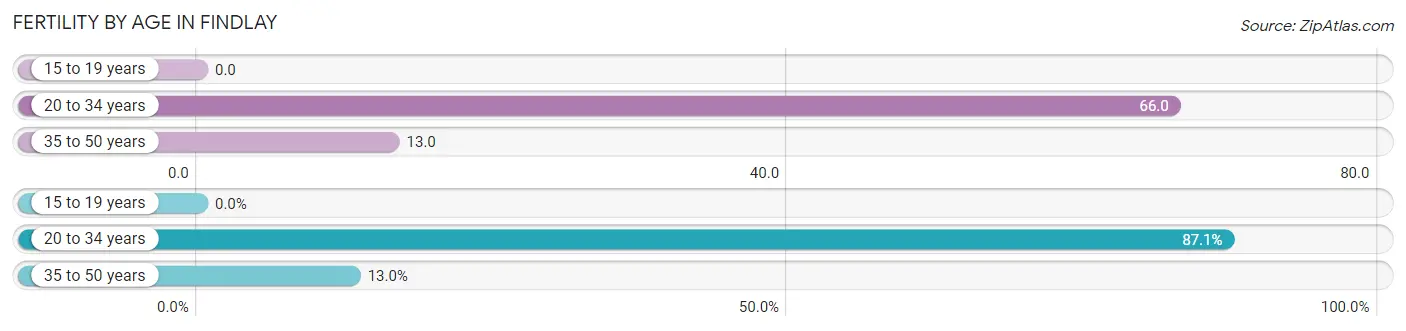
| Age Bracket | Women with Births | Births / 1,000 Women |
| 15 to 19 years | 0 (0.0%) | 0.0 |
| 20 to 34 years | 316 (87.1%) | 66.0 |
| 35 to 50 years | 47 (13.0%) | 13.0 |
| Total | 363 (100.0%) | 37.0 |
Fertility by Age by Marriage Status in Findlay
86.8% of women with births (363) in Findlay are married. The highest percentage of unmarried women with births falls into 20 to 34 years age bracket with 15.2% of them unmarried at the time of birth, while the lowest percentage of unmarried women with births belong to 35 to 50 years age bracket with 0.0% of them unmarried.
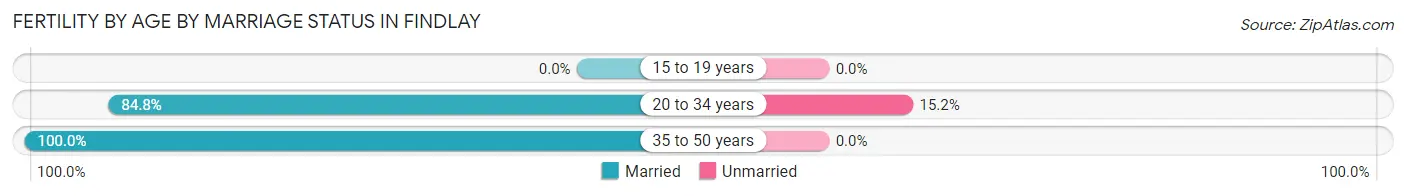
| Age Bracket | Married | Unmarried |
| 15 to 19 years | 0 (0.0%) | 0 (0.0%) |
| 20 to 34 years | 268 (84.8%) | 48 (15.2%) |
| 35 to 50 years | 47 (100.0%) | 0 (0.0%) |
| Total | 315 (86.8%) | 48 (13.2%) |
Fertility by Education in Findlay
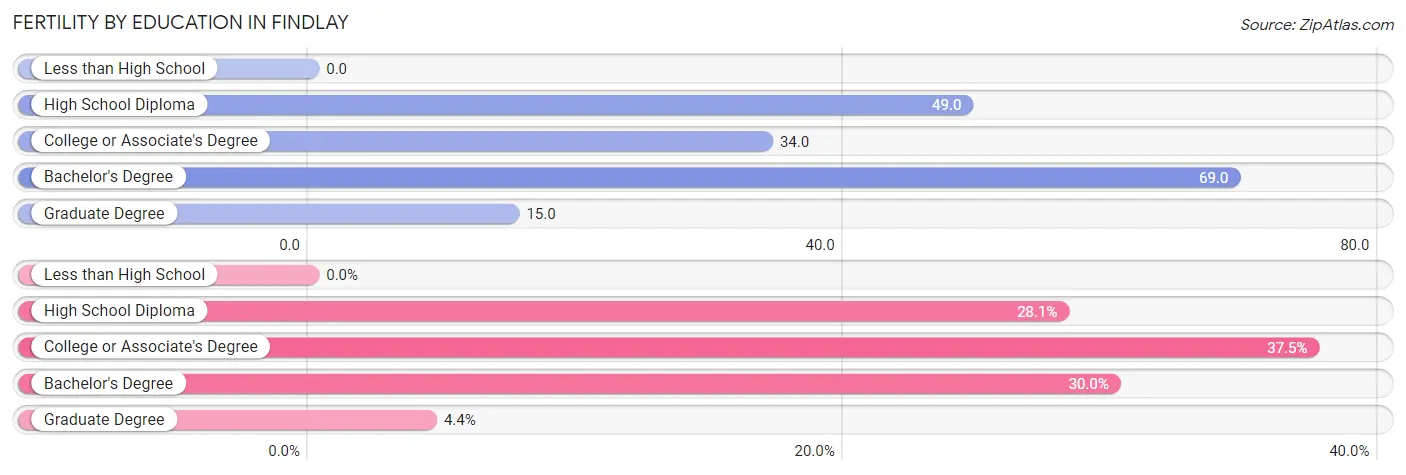
| Educational Attainment | Women with Births | Births / 1,000 Women |
| Less than High School | 0 (0.0%) | 0.0 |
| High School Diploma | 102 (28.1%) | 49.0 |
| College or Associate's Degree | 136 (37.5%) | 34.0 |
| Bachelor's Degree | 109 (30.0%) | 69.0 |
| Graduate Degree | 16 (4.4%) | 15.0 |
| Total | 363 (100.0%) | 37.0 |
Fertility by Education by Marriage Status in Findlay
13.2% of women with births in Findlay are unmarried. Women with the educational attainment of high school diploma are most likely to be married with 100.0% of them married at childbirth, while women with the educational attainment of college or associate's degree are least likely to be married with 35.3% of them unmarried at childbirth.
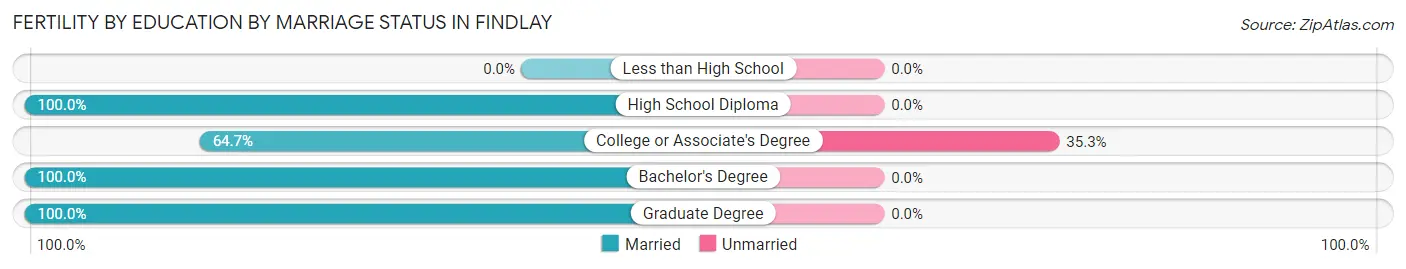
| Educational Attainment | Married | Unmarried |
| Less than High School | 0 (0.0%) | 0 (0.0%) |
| High School Diploma | 102 (100.0%) | 0 (0.0%) |
| College or Associate's Degree | 88 (64.7%) | 48 (35.3%) |
| Bachelor's Degree | 109 (100.0%) | 0 (0.0%) |
| Graduate Degree | 16 (100.0%) | 0 (0.0%) |
| Total | 315 (86.8%) | 48 (13.2%) |
Employment Characteristics in Findlay
Employment by Class of Employer in Findlay
Among the 19,496 employed individuals in Findlay, private company employees (14,536 | 74.6%), not-for-profit organizations (2,162 | 11.1%), and local government employees (1,121 | 5.8%) make up the most common classes of employment.
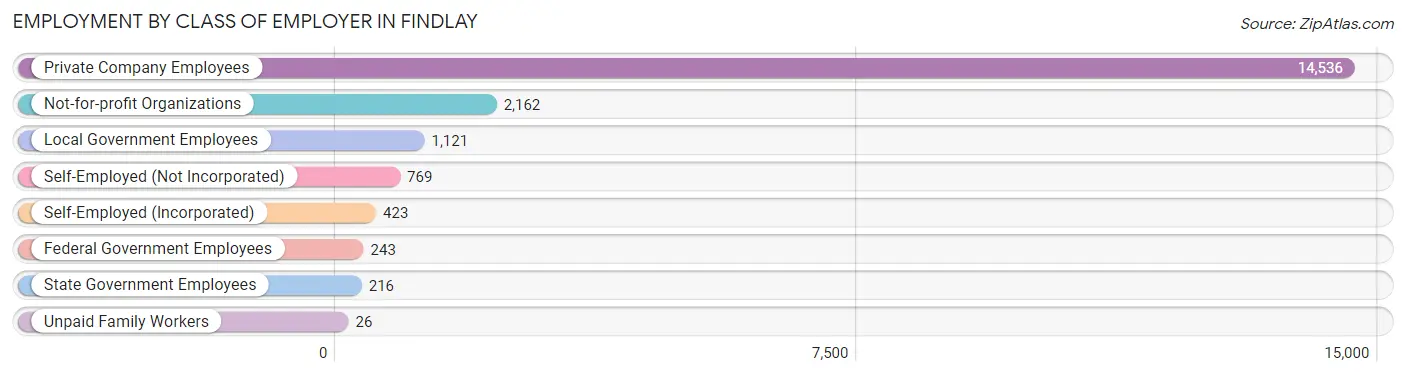
| Employer Class | # Employees | % Employees |
| Private Company Employees | 14,536 | 74.6% |
| Self-Employed (Incorporated) | 423 | 2.2% |
| Self-Employed (Not Incorporated) | 769 | 3.9% |
| Not-for-profit Organizations | 2,162 | 11.1% |
| Local Government Employees | 1,121 | 5.8% |
| State Government Employees | 216 | 1.1% |
| Federal Government Employees | 243 | 1.3% |
| Unpaid Family Workers | 26 | 0.1% |
| Total | 19,496 | 100.0% |
Employment Status by Age in Findlay
According to the labor force statistics for Findlay, out of the total population over 16 years of age (32,989), 63.3% or 20,882 individuals are in the labor force, with 4.3% or 898 of them unemployed. The age group with the highest labor force participation rate is 20 to 24 years, with 85.7% or 2,851 individuals in the labor force. Within the labor force, the 20 to 24 years age range has the highest percentage of unemployed individuals, with 9.9% or 282 of them being unemployed.
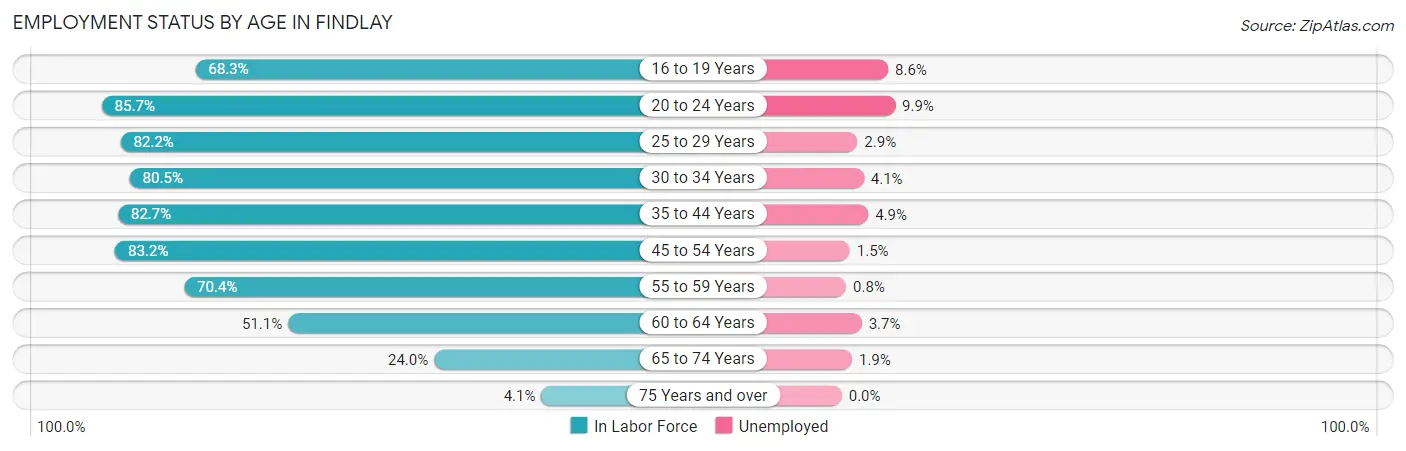
| Age Bracket | In Labor Force | Unemployed |
| 16 to 19 Years | 1,356 (68.3%) | 117 (8.6%) |
| 20 to 24 Years | 2,851 (85.7%) | 282 (9.9%) |
| 25 to 29 Years | 2,818 (82.2%) | 82 (2.9%) |
| 30 to 34 Years | 2,316 (80.5%) | 95 (4.1%) |
| 35 to 44 Years | 3,700 (82.7%) | 181 (4.9%) |
| 45 to 54 Years | 3,657 (83.2%) | 55 (1.5%) |
| 55 to 59 Years | 1,915 (70.4%) | 15 (0.8%) |
| 60 to 64 Years | 1,183 (51.1%) | 44 (3.7%) |
| 65 to 74 Years | 936 (24.0%) | 18 (1.9%) |
| 75 Years and over | 146 (4.1%) | 0 (0.0%) |
| Total | 20,882 (63.3%) | 898 (4.3%) |
Employment Status by Educational Attainment in Findlay
According to labor force statistics for Findlay, 77.1% of individuals (15,582) out of the total population between 25 and 64 years of age (20,210) are in the labor force, with 3.0% or 467 of them being unemployed. The group with the highest labor force participation rate are those with the educational attainment of bachelor's degree or higher, with 81.8% or 5,023 individuals in the labor force. Within the labor force, individuals with less than high school education have the highest percentage of unemployment, with 8.5% or 58 of them being unemployed.
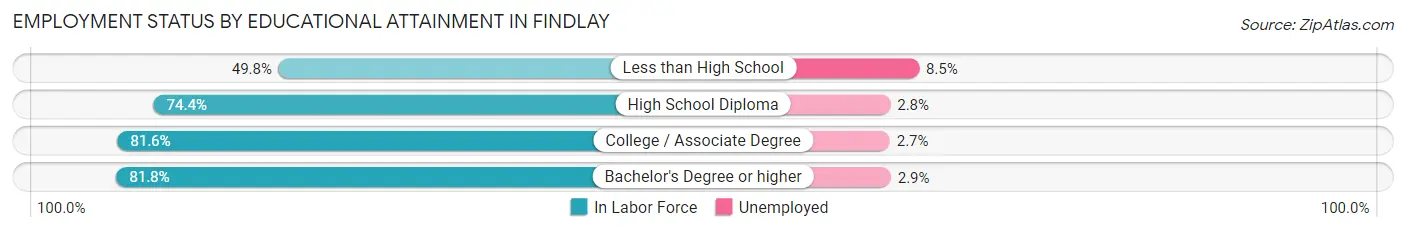
| Educational Attainment | In Labor Force | Unemployed |
| Less than High School | 682 (49.8%) | 116 (8.5%) |
| High School Diploma | 4,940 (74.4%) | 186 (2.8%) |
| College / Associate Degree | 4,944 (81.6%) | 164 (2.7%) |
| Bachelor's Degree or higher | 5,023 (81.8%) | 178 (2.9%) |
| Total | 15,582 (77.1%) | 606 (3.0%) |
Employment Occupations by Sex in Findlay
Management, Business, Science and Arts Occupations
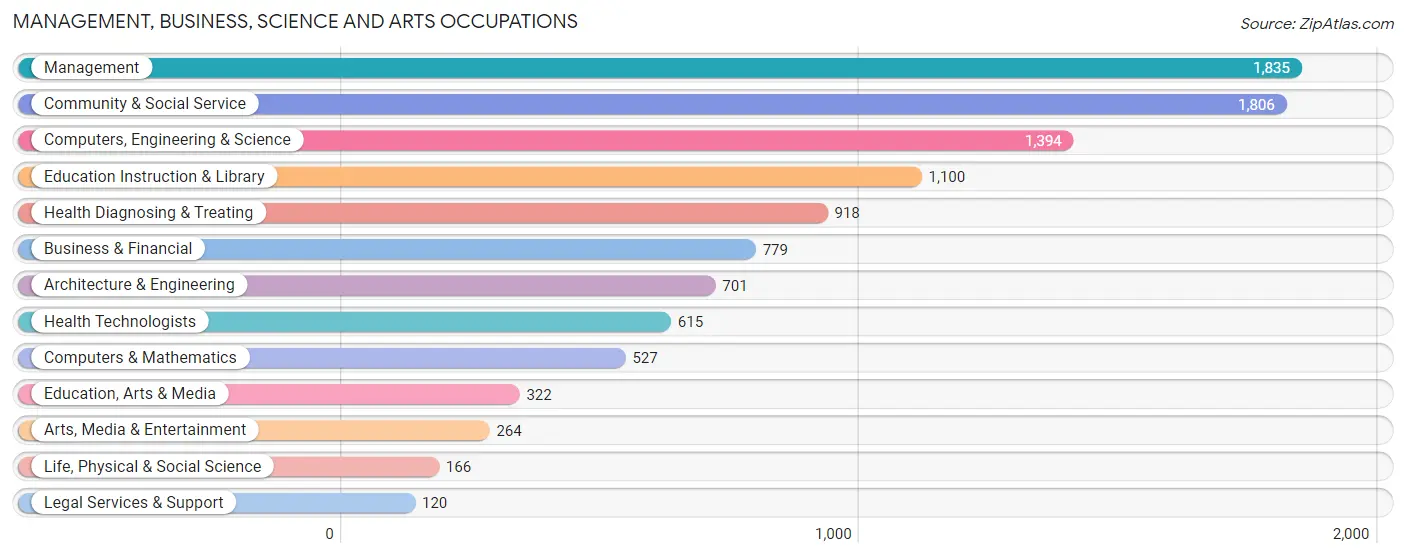
The most common Management, Business, Science and Arts occupations in Findlay are Management (1,835 | 9.2%), Community & Social Service (1,806 | 9.0%), Computers, Engineering & Science (1,394 | 7.0%), Education Instruction & Library (1,100 | 5.5%), and Health Diagnosing & Treating (918 | 4.6%).
Management, Business, Science and Arts Occupations by Sex
Within the Management, Business, Science and Arts occupations in Findlay, the most male-oriented occupations are Architecture & Engineering (87.0%), Computers & Mathematics (80.3%), and Computers, Engineering & Science (79.4%), while the most female-oriented occupations are Health Diagnosing & Treating (76.6%), Health Technologists (75.3%), and Arts, Media & Entertainment (63.6%).
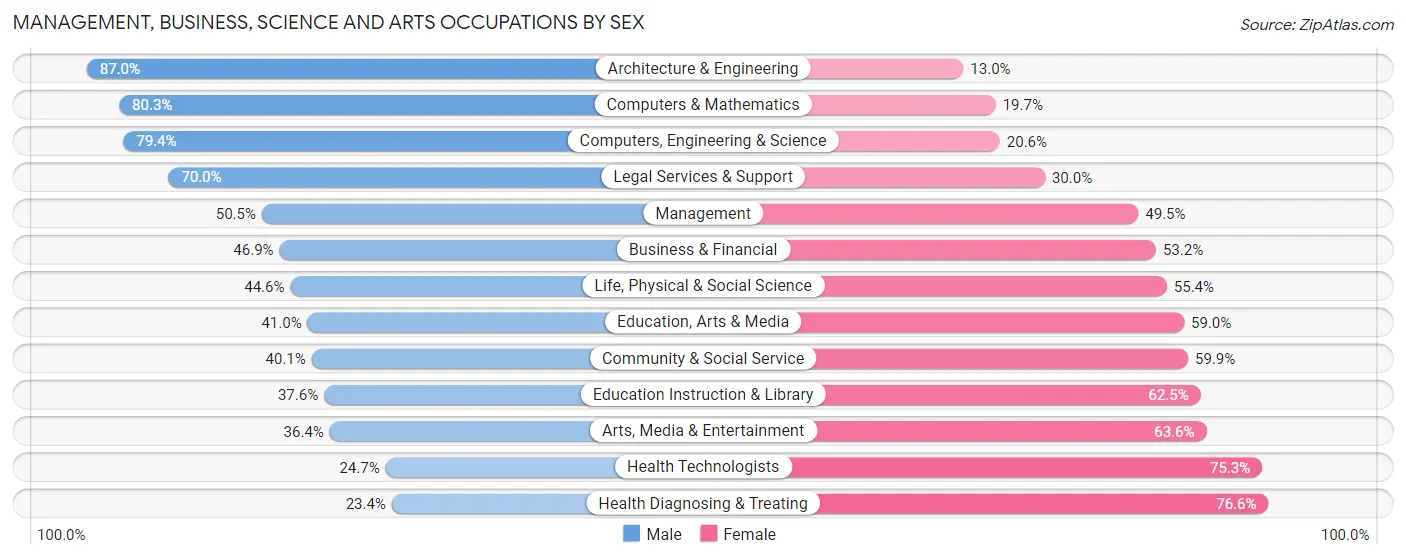
| Occupation | Male | Female |
| Management | 927 (50.5%) | 908 (49.5%) |
| Business & Financial | 365 (46.9%) | 414 (53.1%) |
| Computers, Engineering & Science | 1,107 (79.4%) | 287 (20.6%) |
| Computers & Mathematics | 423 (80.3%) | 104 (19.7%) |
| Architecture & Engineering | 610 (87.0%) | 91 (13.0%) |
| Life, Physical & Social Science | 74 (44.6%) | 92 (55.4%) |
| Community & Social Service | 725 (40.1%) | 1,081 (59.9%) |
| Education, Arts & Media | 132 (41.0%) | 190 (59.0%) |
| Legal Services & Support | 84 (70.0%) | 36 (30.0%) |
| Education Instruction & Library | 413 (37.6%) | 687 (62.5%) |
| Arts, Media & Entertainment | 96 (36.4%) | 168 (63.6%) |
| Health Diagnosing & Treating | 215 (23.4%) | 703 (76.6%) |
| Health Technologists | 152 (24.7%) | 463 (75.3%) |
| Total (Category) | 3,339 (49.6%) | 3,393 (50.4%) |
| Total (Overall) | 10,371 (52.0%) | 9,579 (48.0%) |
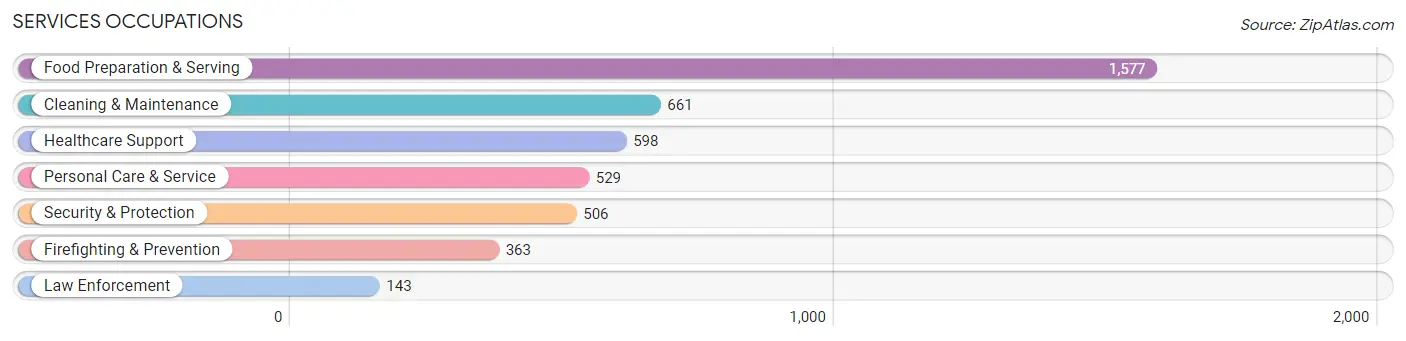
Services Occupations
The most common Services occupations in Findlay are Food Preparation & Serving (1,577 | 7.9%), Cleaning & Maintenance (661 | 3.3%), Healthcare Support (598 | 3.0%), Personal Care & Service (529 | 2.6%), and Security & Protection (506 | 2.5%).
Services Occupations by Sex
Within the Services occupations in Findlay, the most male-oriented occupations are Firefighting & Prevention (82.4%), Security & Protection (77.3%), and Cleaning & Maintenance (66.4%), while the most female-oriented occupations are Healthcare Support (98.2%), Personal Care & Service (87.2%), and Food Preparation & Serving (47.0%).
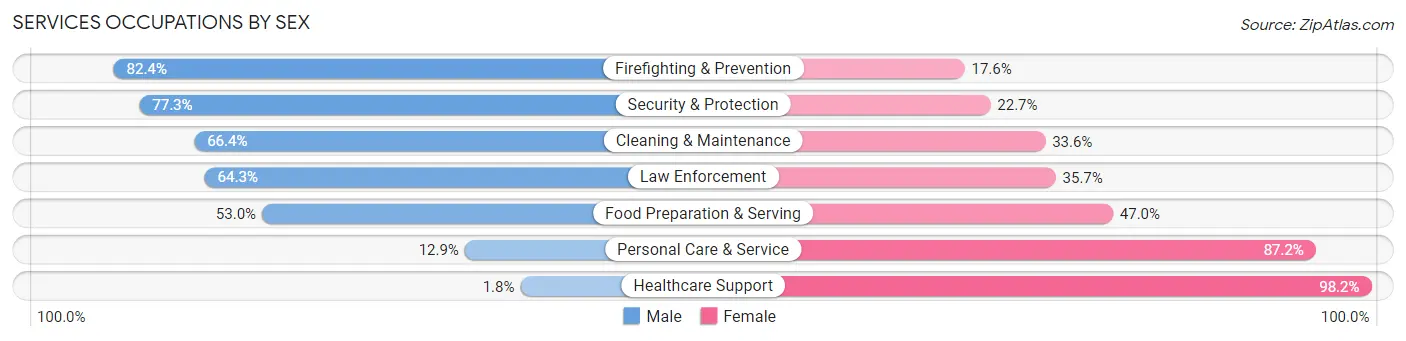
| Occupation | Male | Female |
| Healthcare Support | 11 (1.8%) | 587 (98.2%) |
| Security & Protection | 391 (77.3%) | 115 (22.7%) |
| Firefighting & Prevention | 299 (82.4%) | 64 (17.6%) |
| Law Enforcement | 92 (64.3%) | 51 (35.7%) |
| Food Preparation & Serving | 836 (53.0%) | 741 (47.0%) |
| Cleaning & Maintenance | 439 (66.4%) | 222 (33.6%) |
| Personal Care & Service | 68 (12.9%) | 461 (87.2%) |
| Total (Category) | 1,745 (45.1%) | 2,126 (54.9%) |
| Total (Overall) | 10,371 (52.0%) | 9,579 (48.0%) |
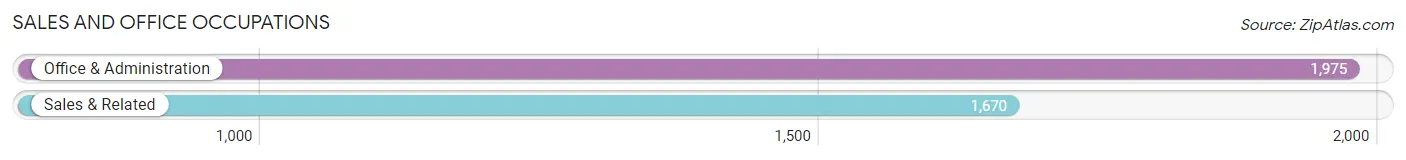
Sales and Office Occupations
The most common Sales and Office occupations in Findlay are Office & Administration (1,975 | 9.9%), and Sales & Related (1,670 | 8.4%).
Sales and Office Occupations by Sex
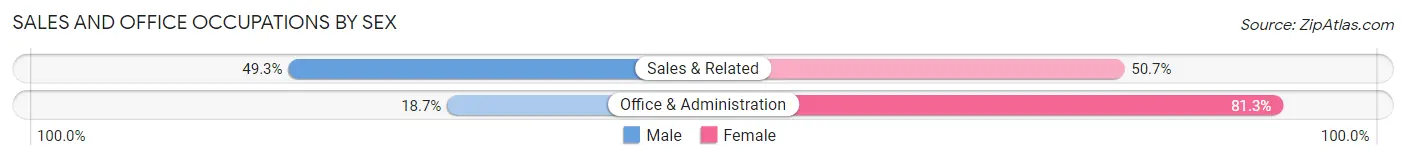
| Occupation | Male | Female |
| Sales & Related | 823 (49.3%) | 847 (50.7%) |
| Office & Administration | 370 (18.7%) | 1,605 (81.3%) |
| Total (Category) | 1,193 (32.7%) | 2,452 (67.3%) |
| Total (Overall) | 10,371 (52.0%) | 9,579 (48.0%) |
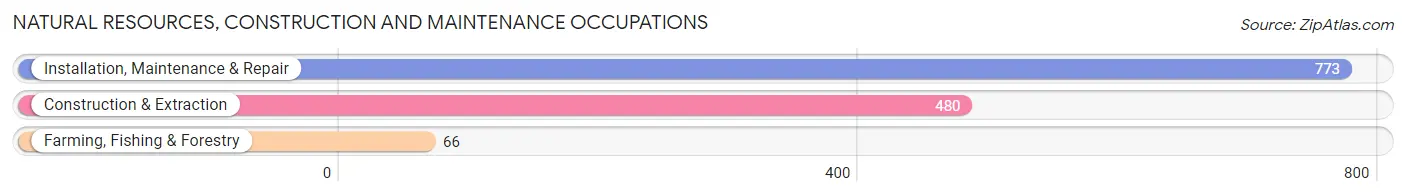
Natural Resources, Construction and Maintenance Occupations
The most common Natural Resources, Construction and Maintenance occupations in Findlay are Installation, Maintenance & Repair (773 | 3.9%), Construction & Extraction (480 | 2.4%), and Farming, Fishing & Forestry (66 | 0.3%).
Natural Resources, Construction and Maintenance Occupations by Sex
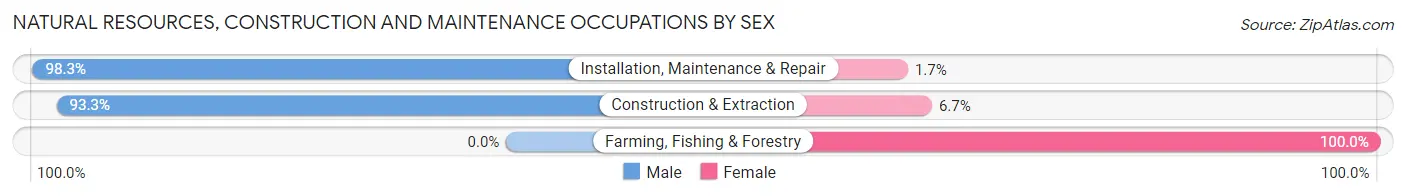
| Occupation | Male | Female |
| Farming, Fishing & Forestry | 0 (0.0%) | 66 (100.0%) |
| Construction & Extraction | 448 (93.3%) | 32 (6.7%) |
| Installation, Maintenance & Repair | 760 (98.3%) | 13 (1.7%) |
| Total (Category) | 1,208 (91.6%) | 111 (8.4%) |
| Total (Overall) | 10,371 (52.0%) | 9,579 (48.0%) |
Production, Transportation and Moving Occupations
The most common Production, Transportation and Moving occupations in Findlay are Production (2,408 | 12.1%), Material Moving (1,347 | 6.8%), and Transportation (628 | 3.2%).
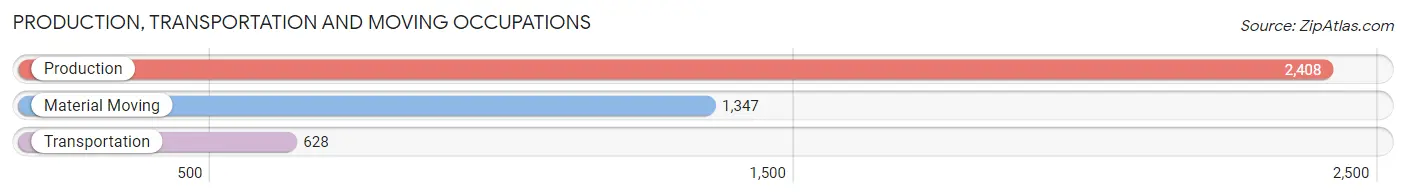
Production, Transportation and Moving Occupations by Sex
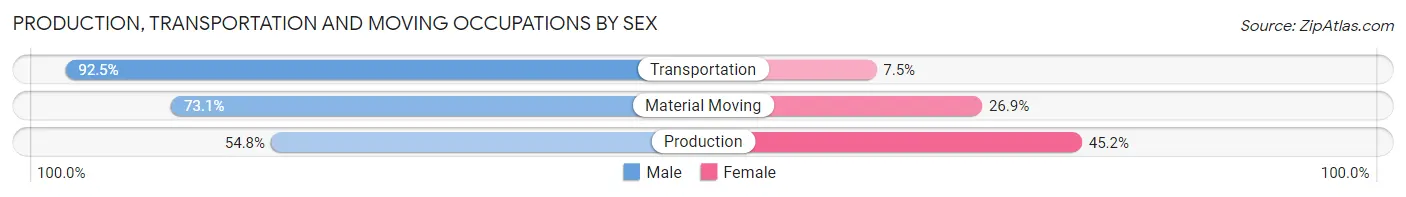
| Occupation | Male | Female |
| Production | 1,320 (54.8%) | 1,088 (45.2%) |
| Transportation | 581 (92.5%) | 47 (7.5%) |
| Material Moving | 985 (73.1%) | 362 (26.9%) |
| Total (Category) | 2,886 (65.8%) | 1,497 (34.2%) |
| Total (Overall) | 10,371 (52.0%) | 9,579 (48.0%) |
Employment Industries by Sex in Findlay
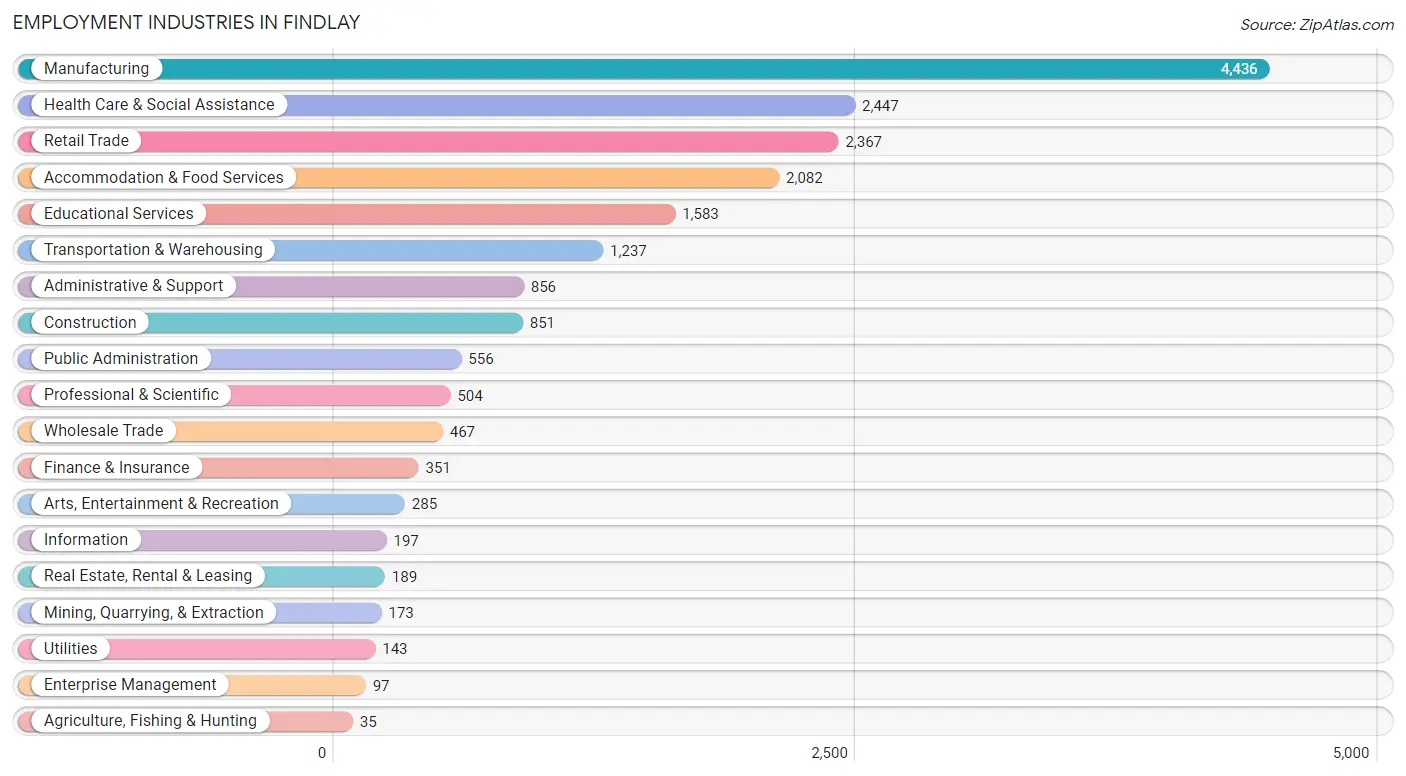
Employment Industries in Findlay
The major employment industries in Findlay include Manufacturing (4,436 | 22.2%), Health Care & Social Assistance (2,447 | 12.3%), Retail Trade (2,367 | 11.9%), Accommodation & Food Services (2,082 | 10.4%), and Educational Services (1,583 | 7.9%).
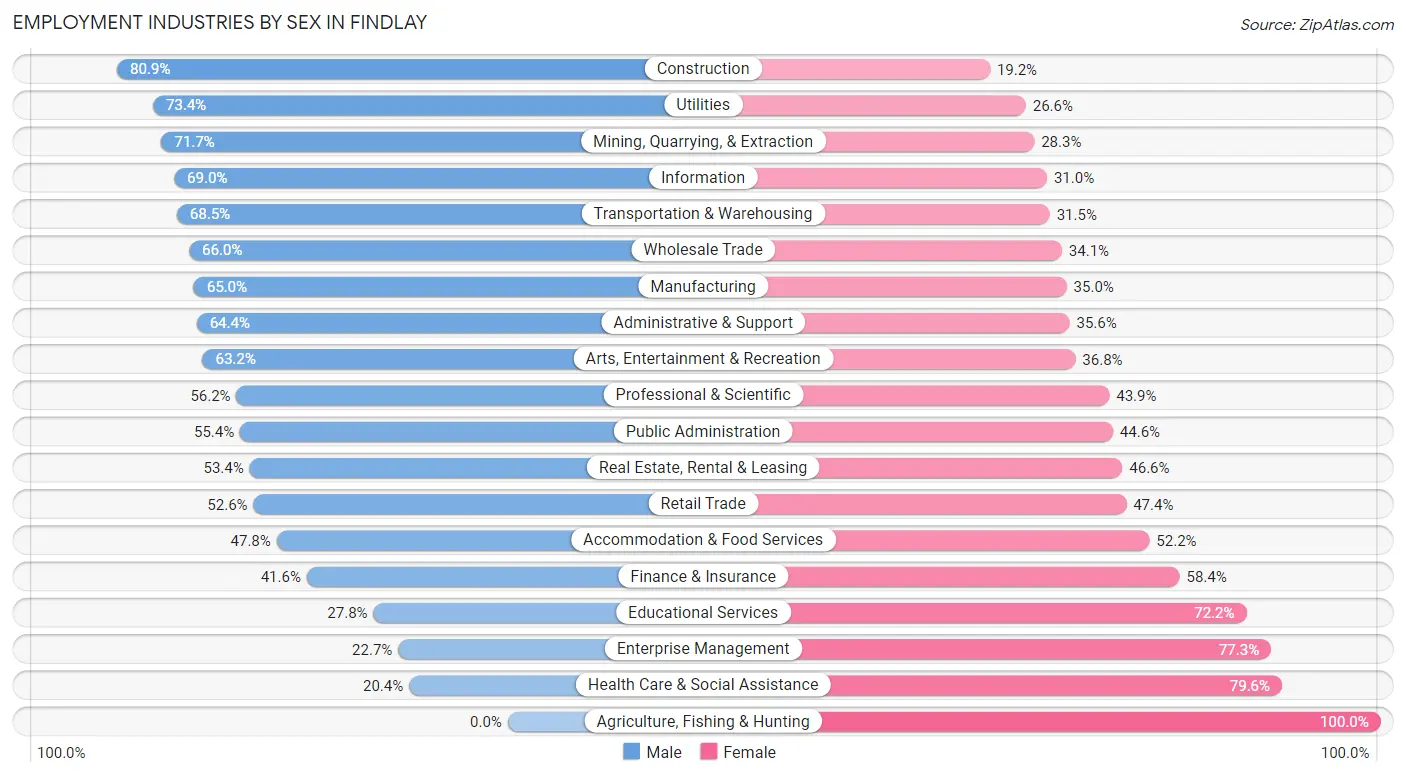
Employment Industries by Sex in Findlay
The Findlay industries that see more men than women are Construction (80.8%), Utilities (73.4%), and Mining, Quarrying, & Extraction (71.7%), whereas the industries that tend to have a higher number of women are Agriculture, Fishing & Hunting (100.0%), Health Care & Social Assistance (79.6%), and Enterprise Management (77.3%).
| Industry | Male | Female |
| Agriculture, Fishing & Hunting | 0 (0.0%) | 35 (100.0%) |
| Mining, Quarrying, & Extraction | 124 (71.7%) | 49 (28.3%) |
| Construction | 688 (80.8%) | 163 (19.2%) |
| Manufacturing | 2,882 (65.0%) | 1,554 (35.0%) |
| Wholesale Trade | 308 (65.9%) | 159 (34.1%) |
| Retail Trade | 1,246 (52.6%) | 1,121 (47.4%) |
| Transportation & Warehousing | 847 (68.5%) | 390 (31.5%) |
| Utilities | 105 (73.4%) | 38 (26.6%) |
| Information | 136 (69.0%) | 61 (31.0%) |
| Finance & Insurance | 146 (41.6%) | 205 (58.4%) |
| Real Estate, Rental & Leasing | 101 (53.4%) | 88 (46.6%) |
| Professional & Scientific | 283 (56.1%) | 221 (43.9%) |
| Enterprise Management | 22 (22.7%) | 75 (77.3%) |
| Administrative & Support | 551 (64.4%) | 305 (35.6%) |
| Educational Services | 440 (27.8%) | 1,143 (72.2%) |
| Health Care & Social Assistance | 500 (20.4%) | 1,947 (79.6%) |
| Arts, Entertainment & Recreation | 180 (63.2%) | 105 (36.8%) |
| Accommodation & Food Services | 996 (47.8%) | 1,086 (52.2%) |
| Public Administration | 308 (55.4%) | 248 (44.6%) |
| Total | 10,371 (52.0%) | 9,579 (48.0%) |
Education in Findlay
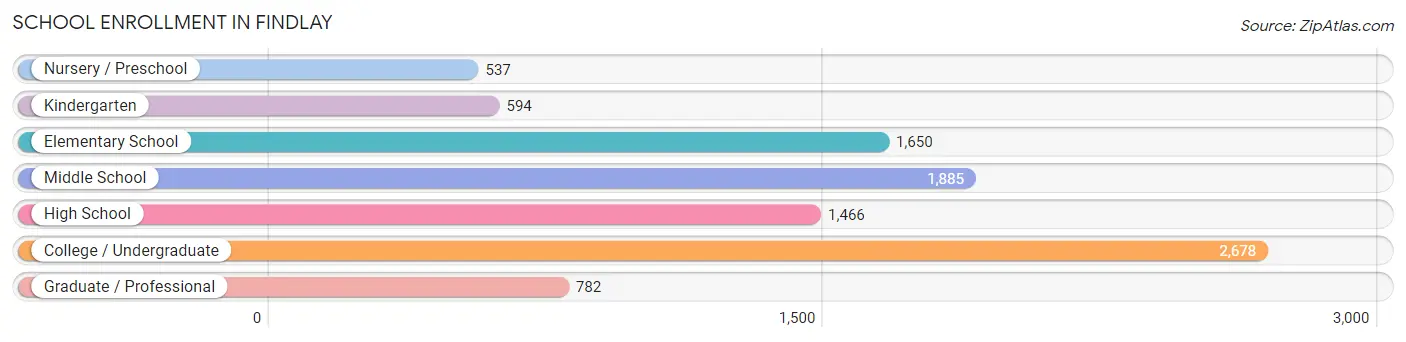
School Enrollment in Findlay
The most common levels of schooling among the 9,592 students in Findlay are college / undergraduate (2,678 | 27.9%), middle school (1,885 | 19.7%), and elementary school (1,650 | 17.2%).
| School Level | # Students | % Students |
| Nursery / Preschool | 537 | 5.6% |
| Kindergarten | 594 | 6.2% |
| Elementary School | 1,650 | 17.2% |
| Middle School | 1,885 | 19.7% |
| High School | 1,466 | 15.3% |
| College / Undergraduate | 2,678 | 27.9% |
| Graduate / Professional | 782 | 8.2% |
| Total | 9,592 | 100.0% |
School Enrollment by Age by Funding Source in Findlay
Out of a total of 9,592 students who are enrolled in schools in Findlay, 2,695 (28.1%) attend a private institution, while the remaining 6,897 (71.9%) are enrolled in public schools. The age group of 20 to 24 year olds has the highest likelihood of being enrolled in private schools, with 1,052 (70.1% in the age bracket) enrolled. Conversely, the age group of 10 to 14 year olds has the lowest likelihood of being enrolled in a private school, with 1,921 (95.2% in the age bracket) attending a public institution.
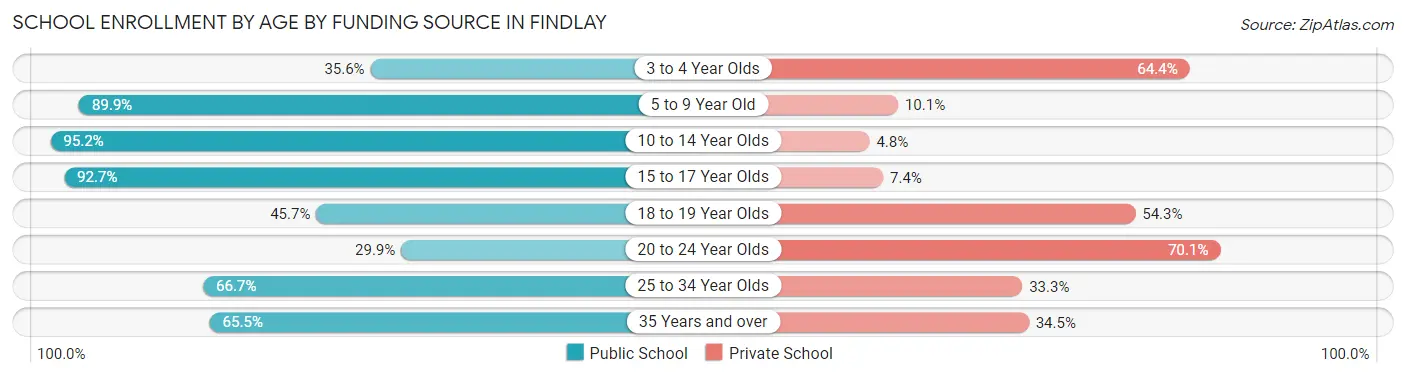
| Age Bracket | Public School | Private School |
| 3 to 4 Year Olds | 148 (35.6%) | 268 (64.4%) |
| 5 to 9 Year Old | 2,051 (89.9%) | 231 (10.1%) |
| 10 to 14 Year Olds | 1,921 (95.2%) | 97 (4.8%) |
| 15 to 17 Year Olds | 1,072 (92.6%) | 85 (7.3%) |
| 18 to 19 Year Olds | 476 (45.7%) | 566 (54.3%) |
| 20 to 24 Year Olds | 448 (29.9%) | 1,052 (70.1%) |
| 25 to 34 Year Olds | 590 (66.7%) | 294 (33.3%) |
| 35 Years and over | 192 (65.5%) | 101 (34.5%) |
| Total | 6,897 (71.9%) | 2,695 (28.1%) |
Educational Attainment by Field of Study in Findlay
Business (1,635 | 19.1%), education (1,615 | 18.9%), engineering (881 | 10.3%), science & technology (790 | 9.2%), and bio, nature & agricultural (524 | 6.1%) are the most common fields of study among 8,556 individuals in Findlay who have obtained a bachelor's degree or higher.
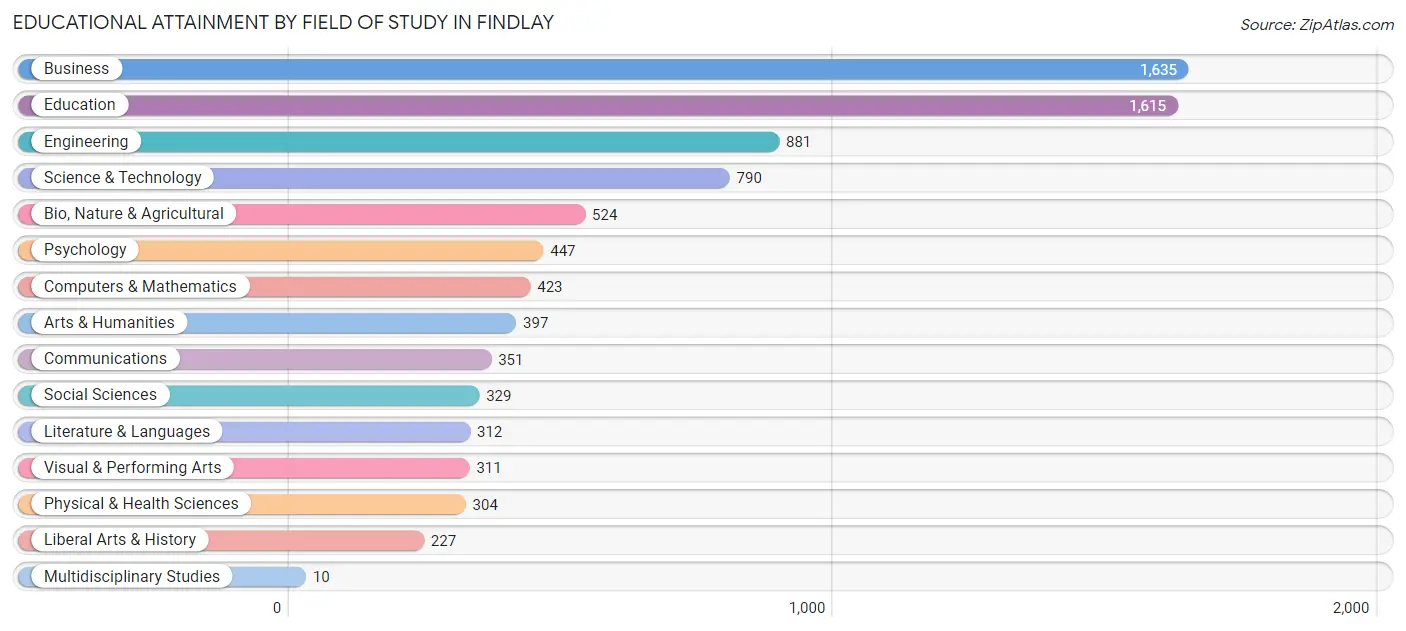
| Field of Study | # Graduates | % Graduates |
| Computers & Mathematics | 423 | 4.9% |
| Bio, Nature & Agricultural | 524 | 6.1% |
| Physical & Health Sciences | 304 | 3.5% |
| Psychology | 447 | 5.2% |
| Social Sciences | 329 | 3.8% |
| Engineering | 881 | 10.3% |
| Multidisciplinary Studies | 10 | 0.1% |
| Science & Technology | 790 | 9.2% |
| Business | 1,635 | 19.1% |
| Education | 1,615 | 18.9% |
| Literature & Languages | 312 | 3.6% |
| Liberal Arts & History | 227 | 2.6% |
| Visual & Performing Arts | 311 | 3.6% |
| Communications | 351 | 4.1% |
| Arts & Humanities | 397 | 4.6% |
| Total | 8,556 | 100.0% |
Transportation & Commute in Findlay
Vehicle Availability by Sex in Findlay
The most prevalent vehicle ownership categories in Findlay are males with 2 vehicles (4,916, accounting for 48.7%) and females with 2 vehicles (4,334, making up 54.9%).
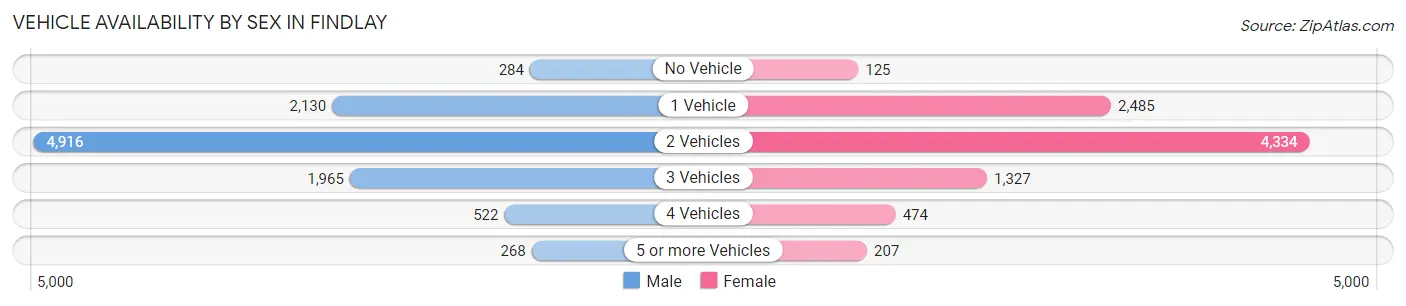
| Vehicles Available | Male | Female |
| No Vehicle | 284 (2.8%) | 125 (1.4%) |
| 1 Vehicle | 2,130 (21.1%) | 2,485 (27.8%) |
| 2 Vehicles | 4,916 (48.7%) | 4,334 (48.4%) |
| 3 Vehicles | 1,965 (19.5%) | 1,327 (14.8%) |
| 4 Vehicles | 522 (5.2%) | 474 (5.3%) |
| 5 or more Vehicles | 268 (2.7%) | 207 (2.3%) |
| Total | 10,085 (100.0%) | 8,952 (100.0%) |
Commute Time in Findlay
The most frequently occuring commute durations in Findlay are 10 to 14 minutes (5,282 commuters, 28.8%), 5 to 9 minutes (4,904 commuters, 26.8%), and 15 to 19 minutes (3,316 commuters, 18.1%).
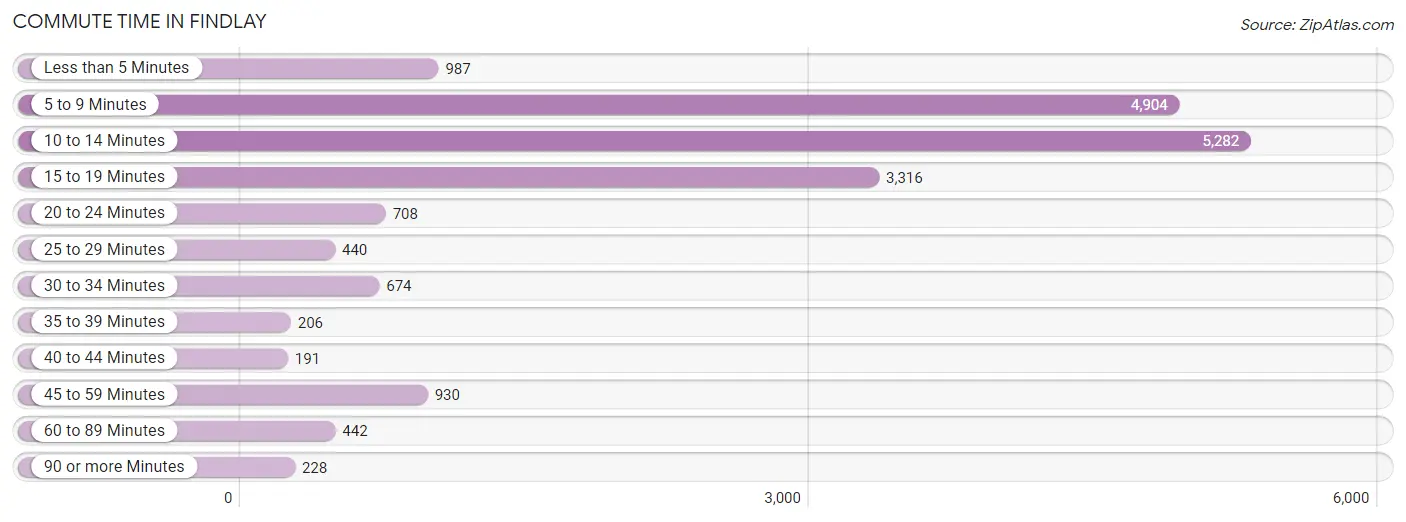
| Commute Time | # Commuters | % Commuters |
| Less than 5 Minutes | 987 | 5.4% |
| 5 to 9 Minutes | 4,904 | 26.8% |
| 10 to 14 Minutes | 5,282 | 28.8% |
| 15 to 19 Minutes | 3,316 | 18.1% |
| 20 to 24 Minutes | 708 | 3.9% |
| 25 to 29 Minutes | 440 | 2.4% |
| 30 to 34 Minutes | 674 | 3.7% |
| 35 to 39 Minutes | 206 | 1.1% |
| 40 to 44 Minutes | 191 | 1.0% |
| 45 to 59 Minutes | 930 | 5.1% |
| 60 to 89 Minutes | 442 | 2.4% |
| 90 or more Minutes | 228 | 1.3% |
Commute Time by Sex in Findlay
The most common commute times in Findlay are 10 to 14 minutes (2,881 commuters, 29.6%) for males and 5 to 9 minutes (2,450 commuters, 28.6%) for females.
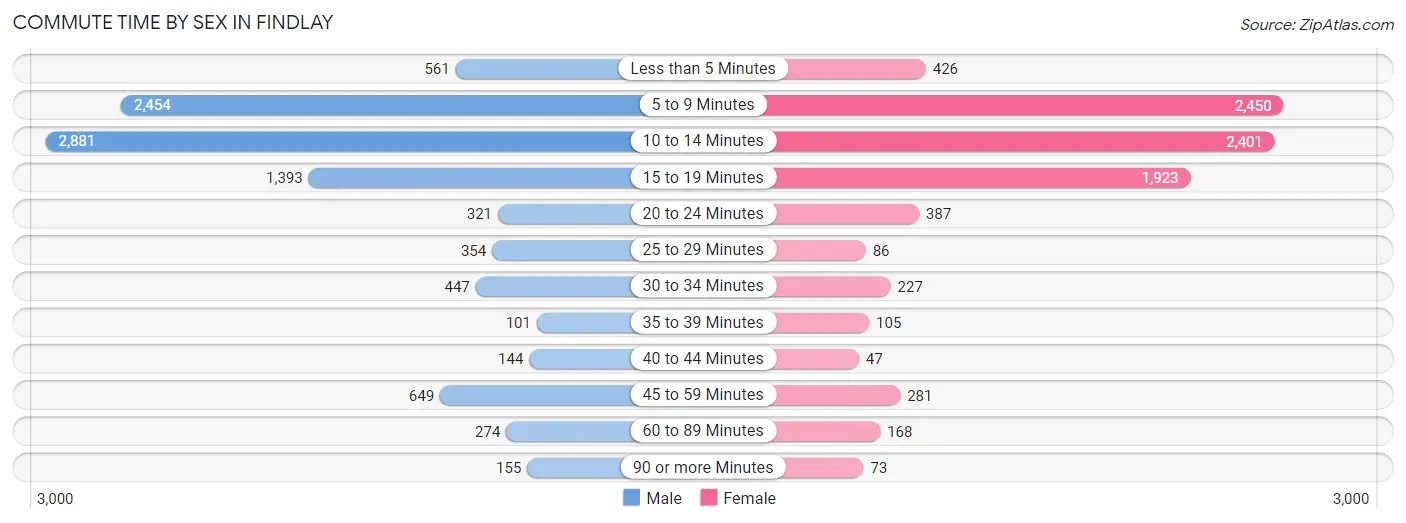
| Commute Time | Male | Female |
| Less than 5 Minutes | 561 (5.8%) | 426 (5.0%) |
| 5 to 9 Minutes | 2,454 (25.2%) | 2,450 (28.6%) |
| 10 to 14 Minutes | 2,881 (29.6%) | 2,401 (28.0%) |
| 15 to 19 Minutes | 1,393 (14.3%) | 1,923 (22.4%) |
| 20 to 24 Minutes | 321 (3.3%) | 387 (4.5%) |
| 25 to 29 Minutes | 354 (3.6%) | 86 (1.0%) |
| 30 to 34 Minutes | 447 (4.6%) | 227 (2.6%) |
| 35 to 39 Minutes | 101 (1.0%) | 105 (1.2%) |
| 40 to 44 Minutes | 144 (1.5%) | 47 (0.5%) |
| 45 to 59 Minutes | 649 (6.7%) | 281 (3.3%) |
| 60 to 89 Minutes | 274 (2.8%) | 168 (2.0%) |
| 90 or more Minutes | 155 (1.6%) | 73 (0.9%) |
Time of Departure to Work by Sex in Findlay
The most frequent times of departure to work in Findlay are 7:00 AM to 7:29 AM (1,356, 13.9%) for males and 7:30 AM to 7:59 AM (1,230, 14.3%) for females.
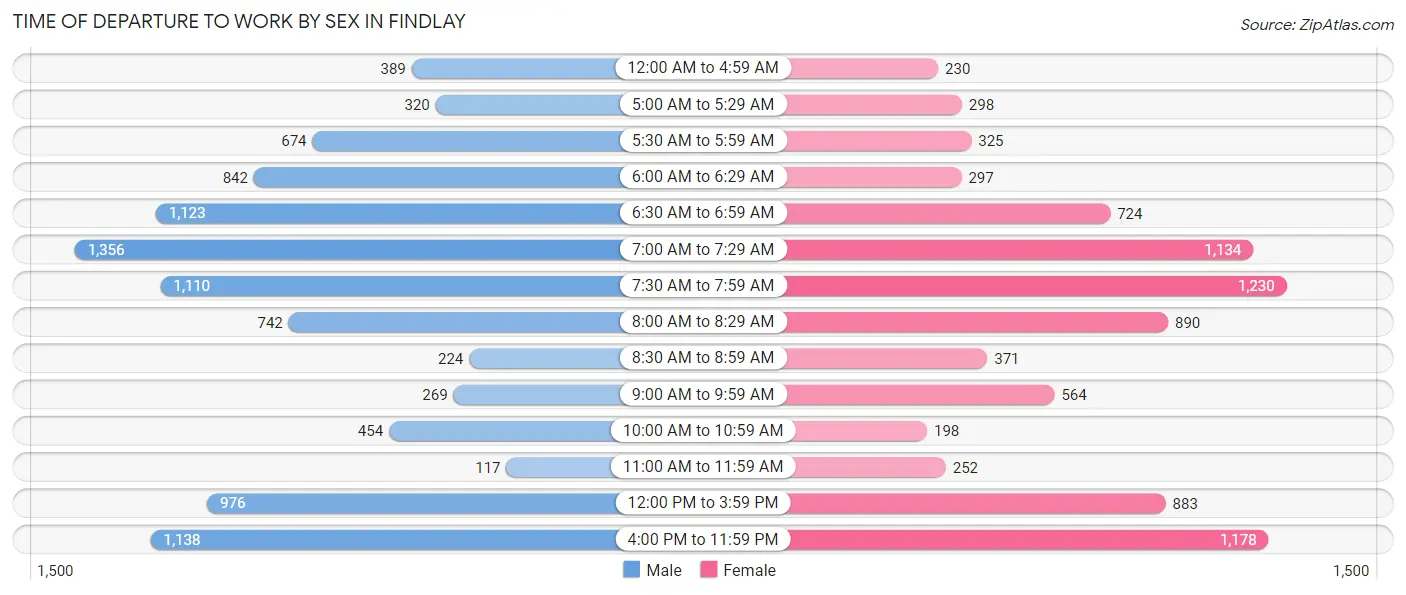
| Time of Departure | Male | Female |
| 12:00 AM to 4:59 AM | 389 (4.0%) | 230 (2.7%) |
| 5:00 AM to 5:29 AM | 320 (3.3%) | 298 (3.5%) |
| 5:30 AM to 5:59 AM | 674 (6.9%) | 325 (3.8%) |
| 6:00 AM to 6:29 AM | 842 (8.6%) | 297 (3.5%) |
| 6:30 AM to 6:59 AM | 1,123 (11.5%) | 724 (8.4%) |
| 7:00 AM to 7:29 AM | 1,356 (13.9%) | 1,134 (13.2%) |
| 7:30 AM to 7:59 AM | 1,110 (11.4%) | 1,230 (14.3%) |
| 8:00 AM to 8:29 AM | 742 (7.6%) | 890 (10.4%) |
| 8:30 AM to 8:59 AM | 224 (2.3%) | 371 (4.3%) |
| 9:00 AM to 9:59 AM | 269 (2.8%) | 564 (6.6%) |
| 10:00 AM to 10:59 AM | 454 (4.7%) | 198 (2.3%) |
| 11:00 AM to 11:59 AM | 117 (1.2%) | 252 (2.9%) |
| 12:00 PM to 3:59 PM | 976 (10.0%) | 883 (10.3%) |
| 4:00 PM to 11:59 PM | 1,138 (11.7%) | 1,178 (13.7%) |
| Total | 9,734 (100.0%) | 8,574 (100.0%) |
Housing Occupancy in Findlay
Occupancy by Ownership in Findlay
Of the total 17,747 dwellings in Findlay, owner-occupied units account for 10,070 (56.7%), while renter-occupied units make up 7,677 (43.3%).
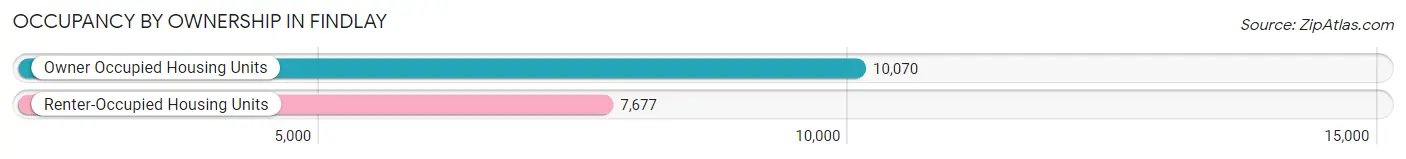
| Occupancy | # Housing Units | % Housing Units |
| Owner Occupied Housing Units | 10,070 | 56.7% |
| Renter-Occupied Housing Units | 7,677 | 43.3% |
| Total Occupied Housing Units | 17,747 | 100.0% |
Occupancy by Household Size in Findlay
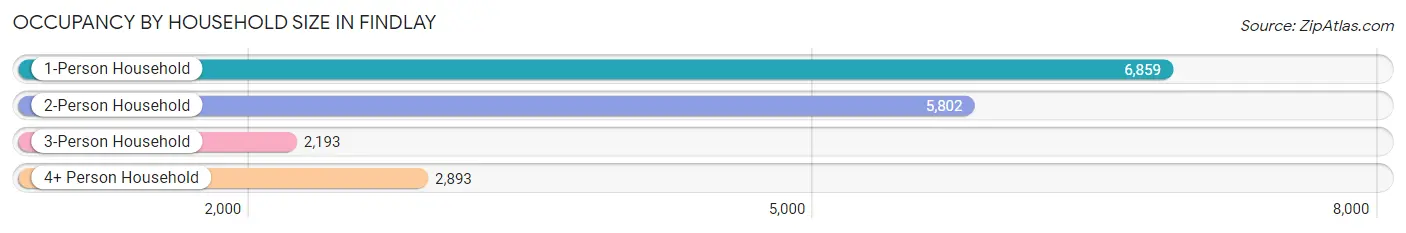
| Household Size | # Housing Units | % Housing Units |
| 1-Person Household | 6,859 | 38.7% |
| 2-Person Household | 5,802 | 32.7% |
| 3-Person Household | 2,193 | 12.4% |
| 4+ Person Household | 2,893 | 16.3% |
| Total Housing Units | 17,747 | 100.0% |
Occupancy by Ownership by Household Size in Findlay
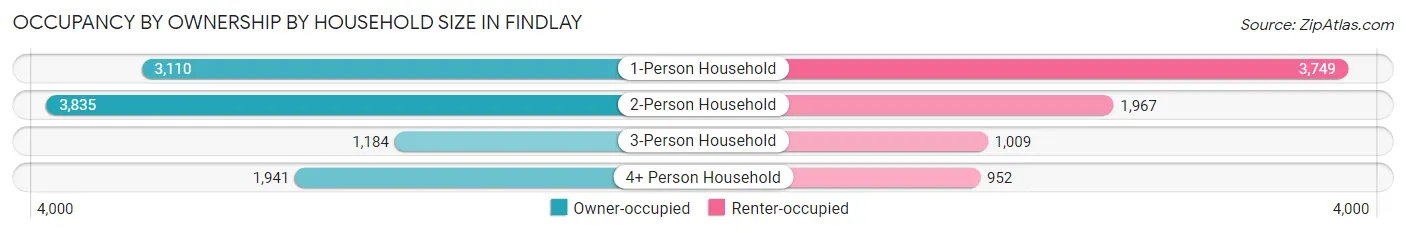
| Household Size | Owner-occupied | Renter-occupied |
| 1-Person Household | 3,110 (45.3%) | 3,749 (54.7%) |
| 2-Person Household | 3,835 (66.1%) | 1,967 (33.9%) |
| 3-Person Household | 1,184 (54.0%) | 1,009 (46.0%) |
| 4+ Person Household | 1,941 (67.1%) | 952 (32.9%) |
| Total Housing Units | 10,070 (56.7%) | 7,677 (43.3%) |
Occupancy by Educational Attainment in Findlay
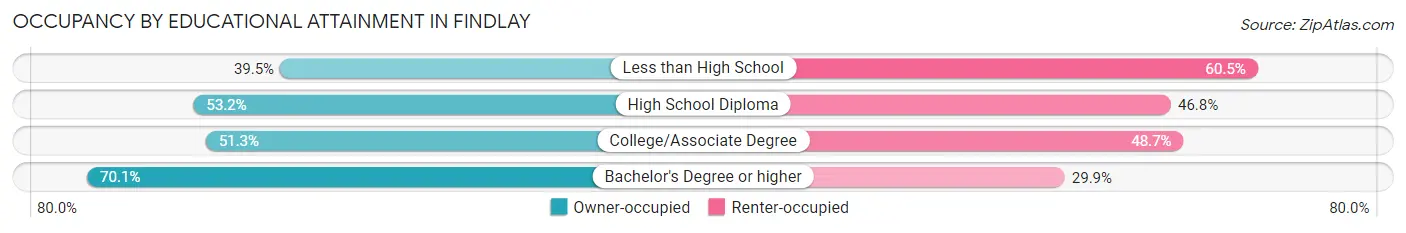
| Household Size | Owner-occupied | Renter-occupied |
| Less than High School | 446 (39.5%) | 683 (60.5%) |
| High School Diploma | 2,931 (53.2%) | 2,575 (46.8%) |
| College/Associate Degree | 2,982 (51.3%) | 2,834 (48.7%) |
| Bachelor's Degree or higher | 3,711 (70.1%) | 1,585 (29.9%) |
Occupancy by Age of Householder in Findlay
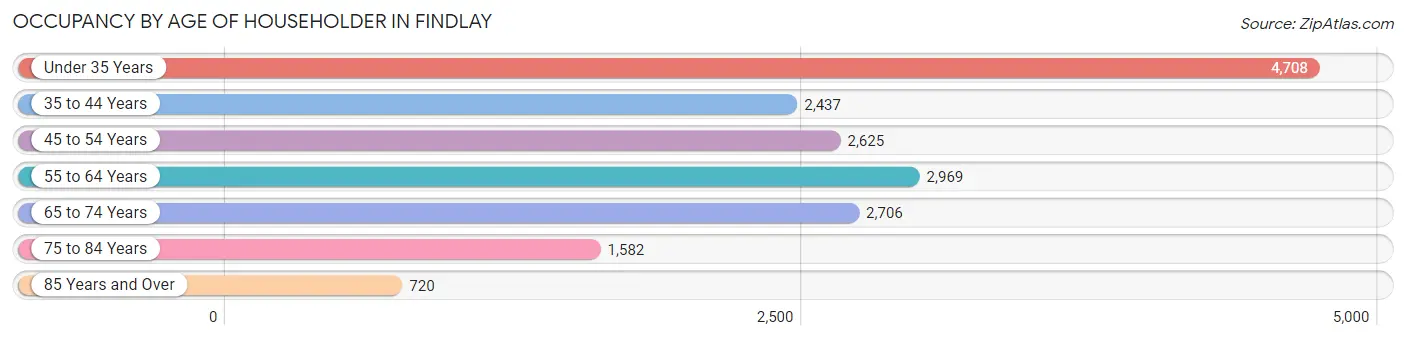
| Age Bracket | # Households | % Households |
| Under 35 Years | 4,708 | 26.5% |
| 35 to 44 Years | 2,437 | 13.7% |
| 45 to 54 Years | 2,625 | 14.8% |
| 55 to 64 Years | 2,969 | 16.7% |
| 65 to 74 Years | 2,706 | 15.2% |
| 75 to 84 Years | 1,582 | 8.9% |
| 85 Years and Over | 720 | 4.1% |
| Total | 17,747 | 100.0% |
Housing Finances in Findlay
Median Income by Occupancy in Findlay
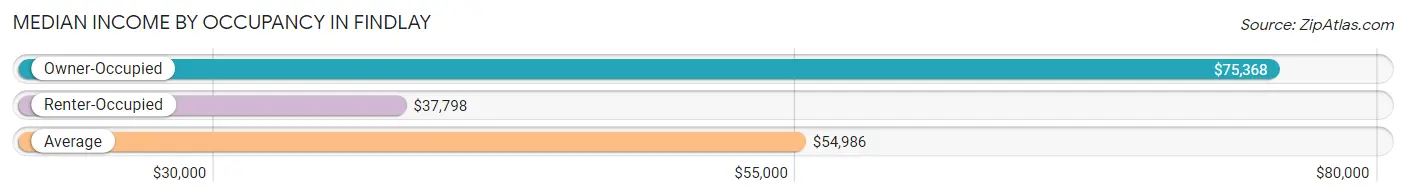
| Occupancy Type | # Households | Median Income |
| Owner-Occupied | 10,070 (56.7%) | $75,368 |
| Renter-Occupied | 7,677 (43.3%) | $37,798 |
| Average | 17,747 (100.0%) | $54,986 |
Occupancy by Householder Income Bracket in Findlay
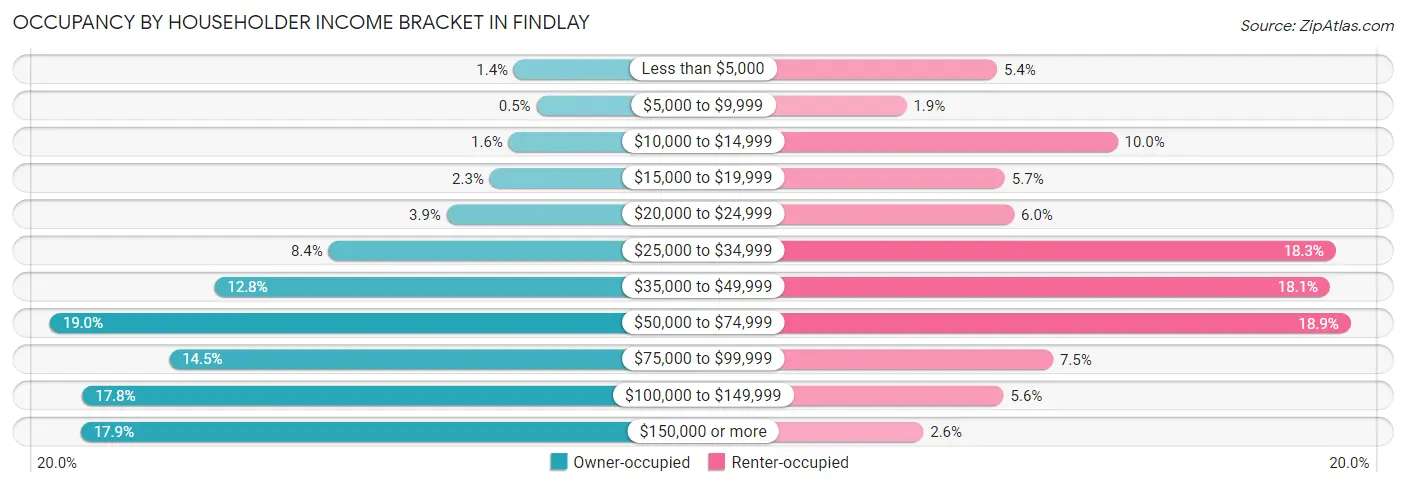
| Income Bracket | Owner-occupied | Renter-occupied |
| Less than $5,000 | 137 (1.4%) | 414 (5.4%) |
| $5,000 to $9,999 | 50 (0.5%) | 149 (1.9%) |
| $10,000 to $14,999 | 157 (1.6%) | 766 (10.0%) |
| $15,000 to $19,999 | 230 (2.3%) | 437 (5.7%) |
| $20,000 to $24,999 | 395 (3.9%) | 464 (6.0%) |
| $25,000 to $34,999 | 848 (8.4%) | 1,404 (18.3%) |
| $35,000 to $49,999 | 1,286 (12.8%) | 1,387 (18.1%) |
| $50,000 to $74,999 | 1,917 (19.0%) | 1,448 (18.9%) |
| $75,000 to $99,999 | 1,459 (14.5%) | 577 (7.5%) |
| $100,000 to $149,999 | 1,792 (17.8%) | 433 (5.6%) |
| $150,000 or more | 1,799 (17.9%) | 198 (2.6%) |
| Total | 10,070 (100.0%) | 7,677 (100.0%) |
Monthly Housing Cost Tiers in Findlay
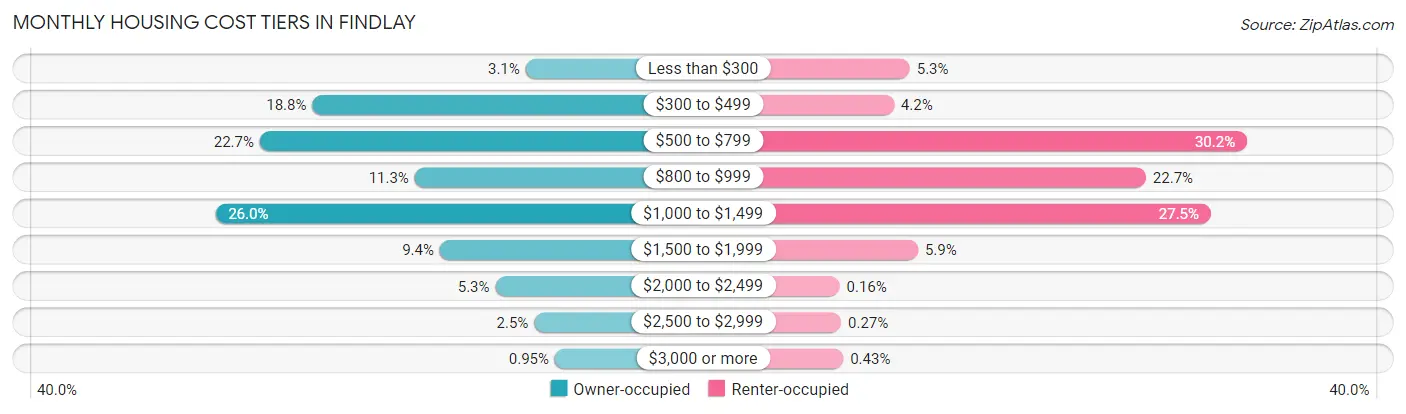
| Monthly Cost | Owner-occupied | Renter-occupied |
| Less than $300 | 312 (3.1%) | 409 (5.3%) |
| $300 to $499 | 1,894 (18.8%) | 319 (4.2%) |
| $500 to $799 | 2,284 (22.7%) | 2,315 (30.2%) |
| $800 to $999 | 1,135 (11.3%) | 1,744 (22.7%) |
| $1,000 to $1,499 | 2,614 (26.0%) | 2,111 (27.5%) |
| $1,500 to $1,999 | 949 (9.4%) | 455 (5.9%) |
| $2,000 to $2,499 | 537 (5.3%) | 12 (0.2%) |
| $2,500 to $2,999 | 249 (2.5%) | 21 (0.3%) |
| $3,000 or more | 96 (0.9%) | 33 (0.4%) |
| Total | 10,070 (100.0%) | 7,677 (100.0%) |
Physical Housing Characteristics in Findlay
Housing Structures in Findlay
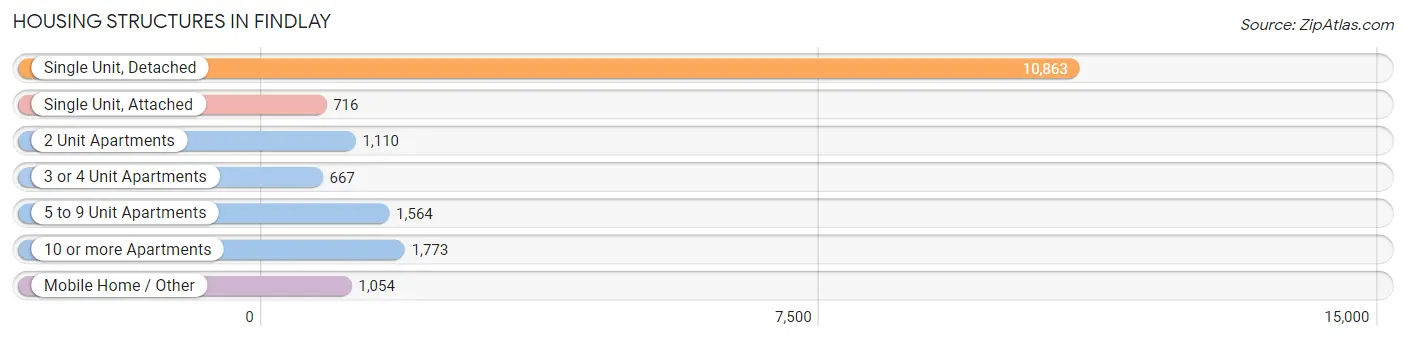
| Structure Type | # Housing Units | % Housing Units |
| Single Unit, Detached | 10,863 | 61.2% |
| Single Unit, Attached | 716 | 4.0% |
| 2 Unit Apartments | 1,110 | 6.2% |
| 3 or 4 Unit Apartments | 667 | 3.8% |
| 5 to 9 Unit Apartments | 1,564 | 8.8% |
| 10 or more Apartments | 1,773 | 10.0% |
| Mobile Home / Other | 1,054 | 5.9% |
| Total | 17,747 | 100.0% |
Housing Structures by Occupancy in Findlay
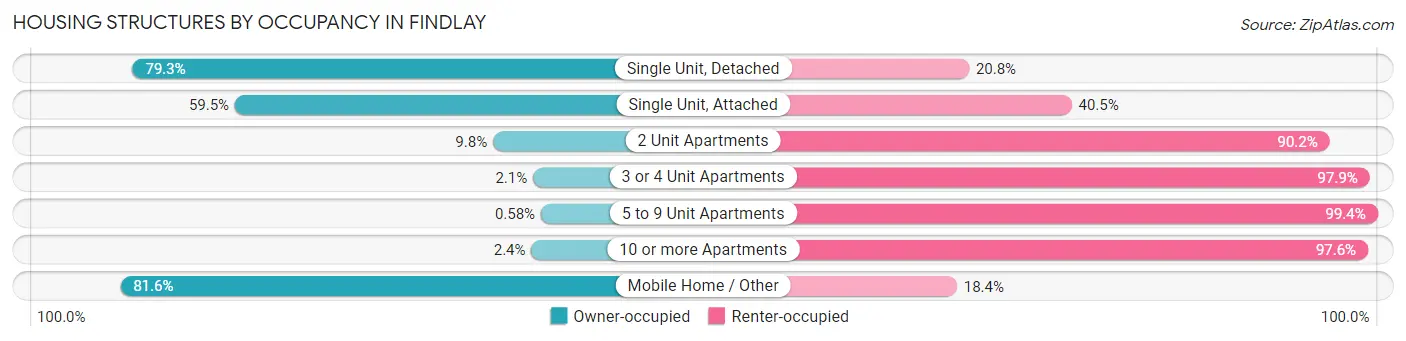
| Structure Type | Owner-occupied | Renter-occupied |
| Single Unit, Detached | 8,609 (79.2%) | 2,254 (20.7%) |
| Single Unit, Attached | 426 (59.5%) | 290 (40.5%) |
| 2 Unit Apartments | 109 (9.8%) | 1,001 (90.2%) |
| 3 or 4 Unit Apartments | 14 (2.1%) | 653 (97.9%) |
| 5 to 9 Unit Apartments | 9 (0.6%) | 1,555 (99.4%) |
| 10 or more Apartments | 43 (2.4%) | 1,730 (97.6%) |
| Mobile Home / Other | 860 (81.6%) | 194 (18.4%) |
| Total | 10,070 (56.7%) | 7,677 (43.3%) |
Housing Structures by Number of Rooms in Findlay
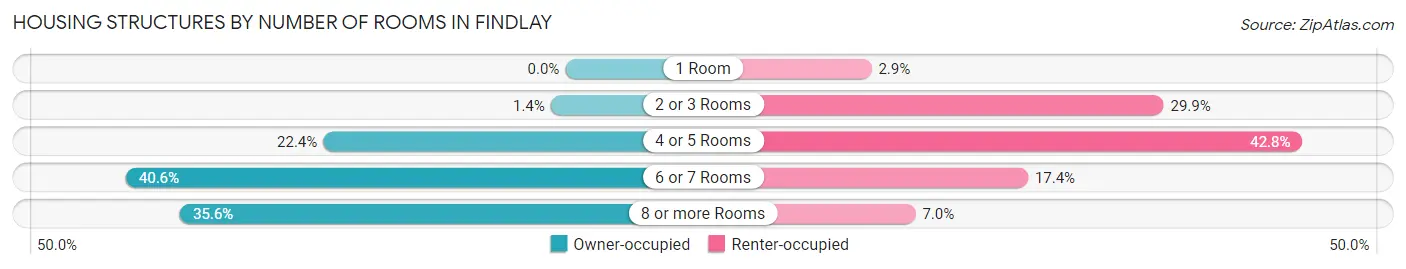
| Number of Rooms | Owner-occupied | Renter-occupied |
| 1 Room | 0 (0.0%) | 224 (2.9%) |
| 2 or 3 Rooms | 136 (1.3%) | 2,298 (29.9%) |
| 4 or 5 Rooms | 2,255 (22.4%) | 3,283 (42.8%) |
| 6 or 7 Rooms | 4,091 (40.6%) | 1,335 (17.4%) |
| 8 or more Rooms | 3,588 (35.6%) | 537 (7.0%) |
| Total | 10,070 (100.0%) | 7,677 (100.0%) |
Housing Structure by Heating Type in Findlay
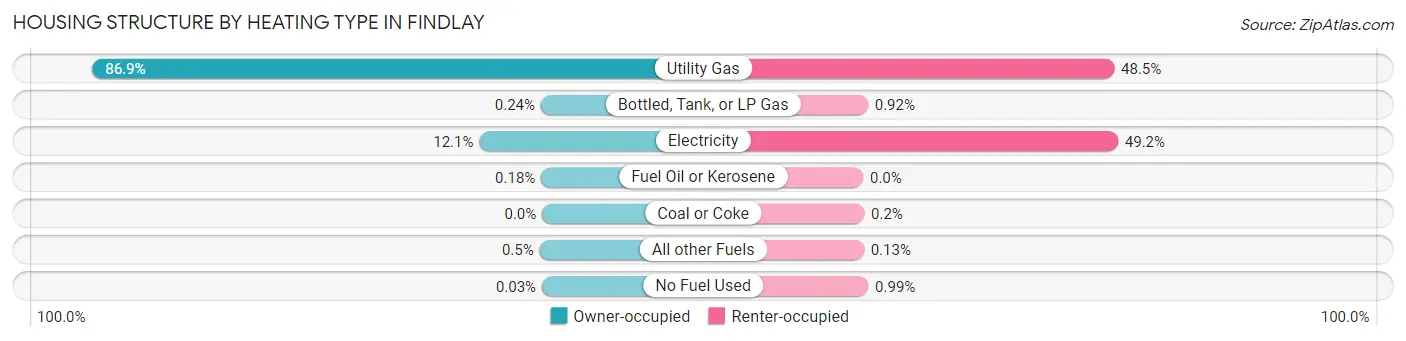
| Heating Type | Owner-occupied | Renter-occupied |
| Utility Gas | 8,752 (86.9%) | 3,725 (48.5%) |
| Bottled, Tank, or LP Gas | 24 (0.2%) | 71 (0.9%) |
| Electricity | 1,223 (12.1%) | 3,780 (49.2%) |
| Fuel Oil or Kerosene | 18 (0.2%) | 0 (0.0%) |
| Coal or Coke | 0 (0.0%) | 15 (0.2%) |
| All other Fuels | 50 (0.5%) | 10 (0.1%) |
| No Fuel Used | 3 (0.0%) | 76 (1.0%) |
| Total | 10,070 (100.0%) | 7,677 (100.0%) |
Household Vehicle Usage in Findlay
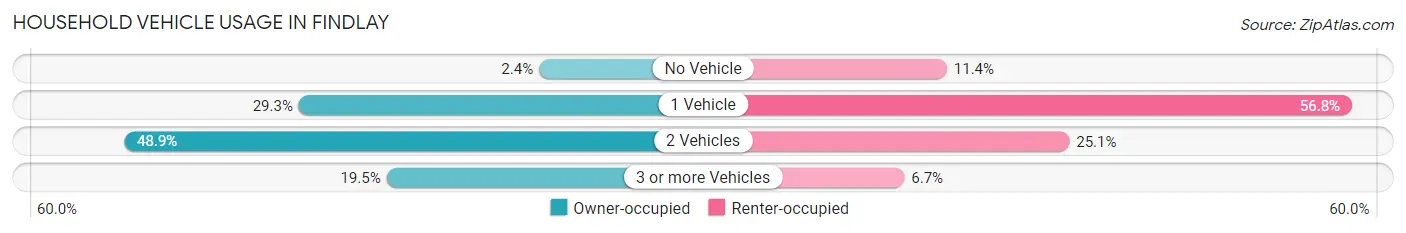
| Vehicles per Household | Owner-occupied | Renter-occupied |
| No Vehicle | 240 (2.4%) | 877 (11.4%) |
| 1 Vehicle | 2,949 (29.3%) | 4,360 (56.8%) |
| 2 Vehicles | 4,921 (48.9%) | 1,929 (25.1%) |
| 3 or more Vehicles | 1,960 (19.5%) | 511 (6.7%) |
| Total | 10,070 (100.0%) | 7,677 (100.0%) |
Real Estate & Mortgages in Findlay
Real Estate and Mortgage Overview in Findlay
| Characteristic | Without Mortgage | With Mortgage |
| Housing Units | 4,115 | 5,955 |
| Median Property Value | $165,800 | $171,200 |
| Median Household Income | $57,420 | $1,218 |
| Monthly Housing Costs | $492 | $96 |
| Real Estate Taxes | $1,721 | $120 |
Property Value by Mortgage Status in Findlay
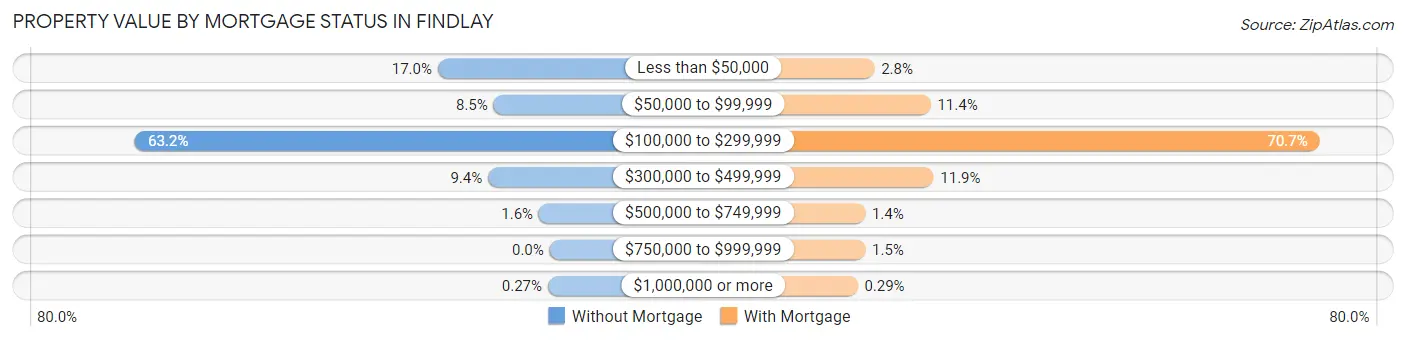
| Property Value | Without Mortgage | With Mortgage |
| Less than $50,000 | 701 (17.0%) | 169 (2.8%) |
| $50,000 to $99,999 | 351 (8.5%) | 680 (11.4%) |
| $100,000 to $299,999 | 2,599 (63.2%) | 4,210 (70.7%) |
| $300,000 to $499,999 | 386 (9.4%) | 706 (11.9%) |
| $500,000 to $749,999 | 67 (1.6%) | 86 (1.4%) |
| $750,000 to $999,999 | 0 (0.0%) | 87 (1.5%) |
| $1,000,000 or more | 11 (0.3%) | 17 (0.3%) |
| Total | 4,115 (100.0%) | 5,955 (100.0%) |
Household Income by Mortgage Status in Findlay
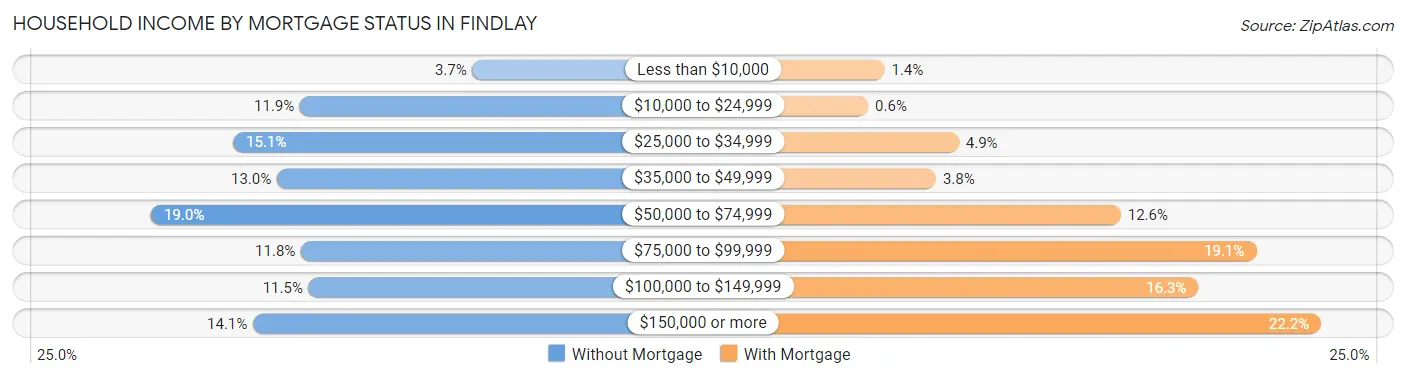
| Household Income | Without Mortgage | With Mortgage |
| Less than $10,000 | 151 (3.7%) | 82 (1.4%) |
| $10,000 to $24,999 | 489 (11.9%) | 36 (0.6%) |
| $25,000 to $34,999 | 620 (15.1%) | 293 (4.9%) |
| $35,000 to $49,999 | 534 (13.0%) | 228 (3.8%) |
| $50,000 to $74,999 | 781 (19.0%) | 752 (12.6%) |
| $75,000 to $99,999 | 487 (11.8%) | 1,136 (19.1%) |
| $100,000 to $149,999 | 472 (11.5%) | 972 (16.3%) |
| $150,000 or more | 581 (14.1%) | 1,320 (22.2%) |
| Total | 4,115 (100.0%) | 5,955 (100.0%) |
Property Value to Household Income Ratio in Findlay
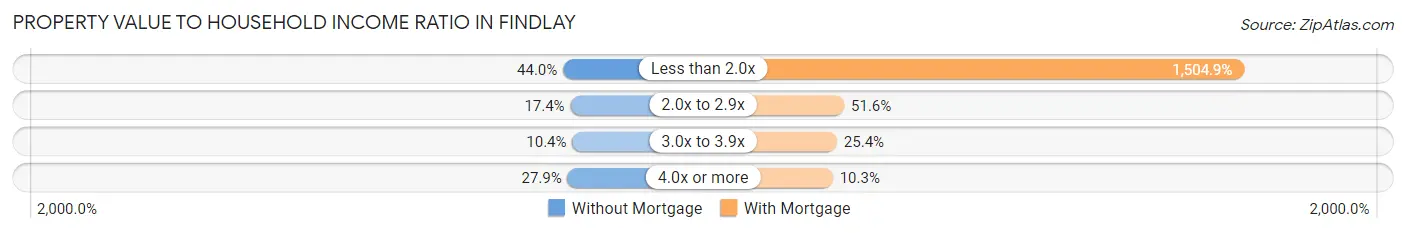
| Value-to-Income Ratio | Without Mortgage | With Mortgage |
| Less than 2.0x | 1,810 (44.0%) | 89,618 (1,504.9%) |
| 2.0x to 2.9x | 716 (17.4%) | 3,072 (51.6%) |
| 3.0x to 3.9x | 426 (10.3%) | 1,512 (25.4%) |
| 4.0x or more | 1,149 (27.9%) | 612 (10.3%) |
| Total | 4,115 (100.0%) | 5,955 (100.0%) |
Real Estate Taxes by Mortgage Status in Findlay
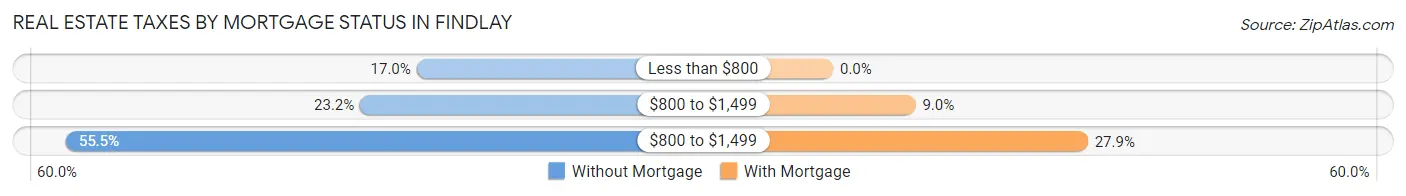
| Property Taxes | Without Mortgage | With Mortgage |
| Less than $800 | 701 (17.0%) | 0 (0.0%) |
| $800 to $1,499 | 956 (23.2%) | 538 (9.0%) |
| $800 to $1,499 | 2,283 (55.5%) | 1,662 (27.9%) |
| Total | 4,115 (100.0%) | 5,955 (100.0%) |
Health & Disability in Findlay
Health Insurance Coverage by Age in Findlay
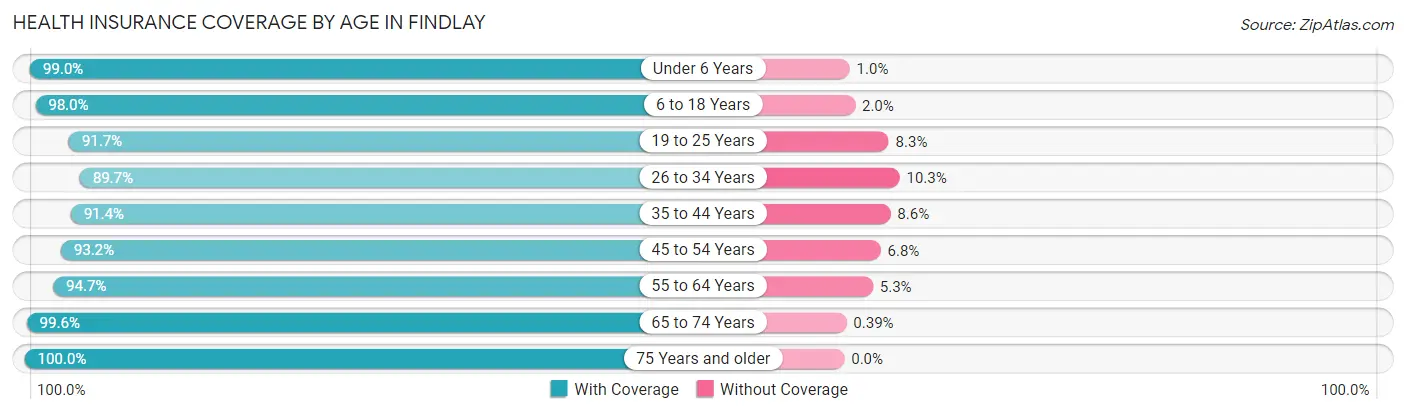
| Age Bracket | With Coverage | Without Coverage |
| Under 6 Years | 3,064 (99.0%) | 31 (1.0%) |
| 6 to 18 Years | 5,490 (98.0%) | 112 (2.0%) |
| 19 to 25 Years | 4,317 (91.7%) | 389 (8.3%) |
| 26 to 34 Years | 4,962 (89.7%) | 570 (10.3%) |
| 35 to 44 Years | 4,059 (91.4%) | 382 (8.6%) |
| 45 to 54 Years | 4,093 (93.2%) | 297 (6.8%) |
| 55 to 64 Years | 4,656 (94.7%) | 262 (5.3%) |
| 65 to 74 Years | 3,819 (99.6%) | 15 (0.4%) |
| 75 Years and older | 3,211 (100.0%) | 0 (0.0%) |
| Total | 37,671 (94.8%) | 2,058 (5.2%) |
Health Insurance Coverage by Citizenship Status in Findlay
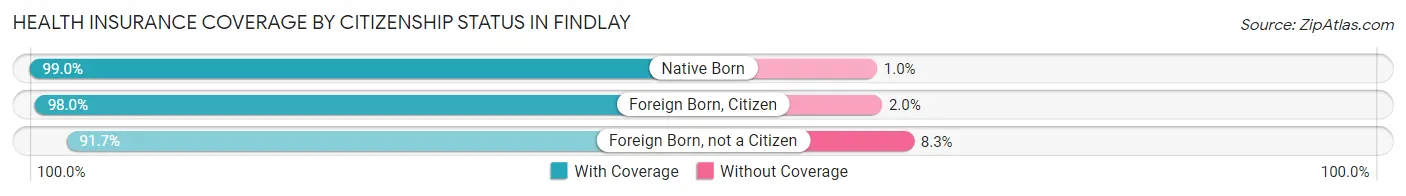
| Citizenship Status | With Coverage | Without Coverage |
| Native Born | 3,064 (99.0%) | 31 (1.0%) |
| Foreign Born, Citizen | 5,490 (98.0%) | 112 (2.0%) |
| Foreign Born, not a Citizen | 4,317 (91.7%) | 389 (8.3%) |
Health Insurance Coverage by Household Income in Findlay
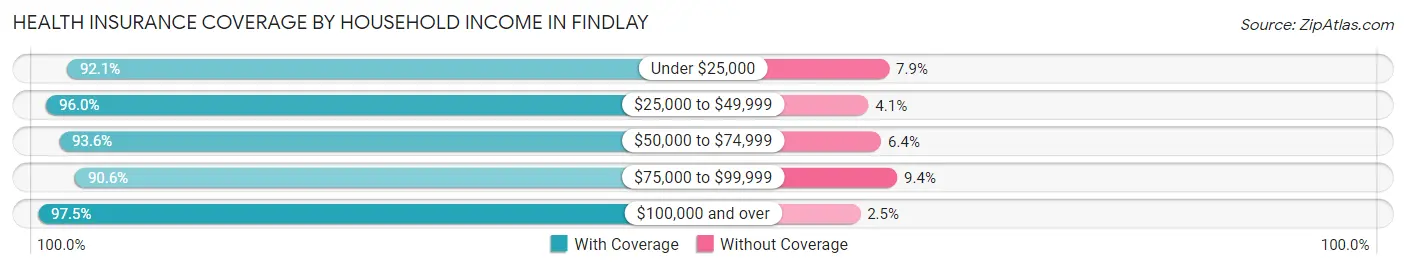
| Household Income | With Coverage | Without Coverage |
| Under $25,000 | 4,092 (92.1%) | 353 (7.9%) |
| $25,000 to $49,999 | 8,187 (96.0%) | 346 (4.1%) |
| $50,000 to $74,999 | 7,385 (93.6%) | 508 (6.4%) |
| $75,000 to $99,999 | 4,778 (90.6%) | 498 (9.4%) |
| $100,000 and over | 12,209 (97.5%) | 315 (2.5%) |
Public vs Private Health Insurance Coverage by Age in Findlay
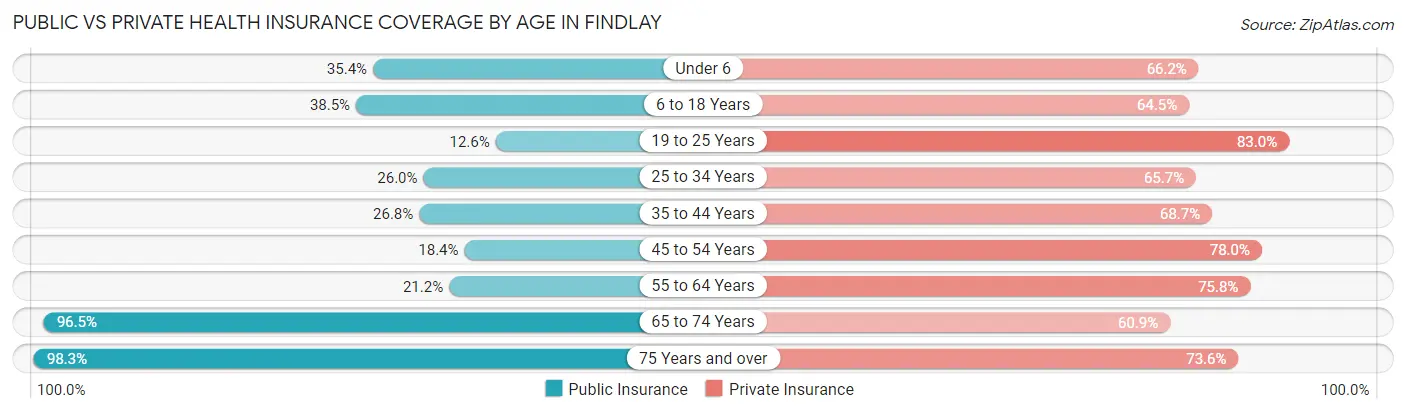
| Age Bracket | Public Insurance | Private Insurance |
| Under 6 | 1,094 (35.3%) | 2,050 (66.2%) |
| 6 to 18 Years | 2,157 (38.5%) | 3,611 (64.5%) |
| 19 to 25 Years | 592 (12.6%) | 3,906 (83.0%) |
| 25 to 34 Years | 1,437 (26.0%) | 3,637 (65.7%) |
| 35 to 44 Years | 1,189 (26.8%) | 3,052 (68.7%) |
| 45 to 54 Years | 807 (18.4%) | 3,422 (77.9%) |
| 55 to 64 Years | 1,044 (21.2%) | 3,728 (75.8%) |
| 65 to 74 Years | 3,698 (96.5%) | 2,336 (60.9%) |
| 75 Years and over | 3,156 (98.3%) | 2,363 (73.6%) |
| Total | 15,174 (38.2%) | 28,105 (70.7%) |
Disability Status by Sex by Age in Findlay
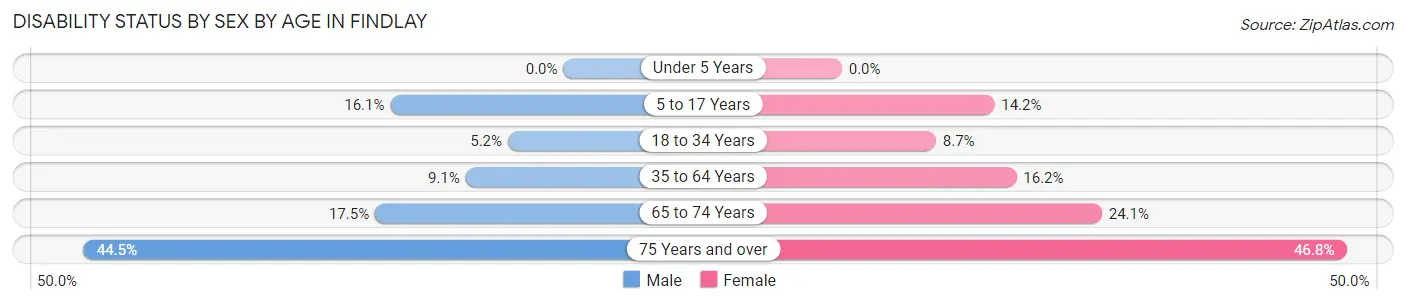
| Age Bracket | Male | Female |
| Under 5 Years | 0 (0.0%) | 0 (0.0%) |
| 5 to 17 Years | 491 (16.1%) | 364 (14.1%) |
| 18 to 34 Years | 270 (5.1%) | 487 (8.7%) |
| 35 to 64 Years | 603 (9.1%) | 1,150 (16.2%) |
| 65 to 74 Years | 305 (17.5%) | 504 (24.1%) |
| 75 Years and over | 542 (44.5%) | 933 (46.8%) |
Disability Class by Sex by Age in Findlay
Disability Class: Hearing Difficulty
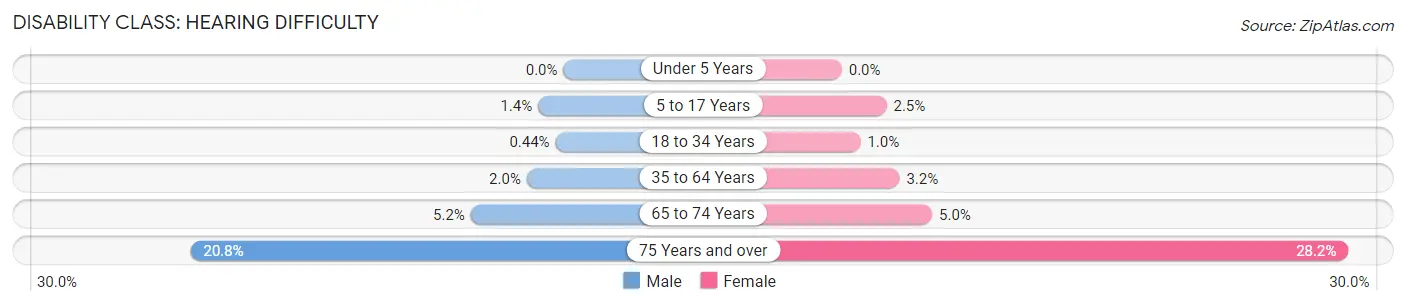
| Age Bracket | Male | Female |
| Under 5 Years | 0 (0.0%) | 0 (0.0%) |
| 5 to 17 Years | 43 (1.4%) | 64 (2.5%) |
| 18 to 34 Years | 23 (0.4%) | 58 (1.0%) |
| 35 to 64 Years | 136 (2.0%) | 228 (3.2%) |
| 65 to 74 Years | 90 (5.2%) | 105 (5.0%) |
| 75 Years and over | 253 (20.8%) | 562 (28.2%) |
Disability Class: Vision Difficulty
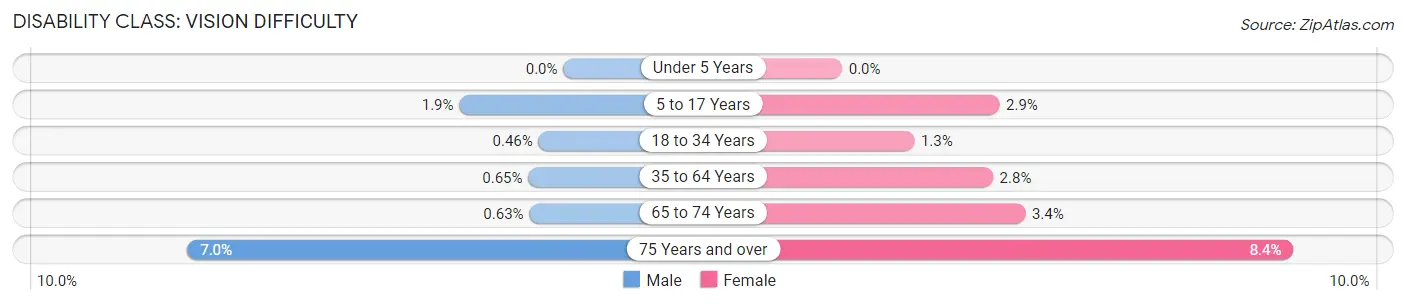
| Age Bracket | Male | Female |
| Under 5 Years | 0 (0.0%) | 0 (0.0%) |
| 5 to 17 Years | 59 (1.9%) | 75 (2.9%) |
| 18 to 34 Years | 24 (0.5%) | 75 (1.3%) |
| 35 to 64 Years | 43 (0.6%) | 199 (2.8%) |
| 65 to 74 Years | 11 (0.6%) | 71 (3.4%) |
| 75 Years and over | 85 (7.0%) | 167 (8.4%) |
Disability Class: Cognitive Difficulty
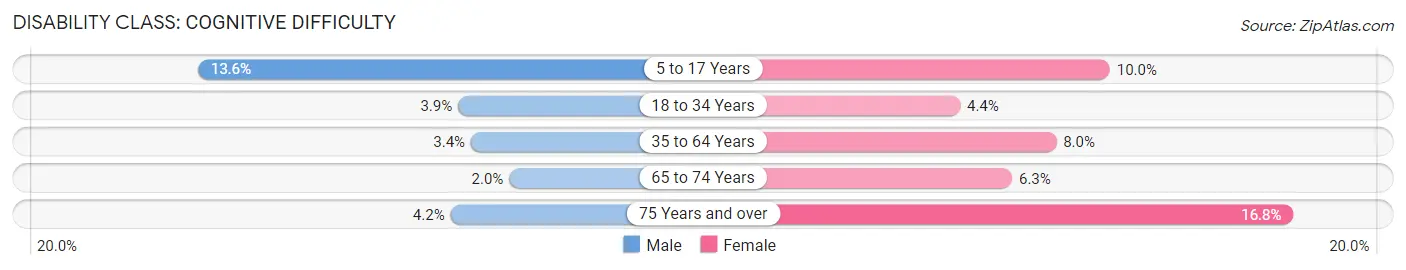
| Age Bracket | Male | Female |
| 5 to 17 Years | 415 (13.6%) | 256 (10.0%) |
| 18 to 34 Years | 205 (3.9%) | 245 (4.4%) |
| 35 to 64 Years | 228 (3.4%) | 565 (8.0%) |
| 65 to 74 Years | 35 (2.0%) | 132 (6.3%) |
| 75 Years and over | 51 (4.2%) | 334 (16.8%) |
Disability Class: Ambulatory Difficulty
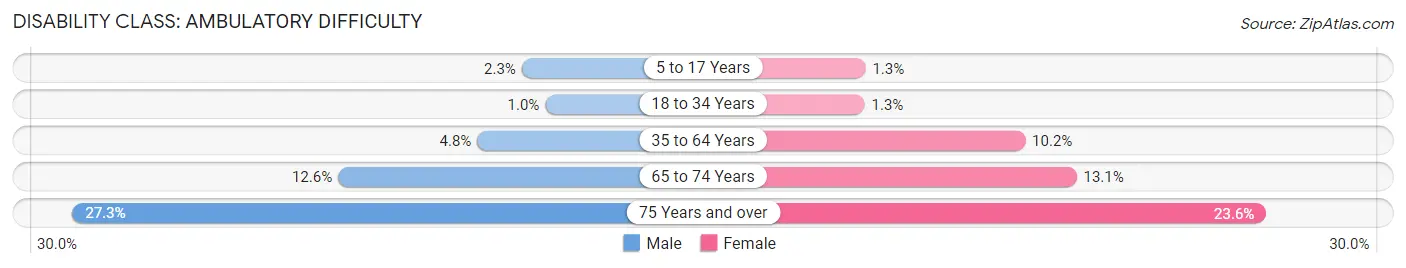
| Age Bracket | Male | Female |
| 5 to 17 Years | 71 (2.3%) | 34 (1.3%) |
| 18 to 34 Years | 53 (1.0%) | 71 (1.3%) |
| 35 to 64 Years | 319 (4.8%) | 725 (10.2%) |
| 65 to 74 Years | 219 (12.6%) | 273 (13.1%) |
| 75 Years and over | 333 (27.3%) | 471 (23.6%) |
Disability Class: Self-Care Difficulty
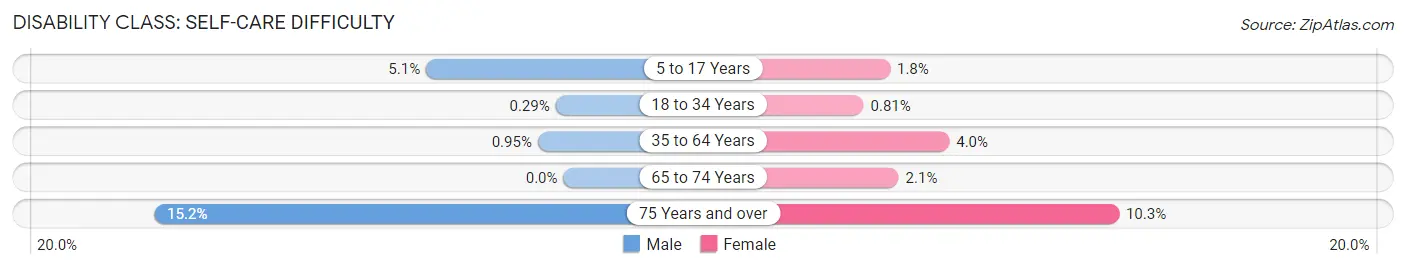
| Age Bracket | Male | Female |
| 5 to 17 Years | 156 (5.1%) | 46 (1.8%) |
| 18 to 34 Years | 15 (0.3%) | 45 (0.8%) |
| 35 to 64 Years | 63 (0.9%) | 283 (4.0%) |
| 65 to 74 Years | 0 (0.0%) | 44 (2.1%) |
| 75 Years and over | 185 (15.2%) | 205 (10.3%) |
Technology Access in Findlay
Computing Device Access in Findlay
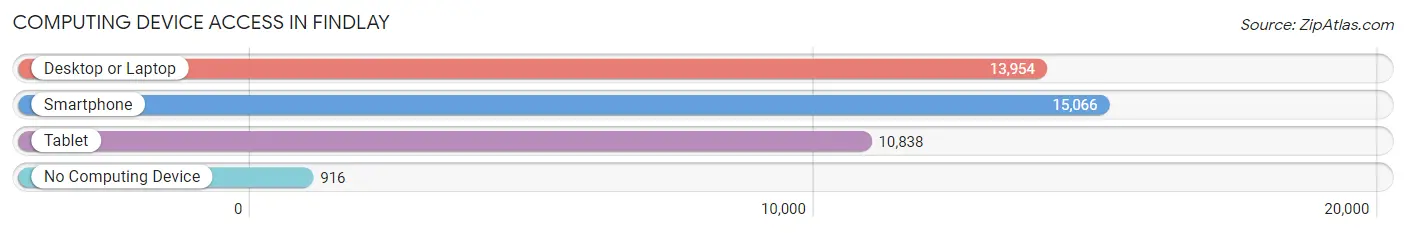
| Device Type | # Households | % Households |
| Desktop or Laptop | 13,954 | 78.6% |
| Smartphone | 15,066 | 84.9% |
| Tablet | 10,838 | 61.1% |
| No Computing Device | 916 | 5.2% |
| Total | 17,747 | 100.0% |
Internet Access in Findlay
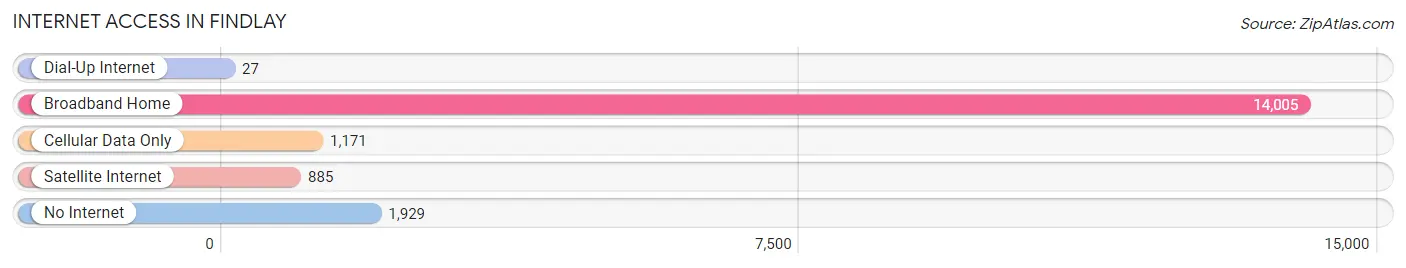
| Internet Type | # Households | % Households |
| Dial-Up Internet | 27 | 0.2% |
| Broadband Home | 14,005 | 78.9% |
| Cellular Data Only | 1,171 | 6.6% |
| Satellite Internet | 885 | 5.0% |
| No Internet | 1,929 | 10.9% |
| Total | 17,747 | 100.0% |
Findlay Summary
History
The city of Findlay, Ohio is located in Hancock County in the northwestern part of the state. It is the county seat and the largest city in the county. The city was founded in 1821 by William Hancock, a Revolutionary War veteran, and was originally known as Hancock Station. The city was later renamed Findlay in honor of James Findlay, a prominent Ohio politician.
The city of Findlay has a rich history that dates back to the early 19th century. The city was a major stop on the Underground Railroad, and many of the city’s historic buildings were built during this time. The city was also home to the first public library in the state of Ohio, which was established in 1845.
The city of Findlay experienced a period of rapid growth in the late 19th and early 20th centuries. The city was home to several major industries, including glass manufacturing, oil refining, and the production of agricultural equipment. The city also became a major transportation hub, with the construction of the Findlay and Fort Wayne Railroad in 1881.
The city of Findlay experienced a period of decline in the mid-20th century, as many of its major industries moved away or closed down. However, the city has experienced a resurgence in recent years, with the development of new businesses and industries.
Geography
Findlay is located in northwestern Ohio, in Hancock County. The city is situated on the Blanchard River, which flows through the city and is a major source of water for the area. The city is located in the Great Black Swamp region of Ohio, which is characterized by flat terrain and numerous wetlands.
The city of Findlay covers an area of approximately 11.5 square miles, with a population of approximately 41,000 people. The city is located approximately 50 miles south of Toledo and 60 miles north of Columbus.
Economy
The economy of Findlay is largely based on manufacturing and services. The city is home to several major employers, including Marathon Petroleum Corporation, Cooper Tire & Rubber Company, and Whirlpool Corporation. The city is also home to several smaller businesses, including restaurants, retail stores, and medical facilities.
The city of Findlay is also home to several educational institutions, including the University of Findlay, Owens Community College, and the Findlay-Hancock County Public Library.
Demographics
As of the 2010 census, the population of Findlay was 41,202. The racial makeup of the city was 90.2% White, 4.3% African American, 0.4% Native American, 1.2% Asian, 0.1% Pacific Islander, 1.3% from other races, and 2.5% from two or more races. Hispanic or Latino of any race were 3.7% of the population.
The median household income in Findlay was $41,945, and the median family income was $51,945. The per capita income for the city was $21,845. About 11.2% of families and 14.2% of the population were below the poverty line, including 19.2% of those under age 18 and 8.2% of those age 65 or over.
Common Questions
What is Per Capita Income in Findlay?
Per Capita income in Findlay is $36,029.
What is the Median Family Income in Findlay?
Median Family Income in Findlay is $76,220.
What is the Median Household income in Findlay?
Median Household Income in Findlay is $54,986.
What is Income or Wage Gap in Findlay?
Income or Wage Gap in Findlay is 32.7%.
Women in Findlay earn 67.3 cents for every dollar earned by a man.
What is Inequality or Gini Index in Findlay?
Inequality or Gini Index in Findlay is 0.48.
What is the Total Population of Findlay?
Total Population of Findlay is 40,408.
What is the Total Male Population of Findlay?
Total Male Population of Findlay is 19,412.
What is the Total Female Population of Findlay?
Total Female Population of Findlay is 20,996.
What is the Ratio of Males per 100 Females in Findlay?
There are 92.46 Males per 100 Females in Findlay.
What is the Ratio of Females per 100 Males in Findlay?
There are 108.16 Females per 100 Males in Findlay.
What is the Median Population Age in Findlay?
Median Population Age in Findlay is 38.1 Years.
What is the Average Family Size in Findlay
Average Family Size in Findlay is 2.9 People.
What is the Average Household Size in Findlay
Average Household Size in Findlay is 2.2 People.
How Large is the Labor Force in Findlay?
There are 20,882 People in the Labor Forcein in Findlay.
What is the Percentage of People in the Labor Force in Findlay?
63.3% of People are in the Labor Force in Findlay.
What is the Unemployment Rate in Findlay?
Unemployment Rate in Findlay is 4.3%.