Cities with the Highest Percentage of Population Employed in Administrative & Support Services in New Jersey
RELATED REPORTS & OPTIONS
Administrative & Support Services
New Jersey
Compare Cities
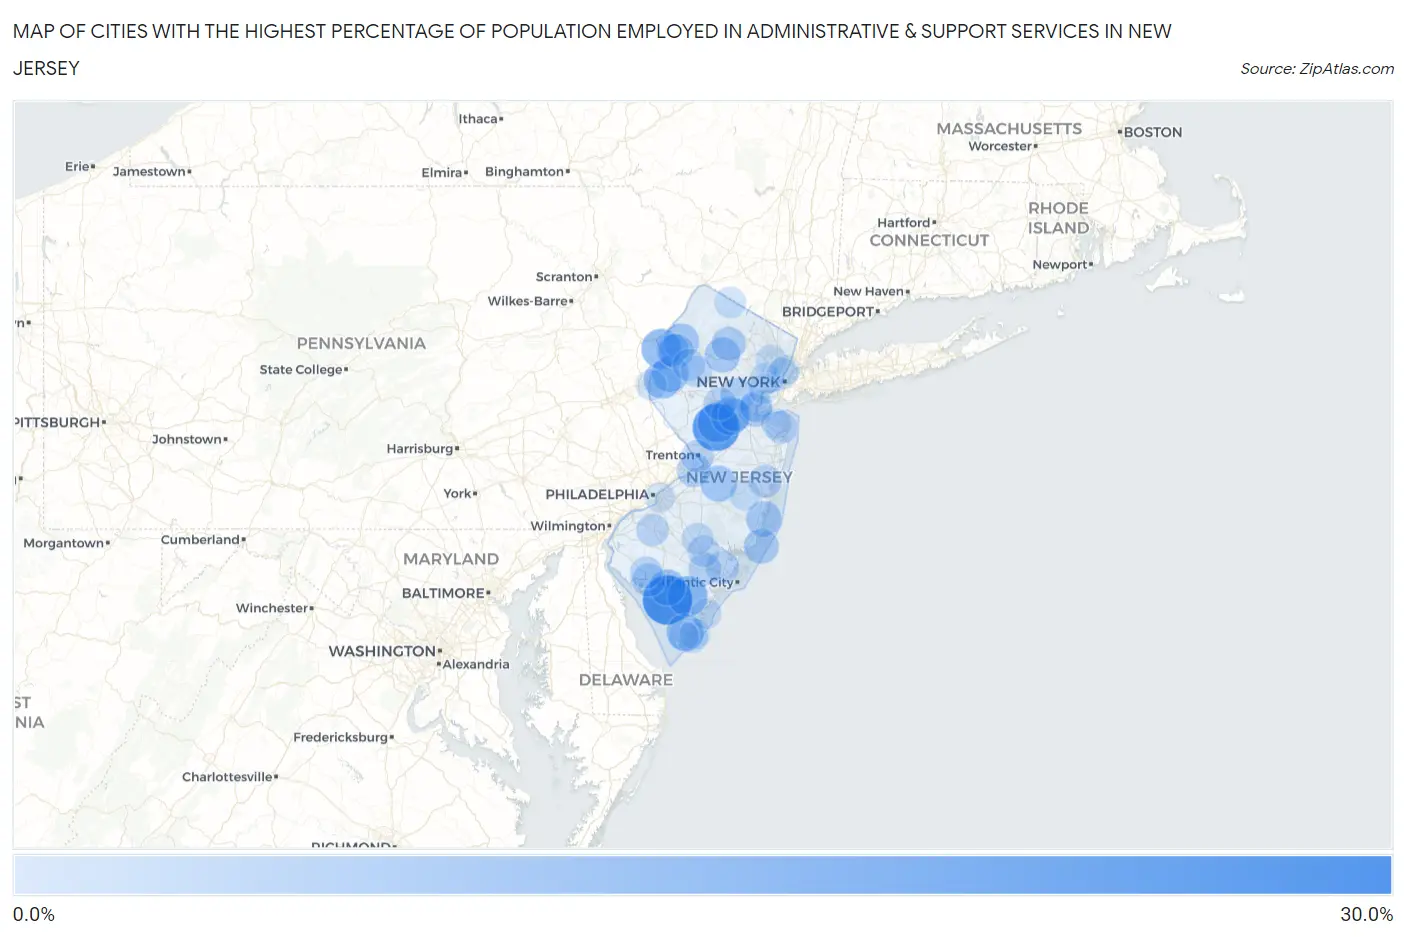
Map of Cities with the Highest Percentage of Population Employed in Administrative & Support Services in New Jersey
0.0%
30.0%
Cities with the Highest Percentage of Population Employed in Administrative & Support Services in New Jersey
| City | % Employed | vs State | vs National | |
| 1. | Port Norris | 26.0% | 3.9%(+22.1)#1 | 4.1%(+21.9)#260 |
| 2. | East Rocky Hill | 23.5% | 3.9%(+19.5)#2 | 4.1%(+19.3)#327 |
| 3. | Beesleys Point | 23.0% | 3.9%(+19.1)#3 | 4.1%(+18.9)#343 |
| 4. | Branchville Borough | 19.7% | 3.9%(+15.8)#4 | 4.1%(+15.6)#453 |
| 5. | West Wildwood Borough | 19.4% | 3.9%(+15.4)#5 | 4.1%(+15.2)#467 |
| 6. | Arrowhead Lake | 17.5% | 3.9%(+13.6)#6 | 4.1%(+13.4)#573 |
| 7. | Griggstown | 16.3% | 3.9%(+12.4)#7 | 4.1%(+12.2)#658 |
| 8. | Belleplain | 16.3% | 3.9%(+12.3)#8 | 4.1%(+12.1)#662 |
| 9. | Columbia | 15.7% | 3.9%(+11.8)#9 | 4.1%(+11.6)#708 |
| 10. | Llewellyn Park | 14.9% | 3.9%(+10.9)#10 | 4.1%(+10.7)#814 |
| 11. | Voorhees | 14.1% | 3.9%(+10.2)#11 | 4.1%(+9.97)#927 |
| 12. | Nesco | 13.8% | 3.9%(+9.83)#12 | 4.1%(+9.63)#975 |
| 13. | New Village | 13.4% | 3.9%(+9.44)#13 | 4.1%(+9.24)#1,047 |
| 14. | Rio Grande | 13.3% | 3.9%(+9.35)#14 | 4.1%(+9.15)#1,064 |
| 15. | Brass Castle | 13.0% | 3.9%(+9.09)#15 | 4.1%(+8.89)#1,108 |
| 16. | Heislerville | 13.0% | 3.9%(+9.09)#16 | 4.1%(+8.89)#1,111 |
| 17. | Harrisonville | 12.4% | 3.9%(+8.48)#17 | 4.1%(+8.28)#1,224 |
| 18. | Laurel Lake | 12.3% | 3.9%(+8.40)#18 | 4.1%(+8.20)#1,234 |
| 19. | Victory Gardens Borough | 12.3% | 3.9%(+8.32)#19 | 4.1%(+8.12)#1,252 |
| 20. | Mcguire Afb | 12.1% | 3.9%(+8.17)#20 | 4.1%(+7.97)#1,280 |
| 21. | Lindenwold Borough | 11.9% | 3.9%(+7.94)#21 | 4.1%(+7.74)#1,336 |
| 22. | Marksboro | 11.8% | 3.9%(+7.82)#22 | 4.1%(+7.61)#1,363 |
| 23. | Cologne | 11.7% | 3.9%(+7.71)#23 | 4.1%(+7.51)#1,389 |
| 24. | New Gretna | 11.7% | 3.9%(+7.70)#24 | 4.1%(+7.50)#1,391 |
| 25. | Waretown | 11.4% | 3.9%(+7.47)#25 | 4.1%(+7.27)#1,440 |
| 26. | Dover | 11.4% | 3.9%(+7.41)#26 | 4.1%(+7.21)#1,457 |
| 27. | North Beach Haven | 11.1% | 3.9%(+7.16)#27 | 4.1%(+6.96)#1,510 |
| 28. | Wharton Borough | 11.1% | 3.9%(+7.15)#28 | 4.1%(+6.95)#1,527 |
| 29. | Hope | 11.0% | 3.9%(+7.09)#29 | 4.1%(+6.89)#1,541 |
| 30. | Crosswicks | 10.9% | 3.9%(+6.96)#30 | 4.1%(+6.76)#1,578 |
| 31. | Plainfield | 10.2% | 3.9%(+6.21)#31 | 4.1%(+6.01)#1,834 |
| 32. | Lake Telemark | 10.1% | 3.9%(+6.15)#32 | 4.1%(+5.95)#1,858 |
| 33. | Florence | 10.0% | 3.9%(+6.08)#33 | 4.1%(+5.88)#1,887 |
| 34. | Perth Amboy | 9.9% | 3.9%(+5.99)#34 | 4.1%(+5.79)#1,936 |
| 35. | Regency At Monroe | 9.5% | 3.9%(+5.54)#35 | 4.1%(+5.34)#2,128 |
| 36. | Fairton | 9.5% | 3.9%(+5.51)#36 | 4.1%(+5.31)#2,139 |
| 37. | New Brunswick | 9.4% | 3.9%(+5.41)#37 | 4.1%(+5.21)#2,188 |
| 38. | Flemington Borough | 9.2% | 3.9%(+5.30)#38 | 4.1%(+5.10)#2,239 |
| 39. | Deal Borough | 9.2% | 3.9%(+5.24)#39 | 4.1%(+5.04)#2,270 |
| 40. | Pomona | 9.2% | 3.9%(+5.21)#40 | 4.1%(+5.01)#2,280 |
| 41. | Mays Landing | 9.1% | 3.9%(+5.19)#41 | 4.1%(+4.99)#2,290 |
| 42. | Finderne | 9.1% | 3.9%(+5.16)#42 | 4.1%(+4.96)#2,307 |
| 43. | Titusville | 9.1% | 3.9%(+5.14)#43 | 4.1%(+4.94)#2,313 |
| 44. | Woodlynne Borough | 9.1% | 3.9%(+5.11)#44 | 4.1%(+4.91)#2,347 |
| 45. | Carlls Corner | 9.0% | 3.9%(+5.09)#45 | 4.1%(+4.89)#2,358 |
| 46. | Mount Hermon | 9.0% | 3.9%(+5.07)#46 | 4.1%(+4.87)#2,371 |
| 47. | Rainbow Lakes | 9.0% | 3.9%(+5.05)#47 | 4.1%(+4.85)#2,375 |
| 48. | Leisure Village | 8.9% | 3.9%(+4.99)#48 | 4.1%(+4.79)#2,407 |
| 49. | Trenton | 8.9% | 3.9%(+4.93)#49 | 4.1%(+4.73)#2,453 |
| 50. | Sewaren | 8.7% | 3.9%(+4.79)#50 | 4.1%(+4.59)#2,531 |
| 51. | Ampere North | 8.7% | 3.9%(+4.76)#51 | 4.1%(+4.56)#2,548 |
| 52. | Cape May Point Borough | 8.7% | 3.9%(+4.75)#52 | 4.1%(+4.55)#2,556 |
| 53. | Palmyra Borough | 8.6% | 3.9%(+4.68)#53 | 4.1%(+4.48)#2,602 |
| 54. | Richwood | 8.6% | 3.9%(+4.66)#54 | 4.1%(+4.46)#2,614 |
| 55. | Gouldtown | 8.6% | 3.9%(+4.61)#55 | 4.1%(+4.41)#2,641 |
| 56. | Beattystown | 8.4% | 3.9%(+4.44)#56 | 4.1%(+4.24)#2,743 |
| 57. | Stirling | 8.4% | 3.9%(+4.43)#57 | 4.1%(+4.23)#2,744 |
| 58. | Bridgeton | 8.3% | 3.9%(+4.39)#58 | 4.1%(+4.19)#2,771 |
| 59. | Navesink | 8.3% | 3.9%(+4.30)#59 | 4.1%(+4.10)#2,831 |
| 60. | Stone Harbor Borough | 8.0% | 3.9%(+4.10)#60 | 4.1%(+3.90)#2,963 |
| 61. | South Bound Brook Borough | 8.0% | 3.9%(+4.09)#61 | 4.1%(+3.89)#2,968 |
| 62. | Elwood | 8.0% | 3.9%(+4.04)#62 | 4.1%(+3.84)#3,001 |
| 63. | Hammonton | 7.9% | 3.9%(+3.95)#63 | 4.1%(+3.75)#3,061 |
| 64. | Long Valley | 7.9% | 3.9%(+3.95)#64 | 4.1%(+3.75)#3,062 |
| 65. | Woodbury Heights Borough | 7.9% | 3.9%(+3.95)#65 | 4.1%(+3.75)#3,063 |
| 66. | Allenhurst Borough | 7.9% | 3.9%(+3.91)#66 | 4.1%(+3.71)#3,105 |
| 67. | Red Bank Borough | 7.8% | 3.9%(+3.87)#67 | 4.1%(+3.67)#3,132 |
| 68. | East Newark Borough | 7.6% | 3.9%(+3.66)#68 | 4.1%(+3.46)#3,298 |
| 69. | Vernon Valley | 7.6% | 3.9%(+3.61)#69 | 4.1%(+3.41)#3,332 |
| 70. | Belmar Borough | 7.5% | 3.9%(+3.60)#70 | 4.1%(+3.40)#3,343 |
| 71. | Brookside | 7.5% | 3.9%(+3.54)#71 | 4.1%(+3.34)#3,406 |
| 72. | Passaic | 7.5% | 3.9%(+3.52)#72 | 4.1%(+3.32)#3,430 |
| 73. | Newark | 7.4% | 3.9%(+3.43)#73 | 4.1%(+3.23)#3,513 |
| 74. | Clementon Borough | 7.4% | 3.9%(+3.42)#74 | 4.1%(+3.22)#3,524 |
| 75. | Union City | 7.3% | 3.9%(+3.36)#75 | 4.1%(+3.16)#3,576 |
| 76. | Freehold Borough | 7.3% | 3.9%(+3.34)#76 | 4.1%(+3.14)#3,600 |
| 77. | Sunset Lake | 7.2% | 3.9%(+3.21)#77 | 4.1%(+3.01)#3,728 |
| 78. | Crestwood Village | 7.1% | 3.9%(+3.13)#78 | 4.1%(+2.93)#3,817 |
| 79. | Phillipsburg | 7.1% | 3.9%(+3.13)#79 | 4.1%(+2.92)#3,818 |
| 80. | Wildwood | 6.9% | 3.9%(+2.97)#80 | 4.1%(+2.77)#3,972 |
| 81. | North Wildwood | 6.9% | 3.9%(+2.96)#81 | 4.1%(+2.76)#3,979 |
| 82. | Neshanic | 6.9% | 3.9%(+2.95)#82 | 4.1%(+2.75)#3,991 |
| 83. | Beachwood Borough | 6.9% | 3.9%(+2.93)#83 | 4.1%(+2.73)#4,010 |
| 84. | Lake Hiawatha | 6.8% | 3.9%(+2.89)#84 | 4.1%(+2.69)#4,052 |
| 85. | Moonachie Borough | 6.7% | 3.9%(+2.77)#85 | 4.1%(+2.57)#4,171 |
| 86. | Belford | 6.7% | 3.9%(+2.76)#86 | 4.1%(+2.56)#4,179 |
| 87. | Sea Isle City | 6.7% | 3.9%(+2.74)#87 | 4.1%(+2.54)#4,200 |
| 88. | Bedminster | 6.6% | 3.9%(+2.70)#88 | 4.1%(+2.50)#4,264 |
| 89. | Elizabeth | 6.6% | 3.9%(+2.68)#89 | 4.1%(+2.48)#4,287 |
| 90. | Erma | 6.5% | 3.9%(+2.58)#90 | 4.1%(+2.38)#4,400 |
| 91. | Camden | 6.5% | 3.9%(+2.52)#91 | 4.1%(+2.32)#4,471 |
| 92. | Hopatcong Borough | 6.4% | 3.9%(+2.41)#92 | 4.1%(+2.21)#4,606 |
| 93. | Leesburg | 6.3% | 3.9%(+2.37)#93 | 4.1%(+2.17)#4,670 |
| 94. | Neptune City Borough | 6.3% | 3.9%(+2.31)#94 | 4.1%(+2.11)#4,750 |
| 95. | National Park Borough | 6.2% | 3.9%(+2.29)#95 | 4.1%(+2.09)#4,785 |
| 96. | Mount Hope | 6.2% | 3.9%(+2.22)#96 | 4.1%(+2.02)#4,880 |
| 97. | South Dennis | 6.2% | 3.9%(+2.21)#97 | 4.1%(+2.01)#4,897 |
| 98. | Mckee | 6.1% | 3.9%(+2.16)#98 | 4.1%(+1.96)#4,971 |
| 99. | Roosevelt Borough | 6.1% | 3.9%(+2.15)#99 | 4.1%(+1.95)#4,979 |
| 100. | West New York | 6.1% | 3.9%(+2.15)#100 | 4.1%(+1.95)#4,985 |
Common Questions
What are the Top 10 Cities with the Highest Percentage of Population Employed in Administrative & Support Services in New Jersey?
Top 10 Cities with the Highest Percentage of Population Employed in Administrative & Support Services in New Jersey are:
#1
26.0%
#2
23.5%
#3
16.3%
#4
16.3%
#5
15.7%
#6
14.1%
#7
13.4%
#8
13.3%
#9
13.0%
#10
12.3%
What city has the Highest Percentage of Population Employed in Administrative & Support Services in New Jersey?
Port Norris has the Highest Percentage of Population Employed in Administrative & Support Services in New Jersey with 26.0%.
What is the Percentage of Population Employed in Administrative & Support Services in the State of New Jersey?
Percentage of Population Employed in Administrative & Support Services in New Jersey is 3.9%.
What is the Percentage of Population Employed in Administrative & Support Services in the United States?
Percentage of Population Employed in Administrative & Support Services in the United States is 4.1%.