Cities with the Highest Percentage of English Population in New Jersey
RELATED REPORTS & OPTIONS
English
New Jersey
Compare Cities
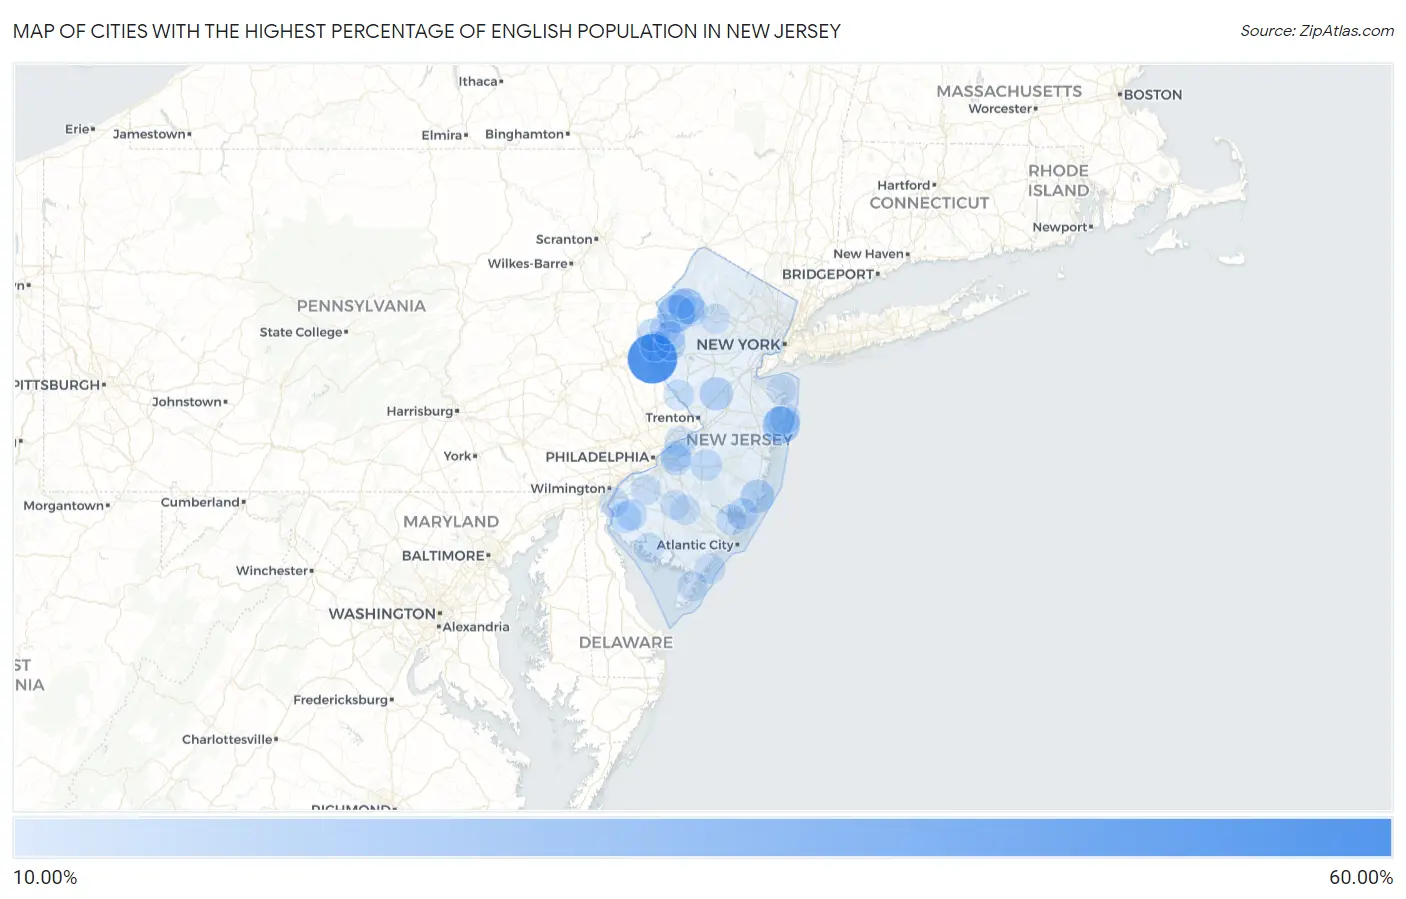
Map of Cities with the Highest Percentage of English Population in New Jersey
0.00%
60.00%
Cities with the Highest Percentage of English Population in New Jersey
| City | English | vs State | vs National | |
| 1. | Finesville | 54.68% | 4.87%(+49.8)#1 | 8.59%(+46.1)#175 |
| 2. | New Vernon | 44.76% | 4.87%(+39.9)#2 | 8.59%(+36.2)#347 |
| 3. | Port Elizabeth | 42.81% | 4.87%(+37.9)#3 | 8.59%(+34.2)#399 |
| 4. | Delmont | 41.03% | 4.87%(+36.2)#4 | 8.59%(+32.4)#447 |
| 5. | Marlboro | 37.33% | 4.87%(+32.5)#5 | 8.59%(+28.7)#583 |
| 6. | Sweetwater | 35.13% | 4.87%(+30.3)#6 | 8.59%(+26.5)#689 |
| 7. | Tavistock Borough | 33.33% | 4.87%(+28.5)#7 | 8.59%(+24.7)#811 |
| 8. | Cape May Point Borough | 30.32% | 4.87%(+25.5)#8 | 8.59%(+21.7)#1,034 |
| 9. | Farmingdale Borough | 30.02% | 4.87%(+25.1)#9 | 8.59%(+21.4)#1,055 |
| 10. | Money Island | 30.00% | 4.87%(+25.1)#10 | 8.59%(+21.4)#1,061 |
| 11. | Hope | 29.68% | 4.87%(+24.8)#11 | 8.59%(+21.1)#1,097 |
| 12. | Laurel Heights | 29.25% | 4.87%(+24.4)#12 | 8.59%(+20.7)#1,150 |
| 13. | West Belmar | 28.57% | 4.87%(+23.7)#13 | 8.59%(+20.0)#1,227 |
| 14. | Othello | 26.36% | 4.87%(+21.5)#14 | 8.59%(+17.8)#1,511 |
| 15. | Johnsonburg | 26.17% | 4.87%(+21.3)#15 | 8.59%(+17.6)#1,549 |
| 16. | Sunset Lake | 25.68% | 4.87%(+20.8)#16 | 8.59%(+17.1)#1,613 |
| 17. | Milmay | 25.14% | 4.87%(+20.3)#17 | 8.59%(+16.6)#1,708 |
| 18. | Nesco | 24.08% | 4.87%(+19.2)#18 | 8.59%(+15.5)#1,908 |
| 19. | Harrisonville | 23.57% | 4.87%(+18.7)#19 | 8.59%(+15.0)#2,001 |
| 20. | Marshallville | 23.45% | 4.87%(+18.6)#20 | 8.59%(+14.9)#2,022 |
| 21. | Mount Tabor | 22.31% | 4.87%(+17.4)#21 | 8.59%(+13.7)#2,244 |
| 22. | Laurel Springs Borough | 22.26% | 4.87%(+17.4)#22 | 8.59%(+13.7)#2,255 |
| 23. | Shiloh Borough | 21.97% | 4.87%(+17.1)#23 | 8.59%(+13.4)#2,343 |
| 24. | Manahawkin | 21.57% | 4.87%(+16.7)#24 | 8.59%(+13.0)#2,465 |
| 25. | Kingston | 20.95% | 4.87%(+16.1)#25 | 8.59%(+12.4)#2,657 |
| 26. | Pennington Borough | 20.07% | 4.87%(+15.2)#26 | 8.59%(+11.5)#2,946 |
| 27. | Pemberton Borough | 19.43% | 4.87%(+14.6)#27 | 8.59%(+10.8)#3,219 |
| 28. | East Vineland | 19.39% | 4.87%(+14.5)#28 | 8.59%(+10.8)#3,240 |
| 29. | Brainards | 19.28% | 4.87%(+14.4)#29 | 8.59%(+10.7)#3,279 |
| 30. | Pitman Borough | 19.27% | 4.87%(+14.4)#30 | 8.59%(+10.7)#3,281 |
| 31. | Wenonah Borough | 19.20% | 4.87%(+14.3)#31 | 8.59%(+10.6)#3,309 |
| 32. | Surf City Borough | 19.17% | 4.87%(+14.3)#32 | 8.59%(+10.6)#3,325 |
| 33. | Beesleys Point | 18.83% | 4.87%(+14.0)#33 | 8.59%(+10.2)#3,453 |
| 34. | Cookstown | 18.56% | 4.87%(+13.7)#34 | 8.59%(+9.97)#3,577 |
| 35. | Richland | 18.53% | 4.87%(+13.7)#35 | 8.59%(+9.94)#3,582 |
| 36. | Pine Beach Borough | 18.23% | 4.87%(+13.4)#36 | 8.59%(+9.65)#3,746 |
| 37. | Crosswicks | 17.80% | 4.87%(+12.9)#37 | 8.59%(+9.21)#3,981 |
| 38. | Marmora | 17.79% | 4.87%(+12.9)#38 | 8.59%(+9.20)#3,988 |
| 39. | New Gretna | 17.75% | 4.87%(+12.9)#39 | 8.59%(+9.16)#4,014 |
| 40. | Tuckahoe | 17.65% | 4.87%(+12.8)#40 | 8.59%(+9.06)#4,079 |
| 41. | Mystic Island | 17.50% | 4.87%(+12.6)#41 | 8.59%(+8.91)#4,167 |
| 42. | Arrowhead Lake | 17.48% | 4.87%(+12.6)#42 | 8.59%(+8.89)#4,189 |
| 43. | Quinton | 17.46% | 4.87%(+12.6)#43 | 8.59%(+8.87)#4,203 |
| 44. | Dennisville | 17.35% | 4.87%(+12.5)#44 | 8.59%(+8.77)#4,260 |
| 45. | Leisuretowne | 17.32% | 4.87%(+12.4)#45 | 8.59%(+8.73)#4,284 |
| 46. | Asbury | 17.24% | 4.87%(+12.4)#46 | 8.59%(+8.65)#4,327 |
| 47. | Sewell | 17.21% | 4.87%(+12.3)#47 | 8.59%(+8.62)#4,345 |
| 48. | Cumberland-Hesstown | 16.91% | 4.87%(+12.0)#48 | 8.59%(+8.32)#4,527 |
| 49. | Swedesboro Borough | 16.89% | 4.87%(+12.0)#49 | 8.59%(+8.30)#4,538 |
| 50. | Alloway | 16.81% | 4.87%(+11.9)#50 | 8.59%(+8.22)#4,583 |
| 51. | Ocean View | 16.70% | 4.87%(+11.8)#51 | 8.59%(+8.12)#4,657 |
| 52. | Mickleton | 16.68% | 4.87%(+11.8)#52 | 8.59%(+8.09)#4,669 |
| 53. | Newfoundland | 16.56% | 4.87%(+11.7)#53 | 8.59%(+7.97)#4,763 |
| 54. | Mantoloking Borough | 16.55% | 4.87%(+11.7)#54 | 8.59%(+7.96)#4,770 |
| 55. | Beverly | 16.43% | 4.87%(+11.6)#55 | 8.59%(+7.84)#4,849 |
| 56. | Ramblewood | 16.39% | 4.87%(+11.5)#56 | 8.59%(+7.80)#4,870 |
| 57. | Palermo | 16.34% | 4.87%(+11.5)#57 | 8.59%(+7.76)#4,911 |
| 58. | Ocean Grove | 16.27% | 4.87%(+11.4)#58 | 8.59%(+7.68)#4,966 |
| 59. | Silver Lake | 16.26% | 4.87%(+11.4)#59 | 8.59%(+7.67)#4,973 |
| 60. | Lambertville | 16.19% | 4.87%(+11.3)#60 | 8.59%(+7.60)#5,027 |
| 61. | Three Bridges | 16.17% | 4.87%(+11.3)#61 | 8.59%(+7.58)#5,034 |
| 62. | Moorestown Lenola | 16.13% | 4.87%(+11.3)#62 | 8.59%(+7.54)#5,063 |
| 63. | Stone Harbor Borough | 16.12% | 4.87%(+11.3)#63 | 8.59%(+7.53)#5,068 |
| 64. | Port Republic | 16.02% | 4.87%(+11.2)#64 | 8.59%(+7.43)#5,146 |
| 65. | Elmer Borough | 16.01% | 4.87%(+11.1)#65 | 8.59%(+7.42)#5,156 |
| 66. | Branchville Borough | 15.96% | 4.87%(+11.1)#66 | 8.59%(+7.37)#5,206 |
| 67. | Barnegat Light Borough | 15.86% | 4.87%(+11.0)#67 | 8.59%(+7.27)#5,269 |
| 68. | Seaville | 15.84% | 4.87%(+11.0)#68 | 8.59%(+7.25)#5,286 |
| 69. | Lopatcong Overlook | 15.74% | 4.87%(+10.9)#69 | 8.59%(+7.15)#5,377 |
| 70. | Strathmere | 15.70% | 4.87%(+10.8)#70 | 8.59%(+7.11)#5,406 |
| 71. | Thorofare | 15.70% | 4.87%(+10.8)#71 | 8.59%(+7.11)#5,411 |
| 72. | Hopewell Borough | 15.67% | 4.87%(+10.8)#72 | 8.59%(+7.08)#5,435 |
| 73. | Ringoes | 15.62% | 4.87%(+10.8)#73 | 8.59%(+7.04)#5,468 |
| 74. | Brookfield | 15.50% | 4.87%(+10.6)#74 | 8.59%(+6.92)#5,546 |
| 75. | West Cape May Borough | 15.43% | 4.87%(+10.6)#75 | 8.59%(+6.84)#5,608 |
| 76. | Haddon Heights Borough | 15.34% | 4.87%(+10.5)#76 | 8.59%(+6.75)#5,666 |
| 77. | Mullica Hill | 15.31% | 4.87%(+10.4)#77 | 8.59%(+6.72)#5,684 |
| 78. | Haddonfield Borough | 15.29% | 4.87%(+10.4)#78 | 8.59%(+6.71)#5,701 |
| 79. | Woodstown Borough | 15.24% | 4.87%(+10.4)#79 | 8.59%(+6.66)#5,743 |
| 80. | Windsor | 15.24% | 4.87%(+10.4)#80 | 8.59%(+6.66)#5,744 |
| 81. | Green | 15.22% | 4.87%(+10.3)#81 | 8.59%(+6.63)#5,763 |
| 82. | Cape May Court House | 15.17% | 4.87%(+10.3)#82 | 8.59%(+6.58)#5,798 |
| 83. | Pennsville | 15.12% | 4.87%(+10.3)#83 | 8.59%(+6.53)#5,837 |
| 84. | Brass Castle | 15.09% | 4.87%(+10.2)#84 | 8.59%(+6.50)#5,865 |
| 85. | Peapack And Gladstone Borough | 15.03% | 4.87%(+10.2)#85 | 8.59%(+6.44)#5,918 |
| 86. | Oaklyn Borough | 15.01% | 4.87%(+10.1)#86 | 8.59%(+6.42)#5,945 |
| 87. | Spring Lake Heights Borough | 14.95% | 4.87%(+10.1)#87 | 8.59%(+6.36)#6,022 |
| 88. | Auburn | 14.85% | 4.87%(+9.98)#88 | 8.59%(+6.26)#6,110 |
| 89. | Westmont | 14.79% | 4.87%(+9.92)#89 | 8.59%(+6.20)#6,163 |
| 90. | Stockton Borough | 14.74% | 4.87%(+9.87)#90 | 8.59%(+6.15)#6,210 |
| 91. | Allamuchy | 14.71% | 4.87%(+9.84)#91 | 8.59%(+6.12)#6,238 |
| 92. | Cedarville | 14.64% | 4.87%(+9.77)#92 | 8.59%(+6.05)#6,294 |
| 93. | Kenvil | 14.55% | 4.87%(+9.68)#93 | 8.59%(+5.96)#6,389 |
| 94. | Marksboro | 14.55% | 4.87%(+9.68)#94 | 8.59%(+5.96)#6,394 |
| 95. | Navesink | 14.53% | 4.87%(+9.67)#95 | 8.59%(+5.95)#6,407 |
| 96. | Riverton Borough | 14.51% | 4.87%(+9.64)#96 | 8.59%(+5.92)#6,427 |
| 97. | Collings Lakes | 14.50% | 4.87%(+9.63)#97 | 8.59%(+5.91)#6,439 |
| 98. | Shark River Hills | 14.49% | 4.87%(+9.62)#98 | 8.59%(+5.90)#6,455 |
| 99. | Tuckerton Borough | 14.46% | 4.87%(+9.59)#99 | 8.59%(+5.87)#6,479 |
| 100. | Victory Lakes | 14.45% | 4.87%(+9.58)#100 | 8.59%(+5.86)#6,495 |
Common Questions
What are the Top 10 Cities with the Highest Percentage of English Population in New Jersey?
Top 10 Cities with the Highest Percentage of English Population in New Jersey are:
#1
54.68%
#2
29.68%
#3
28.57%
#4
26.17%
#5
21.57%
#6
20.95%
#7
19.28%
#8
17.50%
#9
17.46%
#10
17.32%
What city has the Highest Percentage of English Population in New Jersey?
Finesville has the Highest Percentage of English Population in New Jersey with 54.68%.
What is the Percentage of English Population in the State of New Jersey?
Percentage of English Population in New Jersey is 4.87%.
What is the Percentage of English Population in the United States?
Percentage of English Population in the United States is 8.59%.