Cities with the Highest Percentage of Households With Two or more Vehicles in New Jersey
RELATED REPORTS & OPTIONS
Households with 2 or more Cars
New Jersey
Compare Cities
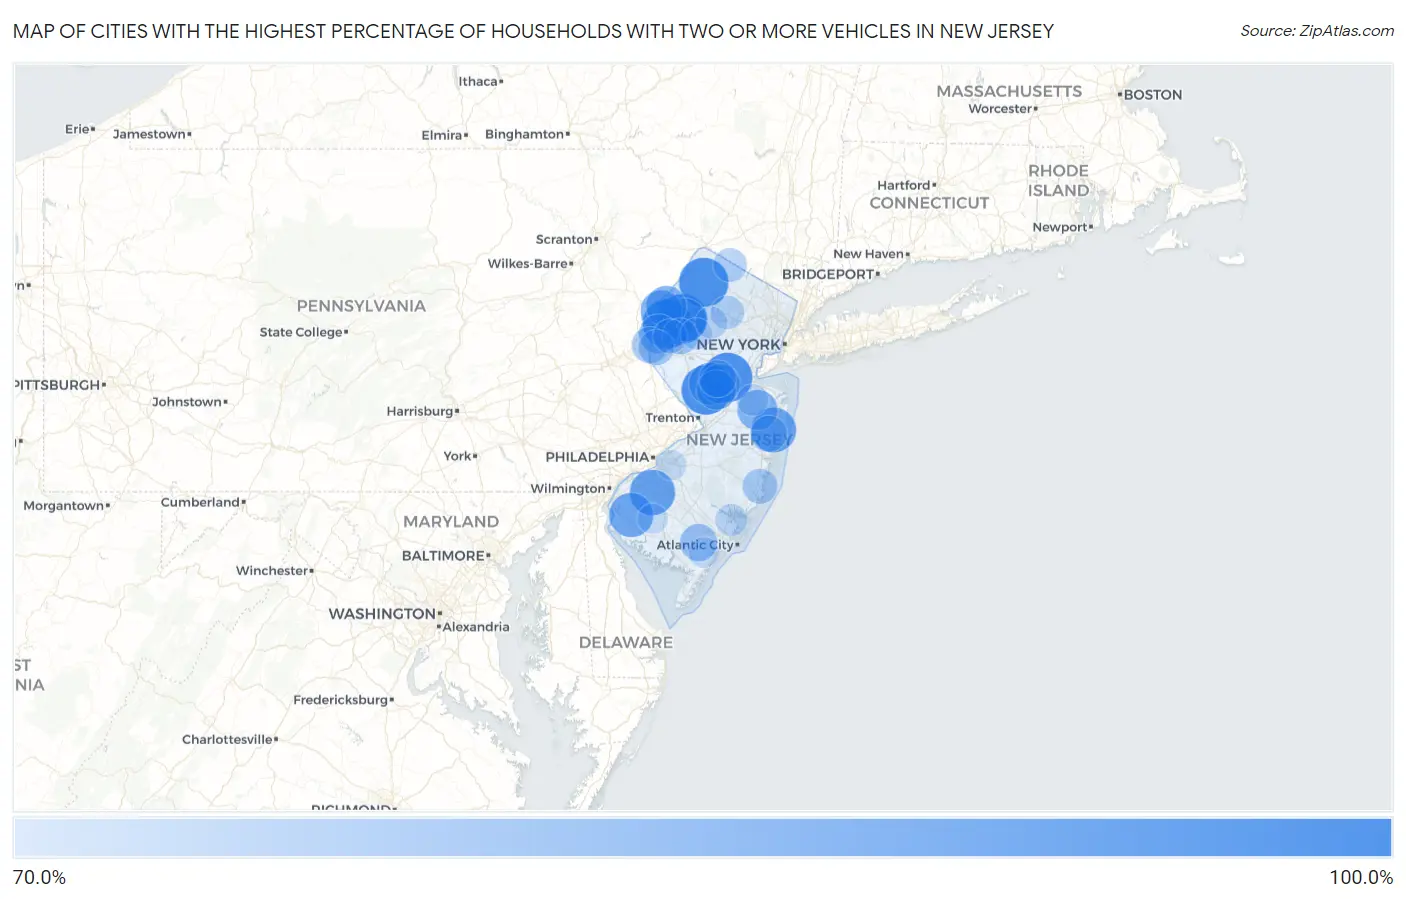
Map of Cities with the Highest Percentage of Households With Two or more Vehicles in New Jersey
0.0%
100.0%
Cities with the Highest Percentage of Households With Two or more Vehicles in New Jersey
| City | Housholds With 2+ Cars | vs State | vs National | |
| 1. | Oceanville | 100.0% | 54.2%(+45.8)#1 | 59.1%(+40.9)#29 |
| 2. | Neshanic | 100.0% | 54.2%(+45.8)#2 | 59.1%(+40.9)#58 |
| 3. | Great Meadows | 100.0% | 54.2%(+45.8)#3 | 59.1%(+40.9)#135 |
| 4. | Mizpah | 100.0% | 54.2%(+45.8)#4 | 59.1%(+40.9)#141 |
| 5. | Bridgeville | 100.0% | 54.2%(+45.8)#5 | 59.1%(+40.9)#171 |
| 6. | Marshallville | 100.0% | 54.2%(+45.8)#6 | 59.1%(+40.9)#201 |
| 7. | Bridgeport | 100.0% | 54.2%(+45.8)#7 | 59.1%(+40.9)#220 |
| 8. | Lamington | 100.0% | 54.2%(+45.8)#8 | 59.1%(+40.9)#235 |
| 9. | Blawenburg | 100.0% | 54.2%(+45.8)#9 | 59.1%(+40.9)#470 |
| 10. | Seeley | 100.0% | 54.2%(+45.8)#10 | 59.1%(+40.9)#620 |
| 11. | Leeds Point | 100.0% | 54.2%(+45.8)#11 | 59.1%(+40.9)#629 |
| 12. | Clyde | 100.0% | 54.2%(+45.8)#12 | 59.1%(+40.9)#638 |
| 13. | Ross Corner | 100.0% | 54.2%(+45.8)#13 | 59.1%(+40.9)#688 |
| 14. | Hibernia | 100.0% | 54.2%(+45.8)#14 | 59.1%(+40.9)#1,091 |
| 15. | Tavistock Borough | 100.0% | 54.2%(+45.8)#15 | 59.1%(+40.9)#1,159 |
| 16. | Crosswicks | 97.7% | 54.2%(+43.5)#16 | 59.1%(+38.6)#1,283 |
| 17. | Richwood | 96.0% | 54.2%(+41.8)#17 | 59.1%(+36.9)#1,351 |
| 18. | Allenwood | 95.5% | 54.2%(+41.3)#18 | 59.1%(+36.4)#1,392 |
| 19. | Alloway | 94.8% | 54.2%(+40.6)#19 | 59.1%(+35.7)#1,447 |
| 20. | Newtonville | 94.7% | 54.2%(+40.5)#20 | 59.1%(+35.6)#1,457 |
| 21. | Vienna | 93.8% | 54.2%(+39.6)#21 | 59.1%(+34.7)#1,532 |
| 22. | Sheppards Mill | 93.6% | 54.2%(+39.4)#22 | 59.1%(+34.5)#1,565 |
| 23. | Harlingen | 92.9% | 54.2%(+38.7)#23 | 59.1%(+33.8)#1,650 |
| 24. | South Dennis | 92.8% | 54.2%(+38.6)#24 | 59.1%(+33.7)#1,667 |
| 25. | Columbia | 92.5% | 54.2%(+38.3)#25 | 59.1%(+33.4)#1,713 |
| 26. | Germania | 92.0% | 54.2%(+37.8)#26 | 59.1%(+32.9)#1,777 |
| 27. | Cream Ridge | 91.5% | 54.2%(+37.3)#27 | 59.1%(+32.4)#1,848 |
| 28. | Hainesburg | 91.3% | 54.2%(+37.1)#28 | 59.1%(+32.2)#1,873 |
| 29. | Oldwick | 91.1% | 54.2%(+36.9)#29 | 59.1%(+32.0)#1,896 |
| 30. | East Freehold | 90.8% | 54.2%(+36.6)#30 | 59.1%(+31.7)#1,948 |
| 31. | Pleasant Plains | 90.5% | 54.2%(+36.3)#31 | 59.1%(+31.4)#1,995 |
| 32. | East Rocky Hill | 90.2% | 54.2%(+36.0)#32 | 59.1%(+31.1)#2,059 |
| 33. | Hutchinson | 90.0% | 54.2%(+35.8)#33 | 59.1%(+30.9)#2,096 |
| 34. | Centre Grove | 89.8% | 54.2%(+35.6)#34 | 59.1%(+30.7)#2,126 |
| 35. | Nesco | 88.8% | 54.2%(+34.6)#35 | 59.1%(+29.7)#2,331 |
| 36. | Forsgate | 88.3% | 54.2%(+34.1)#36 | 59.1%(+29.2)#2,409 |
| 37. | Cookstown | 88.3% | 54.2%(+34.1)#37 | 59.1%(+29.2)#2,422 |
| 38. | Blackwells Mills | 88.0% | 54.2%(+33.8)#38 | 59.1%(+28.9)#2,489 |
| 39. | Bridgewater Center | 87.9% | 54.2%(+33.7)#39 | 59.1%(+28.8)#2,510 |
| 40. | Estell Manor | 87.9% | 54.2%(+33.7)#40 | 59.1%(+28.8)#2,516 |
| 41. | Ramtown | 87.1% | 54.2%(+32.9)#41 | 59.1%(+28.0)#2,705 |
| 42. | Delaware Park | 87.1% | 54.2%(+32.9)#42 | 59.1%(+28.0)#2,722 |
| 43. | North Caldwell Borough | 87.0% | 54.2%(+32.8)#43 | 59.1%(+27.9)#2,732 |
| 44. | Auburn | 86.9% | 54.2%(+32.7)#44 | 59.1%(+27.8)#2,769 |
| 45. | Dennisville | 86.8% | 54.2%(+32.6)#45 | 59.1%(+27.7)#2,795 |
| 46. | Anderson | 86.8% | 54.2%(+32.6)#46 | 59.1%(+27.7)#2,799 |
| 47. | Bedminster | 86.7% | 54.2%(+32.5)#47 | 59.1%(+27.6)#2,826 |
| 48. | Upper Saddle River Borough | 86.5% | 54.2%(+32.3)#48 | 59.1%(+27.4)#2,869 |
| 49. | Greenwich | 86.2% | 54.2%(+32.0)#49 | 59.1%(+27.1)#2,948 |
| 50. | Rockleigh Borough | 85.9% | 54.2%(+31.7)#50 | 59.1%(+26.8)#3,051 |
| 51. | Barnegat | 85.7% | 54.2%(+31.5)#51 | 59.1%(+26.6)#3,089 |
| 52. | Brass Castle | 85.1% | 54.2%(+30.9)#52 | 59.1%(+26.0)#3,264 |
| 53. | Mountain Lakes Borough | 85.0% | 54.2%(+30.8)#53 | 59.1%(+25.9)#3,291 |
| 54. | Connecticut Farms | 85.0% | 54.2%(+30.8)#54 | 59.1%(+25.9)#3,305 |
| 55. | Delmont | 85.0% | 54.2%(+30.8)#55 | 59.1%(+25.9)#3,308 |
| 56. | Windsor | 84.8% | 54.2%(+30.6)#56 | 59.1%(+25.7)#3,361 |
| 57. | Vernon Valley | 84.6% | 54.2%(+30.4)#57 | 59.1%(+25.5)#3,415 |
| 58. | Pleasantdale | 84.5% | 54.2%(+30.3)#58 | 59.1%(+25.4)#3,447 |
| 59. | White Meadow Lake | 84.4% | 54.2%(+30.2)#59 | 59.1%(+25.3)#3,469 |
| 60. | Haworth Borough | 84.4% | 54.2%(+30.2)#60 | 59.1%(+25.3)#3,479 |
| 61. | Essex Fells Borough | 84.4% | 54.2%(+30.2)#61 | 59.1%(+25.3)#3,482 |
| 62. | Beesleys Point | 84.3% | 54.2%(+30.1)#62 | 59.1%(+25.2)#3,520 |
| 63. | Brookside | 84.2% | 54.2%(+30.0)#63 | 59.1%(+25.1)#3,564 |
| 64. | Seaville | 83.9% | 54.2%(+29.7)#64 | 59.1%(+24.8)#3,643 |
| 65. | Three Bridges | 83.9% | 54.2%(+29.7)#65 | 59.1%(+24.8)#3,655 |
| 66. | Pine Brook | 83.8% | 54.2%(+29.6)#66 | 59.1%(+24.7)#3,675 |
| 67. | Packanack Lake | 83.7% | 54.2%(+29.5)#67 | 59.1%(+24.6)#3,712 |
| 68. | Old Tappan Borough | 83.3% | 54.2%(+29.1)#68 | 59.1%(+24.2)#3,844 |
| 69. | Succasunna | 83.1% | 54.2%(+28.9)#69 | 59.1%(+24.0)#3,924 |
| 70. | Port Republic | 83.0% | 54.2%(+28.8)#70 | 59.1%(+23.9)#3,973 |
| 71. | Grenloch | 83.0% | 54.2%(+28.8)#71 | 59.1%(+23.9)#3,977 |
| 72. | Lower Berkshire Valley | 83.0% | 54.2%(+28.8)#72 | 59.1%(+23.9)#3,980 |
| 73. | Washington Crossing | 83.0% | 54.2%(+28.8)#73 | 59.1%(+23.9)#3,981 |
| 74. | Flagtown | 82.9% | 54.2%(+28.7)#74 | 59.1%(+23.8)#4,012 |
| 75. | Rumson Borough | 82.7% | 54.2%(+28.5)#75 | 59.1%(+23.6)#4,065 |
| 76. | Robertsville | 82.5% | 54.2%(+28.3)#76 | 59.1%(+23.4)#4,131 |
| 77. | Long Valley | 82.5% | 54.2%(+28.3)#77 | 59.1%(+23.4)#4,139 |
| 78. | Roadstown | 82.2% | 54.2%(+28.0)#78 | 59.1%(+23.1)#4,265 |
| 79. | Silver Lake | 82.1% | 54.2%(+27.9)#79 | 59.1%(+23.0)#4,294 |
| 80. | Hewitt | 82.0% | 54.2%(+27.8)#80 | 59.1%(+22.9)#4,330 |
| 81. | Little Silver Borough | 81.9% | 54.2%(+27.7)#81 | 59.1%(+22.8)#4,365 |
| 82. | Medford Lakes Borough | 81.9% | 54.2%(+27.7)#82 | 59.1%(+22.8)#4,369 |
| 83. | Sewell | 81.9% | 54.2%(+27.7)#83 | 59.1%(+22.8)#4,371 |
| 84. | Neshanic Station | 81.7% | 54.2%(+27.5)#84 | 59.1%(+22.6)#4,469 |
| 85. | Pine Beach Borough | 81.6% | 54.2%(+27.4)#85 | 59.1%(+22.5)#4,514 |
| 86. | East Vineland | 81.6% | 54.2%(+27.4)#86 | 59.1%(+22.5)#4,518 |
| 87. | Newfoundland | 81.6% | 54.2%(+27.4)#87 | 59.1%(+22.5)#4,521 |
| 88. | Corbin City | 81.5% | 54.2%(+27.3)#88 | 59.1%(+22.4)#4,575 |
| 89. | Troy Hills | 81.4% | 54.2%(+27.2)#89 | 59.1%(+22.3)#4,598 |
| 90. | Olivet | 81.4% | 54.2%(+27.2)#90 | 59.1%(+22.3)#4,611 |
| 91. | Landing | 81.3% | 54.2%(+27.1)#91 | 59.1%(+22.2)#4,641 |
| 92. | Barclay | 81.3% | 54.2%(+27.1)#92 | 59.1%(+22.2)#4,642 |
| 93. | Layton | 81.2% | 54.2%(+27.0)#93 | 59.1%(+22.1)#4,690 |
| 94. | Alpine Borough | 81.0% | 54.2%(+26.8)#94 | 59.1%(+21.9)#4,765 |
| 95. | Harrisonville | 81.0% | 54.2%(+26.8)#95 | 59.1%(+21.9)#4,784 |
| 96. | Titusville | 80.8% | 54.2%(+26.6)#96 | 59.1%(+21.7)#4,854 |
| 97. | Macopin | 80.7% | 54.2%(+26.5)#97 | 59.1%(+21.6)#4,886 |
| 98. | Ringwood Borough | 80.3% | 54.2%(+26.1)#98 | 59.1%(+21.2)#5,055 |
| 99. | Kinnelon Borough | 80.1% | 54.2%(+25.9)#99 | 59.1%(+21.0)#5,159 |
| 100. | Englewood Cliffs Borough | 79.9% | 54.2%(+25.7)#100 | 59.1%(+20.8)#5,297 |
Common Questions
What are the Top 10 Cities with the Highest Percentage of Households With Two or more Vehicles in New Jersey?
Top 10 Cities with the Highest Percentage of Households With Two or more Vehicles in New Jersey are:
#1
100.0%
#2
100.0%
#3
100.0%
#4
100.0%
#5
100.0%
#6
96.0%
#7
95.5%
#8
94.8%
#9
93.8%
#10
92.9%
What city has the Highest Percentage of Households With Two or more Vehicles in New Jersey?
Great Meadows has the Highest Percentage of Households With Two or more Vehicles in New Jersey with 100.0%.
What is the Percentage of Households With Two or more Vehicles in the State of New Jersey?
Percentage of Households With Two or more Vehicles in New Jersey is 54.2%.
What is the Percentage of Households With Two or more Vehicles in the United States?
Percentage of Households With Two or more Vehicles in the United States is 59.1%.