Passaic, NJ Map & Demographics
Passaic Map
Passaic Overview
$23,832
PER CAPITA INCOME
$58,619
AVG FAMILY INCOME
$57,832
AVG HOUSEHOLD INCOME
24.0%
WAGE / INCOME GAP [ % ]
76.0¢/ $1
WAGE / INCOME GAP [ $ ]
$12,825
FAMILY INCOME DEFICIT
0.47
INEQUALITY / GINI INDEX
70,048
TOTAL POPULATION
33,578
MALE POPULATION
36,470
FEMALE POPULATION
92.07
MALES / 100 FEMALES
108.61
FEMALES / 100 MALES
30.5
MEDIAN AGE
3.9
AVG FAMILY SIZE
3.5
AVG HOUSEHOLD SIZE
33,758
LABOR FORCE [ PEOPLE ]
66.7%
PERCENT IN LABOR FORCE
11.8%
UNEMPLOYMENT RATE
Passaic Zip Codes
Income in Passaic
Income Overview in Passaic
Per Capita Income in Passaic is $23,832, while median incomes of families and households are $58,619 and $57,832 respectively.
| Characteristic | Number | Measure |
| Per Capita Income | 70,048 | $23,832 |
| Median Family Income | 15,370 | $58,619 |
| Mean Family Income | 15,370 | $83,215 |
| Median Household Income | 20,182 | $57,832 |
| Mean Household Income | 20,182 | $79,228 |
| Income Deficit | 15,370 | $12,825 |
| Wage / Income Gap (%) | 70,048 | 23.96% |
| Wage / Income Gap ($) | 70,048 | 76.04¢ per $1 |
| Gini / Inequality Index | 70,048 | 0.47 |
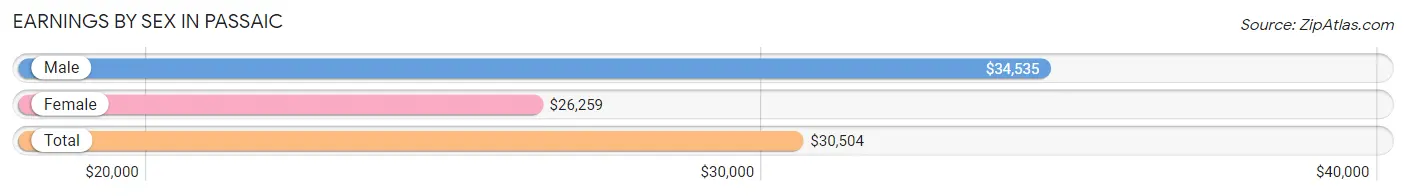
Earnings by Sex in Passaic
Average Earnings in Passaic are $30,504, $34,535 for men and $26,259 for women, a difference of 24.0%.
| Sex | Number | Average Earnings |
| Male | 18,753 (55.2%) | $34,535 |
| Female | 15,239 (44.8%) | $26,259 |
| Total | 33,992 (100.0%) | $30,504 |
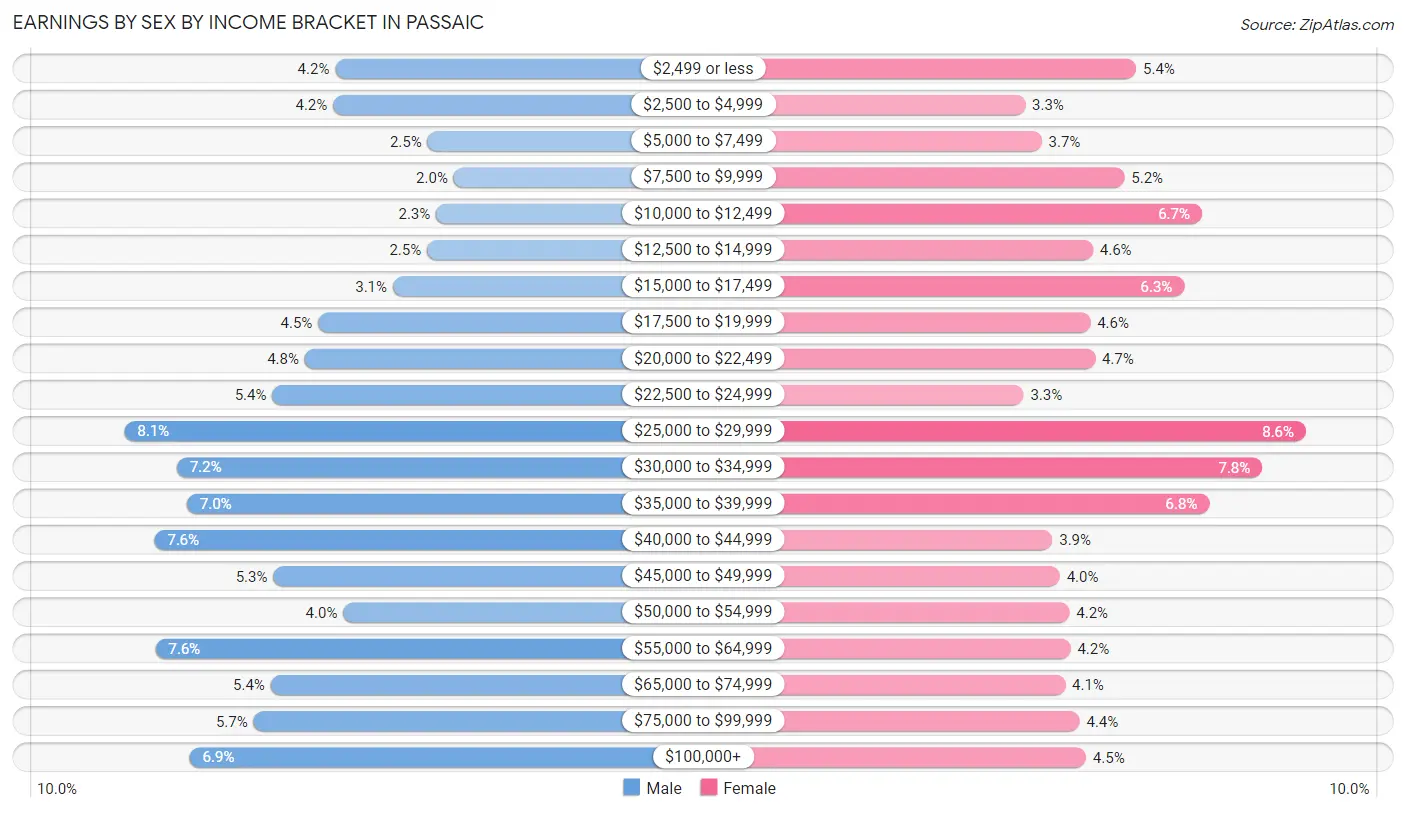
Earnings by Sex by Income Bracket in Passaic
The most common earnings brackets in Passaic are $25,000 to $29,999 for men (1,525 | 8.1%) and $25,000 to $29,999 for women (1,311 | 8.6%).
| Income | Male | Female |
| $2,499 or less | 783 (4.2%) | 826 (5.4%) |
| $2,500 to $4,999 | 791 (4.2%) | 509 (3.3%) |
| $5,000 to $7,499 | 459 (2.5%) | 556 (3.6%) |
| $7,500 to $9,999 | 367 (2.0%) | 792 (5.2%) |
| $10,000 to $12,499 | 430 (2.3%) | 1,013 (6.7%) |
| $12,500 to $14,999 | 462 (2.5%) | 702 (4.6%) |
| $15,000 to $17,499 | 582 (3.1%) | 963 (6.3%) |
| $17,500 to $19,999 | 843 (4.5%) | 695 (4.6%) |
| $20,000 to $22,499 | 890 (4.8%) | 708 (4.6%) |
| $22,500 to $24,999 | 1,006 (5.4%) | 505 (3.3%) |
| $25,000 to $29,999 | 1,525 (8.1%) | 1,311 (8.6%) |
| $30,000 to $34,999 | 1,341 (7.1%) | 1,185 (7.8%) |
| $35,000 to $39,999 | 1,306 (7.0%) | 1,034 (6.8%) |
| $40,000 to $44,999 | 1,419 (7.6%) | 587 (3.8%) |
| $45,000 to $49,999 | 1,002 (5.3%) | 608 (4.0%) |
| $50,000 to $54,999 | 755 (4.0%) | 636 (4.2%) |
| $55,000 to $64,999 | 1,416 (7.5%) | 639 (4.2%) |
| $65,000 to $74,999 | 1,010 (5.4%) | 623 (4.1%) |
| $75,000 to $99,999 | 1,071 (5.7%) | 664 (4.4%) |
| $100,000+ | 1,295 (6.9%) | 683 (4.5%) |
| Total | 18,753 (100.0%) | 15,239 (100.0%) |
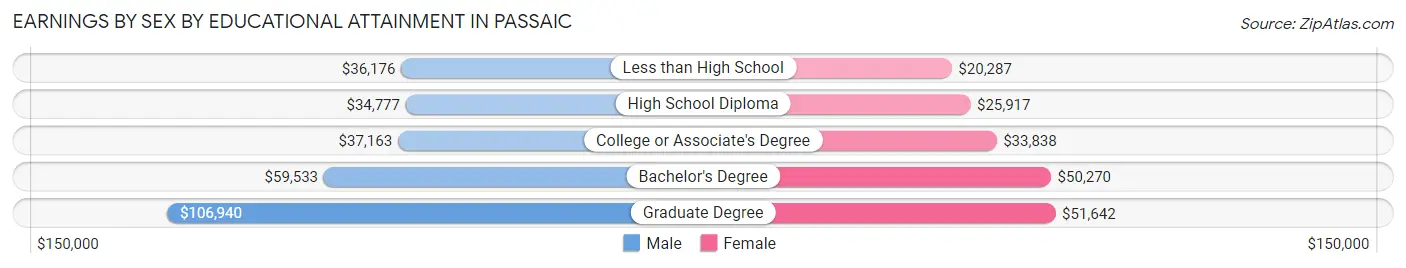
Earnings by Sex by Educational Attainment in Passaic
Average earnings in Passaic are $39,505 for men and $29,300 for women, a difference of 25.8%. Men with an educational attainment of graduate degree enjoy the highest average annual earnings of $106,940, while those with high school diploma education earn the least with $34,777. Women with an educational attainment of graduate degree earn the most with the average annual earnings of $51,642, while those with less than high school education have the smallest earnings of $20,287.
| Educational Attainment | Male Income | Female Income |
| Less than High School | $36,176 | $20,287 |
| High School Diploma | $34,777 | $25,917 |
| College or Associate's Degree | $37,163 | $33,838 |
| Bachelor's Degree | $59,533 | $50,270 |
| Graduate Degree | $106,940 | $51,642 |
| Total | $39,505 | $29,300 |
Family Income in Passaic
Family Income Brackets in Passaic
According to the Passaic family income data, there are 2,813 families falling into the $50,000 to $74,999 income range, which is the most common income bracket and makes up 18.3% of all families. Conversely, the $10,000 to $14,999 income bracket is the least frequent group with only 630 families (4.1%) belonging to this category.
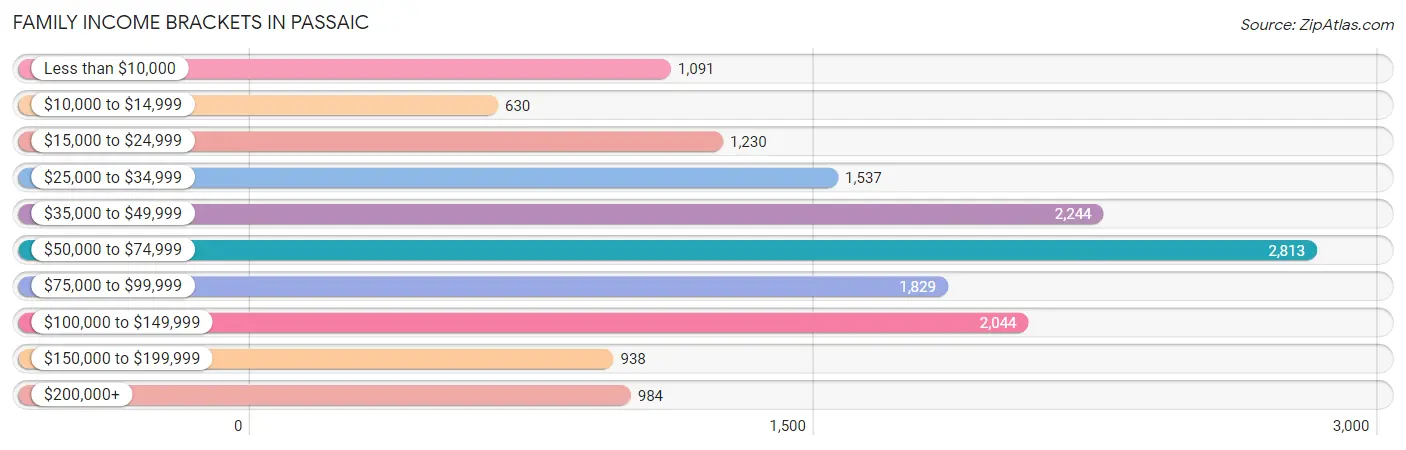
| Income Bracket | # Families | % Families |
| Less than $10,000 | 1,091 | 7.1% |
| $10,000 to $14,999 | 630 | 4.1% |
| $15,000 to $24,999 | 1,230 | 8.0% |
| $25,000 to $34,999 | 1,537 | 10.0% |
| $35,000 to $49,999 | 2,244 | 14.6% |
| $50,000 to $74,999 | 2,813 | 18.3% |
| $75,000 to $99,999 | 1,829 | 11.9% |
| $100,000 to $149,999 | 2,044 | 13.3% |
| $150,000 to $199,999 | 938 | 6.1% |
| $200,000+ | 984 | 6.4% |
Family Income by Famaliy Size in Passaic
7+ person families (1,158 | 7.5%) account for the highest median family income in Passaic with $139,722 per family, while 2-person families (4,048 | 26.3%) have the highest median income of $22,038 per family member.
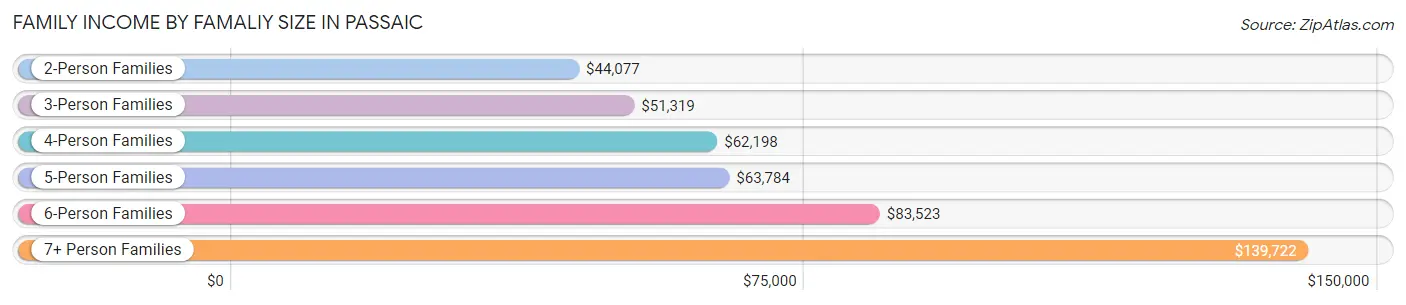
| Income Bracket | # Families | Median Income |
| 2-Person Families | 4,048 (26.3%) | $44,077 |
| 3-Person Families | 3,889 (25.3%) | $51,319 |
| 4-Person Families | 3,389 (22.1%) | $62,198 |
| 5-Person Families | 2,049 (13.3%) | $63,784 |
| 6-Person Families | 837 (5.4%) | $83,523 |
| 7+ Person Families | 1,158 (7.5%) | $139,722 |
| Total | 15,370 (100.0%) | $58,619 |
Family Income by Number of Earners in Passaic
The median family income in Passaic is $58,619, with families comprising 3+ earners (3,103) having the highest median family income of $125,657, while families with no earners (1,879) have the lowest median family income of $15,883, accounting for 20.2% and 12.2% of families, respectively.
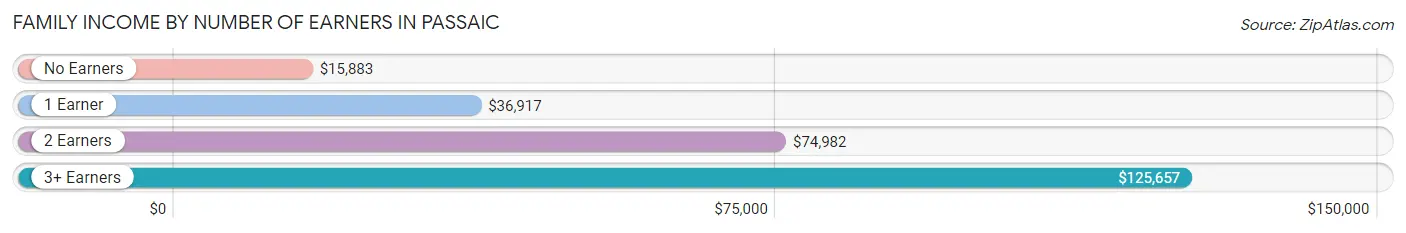
| Number of Earners | # Families | Median Income |
| No Earners | 1,879 (12.2%) | $15,883 |
| 1 Earner | 5,090 (33.1%) | $36,917 |
| 2 Earners | 5,298 (34.5%) | $74,982 |
| 3+ Earners | 3,103 (20.2%) | $125,657 |
| Total | 15,370 (100.0%) | $58,619 |
Household Income in Passaic
Household Income Brackets in Passaic
With 3,774 households falling in the category, the $50,000 to $74,999 income range is the most frequent in Passaic, accounting for 18.7% of all households. In contrast, only 888 households (4.4%) fall into the less than $10,000 income bracket, making it the least populous group.
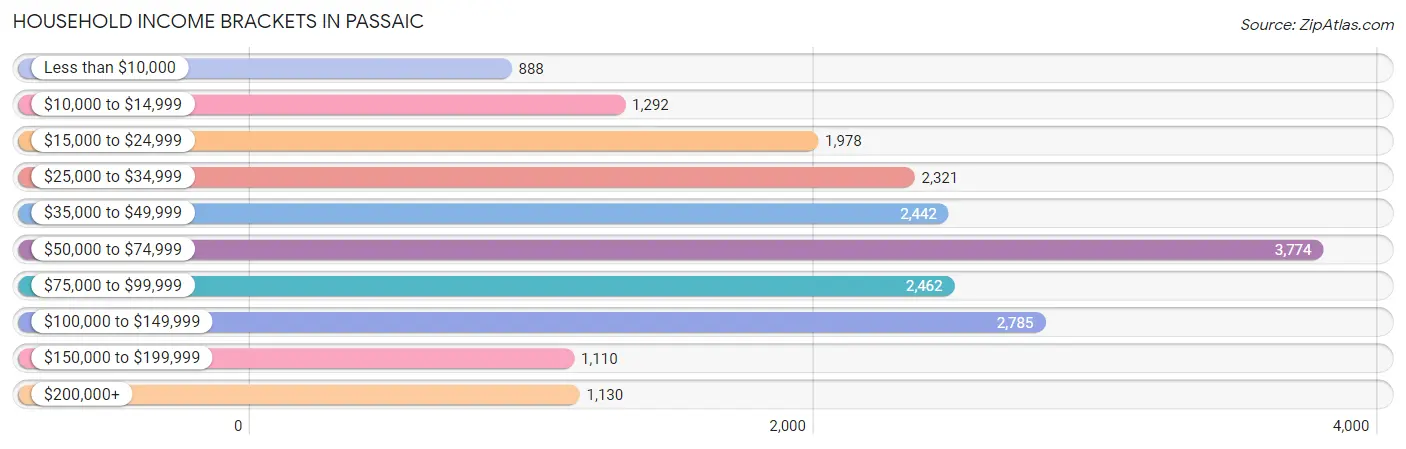
| Income Bracket | # Households | % Households |
| Less than $10,000 | 888 | 4.4% |
| $10,000 to $14,999 | 1,292 | 6.4% |
| $15,000 to $24,999 | 1,978 | 9.8% |
| $25,000 to $34,999 | 2,321 | 11.5% |
| $35,000 to $49,999 | 2,442 | 12.1% |
| $50,000 to $74,999 | 3,774 | 18.7% |
| $75,000 to $99,999 | 2,462 | 12.2% |
| $100,000 to $149,999 | 2,785 | 13.8% |
| $150,000 to $199,999 | 1,110 | 5.5% |
| $200,000+ | 1,130 | 5.6% |
Household Income by Householder Age in Passaic
The median household income in Passaic is $57,832, with the highest median household income of $63,081 found in the 45 to 64 years age bracket for the primary householder. A total of 8,104 households (40.2%) fall into this category. Meanwhile, the 65+ years age bracket for the primary householder has the lowest median household income of $35,746, with 3,932 households (19.5%) in this group.
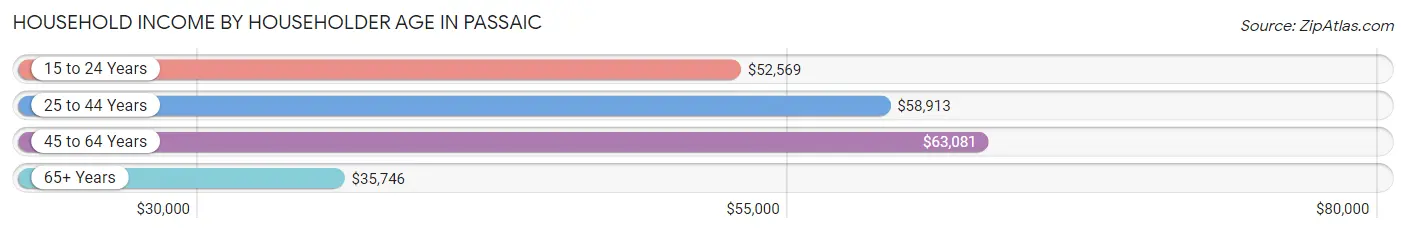
| Income Bracket | # Households | Median Income |
| 15 to 24 Years | 407 (2.0%) | $52,569 |
| 25 to 44 Years | 7,739 (38.4%) | $58,913 |
| 45 to 64 Years | 8,104 (40.2%) | $63,081 |
| 65+ Years | 3,932 (19.5%) | $35,746 |
| Total | 20,182 (100.0%) | $57,832 |
Poverty in Passaic
Income Below Poverty by Sex and Age in Passaic
With 19.7% poverty level for males and 23.9% for females among the residents of Passaic, 6 to 11 year old males and under 5 year old females are the most vulnerable to poverty, with 1,155 males (36.3%) and 1,158 females (38.7%) in their respective age groups living below the poverty level.
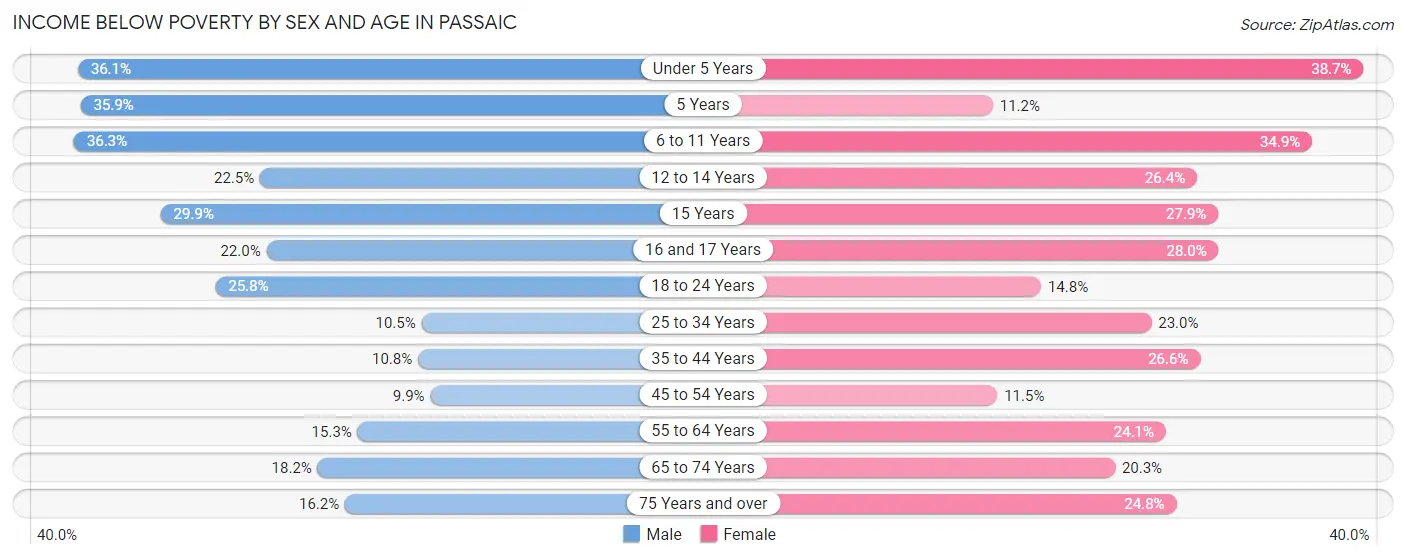
| Age Bracket | Male | Female |
| Under 5 Years | 981 (36.0%) | 1,158 (38.7%) |
| 5 Years | 214 (35.8%) | 64 (11.2%) |
| 6 to 11 Years | 1,155 (36.3%) | 1,234 (34.9%) |
| 12 to 14 Years | 386 (22.5%) | 679 (26.4%) |
| 15 Years | 195 (29.9%) | 202 (27.9%) |
| 16 and 17 Years | 276 (22.0%) | 337 (28.0%) |
| 18 to 24 Years | 1,083 (25.8%) | 613 (14.8%) |
| 25 to 34 Years | 470 (10.5%) | 958 (23.0%) |
| 35 to 44 Years | 551 (10.8%) | 1,295 (26.6%) |
| 45 to 54 Years | 418 (9.9%) | 522 (11.5%) |
| 55 to 64 Years | 438 (15.3%) | 790 (24.1%) |
| 65 to 74 Years | 307 (18.2%) | 419 (20.3%) |
| 75 Years and over | 135 (16.2%) | 385 (24.8%) |
| Total | 6,609 (19.7%) | 8,656 (23.9%) |
Income Above Poverty by Sex and Age in Passaic
According to the poverty statistics in Passaic, males aged 45 to 54 years and females aged 5 years are the age groups that are most secure financially, with 90.1% of males and 88.8% of females in these age groups living above the poverty line.
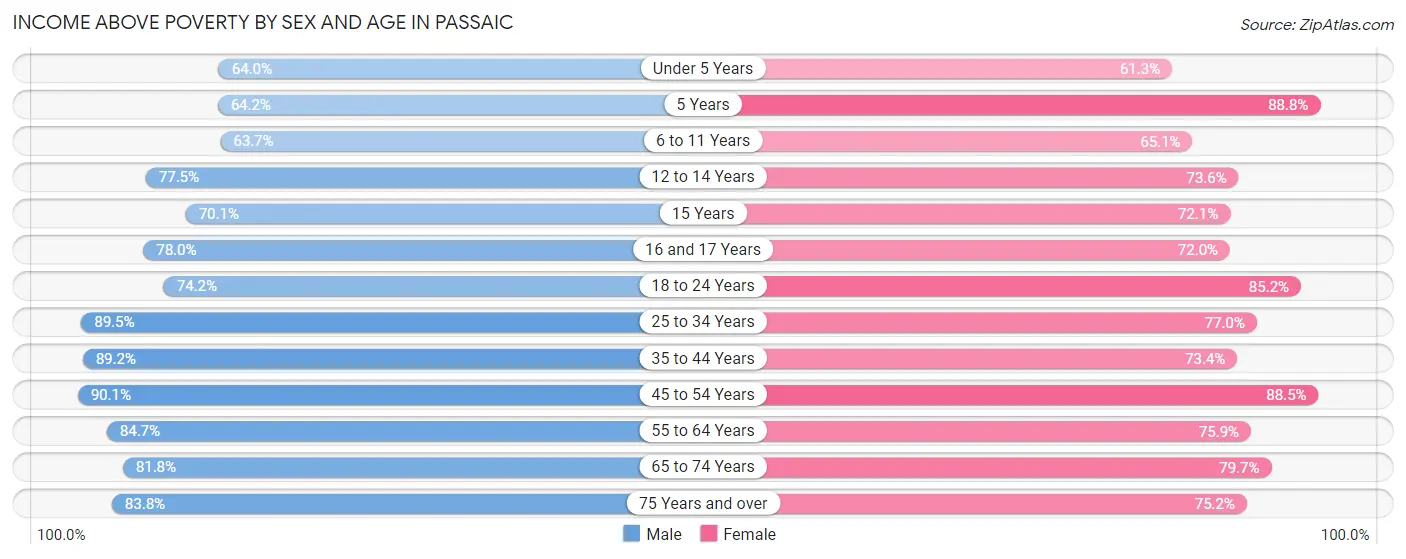
| Age Bracket | Male | Female |
| Under 5 Years | 1,740 (63.9%) | 1,833 (61.3%) |
| 5 Years | 383 (64.1%) | 507 (88.8%) |
| 6 to 11 Years | 2,023 (63.7%) | 2,300 (65.1%) |
| 12 to 14 Years | 1,328 (77.5%) | 1,896 (73.6%) |
| 15 Years | 457 (70.1%) | 521 (72.1%) |
| 16 and 17 Years | 976 (78.0%) | 868 (72.0%) |
| 18 to 24 Years | 3,108 (74.2%) | 3,533 (85.2%) |
| 25 to 34 Years | 3,995 (89.5%) | 3,210 (77.0%) |
| 35 to 44 Years | 4,556 (89.2%) | 3,572 (73.4%) |
| 45 to 54 Years | 3,815 (90.1%) | 4,003 (88.5%) |
| 55 to 64 Years | 2,431 (84.7%) | 2,494 (75.9%) |
| 65 to 74 Years | 1,376 (81.8%) | 1,647 (79.7%) |
| 75 Years and over | 698 (83.8%) | 1,165 (75.2%) |
| Total | 26,886 (80.3%) | 27,549 (76.1%) |
Income Below Poverty Among Married-Couple Families in Passaic
The poverty statistics for married-couple families in Passaic show that 8.9% or 669 of the total 7,483 families live below the poverty line. Families with 3 or 4 children have the highest poverty rate of 15.2%, comprising of 121 families. On the other hand, families with no children have the lowest poverty rate of 7.6%, which includes 236 families.
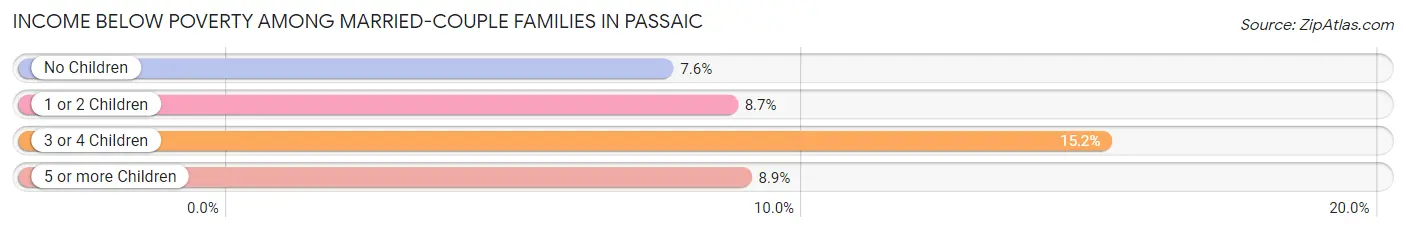
| Children | Above Poverty | Below Poverty |
| No Children | 2,879 (92.4%) | 236 (7.6%) |
| 1 or 2 Children | 2,823 (91.3%) | 269 (8.7%) |
| 3 or 4 Children | 674 (84.8%) | 121 (15.2%) |
| 5 or more Children | 438 (91.1%) | 43 (8.9%) |
| Total | 6,814 (91.1%) | 669 (8.9%) |
Income Below Poverty Among Single-Parent Households in Passaic
According to the poverty data in Passaic, 23.4% or 325 single-father households and 32.9% or 2,134 single-mother households are living below the poverty line. Among single-father households, those with 3 or 4 children have the highest poverty rate, with 40 households (35.4%) experiencing poverty. Likewise, among single-mother households, those with 5 or more children have the highest poverty rate, with 115 households (94.3%) falling below the poverty line.

| Children | Single Father | Single Mother |
| No Children | 131 (18.2%) | 255 (12.5%) |
| 1 or 2 Children | 150 (27.7%) | 1,116 (34.0%) |
| 3 or 4 Children | 40 (35.4%) | 648 (61.5%) |
| 5 or more Children | 4 (28.6%) | 115 (94.3%) |
| Total | 325 (23.4%) | 2,134 (32.9%) |
Income Below Poverty Among Married-Couple vs Single-Parent Households in Passaic
The poverty data for Passaic shows that 669 of the married-couple family households (8.9%) and 2,459 of the single-parent households (31.2%) are living below the poverty level. Within the married-couple family households, those with 3 or 4 children have the highest poverty rate, with 121 households (15.2%) falling below the poverty line. Among the single-parent households, those with 5 or more children have the highest poverty rate, with 119 household (87.5%) living below poverty.
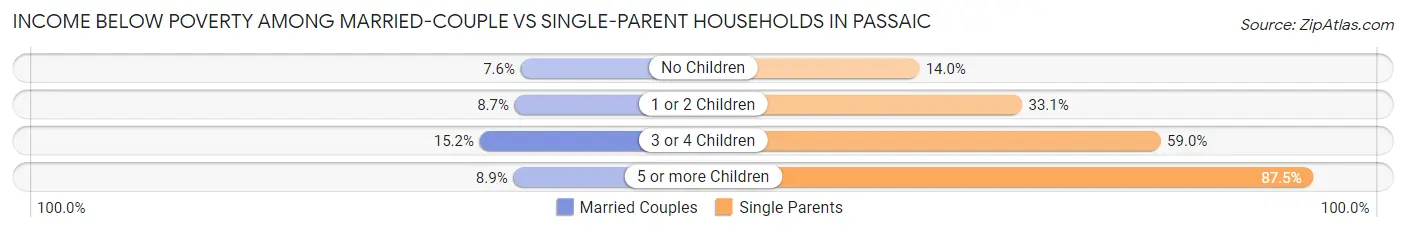
| Children | Married-Couple Families | Single-Parent Households |
| No Children | 236 (7.6%) | 386 (14.0%) |
| 1 or 2 Children | 269 (8.7%) | 1,266 (33.1%) |
| 3 or 4 Children | 121 (15.2%) | 688 (59.0%) |
| 5 or more Children | 43 (8.9%) | 119 (87.5%) |
| Total | 669 (8.9%) | 2,459 (31.2%) |
Race in Passaic
The most populous races in Passaic are Hispanic or Latino (51,885 | 74.1%), Two or more Races (26,155 | 37.3%), and White / Caucasian (25,069 | 35.8%).
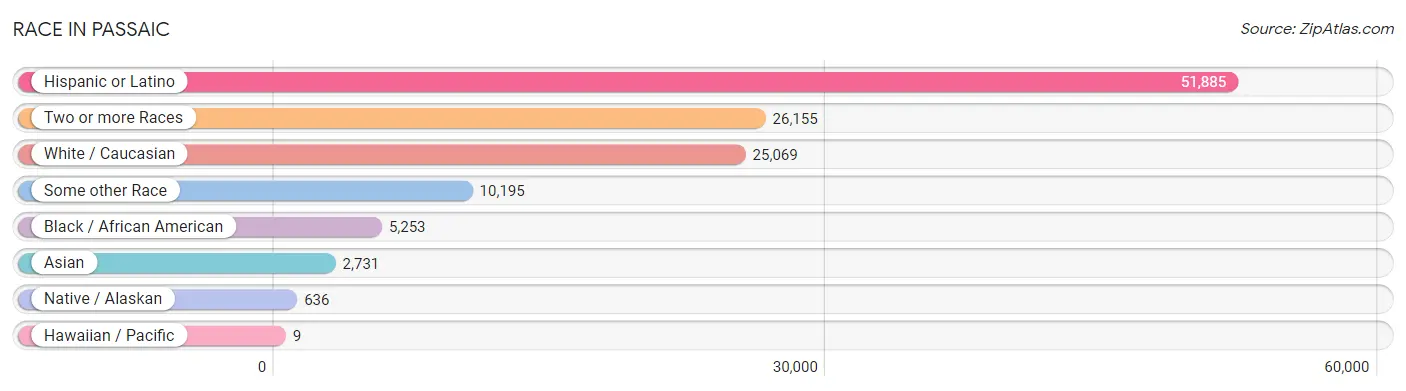
| Race | # Population | % Population |
| Asian | 2,731 | 3.9% |
| Black / African American | 5,253 | 7.5% |
| Hawaiian / Pacific | 9 | 0.0% |
| Hispanic or Latino | 51,885 | 74.1% |
| Native / Alaskan | 636 | 0.9% |
| White / Caucasian | 25,069 | 35.8% |
| Two or more Races | 26,155 | 37.3% |
| Some other Race | 10,195 | 14.5% |
| Total | 70,048 | 100.0% |
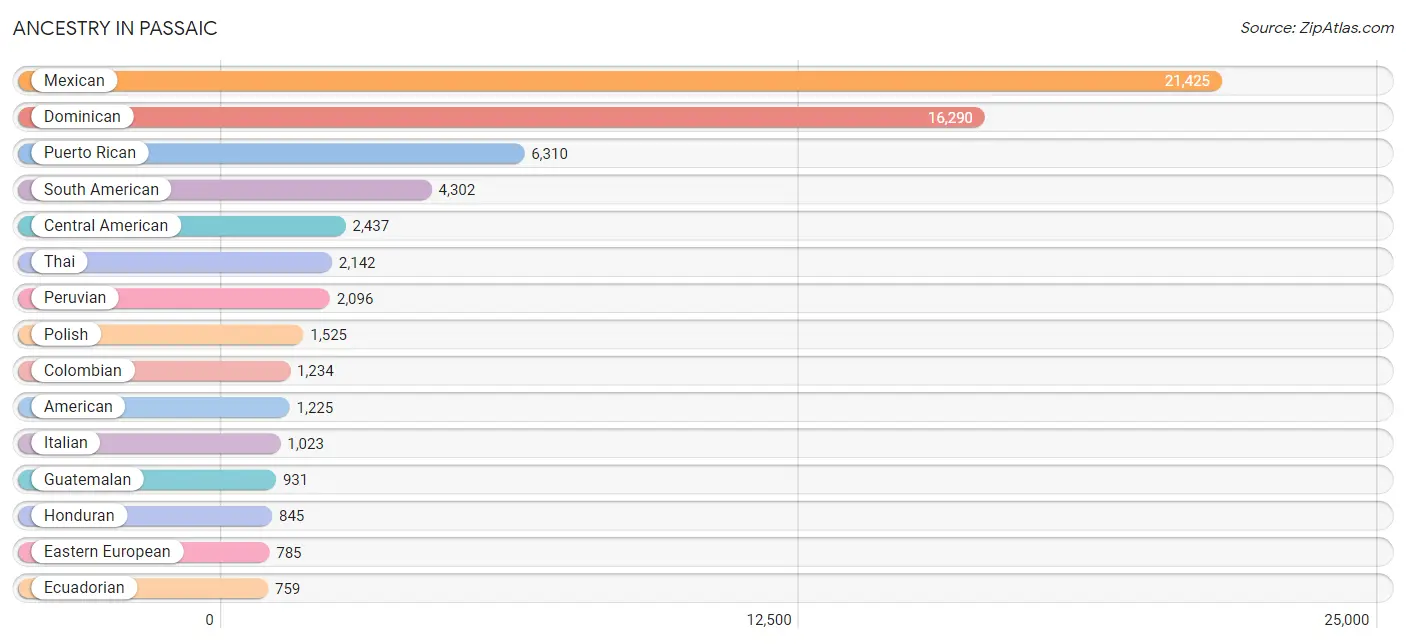
Ancestry in Passaic
The most populous ancestries reported in Passaic are Mexican (21,425 | 30.6%), Dominican (16,290 | 23.3%), Puerto Rican (6,310 | 9.0%), South American (4,302 | 6.1%), and Central American (2,437 | 3.5%), together accounting for 72.5% of all Passaic residents.
| Ancestry | # Population | % Population |
| African | 210 | 0.3% |
| Albanian | 26 | 0.0% |
| American | 1,225 | 1.8% |
| Arab | 151 | 0.2% |
| Argentinean | 42 | 0.1% |
| Austrian | 181 | 0.3% |
| Bangladeshi | 7 | 0.0% |
| Belgian | 31 | 0.0% |
| Bhutanese | 39 | 0.1% |
| Blackfeet | 12 | 0.0% |
| British | 8 | 0.0% |
| Burmese | 9 | 0.0% |
| Canadian | 124 | 0.2% |
| Central American | 2,437 | 3.5% |
| Central American Indian | 40 | 0.1% |
| Cherokee | 19 | 0.0% |
| Chilean | 140 | 0.2% |
| Colombian | 1,234 | 1.8% |
| Costa Rican | 74 | 0.1% |
| Cuban | 377 | 0.5% |
| Czech | 31 | 0.0% |
| Czechoslovakian | 5 | 0.0% |
| Dominican | 16,290 | 23.3% |
| Dutch | 38 | 0.1% |
| Eastern European | 785 | 1.1% |
| Ecuadorian | 759 | 1.1% |
| Egyptian | 48 | 0.1% |
| English | 145 | 0.2% |
| European | 483 | 0.7% |
| French | 40 | 0.1% |
| French Canadian | 48 | 0.1% |
| German | 431 | 0.6% |
| Greek | 16 | 0.0% |
| Guatemalan | 931 | 1.3% |
| Guyanese | 46 | 0.1% |
| Haitian | 74 | 0.1% |
| Honduran | 845 | 1.2% |
| Hungarian | 180 | 0.3% |
| Indian (Asian) | 121 | 0.2% |
| Inupiat | 6 | 0.0% |
| Iranian | 24 | 0.0% |
| Irish | 340 | 0.5% |
| Israeli | 486 | 0.7% |
| Italian | 1,023 | 1.5% |
| Jamaican | 103 | 0.2% |
| Korean | 633 | 0.9% |
| Lithuanian | 35 | 0.1% |
| Macedonian | 46 | 0.1% |
| Mexican | 21,425 | 30.6% |
| Mexican American Indian | 388 | 0.5% |
| Moroccan | 15 | 0.0% |
| Native Hawaiian | 25 | 0.0% |
| Nigerian | 86 | 0.1% |
| Palestinian | 25 | 0.0% |
| Panamanian | 39 | 0.1% |
| Peruvian | 2,096 | 3.0% |
| Polish | 1,525 | 2.2% |
| Portuguese | 4 | 0.0% |
| Puerto Rican | 6,310 | 9.0% |
| Romanian | 30 | 0.0% |
| Russian | 536 | 0.8% |
| Salvadoran | 548 | 0.8% |
| Samoan | 6 | 0.0% |
| Scotch-Irish | 14 | 0.0% |
| Scottish | 5 | 0.0% |
| Slovak | 8 | 0.0% |
| South American | 4,302 | 6.1% |
| Spaniard | 33 | 0.1% |
| Spanish | 15 | 0.0% |
| Sri Lankan | 18 | 0.0% |
| Subsaharan African | 296 | 0.4% |
| Swedish | 10 | 0.0% |
| Swiss | 20 | 0.0% |
| Syrian | 47 | 0.1% |
| Thai | 2,142 | 3.1% |
| Trinidadian and Tobagonian | 47 | 0.1% |
| Turkish | 34 | 0.1% |
| Ukrainian | 174 | 0.3% |
| Venezuelan | 16 | 0.0% |
| Welsh | 10 | 0.0% |
| West Indian | 52 | 0.1% |
| Yugoslavian | 6 | 0.0% | View All 82 Rows |
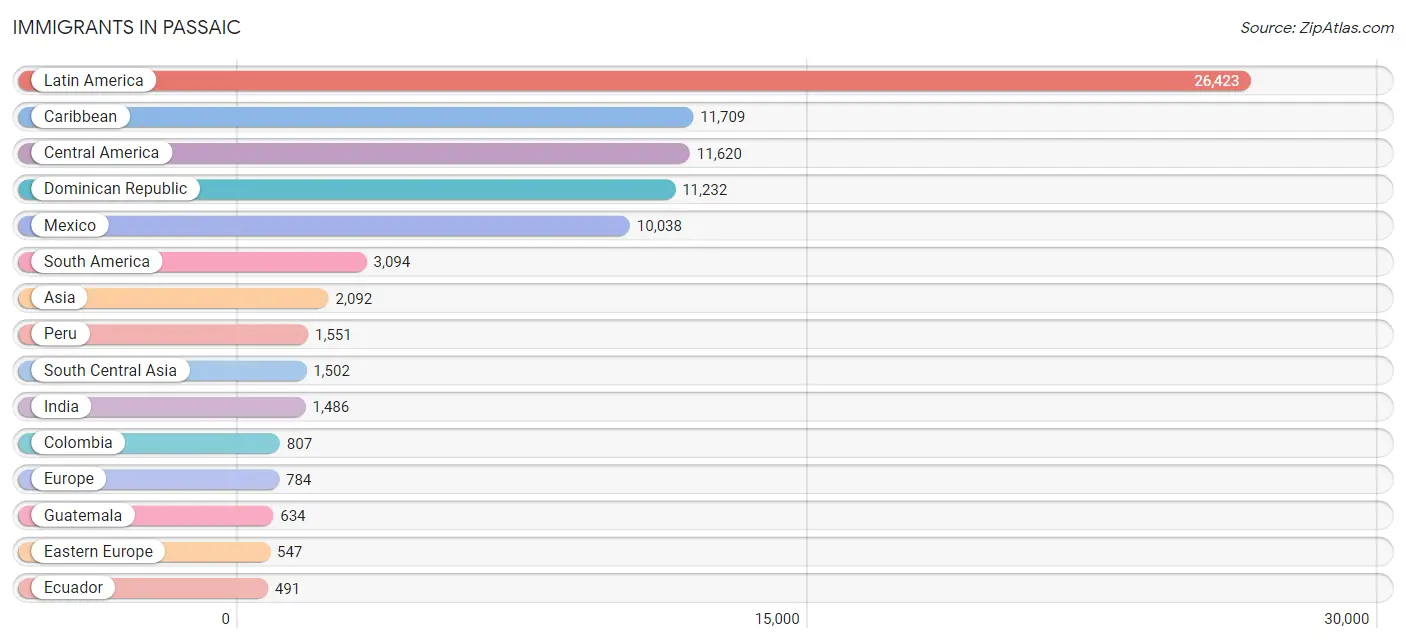
Immigrants in Passaic
The most numerous immigrant groups reported in Passaic came from Latin America (26,423 | 37.7%), Caribbean (11,709 | 16.7%), Central America (11,620 | 16.6%), Dominican Republic (11,232 | 16.0%), and Mexico (10,038 | 14.3%), together accounting for 101.4% of all Passaic residents.
| Immigration Origin | # Population | % Population |
| Africa | 172 | 0.3% |
| Albania | 13 | 0.0% |
| Argentina | 36 | 0.1% |
| Asia | 2,092 | 3.0% |
| Belgium | 6 | 0.0% |
| Bolivia | 3 | 0.0% |
| Canada | 119 | 0.2% |
| Caribbean | 11,709 | 16.7% |
| Central America | 11,620 | 16.6% |
| Chile | 132 | 0.2% |
| China | 51 | 0.1% |
| Colombia | 807 | 1.1% |
| Costa Rica | 43 | 0.1% |
| Cuba | 255 | 0.4% |
| Czechoslovakia | 17 | 0.0% |
| Dominica | 12 | 0.0% |
| Dominican Republic | 11,232 | 16.0% |
| Eastern Asia | 51 | 0.1% |
| Eastern Europe | 547 | 0.8% |
| Ecuador | 491 | 0.7% |
| Egypt | 48 | 0.1% |
| El Salvador | 422 | 0.6% |
| England | 39 | 0.1% |
| Europe | 784 | 1.1% |
| Germany | 56 | 0.1% |
| Ghana | 10 | 0.0% |
| Greece | 4 | 0.0% |
| Guatemala | 634 | 0.9% |
| Guyana | 74 | 0.1% |
| Haiti | 35 | 0.1% |
| Honduras | 473 | 0.7% |
| Hungary | 15 | 0.0% |
| India | 1,486 | 2.1% |
| Iran | 16 | 0.0% |
| Ireland | 11 | 0.0% |
| Israel | 157 | 0.2% |
| Italy | 91 | 0.1% |
| Jamaica | 75 | 0.1% |
| Kuwait | 10 | 0.0% |
| Latin America | 26,423 | 37.7% |
| Latvia | 13 | 0.0% |
| Lithuania | 6 | 0.0% |
| Mexico | 10,038 | 14.3% |
| Morocco | 10 | 0.0% |
| Nigeria | 31 | 0.0% |
| North Macedonia | 71 | 0.1% |
| Northern Africa | 58 | 0.1% |
| Northern Europe | 61 | 0.1% |
| Panama | 10 | 0.0% |
| Peru | 1,551 | 2.2% |
| Philippines | 340 | 0.5% |
| Poland | 243 | 0.4% |
| Romania | 6 | 0.0% |
| Russia | 56 | 0.1% |
| South Africa | 53 | 0.1% |
| South America | 3,094 | 4.4% |
| South Central Asia | 1,502 | 2.1% |
| South Eastern Asia | 340 | 0.5% |
| Southern Europe | 114 | 0.2% |
| Spain | 19 | 0.0% |
| Syria | 10 | 0.0% |
| Trinidad and Tobago | 100 | 0.1% |
| Turkey | 22 | 0.0% |
| Ukraine | 72 | 0.1% |
| Western Africa | 41 | 0.1% |
| Western Asia | 199 | 0.3% |
| Western Europe | 62 | 0.1% | View All 67 Rows |
Sex and Age in Passaic
Sex and Age in Passaic
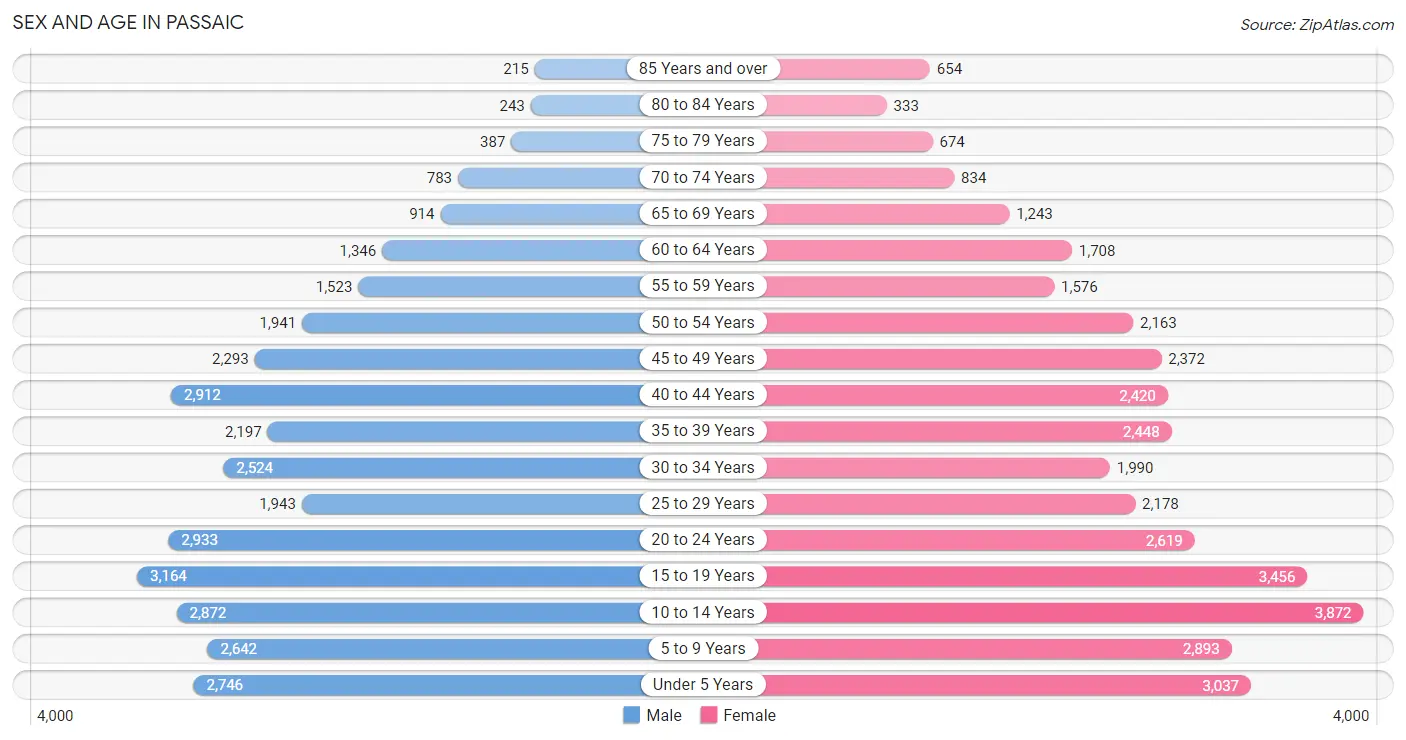
The most populous age groups in Passaic are 15 to 19 Years (3,164 | 9.4%) for men and 10 to 14 Years (3,872 | 10.6%) for women.
| Age Bracket | Male | Female |
| Under 5 Years | 2,746 (8.2%) | 3,037 (8.3%) |
| 5 to 9 Years | 2,642 (7.9%) | 2,893 (7.9%) |
| 10 to 14 Years | 2,872 (8.6%) | 3,872 (10.6%) |
| 15 to 19 Years | 3,164 (9.4%) | 3,456 (9.5%) |
| 20 to 24 Years | 2,933 (8.7%) | 2,619 (7.2%) |
| 25 to 29 Years | 1,943 (5.8%) | 2,178 (6.0%) |
| 30 to 34 Years | 2,524 (7.5%) | 1,990 (5.5%) |
| 35 to 39 Years | 2,197 (6.5%) | 2,448 (6.7%) |
| 40 to 44 Years | 2,912 (8.7%) | 2,420 (6.6%) |
| 45 to 49 Years | 2,293 (6.8%) | 2,372 (6.5%) |
| 50 to 54 Years | 1,941 (5.8%) | 2,163 (5.9%) |
| 55 to 59 Years | 1,523 (4.5%) | 1,576 (4.3%) |
| 60 to 64 Years | 1,346 (4.0%) | 1,708 (4.7%) |
| 65 to 69 Years | 914 (2.7%) | 1,243 (3.4%) |
| 70 to 74 Years | 783 (2.3%) | 834 (2.3%) |
| 75 to 79 Years | 387 (1.1%) | 674 (1.8%) |
| 80 to 84 Years | 243 (0.7%) | 333 (0.9%) |
| 85 Years and over | 215 (0.6%) | 654 (1.8%) |
| Total | 33,578 (100.0%) | 36,470 (100.0%) |
Families and Households in Passaic
Median Family Size in Passaic
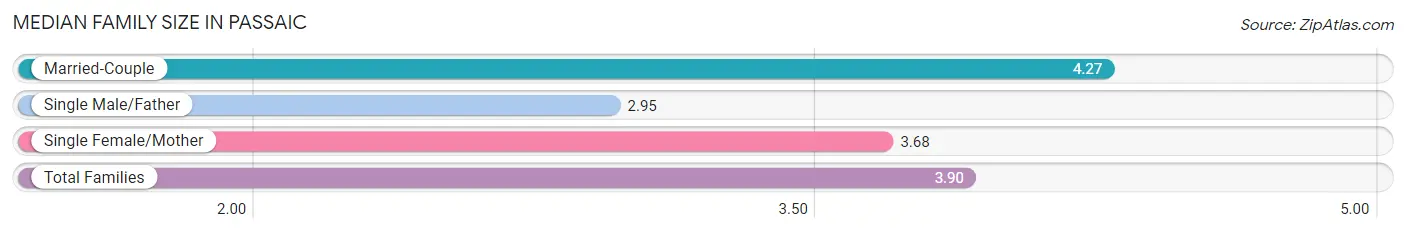
The median family size in Passaic is 3.90 persons per family, with married-couple families (7,483 | 48.7%) accounting for the largest median family size of 4.27 persons per family. On the other hand, single male/father families (1,390 | 9.0%) represent the smallest median family size with 2.95 persons per family.
| Family Type | # Families | Family Size |
| Married-Couple | 7,483 (48.7%) | 4.27 |
| Single Male/Father | 1,390 (9.0%) | 2.95 |
| Single Female/Mother | 6,497 (42.3%) | 3.68 |
| Total Families | 15,370 (100.0%) | 3.90 |
Median Household Size in Passaic
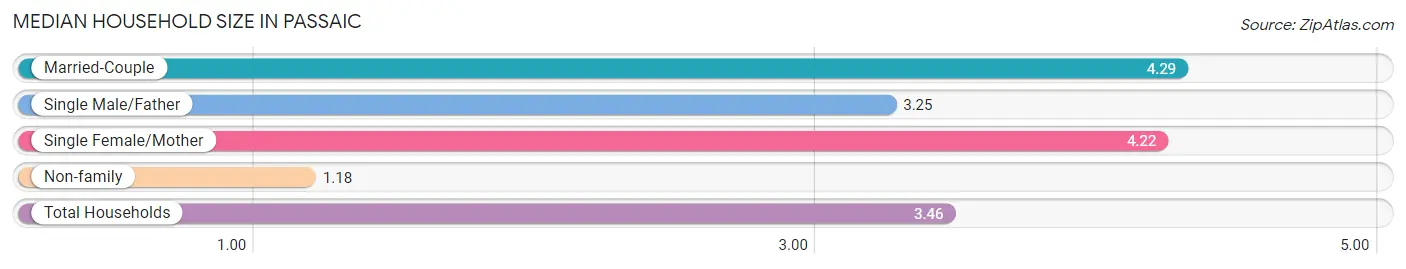
The median household size in Passaic is 3.46 persons per household, with married-couple households (7,483 | 37.1%) accounting for the largest median household size of 4.29 persons per household. non-family households (4,812 | 23.8%) represent the smallest median household size with 1.18 persons per household.
| Household Type | # Households | Household Size |
| Married-Couple | 7,483 (37.1%) | 4.29 |
| Single Male/Father | 1,390 (6.9%) | 3.25 |
| Single Female/Mother | 6,497 (32.2%) | 4.22 |
| Non-family | 4,812 (23.8%) | 1.18 |
| Total Households | 20,182 (100.0%) | 3.46 |
Household Size by Marriage Status in Passaic
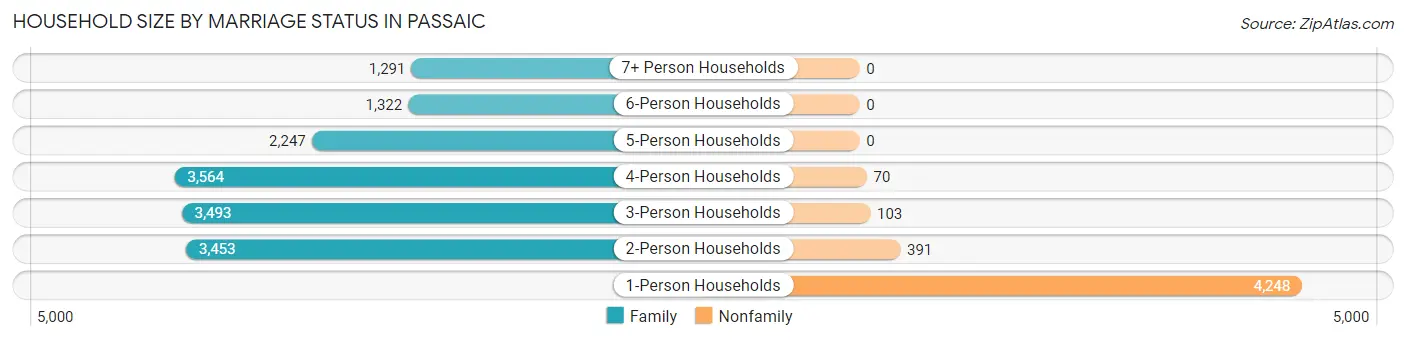
Out of a total of 20,182 households in Passaic, 15,370 (76.2%) are family households, while 4,812 (23.8%) are nonfamily households. The most numerous type of family households are 4-person households, comprising 3,564, and the most common type of nonfamily households are 1-person households, comprising 4,248.
| Household Size | Family Households | Nonfamily Households |
| 1-Person Households | - | 4,248 (21.0%) |
| 2-Person Households | 3,453 (17.1%) | 391 (1.9%) |
| 3-Person Households | 3,493 (17.3%) | 103 (0.5%) |
| 4-Person Households | 3,564 (17.7%) | 70 (0.4%) |
| 5-Person Households | 2,247 (11.1%) | 0 (0.0%) |
| 6-Person Households | 1,322 (6.6%) | 0 (0.0%) |
| 7+ Person Households | 1,291 (6.4%) | 0 (0.0%) |
| Total | 15,370 (76.2%) | 4,812 (23.8%) |
Female Fertility in Passaic
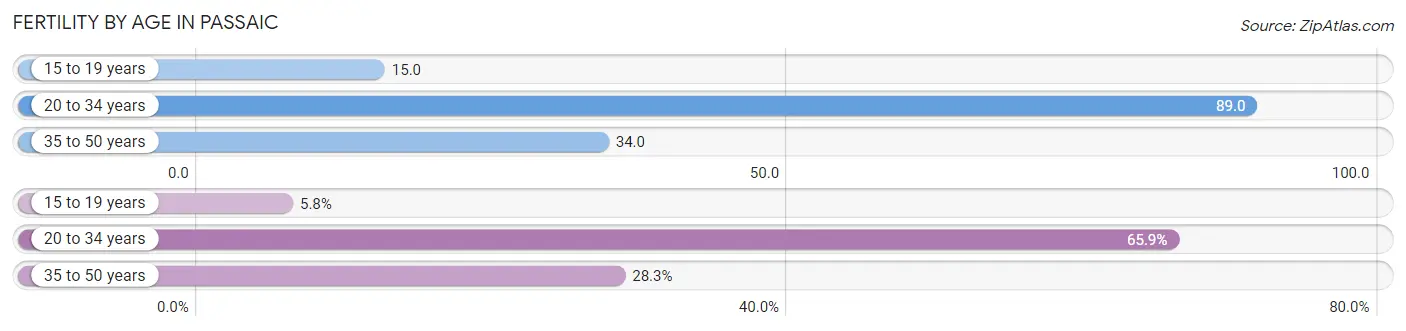
Fertility by Age in Passaic
Average fertility rate in Passaic is 51.0 births per 1,000 women. Women in the age bracket of 20 to 34 years have the highest fertility rate with 89.0 births per 1,000 women. Women in the age bracket of 20 to 34 years acount for 65.9% of all women with births.
| Age Bracket | Women with Births | Births / 1,000 Women |
| 15 to 19 years | 53 (5.8%) | 15.0 |
| 20 to 34 years | 605 (65.9%) | 89.0 |
| 35 to 50 years | 260 (28.3%) | 34.0 |
| Total | 918 (100.0%) | 51.0 |
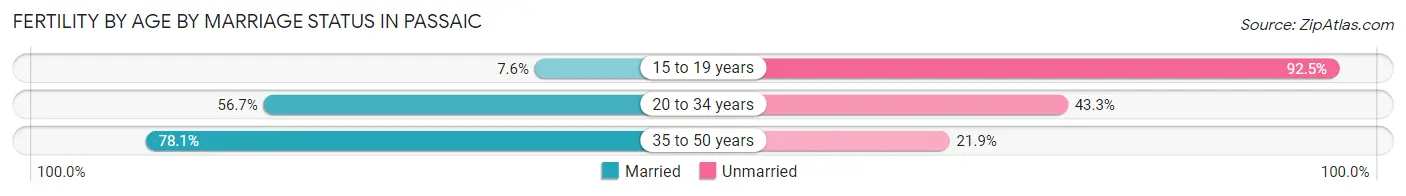
Fertility by Age by Marriage Status in Passaic
59.9% of women with births (918) in Passaic are married. The highest percentage of unmarried women with births falls into 15 to 19 years age bracket with 92.4% of them unmarried at the time of birth, while the lowest percentage of unmarried women with births belong to 35 to 50 years age bracket with 21.9% of them unmarried.
| Age Bracket | Married | Unmarried |
| 15 to 19 years | 4 (7.5%) | 49 (92.4%) |
| 20 to 34 years | 343 (56.7%) | 262 (43.3%) |
| 35 to 50 years | 203 (78.1%) | 57 (21.9%) |
| Total | 550 (59.9%) | 368 (40.1%) |
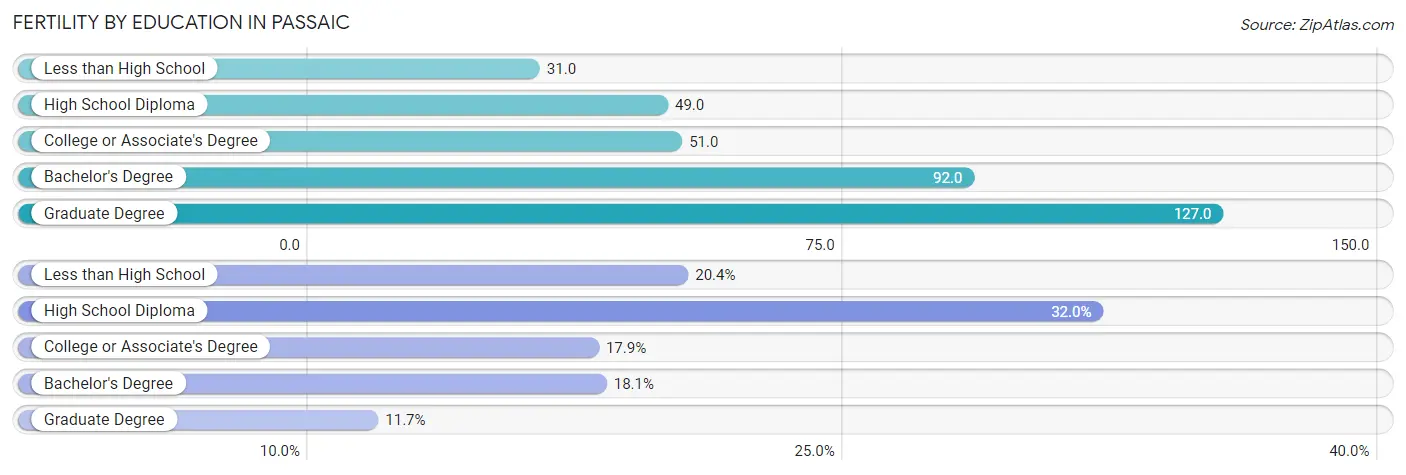
Fertility by Education in Passaic
Average fertility rate in Passaic is 51.0 births per 1,000 women. Women with the education attainment of graduate degree have the highest fertility rate of 127.0 births per 1,000 women, while women with the education attainment of less than high school have the lowest fertility at 31.0 births per 1,000 women. Women with the education attainment of high school diploma represent 32.0% of all women with births.
| Educational Attainment | Women with Births | Births / 1,000 Women |
| Less than High School | 187 (20.4%) | 31.0 |
| High School Diploma | 294 (32.0%) | 49.0 |
| College or Associate's Degree | 164 (17.9%) | 51.0 |
| Bachelor's Degree | 166 (18.1%) | 92.0 |
| Graduate Degree | 107 (11.7%) | 127.0 |
| Total | 918 (100.0%) | 51.0 |
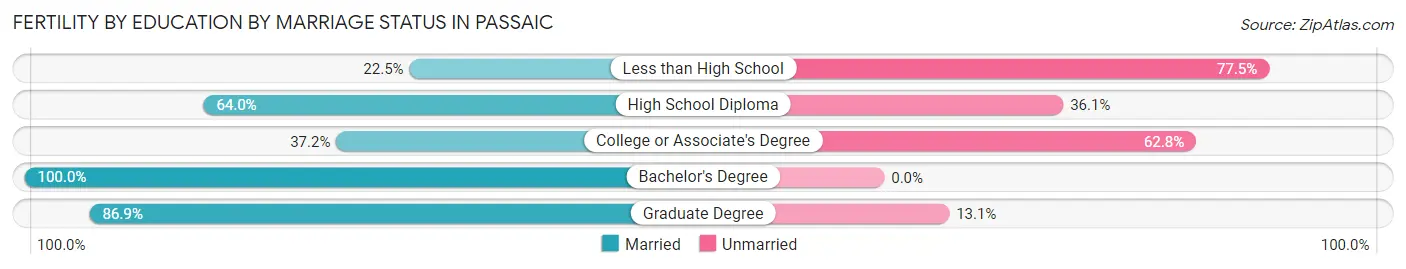
Fertility by Education by Marriage Status in Passaic
40.1% of women with births in Passaic are unmarried. Women with the educational attainment of bachelor's degree are most likely to be married with 100.0% of them married at childbirth, while women with the educational attainment of less than high school are least likely to be married with 77.5% of them unmarried at childbirth.
| Educational Attainment | Married | Unmarried |
| Less than High School | 42 (22.5%) | 145 (77.5%) |
| High School Diploma | 188 (63.9%) | 106 (36.0%) |
| College or Associate's Degree | 61 (37.2%) | 103 (62.8%) |
| Bachelor's Degree | 166 (100.0%) | 0 (0.0%) |
| Graduate Degree | 93 (86.9%) | 14 (13.1%) |
| Total | 550 (59.9%) | 368 (40.1%) |
Employment Characteristics in Passaic
Employment by Class of Employer in Passaic
Among the 29,245 employed individuals in Passaic, private company employees (23,245 | 79.5%), self-employed (not incorporated) (1,829 | 6.2%), and not-for-profit organizations (1,597 | 5.5%) make up the most common classes of employment.
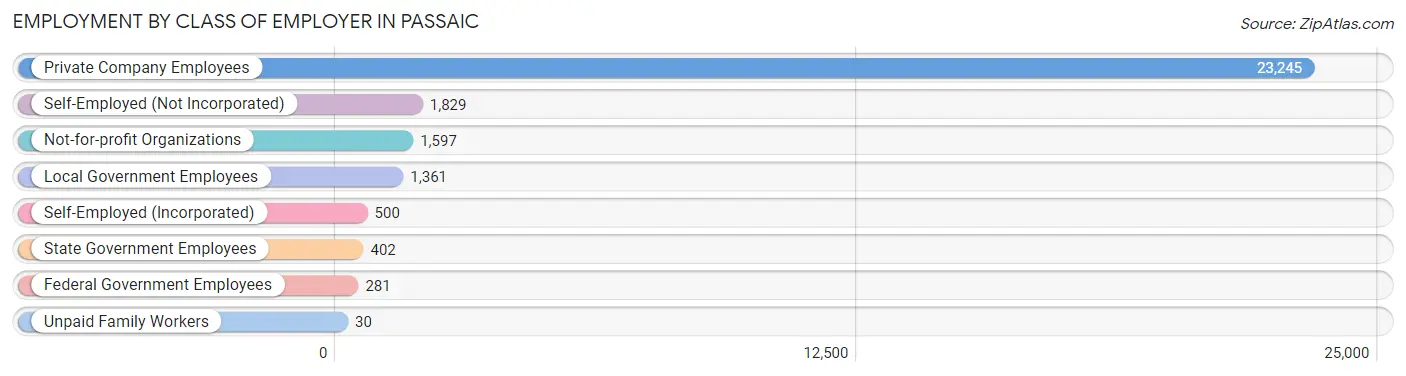
| Employer Class | # Employees | % Employees |
| Private Company Employees | 23,245 | 79.5% |
| Self-Employed (Incorporated) | 500 | 1.7% |
| Self-Employed (Not Incorporated) | 1,829 | 6.2% |
| Not-for-profit Organizations | 1,597 | 5.5% |
| Local Government Employees | 1,361 | 4.6% |
| State Government Employees | 402 | 1.4% |
| Federal Government Employees | 281 | 1.0% |
| Unpaid Family Workers | 30 | 0.1% |
| Total | 29,245 | 100.0% |
Employment Status by Age in Passaic
According to the labor force statistics for Passaic, out of the total population over 16 years of age (50,611), 66.7% or 33,758 individuals are in the labor force, with 11.8% or 3,983 of them unemployed. The age group with the highest labor force participation rate is 35 to 44 years, with 86.0% or 8,580 individuals in the labor force. Within the labor force, the 16 to 19 years age range has the highest percentage of unemployed individuals, with 21.1% or 360 of them being unemployed.
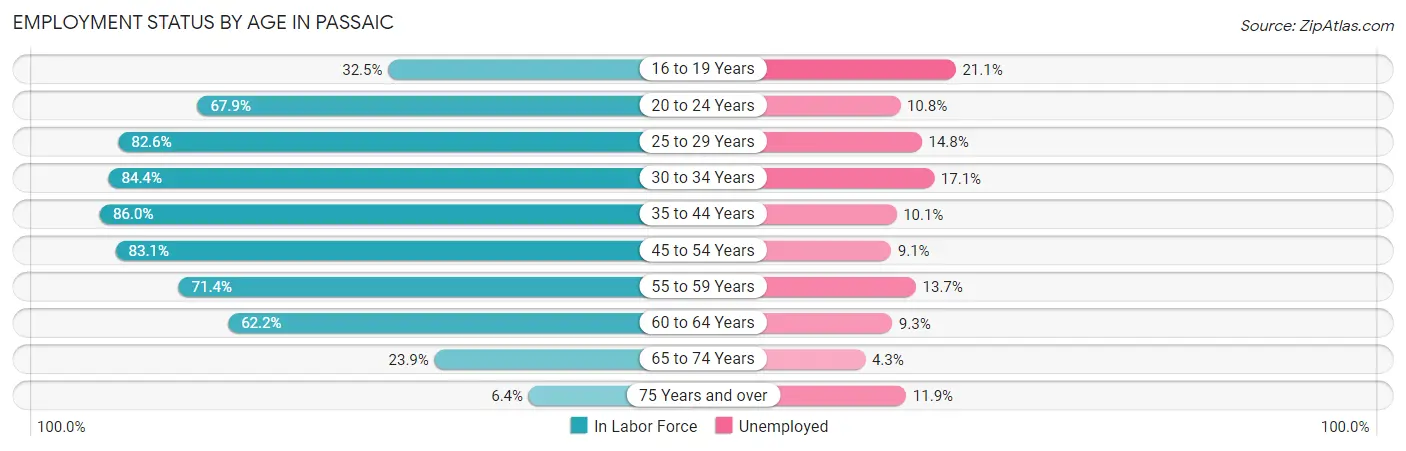
| Age Bracket | In Labor Force | Unemployed |
| 16 to 19 Years | 1,705 (32.5%) | 360 (21.1%) |
| 20 to 24 Years | 3,770 (67.9%) | 407 (10.8%) |
| 25 to 29 Years | 3,404 (82.6%) | 504 (14.8%) |
| 30 to 34 Years | 3,810 (84.4%) | 652 (17.1%) |
| 35 to 44 Years | 8,580 (86.0%) | 867 (10.1%) |
| 45 to 54 Years | 7,287 (83.1%) | 663 (9.1%) |
| 55 to 59 Years | 2,213 (71.4%) | 303 (13.7%) |
| 60 to 64 Years | 1,900 (62.2%) | 177 (9.3%) |
| 65 to 74 Years | 902 (23.9%) | 39 (4.3%) |
| 75 Years and over | 160 (6.4%) | 19 (11.9%) |
| Total | 33,758 (66.7%) | 3,983 (11.8%) |
Employment Status by Educational Attainment in Passaic
According to labor force statistics for Passaic, 81.1% of individuals (27,196) out of the total population between 25 and 64 years of age (33,534) are in the labor force, with 11.6% or 3,155 of them being unemployed. The group with the highest labor force participation rate are those with the educational attainment of bachelor's degree or higher, with 89.9% or 5,044 individuals in the labor force. Within the labor force, individuals with high school diploma education have the highest percentage of unemployment, with 14.4% or 1,464 of them being unemployed.
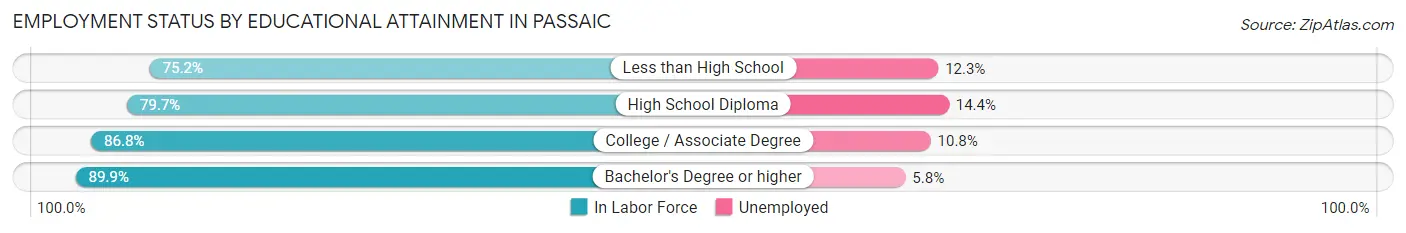
| Educational Attainment | In Labor Force | Unemployed |
| Less than High School | 7,643 (75.2%) | 1,250 (12.3%) |
| High School Diploma | 10,168 (79.7%) | 1,837 (14.4%) |
| College / Associate Degree | 4,341 (86.8%) | 540 (10.8%) |
| Bachelor's Degree or higher | 5,044 (89.9%) | 325 (5.8%) |
| Total | 27,196 (81.1%) | 3,890 (11.6%) |
Employment Occupations by Sex in Passaic
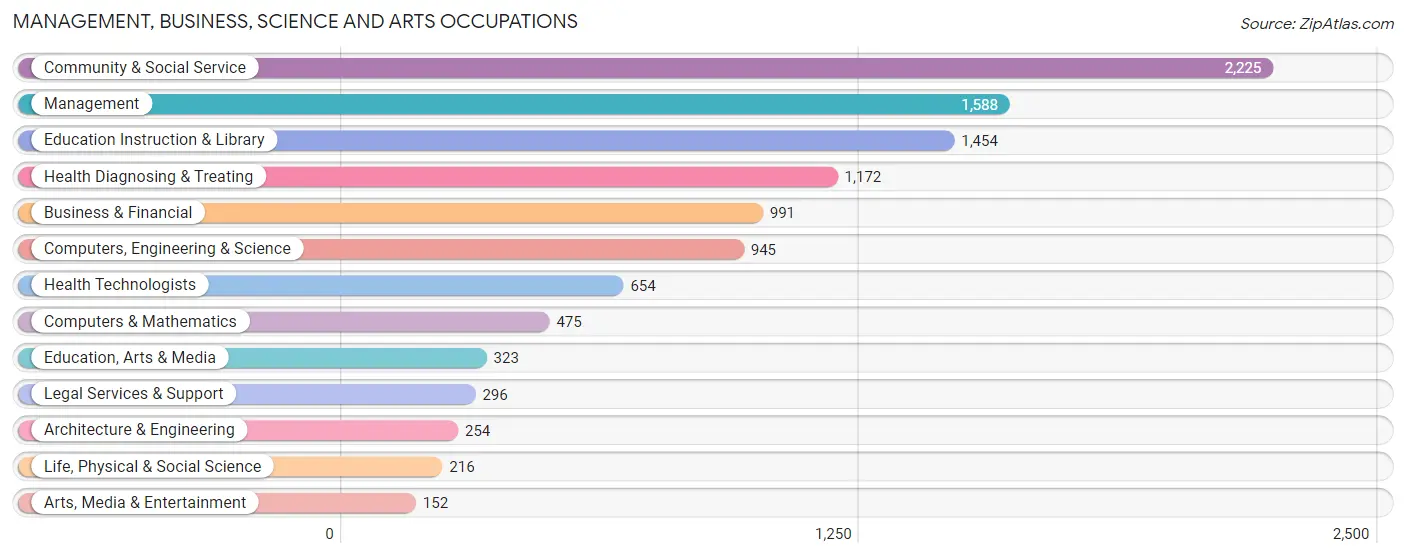
Management, Business, Science and Arts Occupations
The most common Management, Business, Science and Arts occupations in Passaic are Community & Social Service (2,225 | 7.5%), Management (1,588 | 5.3%), Education Instruction & Library (1,454 | 4.9%), Health Diagnosing & Treating (1,172 | 4.0%), and Business & Financial (991 | 3.3%).
Management, Business, Science and Arts Occupations by Sex
Within the Management, Business, Science and Arts occupations in Passaic, the most male-oriented occupations are Architecture & Engineering (76.0%), Management (66.1%), and Computers & Mathematics (61.3%), while the most female-oriented occupations are Education, Arts & Media (81.1%), Health Technologists (77.2%), and Education Instruction & Library (75.4%).
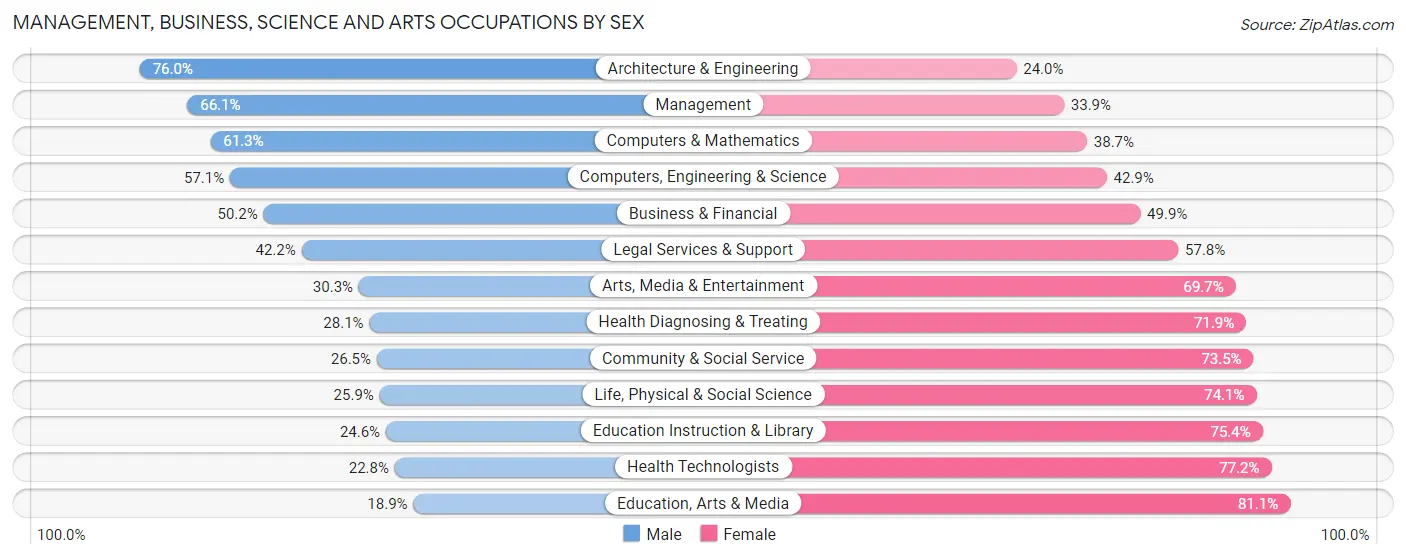
| Occupation | Male | Female |
| Management | 1,049 (66.1%) | 539 (33.9%) |
| Business & Financial | 497 (50.1%) | 494 (49.8%) |
| Computers, Engineering & Science | 540 (57.1%) | 405 (42.9%) |
| Computers & Mathematics | 291 (61.3%) | 184 (38.7%) |
| Architecture & Engineering | 193 (76.0%) | 61 (24.0%) |
| Life, Physical & Social Science | 56 (25.9%) | 160 (74.1%) |
| Community & Social Service | 590 (26.5%) | 1,635 (73.5%) |
| Education, Arts & Media | 61 (18.9%) | 262 (81.1%) |
| Legal Services & Support | 125 (42.2%) | 171 (57.8%) |
| Education Instruction & Library | 358 (24.6%) | 1,096 (75.4%) |
| Arts, Media & Entertainment | 46 (30.3%) | 106 (69.7%) |
| Health Diagnosing & Treating | 329 (28.1%) | 843 (71.9%) |
| Health Technologists | 149 (22.8%) | 505 (77.2%) |
| Total (Category) | 3,005 (43.4%) | 3,916 (56.6%) |
| Total (Overall) | 16,305 (54.9%) | 13,399 (45.1%) |
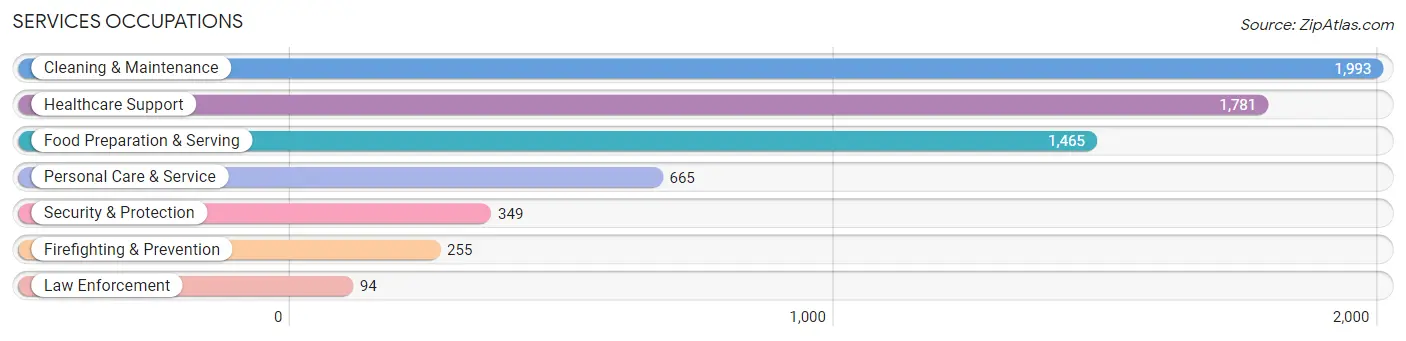
Services Occupations
The most common Services occupations in Passaic are Cleaning & Maintenance (1,993 | 6.7%), Healthcare Support (1,781 | 6.0%), Food Preparation & Serving (1,465 | 4.9%), Personal Care & Service (665 | 2.2%), and Security & Protection (349 | 1.2%).
Services Occupations by Sex
Within the Services occupations in Passaic, the most male-oriented occupations are Law Enforcement (70.2%), Security & Protection (62.7%), and Cleaning & Maintenance (60.8%), while the most female-oriented occupations are Healthcare Support (95.5%), Personal Care & Service (82.0%), and Food Preparation & Serving (52.8%).
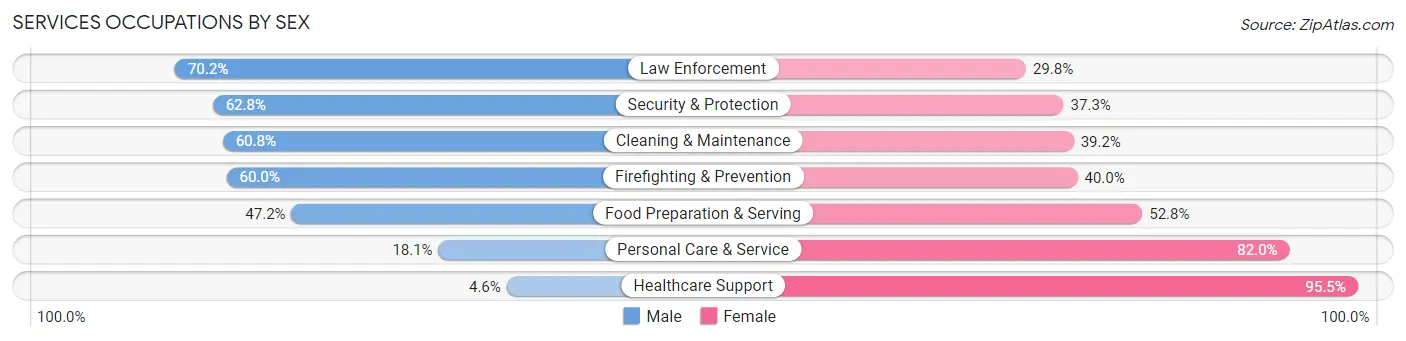
| Occupation | Male | Female |
| Healthcare Support | 81 (4.5%) | 1,700 (95.5%) |
| Security & Protection | 219 (62.7%) | 130 (37.2%) |
| Firefighting & Prevention | 153 (60.0%) | 102 (40.0%) |
| Law Enforcement | 66 (70.2%) | 28 (29.8%) |
| Food Preparation & Serving | 691 (47.2%) | 774 (52.8%) |
| Cleaning & Maintenance | 1,211 (60.8%) | 782 (39.2%) |
| Personal Care & Service | 120 (18.0%) | 545 (82.0%) |
| Total (Category) | 2,322 (37.1%) | 3,931 (62.9%) |
| Total (Overall) | 16,305 (54.9%) | 13,399 (45.1%) |
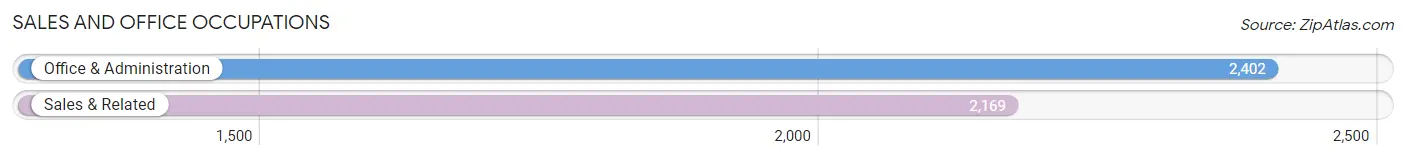
Sales and Office Occupations
The most common Sales and Office occupations in Passaic are Office & Administration (2,402 | 8.1%), and Sales & Related (2,169 | 7.3%).
Sales and Office Occupations by Sex
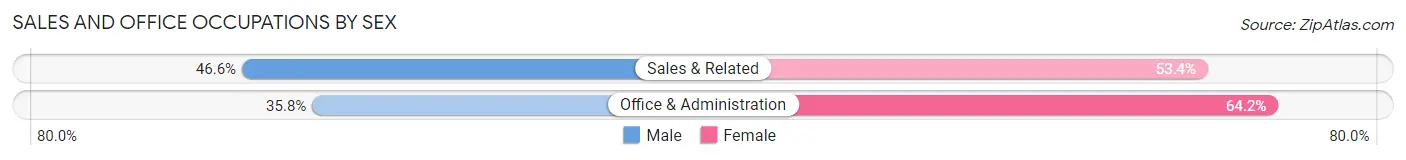
| Occupation | Male | Female |
| Sales & Related | 1,010 (46.6%) | 1,159 (53.4%) |
| Office & Administration | 859 (35.8%) | 1,543 (64.2%) |
| Total (Category) | 1,869 (40.9%) | 2,702 (59.1%) |
| Total (Overall) | 16,305 (54.9%) | 13,399 (45.1%) |
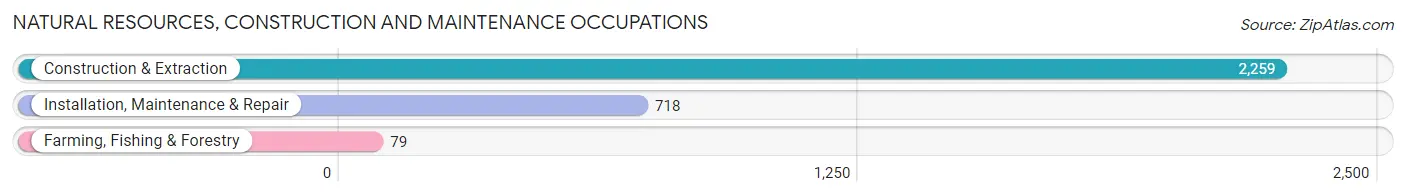
Natural Resources, Construction and Maintenance Occupations
The most common Natural Resources, Construction and Maintenance occupations in Passaic are Construction & Extraction (2,259 | 7.6%), Installation, Maintenance & Repair (718 | 2.4%), and Farming, Fishing & Forestry (79 | 0.3%).
Natural Resources, Construction and Maintenance Occupations by Sex
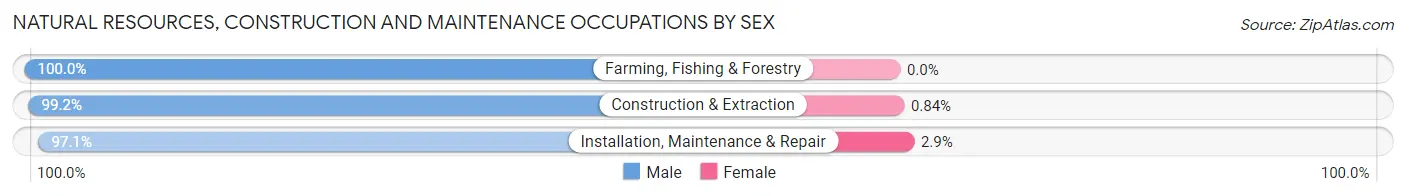
| Occupation | Male | Female |
| Farming, Fishing & Forestry | 79 (100.0%) | 0 (0.0%) |
| Construction & Extraction | 2,240 (99.2%) | 19 (0.8%) |
| Installation, Maintenance & Repair | 697 (97.1%) | 21 (2.9%) |
| Total (Category) | 3,016 (98.7%) | 40 (1.3%) |
| Total (Overall) | 16,305 (54.9%) | 13,399 (45.1%) |
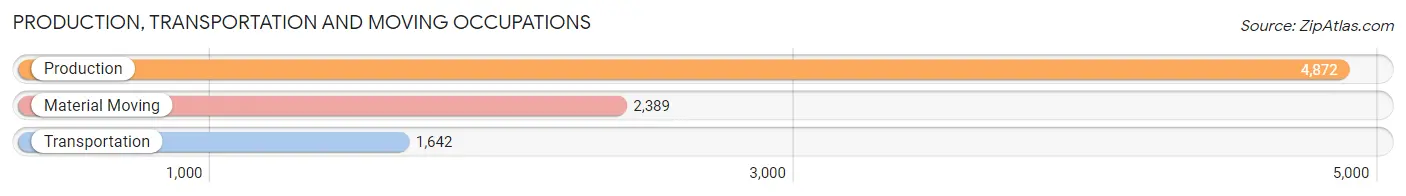
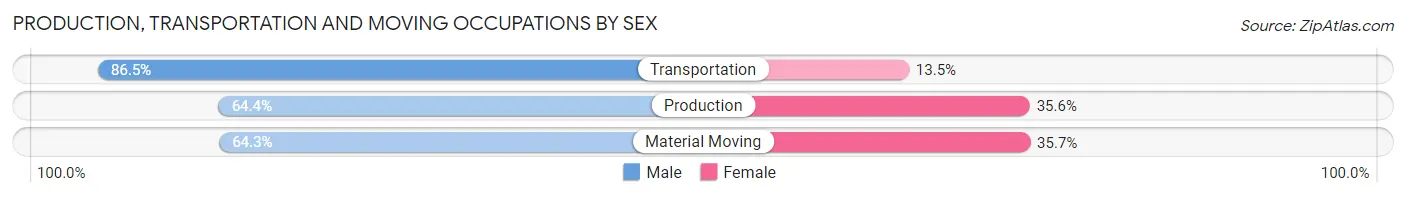
Production, Transportation and Moving Occupations
The most common Production, Transportation and Moving occupations in Passaic are Production (4,872 | 16.4%), Material Moving (2,389 | 8.0%), and Transportation (1,642 | 5.5%).
Production, Transportation and Moving Occupations by Sex
| Occupation | Male | Female |
| Production | 3,136 (64.4%) | 1,736 (35.6%) |
| Transportation | 1,421 (86.5%) | 221 (13.5%) |
| Material Moving | 1,536 (64.3%) | 853 (35.7%) |
| Total (Category) | 6,093 (68.4%) | 2,810 (31.6%) |
| Total (Overall) | 16,305 (54.9%) | 13,399 (45.1%) |
Employment Industries by Sex in Passaic
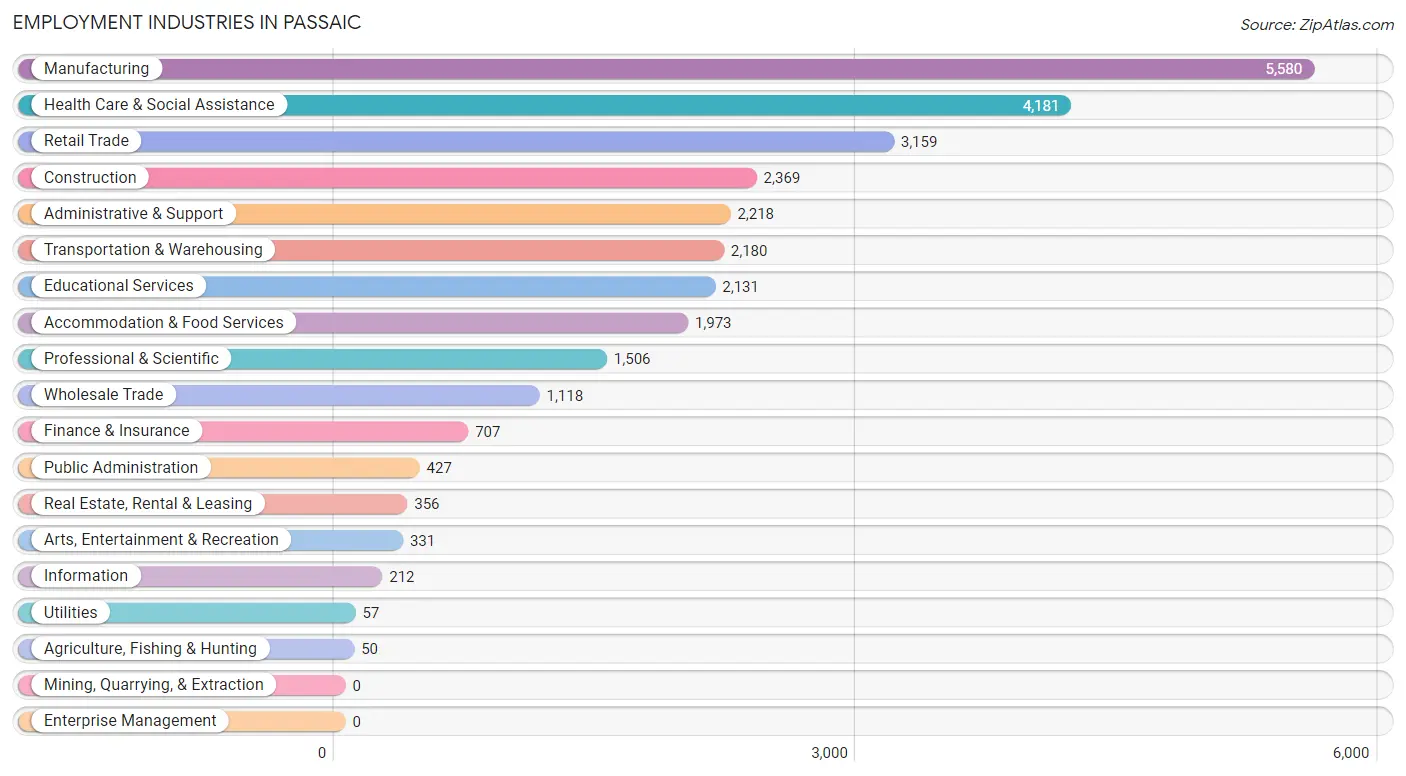
Employment Industries in Passaic
The major employment industries in Passaic include Manufacturing (5,580 | 18.8%), Health Care & Social Assistance (4,181 | 14.1%), Retail Trade (3,159 | 10.6%), Construction (2,369 | 8.0%), and Administrative & Support (2,218 | 7.5%).
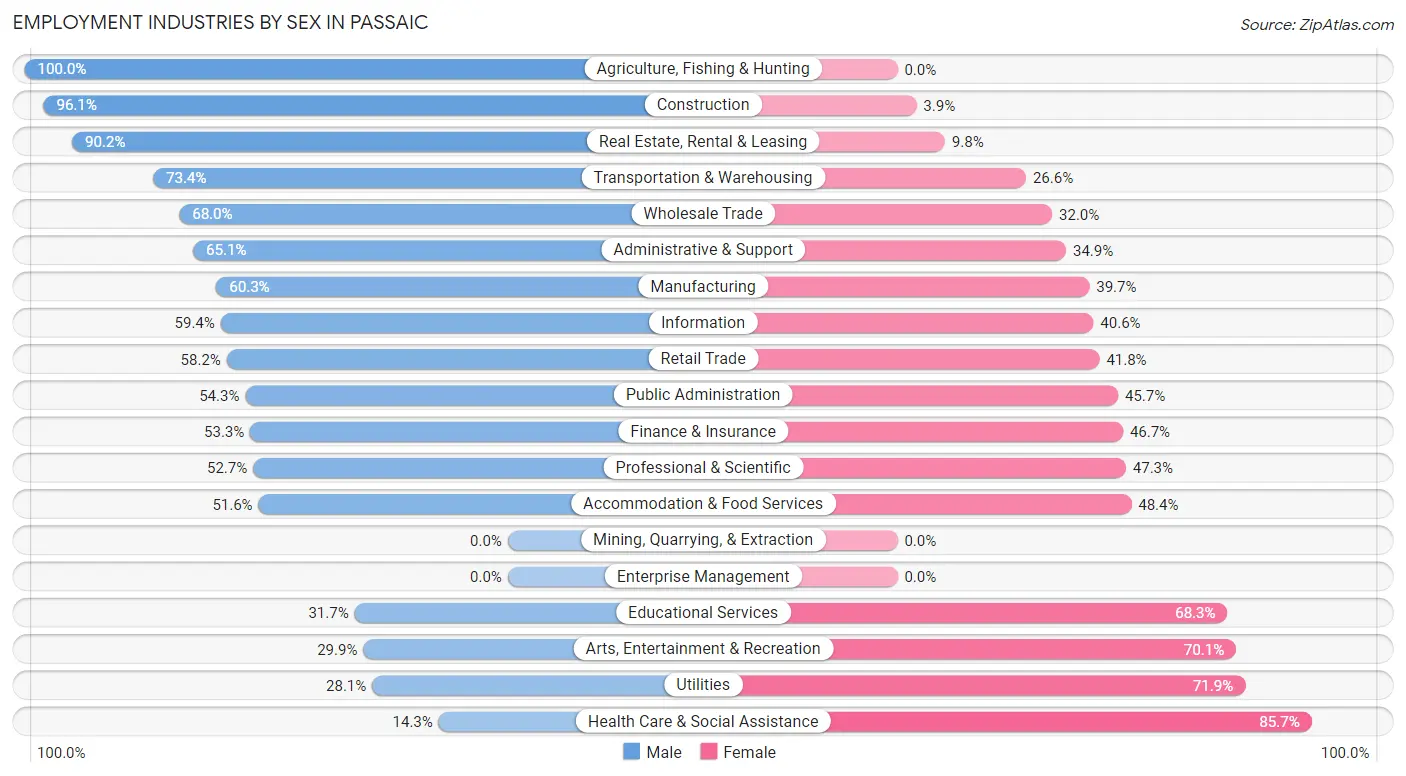
Employment Industries by Sex in Passaic
The Passaic industries that see more men than women are Agriculture, Fishing & Hunting (100.0%), Construction (96.1%), and Real Estate, Rental & Leasing (90.2%), whereas the industries that tend to have a higher number of women are Health Care & Social Assistance (85.7%), Utilities (71.9%), and Arts, Entertainment & Recreation (70.1%).
| Industry | Male | Female |
| Agriculture, Fishing & Hunting | 50 (100.0%) | 0 (0.0%) |
| Mining, Quarrying, & Extraction | 0 (0.0%) | 0 (0.0%) |
| Construction | 2,276 (96.1%) | 93 (3.9%) |
| Manufacturing | 3,364 (60.3%) | 2,216 (39.7%) |
| Wholesale Trade | 760 (68.0%) | 358 (32.0%) |
| Retail Trade | 1,838 (58.2%) | 1,321 (41.8%) |
| Transportation & Warehousing | 1,600 (73.4%) | 580 (26.6%) |
| Utilities | 16 (28.1%) | 41 (71.9%) |
| Information | 126 (59.4%) | 86 (40.6%) |
| Finance & Insurance | 377 (53.3%) | 330 (46.7%) |
| Real Estate, Rental & Leasing | 321 (90.2%) | 35 (9.8%) |
| Professional & Scientific | 794 (52.7%) | 712 (47.3%) |
| Enterprise Management | 0 (0.0%) | 0 (0.0%) |
| Administrative & Support | 1,444 (65.1%) | 774 (34.9%) |
| Educational Services | 676 (31.7%) | 1,455 (68.3%) |
| Health Care & Social Assistance | 598 (14.3%) | 3,583 (85.7%) |
| Arts, Entertainment & Recreation | 99 (29.9%) | 232 (70.1%) |
| Accommodation & Food Services | 1,018 (51.6%) | 955 (48.4%) |
| Public Administration | 232 (54.3%) | 195 (45.7%) |
| Total | 16,305 (54.9%) | 13,399 (45.1%) |
Education in Passaic
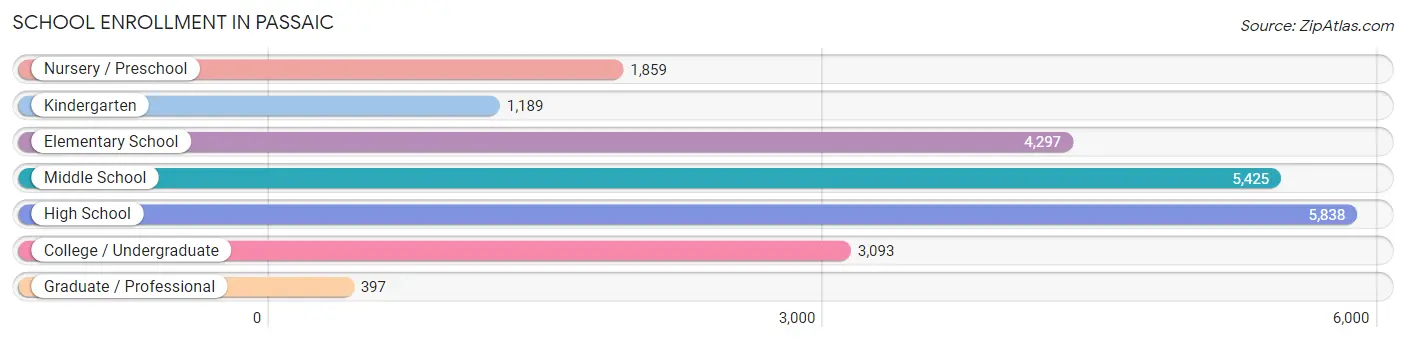
School Enrollment in Passaic
The most common levels of schooling among the 22,098 students in Passaic are high school (5,838 | 26.4%), middle school (5,425 | 24.5%), and elementary school (4,297 | 19.5%).
| School Level | # Students | % Students |
| Nursery / Preschool | 1,859 | 8.4% |
| Kindergarten | 1,189 | 5.4% |
| Elementary School | 4,297 | 19.5% |
| Middle School | 5,425 | 24.5% |
| High School | 5,838 | 26.4% |
| College / Undergraduate | 3,093 | 14.0% |
| Graduate / Professional | 397 | 1.8% |
| Total | 22,098 | 100.0% |
School Enrollment by Age by Funding Source in Passaic
Out of a total of 22,098 students who are enrolled in schools in Passaic, 4,199 (19.0%) attend a private institution, while the remaining 17,899 (81.0%) are enrolled in public schools. The age group of 35 years and over has the highest likelihood of being enrolled in private schools, with 195 (52.8% in the age bracket) enrolled. Conversely, the age group of 3 to 4 year olds has the lowest likelihood of being enrolled in a private school, with 1,518 (85.5% in the age bracket) attending a public institution.
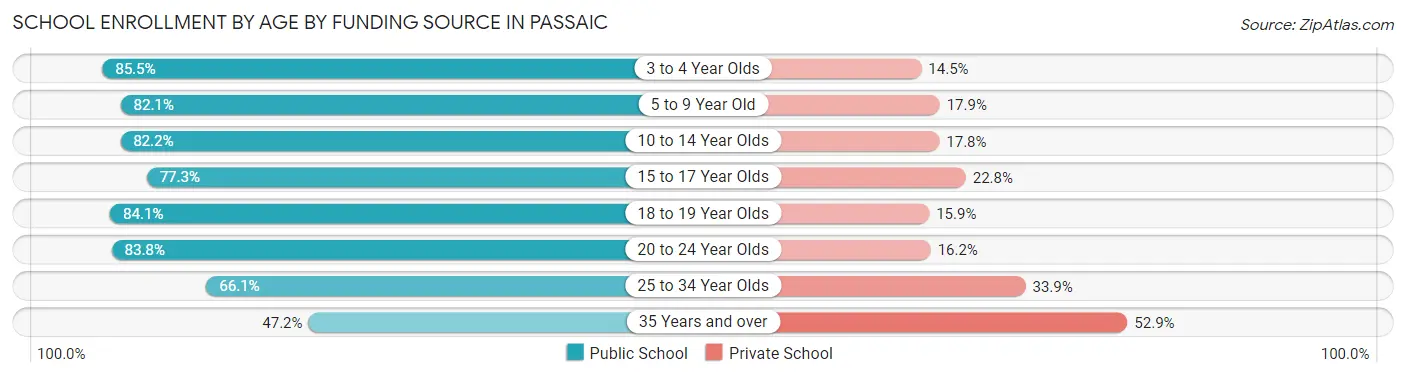
| Age Bracket | Public School | Private School |
| 3 to 4 Year Olds | 1,518 (85.5%) | 257 (14.5%) |
| 5 to 9 Year Old | 4,315 (82.1%) | 940 (17.9%) |
| 10 to 14 Year Olds | 5,500 (82.2%) | 1,193 (17.8%) |
| 15 to 17 Year Olds | 2,934 (77.2%) | 864 (22.8%) |
| 18 to 19 Year Olds | 1,609 (84.1%) | 305 (15.9%) |
| 20 to 24 Year Olds | 1,556 (83.8%) | 301 (16.2%) |
| 25 to 34 Year Olds | 289 (66.1%) | 148 (33.9%) |
| 35 Years and over | 174 (47.1%) | 195 (52.8%) |
| Total | 17,899 (81.0%) | 4,199 (19.0%) |
Educational Attainment by Field of Study in Passaic
Business (1,341 | 19.8%), science & technology (747 | 11.1%), education (693 | 10.2%), liberal arts & history (667 | 9.9%), and psychology (621 | 9.2%) are the most common fields of study among 6,762 individuals in Passaic who have obtained a bachelor's degree or higher.
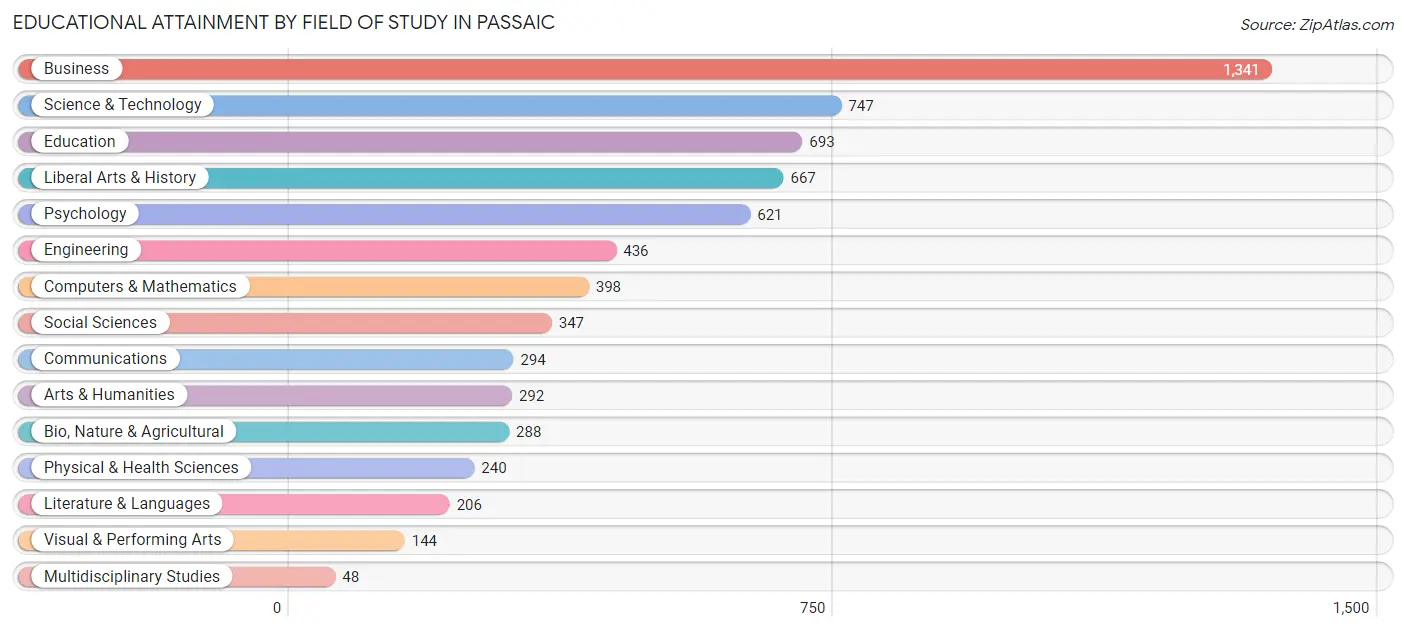
| Field of Study | # Graduates | % Graduates |
| Computers & Mathematics | 398 | 5.9% |
| Bio, Nature & Agricultural | 288 | 4.3% |
| Physical & Health Sciences | 240 | 3.5% |
| Psychology | 621 | 9.2% |
| Social Sciences | 347 | 5.1% |
| Engineering | 436 | 6.5% |
| Multidisciplinary Studies | 48 | 0.7% |
| Science & Technology | 747 | 11.1% |
| Business | 1,341 | 19.8% |
| Education | 693 | 10.2% |
| Literature & Languages | 206 | 3.0% |
| Liberal Arts & History | 667 | 9.9% |
| Visual & Performing Arts | 144 | 2.1% |
| Communications | 294 | 4.3% |
| Arts & Humanities | 292 | 4.3% |
| Total | 6,762 | 100.0% |
Transportation & Commute in Passaic
Vehicle Availability by Sex in Passaic
The most prevalent vehicle ownership categories in Passaic are males with 1 vehicle (6,141, accounting for 37.9%) and females with 1 vehicle (4,779, making up 47.1%).
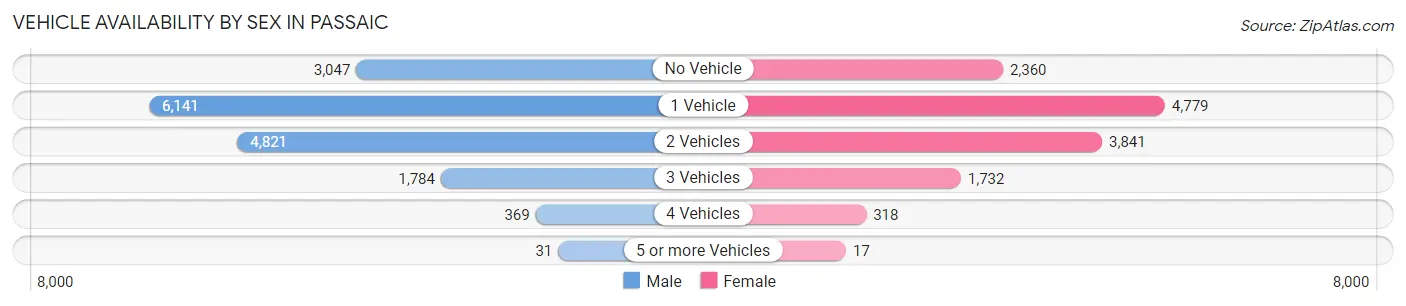
| Vehicles Available | Male | Female |
| No Vehicle | 3,047 (18.8%) | 2,360 (18.1%) |
| 1 Vehicle | 6,141 (37.9%) | 4,779 (36.6%) |
| 2 Vehicles | 4,821 (29.8%) | 3,841 (29.4%) |
| 3 Vehicles | 1,784 (11.0%) | 1,732 (13.3%) |
| 4 Vehicles | 369 (2.3%) | 318 (2.4%) |
| 5 or more Vehicles | 31 (0.2%) | 17 (0.1%) |
| Total | 16,193 (100.0%) | 13,047 (100.0%) |
Commute Time in Passaic
The most frequently occuring commute durations in Passaic are 10 to 14 minutes (4,929 commuters, 18.1%), 20 to 24 minutes (4,006 commuters, 14.7%), and 15 to 19 minutes (3,975 commuters, 14.6%).
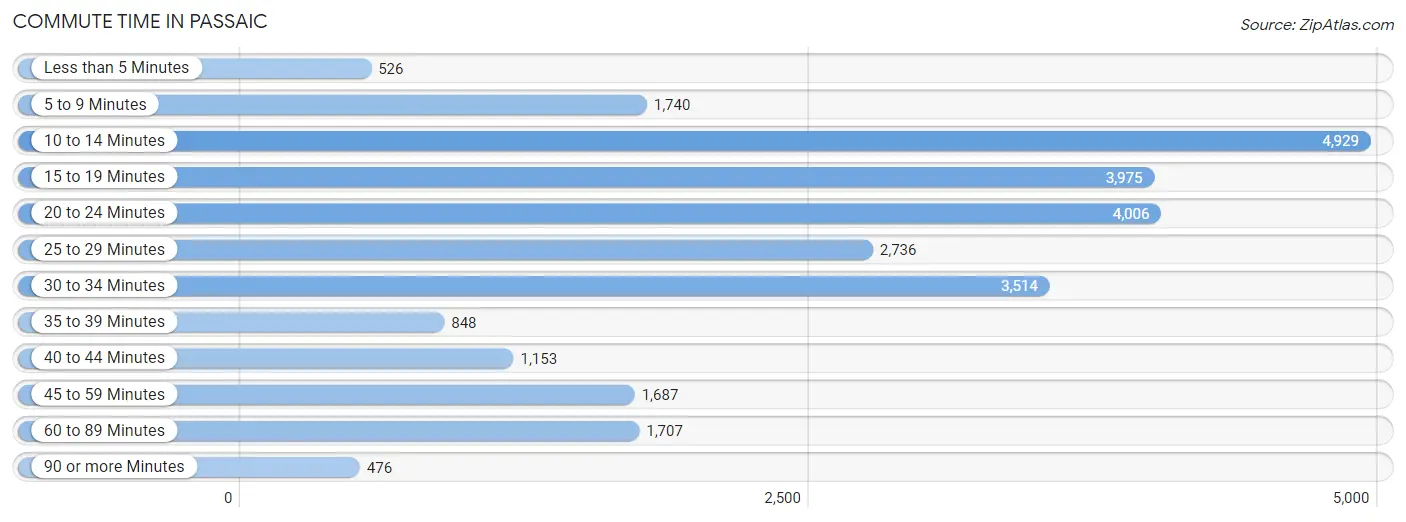
| Commute Time | # Commuters | % Commuters |
| Less than 5 Minutes | 526 | 1.9% |
| 5 to 9 Minutes | 1,740 | 6.4% |
| 10 to 14 Minutes | 4,929 | 18.1% |
| 15 to 19 Minutes | 3,975 | 14.6% |
| 20 to 24 Minutes | 4,006 | 14.7% |
| 25 to 29 Minutes | 2,736 | 10.0% |
| 30 to 34 Minutes | 3,514 | 12.9% |
| 35 to 39 Minutes | 848 | 3.1% |
| 40 to 44 Minutes | 1,153 | 4.2% |
| 45 to 59 Minutes | 1,687 | 6.2% |
| 60 to 89 Minutes | 1,707 | 6.2% |
| 90 or more Minutes | 476 | 1.7% |
Commute Time by Sex in Passaic
The most common commute times in Passaic are 20 to 24 minutes (2,484 commuters, 16.2%) for males and 10 to 14 minutes (2,476 commuters, 20.7%) for females.
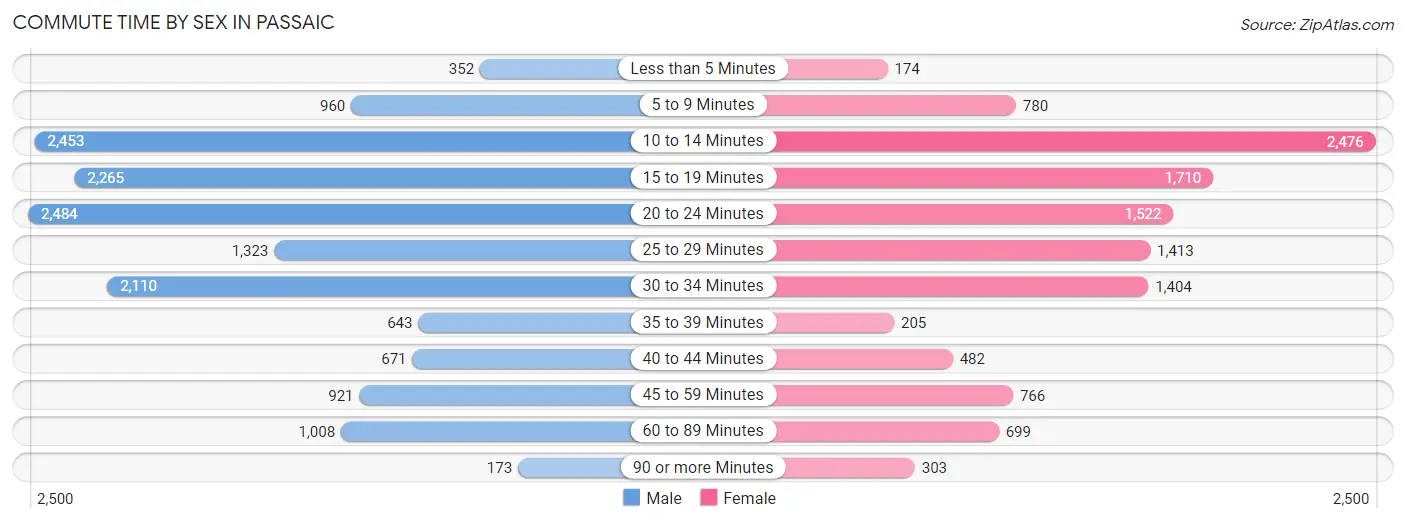
| Commute Time | Male | Female |
| Less than 5 Minutes | 352 (2.3%) | 174 (1.5%) |
| 5 to 9 Minutes | 960 (6.2%) | 780 (6.5%) |
| 10 to 14 Minutes | 2,453 (16.0%) | 2,476 (20.7%) |
| 15 to 19 Minutes | 2,265 (14.7%) | 1,710 (14.3%) |
| 20 to 24 Minutes | 2,484 (16.2%) | 1,522 (12.8%) |
| 25 to 29 Minutes | 1,323 (8.6%) | 1,413 (11.8%) |
| 30 to 34 Minutes | 2,110 (13.7%) | 1,404 (11.8%) |
| 35 to 39 Minutes | 643 (4.2%) | 205 (1.7%) |
| 40 to 44 Minutes | 671 (4.4%) | 482 (4.0%) |
| 45 to 59 Minutes | 921 (6.0%) | 766 (6.4%) |
| 60 to 89 Minutes | 1,008 (6.6%) | 699 (5.9%) |
| 90 or more Minutes | 173 (1.1%) | 303 (2.5%) |
Time of Departure to Work by Sex in Passaic
The most frequent times of departure to work in Passaic are 8:00 AM to 8:29 AM (2,927, 19.1%) for males and 8:00 AM to 8:29 AM (1,991, 16.7%) for females.
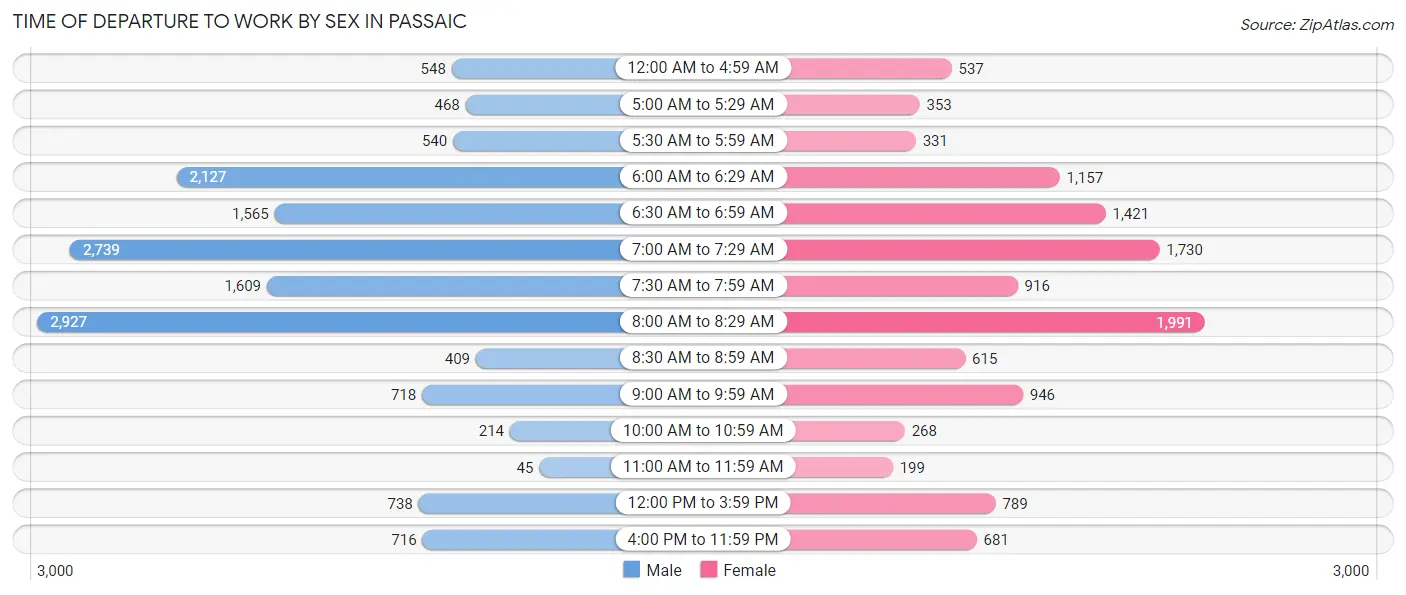
| Time of Departure | Male | Female |
| 12:00 AM to 4:59 AM | 548 (3.6%) | 537 (4.5%) |
| 5:00 AM to 5:29 AM | 468 (3.0%) | 353 (3.0%) |
| 5:30 AM to 5:59 AM | 540 (3.5%) | 331 (2.8%) |
| 6:00 AM to 6:29 AM | 2,127 (13.8%) | 1,157 (9.7%) |
| 6:30 AM to 6:59 AM | 1,565 (10.2%) | 1,421 (11.9%) |
| 7:00 AM to 7:29 AM | 2,739 (17.8%) | 1,730 (14.5%) |
| 7:30 AM to 7:59 AM | 1,609 (10.5%) | 916 (7.7%) |
| 8:00 AM to 8:29 AM | 2,927 (19.1%) | 1,991 (16.7%) |
| 8:30 AM to 8:59 AM | 409 (2.7%) | 615 (5.1%) |
| 9:00 AM to 9:59 AM | 718 (4.7%) | 946 (7.9%) |
| 10:00 AM to 10:59 AM | 214 (1.4%) | 268 (2.2%) |
| 11:00 AM to 11:59 AM | 45 (0.3%) | 199 (1.7%) |
| 12:00 PM to 3:59 PM | 738 (4.8%) | 789 (6.6%) |
| 4:00 PM to 11:59 PM | 716 (4.7%) | 681 (5.7%) |
| Total | 15,363 (100.0%) | 11,934 (100.0%) |
Housing Occupancy in Passaic
Occupancy by Ownership in Passaic
Of the total 20,182 dwellings in Passaic, owner-occupied units account for 4,446 (22.0%), while renter-occupied units make up 15,736 (78.0%).
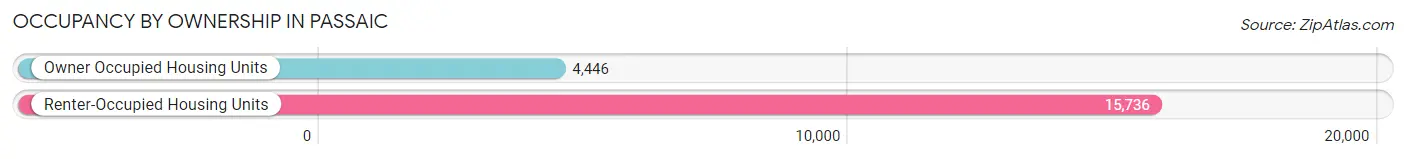
| Occupancy | # Housing Units | % Housing Units |
| Owner Occupied Housing Units | 4,446 | 22.0% |
| Renter-Occupied Housing Units | 15,736 | 78.0% |
| Total Occupied Housing Units | 20,182 | 100.0% |
Occupancy by Household Size in Passaic
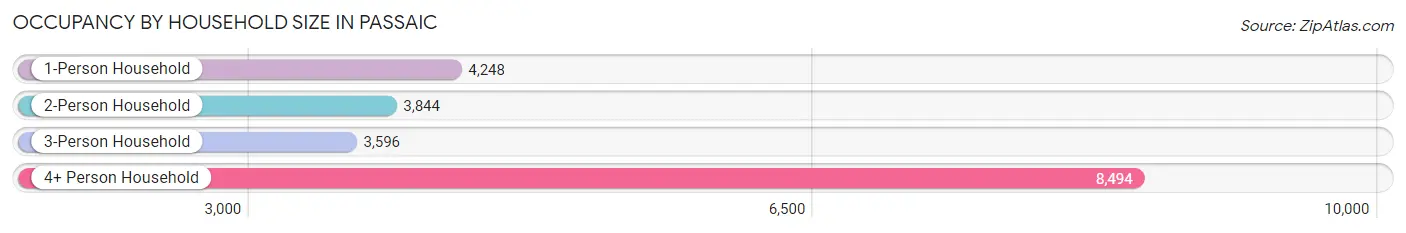
| Household Size | # Housing Units | % Housing Units |
| 1-Person Household | 4,248 | 21.0% |
| 2-Person Household | 3,844 | 19.1% |
| 3-Person Household | 3,596 | 17.8% |
| 4+ Person Household | 8,494 | 42.1% |
| Total Housing Units | 20,182 | 100.0% |
Occupancy by Ownership by Household Size in Passaic
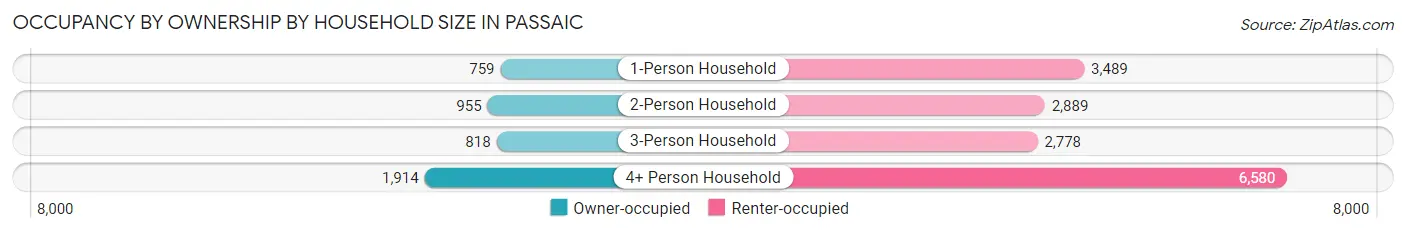
| Household Size | Owner-occupied | Renter-occupied |
| 1-Person Household | 759 (17.9%) | 3,489 (82.1%) |
| 2-Person Household | 955 (24.8%) | 2,889 (75.2%) |
| 3-Person Household | 818 (22.8%) | 2,778 (77.2%) |
| 4+ Person Household | 1,914 (22.5%) | 6,580 (77.5%) |
| Total Housing Units | 4,446 (22.0%) | 15,736 (78.0%) |
Occupancy by Educational Attainment in Passaic
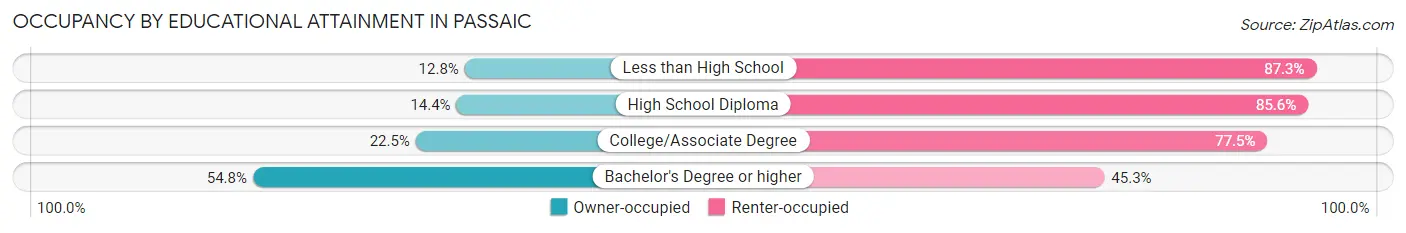
| Household Size | Owner-occupied | Renter-occupied |
| Less than High School | 827 (12.8%) | 5,658 (87.3%) |
| High School Diploma | 1,044 (14.4%) | 6,217 (85.6%) |
| College/Associate Degree | 660 (22.5%) | 2,278 (77.5%) |
| Bachelor's Degree or higher | 1,915 (54.7%) | 1,583 (45.3%) |
Occupancy by Age of Householder in Passaic
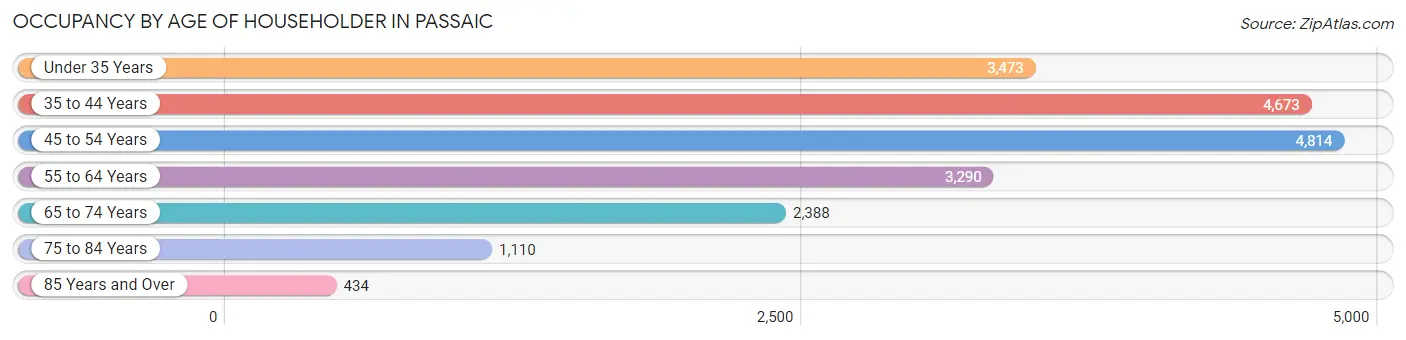
| Age Bracket | # Households | % Households |
| Under 35 Years | 3,473 | 17.2% |
| 35 to 44 Years | 4,673 | 23.2% |
| 45 to 54 Years | 4,814 | 23.8% |
| 55 to 64 Years | 3,290 | 16.3% |
| 65 to 74 Years | 2,388 | 11.8% |
| 75 to 84 Years | 1,110 | 5.5% |
| 85 Years and Over | 434 | 2.1% |
| Total | 20,182 | 100.0% |
Housing Finances in Passaic
Median Income by Occupancy in Passaic
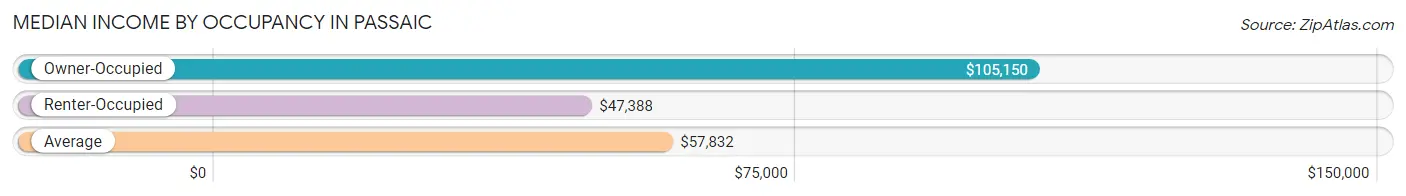
| Occupancy Type | # Households | Median Income |
| Owner-Occupied | 4,446 (22.0%) | $105,150 |
| Renter-Occupied | 15,736 (78.0%) | $47,388 |
| Average | 20,182 (100.0%) | $57,832 |
Occupancy by Householder Income Bracket in Passaic
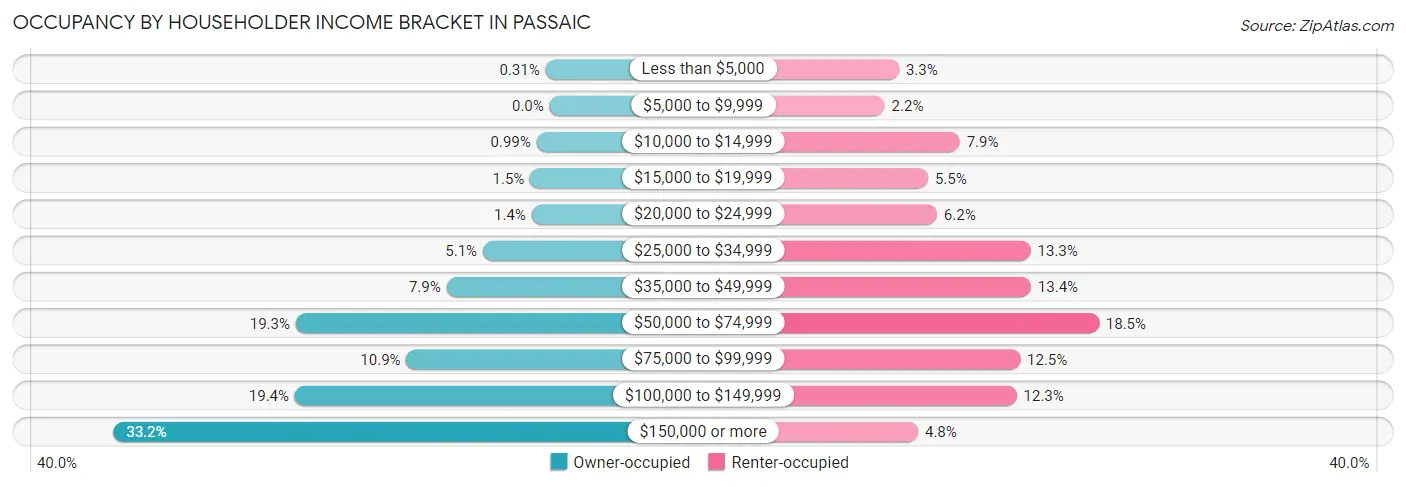
| Income Bracket | Owner-occupied | Renter-occupied |
| Less than $5,000 | 14 (0.3%) | 521 (3.3%) |
| $5,000 to $9,999 | 0 (0.0%) | 350 (2.2%) |
| $10,000 to $14,999 | 44 (1.0%) | 1,249 (7.9%) |
| $15,000 to $19,999 | 66 (1.5%) | 868 (5.5%) |
| $20,000 to $24,999 | 61 (1.4%) | 975 (6.2%) |
| $25,000 to $34,999 | 226 (5.1%) | 2,099 (13.3%) |
| $35,000 to $49,999 | 349 (7.9%) | 2,102 (13.4%) |
| $50,000 to $74,999 | 860 (19.3%) | 2,918 (18.5%) |
| $75,000 to $99,999 | 485 (10.9%) | 1,974 (12.5%) |
| $100,000 to $149,999 | 863 (19.4%) | 1,931 (12.3%) |
| $150,000 or more | 1,478 (33.2%) | 749 (4.8%) |
| Total | 4,446 (100.0%) | 15,736 (100.0%) |
Monthly Housing Cost Tiers in Passaic
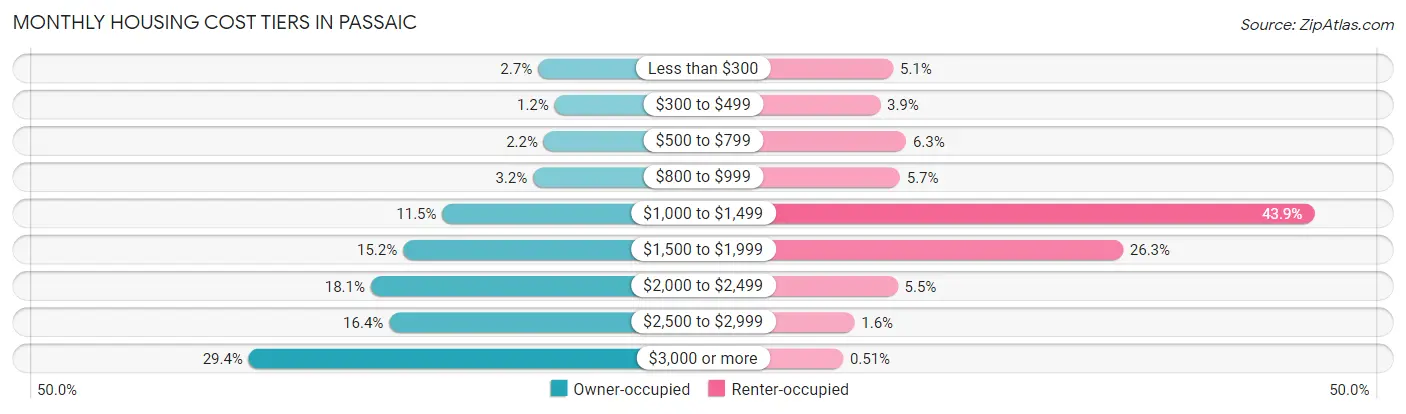
| Monthly Cost | Owner-occupied | Renter-occupied |
| Less than $300 | 122 (2.7%) | 805 (5.1%) |
| $300 to $499 | 54 (1.2%) | 617 (3.9%) |
| $500 to $799 | 98 (2.2%) | 993 (6.3%) |
| $800 to $999 | 142 (3.2%) | 903 (5.7%) |
| $1,000 to $1,499 | 513 (11.5%) | 6,907 (43.9%) |
| $1,500 to $1,999 | 674 (15.2%) | 4,135 (26.3%) |
| $2,000 to $2,499 | 806 (18.1%) | 872 (5.5%) |
| $2,500 to $2,999 | 731 (16.4%) | 246 (1.6%) |
| $3,000 or more | 1,306 (29.4%) | 81 (0.5%) |
| Total | 4,446 (100.0%) | 15,736 (100.0%) |
Physical Housing Characteristics in Passaic
Housing Structures in Passaic
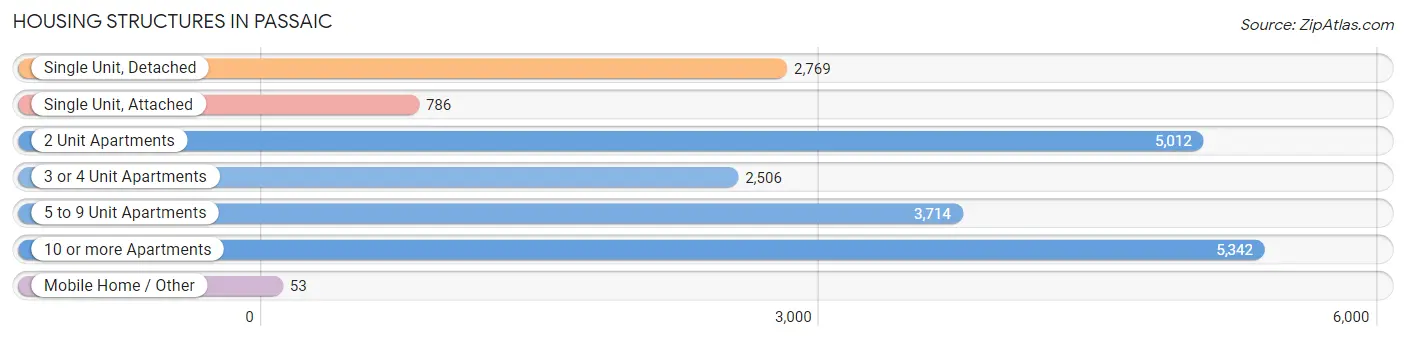
| Structure Type | # Housing Units | % Housing Units |
| Single Unit, Detached | 2,769 | 13.7% |
| Single Unit, Attached | 786 | 3.9% |
| 2 Unit Apartments | 5,012 | 24.8% |
| 3 or 4 Unit Apartments | 2,506 | 12.4% |
| 5 to 9 Unit Apartments | 3,714 | 18.4% |
| 10 or more Apartments | 5,342 | 26.5% |
| Mobile Home / Other | 53 | 0.3% |
| Total | 20,182 | 100.0% |
Housing Structures by Occupancy in Passaic
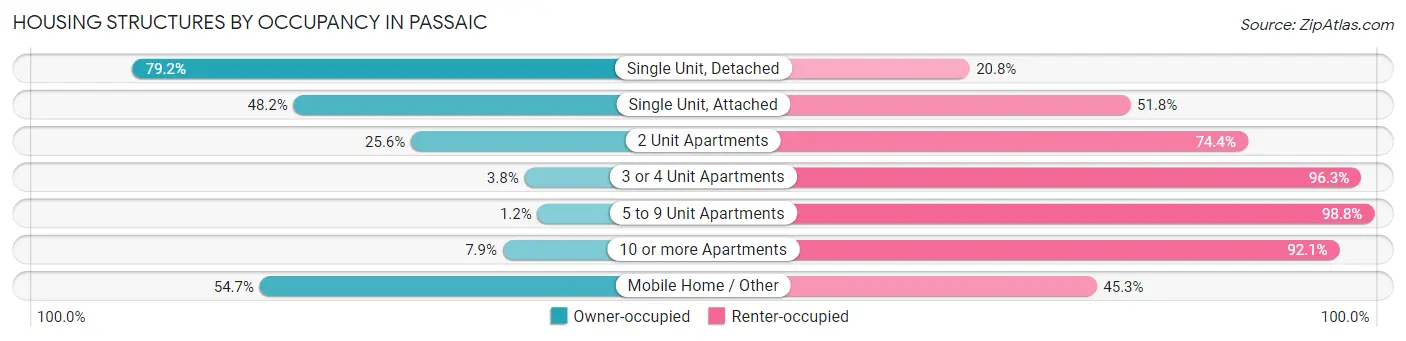
| Structure Type | Owner-occupied | Renter-occupied |
| Single Unit, Detached | 2,193 (79.2%) | 576 (20.8%) |
| Single Unit, Attached | 379 (48.2%) | 407 (51.8%) |
| 2 Unit Apartments | 1,282 (25.6%) | 3,730 (74.4%) |
| 3 or 4 Unit Apartments | 94 (3.7%) | 2,412 (96.3%) |
| 5 to 9 Unit Apartments | 46 (1.2%) | 3,668 (98.8%) |
| 10 or more Apartments | 423 (7.9%) | 4,919 (92.1%) |
| Mobile Home / Other | 29 (54.7%) | 24 (45.3%) |
| Total | 4,446 (22.0%) | 15,736 (78.0%) |
Housing Structures by Number of Rooms in Passaic
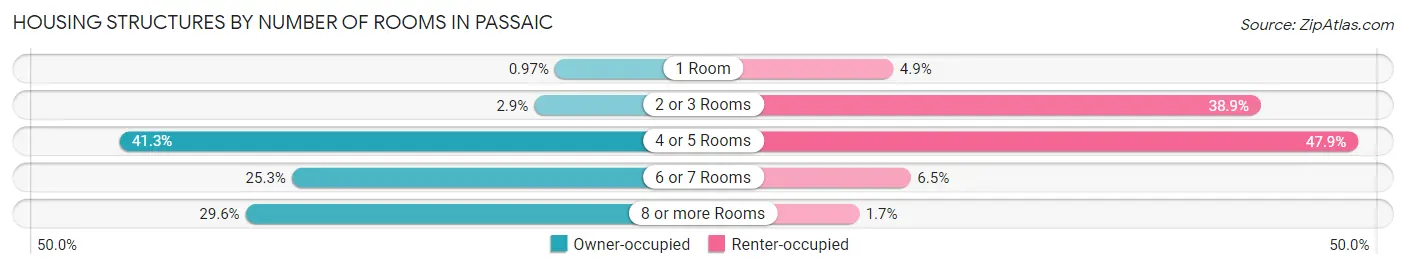
| Number of Rooms | Owner-occupied | Renter-occupied |
| 1 Room | 43 (1.0%) | 771 (4.9%) |
| 2 or 3 Rooms | 128 (2.9%) | 6,124 (38.9%) |
| 4 or 5 Rooms | 1,835 (41.3%) | 7,541 (47.9%) |
| 6 or 7 Rooms | 1,125 (25.3%) | 1,026 (6.5%) |
| 8 or more Rooms | 1,315 (29.6%) | 274 (1.7%) |
| Total | 4,446 (100.0%) | 15,736 (100.0%) |
Housing Structure by Heating Type in Passaic
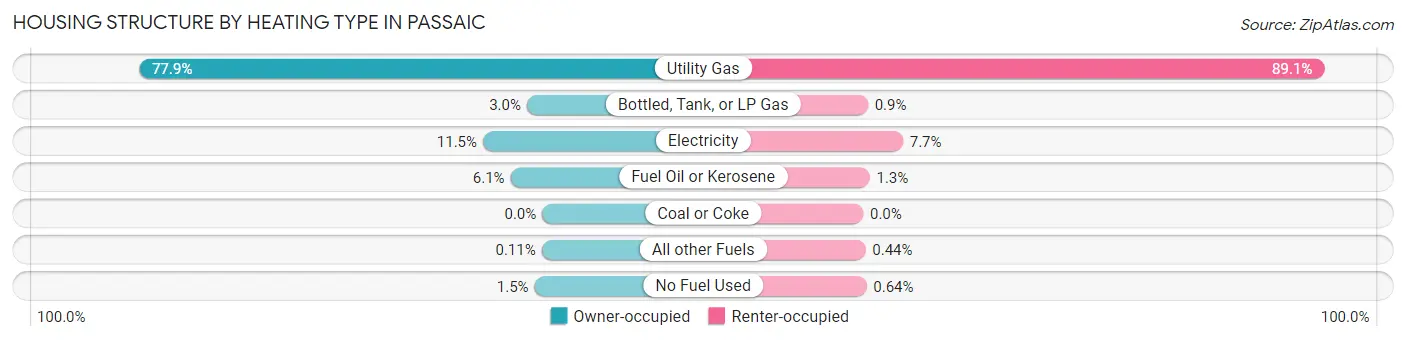
| Heating Type | Owner-occupied | Renter-occupied |
| Utility Gas | 3,463 (77.9%) | 14,020 (89.1%) |
| Bottled, Tank, or LP Gas | 131 (2.9%) | 141 (0.9%) |
| Electricity | 509 (11.5%) | 1,208 (7.7%) |
| Fuel Oil or Kerosene | 272 (6.1%) | 196 (1.3%) |
| Coal or Coke | 0 (0.0%) | 0 (0.0%) |
| All other Fuels | 5 (0.1%) | 70 (0.4%) |
| No Fuel Used | 66 (1.5%) | 101 (0.6%) |
| Total | 4,446 (100.0%) | 15,736 (100.0%) |
Household Vehicle Usage in Passaic
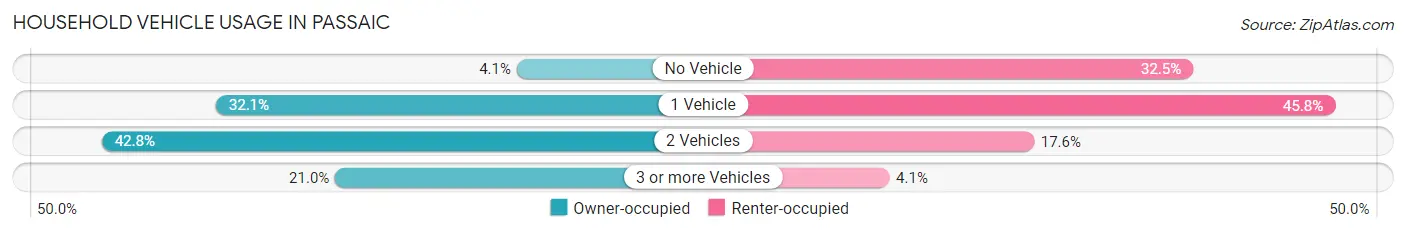
| Vehicles per Household | Owner-occupied | Renter-occupied |
| No Vehicle | 180 (4.1%) | 5,113 (32.5%) |
| 1 Vehicle | 1,429 (32.1%) | 7,199 (45.8%) |
| 2 Vehicles | 1,903 (42.8%) | 2,774 (17.6%) |
| 3 or more Vehicles | 934 (21.0%) | 650 (4.1%) |
| Total | 4,446 (100.0%) | 15,736 (100.0%) |
Real Estate & Mortgages in Passaic
Real Estate and Mortgage Overview in Passaic
| Characteristic | Without Mortgage | With Mortgage |
| Housing Units | 1,487 | 2,959 |
| Median Property Value | $427,800 | $366,600 |
| Median Household Income | $78,125 | $1,142 |
| Monthly Housing Costs | $1,389 | $1,280 |
| Real Estate Taxes | $10,001 | $75 |
Property Value by Mortgage Status in Passaic
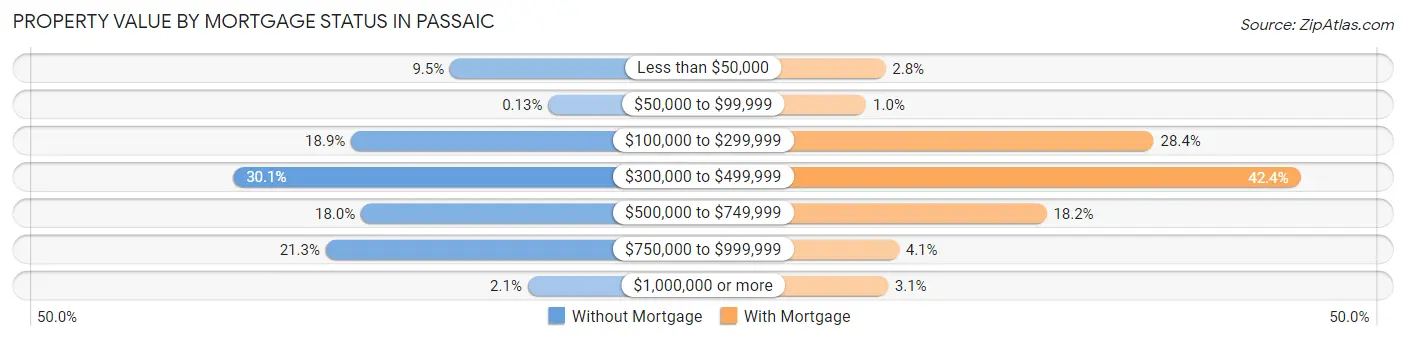
| Property Value | Without Mortgage | With Mortgage |
| Less than $50,000 | 141 (9.5%) | 84 (2.8%) |
| $50,000 to $99,999 | 2 (0.1%) | 30 (1.0%) |
| $100,000 to $299,999 | 281 (18.9%) | 840 (28.4%) |
| $300,000 to $499,999 | 448 (30.1%) | 1,254 (42.4%) |
| $500,000 to $749,999 | 267 (18.0%) | 538 (18.2%) |
| $750,000 to $999,999 | 317 (21.3%) | 122 (4.1%) |
| $1,000,000 or more | 31 (2.1%) | 91 (3.1%) |
| Total | 1,487 (100.0%) | 2,959 (100.0%) |
Household Income by Mortgage Status in Passaic
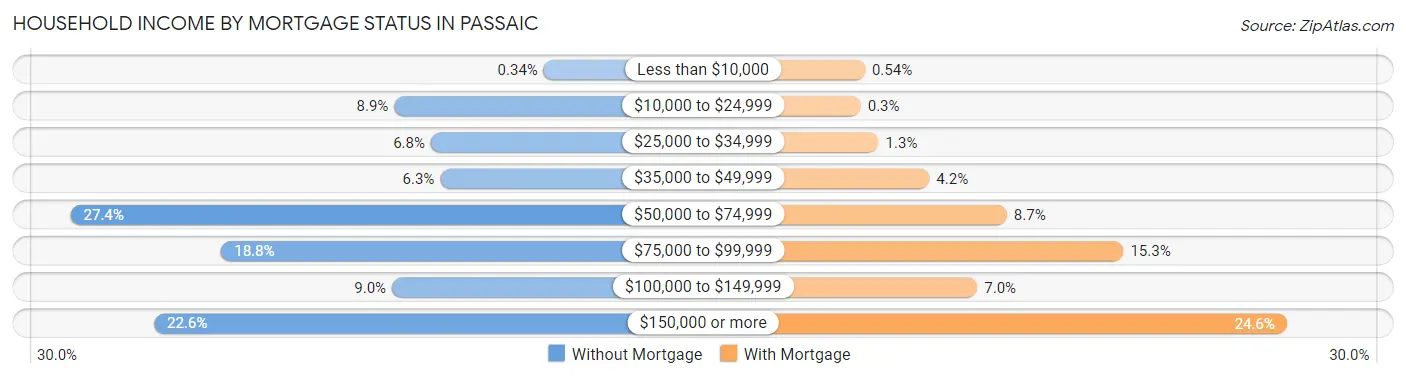
| Household Income | Without Mortgage | With Mortgage |
| Less than $10,000 | 5 (0.3%) | 16 (0.5%) |
| $10,000 to $24,999 | 132 (8.9%) | 9 (0.3%) |
| $25,000 to $34,999 | 101 (6.8%) | 39 (1.3%) |
| $35,000 to $49,999 | 93 (6.2%) | 125 (4.2%) |
| $50,000 to $74,999 | 407 (27.4%) | 256 (8.6%) |
| $75,000 to $99,999 | 279 (18.8%) | 453 (15.3%) |
| $100,000 to $149,999 | 134 (9.0%) | 206 (7.0%) |
| $150,000 or more | 336 (22.6%) | 729 (24.6%) |
| Total | 1,487 (100.0%) | 2,959 (100.0%) |
Property Value to Household Income Ratio in Passaic
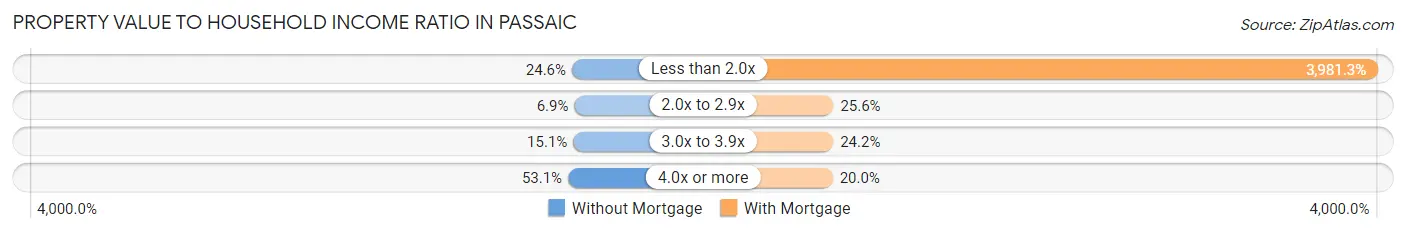
| Value-to-Income Ratio | Without Mortgage | With Mortgage |
| Less than 2.0x | 365 (24.5%) | 117,807 (3,981.3%) |
| 2.0x to 2.9x | 103 (6.9%) | 758 (25.6%) |
| 3.0x to 3.9x | 225 (15.1%) | 716 (24.2%) |
| 4.0x or more | 789 (53.1%) | 592 (20.0%) |
| Total | 1,487 (100.0%) | 2,959 (100.0%) |
Real Estate Taxes by Mortgage Status in Passaic
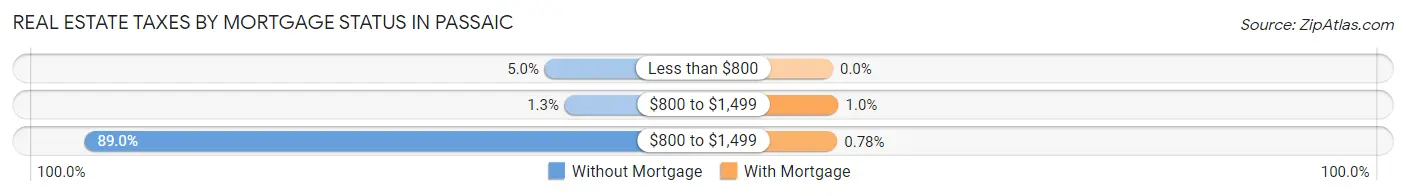
| Property Taxes | Without Mortgage | With Mortgage |
| Less than $800 | 74 (5.0%) | 0 (0.0%) |
| $800 to $1,499 | 20 (1.3%) | 30 (1.0%) |
| $800 to $1,499 | 1,324 (89.0%) | 23 (0.8%) |
| Total | 1,487 (100.0%) | 2,959 (100.0%) |
Health & Disability in Passaic
Health Insurance Coverage by Age in Passaic
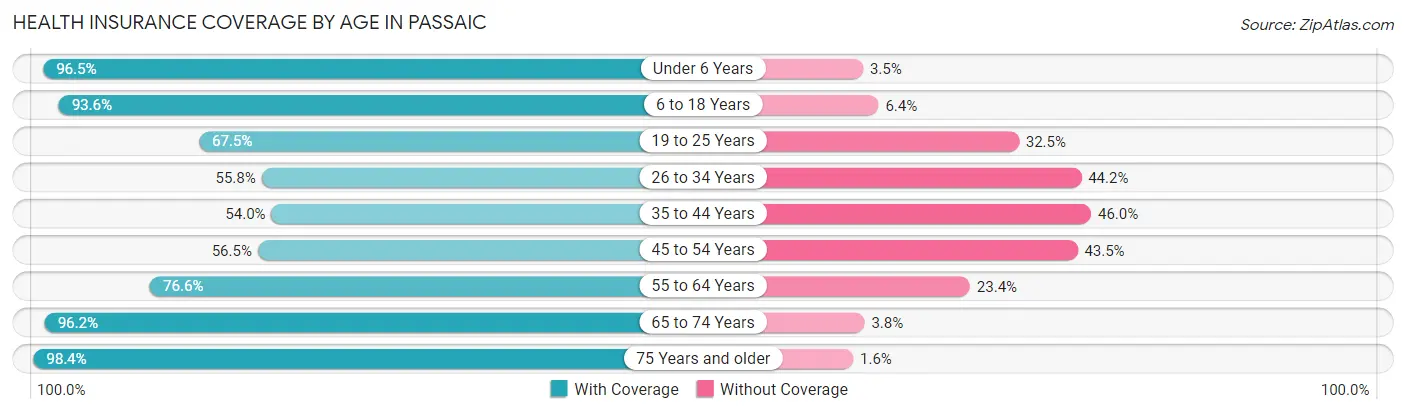
| Age Bracket | With Coverage | Without Coverage |
| Under 6 Years | 6,710 (96.5%) | 242 (3.5%) |
| 6 to 18 Years | 15,364 (93.6%) | 1,045 (6.4%) |
| 19 to 25 Years | 5,322 (67.5%) | 2,567 (32.5%) |
| 26 to 34 Years | 4,223 (55.8%) | 3,343 (44.2%) |
| 35 to 44 Years | 5,384 (54.0%) | 4,590 (46.0%) |
| 45 to 54 Years | 4,950 (56.5%) | 3,808 (43.5%) |
| 55 to 64 Years | 4,712 (76.6%) | 1,441 (23.4%) |
| 65 to 74 Years | 3,608 (96.2%) | 141 (3.8%) |
| 75 Years and older | 2,344 (98.4%) | 39 (1.6%) |
| Total | 52,617 (75.3%) | 17,216 (24.6%) |
Health Insurance Coverage by Citizenship Status in Passaic
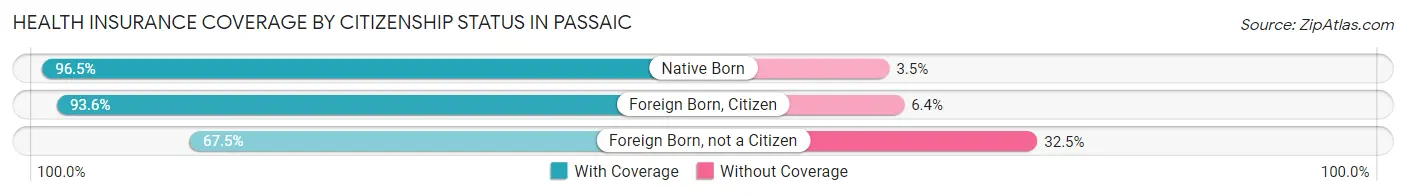
| Citizenship Status | With Coverage | Without Coverage |
| Native Born | 6,710 (96.5%) | 242 (3.5%) |
| Foreign Born, Citizen | 15,364 (93.6%) | 1,045 (6.4%) |
| Foreign Born, not a Citizen | 5,322 (67.5%) | 2,567 (32.5%) |
Health Insurance Coverage by Household Income in Passaic
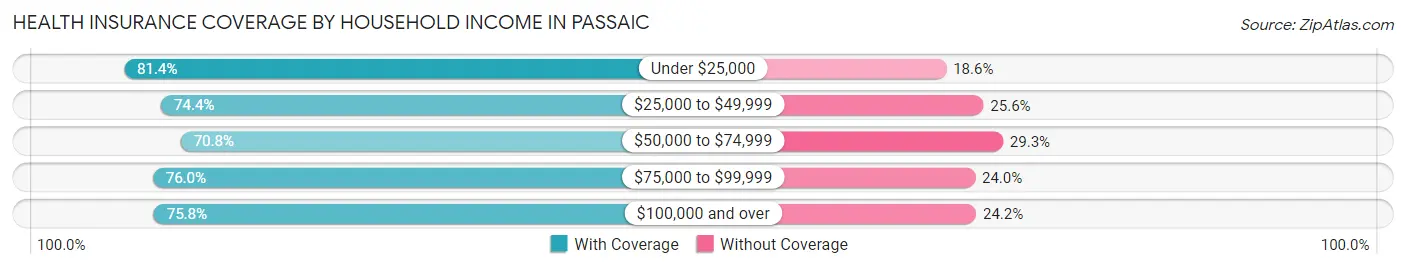
| Household Income | With Coverage | Without Coverage |
| Under $25,000 | 7,560 (81.4%) | 1,731 (18.6%) |
| $25,000 to $49,999 | 11,239 (74.4%) | 3,865 (25.6%) |
| $50,000 to $74,999 | 8,956 (70.8%) | 3,703 (29.2%) |
| $75,000 to $99,999 | 7,140 (76.0%) | 2,258 (24.0%) |
| $100,000 and over | 17,614 (75.8%) | 5,625 (24.2%) |
Public vs Private Health Insurance Coverage by Age in Passaic
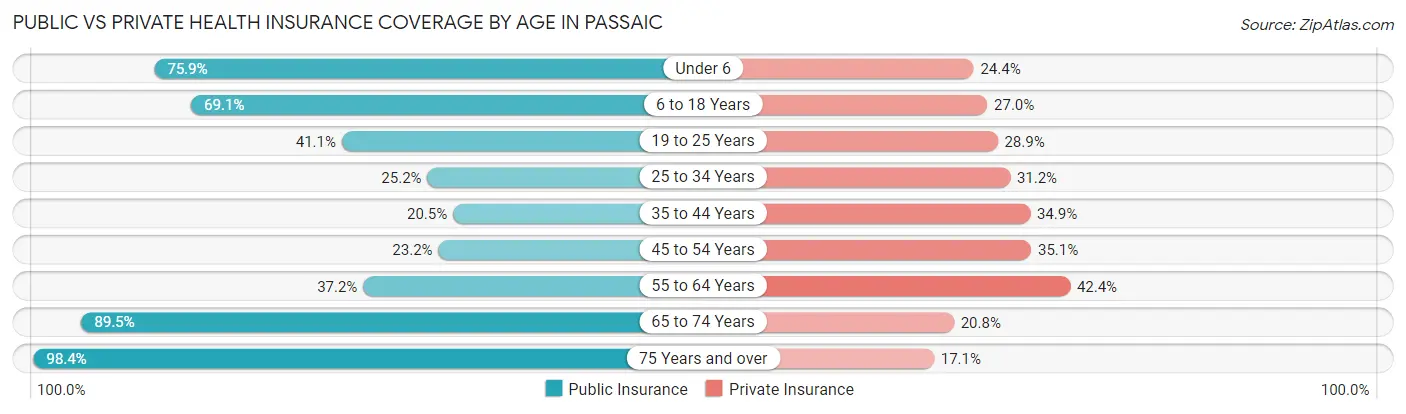
| Age Bracket | Public Insurance | Private Insurance |
| Under 6 | 5,278 (75.9%) | 1,699 (24.4%) |
| 6 to 18 Years | 11,338 (69.1%) | 4,426 (27.0%) |
| 19 to 25 Years | 3,245 (41.1%) | 2,280 (28.9%) |
| 25 to 34 Years | 1,909 (25.2%) | 2,361 (31.2%) |
| 35 to 44 Years | 2,042 (20.5%) | 3,484 (34.9%) |
| 45 to 54 Years | 2,031 (23.2%) | 3,077 (35.1%) |
| 55 to 64 Years | 2,286 (37.1%) | 2,606 (42.3%) |
| 65 to 74 Years | 3,354 (89.5%) | 779 (20.8%) |
| 75 Years and over | 2,344 (98.4%) | 407 (17.1%) |
| Total | 33,827 (48.4%) | 21,119 (30.2%) |
Disability Status by Sex by Age in Passaic
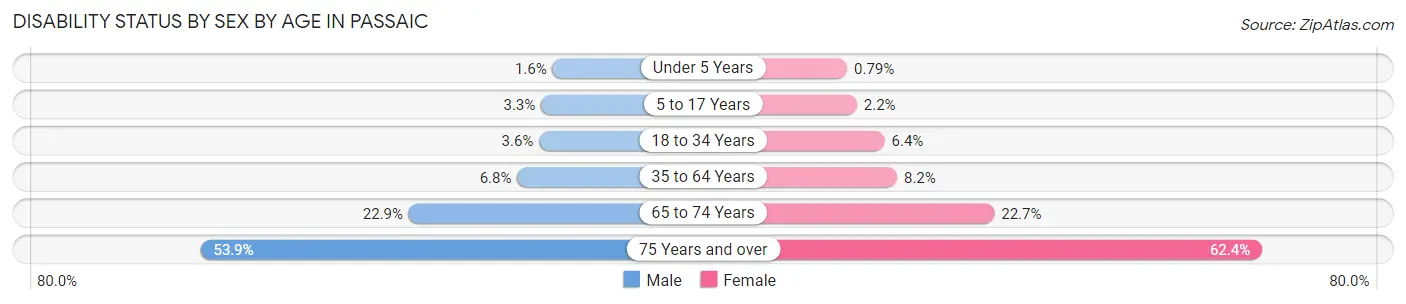
| Age Bracket | Male | Female |
| Under 5 Years | 44 (1.6%) | 24 (0.8%) |
| 5 to 17 Years | 245 (3.3%) | 195 (2.2%) |
| 18 to 34 Years | 310 (3.6%) | 527 (6.4%) |
| 35 to 64 Years | 835 (6.8%) | 1,039 (8.2%) |
| 65 to 74 Years | 386 (22.9%) | 468 (22.7%) |
| 75 Years and over | 449 (53.9%) | 967 (62.4%) |
Disability Class by Sex by Age in Passaic
Disability Class: Hearing Difficulty
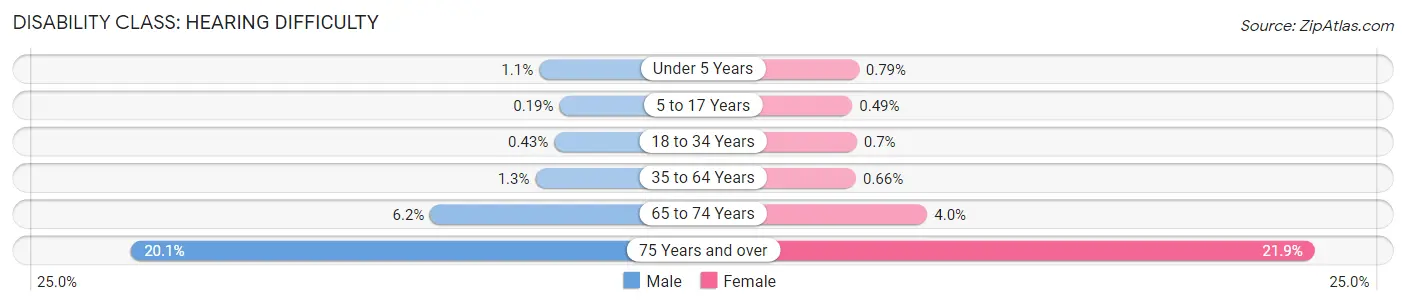
| Age Bracket | Male | Female |
| Under 5 Years | 31 (1.1%) | 24 (0.8%) |
| 5 to 17 Years | 14 (0.2%) | 43 (0.5%) |
| 18 to 34 Years | 37 (0.4%) | 58 (0.7%) |
| 35 to 64 Years | 159 (1.3%) | 84 (0.7%) |
| 65 to 74 Years | 104 (6.2%) | 82 (4.0%) |
| 75 Years and over | 167 (20.1%) | 340 (21.9%) |
Disability Class: Vision Difficulty
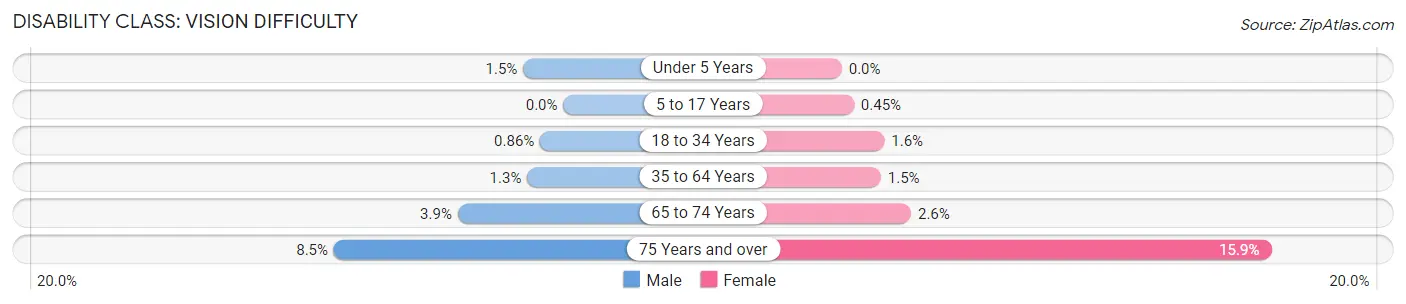
| Age Bracket | Male | Female |
| Under 5 Years | 41 (1.5%) | 0 (0.0%) |
| 5 to 17 Years | 0 (0.0%) | 39 (0.4%) |
| 18 to 34 Years | 74 (0.9%) | 131 (1.6%) |
| 35 to 64 Years | 163 (1.3%) | 184 (1.5%) |
| 65 to 74 Years | 66 (3.9%) | 53 (2.6%) |
| 75 Years and over | 71 (8.5%) | 247 (15.9%) |
Disability Class: Cognitive Difficulty
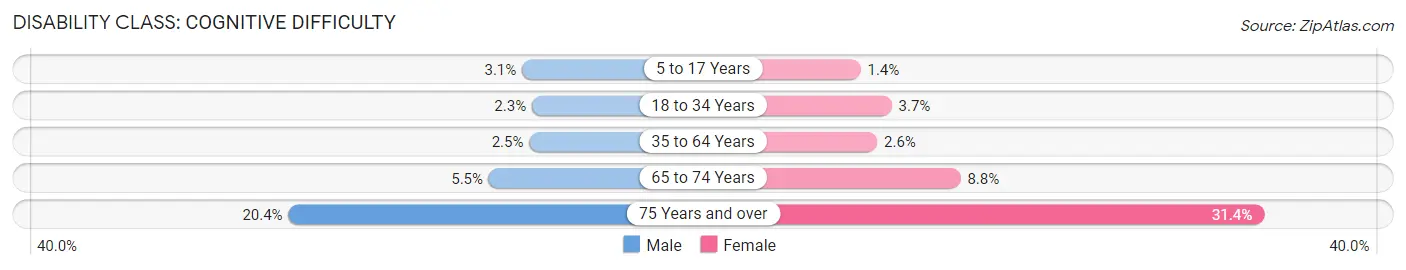
| Age Bracket | Male | Female |
| 5 to 17 Years | 227 (3.1%) | 121 (1.4%) |
| 18 to 34 Years | 201 (2.3%) | 306 (3.7%) |
| 35 to 64 Years | 309 (2.5%) | 332 (2.6%) |
| 65 to 74 Years | 93 (5.5%) | 182 (8.8%) |
| 75 Years and over | 170 (20.4%) | 486 (31.4%) |
Disability Class: Ambulatory Difficulty
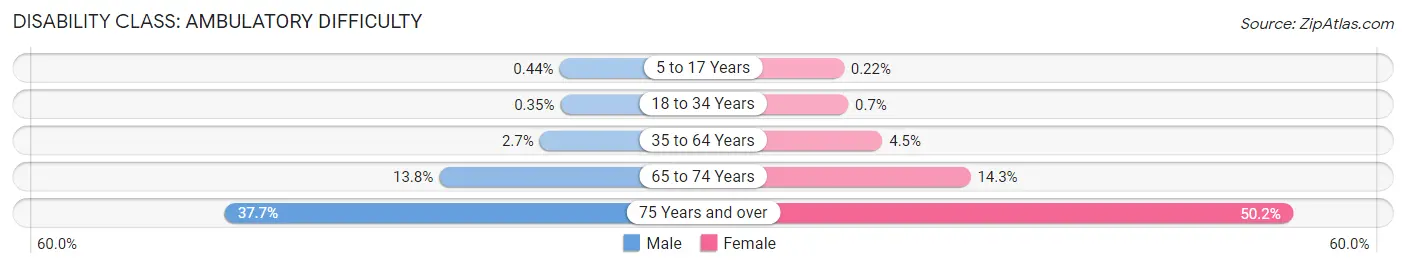
| Age Bracket | Male | Female |
| 5 to 17 Years | 33 (0.4%) | 19 (0.2%) |
| 18 to 34 Years | 30 (0.4%) | 58 (0.7%) |
| 35 to 64 Years | 324 (2.6%) | 572 (4.5%) |
| 65 to 74 Years | 233 (13.8%) | 296 (14.3%) |
| 75 Years and over | 314 (37.7%) | 778 (50.2%) |
Disability Class: Self-Care Difficulty
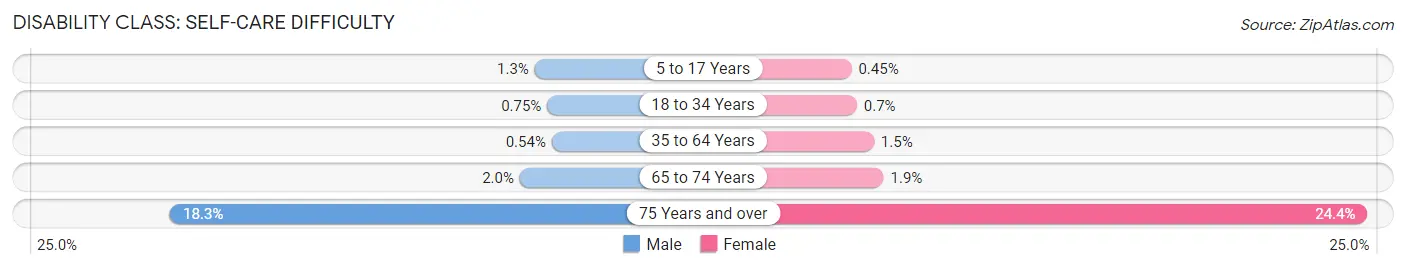
| Age Bracket | Male | Female |
| 5 to 17 Years | 99 (1.3%) | 39 (0.4%) |
| 18 to 34 Years | 65 (0.7%) | 58 (0.7%) |
| 35 to 64 Years | 66 (0.5%) | 189 (1.5%) |
| 65 to 74 Years | 34 (2.0%) | 40 (1.9%) |
| 75 Years and over | 152 (18.2%) | 378 (24.4%) |
Technology Access in Passaic
Computing Device Access in Passaic
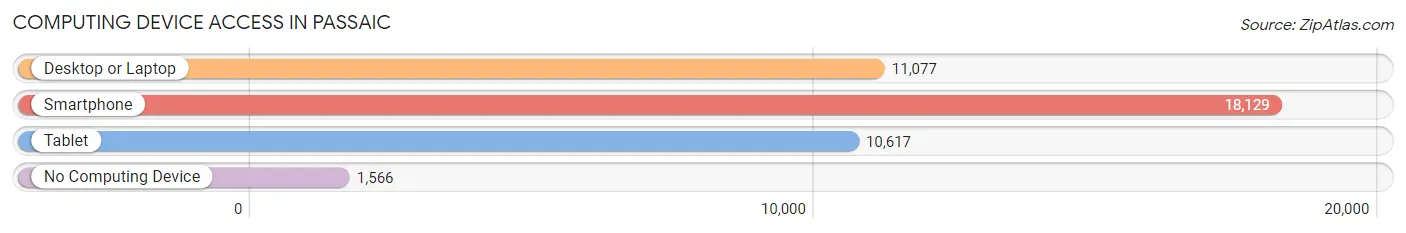
| Device Type | # Households | % Households |
| Desktop or Laptop | 11,077 | 54.9% |
| Smartphone | 18,129 | 89.8% |
| Tablet | 10,617 | 52.6% |
| No Computing Device | 1,566 | 7.8% |
| Total | 20,182 | 100.0% |
Internet Access in Passaic
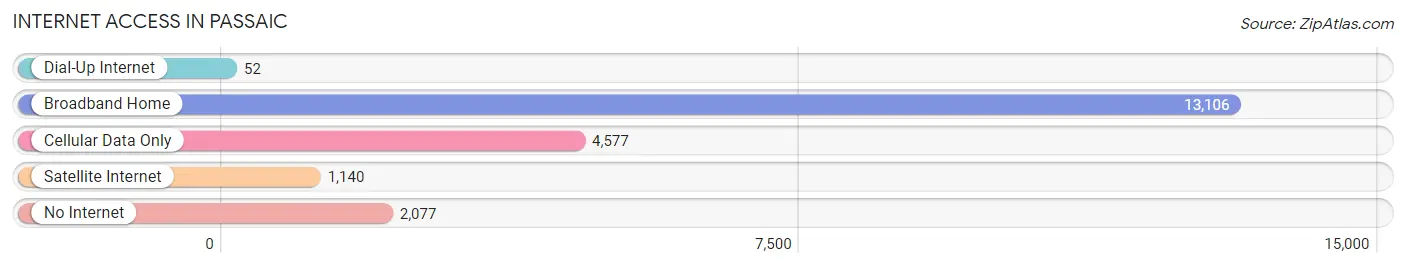
| Internet Type | # Households | % Households |
| Dial-Up Internet | 52 | 0.3% |
| Broadband Home | 13,106 | 64.9% |
| Cellular Data Only | 4,577 | 22.7% |
| Satellite Internet | 1,140 | 5.7% |
| No Internet | 2,077 | 10.3% |
| Total | 20,182 | 100.0% |
Passaic Summary
Passaic, NJ is a city located in Passaic County, New Jersey. It is situated in the northeastern part of the state, about 8 miles west of New York City. The city is bordered by Clifton, Paterson, Prospect Park, and Wallington. As of the 2010 United States Census, the city had a total population of 69,781, making it the 15th most populous municipality in New Jersey.
History
The area that is now Passaic was originally inhabited by the Lenape Native Americans. The first European settlers arrived in the area in the late 17th century, and the area was officially established as the Township of Acquackanonk in 1720. The name was derived from the Lenape word for “place of the big snake.” In 1791, the township was divided into two parts, and the northern part was renamed the Township of Passaic.
In 1837, the city of Passaic was incorporated as a separate municipality. The city quickly grew in the 19th century, and by the early 20th century, it had become a major industrial center. The city was home to a variety of industries, including textiles, chemicals, and rubber.
Geography
Passaic is located at 40°51'17" North, 74°09'45" West (40.854722, -74.1625). According to the United States Census Bureau, the city has a total area of 4.3 square miles, all of which is land.
The city is situated in the Passaic River Valley, and is bordered by the Passaic River to the east and the Passaic Valley to the west. The city is located in the northeastern part of the state, about 8 miles west of New York City.
Economy
Passaic has a diverse economy, with a variety of industries represented. The city is home to a number of manufacturing companies, including pharmaceuticals, chemicals, textiles, and rubber. The city is also home to a number of retail stores, restaurants, and other businesses.
The city is also home to a number of educational institutions, including Passaic County Community College, William Paterson University, and Berkeley College.
Demographics
As of the 2010 United States Census, there were 69,781 people, 24,945 households, and 16,945 families residing in the city. The population density was 16,093.3 people per square mile. The racial makeup of the city was 44.2% White, 28.2% African American, 0.5% Native American, 8.3% Asian, 0.1% Pacific Islander, 16.7% from other races, and 2.1% from two or more races. Hispanic or Latino of any race were 44.3% of the population.
The median income for a household in the city was $37,837, and the median income for a family was $45,837. The per capita income for the city was $18,945. About 18.3% of families and 22.2% of the population were below the poverty line, including 33.2% of those under age 18 and 16.2% of those age 65 or over.
Common Questions
What is Per Capita Income in Passaic?
Per Capita income in Passaic is $23,832.
What is the Median Family Income in Passaic?
Median Family Income in Passaic is $58,619.
What is the Median Household income in Passaic?
Median Household Income in Passaic is $57,832.
What is Income or Wage Gap in Passaic?
Income or Wage Gap in Passaic is 24.0%.
Women in Passaic earn 76.0 cents for every dollar earned by a man.
What is Family Income Deficit in Passaic?
Family Income Deficit in Passaic is $12,825.
Families that are below poverty line in Passaic earn $12,825 less on average than the poverty threshold level.
What is Inequality or Gini Index in Passaic?
Inequality or Gini Index in Passaic is 0.47.
What is the Total Population of Passaic?
Total Population of Passaic is 70,048.
What is the Total Male Population of Passaic?
Total Male Population of Passaic is 33,578.
What is the Total Female Population of Passaic?
Total Female Population of Passaic is 36,470.
What is the Ratio of Males per 100 Females in Passaic?
There are 92.07 Males per 100 Females in Passaic.
What is the Ratio of Females per 100 Males in Passaic?
There are 108.61 Females per 100 Males in Passaic.
What is the Median Population Age in Passaic?
Median Population Age in Passaic is 30.5 Years.
What is the Average Family Size in Passaic
Average Family Size in Passaic is 3.9 People.
What is the Average Household Size in Passaic
Average Household Size in Passaic is 3.5 People.
How Large is the Labor Force in Passaic?
There are 33,758 People in the Labor Forcein in Passaic.
What is the Percentage of People in the Labor Force in Passaic?
66.7% of People are in the Labor Force in Passaic.
What is the Unemployment Rate in Passaic?
Unemployment Rate in Passaic is 11.8%.