Cities with the Highest Percentage of Welsh Population in New Jersey
RELATED REPORTS & OPTIONS
Welsh
New Jersey
Compare Cities
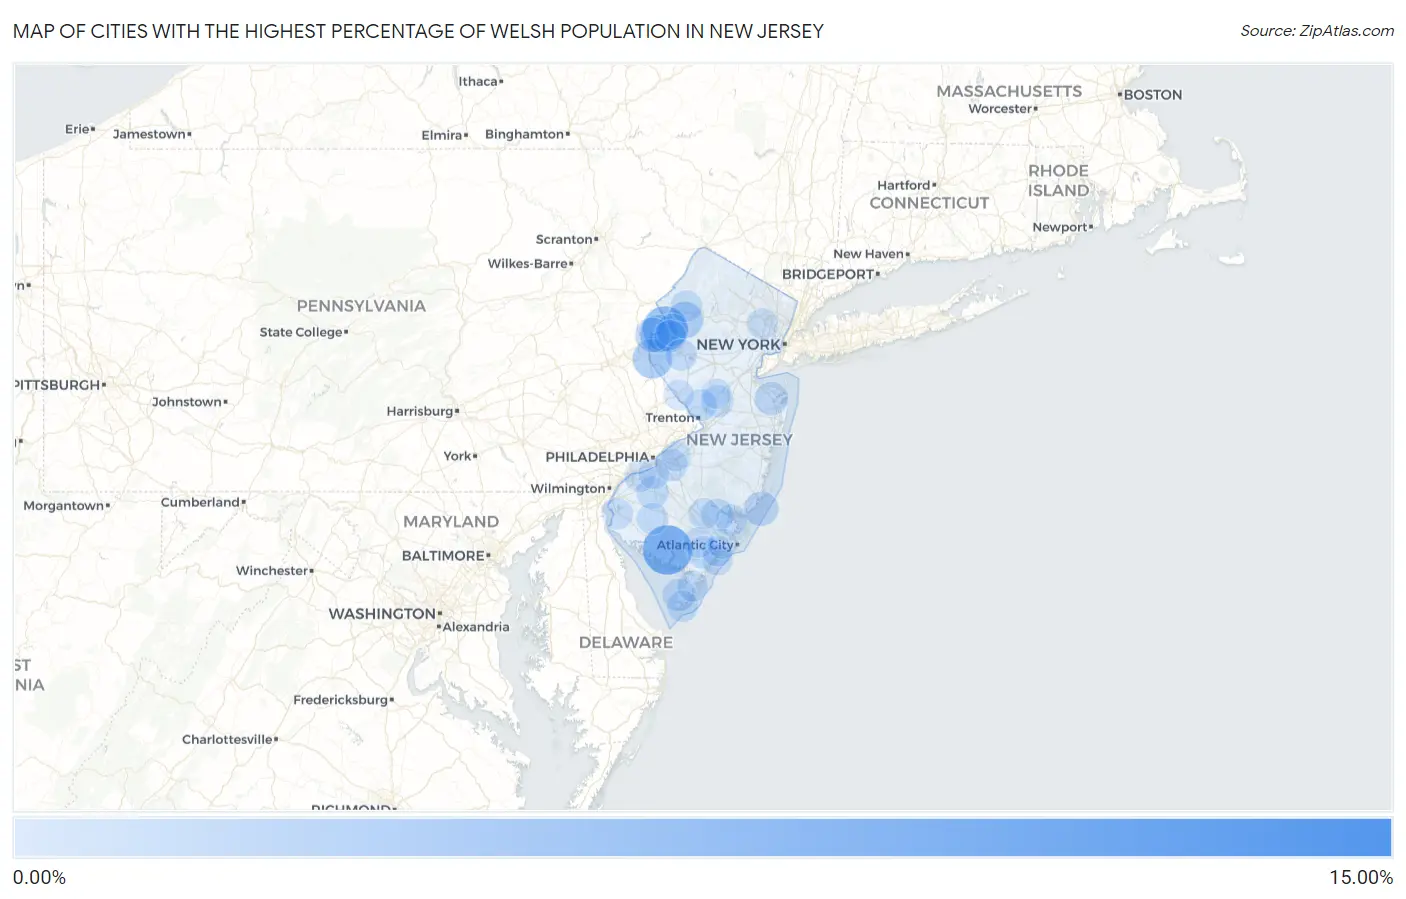
Map of Cities with the Highest Percentage of Welsh Population in New Jersey
0.00%
15.00%
Cities with the Highest Percentage of Welsh Population in New Jersey
| City | Welsh | vs State | vs National | |
| 1. | Seeley | 11.25% | 0.31%(+10.9)#1 | 0.52%(+10.7)#115 |
| 2. | Sewell | 9.23% | 0.31%(+8.91)#2 | 0.52%(+8.70)#171 |
| 3. | Swedesboro Borough | 7.61% | 0.31%(+7.30)#3 | 0.52%(+7.09)#233 |
| 4. | Laurel Lake | 7.16% | 0.31%(+6.85)#4 | 0.52%(+6.64)#263 |
| 5. | Cumberland-Hesstown | 6.28% | 0.31%(+5.97)#5 | 0.52%(+5.76)#337 |
| 6. | Brookfield | 5.68% | 0.31%(+5.37)#6 | 0.52%(+5.16)#388 |
| 7. | Crosswicks | 5.61% | 0.31%(+5.30)#7 | 0.52%(+5.09)#399 |
| 8. | Beesleys Point | 5.52% | 0.31%(+5.21)#8 | 0.52%(+5.00)#412 |
| 9. | Othello | 5.45% | 0.31%(+5.14)#9 | 0.52%(+4.93)#425 |
| 10. | Newtonville | 5.30% | 0.31%(+4.99)#10 | 0.52%(+4.78)#451 |
| 11. | Andover Borough | 4.15% | 0.31%(+3.84)#11 | 0.52%(+3.63)#701 |
| 12. | Finesville | 3.93% | 0.31%(+3.61)#12 | 0.52%(+3.40)#772 |
| 13. | Oldwick | 3.89% | 0.31%(+3.58)#13 | 0.52%(+3.37)#785 |
| 14. | Stone Harbor Borough | 3.83% | 0.31%(+3.52)#14 | 0.52%(+3.31)#799 |
| 15. | English Creek | 3.78% | 0.31%(+3.47)#15 | 0.52%(+3.26)#820 |
| 16. | Hutchinson | 3.48% | 0.31%(+3.16)#16 | 0.52%(+2.95)#955 |
| 17. | Fortescue | 3.45% | 0.31%(+3.13)#17 | 0.52%(+2.92)#975 |
| 18. | Paulsboro Borough | 3.28% | 0.31%(+2.96)#18 | 0.52%(+2.75)#1,064 |
| 19. | Avon By The Sea Borough | 3.18% | 0.31%(+2.87)#19 | 0.52%(+2.66)#1,122 |
| 20. | Vienna | 3.00% | 0.31%(+2.69)#20 | 0.52%(+2.48)#1,202 |
| 21. | Berlin Borough | 2.87% | 0.31%(+2.56)#21 | 0.52%(+2.35)#1,286 |
| 22. | Rainbow Lakes | 2.86% | 0.31%(+2.55)#22 | 0.52%(+2.34)#1,294 |
| 23. | Laurel Springs Borough | 2.74% | 0.31%(+2.43)#23 | 0.52%(+2.22)#1,390 |
| 24. | Brooklawn Borough | 2.59% | 0.31%(+2.27)#24 | 0.52%(+2.06)#1,540 |
| 25. | Ocean View | 2.56% | 0.31%(+2.25)#25 | 0.52%(+2.04)#1,571 |
| 26. | Riverton Borough | 2.42% | 0.31%(+2.11)#26 | 0.52%(+1.90)#1,710 |
| 27. | Brainards | 2.41% | 0.31%(+2.10)#27 | 0.52%(+1.89)#1,730 |
| 28. | Medford Lakes Borough | 2.39% | 0.31%(+2.08)#28 | 0.52%(+1.87)#1,754 |
| 29. | Malaga | 2.36% | 0.31%(+2.04)#29 | 0.52%(+1.83)#1,794 |
| 30. | North Beach Haven | 2.36% | 0.31%(+2.04)#30 | 0.52%(+1.83)#1,798 |
| 31. | Barrington Borough | 2.31% | 0.31%(+1.99)#31 | 0.52%(+1.78)#1,845 |
| 32. | Avalon Borough | 2.26% | 0.31%(+1.95)#32 | 0.52%(+1.74)#1,892 |
| 33. | Silver Lake | 2.23% | 0.31%(+1.92)#33 | 0.52%(+1.71)#1,933 |
| 34. | Marmora | 2.23% | 0.31%(+1.91)#34 | 0.52%(+1.71)#1,938 |
| 35. | Wenonah Borough | 2.21% | 0.31%(+1.90)#35 | 0.52%(+1.69)#1,961 |
| 36. | Green | 2.09% | 0.31%(+1.78)#36 | 0.52%(+1.57)#2,105 |
| 37. | Lincroft | 2.05% | 0.31%(+1.73)#37 | 0.52%(+1.52)#2,166 |
| 38. | Carlls Corner | 2.01% | 0.31%(+1.70)#38 | 0.52%(+1.49)#2,231 |
| 39. | Collingswood Borough | 2.00% | 0.31%(+1.69)#39 | 0.52%(+1.48)#2,256 |
| 40. | Palmyra Borough | 1.94% | 0.31%(+1.62)#40 | 0.52%(+1.41)#2,379 |
| 41. | Woodbury Heights Borough | 1.91% | 0.31%(+1.59)#41 | 0.52%(+1.38)#2,424 |
| 42. | Oxford | 1.84% | 0.31%(+1.53)#42 | 0.52%(+1.32)#2,532 |
| 43. | Peapack And Gladstone Borough | 1.84% | 0.31%(+1.52)#43 | 0.52%(+1.31)#2,541 |
| 44. | Auburn | 1.79% | 0.31%(+1.47)#44 | 0.52%(+1.26)#2,628 |
| 45. | Netcong Borough | 1.78% | 0.31%(+1.46)#45 | 0.52%(+1.26)#2,646 |
| 46. | Villas | 1.76% | 0.31%(+1.45)#46 | 0.52%(+1.24)#2,679 |
| 47. | Barclay | 1.75% | 0.31%(+1.44)#47 | 0.52%(+1.23)#2,705 |
| 48. | Egg Harbor City | 1.74% | 0.31%(+1.42)#48 | 0.52%(+1.21)#2,745 |
| 49. | Corbin City | 1.72% | 0.31%(+1.41)#49 | 0.52%(+1.20)#2,776 |
| 50. | Plainsboro Center | 1.70% | 0.31%(+1.38)#50 | 0.52%(+1.17)#2,833 |
| 51. | Richwood | 1.67% | 0.31%(+1.35)#51 | 0.52%(+1.14)#2,902 |
| 52. | Westmont | 1.65% | 0.31%(+1.33)#52 | 0.52%(+1.12)#2,947 |
| 53. | Penns Grove Borough | 1.63% | 0.31%(+1.32)#53 | 0.52%(+1.11)#2,970 |
| 54. | Brass Castle | 1.63% | 0.31%(+1.32)#54 | 0.52%(+1.11)#2,971 |
| 55. | Ogdensburg Borough | 1.58% | 0.31%(+1.27)#55 | 0.52%(+1.06)#3,100 |
| 56. | Lawrenceville | 1.52% | 0.31%(+1.20)#56 | 0.52%(+0.992)#3,271 |
| 57. | Olivet | 1.50% | 0.31%(+1.18)#57 | 0.52%(+0.974)#3,319 |
| 58. | Johnsonburg | 1.49% | 0.31%(+1.17)#58 | 0.52%(+0.965)#3,347 |
| 59. | Packanack Lake | 1.47% | 0.31%(+1.16)#59 | 0.52%(+0.947)#3,386 |
| 60. | Cape May | 1.46% | 0.31%(+1.14)#60 | 0.52%(+0.932)#3,440 |
| 61. | Clinton | 1.44% | 0.31%(+1.13)#61 | 0.52%(+0.917)#3,485 |
| 62. | Port Republic | 1.43% | 0.31%(+1.11)#62 | 0.52%(+0.904)#3,525 |
| 63. | Folsom Borough | 1.42% | 0.31%(+1.11)#63 | 0.52%(+0.895)#3,554 |
| 64. | Haddonfield Borough | 1.39% | 0.31%(+1.07)#64 | 0.52%(+0.864)#3,647 |
| 65. | Runnemede Borough | 1.35% | 0.31%(+1.03)#65 | 0.52%(+0.824)#3,799 |
| 66. | Salem | 1.34% | 0.31%(+1.03)#66 | 0.52%(+0.819)#3,814 |
| 67. | Gibbstown | 1.33% | 0.31%(+1.01)#67 | 0.52%(+0.801)#3,867 |
| 68. | Shiloh Borough | 1.31% | 0.31%(+0.997)#68 | 0.52%(+0.787)#3,915 |
| 69. | Elwood | 1.31% | 0.31%(+0.991)#69 | 0.52%(+0.781)#3,939 |
| 70. | Atco | 1.30% | 0.31%(+0.990)#70 | 0.52%(+0.780)#3,946 |
| 71. | Haworth Borough | 1.29% | 0.31%(+0.972)#71 | 0.52%(+0.762)#4,023 |
| 72. | Lower Berkshire Valley | 1.27% | 0.31%(+0.959)#72 | 0.52%(+0.749)#4,059 |
| 73. | Cape May Court House | 1.26% | 0.31%(+0.945)#73 | 0.52%(+0.735)#4,108 |
| 74. | Newfield Borough | 1.26% | 0.31%(+0.942)#74 | 0.52%(+0.732)#4,124 |
| 75. | Spring Lake Heights Borough | 1.25% | 0.31%(+0.940)#75 | 0.52%(+0.730)#4,137 |
| 76. | Rockaway Borough | 1.23% | 0.31%(+0.915)#76 | 0.52%(+0.705)#4,223 |
| 77. | Wood Ridge Borough | 1.22% | 0.31%(+0.908)#77 | 0.52%(+0.698)#4,251 |
| 78. | Woodbury | 1.22% | 0.31%(+0.908)#78 | 0.52%(+0.698)#4,254 |
| 79. | Monmouth Beach Borough | 1.22% | 0.31%(+0.905)#79 | 0.52%(+0.695)#4,265 |
| 80. | Upper Montclair | 1.21% | 0.31%(+0.899)#80 | 0.52%(+0.689)#4,289 |
| 81. | Woodland Park Borough | 1.19% | 0.31%(+0.874)#81 | 0.52%(+0.664)#4,391 |
| 82. | Highlands Borough | 1.18% | 0.31%(+0.869)#82 | 0.52%(+0.659)#4,409 |
| 83. | Longport Borough | 1.16% | 0.31%(+0.845)#83 | 0.52%(+0.635)#4,513 |
| 84. | Estell Manor | 1.16% | 0.31%(+0.842)#84 | 0.52%(+0.632)#4,522 |
| 85. | Pitman Borough | 1.15% | 0.31%(+0.832)#85 | 0.52%(+0.623)#4,560 |
| 86. | Ocean City | 1.14% | 0.31%(+0.822)#86 | 0.52%(+0.612)#4,608 |
| 87. | Surf City Borough | 1.13% | 0.31%(+0.817)#87 | 0.52%(+0.608)#4,623 |
| 88. | Somers Point | 1.12% | 0.31%(+0.802)#88 | 0.52%(+0.592)#4,697 |
| 89. | Allentown Borough | 1.10% | 0.31%(+0.786)#89 | 0.52%(+0.576)#4,767 |
| 90. | Lambertville | 1.09% | 0.31%(+0.776)#90 | 0.52%(+0.566)#4,820 |
| 91. | Ringoes | 1.08% | 0.31%(+0.767)#91 | 0.52%(+0.557)#4,869 |
| 92. | Liberty Corner | 1.08% | 0.31%(+0.766)#92 | 0.52%(+0.556)#4,875 |
| 93. | Bridgewater Center | 1.06% | 0.31%(+0.750)#93 | 0.52%(+0.540)#4,950 |
| 94. | Highland Park Borough | 1.05% | 0.31%(+0.732)#94 | 0.52%(+0.523)#5,035 |
| 95. | Moorestown Lenola | 1.04% | 0.31%(+0.722)#95 | 0.52%(+0.512)#5,093 |
| 96. | Lake Hopatcong | 1.02% | 0.31%(+0.706)#96 | 0.52%(+0.497)#5,168 |
| 97. | Haddon Heights Borough | 1.02% | 0.31%(+0.701)#97 | 0.52%(+0.491)#5,212 |
| 98. | Kingston | 1.01% | 0.31%(+0.694)#98 | 0.52%(+0.484)#5,240 |
| 99. | Northfield | 1.00% | 0.31%(+0.682)#99 | 0.52%(+0.472)#5,322 |
| 100. | Harrington Park Borough | 0.99% | 0.31%(+0.680)#100 | 0.52%(+0.470)#5,330 |
Common Questions
What are the Top 10 Cities with the Highest Percentage of Welsh Population in New Jersey?
Top 10 Cities with the Highest Percentage of Welsh Population in New Jersey are:
#1
7.16%
#2
5.68%
#3
3.93%
#4
3.48%
#5
3.00%
#6
2.41%
#7
2.36%
#8
2.05%
#9
1.84%
#10
1.76%
What city has the Highest Percentage of Welsh Population in New Jersey?
Laurel Lake has the Highest Percentage of Welsh Population in New Jersey with 7.16%.
What is the Percentage of Welsh Population in the State of New Jersey?
Percentage of Welsh Population in New Jersey is 0.31%.
What is the Percentage of Welsh Population in the United States?
Percentage of Welsh Population in the United States is 0.52%.