Cities with the Most Immigrants from Western Africa in New Jersey
RELATED REPORTS & OPTIONS
Western Africa
New Jersey
Compare Cities
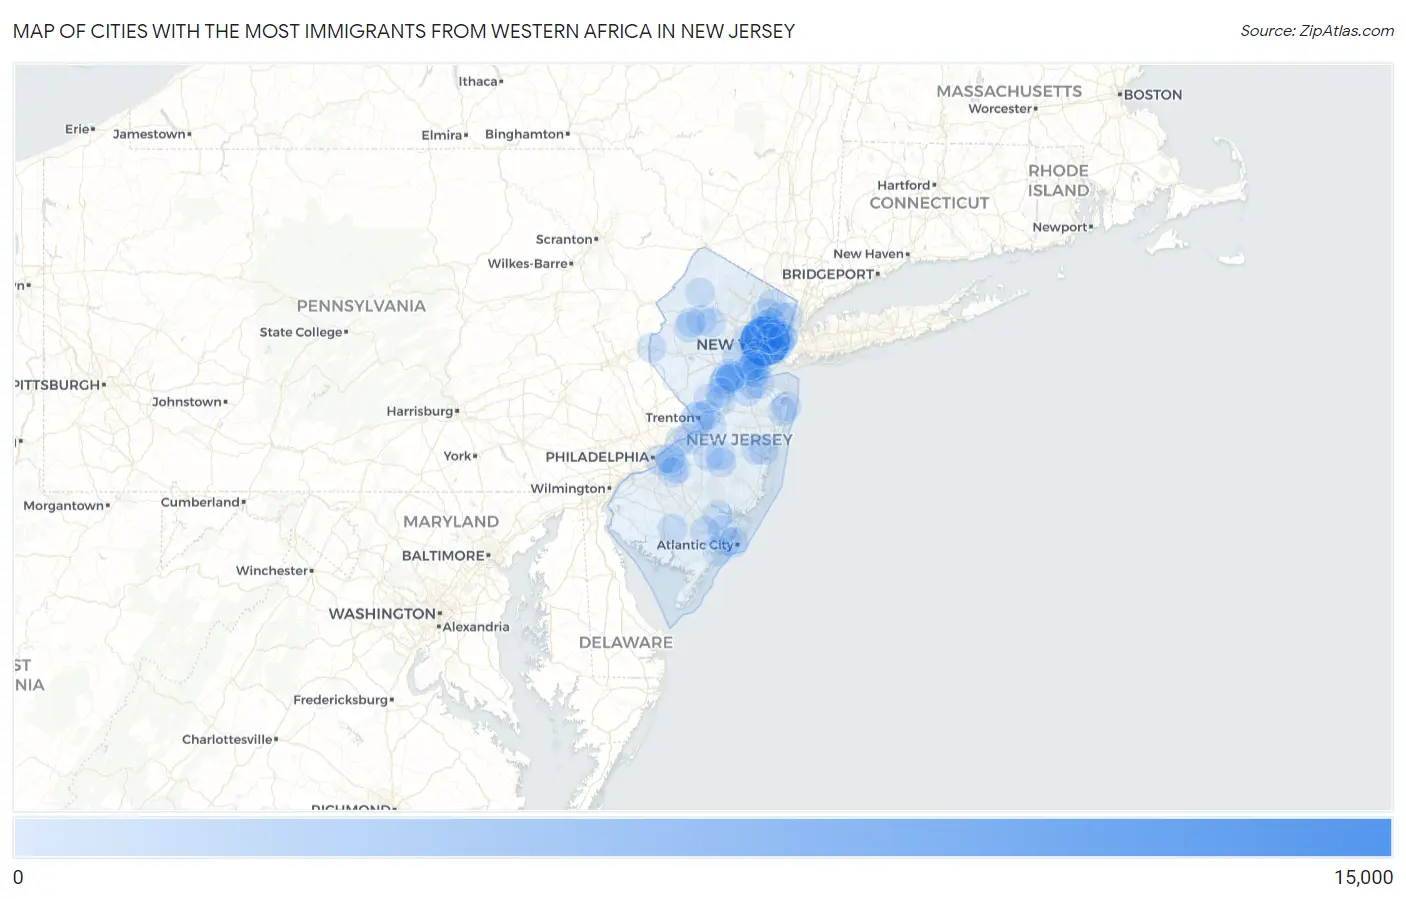
Map of Cities with the Most Immigrants from Western Africa in New Jersey
0
15,000
Cities with the Most Immigrants from Western Africa in New Jersey
| City | Western Africa | vs State | vs National | |
| 1. | Newark | 13,801 | 61,458(22.46%)#1 | 985,560(1.40%)#6 |
| 2. | East Orange | 2,622 | 61,458(4.27%)#2 | 985,560(0.27%)#37 |
| 3. | Trenton | 2,588 | 61,458(4.21%)#3 | 985,560(0.26%)#38 |
| 4. | Jersey City | 2,369 | 61,458(3.85%)#4 | 985,560(0.24%)#45 |
| 5. | Elizabeth | 953 | 61,458(1.55%)#5 | 985,560(0.10%)#143 |
| 6. | Sayreville Borough | 914 | 61,458(1.49%)#6 | 985,560(0.09%)#149 |
| 7. | Sicklerville | 703 | 61,458(1.14%)#7 | 985,560(0.07%)#192 |
| 8. | Paterson | 631 | 61,458(1.03%)#8 | 985,560(0.06%)#226 |
| 9. | Fords | 533 | 61,458(0.87%)#9 | 985,560(0.05%)#266 |
| 10. | Vauxhall | 528 | 61,458(0.86%)#10 | 985,560(0.05%)#272 |
| 11. | Hackensack | 503 | 61,458(0.82%)#11 | 985,560(0.05%)#286 |
| 12. | Camden | 430 | 61,458(0.70%)#12 | 985,560(0.04%)#328 |
| 13. | Madison Park | 410 | 61,458(0.67%)#13 | 985,560(0.04%)#348 |
| 14. | New Brunswick | 390 | 61,458(0.63%)#14 | 985,560(0.04%)#364 |
| 15. | Franklin Park | 390 | 61,458(0.63%)#15 | 985,560(0.04%)#365 |
| 16. | Linden | 389 | 61,458(0.63%)#16 | 985,560(0.04%)#366 |
| 17. | Plainfield | 380 | 61,458(0.62%)#17 | 985,560(0.04%)#372 |
| 18. | Roselle Borough | 374 | 61,458(0.61%)#18 | 985,560(0.04%)#381 |
| 19. | Carteret Borough | 351 | 61,458(0.57%)#19 | 985,560(0.04%)#397 |
| 20. | Parsippany | 335 | 61,458(0.55%)#20 | 985,560(0.03%)#415 |
| 21. | Toms River | 306 | 61,458(0.50%)#21 | 985,560(0.03%)#452 |
| 22. | Burlington | 301 | 61,458(0.49%)#22 | 985,560(0.03%)#460 |
| 23. | Lindenwold Borough | 284 | 61,458(0.46%)#23 | 985,560(0.03%)#489 |
| 24. | Woodbridge | 265 | 61,458(0.43%)#24 | 985,560(0.03%)#523 |
| 25. | Bayonne | 256 | 61,458(0.42%)#25 | 985,560(0.03%)#539 |
| 26. | Lodi Borough | 251 | 61,458(0.41%)#26 | 985,560(0.03%)#549 |
| 27. | Somerset | 250 | 61,458(0.41%)#27 | 985,560(0.03%)#554 |
| 28. | Bergenfield Borough | 249 | 61,458(0.41%)#28 | 985,560(0.03%)#558 |
| 29. | Budd Lake | 244 | 61,458(0.40%)#29 | 985,560(0.02%)#569 |
| 30. | Vineland | 219 | 61,458(0.36%)#30 | 985,560(0.02%)#606 |
| 31. | Old Bridge | 209 | 61,458(0.34%)#31 | 985,560(0.02%)#623 |
| 32. | Secaucus | 194 | 61,458(0.32%)#32 | 985,560(0.02%)#667 |
| 33. | Englewood | 173 | 61,458(0.28%)#33 | 985,560(0.02%)#728 |
| 34. | Union City | 166 | 61,458(0.27%)#34 | 985,560(0.02%)#752 |
| 35. | Ampere North | 165 | 61,458(0.27%)#35 | 985,560(0.02%)#764 |
| 36. | Pompton Plains | 149 | 61,458(0.24%)#36 | 985,560(0.02%)#836 |
| 37. | Bargaintown | 148 | 61,458(0.24%)#37 | 985,560(0.02%)#839 |
| 38. | Six Mile Run | 143 | 61,458(0.23%)#38 | 985,560(0.01%)#858 |
| 39. | Kearny | 142 | 61,458(0.23%)#39 | 985,560(0.01%)#861 |
| 40. | Hightstown Borough | 140 | 61,458(0.23%)#40 | 985,560(0.01%)#875 |
| 41. | Hillsborough | 137 | 61,458(0.22%)#41 | 985,560(0.01%)#890 |
| 42. | Pleasantville | 135 | 61,458(0.22%)#42 | 985,560(0.01%)#900 |
| 43. | Avenel | 133 | 61,458(0.22%)#43 | 985,560(0.01%)#912 |
| 44. | Princeton Meadows | 133 | 61,458(0.22%)#44 | 985,560(0.01%)#913 |
| 45. | Mercerville | 129 | 61,458(0.21%)#45 | 985,560(0.01%)#932 |
| 46. | Fair Lawn Borough | 120 | 61,458(0.20%)#46 | 985,560(0.01%)#969 |
| 47. | Perth Amboy | 115 | 61,458(0.19%)#47 | 985,560(0.01%)#1,000 |
| 48. | East Franklin | 115 | 61,458(0.19%)#48 | 985,560(0.01%)#1,003 |
| 49. | Egg Harbor City | 103 | 61,458(0.17%)#49 | 985,560(0.01%)#1,063 |
| 50. | Tenafly Borough | 102 | 61,458(0.17%)#50 | 985,560(0.01%)#1,070 |
| 51. | Pemberton Heights | 102 | 61,458(0.17%)#51 | 985,560(0.01%)#1,071 |
| 52. | Highland Park Borough | 98 | 61,458(0.16%)#52 | 985,560(0.01%)#1,104 |
| 53. | Forsgate | 97 | 61,458(0.16%)#53 | 985,560(0.01%)#1,111 |
| 54. | Beattystown | 96 | 61,458(0.16%)#54 | 985,560(0.01%)#1,125 |
| 55. | Kingston Estates | 92 | 61,458(0.15%)#55 | 985,560(0.01%)#1,148 |
| 56. | Phillipsburg | 90 | 61,458(0.15%)#56 | 985,560(0.01%)#1,166 |
| 57. | Cliffside Park Borough | 89 | 61,458(0.14%)#57 | 985,560(0.01%)#1,172 |
| 58. | Voorhees | 89 | 61,458(0.14%)#58 | 985,560(0.01%)#1,179 |
| 59. | Princeton | 85 | 61,458(0.14%)#59 | 985,560(0.01%)#1,212 |
| 60. | South Plainfield Borough | 85 | 61,458(0.14%)#60 | 985,560(0.01%)#1,213 |
| 61. | Browns Mills | 83 | 61,458(0.14%)#61 | 985,560(0.01%)#1,234 |
| 62. | Presidential Lakes Estates | 83 | 61,458(0.14%)#62 | 985,560(0.01%)#1,237 |
| 63. | Glassboro Borough | 80 | 61,458(0.13%)#63 | 985,560(0.01%)#1,255 |
| 64. | Echelon | 80 | 61,458(0.13%)#64 | 985,560(0.01%)#1,260 |
| 65. | Port Reading | 80 | 61,458(0.13%)#65 | 985,560(0.01%)#1,263 |
| 66. | Peapack And Gladstone Borough | 80 | 61,458(0.13%)#66 | 985,560(0.01%)#1,264 |
| 67. | Long Branch | 79 | 61,458(0.13%)#67 | 985,560(0.01%)#1,269 |
| 68. | Oakhurst | 79 | 61,458(0.13%)#68 | 985,560(0.01%)#1,273 |
| 69. | Atlantic City | 76 | 61,458(0.12%)#69 | 985,560(0.01%)#1,297 |
| 70. | Somers Point | 76 | 61,458(0.12%)#70 | 985,560(0.01%)#1,302 |
| 71. | Heathcote | 75 | 61,458(0.12%)#71 | 985,560(0.01%)#1,309 |
| 72. | Dumont Borough | 74 | 61,458(0.12%)#72 | 985,560(0.01%)#1,316 |
| 73. | Hoboken | 72 | 61,458(0.12%)#73 | 985,560(0.01%)#1,331 |
| 74. | Groveville | 71 | 61,458(0.12%)#74 | 985,560(0.01%)#1,350 |
| 75. | Ridgewood | 66 | 61,458(0.11%)#75 | 985,560(0.01%)#1,413 |
| 76. | Pine Lake Park | 66 | 61,458(0.11%)#76 | 985,560(0.01%)#1,419 |
| 77. | Beverly | 65 | 61,458(0.11%)#77 | 985,560(0.01%)#1,430 |
| 78. | Succasunna | 61 | 61,458(0.10%)#78 | 985,560(0.01%)#1,487 |
| 79. | Collingswood Borough | 59 | 61,458(0.10%)#79 | 985,560(0.01%)#1,513 |
| 80. | Raritan Borough | 57 | 61,458(0.09%)#80 | 985,560(0.01%)#1,540 |
| 81. | Fort Lee Borough | 56 | 61,458(0.09%)#81 | 985,560(0.01%)#1,545 |
| 82. | Harrison | 56 | 61,458(0.09%)#82 | 985,560(0.01%)#1,551 |
| 83. | Brookdale | 54 | 61,458(0.09%)#83 | 985,560(0.01%)#1,585 |
| 84. | Hackettstown | 51 | 61,458(0.08%)#84 | 985,560(0.01%)#1,631 |
| 85. | Cliffwood Beach | 48 | 61,458(0.08%)#85 | 985,560(0.00%)#1,687 |
| 86. | Wood Ridge Borough | 47 | 61,458(0.08%)#86 | 985,560(0.00%)#1,698 |
| 87. | Newton | 46 | 61,458(0.07%)#87 | 985,560(0.00%)#1,714 |
| 88. | South River Borough | 44 | 61,458(0.07%)#88 | 985,560(0.00%)#1,749 |
| 89. | Caldwell Borough | 44 | 61,458(0.07%)#89 | 985,560(0.00%)#1,757 |
| 90. | Westville Borough | 42 | 61,458(0.07%)#90 | 985,560(0.00%)#1,807 |
| 91. | Passaic | 41 | 61,458(0.07%)#91 | 985,560(0.00%)#1,812 |
| 92. | Roselle Park Borough | 41 | 61,458(0.07%)#92 | 985,560(0.00%)#1,822 |
| 93. | Fairview Borough | 40 | 61,458(0.07%)#93 | 985,560(0.00%)#1,850 |
| 94. | Short Hills | 40 | 61,458(0.07%)#94 | 985,560(0.00%)#1,851 |
| 95. | Great Notch | 40 | 61,458(0.07%)#95 | 985,560(0.00%)#1,858 |
| 96. | Springdale | 39 | 61,458(0.06%)#96 | 985,560(0.00%)#1,867 |
| 97. | Cherry Hill Mall | 38 | 61,458(0.06%)#97 | 985,560(0.00%)#1,893 |
| 98. | Pomona | 38 | 61,458(0.06%)#98 | 985,560(0.00%)#1,895 |
| 99. | Iselin | 37 | 61,458(0.06%)#99 | 985,560(0.00%)#1,910 |
| 100. | Mays Landing | 35 | 61,458(0.06%)#100 | 985,560(0.00%)#1,959 |
Common Questions
What are the Top 10 Cities with the Most Immigrants from Western Africa in New Jersey?
Top 10 Cities with the Most Immigrants from Western Africa in New Jersey are:
#1
13,801
#2
2,622
#3
2,588
#4
2,369
#5
953
#6
631
#7
533
#8
503
#9
430
#10
410
What city has the Most Immigrants from Western Africa in New Jersey?
Newark has the Most Immigrants from Western Africa in New Jersey with 13,801.
What is the Total Immigrants from Western Africa in the State of New Jersey?
Total Immigrants from Western Africa in New Jersey is 61,458.
What is the Total Immigrants from Western Africa in the United States?
Total Immigrants from Western Africa in the United States is 985,560.