Cities with the Highest Percentage of Immigrants from Nigeria in New Jersey
RELATED REPORTS & OPTIONS
Nigeria
New Jersey
Compare Cities
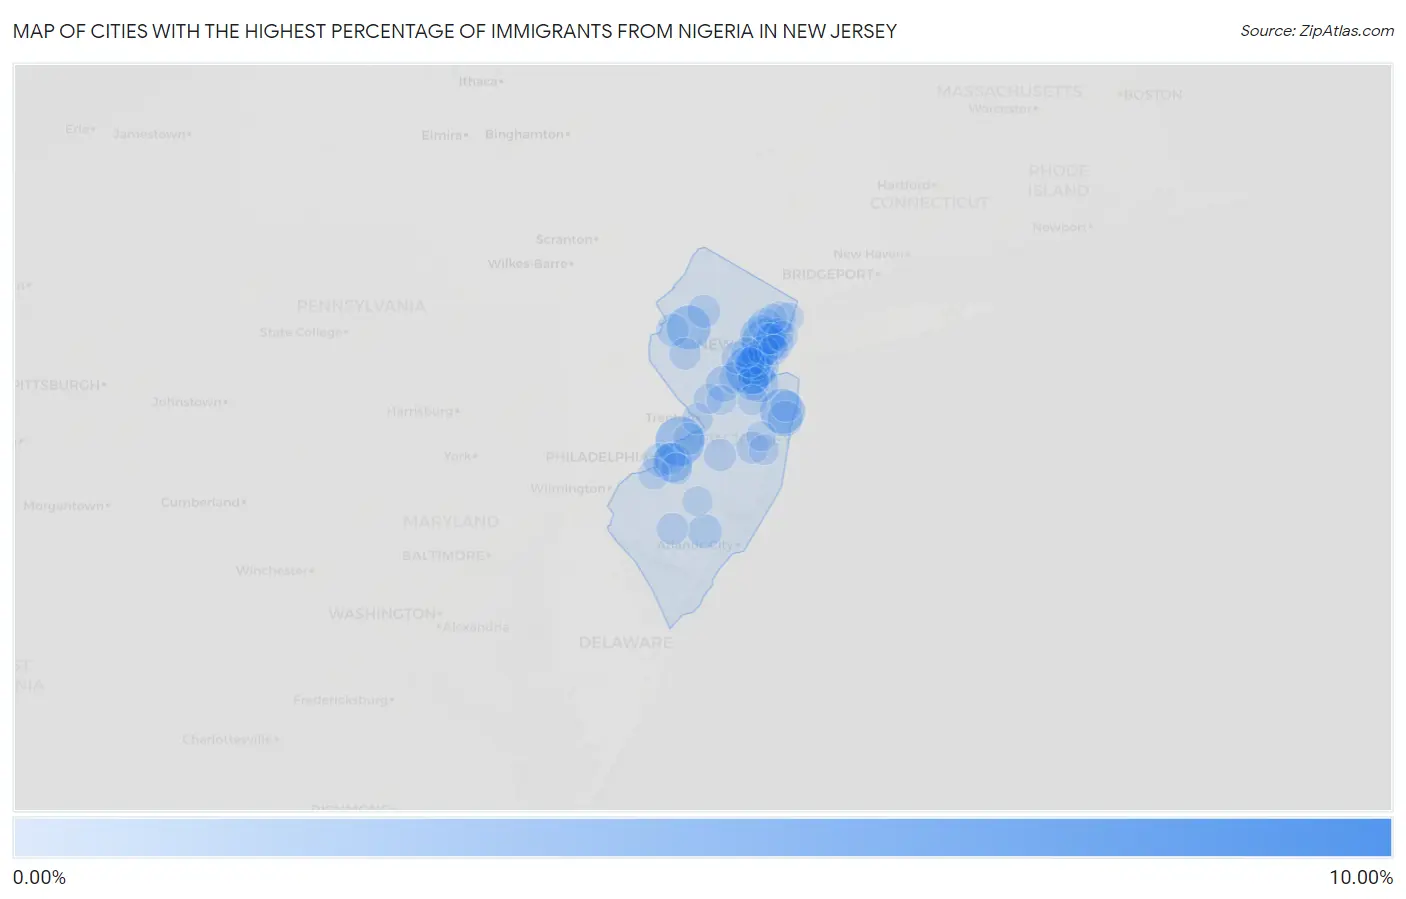
Map of Cities with the Highest Percentage of Immigrants from Nigeria in New Jersey
0.00%
10.00%
Cities with the Highest Percentage of Immigrants from Nigeria in New Jersey
| City | Nigeria | vs State | vs National | |
| 1. | Vauxhall | 8.84% | 0.27%(+8.56)#-1 | 0.13%(+8.71)#0 |
| 2. | Forsgate | 4.22% | 0.27%(+3.94)#0 | 0.13%(+4.09)#1 |
| 3. | Peapack And Gladstone Borough | 3.12% | 0.27%(+2.85)#11 | 0.13%(+3.00)#344 |
| 4. | Wrightstown Borough | 3.00% | 0.27%(+2.73)#12 | 0.13%(+2.87)#345 |
| 5. | Beverly | 2.60% | 0.27%(+2.33)#13 | 0.13%(+2.47)#346 |
| 6. | Fords | 2.48% | 0.27%(+2.21)#14 | 0.13%(+2.35)#347 |
| 7. | Newark | 2.08% | 0.27%(+1.81)#69 | 0.13%(+1.96)#1,975 |
| 8. | Oakhurst | 2.02% | 0.27%(+1.75)#70 | 0.13%(+1.89)#1,976 |
| 9. | Beattystown | 1.90% | 0.27%(+1.63)#71 | 0.13%(+1.78)#1,977 |
| 10. | Hightstown Borough | 1.89% | 0.27%(+1.62)#72 | 0.13%(+1.77)#1,978 |
| 11. | Pottersville | 1.80% | 0.27%(+1.53)#73 | 0.13%(+1.68)#1,979 |
| 12. | Ampere North | 1.76% | 0.27%(+1.49)#74 | 0.13%(+1.64)#1,980 |
| 13. | Port Reading | 1.71% | 0.27%(+1.44)#75 | 0.13%(+1.58)#1,981 |
| 14. | East Orange | 1.62% | 0.27%(+1.34)#76 | 0.13%(+1.49)#1,982 |
| 15. | Kingston Estates | 1.31% | 0.27%(+1.04)#77 | 0.13%(+1.19)#1,983 |
| 16. | Roselle Borough | 1.21% | 0.27%(+0.936)#78 | 0.13%(+1.08)#1,984 |
| 17. | Hi Nella Borough | 1.13% | 0.27%(+0.860)#79 | 0.13%(+1.01)#1,985 |
| 18. | Sicklerville | 0.99% | 0.27%(+0.720)#80 | 0.13%(+0.867)#1,986 |
| 19. | Cliffwood Beach | 0.96% | 0.27%(+0.691)#81 | 0.13%(+0.838)#1,987 |
| 20. | Woodbridge | 0.86% | 0.27%(+0.592)#82 | 0.13%(+0.739)#1,988 |
| 21. | Franklin Park | 0.83% | 0.27%(+0.554)#83 | 0.13%(+0.701)#1,989 |
| 22. | Woodlynne Borough | 0.83% | 0.27%(+0.554)#84 | 0.13%(+0.701)#1,990 |
| 23. | Bloomsbury Borough | 0.81% | 0.27%(+0.541)#85 | 0.13%(+0.688)#1,991 |
| 24. | Ocean Grove | 0.80% | 0.27%(+0.526)#86 | 0.13%(+0.673)#1,992 |
| 25. | Pine Beach Borough | 0.79% | 0.27%(+0.518)#87 | 0.13%(+0.665)#1,993 |
| 26. | Avenel | 0.70% | 0.27%(+0.430)#88 | 0.13%(+0.577)#1,994 |
| 27. | Netcong Borough | 0.63% | 0.27%(+0.359)#89 | 0.13%(+0.506)#1,995 |
| 28. | Lodi Borough | 0.63% | 0.27%(+0.355)#90 | 0.13%(+0.502)#1,996 |
| 29. | Bergenfield Borough | 0.63% | 0.27%(+0.355)#91 | 0.13%(+0.501)#1,997 |
| 30. | Lindenwold Borough | 0.57% | 0.27%(+0.294)#92 | 0.13%(+0.441)#1,998 |
| 31. | Mays Landing | 0.57% | 0.27%(+0.293)#93 | 0.13%(+0.440)#1,999 |
| 32. | South Toms River Borough | 0.55% | 0.27%(+0.274)#94 | 0.13%(+0.420)#2,000 |
| 33. | Ramapo College Of New Jersey | 0.53% | 0.27%(+0.262)#95 | 0.13%(+0.409)#2,001 |
| 34. | Brookdale | 0.52% | 0.27%(+0.251)#96 | 0.13%(+0.398)#2,002 |
| 35. | Linden | 0.51% | 0.27%(+0.236)#97 | 0.13%(+0.383)#2,003 |
| 36. | Madison Park | 0.51% | 0.27%(+0.234)#98 | 0.13%(+0.381)#2,004 |
| 37. | Camden | 0.50% | 0.27%(+0.223)#99 | 0.13%(+0.370)#2,005 |
| 38. | Caldwell Borough | 0.49% | 0.27%(+0.222)#100 | 0.13%(+0.369)#2,006 |
| 39. | Parsippany | 0.49% | 0.27%(+0.214)#101 | 0.13%(+0.360)#2,007 |
| 40. | Sayreville Borough | 0.44% | 0.27%(+0.166)#102 | 0.13%(+0.313)#2,008 |
| 41. | Stockton University | 0.42% | 0.27%(+0.151)#103 | 0.13%(+0.298)#2,009 |
| 42. | Byram Center | 0.41% | 0.27%(+0.134)#104 | 0.13%(+0.281)#2,010 |
| 43. | Oxford | 0.40% | 0.27%(+0.128)#105 | 0.13%(+0.275)#2,011 |
| 44. | Kean University | 0.38% | 0.27%(+0.108)#106 | 0.13%(+0.255)#2,012 |
| 45. | Hackensack | 0.37% | 0.27%(+0.099)#107 | 0.13%(+0.246)#2,013 |
| 46. | New Brunswick | 0.36% | 0.27%(+0.092)#108 | 0.13%(+0.239)#2,014 |
| 47. | Bogota Borough | 0.35% | 0.27%(+0.074)#109 | 0.13%(+0.221)#2,015 |
| 48. | Leisure Knoll | 0.34% | 0.27%(+0.071)#110 | 0.13%(+0.217)#2,016 |
| 49. | Browns Mills | 0.34% | 0.27%(+0.065)#111 | 0.13%(+0.212)#2,017 |
| 50. | Plainfield | 0.33% | 0.27%(+0.059)#112 | 0.13%(+0.205)#2,018 |
| 51. | Lake Hopatcong | 0.32% | 0.27%(+0.052)#113 | 0.13%(+0.199)#2,019 |
| 52. | Laurel Springs Borough | 0.30% | 0.27%(+0.027)#114 | 0.13%(+0.174)#2,020 |
| 53. | Cherry Hill Mall | 0.29% | 0.27%(+0.018)#115 | 0.13%(+0.165)#2,021 |
| 54. | Burlington | 0.28% | 0.27%(+0.012)#116 | 0.13%(+0.159)#2,022 |
| 55. | South Plainfield Borough | 0.28% | 0.27%(+0.003)#117 | 0.13%(+0.150)#2,023 |
| 56. | Annandale | 0.27% | 0.27%(-0.003)#118 | 0.13%(+0.144)#2,024 |
| 57. | Vineland | 0.27% | 0.27%(-0.004)#119 | 0.13%(+0.142)#2,025 |
| 58. | Fairview Borough | 0.27% | 0.27%(-0.005)#120 | 0.13%(+0.142)#2,026 |
| 59. | Jersey City | 0.26% | 0.27%(-0.016)#121 | 0.13%(+0.131)#2,027 |
| 60. | Springdale | 0.26% | 0.27%(-0.017)#122 | 0.13%(+0.130)#2,028 |
| 61. | Carteret Borough | 0.25% | 0.27%(-0.022)#123 | 0.13%(+0.125)#2,029 |
| 62. | Secaucus | 0.24% | 0.27%(-0.035)#124 | 0.13%(+0.112)#2,030 |
| 63. | Watsessing | 0.23% | 0.27%(-0.039)#125 | 0.13%(+0.107)#2,031 |
| 64. | Harrison | 0.23% | 0.27%(-0.044)#126 | 0.13%(+0.103)#2,032 |
| 65. | Stanhope Borough | 0.23% | 0.27%(-0.046)#127 | 0.13%(+0.101)#2,033 |
| 66. | Long Branch | 0.22% | 0.27%(-0.053)#128 | 0.13%(+0.093)#2,034 |
| 67. | Woodbury | 0.21% | 0.27%(-0.062)#129 | 0.13%(+0.085)#2,035 |
| 68. | Somerville Borough | 0.21% | 0.27%(-0.064)#130 | 0.13%(+0.083)#2,036 |
| 69. | Trenton | 0.21% | 0.27%(-0.066)#131 | 0.13%(+0.081)#2,037 |
| 70. | Highland Park Borough | 0.20% | 0.27%(-0.073)#132 | 0.13%(+0.074)#2,038 |
| 71. | Cliffside Park Borough | 0.19% | 0.27%(-0.085)#133 | 0.13%(+0.062)#2,039 |
| 72. | Glassboro Borough | 0.18% | 0.27%(-0.090)#134 | 0.13%(+0.057)#2,040 |
| 73. | Fair Lawn Borough | 0.18% | 0.27%(-0.092)#135 | 0.13%(+0.054)#2,041 |
| 74. | Red Bank Borough | 0.18% | 0.27%(-0.094)#136 | 0.13%(+0.053)#2,042 |
| 75. | Elizabeth | 0.17% | 0.27%(-0.105)#137 | 0.13%(+0.042)#2,043 |
| 76. | South Amboy | 0.14% | 0.27%(-0.133)#138 | 0.13%(+0.013)#2,044 |
| 77. | Roselle Park Borough | 0.14% | 0.27%(-0.137)#139 | 0.13%(+0.010)#2,045 |
| 78. | Edgewater Borough | 0.13% | 0.27%(-0.141)#140 | 0.13%(+0.006)#2,046 |
| 79. | Tenafly Borough | 0.12% | 0.27%(-0.148)#141 | 0.13%(-0.002)#2,047 |
| 80. | Fort Lee Borough | 0.12% | 0.27%(-0.149)#142 | 0.13%(-0.003)#2,048 |
| 81. | Kearny | 0.12% | 0.27%(-0.156)#143 | 0.13%(-0.009)#2,049 |
| 82. | Eatontown Borough | 0.11% | 0.27%(-0.162)#144 | 0.13%(-0.015)#2,050 |
| 83. | Englewood | 0.10% | 0.27%(-0.170)#145 | 0.13%(-0.023)#2,051 |
| 84. | Union City | 0.095% | 0.27%(-0.177)#146 | 0.13%(-0.031)#2,052 |
| 85. | Robertsville | 0.095% | 0.27%(-0.178)#147 | 0.13%(-0.031)#2,053 |
| 86. | Westfield | 0.094% | 0.27%(-0.179)#148 | 0.13%(-0.032)#2,054 |
| 87. | Norwood Borough | 0.088% | 0.27%(-0.184)#149 | 0.13%(-0.037)#2,055 |
| 88. | Toms River | 0.088% | 0.27%(-0.184)#150 | 0.13%(-0.037)#2,056 |
| 89. | New Milford Borough | 0.083% | 0.27%(-0.190)#151 | 0.13%(-0.043)#2,057 |
| 90. | Princeton | 0.082% | 0.27%(-0.190)#152 | 0.13%(-0.044)#2,058 |
| 91. | Bayonne | 0.075% | 0.27%(-0.197)#153 | 0.13%(-0.051)#2,059 |
| 92. | Tinton Falls Borough | 0.073% | 0.27%(-0.200)#154 | 0.13%(-0.053)#2,060 |
| 93. | Garfield | 0.062% | 0.27%(-0.211)#155 | 0.13%(-0.064)#2,061 |
| 94. | Hammonton | 0.061% | 0.27%(-0.212)#156 | 0.13%(-0.065)#2,062 |
| 95. | Colonia | 0.059% | 0.27%(-0.213)#157 | 0.13%(-0.067)#2,063 |
| 96. | Palisades Park Borough | 0.054% | 0.27%(-0.218)#158 | 0.13%(-0.071)#2,064 |
| 97. | Maywood Borough | 0.050% | 0.27%(-0.223)#159 | 0.13%(-0.076)#2,065 |
| 98. | Paramus Borough | 0.049% | 0.27%(-0.224)#160 | 0.13%(-0.077)#2,066 |
| 99. | Lakewood | 0.045% | 0.27%(-0.227)#161 | 0.13%(-0.081)#2,067 |
| 100. | Princeton Meadows | 0.045% | 0.27%(-0.228)#162 | 0.13%(-0.081)#2,068 |
Common Questions
What are the Top 10 Cities with the Highest Percentage of Immigrants from Nigeria in New Jersey?
Top 10 Cities with the Highest Percentage of Immigrants from Nigeria in New Jersey are:
#1
2.60%
#2
2.48%
#3
2.08%
#4
2.02%
#5
1.90%
#6
1.71%
#7
1.62%
#8
1.31%
#9
0.96%
#10
0.86%
What city has the Highest Percentage of Immigrants from Nigeria in New Jersey?
Beverly has the Highest Percentage of Immigrants from Nigeria in New Jersey with 2.60%.
What is the Percentage of Immigrants from Nigeria in the State of New Jersey?
Percentage of Immigrants from Nigeria in New Jersey is 0.27%.
What is the Percentage of Immigrants from Nigeria in the United States?
Percentage of Immigrants from Nigeria in the United States is 0.13%.