Cities with the Highest Percentage of Central American Population in New Jersey
RELATED REPORTS & OPTIONS
Central American
New Jersey
Compare Cities
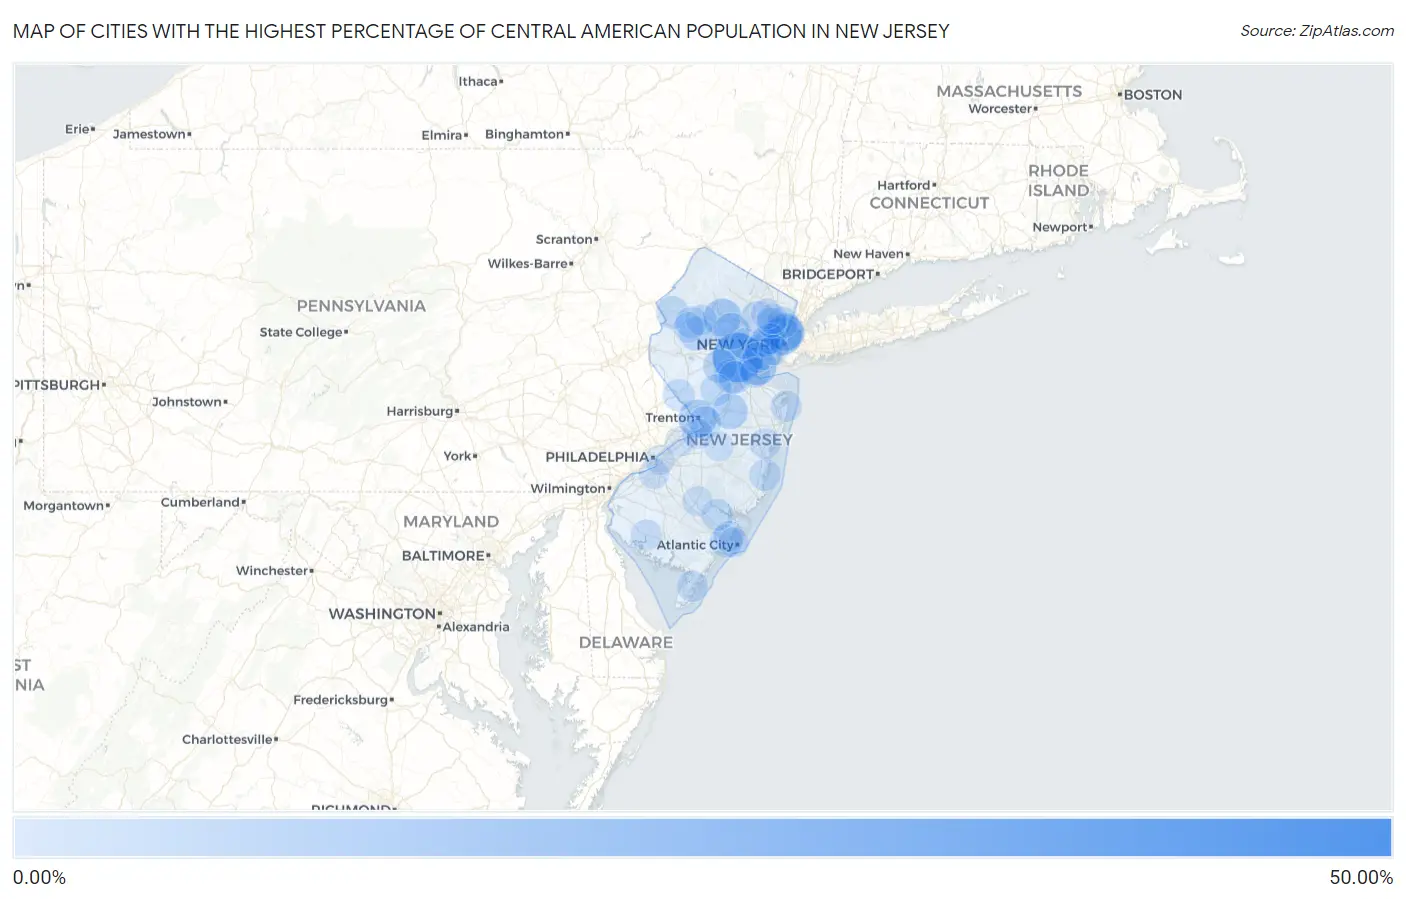
Map of Cities with the Highest Percentage of Central American Population in New Jersey
0.00%
50.00%
Cities with the Highest Percentage of Central American Population in New Jersey
| City | Central American | vs State | vs National | |
| 1. | Teterboro Borough | 48.35% | 2.71%(+45.6)#1 | 1.81%(+46.5)#10 |
| 2. | Plainfield | 30.63% | 2.71%(+27.9)#2 | 1.81%(+28.8)#58 |
| 3. | Millstone Borough | 26.88% | 2.71%(+24.2)#3 | 1.81%(+25.1)#79 |
| 4. | Fairview Borough | 21.39% | 2.71%(+18.7)#4 | 1.81%(+19.6)#125 |
| 5. | West Berlin | 19.70% | 2.71%(+17.0)#5 | 1.81%(+17.9)#147 |
| 6. | Bound Brook Borough | 19.37% | 2.71%(+16.7)#6 | 1.81%(+17.6)#156 |
| 7. | North Plainfield Borough | 17.25% | 2.71%(+14.5)#7 | 1.81%(+15.4)#192 |
| 8. | Dividing Creek | 16.41% | 2.71%(+13.7)#8 | 1.81%(+14.6)#205 |
| 9. | West New York | 15.85% | 2.71%(+13.1)#9 | 1.81%(+14.0)#219 |
| 10. | Union City | 14.49% | 2.71%(+11.8)#10 | 1.81%(+12.7)#260 |
| 11. | Port Reading | 14.41% | 2.71%(+11.7)#11 | 1.81%(+12.6)#263 |
| 12. | Trenton | 14.33% | 2.71%(+11.6)#12 | 1.81%(+12.5)#265 |
| 13. | Flemington Borough | 14.04% | 2.71%(+11.3)#13 | 1.81%(+12.2)#271 |
| 14. | Dover | 13.99% | 2.71%(+11.3)#14 | 1.81%(+12.2)#273 |
| 15. | Elizabeth | 13.96% | 2.71%(+11.3)#15 | 1.81%(+12.1)#275 |
| 16. | Lindenwold Borough | 13.06% | 2.71%(+10.4)#16 | 1.81%(+11.2)#302 |
| 17. | Victory Gardens Borough | 12.27% | 2.71%(+9.56)#17 | 1.81%(+10.5)#337 |
| 18. | Guttenberg | 12.05% | 2.71%(+9.34)#18 | 1.81%(+10.2)#340 |
| 19. | Dunellen Borough | 11.99% | 2.71%(+9.28)#19 | 1.81%(+10.2)#344 |
| 20. | Morristown | 11.88% | 2.71%(+9.17)#20 | 1.81%(+10.1)#351 |
| 21. | Twin Rivers | 11.06% | 2.71%(+8.35)#21 | 1.81%(+9.25)#383 |
| 22. | Absecon Highlands | 10.43% | 2.71%(+7.72)#22 | 1.81%(+8.62)#417 |
| 23. | Cliffside Park Borough | 10.42% | 2.71%(+7.71)#23 | 1.81%(+8.61)#418 |
| 24. | Roosevelt Borough | 10.13% | 2.71%(+7.42)#24 | 1.81%(+8.31)#430 |
| 25. | Netcong Borough | 10.05% | 2.71%(+7.34)#25 | 1.81%(+8.23)#434 |
| 26. | South Bound Brook Borough | 8.83% | 2.71%(+6.12)#26 | 1.81%(+7.01)#517 |
| 27. | East Franklin | 8.52% | 2.71%(+5.81)#27 | 1.81%(+6.71)#539 |
| 28. | Long Valley | 8.50% | 2.71%(+5.79)#28 | 1.81%(+6.69)#542 |
| 29. | Finderne | 8.40% | 2.71%(+5.69)#29 | 1.81%(+6.59)#550 |
| 30. | Middlesex Borough | 7.79% | 2.71%(+5.08)#30 | 1.81%(+5.98)#615 |
| 31. | South River Borough | 7.59% | 2.71%(+4.88)#31 | 1.81%(+5.77)#645 |
| 32. | Swedesboro Borough | 7.32% | 2.71%(+4.61)#32 | 1.81%(+5.50)#684 |
| 33. | New Brunswick | 7.02% | 2.71%(+4.31)#33 | 1.81%(+5.21)#711 |
| 34. | Mount Hermon | 6.96% | 2.71%(+4.25)#34 | 1.81%(+5.14)#726 |
| 35. | Pleasantville | 6.89% | 2.71%(+4.18)#35 | 1.81%(+5.08)#737 |
| 36. | Singac | 6.77% | 2.71%(+4.06)#36 | 1.81%(+4.96)#758 |
| 37. | Ridgefield Borough | 6.58% | 2.71%(+3.87)#37 | 1.81%(+4.76)#797 |
| 38. | Raritan Borough | 6.48% | 2.71%(+3.77)#38 | 1.81%(+4.67)#810 |
| 39. | White Horse | 6.36% | 2.71%(+3.65)#39 | 1.81%(+4.54)#827 |
| 40. | Carteret Borough | 6.16% | 2.71%(+3.45)#40 | 1.81%(+4.34)#859 |
| 41. | Egg Harbor City | 6.03% | 2.71%(+3.32)#41 | 1.81%(+4.22)#880 |
| 42. | Palisades Park Borough | 5.96% | 2.71%(+3.25)#42 | 1.81%(+4.14)#897 |
| 43. | Lambertville | 5.77% | 2.71%(+3.06)#43 | 1.81%(+3.95)#937 |
| 44. | Hackettstown | 5.46% | 2.71%(+2.75)#44 | 1.81%(+3.65)#1,012 |
| 45. | East Rocky Hill | 5.35% | 2.71%(+2.64)#45 | 1.81%(+3.54)#1,042 |
| 46. | Ridgefield Park | 5.27% | 2.71%(+2.56)#46 | 1.81%(+3.45)#1,065 |
| 47. | Forked River | 5.18% | 2.71%(+2.47)#47 | 1.81%(+3.36)#1,087 |
| 48. | Gillette | 5.05% | 2.71%(+2.35)#48 | 1.81%(+3.24)#1,113 |
| 49. | Cedar Knolls | 4.81% | 2.71%(+2.10)#49 | 1.81%(+2.99)#1,168 |
| 50. | Northvale Borough | 4.72% | 2.71%(+2.01)#50 | 1.81%(+2.91)#1,188 |
| 51. | Long Branch | 4.66% | 2.71%(+1.95)#51 | 1.81%(+2.84)#1,205 |
| 52. | Manville Borough | 4.62% | 2.71%(+1.91)#52 | 1.81%(+2.81)#1,222 |
| 53. | Cape May Court House | 4.53% | 2.71%(+1.83)#53 | 1.81%(+2.72)#1,246 |
| 54. | Roselle Park Borough | 4.53% | 2.71%(+1.82)#54 | 1.81%(+2.72)#1,247 |
| 55. | Pleasantdale | 4.43% | 2.71%(+1.72)#55 | 1.81%(+2.61)#1,273 |
| 56. | Hightstown Borough | 4.35% | 2.71%(+1.64)#56 | 1.81%(+2.54)#1,298 |
| 57. | Lodi Borough | 4.35% | 2.71%(+1.64)#57 | 1.81%(+2.53)#1,300 |
| 58. | Harrison | 4.34% | 2.71%(+1.63)#58 | 1.81%(+2.53)#1,303 |
| 59. | Stratford Borough | 4.29% | 2.71%(+1.59)#59 | 1.81%(+2.48)#1,321 |
| 60. | Budd Lake | 4.29% | 2.71%(+1.58)#60 | 1.81%(+2.47)#1,326 |
| 61. | Bridgeton | 4.27% | 2.71%(+1.56)#61 | 1.81%(+2.46)#1,331 |
| 62. | Summit | 4.21% | 2.71%(+1.50)#62 | 1.81%(+2.39)#1,351 |
| 63. | Absecon | 4.18% | 2.71%(+1.47)#63 | 1.81%(+2.37)#1,365 |
| 64. | Leisure Village | 4.07% | 2.71%(+1.36)#64 | 1.81%(+2.26)#1,402 |
| 65. | Watsessing | 3.99% | 2.71%(+1.28)#65 | 1.81%(+2.18)#1,432 |
| 66. | Kearny | 3.96% | 2.71%(+1.25)#66 | 1.81%(+2.14)#1,445 |
| 67. | Woodbury | 3.91% | 2.71%(+1.20)#67 | 1.81%(+2.09)#1,461 |
| 68. | Liberty Corner | 3.81% | 2.71%(+1.10)#68 | 1.81%(+2.00)#1,491 |
| 69. | Beattystown | 3.75% | 2.71%(+1.04)#69 | 1.81%(+1.94)#1,507 |
| 70. | Newark | 3.71% | 2.71%(+0.998)#70 | 1.81%(+1.89)#1,529 |
| 71. | Westwood Borough | 3.70% | 2.71%(+0.991)#71 | 1.81%(+1.89)#1,533 |
| 72. | Linden | 3.68% | 2.71%(+0.971)#72 | 1.81%(+1.87)#1,539 |
| 73. | Bayonne | 3.67% | 2.71%(+0.964)#73 | 1.81%(+1.86)#1,543 |
| 74. | Glen Gardner Borough | 3.66% | 2.71%(+0.955)#74 | 1.81%(+1.85)#1,547 |
| 75. | Perth Amboy | 3.65% | 2.71%(+0.941)#75 | 1.81%(+1.84)#1,551 |
| 76. | Paterson | 3.63% | 2.71%(+0.918)#76 | 1.81%(+1.81)#1,561 |
| 77. | Deal Borough | 3.57% | 2.71%(+0.856)#77 | 1.81%(+1.75)#1,586 |
| 78. | Roebling | 3.55% | 2.71%(+0.836)#78 | 1.81%(+1.73)#1,595 |
| 79. | Passaic | 3.48% | 2.71%(+0.770)#79 | 1.81%(+1.67)#1,626 |
| 80. | Franklin Borough | 3.47% | 2.71%(+0.757)#80 | 1.81%(+1.65)#1,636 |
| 81. | Garfield | 3.46% | 2.71%(+0.752)#81 | 1.81%(+1.65)#1,638 |
| 82. | Bogota Borough | 3.46% | 2.71%(+0.747)#82 | 1.81%(+1.64)#1,642 |
| 83. | Caldwell Borough | 3.41% | 2.71%(+0.696)#83 | 1.81%(+1.59)#1,669 |
| 84. | Prospect Park Borough | 3.40% | 2.71%(+0.688)#84 | 1.81%(+1.58)#1,675 |
| 85. | South Plainfield Borough | 3.38% | 2.71%(+0.669)#85 | 1.81%(+1.57)#1,684 |
| 86. | Atlantic City | 3.31% | 2.71%(+0.603)#86 | 1.81%(+1.50)#1,721 |
| 87. | Hammonton | 3.30% | 2.71%(+0.589)#87 | 1.81%(+1.49)#1,732 |
| 88. | Stirling | 3.28% | 2.71%(+0.573)#88 | 1.81%(+1.47)#1,741 |
| 89. | Lyons | 3.28% | 2.71%(+0.568)#89 | 1.81%(+1.46)#1,744 |
| 90. | New Vernon | 3.22% | 2.71%(+0.513)#90 | 1.81%(+1.41)#1,767 |
| 91. | Elmwood Park Borough | 3.18% | 2.71%(+0.475)#91 | 1.81%(+1.37)#1,779 |
| 92. | Little Ferry Borough | 3.17% | 2.71%(+0.458)#92 | 1.81%(+1.35)#1,787 |
| 93. | Beverly | 3.16% | 2.71%(+0.448)#93 | 1.81%(+1.34)#1,792 |
| 94. | Mcguire Afb | 3.15% | 2.71%(+0.442)#94 | 1.81%(+1.34)#1,797 |
| 95. | Camden | 3.14% | 2.71%(+0.430)#95 | 1.81%(+1.33)#1,801 |
| 96. | Franklinville | 3.08% | 2.71%(+0.375)#96 | 1.81%(+1.27)#1,837 |
| 97. | Red Bank Borough | 3.06% | 2.71%(+0.352)#97 | 1.81%(+1.25)#1,846 |
| 98. | Bedminster | 3.03% | 2.71%(+0.321)#98 | 1.81%(+1.22)#1,862 |
| 99. | Bergenfield Borough | 3.03% | 2.71%(+0.320)#99 | 1.81%(+1.22)#1,864 |
| 100. | Milltown Borough | 3.02% | 2.71%(+0.312)#100 | 1.81%(+1.21)#1,871 |
Common Questions
What are the Top 10 Cities with the Highest Percentage of Central American Population in New Jersey?
Top 10 Cities with the Highest Percentage of Central American Population in New Jersey are:
#1
30.63%
#2
15.85%
#3
14.49%
#4
14.41%
#5
14.33%
#6
13.99%
#7
13.96%
#8
12.05%
#9
11.88%
#10
11.06%
What city has the Highest Percentage of Central American Population in New Jersey?
Plainfield has the Highest Percentage of Central American Population in New Jersey with 30.63%.
What is the Percentage of Central American Population in the State of New Jersey?
Percentage of Central American Population in New Jersey is 2.71%.
What is the Percentage of Central American Population in the United States?
Percentage of Central American Population in the United States is 1.81%.