Colonia, NJ Map & Demographics
Colonia Map
Colonia Overview
$48,773
PER CAPITA INCOME
$139,247
AVG FAMILY INCOME
$129,122
AVG HOUSEHOLD INCOME
27.4%
WAGE / INCOME GAP [ % ]
72.6¢/ $1
WAGE / INCOME GAP [ $ ]
$13,332
FAMILY INCOME DEFICIT
0.37
INEQUALITY / GINI INDEX
18,581
TOTAL POPULATION
9,046
MALE POPULATION
9,535
FEMALE POPULATION
94.87
MALES / 100 FEMALES
105.41
FEMALES / 100 MALES
42.7
MEDIAN AGE
3.4
AVG FAMILY SIZE
3.0
AVG HOUSEHOLD SIZE
9,836
LABOR FORCE [ PEOPLE ]
65.4%
PERCENT IN LABOR FORCE
2.9%
UNEMPLOYMENT RATE
Colonia Zip Codes
Income in Colonia
Income Overview in Colonia
Per Capita Income in Colonia is $48,773, while median incomes of families and households are $139,247 and $129,122 respectively.
| Characteristic | Number | Measure |
| Per Capita Income | 18,581 | $48,773 |
| Median Family Income | 4,963 | $139,247 |
| Mean Family Income | 4,963 | $158,844 |
| Median Household Income | 6,220 | $129,122 |
| Mean Household Income | 6,220 | $143,347 |
| Income Deficit | 4,963 | $13,332 |
| Wage / Income Gap (%) | 18,581 | 27.36% |
| Wage / Income Gap ($) | 18,581 | 72.64¢ per $1 |
| Gini / Inequality Index | 18,581 | 0.37 |
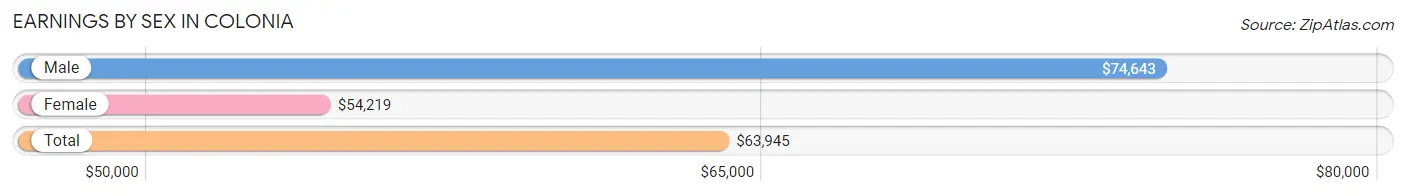
Earnings by Sex in Colonia
Average Earnings in Colonia are $63,945, $74,643 for men and $54,219 for women, a difference of 27.4%.
| Sex | Number | Average Earnings |
| Male | 5,530 (53.4%) | $74,643 |
| Female | 4,824 (46.6%) | $54,219 |
| Total | 10,354 (100.0%) | $63,945 |
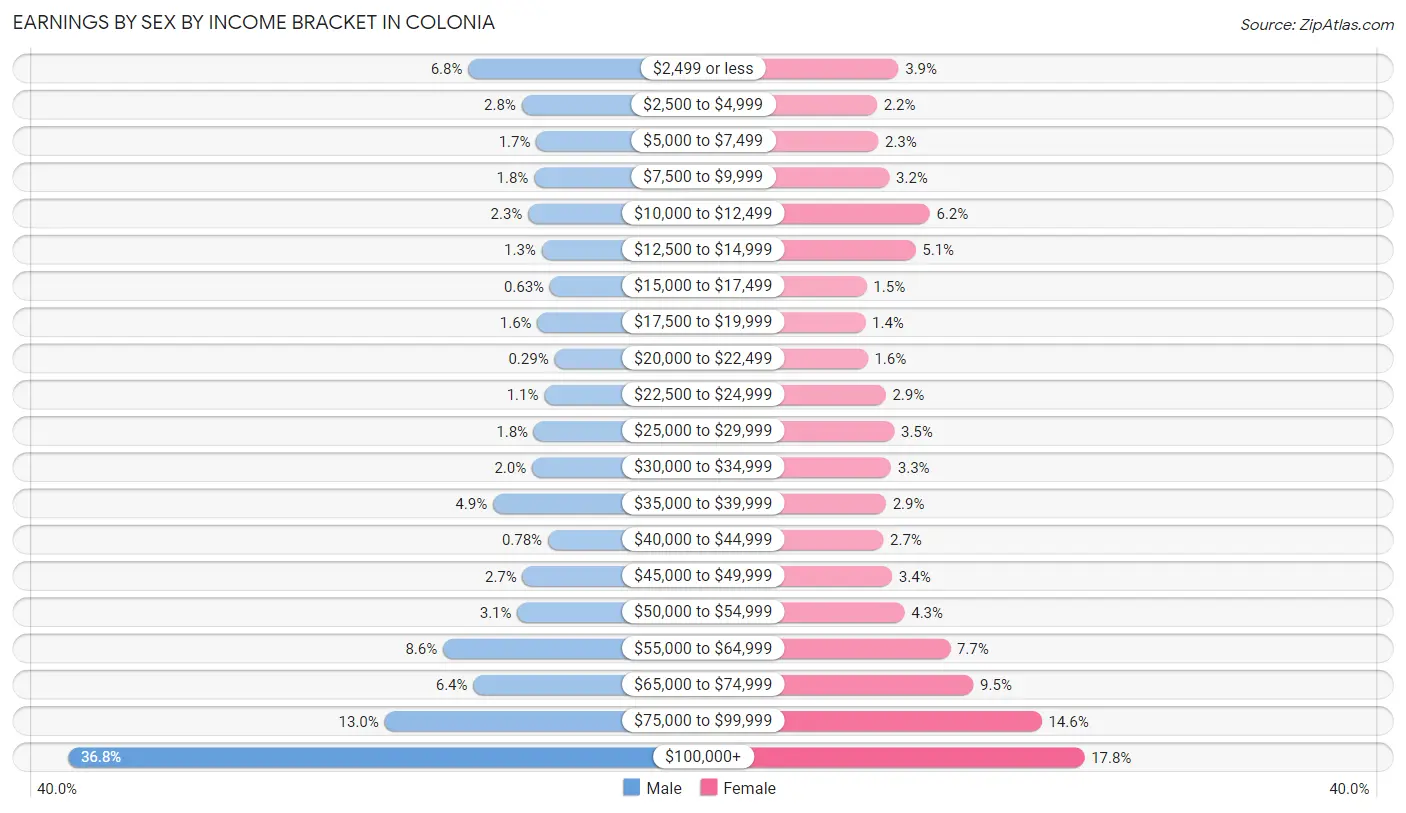
Earnings by Sex by Income Bracket in Colonia
The most common earnings brackets in Colonia are $100,000+ for men (2,032 | 36.7%) and $100,000+ for women (858 | 17.8%).
| Income | Male | Female |
| $2,499 or less | 373 (6.8%) | 186 (3.9%) |
| $2,500 to $4,999 | 152 (2.8%) | 108 (2.2%) |
| $5,000 to $7,499 | 91 (1.7%) | 113 (2.3%) |
| $7,500 to $9,999 | 100 (1.8%) | 153 (3.2%) |
| $10,000 to $12,499 | 125 (2.3%) | 299 (6.2%) |
| $12,500 to $14,999 | 69 (1.3%) | 248 (5.1%) |
| $15,000 to $17,499 | 35 (0.6%) | 71 (1.5%) |
| $17,500 to $19,999 | 87 (1.6%) | 66 (1.4%) |
| $20,000 to $22,499 | 16 (0.3%) | 75 (1.5%) |
| $22,500 to $24,999 | 58 (1.1%) | 140 (2.9%) |
| $25,000 to $29,999 | 101 (1.8%) | 171 (3.5%) |
| $30,000 to $34,999 | 109 (2.0%) | 159 (3.3%) |
| $35,000 to $39,999 | 271 (4.9%) | 141 (2.9%) |
| $40,000 to $44,999 | 43 (0.8%) | 131 (2.7%) |
| $45,000 to $49,999 | 148 (2.7%) | 163 (3.4%) |
| $50,000 to $54,999 | 170 (3.1%) | 208 (4.3%) |
| $55,000 to $64,999 | 478 (8.6%) | 373 (7.7%) |
| $65,000 to $74,999 | 352 (6.4%) | 457 (9.5%) |
| $75,000 to $99,999 | 720 (13.0%) | 704 (14.6%) |
| $100,000+ | 2,032 (36.7%) | 858 (17.8%) |
| Total | 5,530 (100.0%) | 4,824 (100.0%) |
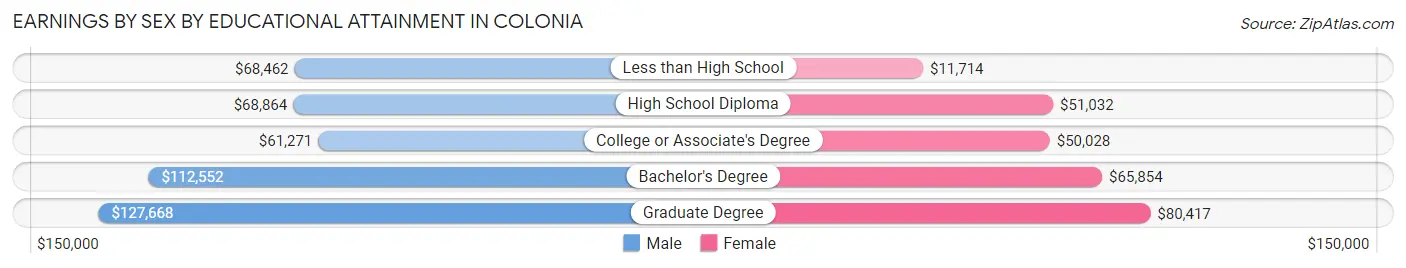
Earnings by Sex by Educational Attainment in Colonia
Average earnings in Colonia are $82,008 for men and $58,134 for women, a difference of 29.1%. Men with an educational attainment of graduate degree enjoy the highest average annual earnings of $127,668, while those with college or associate's degree education earn the least with $61,271. Women with an educational attainment of graduate degree earn the most with the average annual earnings of $80,417, while those with less than high school education have the smallest earnings of $11,714.
| Educational Attainment | Male Income | Female Income |
| Less than High School | $68,462 | $11,714 |
| High School Diploma | $68,864 | $51,032 |
| College or Associate's Degree | $61,271 | $50,028 |
| Bachelor's Degree | $112,552 | $65,854 |
| Graduate Degree | $127,668 | $80,417 |
| Total | $82,008 | $58,134 |
Family Income in Colonia
Family Income Brackets in Colonia
According to the Colonia family income data, there are 1,390 families falling into the $200,000+ income range, which is the most common income bracket and makes up 28.0% of all families. Conversely, the $15,000 to $24,999 income bracket is the least frequent group with only 55 families (1.1%) belonging to this category.
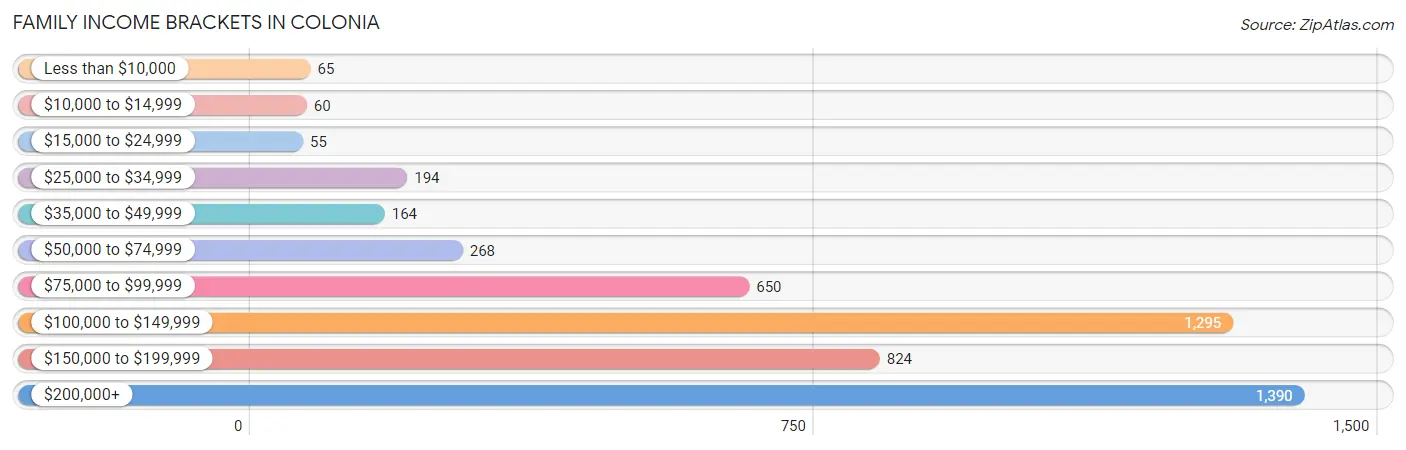
| Income Bracket | # Families | % Families |
| Less than $10,000 | 65 | 1.3% |
| $10,000 to $14,999 | 60 | 1.2% |
| $15,000 to $24,999 | 55 | 1.1% |
| $25,000 to $34,999 | 194 | 3.9% |
| $35,000 to $49,999 | 164 | 3.3% |
| $50,000 to $74,999 | 268 | 5.4% |
| $75,000 to $99,999 | 650 | 13.1% |
| $100,000 to $149,999 | 1,295 | 26.1% |
| $150,000 to $199,999 | 824 | 16.6% |
| $200,000+ | 1,390 | 28.0% |
Family Income by Famaliy Size in Colonia
4-person families (1,013 | 20.4%) account for the highest median family income in Colonia with $176,125 per family, while 3-person families (1,047 | 21.1%) have the highest median income of $56,480 per family member.
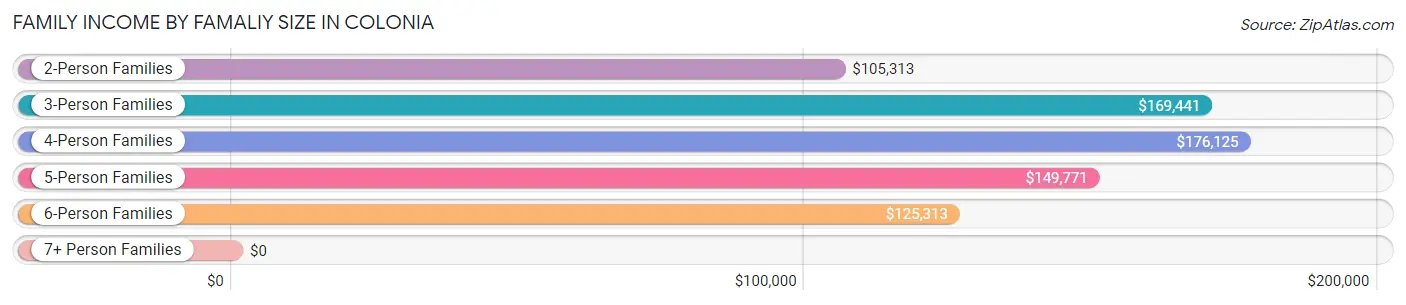
| Income Bracket | # Families | Median Income |
| 2-Person Families | 1,976 (39.8%) | $105,313 |
| 3-Person Families | 1,047 (21.1%) | $169,441 |
| 4-Person Families | 1,013 (20.4%) | $176,125 |
| 5-Person Families | 529 (10.7%) | $149,771 |
| 6-Person Families | 329 (6.6%) | $125,313 |
| 7+ Person Families | 69 (1.4%) | $0 |
| Total | 4,963 (100.0%) | $139,247 |
Family Income by Number of Earners in Colonia
The median family income in Colonia is $139,247, with families comprising 3+ earners (992) having the highest median family income of $176,094, while families with no earners (587) have the lowest median family income of $63,550, accounting for 20.0% and 11.8% of families, respectively.
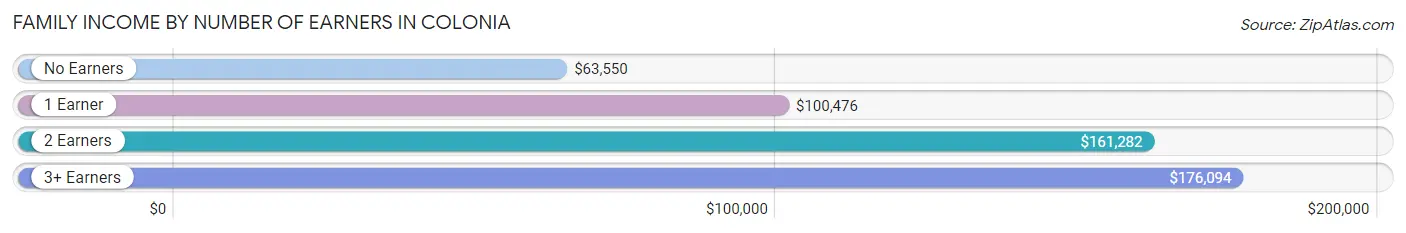
| Number of Earners | # Families | Median Income |
| No Earners | 587 (11.8%) | $63,550 |
| 1 Earner | 1,152 (23.2%) | $100,476 |
| 2 Earners | 2,232 (45.0%) | $161,282 |
| 3+ Earners | 992 (20.0%) | $176,094 |
| Total | 4,963 (100.0%) | $139,247 |
Household Income in Colonia
Household Income Brackets in Colonia
With 1,487 households falling in the category, the $200,000+ income range is the most frequent in Colonia, accounting for 23.9% of all households. In contrast, only 100 households (1.6%) fall into the $10,000 to $14,999 income bracket, making it the least populous group.
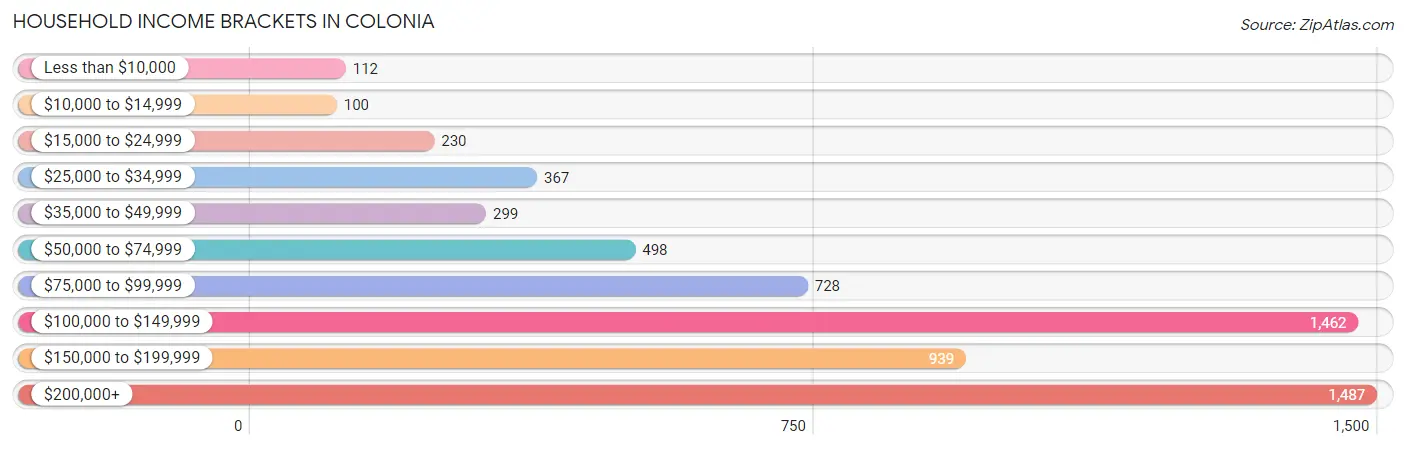
| Income Bracket | # Households | % Households |
| Less than $10,000 | 112 | 1.8% |
| $10,000 to $14,999 | 100 | 1.6% |
| $15,000 to $24,999 | 230 | 3.7% |
| $25,000 to $34,999 | 367 | 5.9% |
| $35,000 to $49,999 | 299 | 4.8% |
| $50,000 to $74,999 | 498 | 8.0% |
| $75,000 to $99,999 | 728 | 11.7% |
| $100,000 to $149,999 | 1,462 | 23.5% |
| $150,000 to $199,999 | 939 | 15.1% |
| $200,000+ | 1,487 | 23.9% |
Household Income by Householder Age in Colonia
The median household income in Colonia is $129,122, with the highest median household income of $156,417 found in the 45 to 64 years age bracket for the primary householder. A total of 2,532 households (40.7%) fall into this category. Meanwhile, the 15 to 24 years age bracket for the primary householder has the lowest median household income of $0, with 25 households (0.4%) in this group.
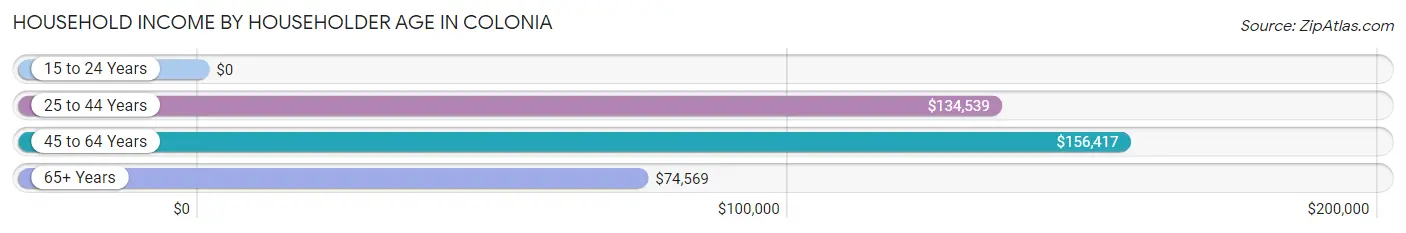
| Income Bracket | # Households | Median Income |
| 15 to 24 Years | 25 (0.4%) | $0 |
| 25 to 44 Years | 1,749 (28.1%) | $134,539 |
| 45 to 64 Years | 2,532 (40.7%) | $156,417 |
| 65+ Years | 1,914 (30.8%) | $74,569 |
| Total | 6,220 (100.0%) | $129,122 |
Poverty in Colonia
Income Below Poverty by Sex and Age in Colonia
With 4.6% poverty level for males and 6.7% for females among the residents of Colonia, 5 year old males and 6 to 11 year old females are the most vulnerable to poverty, with 58 males (26.6%) and 95 females (16.8%) in their respective age groups living below the poverty level.
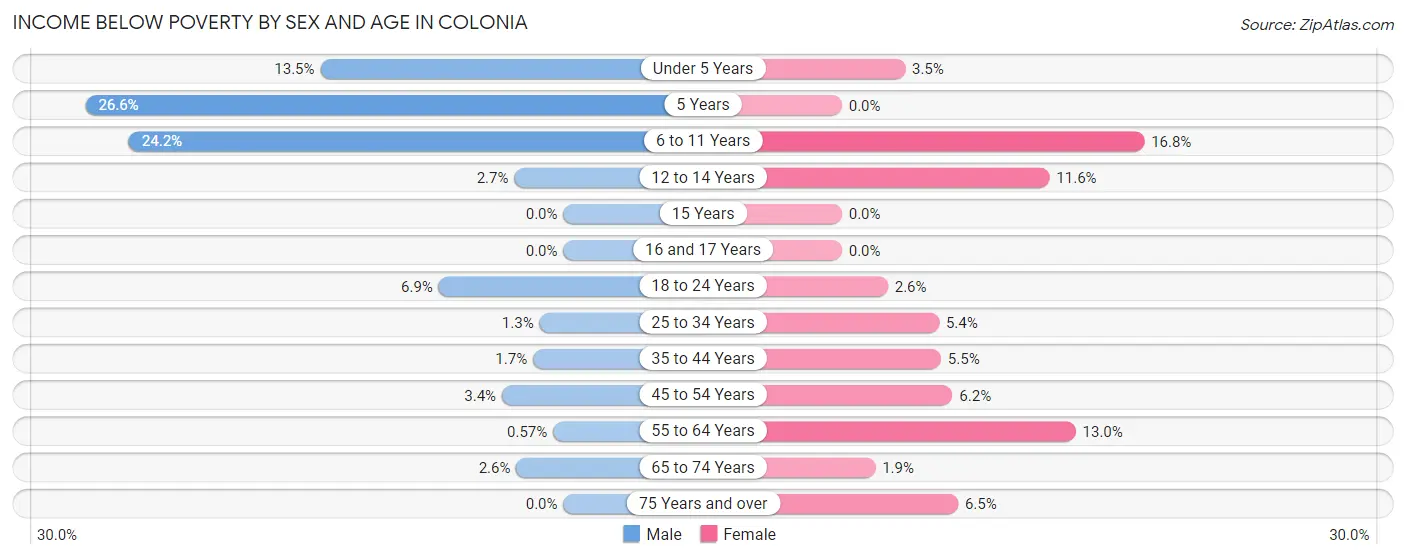
| Age Bracket | Male | Female |
| Under 5 Years | 64 (13.5%) | 14 (3.5%) |
| 5 Years | 58 (26.6%) | 0 (0.0%) |
| 6 to 11 Years | 127 (24.2%) | 95 (16.8%) |
| 12 to 14 Years | 11 (2.7%) | 43 (11.6%) |
| 15 Years | 0 (0.0%) | 0 (0.0%) |
| 16 and 17 Years | 0 (0.0%) | 0 (0.0%) |
| 18 to 24 Years | 42 (6.9%) | 13 (2.6%) |
| 25 to 34 Years | 13 (1.3%) | 63 (5.4%) |
| 35 to 44 Years | 21 (1.7%) | 70 (5.5%) |
| 45 to 54 Years | 43 (3.4%) | 81 (6.2%) |
| 55 to 64 Years | 7 (0.6%) | 180 (13.0%) |
| 65 to 74 Years | 31 (2.6%) | 19 (1.9%) |
| 75 Years and over | 0 (0.0%) | 61 (6.5%) |
| Total | 417 (4.6%) | 639 (6.7%) |
Income Above Poverty by Sex and Age in Colonia
According to the poverty statistics in Colonia, males aged 15 years and females aged 5 years are the age groups that are most secure financially, with 100.0% of males and 100.0% of females in these age groups living above the poverty line.
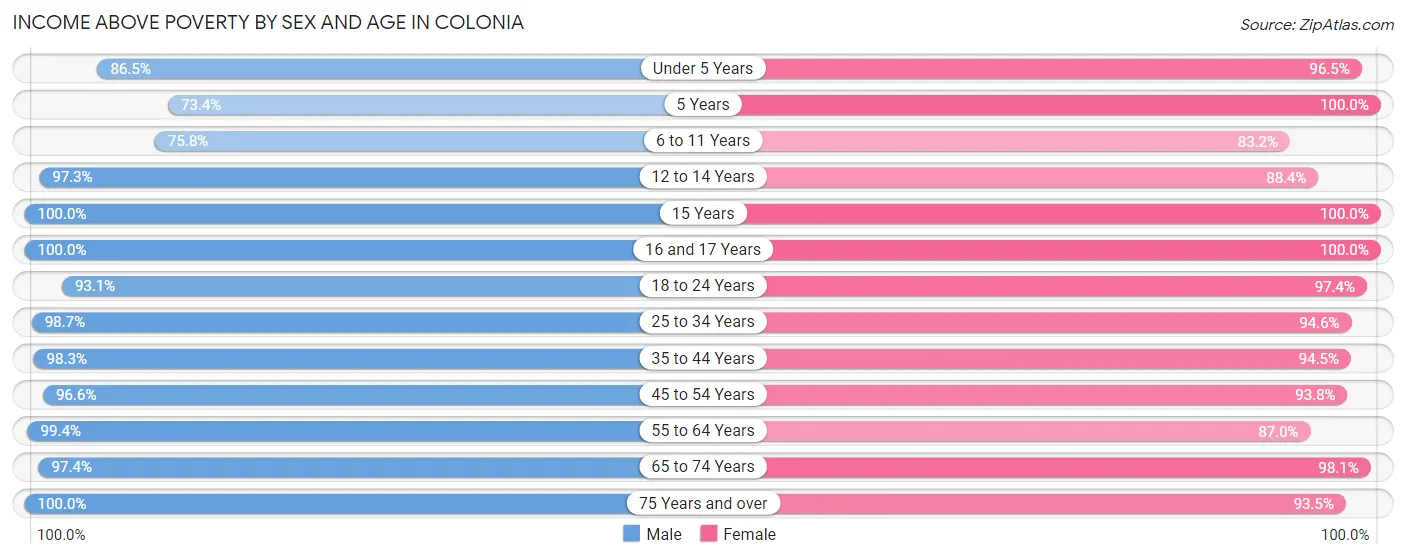
| Age Bracket | Male | Female |
| Under 5 Years | 409 (86.5%) | 384 (96.5%) |
| 5 Years | 160 (73.4%) | 102 (100.0%) |
| 6 to 11 Years | 398 (75.8%) | 469 (83.2%) |
| 12 to 14 Years | 392 (97.3%) | 329 (88.4%) |
| 15 Years | 142 (100.0%) | 261 (100.0%) |
| 16 and 17 Years | 220 (100.0%) | 237 (100.0%) |
| 18 to 24 Years | 563 (93.1%) | 494 (97.4%) |
| 25 to 34 Years | 967 (98.7%) | 1,102 (94.6%) |
| 35 to 44 Years | 1,219 (98.3%) | 1,197 (94.5%) |
| 45 to 54 Years | 1,215 (96.6%) | 1,234 (93.8%) |
| 55 to 64 Years | 1,218 (99.4%) | 1,202 (87.0%) |
| 65 to 74 Years | 1,153 (97.4%) | 1,003 (98.1%) |
| 75 Years and over | 490 (100.0%) | 882 (93.5%) |
| Total | 8,546 (95.4%) | 8,896 (93.3%) |
Income Below Poverty Among Married-Couple Families in Colonia
The poverty statistics for married-couple families in Colonia show that 1.2% or 47 of the total 3,989 families live below the poverty line. Families with 1 or 2 children have the highest poverty rate of 1.5%, comprising of 20 families. On the other hand, families with 3 or 4 children have the lowest poverty rate of 0.0%, which includes 0 families.
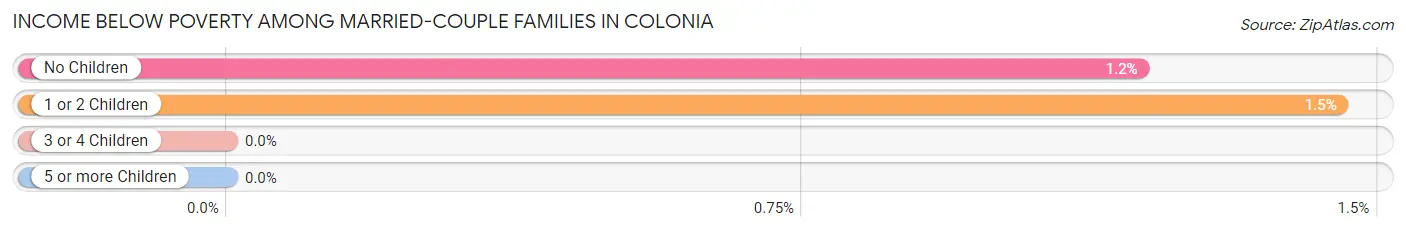
| Children | Above Poverty | Below Poverty |
| No Children | 2,248 (98.8%) | 27 (1.2%) |
| 1 or 2 Children | 1,357 (98.6%) | 20 (1.5%) |
| 3 or 4 Children | 337 (100.0%) | 0 (0.0%) |
| 5 or more Children | 0 (0.0%) | 0 (0.0%) |
| Total | 3,942 (98.8%) | 47 (1.2%) |
Income Below Poverty Among Single-Parent Households in Colonia
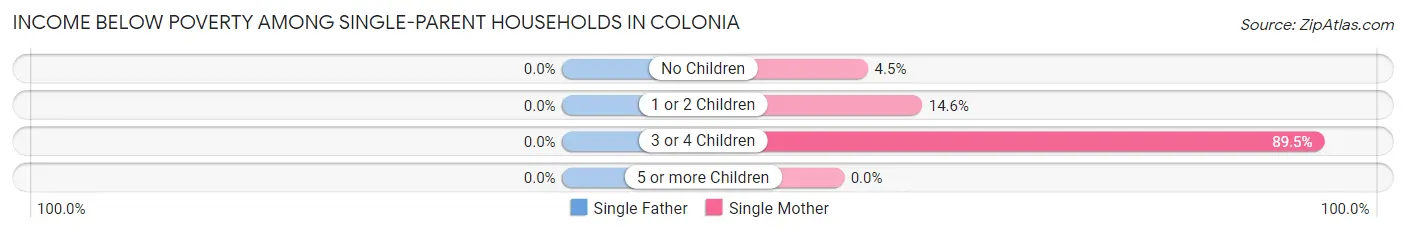
| Children | Single Father | Single Mother |
| No Children | 0 (0.0%) | 22 (4.5%) |
| 1 or 2 Children | 0 (0.0%) | 32 (14.5%) |
| 3 or 4 Children | 0 (0.0%) | 77 (89.5%) |
| 5 or more Children | 0 (0.0%) | 0 (0.0%) |
| Total | 0 (0.0%) | 131 (16.4%) |
Income Below Poverty Among Married-Couple vs Single-Parent Households in Colonia
The poverty data for Colonia shows that 47 of the married-couple family households (1.2%) and 131 of the single-parent households (13.5%) are living below the poverty level. Within the married-couple family households, those with 1 or 2 children have the highest poverty rate, with 20 households (1.5%) falling below the poverty line. Among the single-parent households, those with 3 or 4 children have the highest poverty rate, with 77 household (76.2%) living below poverty.
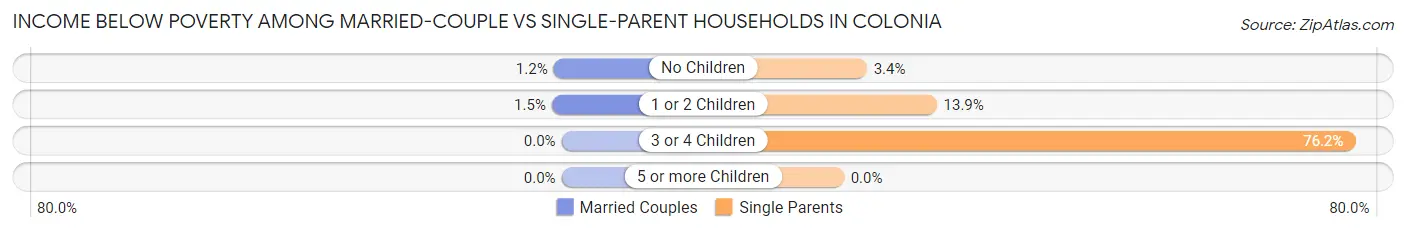
| Children | Married-Couple Families | Single-Parent Households |
| No Children | 27 (1.2%) | 22 (3.4%) |
| 1 or 2 Children | 20 (1.5%) | 32 (13.9%) |
| 3 or 4 Children | 0 (0.0%) | 77 (76.2%) |
| 5 or more Children | 0 (0.0%) | 0 (0.0%) |
| Total | 47 (1.2%) | 131 (13.5%) |
Race in Colonia
The most populous races in Colonia are White / Caucasian (12,538 | 67.5%), Asian (2,896 | 15.6%), and Hispanic or Latino (2,601 | 14.0%).
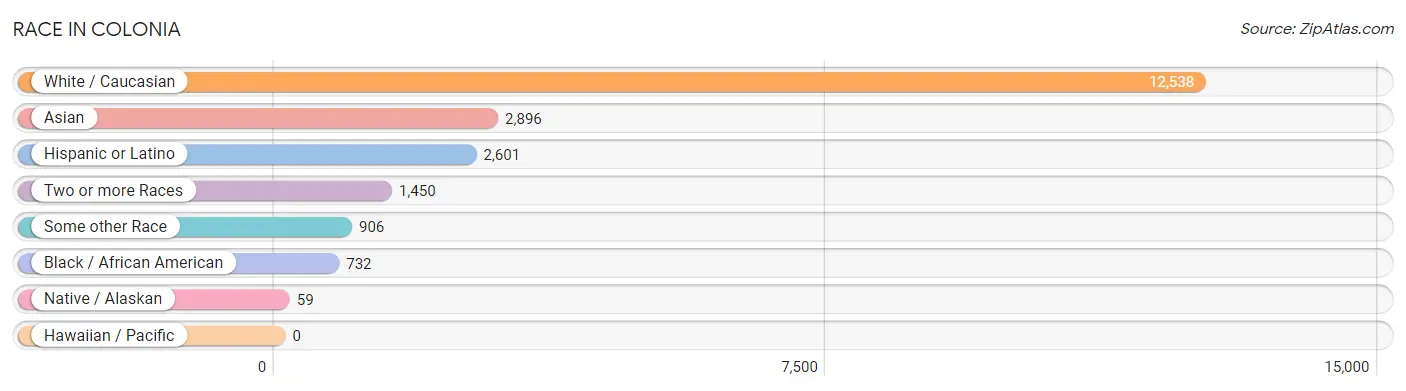
| Race | # Population | % Population |
| Asian | 2,896 | 15.6% |
| Black / African American | 732 | 3.9% |
| Hawaiian / Pacific | 0 | 0.0% |
| Hispanic or Latino | 2,601 | 14.0% |
| Native / Alaskan | 59 | 0.3% |
| White / Caucasian | 12,538 | 67.5% |
| Two or more Races | 1,450 | 7.8% |
| Some other Race | 906 | 4.9% |
| Total | 18,581 | 100.0% |
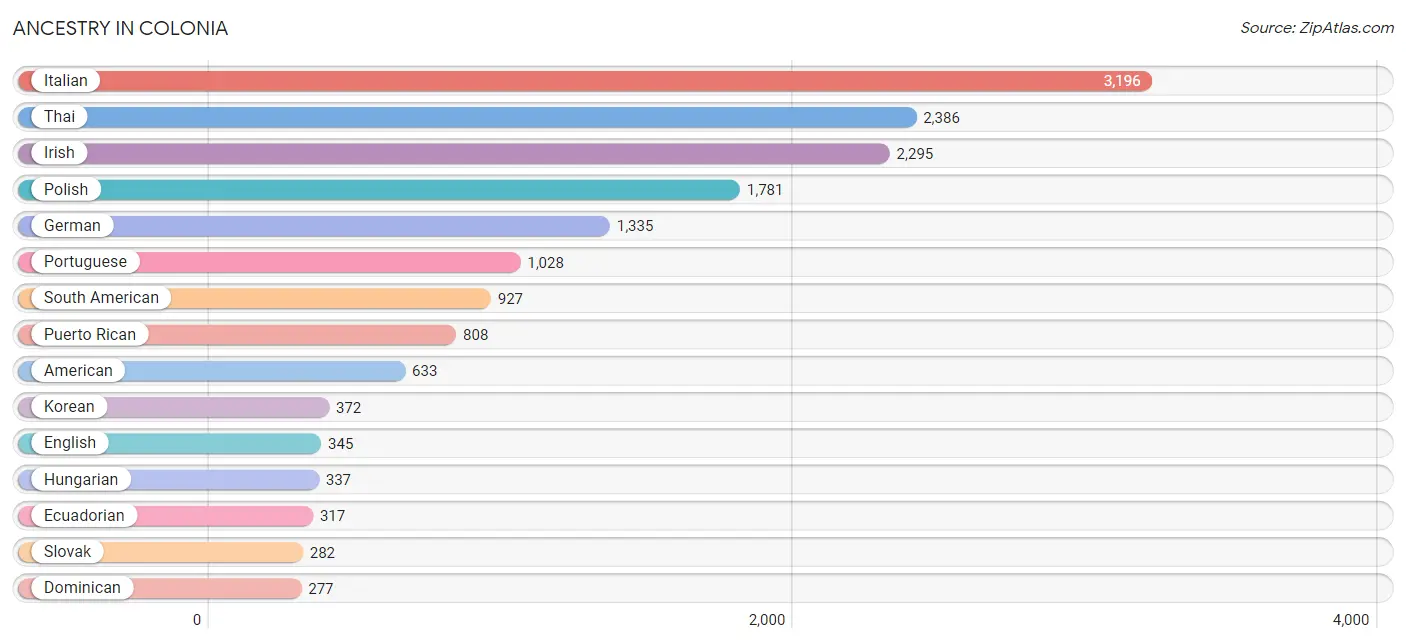
Ancestry in Colonia
The most populous ancestries reported in Colonia are Italian (3,196 | 17.2%), Thai (2,386 | 12.8%), Irish (2,295 | 12.3%), Polish (1,781 | 9.6%), and German (1,335 | 7.2%), together accounting for 59.2% of all Colonia residents.
| Ancestry | # Population | % Population |
| African | 14 | 0.1% |
| Alaskan Athabascan | 71 | 0.4% |
| Albanian | 23 | 0.1% |
| American | 633 | 3.4% |
| Arab | 185 | 1.0% |
| Argentinean | 72 | 0.4% |
| Austrian | 58 | 0.3% |
| Barbadian | 15 | 0.1% |
| Bolivian | 9 | 0.1% |
| Brazilian | 115 | 0.6% |
| British | 10 | 0.1% |
| British West Indian | 12 | 0.1% |
| Burmese | 37 | 0.2% |
| Canadian | 42 | 0.2% |
| Central American | 106 | 0.6% |
| Central American Indian | 33 | 0.2% |
| Chilean | 40 | 0.2% |
| Colombian | 208 | 1.1% |
| Croatian | 9 | 0.1% |
| Cuban | 59 | 0.3% |
| Czech | 76 | 0.4% |
| Czechoslovakian | 7 | 0.0% |
| Danish | 26 | 0.1% |
| Dominican | 277 | 1.5% |
| Dutch | 81 | 0.4% |
| Eastern European | 40 | 0.2% |
| Ecuadorian | 317 | 1.7% |
| Egyptian | 75 | 0.4% |
| English | 345 | 1.9% |
| Estonian | 13 | 0.1% |
| European | 95 | 0.5% |
| Finnish | 8 | 0.0% |
| French | 193 | 1.0% |
| French Canadian | 10 | 0.1% |
| German | 1,335 | 7.2% |
| German Russian | 10 | 0.1% |
| Greek | 125 | 0.7% |
| Guyanese | 31 | 0.2% |
| Haitian | 18 | 0.1% |
| Honduran | 28 | 0.2% |
| Hungarian | 337 | 1.8% |
| Indian (Asian) | 272 | 1.5% |
| Irish | 2,295 | 12.3% |
| Italian | 3,196 | 17.2% |
| Jamaican | 12 | 0.1% |
| Korean | 372 | 2.0% |
| Lebanese | 78 | 0.4% |
| Lithuanian | 92 | 0.5% |
| Maltese | 20 | 0.1% |
| Mexican | 28 | 0.2% |
| Nigerian | 33 | 0.2% |
| Norwegian | 64 | 0.3% |
| Palestinian | 18 | 0.1% |
| Peruvian | 17 | 0.1% |
| Polish | 1,781 | 9.6% |
| Portuguese | 1,028 | 5.5% |
| Puerto Rican | 808 | 4.3% |
| Romanian | 9 | 0.1% |
| Russian | 161 | 0.9% |
| Salvadoran | 78 | 0.4% |
| Scotch-Irish | 31 | 0.2% |
| Scottish | 141 | 0.8% |
| Slavic | 38 | 0.2% |
| Slovak | 282 | 1.5% |
| Slovene | 5 | 0.0% |
| South American | 927 | 5.0% |
| South American Indian | 9 | 0.1% |
| Spaniard | 219 | 1.2% |
| Spanish | 70 | 0.4% |
| Sri Lankan | 12 | 0.1% |
| Subsaharan African | 47 | 0.3% |
| Swedish | 69 | 0.4% |
| Thai | 2,386 | 12.8% |
| Trinidadian and Tobagonian | 29 | 0.2% |
| Turkish | 32 | 0.2% |
| Ukrainian | 152 | 0.8% |
| Uruguayan | 13 | 0.1% |
| Venezuelan | 64 | 0.3% |
| Welsh | 28 | 0.2% |
| West Indian | 14 | 0.1% |
| Yugoslavian | 9 | 0.1% | View All 81 Rows |
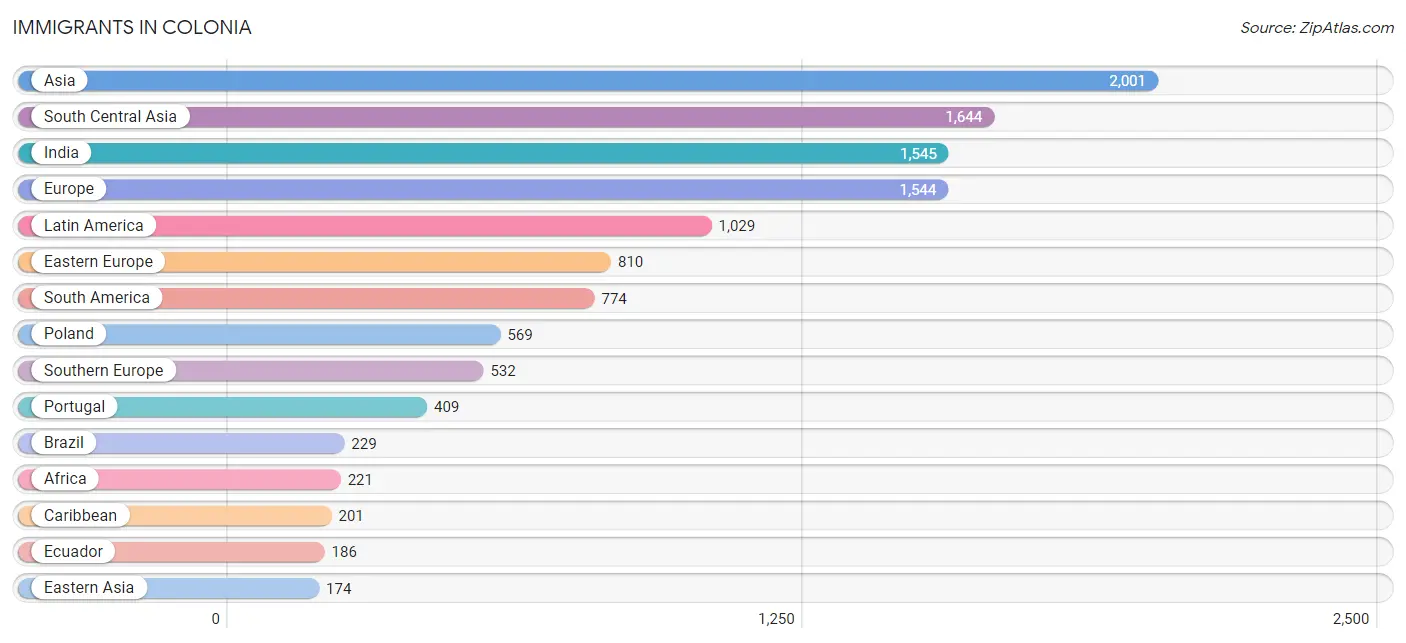
Immigrants in Colonia
The most numerous immigrant groups reported in Colonia came from Asia (2,001 | 10.8%), South Central Asia (1,644 | 8.8%), India (1,545 | 8.3%), Europe (1,544 | 8.3%), and Latin America (1,029 | 5.5%), together accounting for 41.8% of all Colonia residents.
| Immigration Origin | # Population | % Population |
| Africa | 221 | 1.2% |
| Albania | 7 | 0.0% |
| Argentina | 36 | 0.2% |
| Asia | 2,001 | 10.8% |
| Austria | 16 | 0.1% |
| Bangladesh | 26 | 0.1% |
| Bolivia | 9 | 0.1% |
| Brazil | 229 | 1.2% |
| Canada | 10 | 0.1% |
| Caribbean | 201 | 1.1% |
| Central America | 54 | 0.3% |
| Chile | 38 | 0.2% |
| China | 159 | 0.9% |
| Colombia | 106 | 0.6% |
| Croatia | 9 | 0.1% |
| Cuba | 16 | 0.1% |
| Czechoslovakia | 92 | 0.5% |
| Dominican Republic | 171 | 0.9% |
| Eastern Africa | 40 | 0.2% |
| Eastern Asia | 174 | 0.9% |
| Eastern Europe | 810 | 4.4% |
| Ecuador | 186 | 1.0% |
| Egypt | 161 | 0.9% |
| El Salvador | 33 | 0.2% |
| England | 15 | 0.1% |
| Ethiopia | 18 | 0.1% |
| Europe | 1,544 | 8.3% |
| France | 31 | 0.2% |
| Germany | 100 | 0.5% |
| Guyana | 98 | 0.5% |
| Honduras | 21 | 0.1% |
| Hong Kong | 29 | 0.2% |
| India | 1,545 | 8.3% |
| Iran | 14 | 0.1% |
| Ireland | 9 | 0.1% |
| Italy | 57 | 0.3% |
| Kenya | 13 | 0.1% |
| Korea | 15 | 0.1% |
| Latin America | 1,029 | 5.5% |
| Lebanon | 19 | 0.1% |
| Lithuania | 20 | 0.1% |
| Middle Africa | 9 | 0.1% |
| Nigeria | 11 | 0.1% |
| Northern Africa | 161 | 0.9% |
| Northern Europe | 40 | 0.2% |
| Pakistan | 37 | 0.2% |
| Peru | 17 | 0.1% |
| Philippines | 132 | 0.7% |
| Poland | 569 | 3.1% |
| Portugal | 409 | 2.2% |
| Romania | 19 | 0.1% |
| Scotland | 3 | 0.0% |
| South America | 774 | 4.2% |
| South Central Asia | 1,644 | 8.8% |
| South Eastern Asia | 144 | 0.8% |
| Southern Europe | 532 | 2.9% |
| Spain | 66 | 0.4% |
| Sri Lanka | 22 | 0.1% |
| Taiwan | 32 | 0.2% |
| Trinidad and Tobago | 14 | 0.1% |
| Turkey | 16 | 0.1% |
| Ukraine | 94 | 0.5% |
| Venezuela | 55 | 0.3% |
| Vietnam | 12 | 0.1% |
| Western Africa | 11 | 0.1% |
| Western Asia | 39 | 0.2% |
| Western Europe | 147 | 0.8% | View All 67 Rows |
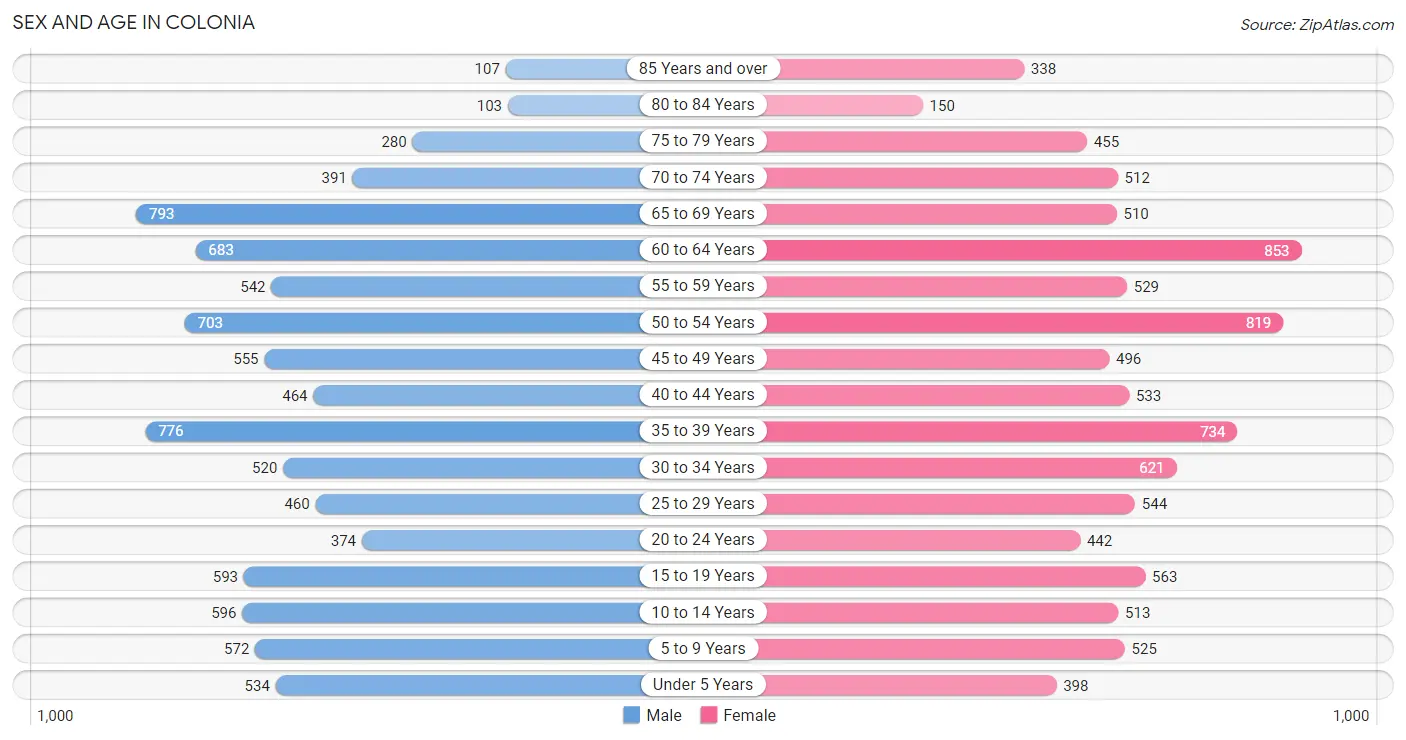
Sex and Age in Colonia
Sex and Age in Colonia
The most populous age groups in Colonia are 65 to 69 Years (793 | 8.8%) for men and 60 to 64 Years (853 | 8.9%) for women.
| Age Bracket | Male | Female |
| Under 5 Years | 534 (5.9%) | 398 (4.2%) |
| 5 to 9 Years | 572 (6.3%) | 525 (5.5%) |
| 10 to 14 Years | 596 (6.6%) | 513 (5.4%) |
| 15 to 19 Years | 593 (6.6%) | 563 (5.9%) |
| 20 to 24 Years | 374 (4.1%) | 442 (4.6%) |
| 25 to 29 Years | 460 (5.1%) | 544 (5.7%) |
| 30 to 34 Years | 520 (5.8%) | 621 (6.5%) |
| 35 to 39 Years | 776 (8.6%) | 734 (7.7%) |
| 40 to 44 Years | 464 (5.1%) | 533 (5.6%) |
| 45 to 49 Years | 555 (6.1%) | 496 (5.2%) |
| 50 to 54 Years | 703 (7.8%) | 819 (8.6%) |
| 55 to 59 Years | 542 (6.0%) | 529 (5.6%) |
| 60 to 64 Years | 683 (7.5%) | 853 (8.9%) |
| 65 to 69 Years | 793 (8.8%) | 510 (5.3%) |
| 70 to 74 Years | 391 (4.3%) | 512 (5.4%) |
| 75 to 79 Years | 280 (3.1%) | 455 (4.8%) |
| 80 to 84 Years | 103 (1.1%) | 150 (1.6%) |
| 85 Years and over | 107 (1.2%) | 338 (3.5%) |
| Total | 9,046 (100.0%) | 9,535 (100.0%) |
Families and Households in Colonia
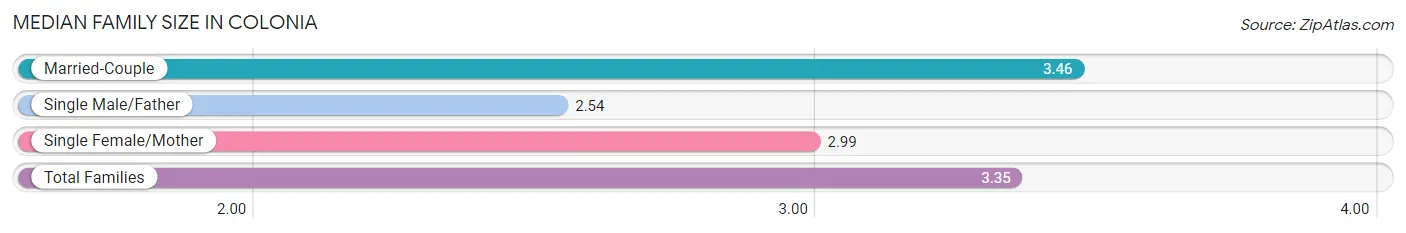
Median Family Size in Colonia
The median family size in Colonia is 3.35 persons per family, with married-couple families (3,989 | 80.4%) accounting for the largest median family size of 3.46 persons per family. On the other hand, single male/father families (176 | 3.5%) represent the smallest median family size with 2.54 persons per family.
| Family Type | # Families | Family Size |
| Married-Couple | 3,989 (80.4%) | 3.46 |
| Single Male/Father | 176 (3.5%) | 2.54 |
| Single Female/Mother | 798 (16.1%) | 2.99 |
| Total Families | 4,963 (100.0%) | 3.35 |
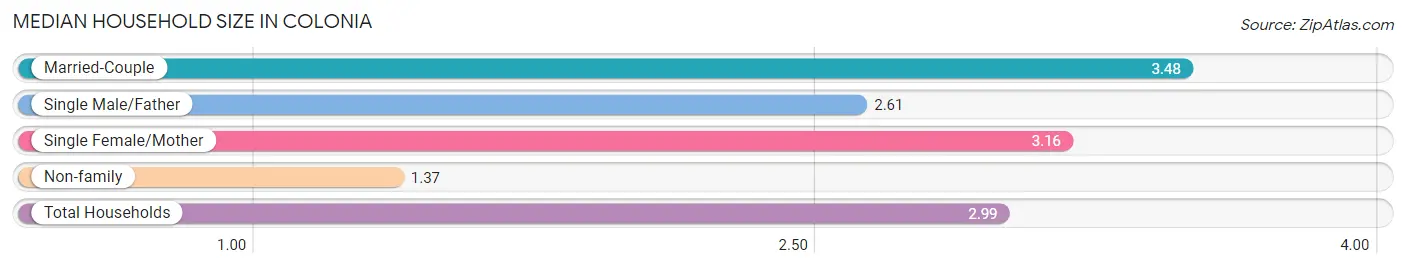
Median Household Size in Colonia
The median household size in Colonia is 2.99 persons per household, with married-couple households (3,989 | 64.1%) accounting for the largest median household size of 3.48 persons per household. non-family households (1,257 | 20.2%) represent the smallest median household size with 1.37 persons per household.
| Household Type | # Households | Household Size |
| Married-Couple | 3,989 (64.1%) | 3.48 |
| Single Male/Father | 176 (2.8%) | 2.61 |
| Single Female/Mother | 798 (12.8%) | 3.16 |
| Non-family | 1,257 (20.2%) | 1.37 |
| Total Households | 6,220 (100.0%) | 2.99 |
Household Size by Marriage Status in Colonia
Out of a total of 6,220 households in Colonia, 4,963 (79.8%) are family households, while 1,257 (20.2%) are nonfamily households. The most numerous type of family households are 2-person households, comprising 1,926, and the most common type of nonfamily households are 1-person households, comprising 911.
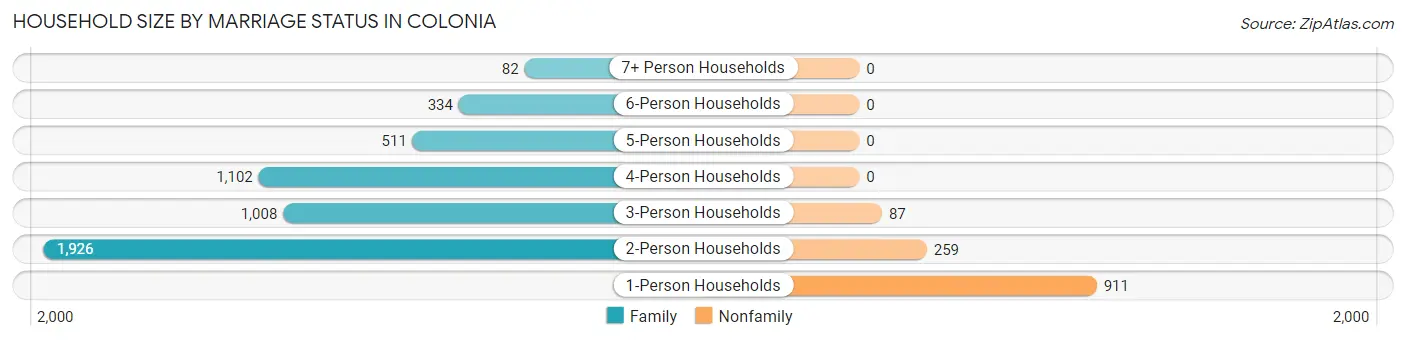
| Household Size | Family Households | Nonfamily Households |
| 1-Person Households | - | 911 (14.6%) |
| 2-Person Households | 1,926 (31.0%) | 259 (4.2%) |
| 3-Person Households | 1,008 (16.2%) | 87 (1.4%) |
| 4-Person Households | 1,102 (17.7%) | 0 (0.0%) |
| 5-Person Households | 511 (8.2%) | 0 (0.0%) |
| 6-Person Households | 334 (5.4%) | 0 (0.0%) |
| 7+ Person Households | 82 (1.3%) | 0 (0.0%) |
| Total | 4,963 (79.8%) | 1,257 (20.2%) |
Female Fertility in Colonia
Fertility by Age in Colonia
Average fertility rate in Colonia is 49.0 births per 1,000 women. Women in the age bracket of 20 to 34 years have the highest fertility rate with 94.0 births per 1,000 women. Women in the age bracket of 20 to 34 years acount for 75.5% of all women with births.
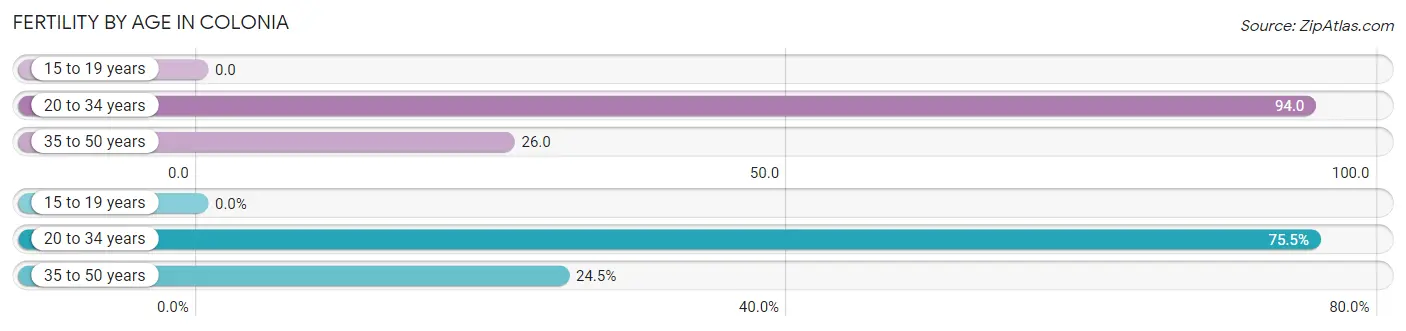
| Age Bracket | Women with Births | Births / 1,000 Women |
| 15 to 19 years | 0 (0.0%) | 0.0 |
| 20 to 34 years | 151 (75.5%) | 94.0 |
| 35 to 50 years | 49 (24.5%) | 26.0 |
| Total | 200 (100.0%) | 49.0 |
Fertility by Age by Marriage Status in Colonia
96.0% of women with births (200) in Colonia are married. The highest percentage of unmarried women with births falls into 35 to 50 years age bracket with 16.3% of them unmarried at the time of birth, while the lowest percentage of unmarried women with births belong to 20 to 34 years age bracket with 0.0% of them unmarried.
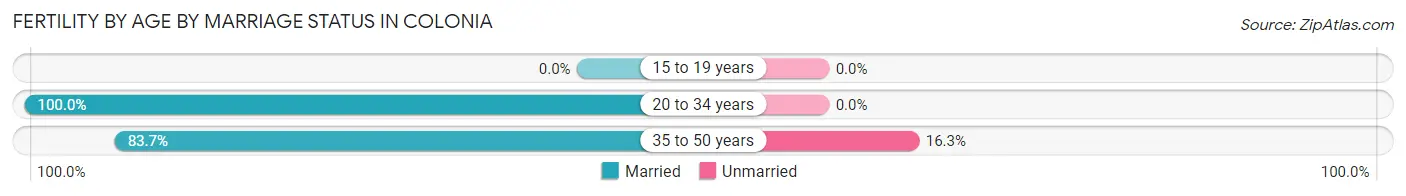
| Age Bracket | Married | Unmarried |
| 15 to 19 years | 0 (0.0%) | 0 (0.0%) |
| 20 to 34 years | 151 (100.0%) | 0 (0.0%) |
| 35 to 50 years | 41 (83.7%) | 8 (16.3%) |
| Total | 192 (96.0%) | 8 (4.0%) |
Fertility by Education in Colonia
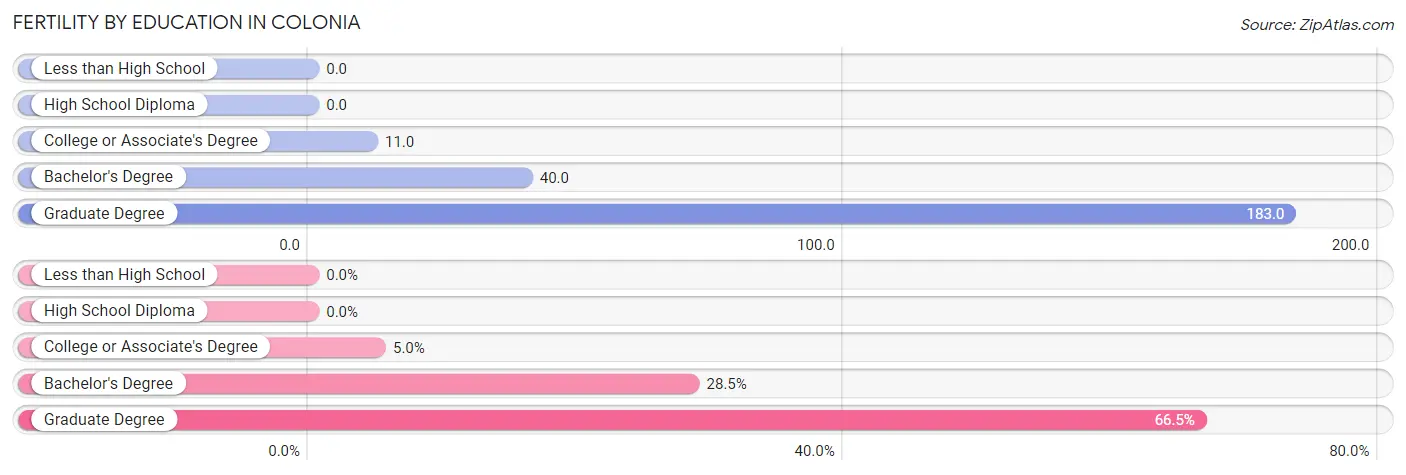
| Educational Attainment | Women with Births | Births / 1,000 Women |
| Less than High School | 0 (0.0%) | 0.0 |
| High School Diploma | 0 (0.0%) | 0.0 |
| College or Associate's Degree | 10 (5.0%) | 11.0 |
| Bachelor's Degree | 57 (28.5%) | 40.0 |
| Graduate Degree | 133 (66.5%) | 183.0 |
| Total | 200 (100.0%) | 49.0 |
Fertility by Education by Marriage Status in Colonia
4.0% of women with births in Colonia are unmarried. Women with the educational attainment of college or associate's degree are most likely to be married with 100.0% of them married at childbirth, while women with the educational attainment of bachelor's degree are least likely to be married with 14.0% of them unmarried at childbirth.
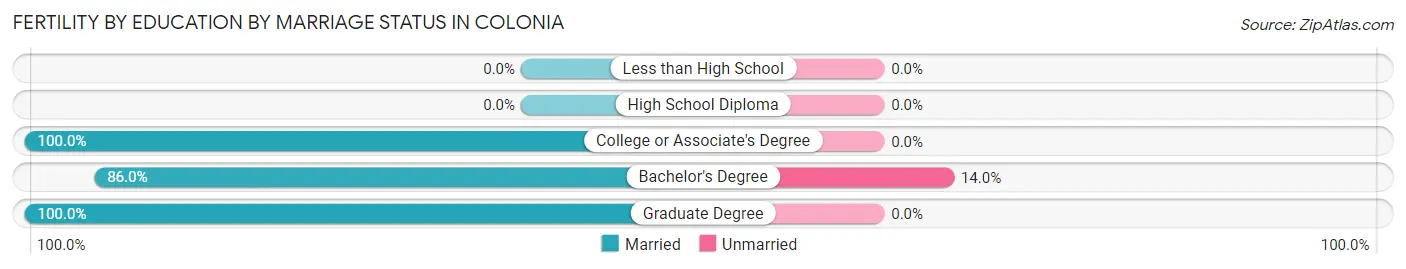
| Educational Attainment | Married | Unmarried |
| Less than High School | 0 (0.0%) | 0 (0.0%) |
| High School Diploma | 0 (0.0%) | 0 (0.0%) |
| College or Associate's Degree | 10 (100.0%) | 0 (0.0%) |
| Bachelor's Degree | 49 (86.0%) | 8 (14.0%) |
| Graduate Degree | 133 (100.0%) | 0 (0.0%) |
| Total | 192 (96.0%) | 8 (4.0%) |
Employment Characteristics in Colonia
Employment by Class of Employer in Colonia
Among the 9,303 employed individuals in Colonia, private company employees (6,548 | 70.4%), local government employees (1,035 | 11.1%), and not-for-profit organizations (527 | 5.7%) make up the most common classes of employment.
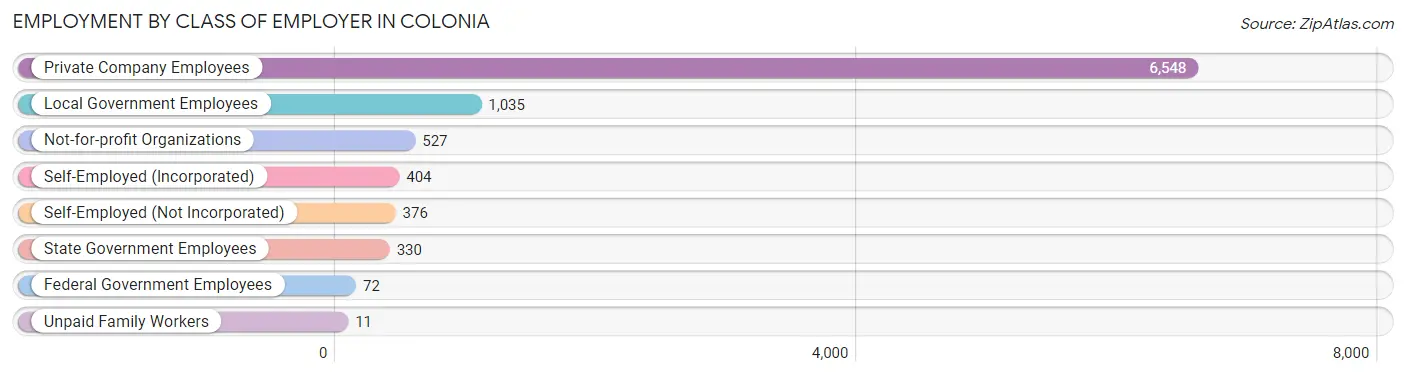
| Employer Class | # Employees | % Employees |
| Private Company Employees | 6,548 | 70.4% |
| Self-Employed (Incorporated) | 404 | 4.3% |
| Self-Employed (Not Incorporated) | 376 | 4.0% |
| Not-for-profit Organizations | 527 | 5.7% |
| Local Government Employees | 1,035 | 11.1% |
| State Government Employees | 330 | 3.5% |
| Federal Government Employees | 72 | 0.8% |
| Unpaid Family Workers | 11 | 0.1% |
| Total | 9,303 | 100.0% |
Employment Status by Age in Colonia
According to the labor force statistics for Colonia, out of the total population over 16 years of age (15,040), 65.4% or 9,836 individuals are in the labor force, with 2.9% or 285 of them unemployed. The age group with the highest labor force participation rate is 35 to 44 years, with 93.4% or 2,342 individuals in the labor force. Within the labor force, the 16 to 19 years age range has the highest percentage of unemployed individuals, with 9.6% or 21 of them being unemployed.
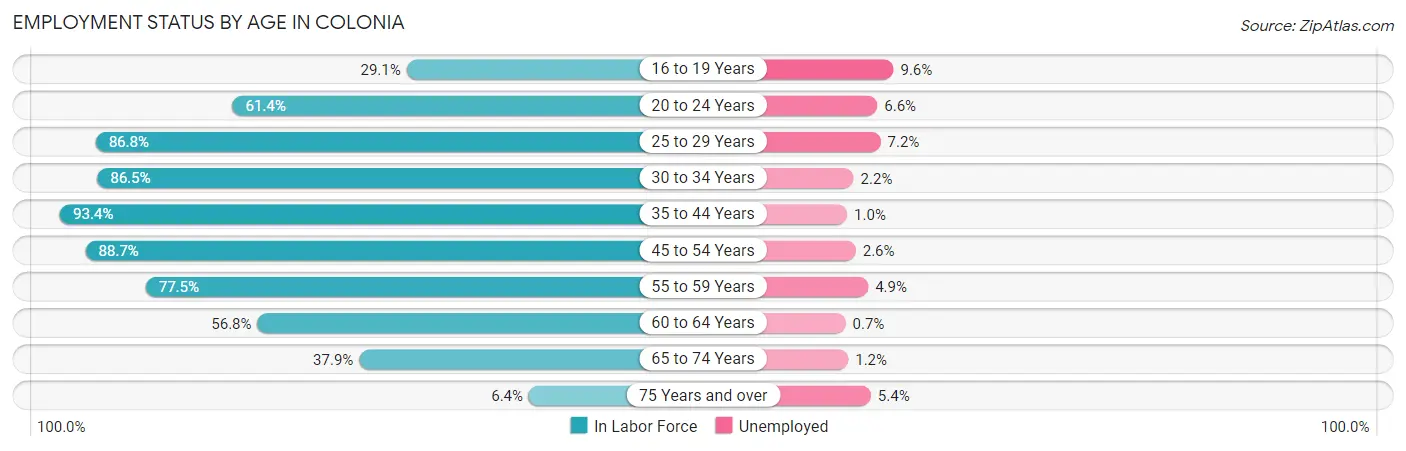
| Age Bracket | In Labor Force | Unemployed |
| 16 to 19 Years | 219 (29.1%) | 21 (9.6%) |
| 20 to 24 Years | 501 (61.4%) | 33 (6.6%) |
| 25 to 29 Years | 871 (86.8%) | 63 (7.2%) |
| 30 to 34 Years | 987 (86.5%) | 22 (2.2%) |
| 35 to 44 Years | 2,342 (93.4%) | 23 (1.0%) |
| 45 to 54 Years | 2,282 (88.7%) | 59 (2.6%) |
| 55 to 59 Years | 830 (77.5%) | 41 (4.9%) |
| 60 to 64 Years | 872 (56.8%) | 6 (0.7%) |
| 65 to 74 Years | 836 (37.9%) | 10 (1.2%) |
| 75 Years and over | 92 (6.4%) | 5 (5.4%) |
| Total | 9,836 (65.4%) | 285 (2.9%) |
Employment Status by Educational Attainment in Colonia
According to labor force statistics for Colonia, 83.2% of individuals (8,180) out of the total population between 25 and 64 years of age (9,832) are in the labor force, with 2.6% or 213 of them being unemployed. The group with the highest labor force participation rate are those with the educational attainment of high school diploma, with 86.0% or 1,454 individuals in the labor force. Within the labor force, individuals with less than high school education have the highest percentage of unemployment, with 8.2% or 35 of them being unemployed.
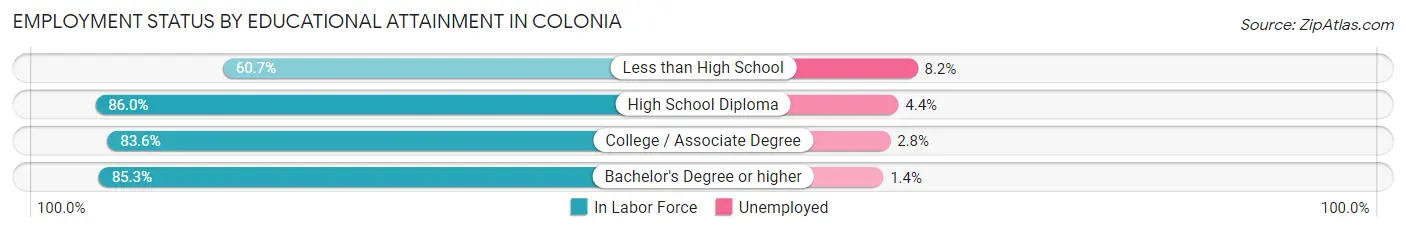
| Educational Attainment | In Labor Force | Unemployed |
| Less than High School | 427 (60.7%) | 58 (8.2%) |
| High School Diploma | 1,454 (86.0%) | 74 (4.4%) |
| College / Associate Degree | 2,121 (83.6%) | 71 (2.8%) |
| Bachelor's Degree or higher | 4,181 (85.3%) | 69 (1.4%) |
| Total | 8,180 (83.2%) | 256 (2.6%) |
Employment Occupations by Sex in Colonia
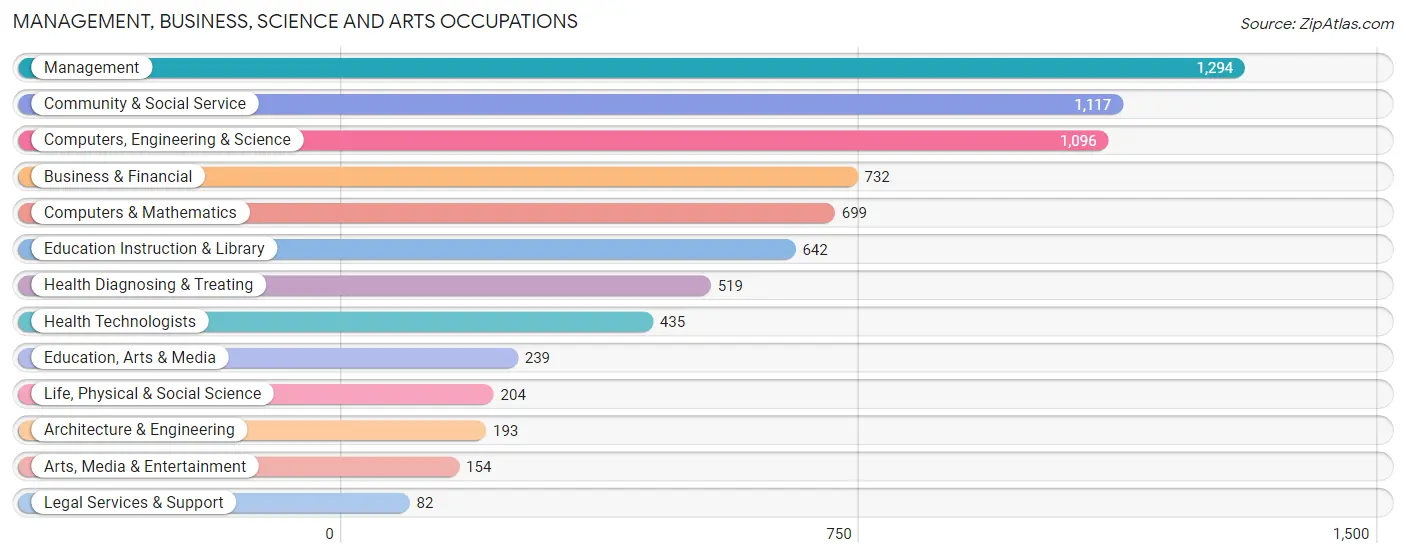
Management, Business, Science and Arts Occupations
The most common Management, Business, Science and Arts occupations in Colonia are Management (1,294 | 13.6%), Community & Social Service (1,117 | 11.7%), Computers, Engineering & Science (1,096 | 11.5%), Business & Financial (732 | 7.7%), and Computers & Mathematics (699 | 7.3%).
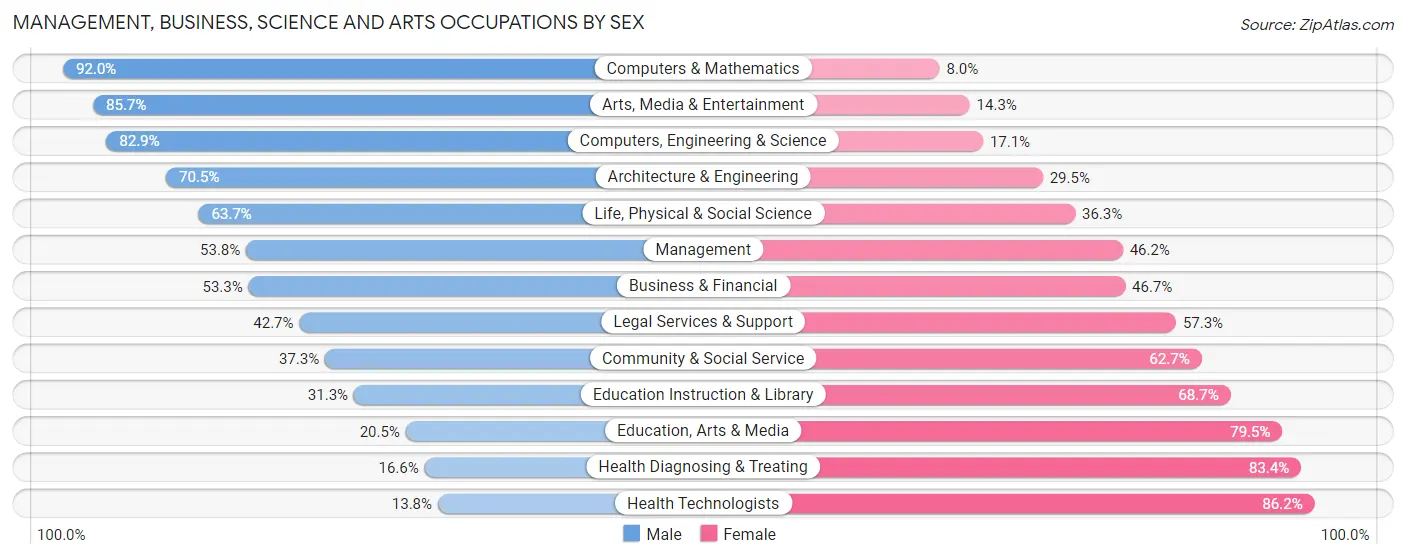
Management, Business, Science and Arts Occupations by Sex
Within the Management, Business, Science and Arts occupations in Colonia, the most male-oriented occupations are Computers & Mathematics (92.0%), Arts, Media & Entertainment (85.7%), and Computers, Engineering & Science (82.9%), while the most female-oriented occupations are Health Technologists (86.2%), Health Diagnosing & Treating (83.4%), and Education, Arts & Media (79.5%).
| Occupation | Male | Female |
| Management | 696 (53.8%) | 598 (46.2%) |
| Business & Financial | 390 (53.3%) | 342 (46.7%) |
| Computers, Engineering & Science | 909 (82.9%) | 187 (17.1%) |
| Computers & Mathematics | 643 (92.0%) | 56 (8.0%) |
| Architecture & Engineering | 136 (70.5%) | 57 (29.5%) |
| Life, Physical & Social Science | 130 (63.7%) | 74 (36.3%) |
| Community & Social Service | 417 (37.3%) | 700 (62.7%) |
| Education, Arts & Media | 49 (20.5%) | 190 (79.5%) |
| Legal Services & Support | 35 (42.7%) | 47 (57.3%) |
| Education Instruction & Library | 201 (31.3%) | 441 (68.7%) |
| Arts, Media & Entertainment | 132 (85.7%) | 22 (14.3%) |
| Health Diagnosing & Treating | 86 (16.6%) | 433 (83.4%) |
| Health Technologists | 60 (13.8%) | 375 (86.2%) |
| Total (Category) | 2,498 (52.5%) | 2,260 (47.5%) |
| Total (Overall) | 5,295 (55.5%) | 4,252 (44.5%) |
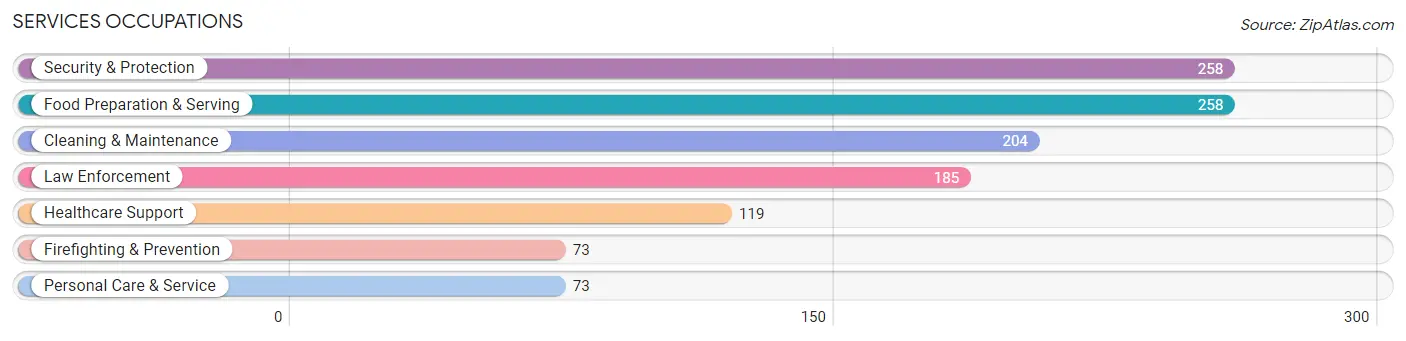
Services Occupations
The most common Services occupations in Colonia are Security & Protection (258 | 2.7%), Food Preparation & Serving (258 | 2.7%), Cleaning & Maintenance (204 | 2.1%), Law Enforcement (185 | 1.9%), and Healthcare Support (119 | 1.3%).
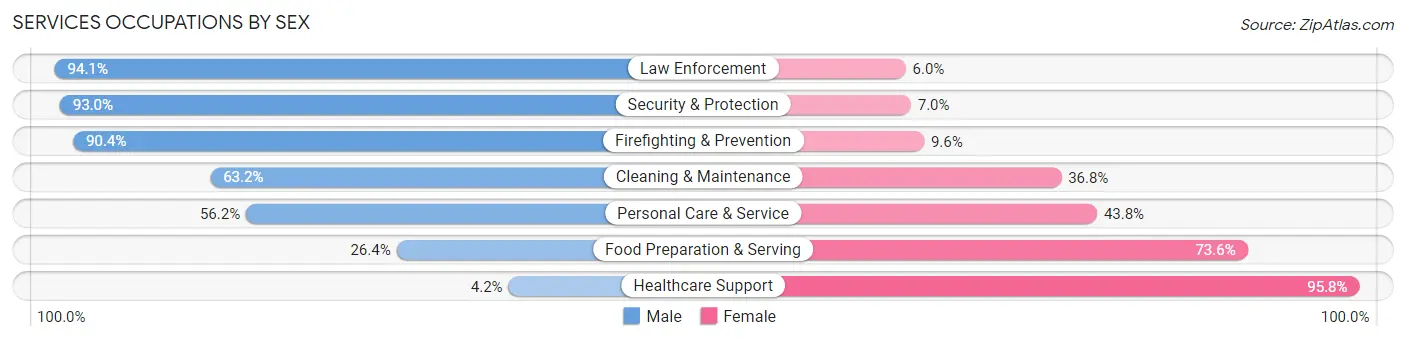
Services Occupations by Sex
Within the Services occupations in Colonia, the most male-oriented occupations are Law Enforcement (94.1%), Security & Protection (93.0%), and Firefighting & Prevention (90.4%), while the most female-oriented occupations are Healthcare Support (95.8%), Food Preparation & Serving (73.6%), and Personal Care & Service (43.8%).
| Occupation | Male | Female |
| Healthcare Support | 5 (4.2%) | 114 (95.8%) |
| Security & Protection | 240 (93.0%) | 18 (7.0%) |
| Firefighting & Prevention | 66 (90.4%) | 7 (9.6%) |
| Law Enforcement | 174 (94.1%) | 11 (5.9%) |
| Food Preparation & Serving | 68 (26.4%) | 190 (73.6%) |
| Cleaning & Maintenance | 129 (63.2%) | 75 (36.8%) |
| Personal Care & Service | 41 (56.2%) | 32 (43.8%) |
| Total (Category) | 483 (53.0%) | 429 (47.0%) |
| Total (Overall) | 5,295 (55.5%) | 4,252 (44.5%) |
Sales and Office Occupations
The most common Sales and Office occupations in Colonia are Office & Administration (1,207 | 12.6%), and Sales & Related (1,042 | 10.9%).

Sales and Office Occupations by Sex
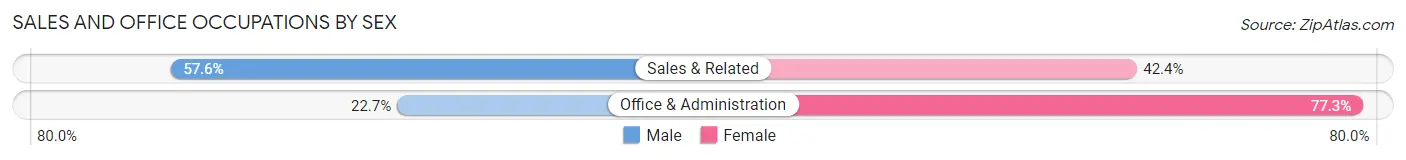
| Occupation | Male | Female |
| Sales & Related | 600 (57.6%) | 442 (42.4%) |
| Office & Administration | 274 (22.7%) | 933 (77.3%) |
| Total (Category) | 874 (38.9%) | 1,375 (61.1%) |
| Total (Overall) | 5,295 (55.5%) | 4,252 (44.5%) |
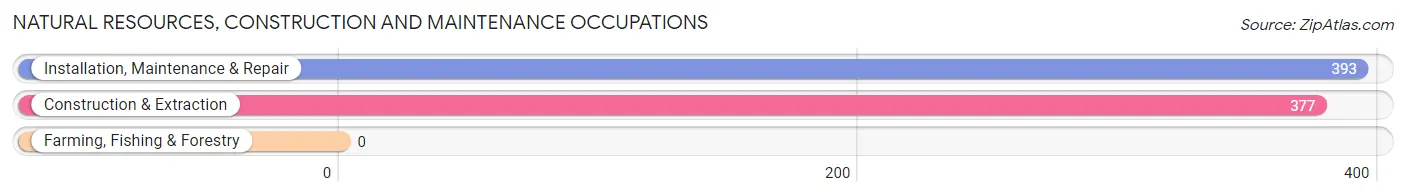
Natural Resources, Construction and Maintenance Occupations
The most common Natural Resources, Construction and Maintenance occupations in Colonia are Installation, Maintenance & Repair (393 | 4.1%), and Construction & Extraction (377 | 4.0%).
Natural Resources, Construction and Maintenance Occupations by Sex
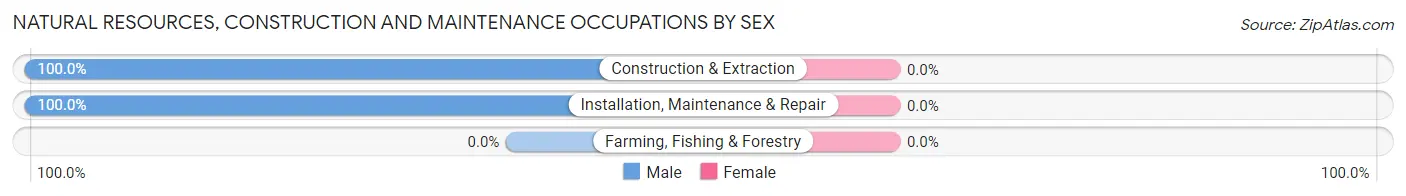
| Occupation | Male | Female |
| Farming, Fishing & Forestry | 0 (0.0%) | 0 (0.0%) |
| Construction & Extraction | 377 (100.0%) | 0 (0.0%) |
| Installation, Maintenance & Repair | 393 (100.0%) | 0 (0.0%) |
| Total (Category) | 770 (100.0%) | 0 (0.0%) |
| Total (Overall) | 5,295 (55.5%) | 4,252 (44.5%) |
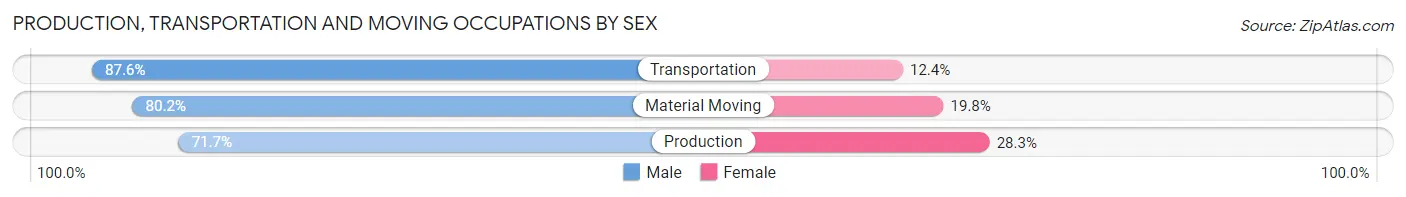
Production, Transportation and Moving Occupations
The most common Production, Transportation and Moving occupations in Colonia are Production (403 | 4.2%), Material Moving (237 | 2.5%), and Transportation (218 | 2.3%).
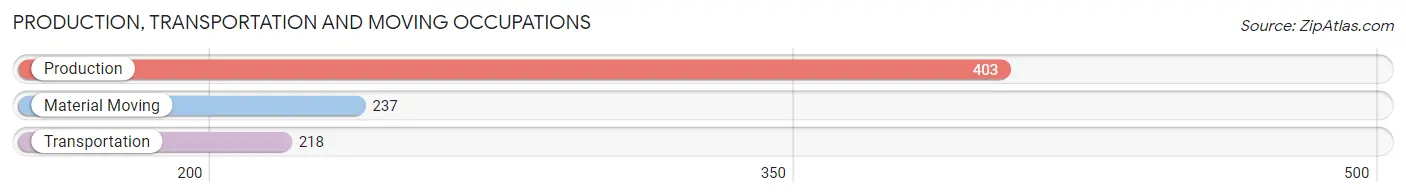
Production, Transportation and Moving Occupations by Sex
| Occupation | Male | Female |
| Production | 289 (71.7%) | 114 (28.3%) |
| Transportation | 191 (87.6%) | 27 (12.4%) |
| Material Moving | 190 (80.2%) | 47 (19.8%) |
| Total (Category) | 670 (78.1%) | 188 (21.9%) |
| Total (Overall) | 5,295 (55.5%) | 4,252 (44.5%) |
Employment Industries by Sex in Colonia
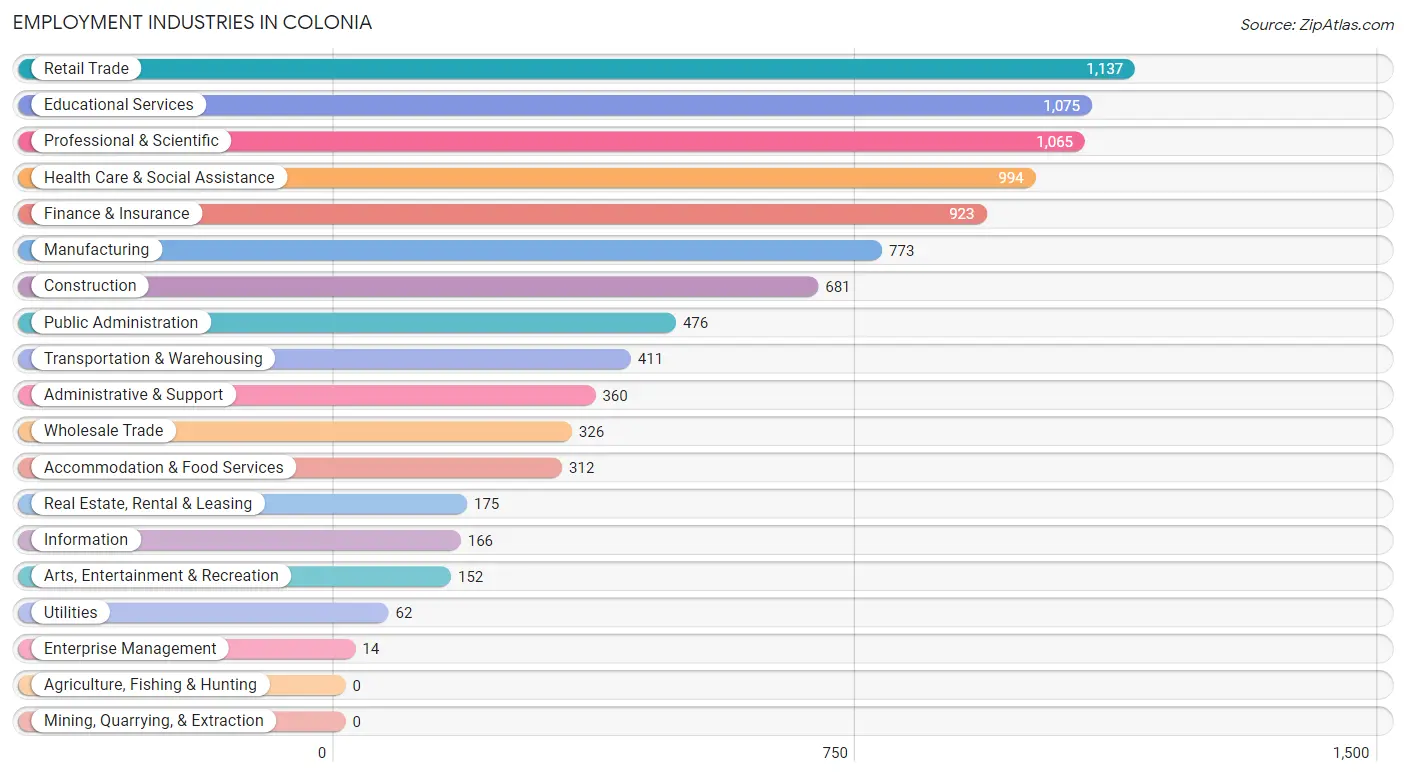
Employment Industries in Colonia
The major employment industries in Colonia include Retail Trade (1,137 | 11.9%), Educational Services (1,075 | 11.3%), Professional & Scientific (1,065 | 11.2%), Health Care & Social Assistance (994 | 10.4%), and Finance & Insurance (923 | 9.7%).
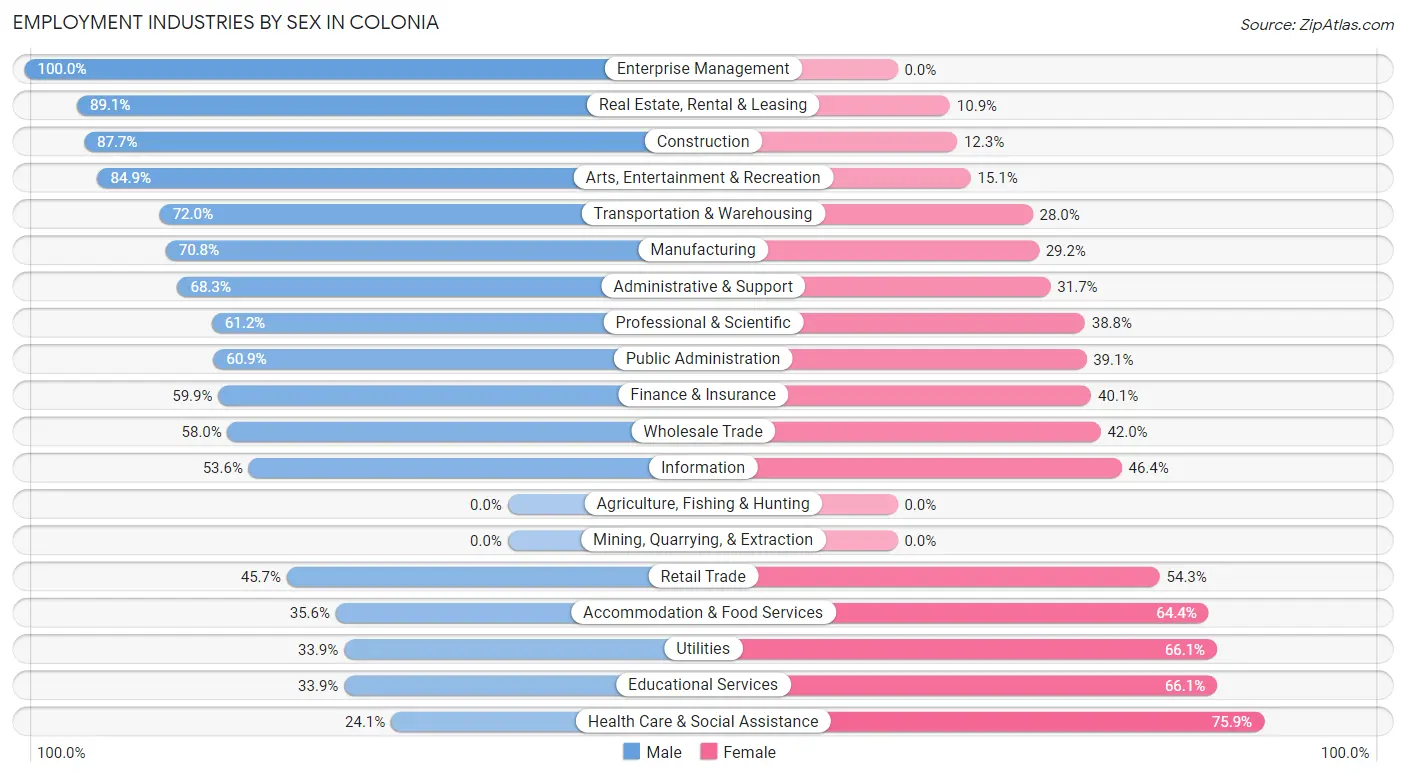
Employment Industries by Sex in Colonia
The Colonia industries that see more men than women are Enterprise Management (100.0%), Real Estate, Rental & Leasing (89.1%), and Construction (87.7%), whereas the industries that tend to have a higher number of women are Health Care & Social Assistance (75.9%), Educational Services (66.1%), and Utilities (66.1%).
| Industry | Male | Female |
| Agriculture, Fishing & Hunting | 0 (0.0%) | 0 (0.0%) |
| Mining, Quarrying, & Extraction | 0 (0.0%) | 0 (0.0%) |
| Construction | 597 (87.7%) | 84 (12.3%) |
| Manufacturing | 547 (70.8%) | 226 (29.2%) |
| Wholesale Trade | 189 (58.0%) | 137 (42.0%) |
| Retail Trade | 520 (45.7%) | 617 (54.3%) |
| Transportation & Warehousing | 296 (72.0%) | 115 (28.0%) |
| Utilities | 21 (33.9%) | 41 (66.1%) |
| Information | 89 (53.6%) | 77 (46.4%) |
| Finance & Insurance | 553 (59.9%) | 370 (40.1%) |
| Real Estate, Rental & Leasing | 156 (89.1%) | 19 (10.9%) |
| Professional & Scientific | 652 (61.2%) | 413 (38.8%) |
| Enterprise Management | 14 (100.0%) | 0 (0.0%) |
| Administrative & Support | 246 (68.3%) | 114 (31.7%) |
| Educational Services | 364 (33.9%) | 711 (66.1%) |
| Health Care & Social Assistance | 240 (24.1%) | 754 (75.9%) |
| Arts, Entertainment & Recreation | 129 (84.9%) | 23 (15.1%) |
| Accommodation & Food Services | 111 (35.6%) | 201 (64.4%) |
| Public Administration | 290 (60.9%) | 186 (39.1%) |
| Total | 5,295 (55.5%) | 4,252 (44.5%) |
Education in Colonia
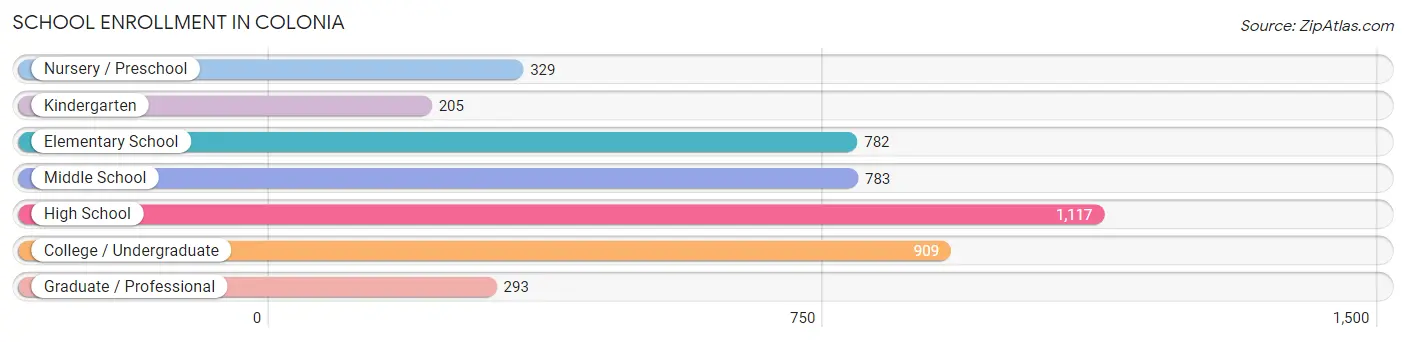
School Enrollment in Colonia
The most common levels of schooling among the 4,418 students in Colonia are high school (1,117 | 25.3%), college / undergraduate (909 | 20.6%), and middle school (783 | 17.7%).
| School Level | # Students | % Students |
| Nursery / Preschool | 329 | 7.4% |
| Kindergarten | 205 | 4.6% |
| Elementary School | 782 | 17.7% |
| Middle School | 783 | 17.7% |
| High School | 1,117 | 25.3% |
| College / Undergraduate | 909 | 20.6% |
| Graduate / Professional | 293 | 6.6% |
| Total | 4,418 | 100.0% |
School Enrollment by Age by Funding Source in Colonia
Out of a total of 4,418 students who are enrolled in schools in Colonia, 906 (20.5%) attend a private institution, while the remaining 3,512 (79.5%) are enrolled in public schools. The age group of 3 to 4 year olds has the highest likelihood of being enrolled in private schools, with 187 (88.2% in the age bracket) enrolled. Conversely, the age group of 10 to 14 year olds has the lowest likelihood of being enrolled in a private school, with 1,020 (94.2% in the age bracket) attending a public institution.
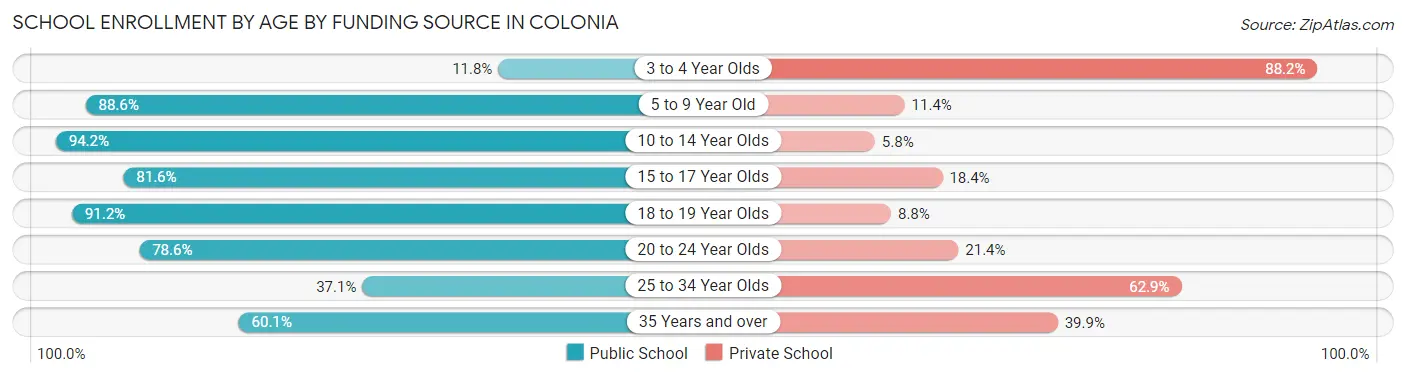
| Age Bracket | Public School | Private School |
| 3 to 4 Year Olds | 25 (11.8%) | 187 (88.2%) |
| 5 to 9 Year Old | 921 (88.6%) | 118 (11.4%) |
| 10 to 14 Year Olds | 1,020 (94.2%) | 63 (5.8%) |
| 15 to 17 Year Olds | 692 (81.6%) | 156 (18.4%) |
| 18 to 19 Year Olds | 248 (91.2%) | 24 (8.8%) |
| 20 to 24 Year Olds | 405 (78.6%) | 110 (21.4%) |
| 25 to 34 Year Olds | 108 (37.1%) | 183 (62.9%) |
| 35 Years and over | 95 (60.1%) | 63 (39.9%) |
| Total | 3,512 (79.5%) | 906 (20.5%) |
Educational Attainment by Field of Study in Colonia
Business (1,316 | 20.7%), science & technology (781 | 12.3%), education (749 | 11.8%), engineering (623 | 9.8%), and social sciences (482 | 7.6%) are the most common fields of study among 6,345 individuals in Colonia who have obtained a bachelor's degree or higher.
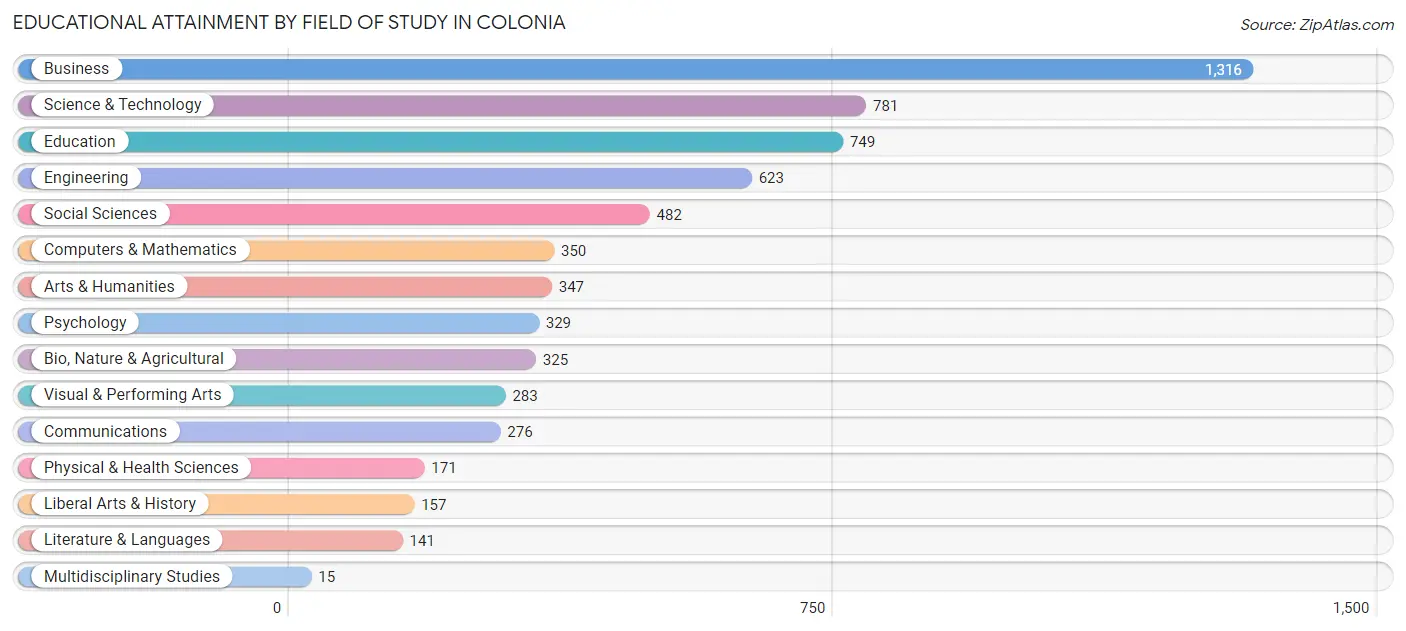
| Field of Study | # Graduates | % Graduates |
| Computers & Mathematics | 350 | 5.5% |
| Bio, Nature & Agricultural | 325 | 5.1% |
| Physical & Health Sciences | 171 | 2.7% |
| Psychology | 329 | 5.2% |
| Social Sciences | 482 | 7.6% |
| Engineering | 623 | 9.8% |
| Multidisciplinary Studies | 15 | 0.2% |
| Science & Technology | 781 | 12.3% |
| Business | 1,316 | 20.7% |
| Education | 749 | 11.8% |
| Literature & Languages | 141 | 2.2% |
| Liberal Arts & History | 157 | 2.5% |
| Visual & Performing Arts | 283 | 4.5% |
| Communications | 276 | 4.3% |
| Arts & Humanities | 347 | 5.5% |
| Total | 6,345 | 100.0% |
Transportation & Commute in Colonia
Vehicle Availability by Sex in Colonia
The most prevalent vehicle ownership categories in Colonia are males with 2 vehicles (2,292, accounting for 43.7%) and females with 2 vehicles (1,847, making up 56.6%).
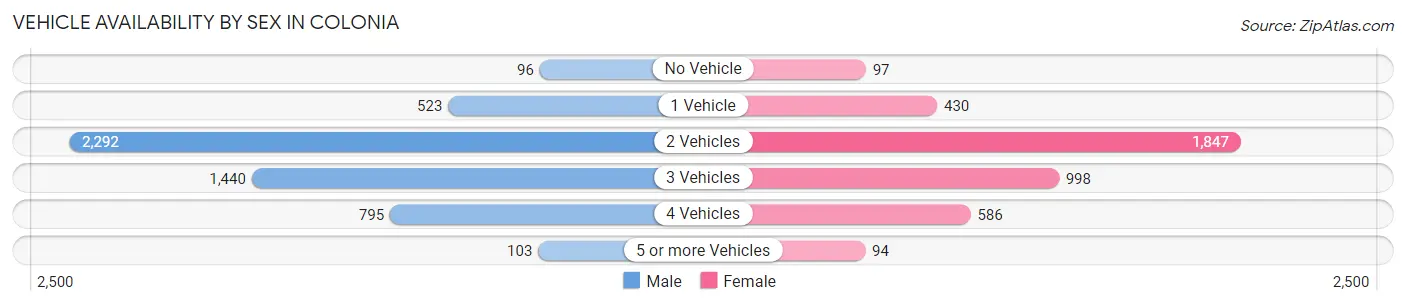
| Vehicles Available | Male | Female |
| No Vehicle | 96 (1.8%) | 97 (2.4%) |
| 1 Vehicle | 523 (10.0%) | 430 (10.6%) |
| 2 Vehicles | 2,292 (43.7%) | 1,847 (45.6%) |
| 3 Vehicles | 1,440 (27.4%) | 998 (24.6%) |
| 4 Vehicles | 795 (15.1%) | 586 (14.5%) |
| 5 or more Vehicles | 103 (2.0%) | 94 (2.3%) |
| Total | 5,249 (100.0%) | 4,052 (100.0%) |
Commute Time in Colonia
The most frequently occuring commute durations in Colonia are 30 to 34 minutes (1,480 commuters, 17.9%), 45 to 59 minutes (1,253 commuters, 15.2%), and 20 to 24 minutes (1,014 commuters, 12.3%).
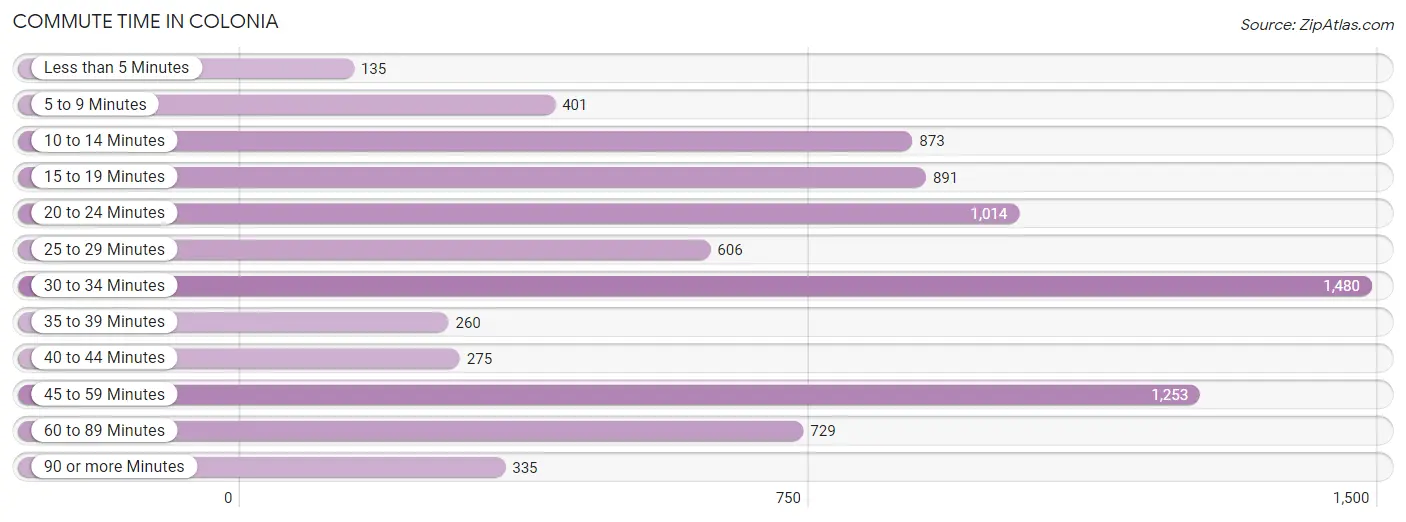
| Commute Time | # Commuters | % Commuters |
| Less than 5 Minutes | 135 | 1.6% |
| 5 to 9 Minutes | 401 | 4.9% |
| 10 to 14 Minutes | 873 | 10.6% |
| 15 to 19 Minutes | 891 | 10.8% |
| 20 to 24 Minutes | 1,014 | 12.3% |
| 25 to 29 Minutes | 606 | 7.3% |
| 30 to 34 Minutes | 1,480 | 17.9% |
| 35 to 39 Minutes | 260 | 3.2% |
| 40 to 44 Minutes | 275 | 3.3% |
| 45 to 59 Minutes | 1,253 | 15.2% |
| 60 to 89 Minutes | 729 | 8.8% |
| 90 or more Minutes | 335 | 4.1% |
Commute Time by Sex in Colonia
The most common commute times in Colonia are 45 to 59 minutes (890 commuters, 19.1%) for males and 30 to 34 minutes (696 commuters, 19.4%) for females.
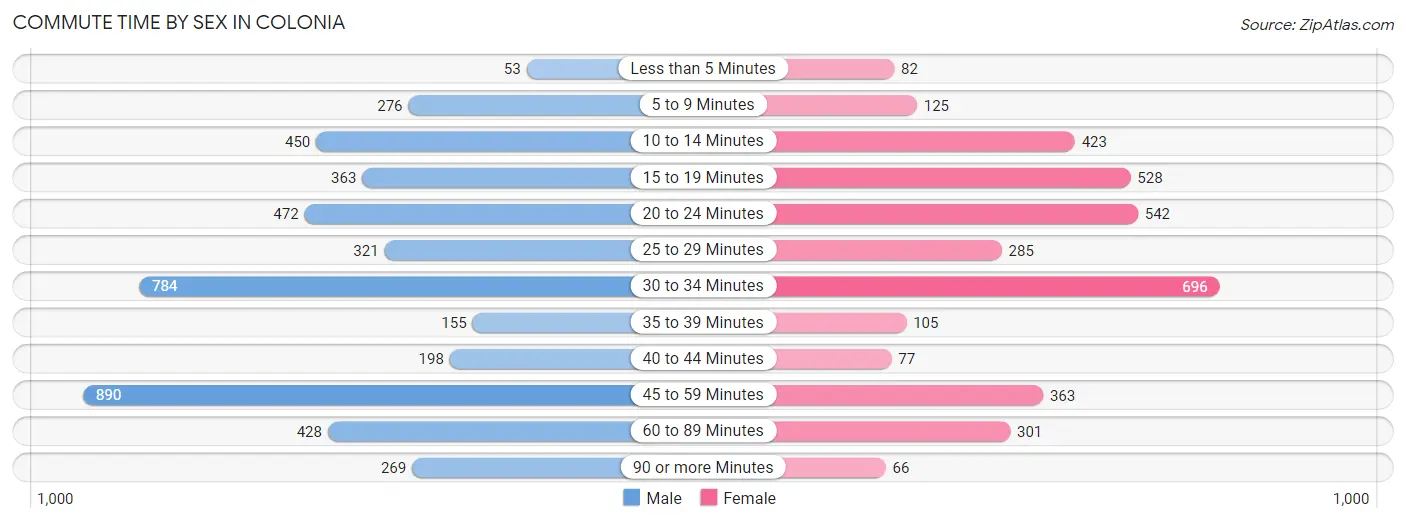
| Commute Time | Male | Female |
| Less than 5 Minutes | 53 (1.1%) | 82 (2.3%) |
| 5 to 9 Minutes | 276 (5.9%) | 125 (3.5%) |
| 10 to 14 Minutes | 450 (9.7%) | 423 (11.8%) |
| 15 to 19 Minutes | 363 (7.8%) | 528 (14.7%) |
| 20 to 24 Minutes | 472 (10.1%) | 542 (15.1%) |
| 25 to 29 Minutes | 321 (6.9%) | 285 (7.9%) |
| 30 to 34 Minutes | 784 (16.8%) | 696 (19.4%) |
| 35 to 39 Minutes | 155 (3.3%) | 105 (2.9%) |
| 40 to 44 Minutes | 198 (4.3%) | 77 (2.1%) |
| 45 to 59 Minutes | 890 (19.1%) | 363 (10.1%) |
| 60 to 89 Minutes | 428 (9.2%) | 301 (8.4%) |
| 90 or more Minutes | 269 (5.8%) | 66 (1.8%) |
Time of Departure to Work by Sex in Colonia
The most frequent times of departure to work in Colonia are 7:00 AM to 7:29 AM (770, 16.5%) for males and 8:00 AM to 8:29 AM (708, 19.7%) for females.
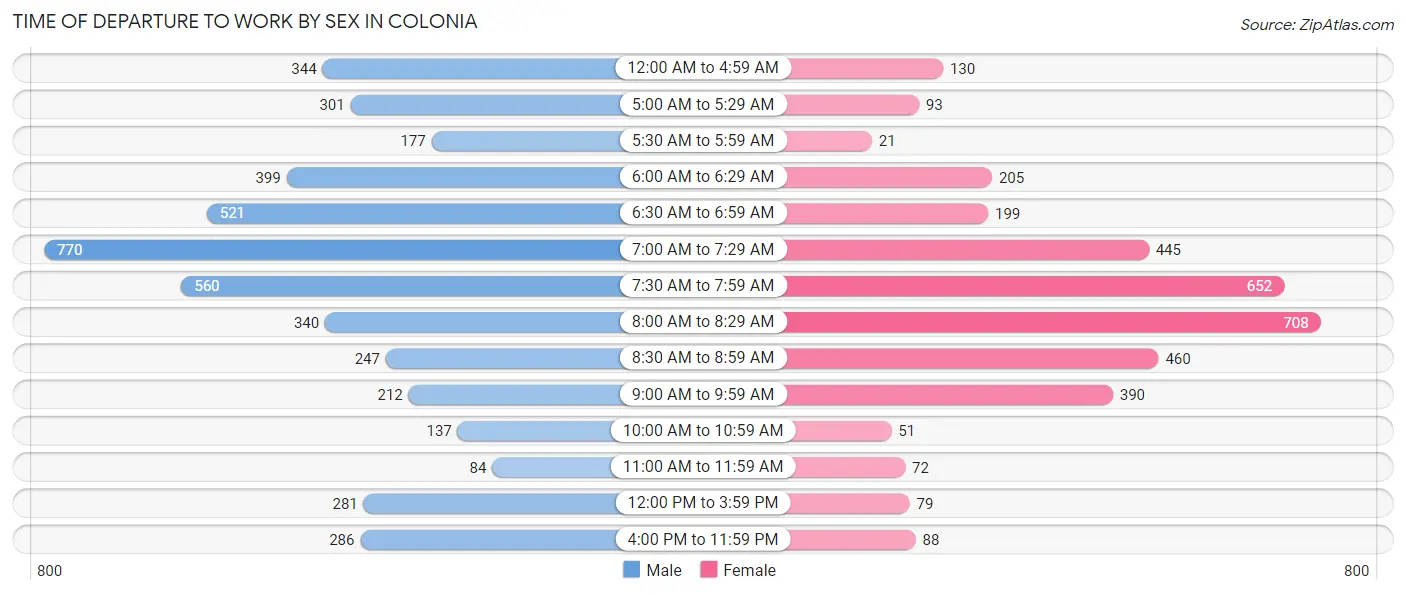
| Time of Departure | Male | Female |
| 12:00 AM to 4:59 AM | 344 (7.4%) | 130 (3.6%) |
| 5:00 AM to 5:29 AM | 301 (6.5%) | 93 (2.6%) |
| 5:30 AM to 5:59 AM | 177 (3.8%) | 21 (0.6%) |
| 6:00 AM to 6:29 AM | 399 (8.6%) | 205 (5.7%) |
| 6:30 AM to 6:59 AM | 521 (11.2%) | 199 (5.5%) |
| 7:00 AM to 7:29 AM | 770 (16.5%) | 445 (12.4%) |
| 7:30 AM to 7:59 AM | 560 (12.0%) | 652 (18.1%) |
| 8:00 AM to 8:29 AM | 340 (7.3%) | 708 (19.7%) |
| 8:30 AM to 8:59 AM | 247 (5.3%) | 460 (12.8%) |
| 9:00 AM to 9:59 AM | 212 (4.5%) | 390 (10.8%) |
| 10:00 AM to 10:59 AM | 137 (2.9%) | 51 (1.4%) |
| 11:00 AM to 11:59 AM | 84 (1.8%) | 72 (2.0%) |
| 12:00 PM to 3:59 PM | 281 (6.0%) | 79 (2.2%) |
| 4:00 PM to 11:59 PM | 286 (6.1%) | 88 (2.5%) |
| Total | 4,659 (100.0%) | 3,593 (100.0%) |
Housing Occupancy in Colonia
Occupancy by Ownership in Colonia
Of the total 6,220 dwellings in Colonia, owner-occupied units account for 5,558 (89.4%), while renter-occupied units make up 662 (10.6%).
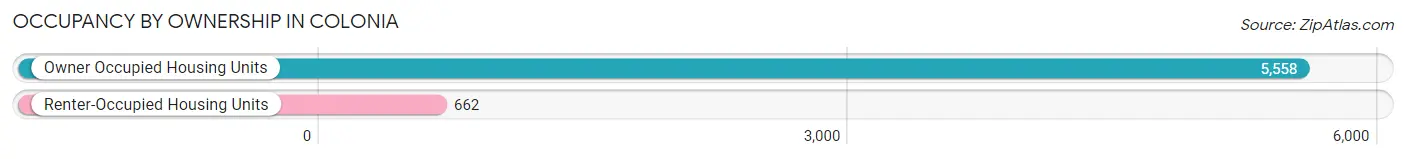
| Occupancy | # Housing Units | % Housing Units |
| Owner Occupied Housing Units | 5,558 | 89.4% |
| Renter-Occupied Housing Units | 662 | 10.6% |
| Total Occupied Housing Units | 6,220 | 100.0% |
Occupancy by Household Size in Colonia
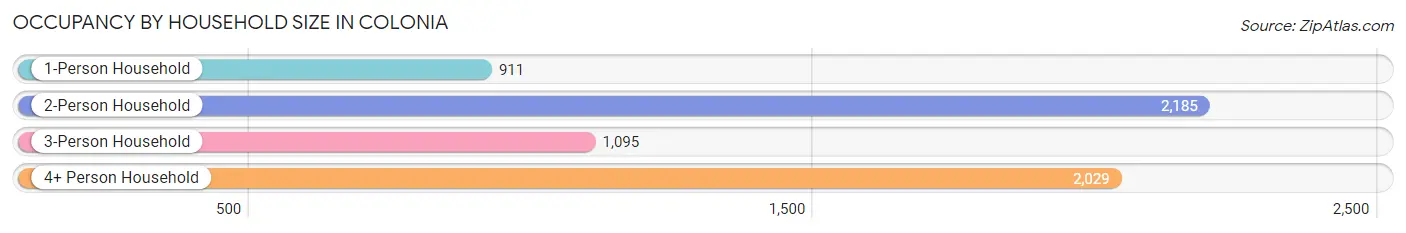
| Household Size | # Housing Units | % Housing Units |
| 1-Person Household | 911 | 14.6% |
| 2-Person Household | 2,185 | 35.1% |
| 3-Person Household | 1,095 | 17.6% |
| 4+ Person Household | 2,029 | 32.6% |
| Total Housing Units | 6,220 | 100.0% |
Occupancy by Ownership by Household Size in Colonia
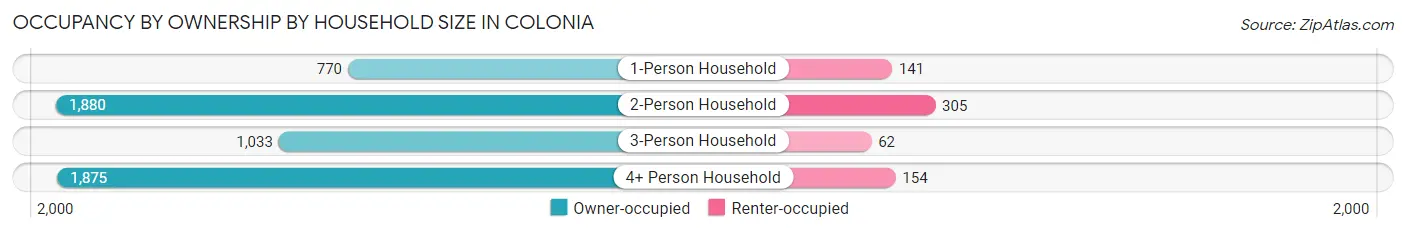
| Household Size | Owner-occupied | Renter-occupied |
| 1-Person Household | 770 (84.5%) | 141 (15.5%) |
| 2-Person Household | 1,880 (86.0%) | 305 (14.0%) |
| 3-Person Household | 1,033 (94.3%) | 62 (5.7%) |
| 4+ Person Household | 1,875 (92.4%) | 154 (7.6%) |
| Total Housing Units | 5,558 (89.4%) | 662 (10.6%) |
Occupancy by Educational Attainment in Colonia
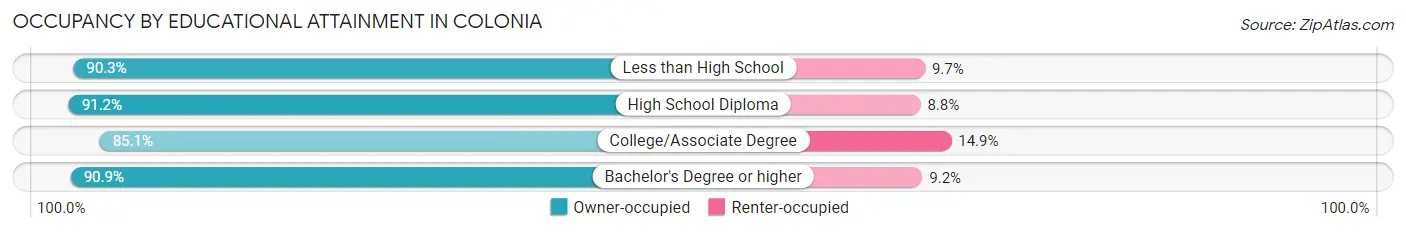
| Household Size | Owner-occupied | Renter-occupied |
| Less than High School | 327 (90.3%) | 35 (9.7%) |
| High School Diploma | 1,298 (91.2%) | 125 (8.8%) |
| College/Associate Degree | 1,422 (85.1%) | 249 (14.9%) |
| Bachelor's Degree or higher | 2,511 (90.8%) | 253 (9.1%) |
Occupancy by Age of Householder in Colonia
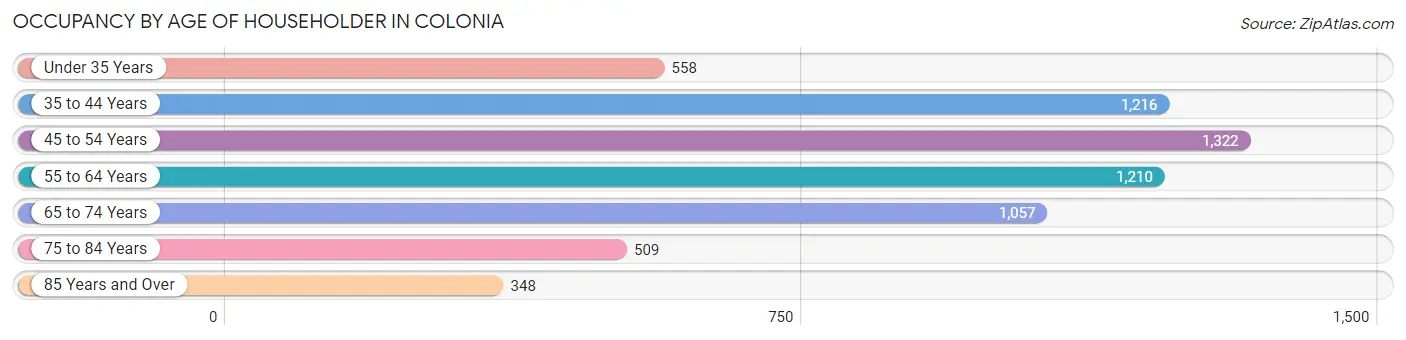
| Age Bracket | # Households | % Households |
| Under 35 Years | 558 | 9.0% |
| 35 to 44 Years | 1,216 | 19.6% |
| 45 to 54 Years | 1,322 | 21.2% |
| 55 to 64 Years | 1,210 | 19.5% |
| 65 to 74 Years | 1,057 | 17.0% |
| 75 to 84 Years | 509 | 8.2% |
| 85 Years and Over | 348 | 5.6% |
| Total | 6,220 | 100.0% |
Housing Finances in Colonia
Median Income by Occupancy in Colonia
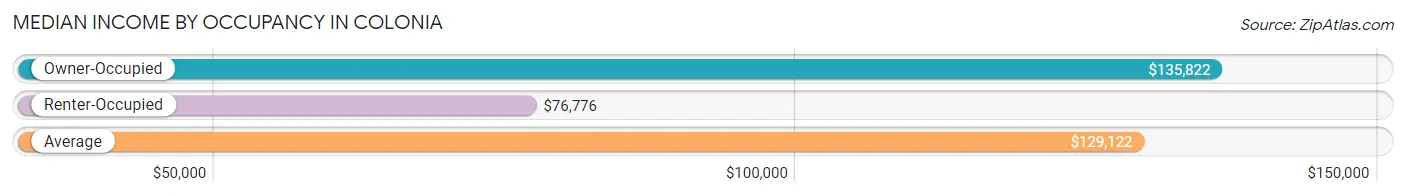
| Occupancy Type | # Households | Median Income |
| Owner-Occupied | 5,558 (89.4%) | $135,822 |
| Renter-Occupied | 662 (10.6%) | $76,776 |
| Average | 6,220 (100.0%) | $129,122 |
Occupancy by Householder Income Bracket in Colonia
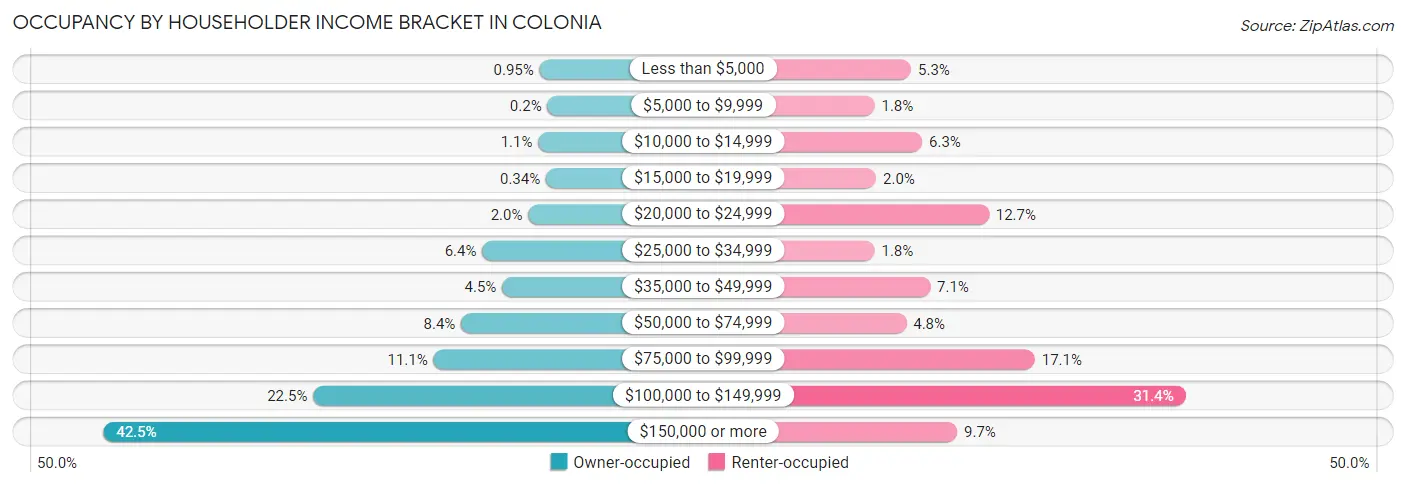
| Income Bracket | Owner-occupied | Renter-occupied |
| Less than $5,000 | 53 (0.9%) | 35 (5.3%) |
| $5,000 to $9,999 | 11 (0.2%) | 12 (1.8%) |
| $10,000 to $14,999 | 60 (1.1%) | 42 (6.3%) |
| $15,000 to $19,999 | 19 (0.3%) | 13 (2.0%) |
| $20,000 to $24,999 | 113 (2.0%) | 84 (12.7%) |
| $25,000 to $34,999 | 356 (6.4%) | 12 (1.8%) |
| $35,000 to $49,999 | 251 (4.5%) | 47 (7.1%) |
| $50,000 to $74,999 | 468 (8.4%) | 32 (4.8%) |
| $75,000 to $99,999 | 614 (11.1%) | 113 (17.1%) |
| $100,000 to $149,999 | 1,251 (22.5%) | 208 (31.4%) |
| $150,000 or more | 2,362 (42.5%) | 64 (9.7%) |
| Total | 5,558 (100.0%) | 662 (100.0%) |
Monthly Housing Cost Tiers in Colonia
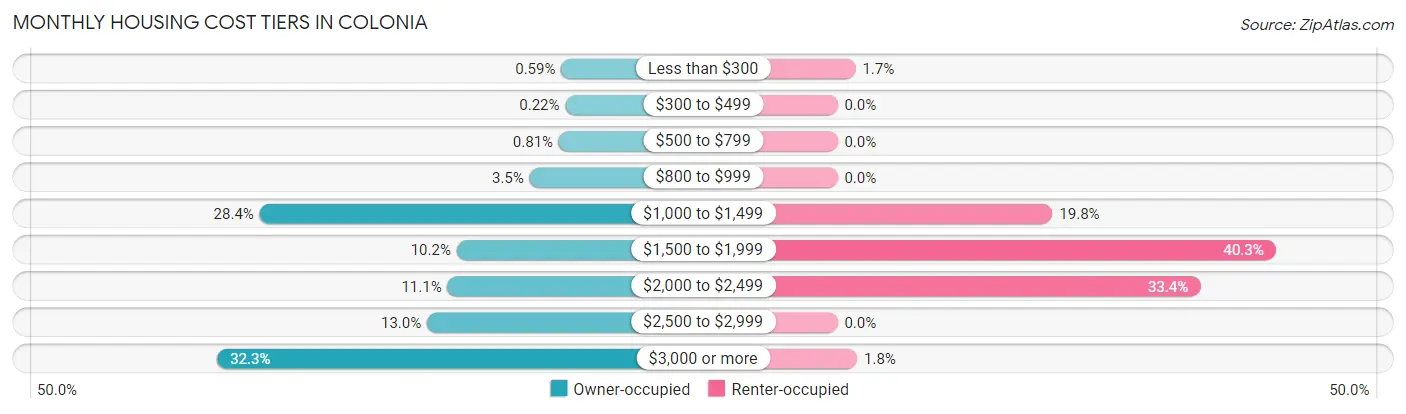
| Monthly Cost | Owner-occupied | Renter-occupied |
| Less than $300 | 33 (0.6%) | 11 (1.7%) |
| $300 to $499 | 12 (0.2%) | 0 (0.0%) |
| $500 to $799 | 45 (0.8%) | 0 (0.0%) |
| $800 to $999 | 195 (3.5%) | 0 (0.0%) |
| $1,000 to $1,499 | 1,576 (28.4%) | 131 (19.8%) |
| $1,500 to $1,999 | 568 (10.2%) | 267 (40.3%) |
| $2,000 to $2,499 | 615 (11.1%) | 221 (33.4%) |
| $2,500 to $2,999 | 720 (13.0%) | 0 (0.0%) |
| $3,000 or more | 1,794 (32.3%) | 12 (1.8%) |
| Total | 5,558 (100.0%) | 662 (100.0%) |
Physical Housing Characteristics in Colonia
Housing Structures in Colonia
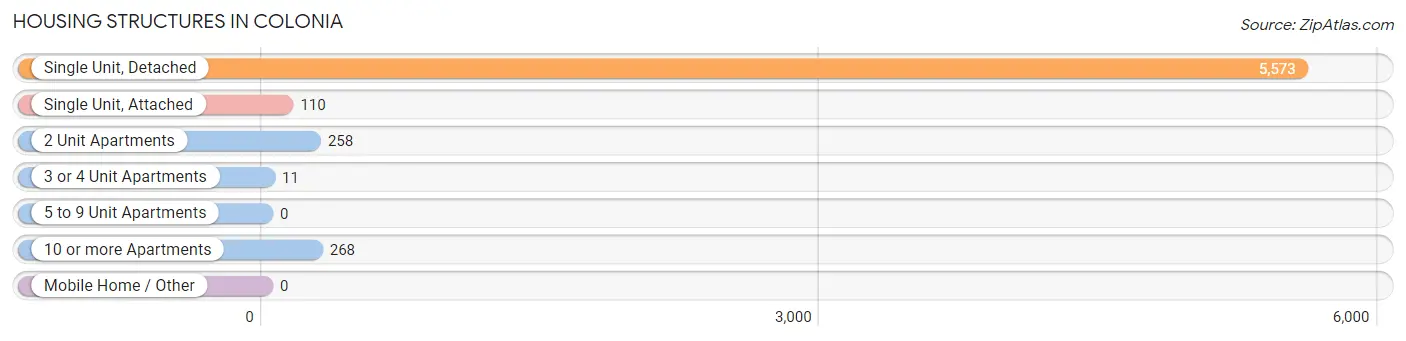
| Structure Type | # Housing Units | % Housing Units |
| Single Unit, Detached | 5,573 | 89.6% |
| Single Unit, Attached | 110 | 1.8% |
| 2 Unit Apartments | 258 | 4.2% |
| 3 or 4 Unit Apartments | 11 | 0.2% |
| 5 to 9 Unit Apartments | 0 | 0.0% |
| 10 or more Apartments | 268 | 4.3% |
| Mobile Home / Other | 0 | 0.0% |
| Total | 6,220 | 100.0% |
Housing Structures by Occupancy in Colonia
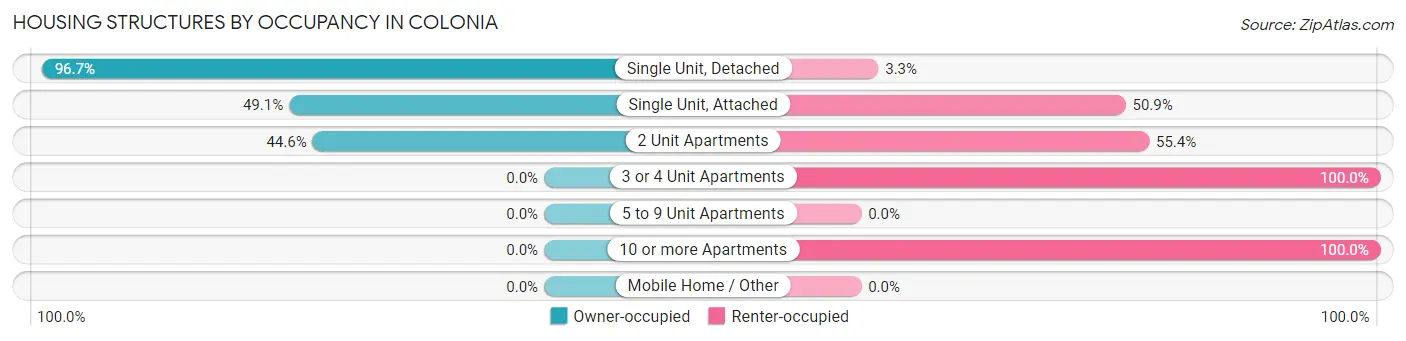
| Structure Type | Owner-occupied | Renter-occupied |
| Single Unit, Detached | 5,389 (96.7%) | 184 (3.3%) |
| Single Unit, Attached | 54 (49.1%) | 56 (50.9%) |
| 2 Unit Apartments | 115 (44.6%) | 143 (55.4%) |
| 3 or 4 Unit Apartments | 0 (0.0%) | 11 (100.0%) |
| 5 to 9 Unit Apartments | 0 (0.0%) | 0 (0.0%) |
| 10 or more Apartments | 0 (0.0%) | 268 (100.0%) |
| Mobile Home / Other | 0 (0.0%) | 0 (0.0%) |
| Total | 5,558 (89.4%) | 662 (10.6%) |
Housing Structures by Number of Rooms in Colonia
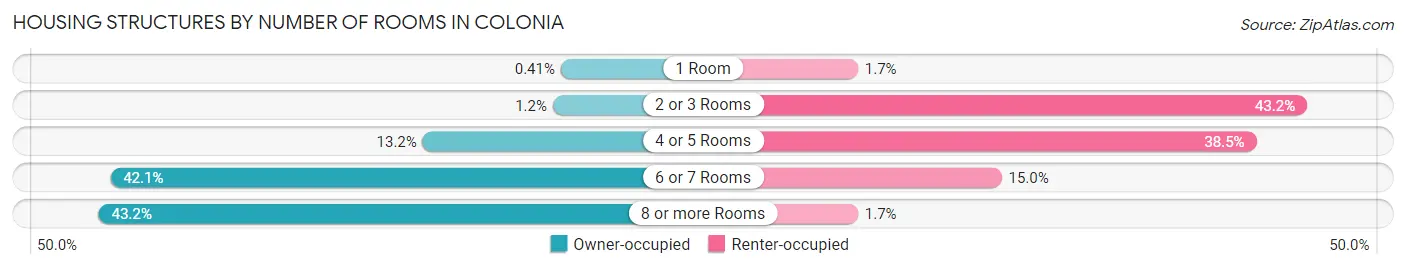
| Number of Rooms | Owner-occupied | Renter-occupied |
| 1 Room | 23 (0.4%) | 11 (1.7%) |
| 2 or 3 Rooms | 64 (1.1%) | 286 (43.2%) |
| 4 or 5 Rooms | 733 (13.2%) | 255 (38.5%) |
| 6 or 7 Rooms | 2,339 (42.1%) | 99 (14.9%) |
| 8 or more Rooms | 2,399 (43.2%) | 11 (1.7%) |
| Total | 5,558 (100.0%) | 662 (100.0%) |
Housing Structure by Heating Type in Colonia
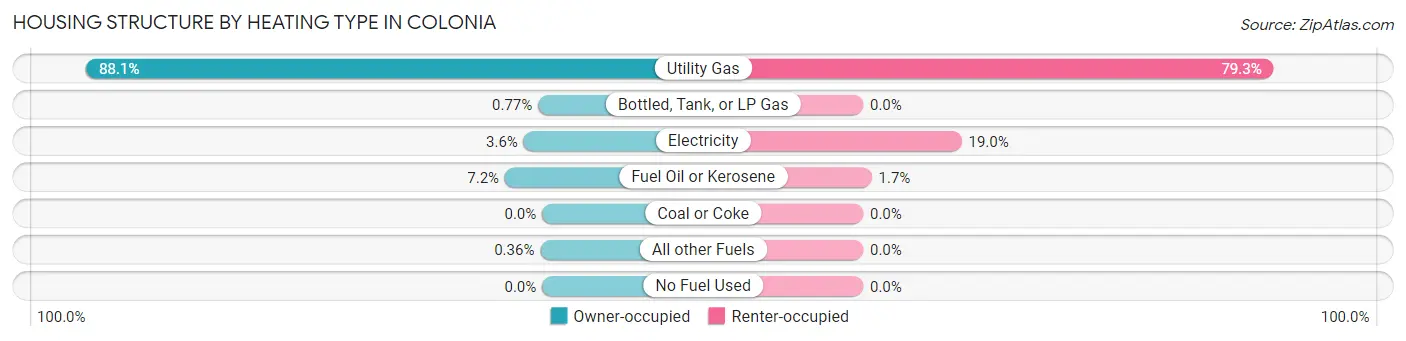
| Heating Type | Owner-occupied | Renter-occupied |
| Utility Gas | 4,898 (88.1%) | 525 (79.3%) |
| Bottled, Tank, or LP Gas | 43 (0.8%) | 0 (0.0%) |
| Electricity | 198 (3.6%) | 126 (19.0%) |
| Fuel Oil or Kerosene | 399 (7.2%) | 11 (1.7%) |
| Coal or Coke | 0 (0.0%) | 0 (0.0%) |
| All other Fuels | 20 (0.4%) | 0 (0.0%) |
| No Fuel Used | 0 (0.0%) | 0 (0.0%) |
| Total | 5,558 (100.0%) | 662 (100.0%) |
Household Vehicle Usage in Colonia
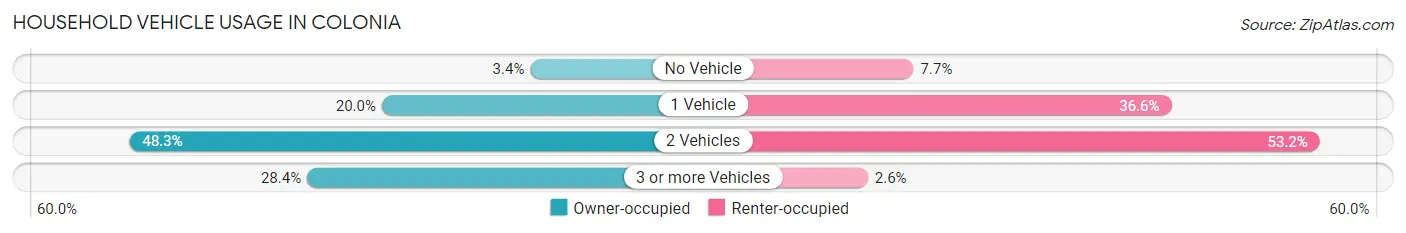
| Vehicles per Household | Owner-occupied | Renter-occupied |
| No Vehicle | 187 (3.4%) | 51 (7.7%) |
| 1 Vehicle | 1,111 (20.0%) | 242 (36.6%) |
| 2 Vehicles | 2,683 (48.3%) | 352 (53.2%) |
| 3 or more Vehicles | 1,577 (28.4%) | 17 (2.6%) |
| Total | 5,558 (100.0%) | 662 (100.0%) |
Real Estate & Mortgages in Colonia
Real Estate and Mortgage Overview in Colonia
| Characteristic | Without Mortgage | With Mortgage |
| Housing Units | 2,088 | 3,470 |
| Median Property Value | $406,100 | $453,900 |
| Median Household Income | $92,143 | $1,870 |
| Monthly Housing Costs | $1,274 | $1,742 |
| Real Estate Taxes | $9,982 | $35 |
Property Value by Mortgage Status in Colonia
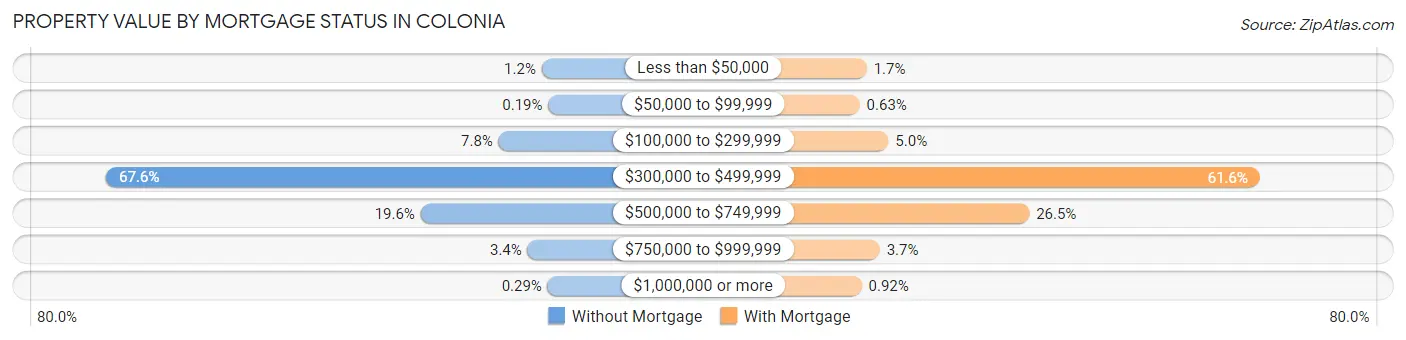
| Property Value | Without Mortgage | With Mortgage |
| Less than $50,000 | 25 (1.2%) | 59 (1.7%) |
| $50,000 to $99,999 | 4 (0.2%) | 22 (0.6%) |
| $100,000 to $299,999 | 162 (7.8%) | 174 (5.0%) |
| $300,000 to $499,999 | 1,411 (67.6%) | 2,137 (61.6%) |
| $500,000 to $749,999 | 410 (19.6%) | 918 (26.5%) |
| $750,000 to $999,999 | 70 (3.4%) | 128 (3.7%) |
| $1,000,000 or more | 6 (0.3%) | 32 (0.9%) |
| Total | 2,088 (100.0%) | 3,470 (100.0%) |
Household Income by Mortgage Status in Colonia
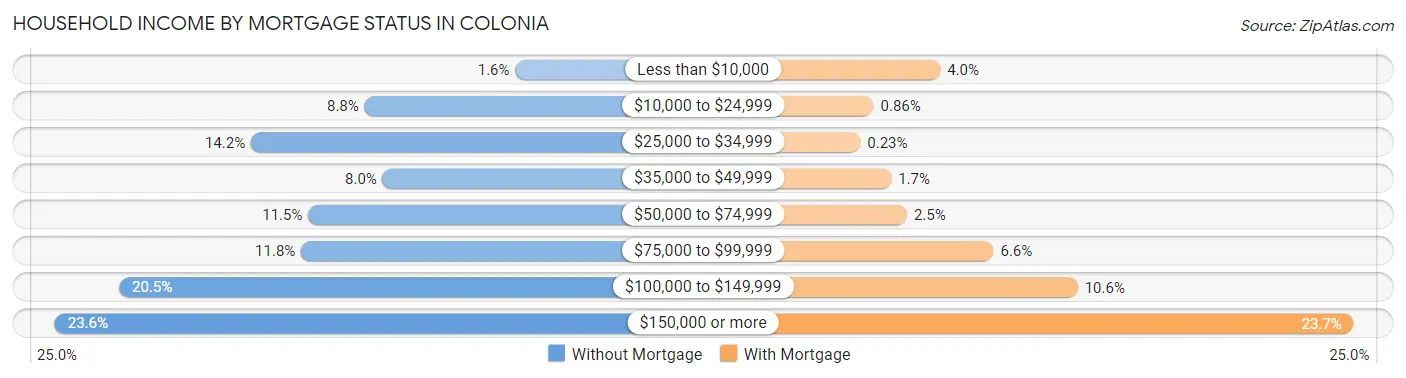
| Household Income | Without Mortgage | With Mortgage |
| Less than $10,000 | 34 (1.6%) | 140 (4.0%) |
| $10,000 to $24,999 | 184 (8.8%) | 30 (0.9%) |
| $25,000 to $34,999 | 297 (14.2%) | 8 (0.2%) |
| $35,000 to $49,999 | 166 (8.0%) | 59 (1.7%) |
| $50,000 to $74,999 | 240 (11.5%) | 85 (2.5%) |
| $75,000 to $99,999 | 247 (11.8%) | 228 (6.6%) |
| $100,000 to $149,999 | 428 (20.5%) | 367 (10.6%) |
| $150,000 or more | 492 (23.6%) | 823 (23.7%) |
| Total | 2,088 (100.0%) | 3,470 (100.0%) |
Property Value to Household Income Ratio in Colonia
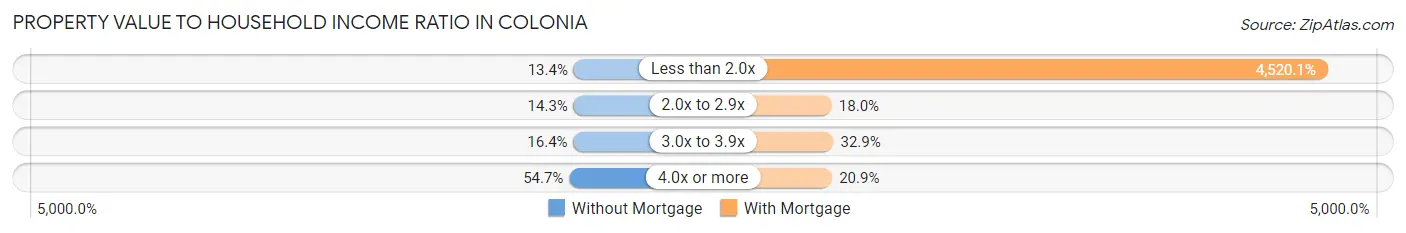
| Value-to-Income Ratio | Without Mortgage | With Mortgage |
| Less than 2.0x | 280 (13.4%) | 156,846 (4,520.1%) |
| 2.0x to 2.9x | 299 (14.3%) | 626 (18.0%) |
| 3.0x to 3.9x | 343 (16.4%) | 1,140 (32.9%) |
| 4.0x or more | 1,143 (54.7%) | 726 (20.9%) |
| Total | 2,088 (100.0%) | 3,470 (100.0%) |
Real Estate Taxes by Mortgage Status in Colonia
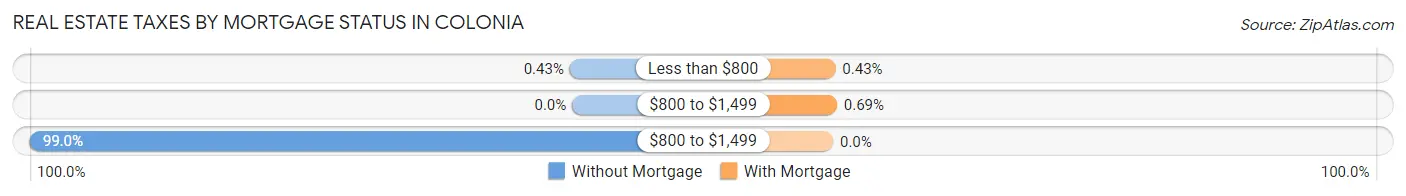
| Property Taxes | Without Mortgage | With Mortgage |
| Less than $800 | 9 (0.4%) | 15 (0.4%) |
| $800 to $1,499 | 0 (0.0%) | 24 (0.7%) |
| $800 to $1,499 | 2,068 (99.0%) | 0 (0.0%) |
| Total | 2,088 (100.0%) | 3,470 (100.0%) |
Health & Disability in Colonia
Health Insurance Coverage by Age in Colonia
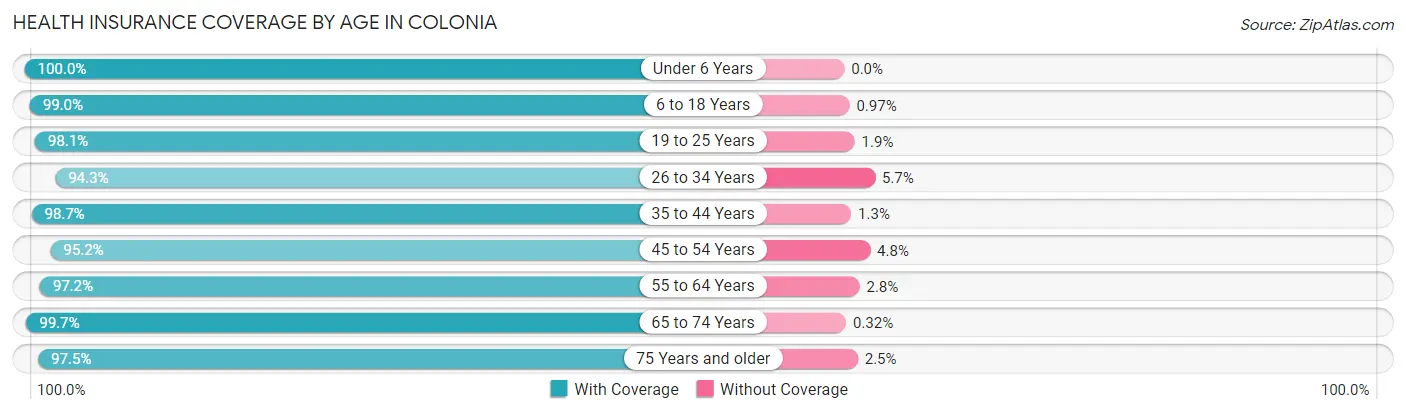
| Age Bracket | With Coverage | Without Coverage |
| Under 6 Years | 1,252 (100.0%) | 0 (0.0%) |
| 6 to 18 Years | 2,862 (99.0%) | 28 (1.0%) |
| 19 to 25 Years | 1,115 (98.1%) | 22 (1.9%) |
| 26 to 34 Years | 1,863 (94.3%) | 113 (5.7%) |
| 35 to 44 Years | 2,475 (98.7%) | 32 (1.3%) |
| 45 to 54 Years | 2,449 (95.2%) | 124 (4.8%) |
| 55 to 64 Years | 2,533 (97.2%) | 74 (2.8%) |
| 65 to 74 Years | 2,199 (99.7%) | 7 (0.3%) |
| 75 Years and older | 1,397 (97.5%) | 36 (2.5%) |
| Total | 18,145 (97.7%) | 436 (2.4%) |
Health Insurance Coverage by Citizenship Status in Colonia
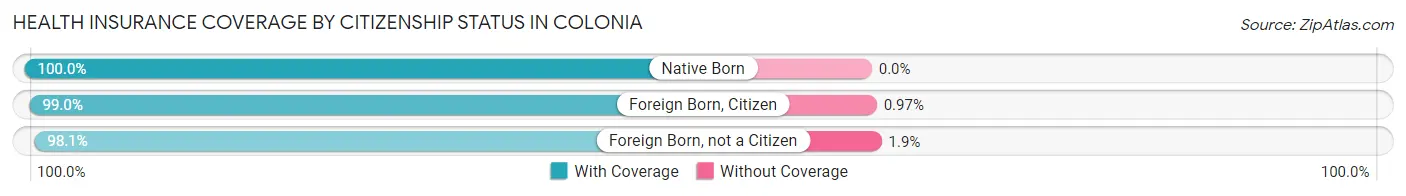
| Citizenship Status | With Coverage | Without Coverage |
| Native Born | 1,252 (100.0%) | 0 (0.0%) |
| Foreign Born, Citizen | 2,862 (99.0%) | 28 (1.0%) |
| Foreign Born, not a Citizen | 1,115 (98.1%) | 22 (1.9%) |
Health Insurance Coverage by Household Income in Colonia
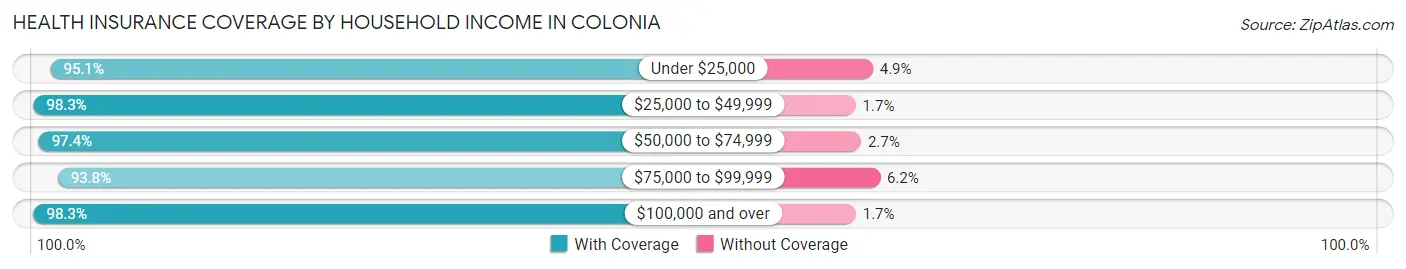
| Household Income | With Coverage | Without Coverage |
| Under $25,000 | 899 (95.1%) | 46 (4.9%) |
| $25,000 to $49,999 | 1,184 (98.3%) | 20 (1.7%) |
| $50,000 to $74,999 | 1,029 (97.4%) | 28 (2.6%) |
| $75,000 to $99,999 | 1,736 (93.8%) | 115 (6.2%) |
| $100,000 and over | 13,288 (98.3%) | 227 (1.7%) |
Public vs Private Health Insurance Coverage by Age in Colonia
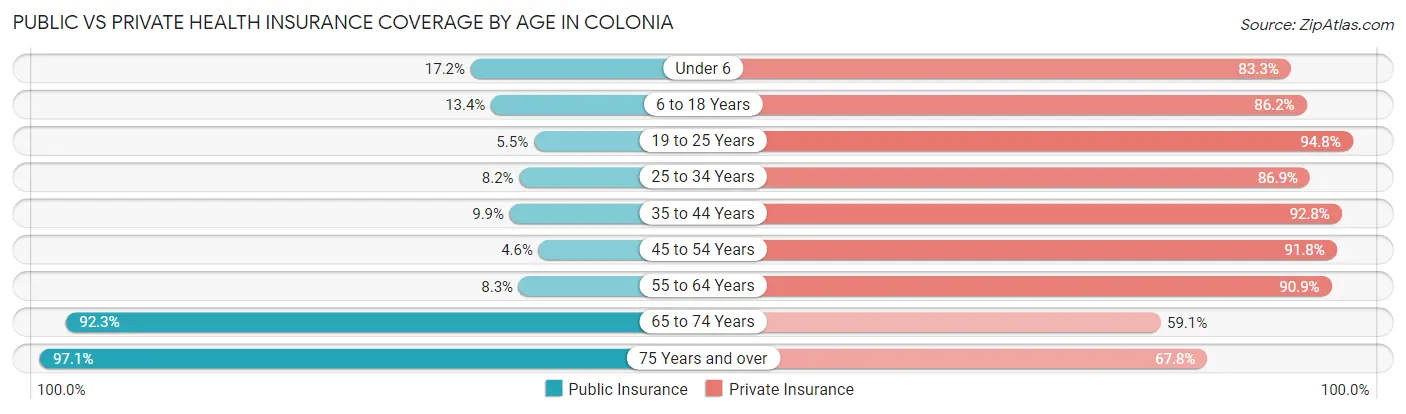
| Age Bracket | Public Insurance | Private Insurance |
| Under 6 | 215 (17.2%) | 1,043 (83.3%) |
| 6 to 18 Years | 387 (13.4%) | 2,492 (86.2%) |
| 19 to 25 Years | 62 (5.4%) | 1,078 (94.8%) |
| 25 to 34 Years | 161 (8.2%) | 1,717 (86.9%) |
| 35 to 44 Years | 249 (9.9%) | 2,326 (92.8%) |
| 45 to 54 Years | 117 (4.5%) | 2,363 (91.8%) |
| 55 to 64 Years | 215 (8.3%) | 2,369 (90.9%) |
| 65 to 74 Years | 2,035 (92.2%) | 1,303 (59.1%) |
| 75 Years and over | 1,392 (97.1%) | 972 (67.8%) |
| Total | 4,833 (26.0%) | 15,663 (84.3%) |
Disability Status by Sex by Age in Colonia
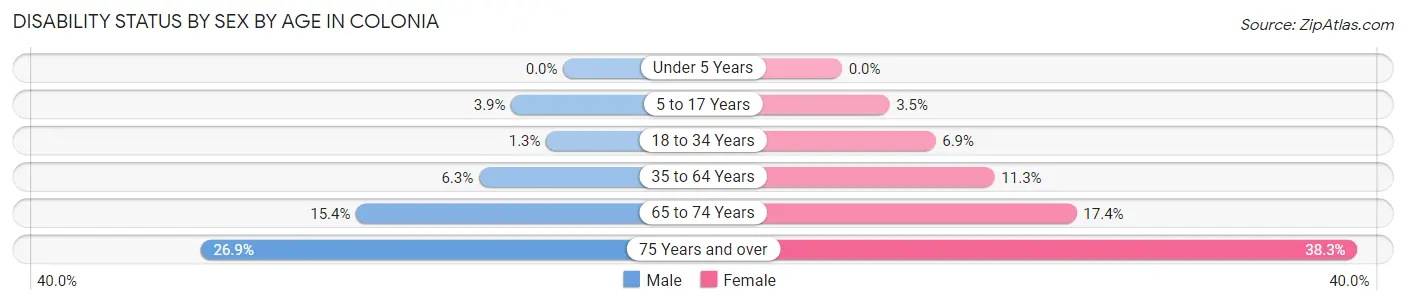
| Age Bracket | Male | Female |
| Under 5 Years | 0 (0.0%) | 0 (0.0%) |
| 5 to 17 Years | 59 (3.9%) | 54 (3.5%) |
| 18 to 34 Years | 20 (1.3%) | 116 (6.9%) |
| 35 to 64 Years | 233 (6.3%) | 449 (11.3%) |
| 65 to 74 Years | 182 (15.4%) | 178 (17.4%) |
| 75 Years and over | 132 (26.9%) | 361 (38.3%) |
Disability Class by Sex by Age in Colonia
Disability Class: Hearing Difficulty
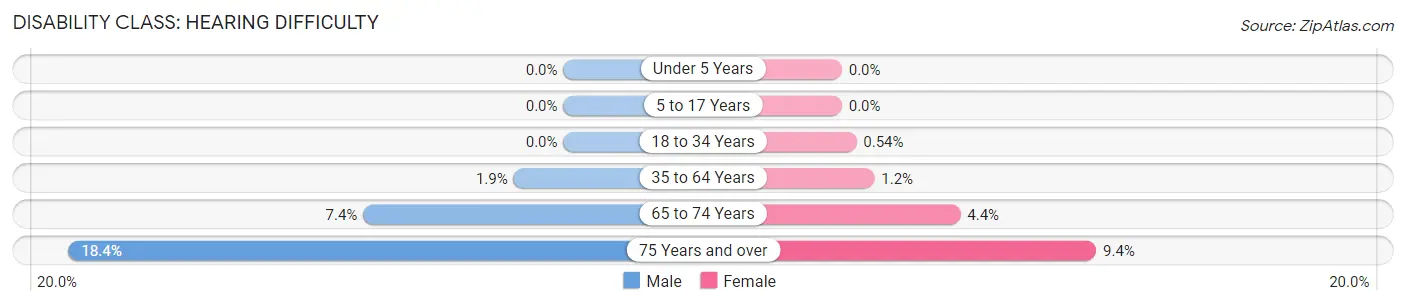
| Age Bracket | Male | Female |
| Under 5 Years | 0 (0.0%) | 0 (0.0%) |
| 5 to 17 Years | 0 (0.0%) | 0 (0.0%) |
| 18 to 34 Years | 0 (0.0%) | 9 (0.5%) |
| 35 to 64 Years | 69 (1.8%) | 48 (1.2%) |
| 65 to 74 Years | 88 (7.4%) | 45 (4.4%) |
| 75 Years and over | 90 (18.4%) | 89 (9.4%) |
Disability Class: Vision Difficulty
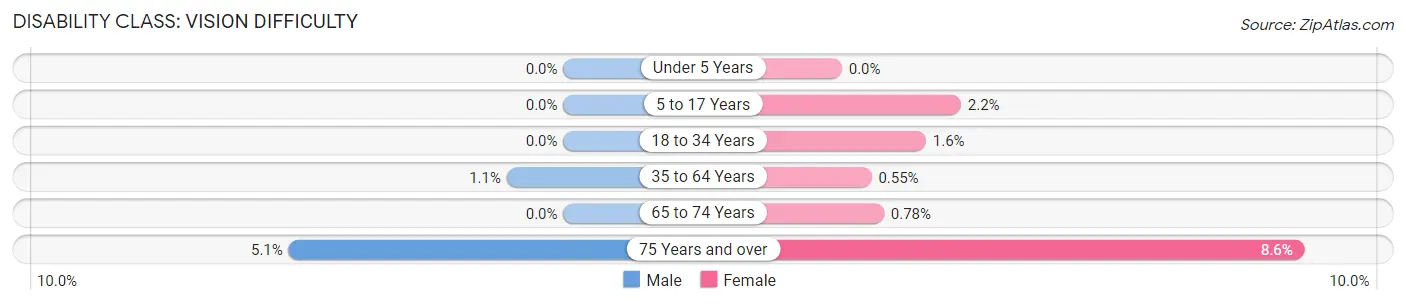
| Age Bracket | Male | Female |
| Under 5 Years | 0 (0.0%) | 0 (0.0%) |
| 5 to 17 Years | 0 (0.0%) | 34 (2.2%) |
| 18 to 34 Years | 0 (0.0%) | 26 (1.6%) |
| 35 to 64 Years | 39 (1.1%) | 22 (0.5%) |
| 65 to 74 Years | 0 (0.0%) | 8 (0.8%) |
| 75 Years and over | 25 (5.1%) | 81 (8.6%) |
Disability Class: Cognitive Difficulty
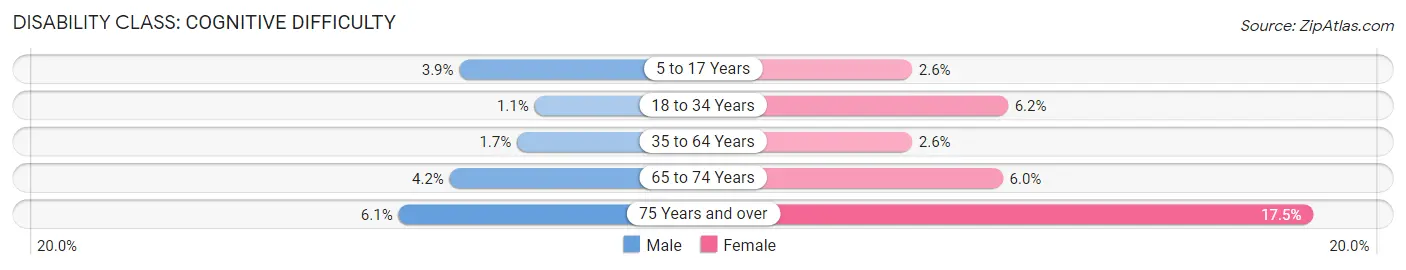
| Age Bracket | Male | Female |
| 5 to 17 Years | 59 (3.9%) | 40 (2.6%) |
| 18 to 34 Years | 17 (1.1%) | 103 (6.2%) |
| 35 to 64 Years | 64 (1.7%) | 103 (2.6%) |
| 65 to 74 Years | 50 (4.2%) | 61 (6.0%) |
| 75 Years and over | 30 (6.1%) | 165 (17.5%) |
Disability Class: Ambulatory Difficulty
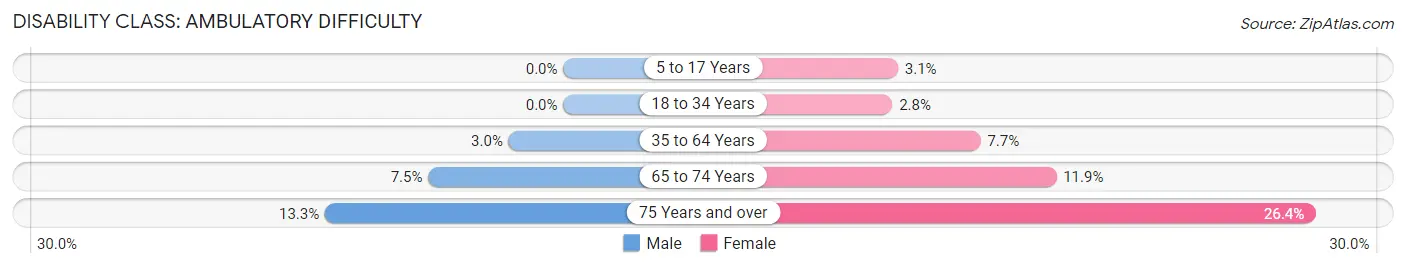
| Age Bracket | Male | Female |
| 5 to 17 Years | 0 (0.0%) | 48 (3.1%) |
| 18 to 34 Years | 0 (0.0%) | 47 (2.8%) |
| 35 to 64 Years | 113 (3.0%) | 306 (7.7%) |
| 65 to 74 Years | 89 (7.5%) | 122 (11.9%) |
| 75 Years and over | 65 (13.3%) | 249 (26.4%) |
Disability Class: Self-Care Difficulty
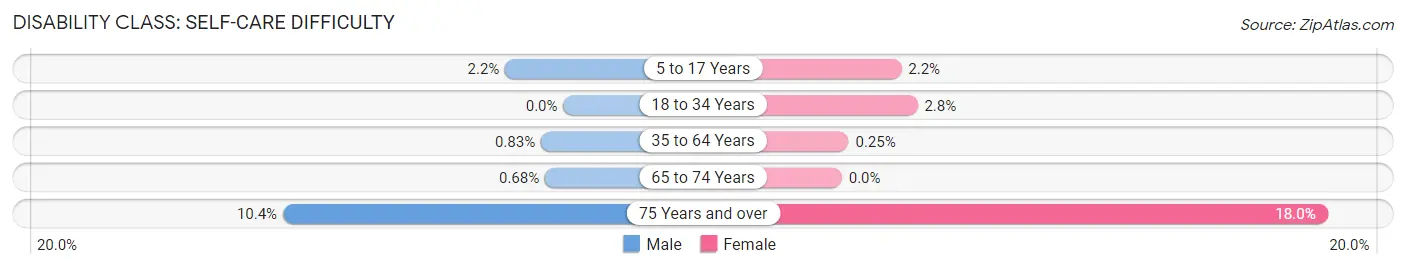
| Age Bracket | Male | Female |
| 5 to 17 Years | 33 (2.2%) | 34 (2.2%) |
| 18 to 34 Years | 0 (0.0%) | 47 (2.8%) |
| 35 to 64 Years | 31 (0.8%) | 10 (0.3%) |
| 65 to 74 Years | 8 (0.7%) | 0 (0.0%) |
| 75 Years and over | 51 (10.4%) | 170 (18.0%) |
Technology Access in Colonia
Computing Device Access in Colonia
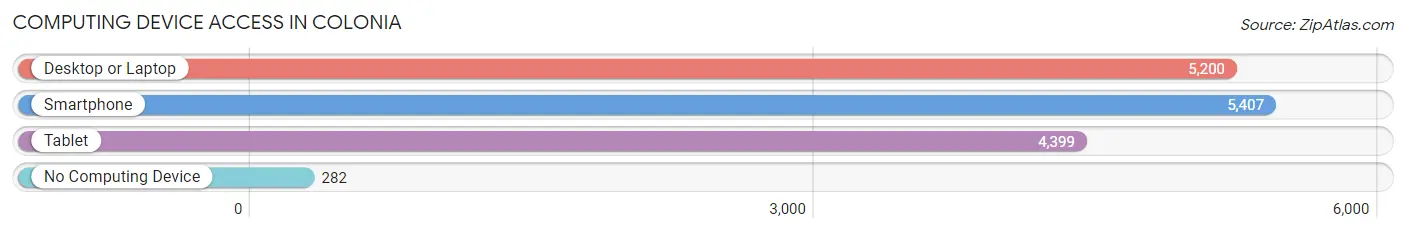
| Device Type | # Households | % Households |
| Desktop or Laptop | 5,200 | 83.6% |
| Smartphone | 5,407 | 86.9% |
| Tablet | 4,399 | 70.7% |
| No Computing Device | 282 | 4.5% |
| Total | 6,220 | 100.0% |
Internet Access in Colonia
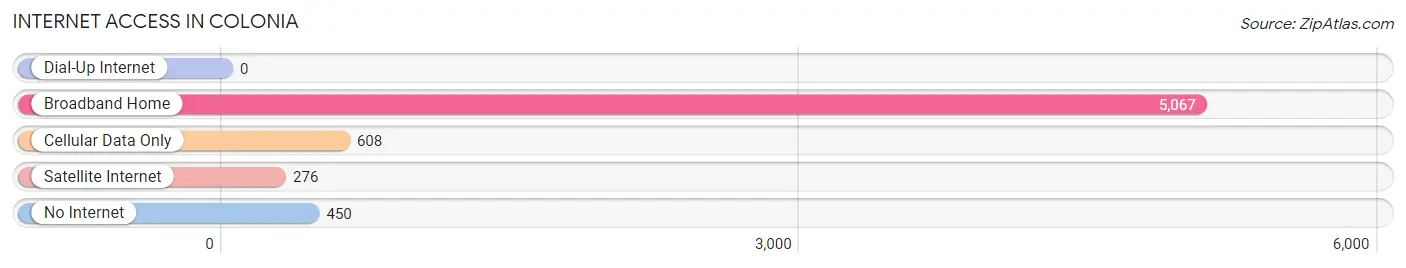
| Internet Type | # Households | % Households |
| Dial-Up Internet | 0 | 0.0% |
| Broadband Home | 5,067 | 81.5% |
| Cellular Data Only | 608 | 9.8% |
| Satellite Internet | 276 | 4.4% |
| No Internet | 450 | 7.2% |
| Total | 6,220 | 100.0% |
Colonia Summary
Colonia is a census-designated place (CDP) located in Woodbridge Township, Middlesex County, New Jersey. It is a suburban community located about 25 miles southwest of New York City. As of the 2010 United States Census, the CDP's population was 19,052.
Geography
Colonia is located at 40°31'25" North, 74°19'45" West (40.523607, -74.329092). According to the United States Census Bureau, the CDP has a total area of 3.3 square miles, all of which is land.
Colonia is bordered by the Rahway River to the north, the Garden State Parkway to the east, and the New Jersey Turnpike to the west. It is located in the Raritan Valley region of New Jersey.
History
Colonia was first settled in the late 19th century by Italian immigrants. The area was originally known as "Colonia di San Giuseppe" or "St. Joseph's Colony". The name was changed to Colonia in the early 20th century.
The area was largely agricultural until the 1950s, when it began to be developed as a suburban community. The population of Colonia has grown steadily since then, and it is now one of the most populous communities in Middlesex County.
Economy
Colonia is a largely residential community, with a few small businesses located in the area. The largest employers in the area are the Woodbridge Township School District, the Colonia Public Library, and the Colonia Fire Department.
Demographics
As of the 2010 United States Census, there were 19,052 people, 6,945 households, and 5,092 families residing in the CDP. The population density was 5,741.3 per square mile. There were 7,093 housing units at an average density of 2,148.3 per square mile. The racial makeup of the CDP was 79.2% White, 8.2% African American, 0.2% Native American, 8.2% Asian, 0.1% Pacific Islander, 1.7% from other races, and 2.6% from two or more races. Hispanic or Latino of any race were 8.7% of the population.
There were 6,945 households, out of which 33.2% had children under the age of 18 living with them, 57.2% were married couples living together, 11.2% had a female householder with no husband present, and 27.2% were non-families. 22.2% of all households were made up of individuals, and 9.7% had someone living alone who was 65 years of age or older. The average household size was 2.72 and the average family size was 3.22.
In the CDP, the population was spread out, with 23.2% under the age of 18, 7.2% from 18 to 24, 29.2% from 25 to 44, 25.7% from 45 to 64, and 14.7% who were 65 years of age or older. The median age was 38.7 years. For every 100 females, there were 93.2 males. For every 100 females age 18 and over, there were 90.2 males.
The median income for a household in the CDP was $76,945, and the median income for a family was $86,945. Males had a median income of $60,945 versus $45,945 for females. The per capita income for the CDP was $31,945. About 2.7% of families and 3.7% of the population were below the poverty line, including 4.7% of those under age 18 and 4.7% of those age 65 or over.
Common Questions
What is Per Capita Income in Colonia?
Per Capita income in Colonia is $48,773.
What is the Median Family Income in Colonia?
Median Family Income in Colonia is $139,247.
What is the Median Household income in Colonia?
Median Household Income in Colonia is $129,122.
What is Income or Wage Gap in Colonia?
Income or Wage Gap in Colonia is 27.4%.
Women in Colonia earn 72.6 cents for every dollar earned by a man.
What is Family Income Deficit in Colonia?
Family Income Deficit in Colonia is $13,332.
Families that are below poverty line in Colonia earn $13,332 less on average than the poverty threshold level.
What is Inequality or Gini Index in Colonia?
Inequality or Gini Index in Colonia is 0.37.
What is the Total Population of Colonia?
Total Population of Colonia is 18,581.
What is the Total Male Population of Colonia?
Total Male Population of Colonia is 9,046.
What is the Total Female Population of Colonia?
Total Female Population of Colonia is 9,535.
What is the Ratio of Males per 100 Females in Colonia?
There are 94.87 Males per 100 Females in Colonia.
What is the Ratio of Females per 100 Males in Colonia?
There are 105.41 Females per 100 Males in Colonia.
What is the Median Population Age in Colonia?
Median Population Age in Colonia is 42.7 Years.
What is the Average Family Size in Colonia
Average Family Size in Colonia is 3.4 People.
What is the Average Household Size in Colonia
Average Household Size in Colonia is 3.0 People.
How Large is the Labor Force in Colonia?
There are 9,836 People in the Labor Forcein in Colonia.
What is the Percentage of People in the Labor Force in Colonia?
65.4% of People are in the Labor Force in Colonia.
What is the Unemployment Rate in Colonia?
Unemployment Rate in Colonia is 2.9%.