Ventnor City, NJ Map & Demographics
Ventnor City Map
Ventnor City Overview
$48,344
PER CAPITA INCOME
$86,011
AVG FAMILY INCOME
$71,321
AVG HOUSEHOLD INCOME
19.2%
WAGE / INCOME GAP [ % ]
80.8¢/ $1
WAGE / INCOME GAP [ $ ]
0.51
INEQUALITY / GINI INDEX
9,285
TOTAL POPULATION
4,471
MALE POPULATION
4,814
FEMALE POPULATION
92.87
MALES / 100 FEMALES
107.67
FEMALES / 100 MALES
54.4
MEDIAN AGE
2.8
AVG FAMILY SIZE
2.1
AVG HOUSEHOLD SIZE
4,817
LABOR FORCE [ PEOPLE ]
58.2%
PERCENT IN LABOR FORCE
7.2%
UNEMPLOYMENT RATE
Ventnor City Zip Codes
Ventnor City Area Codes
Income in Ventnor City
Income Overview in Ventnor City
Per Capita Income in Ventnor City is $48,344, while median incomes of families and households are $86,011 and $71,321 respectively.
| Characteristic | Number | Measure |
| Per Capita Income | 9,285 | $48,344 |
| Median Family Income | 2,432 | $86,011 |
| Mean Family Income | 2,432 | $136,879 |
| Median Household Income | 4,348 | $71,321 |
| Mean Household Income | 4,348 | $104,821 |
| Income Deficit | 2,432 | $0 |
| Wage / Income Gap (%) | 9,285 | 19.17% |
| Wage / Income Gap ($) | 9,285 | 80.83¢ per $1 |
| Gini / Inequality Index | 9,285 | 0.51 |
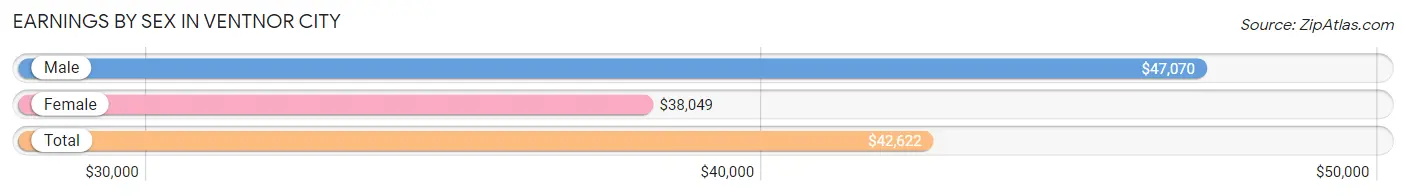
Earnings by Sex in Ventnor City
Average Earnings in Ventnor City are $42,622, $47,070 for men and $38,049 for women, a difference of 19.2%.
| Sex | Number | Average Earnings |
| Male | 2,701 (54.1%) | $47,070 |
| Female | 2,288 (45.9%) | $38,049 |
| Total | 4,989 (100.0%) | $42,622 |
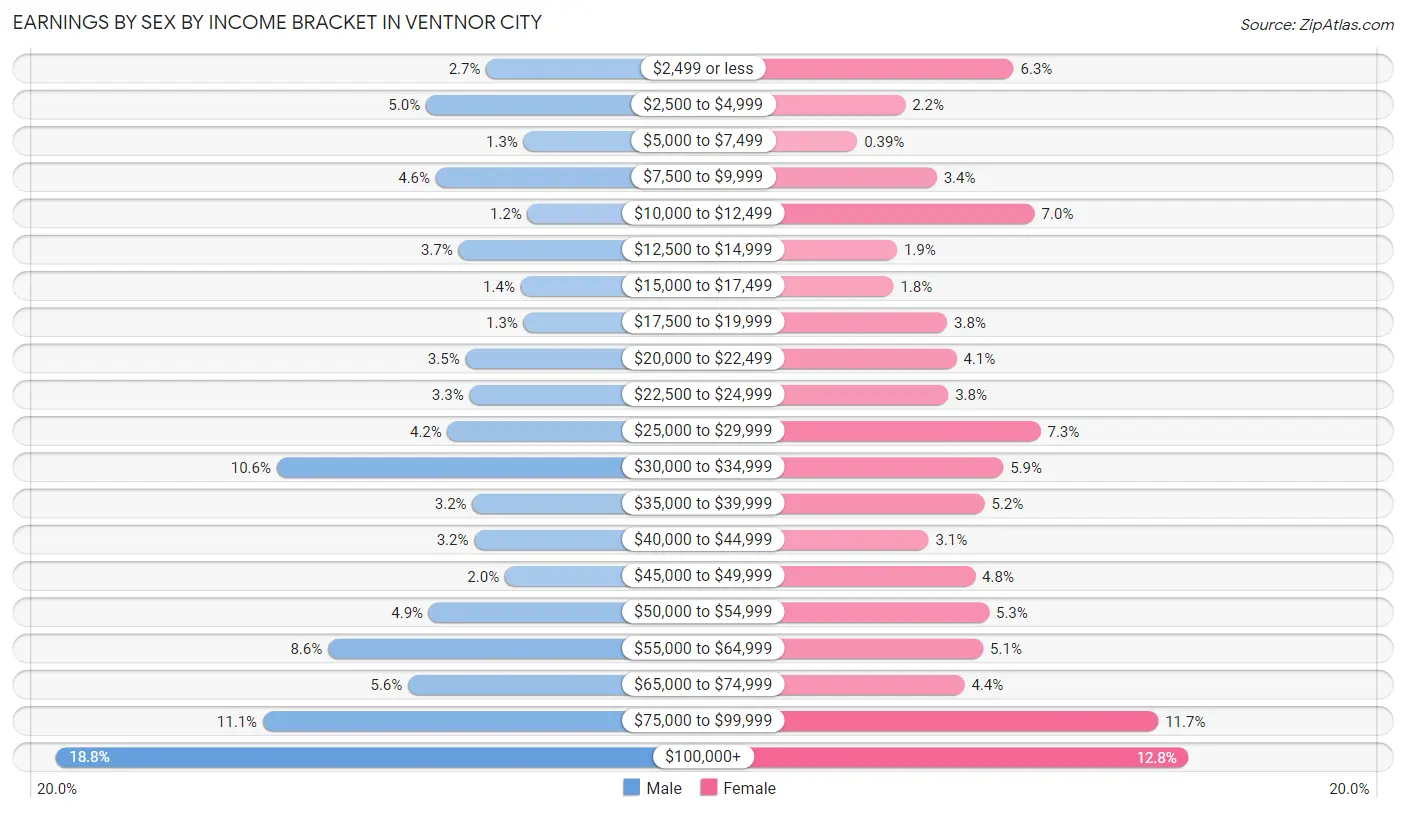
Earnings by Sex by Income Bracket in Ventnor City
The most common earnings brackets in Ventnor City are $100,000+ for men (508 | 18.8%) and $100,000+ for women (293 | 12.8%).
| Income | Male | Female |
| $2,499 or less | 73 (2.7%) | 143 (6.2%) |
| $2,500 to $4,999 | 134 (5.0%) | 50 (2.2%) |
| $5,000 to $7,499 | 35 (1.3%) | 9 (0.4%) |
| $7,500 to $9,999 | 124 (4.6%) | 77 (3.4%) |
| $10,000 to $12,499 | 31 (1.1%) | 161 (7.0%) |
| $12,500 to $14,999 | 101 (3.7%) | 43 (1.9%) |
| $15,000 to $17,499 | 38 (1.4%) | 40 (1.8%) |
| $17,500 to $19,999 | 35 (1.3%) | 86 (3.8%) |
| $20,000 to $22,499 | 94 (3.5%) | 94 (4.1%) |
| $22,500 to $24,999 | 90 (3.3%) | 87 (3.8%) |
| $25,000 to $29,999 | 112 (4.2%) | 166 (7.3%) |
| $30,000 to $34,999 | 285 (10.5%) | 134 (5.9%) |
| $35,000 to $39,999 | 87 (3.2%) | 118 (5.2%) |
| $40,000 to $44,999 | 85 (3.2%) | 70 (3.1%) |
| $45,000 to $49,999 | 54 (2.0%) | 110 (4.8%) |
| $50,000 to $54,999 | 131 (4.9%) | 122 (5.3%) |
| $55,000 to $64,999 | 233 (8.6%) | 117 (5.1%) |
| $65,000 to $74,999 | 152 (5.6%) | 101 (4.4%) |
| $75,000 to $99,999 | 299 (11.1%) | 267 (11.7%) |
| $100,000+ | 508 (18.8%) | 293 (12.8%) |
| Total | 2,701 (100.0%) | 2,288 (100.0%) |
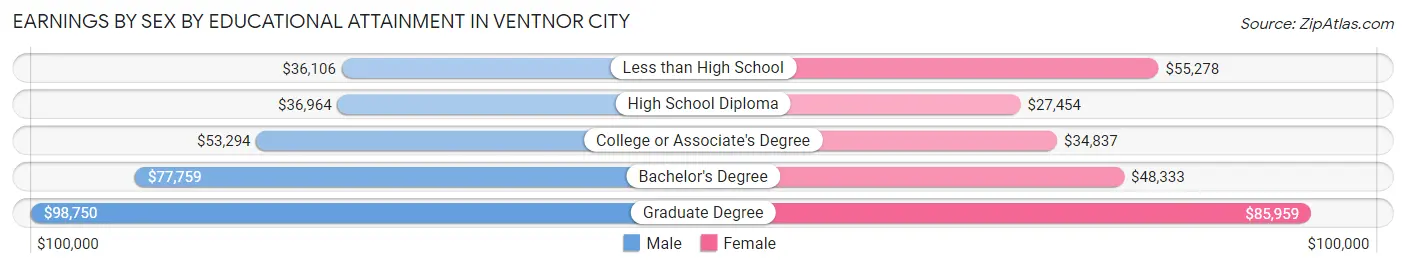
Earnings by Sex by Educational Attainment in Ventnor City
Average earnings in Ventnor City are $54,516 for men and $43,972 for women, a difference of 19.3%. Men with an educational attainment of graduate degree enjoy the highest average annual earnings of $98,750, while those with less than high school education earn the least with $36,106. Women with an educational attainment of graduate degree earn the most with the average annual earnings of $85,959, while those with high school diploma education have the smallest earnings of $27,454.
| Educational Attainment | Male Income | Female Income |
| Less than High School | $36,106 | $55,278 |
| High School Diploma | $36,964 | $27,454 |
| College or Associate's Degree | $53,294 | $34,837 |
| Bachelor's Degree | $77,759 | $48,333 |
| Graduate Degree | $98,750 | $85,959 |
| Total | $54,516 | $43,972 |
Family Income in Ventnor City
Family Income Brackets in Ventnor City
According to the Ventnor City family income data, there are 467 families falling into the $200,000+ income range, which is the most common income bracket and makes up 19.2% of all families. Conversely, the less than $10,000 income bracket is the least frequent group with only 22 families (0.9%) belonging to this category.
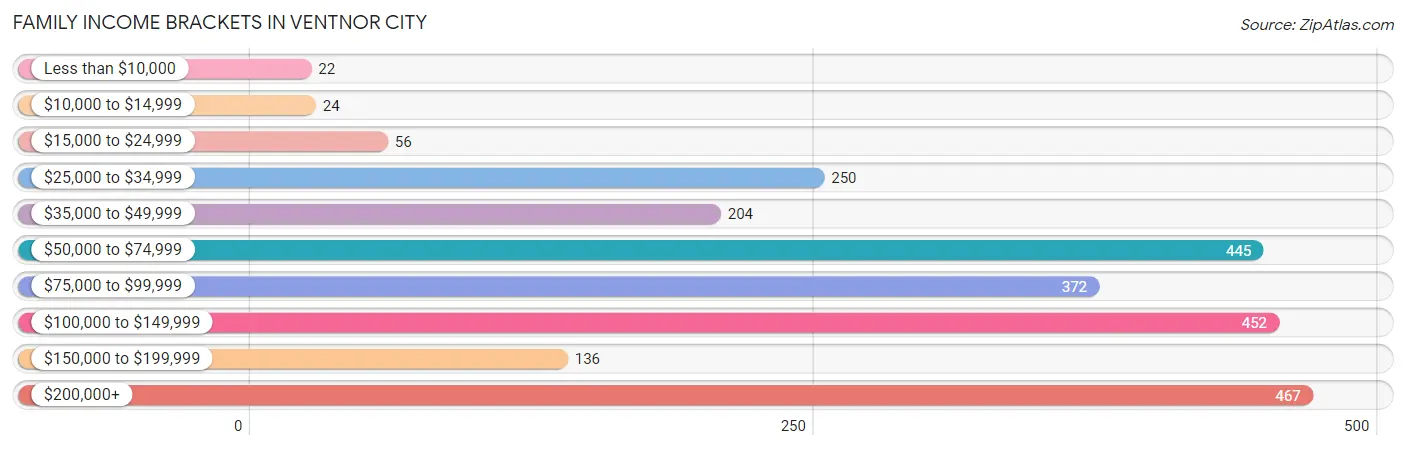
| Income Bracket | # Families | % Families |
| Less than $10,000 | 22 | 0.9% |
| $10,000 to $14,999 | 24 | 1.0% |
| $15,000 to $24,999 | 56 | 2.3% |
| $25,000 to $34,999 | 250 | 10.3% |
| $35,000 to $49,999 | 204 | 8.4% |
| $50,000 to $74,999 | 445 | 18.3% |
| $75,000 to $99,999 | 372 | 15.3% |
| $100,000 to $149,999 | 452 | 18.6% |
| $150,000 to $199,999 | 136 | 5.6% |
| $200,000+ | 467 | 19.2% |
Family Income by Famaliy Size in Ventnor City
3-person families (453 | 18.6%) account for the highest median family income in Ventnor City with $120,612 per family, while 2-person families (1,439 | 59.2%) have the highest median income of $40,580 per family member.
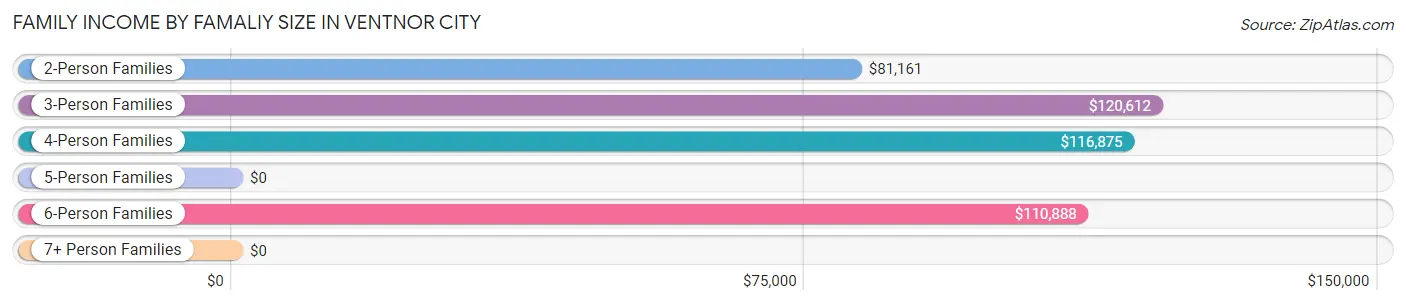
| Income Bracket | # Families | Median Income |
| 2-Person Families | 1,439 (59.2%) | $81,161 |
| 3-Person Families | 453 (18.6%) | $120,612 |
| 4-Person Families | 279 (11.5%) | $116,875 |
| 5-Person Families | 109 (4.5%) | $0 |
| 6-Person Families | 75 (3.1%) | $110,888 |
| 7+ Person Families | 77 (3.2%) | $0 |
| Total | 2,432 (100.0%) | $86,011 |
Family Income by Number of Earners in Ventnor City
The median family income in Ventnor City is $86,011, with families comprising 3+ earners (323) having the highest median family income of $124,563, while families with no earners (551) have the lowest median family income of $57,726, accounting for 13.3% and 22.7% of families, respectively.
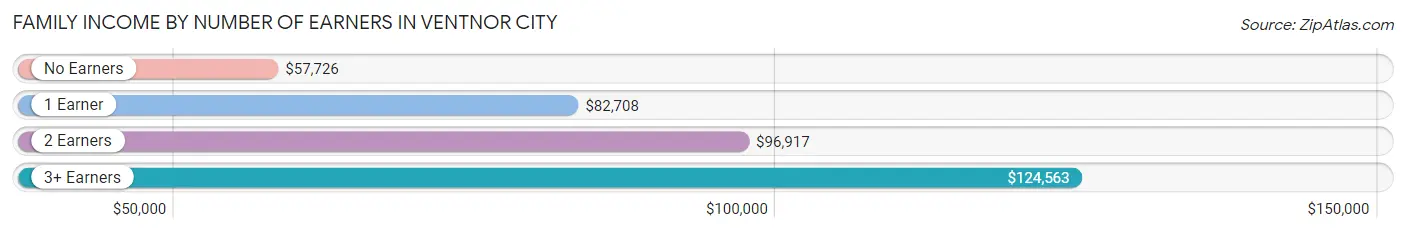
| Number of Earners | # Families | Median Income |
| No Earners | 551 (22.7%) | $57,726 |
| 1 Earner | 647 (26.6%) | $82,708 |
| 2 Earners | 911 (37.5%) | $96,917 |
| 3+ Earners | 323 (13.3%) | $124,563 |
| Total | 2,432 (100.0%) | $86,011 |
Household Income in Ventnor City
Household Income Brackets in Ventnor City
With 696 households falling in the category, the $50,000 to $74,999 income range is the most frequent in Ventnor City, accounting for 16.0% of all households. In contrast, only 152 households (3.5%) fall into the $10,000 to $14,999 income bracket, making it the least populous group.
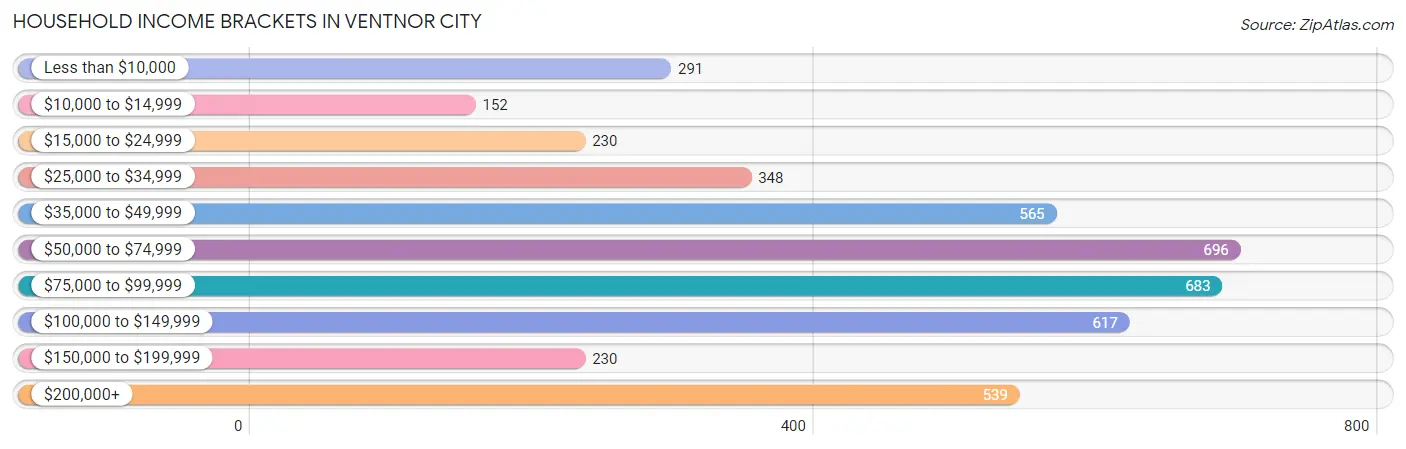
| Income Bracket | # Households | % Households |
| Less than $10,000 | 291 | 6.7% |
| $10,000 to $14,999 | 152 | 3.5% |
| $15,000 to $24,999 | 230 | 5.3% |
| $25,000 to $34,999 | 348 | 8.0% |
| $35,000 to $49,999 | 565 | 13.0% |
| $50,000 to $74,999 | 696 | 16.0% |
| $75,000 to $99,999 | 683 | 15.7% |
| $100,000 to $149,999 | 617 | 14.2% |
| $150,000 to $199,999 | 230 | 5.3% |
| $200,000+ | 539 | 12.4% |
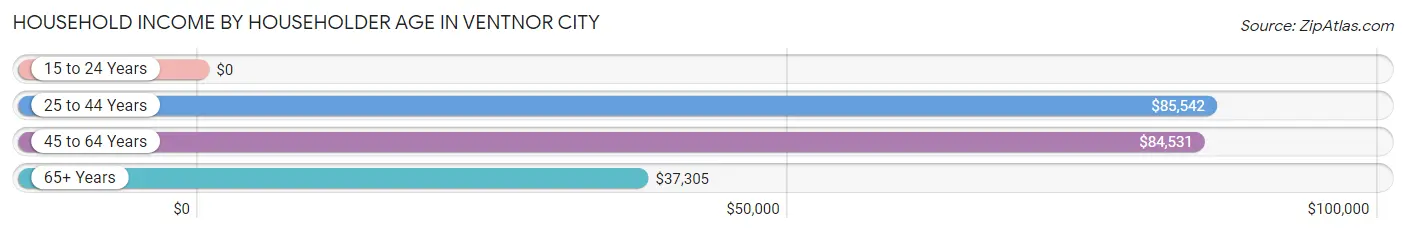
Household Income by Householder Age in Ventnor City
The median household income in Ventnor City is $71,321, with the highest median household income of $85,542 found in the 25 to 44 years age bracket for the primary householder. A total of 877 households (20.2%) fall into this category. Meanwhile, the 15 to 24 years age bracket for the primary householder has the lowest median household income of $0, with 11 households (0.3%) in this group.
| Income Bracket | # Households | Median Income |
| 15 to 24 Years | 11 (0.3%) | $0 |
| 25 to 44 Years | 877 (20.2%) | $85,542 |
| 45 to 64 Years | 1,700 (39.1%) | $84,531 |
| 65+ Years | 1,760 (40.5%) | $37,305 |
| Total | 4,348 (100.0%) | $71,321 |
Poverty in Ventnor City
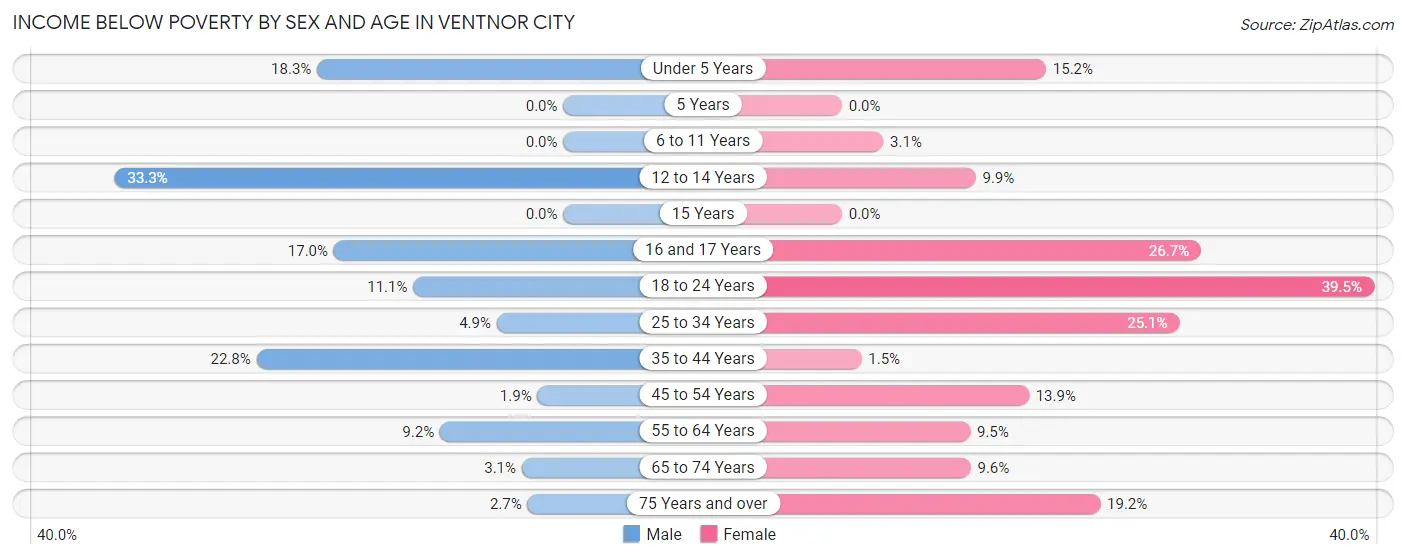
Income Below Poverty by Sex and Age in Ventnor City
With 8.0% poverty level for males and 14.5% for females among the residents of Ventnor City, 12 to 14 year old males and 18 to 24 year old females are the most vulnerable to poverty, with 39 males (33.3%) and 109 females (39.5%) in their respective age groups living below the poverty level.
| Age Bracket | Male | Female |
| Under 5 Years | 17 (18.3%) | 15 (15.1%) |
| 5 Years | 0 (0.0%) | 0 (0.0%) |
| 6 to 11 Years | 0 (0.0%) | 7 (3.1%) |
| 12 to 14 Years | 39 (33.3%) | 14 (9.9%) |
| 15 Years | 0 (0.0%) | 0 (0.0%) |
| 16 and 17 Years | 23 (17.0%) | 32 (26.7%) |
| 18 to 24 Years | 40 (11.1%) | 109 (39.5%) |
| 25 to 34 Years | 34 (4.9%) | 106 (25.1%) |
| 35 to 44 Years | 77 (22.8%) | 6 (1.5%) |
| 45 to 54 Years | 9 (1.9%) | 74 (13.9%) |
| 55 to 64 Years | 84 (9.2%) | 92 (9.5%) |
| 65 to 74 Years | 21 (3.1%) | 54 (9.6%) |
| 75 Years and over | 11 (2.7%) | 188 (19.2%) |
| Total | 355 (8.0%) | 697 (14.5%) |
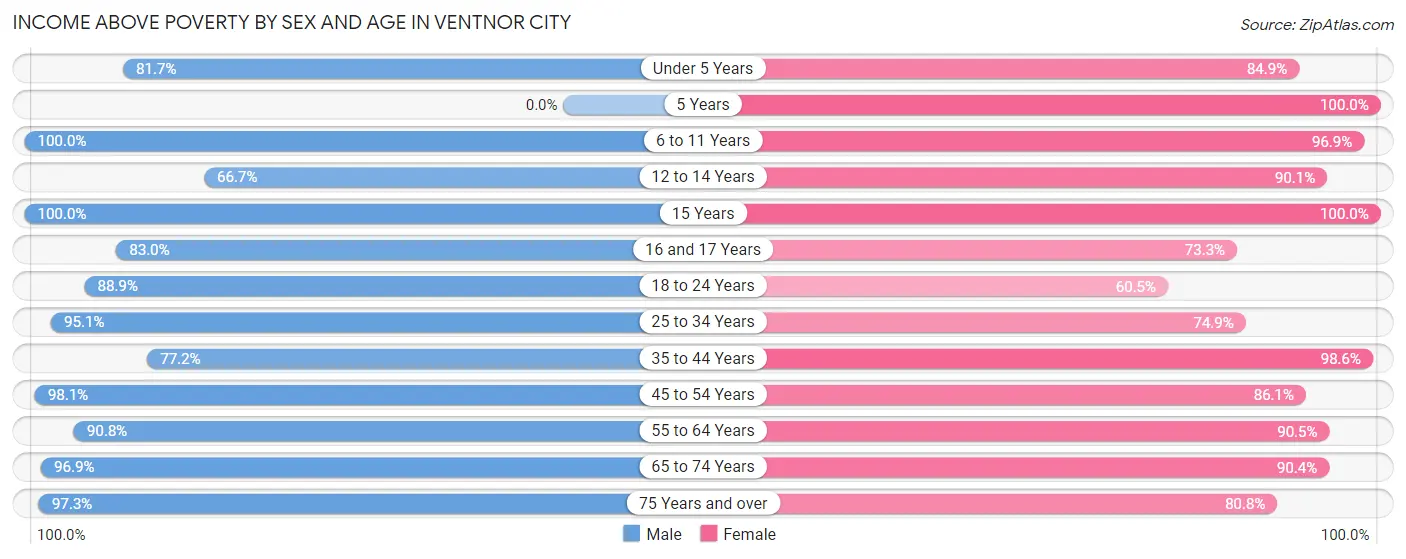
Income Above Poverty by Sex and Age in Ventnor City
According to the poverty statistics in Ventnor City, males aged 6 to 11 years and females aged 5 years are the age groups that are most secure financially, with 100.0% of males and 100.0% of females in these age groups living above the poverty line.
| Age Bracket | Male | Female |
| Under 5 Years | 76 (81.7%) | 84 (84.9%) |
| 5 Years | 0 (0.0%) | 64 (100.0%) |
| 6 to 11 Years | 170 (100.0%) | 221 (96.9%) |
| 12 to 14 Years | 78 (66.7%) | 127 (90.1%) |
| 15 Years | 79 (100.0%) | 6 (100.0%) |
| 16 and 17 Years | 112 (83.0%) | 88 (73.3%) |
| 18 to 24 Years | 319 (88.9%) | 167 (60.5%) |
| 25 to 34 Years | 654 (95.1%) | 317 (74.9%) |
| 35 to 44 Years | 261 (77.2%) | 407 (98.6%) |
| 45 to 54 Years | 460 (98.1%) | 459 (86.1%) |
| 55 to 64 Years | 833 (90.8%) | 874 (90.5%) |
| 65 to 74 Years | 661 (96.9%) | 511 (90.4%) |
| 75 Years and over | 402 (97.3%) | 792 (80.8%) |
| Total | 4,105 (92.0%) | 4,117 (85.5%) |
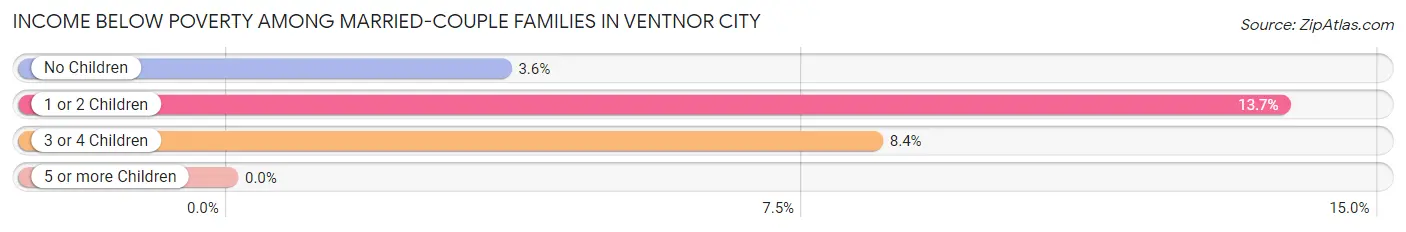
Income Below Poverty Among Married-Couple Families in Ventnor City
The poverty statistics for married-couple families in Ventnor City show that 6.3% or 115 of the total 1,828 families live below the poverty line. Families with 1 or 2 children have the highest poverty rate of 13.7%, comprising of 61 families. On the other hand, families with no children have the lowest poverty rate of 3.6%, which includes 46 families.
| Children | Above Poverty | Below Poverty |
| No Children | 1,243 (96.4%) | 46 (3.6%) |
| 1 or 2 Children | 383 (86.3%) | 61 (13.7%) |
| 3 or 4 Children | 87 (91.6%) | 8 (8.4%) |
| 5 or more Children | 0 (0.0%) | 0 (0.0%) |
| Total | 1,713 (93.7%) | 115 (6.3%) |
Income Below Poverty Among Single-Parent Households in Ventnor City
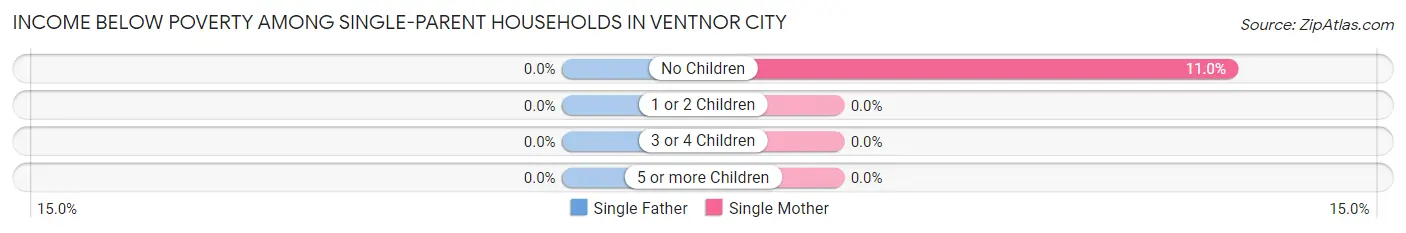
| Children | Single Father | Single Mother |
| No Children | 0 (0.0%) | 25 (11.0%) |
| 1 or 2 Children | 0 (0.0%) | 0 (0.0%) |
| 3 or 4 Children | 0 (0.0%) | 0 (0.0%) |
| 5 or more Children | 0 (0.0%) | 0 (0.0%) |
| Total | 0 (0.0%) | 25 (7.3%) |
Income Below Poverty Among Married-Couple vs Single-Parent Households in Ventnor City
The poverty data for Ventnor City shows that 115 of the married-couple family households (6.3%) and 25 of the single-parent households (4.1%) are living below the poverty level. Within the married-couple family households, those with 1 or 2 children have the highest poverty rate, with 61 households (13.7%) falling below the poverty line. Among the single-parent households, those with no children have the highest poverty rate, with 25 household (5.3%) living below poverty.
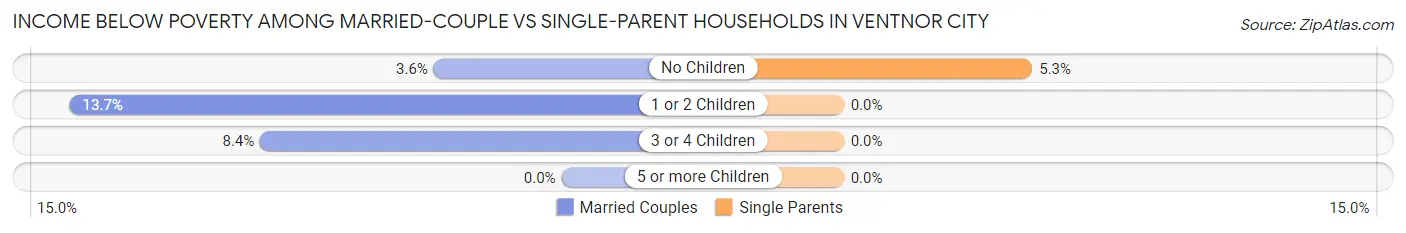
| Children | Married-Couple Families | Single-Parent Households |
| No Children | 46 (3.6%) | 25 (5.3%) |
| 1 or 2 Children | 61 (13.7%) | 0 (0.0%) |
| 3 or 4 Children | 8 (8.4%) | 0 (0.0%) |
| 5 or more Children | 0 (0.0%) | 0 (0.0%) |
| Total | 115 (6.3%) | 25 (4.1%) |
Race in Ventnor City
The most populous races in Ventnor City are White / Caucasian (6,954 | 74.9%), Hispanic or Latino (1,243 | 13.4%), and Asian (844 | 9.1%).
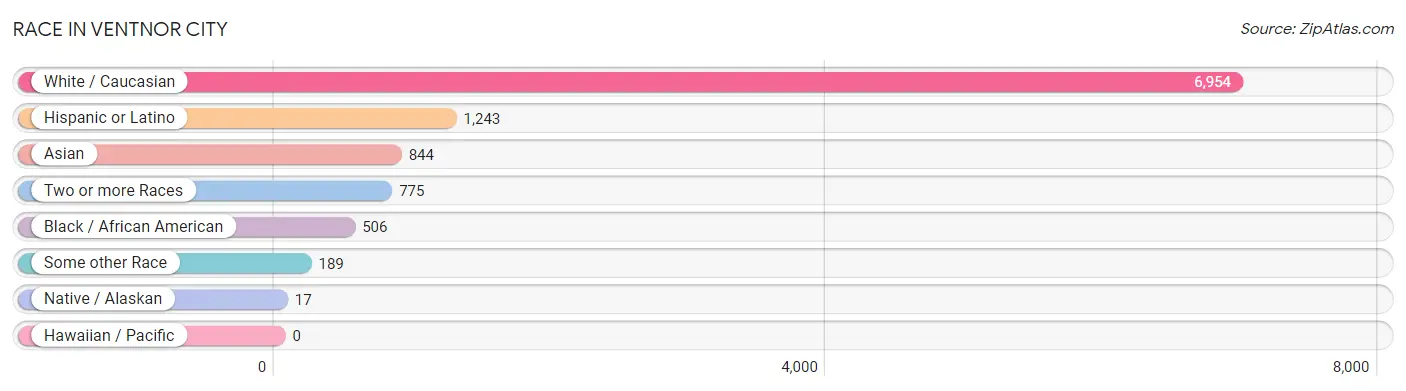
| Race | # Population | % Population |
| Asian | 844 | 9.1% |
| Black / African American | 506 | 5.4% |
| Hawaiian / Pacific | 0 | 0.0% |
| Hispanic or Latino | 1,243 | 13.4% |
| Native / Alaskan | 17 | 0.2% |
| White / Caucasian | 6,954 | 74.9% |
| Two or more Races | 775 | 8.4% |
| Some other Race | 189 | 2.0% |
| Total | 9,285 | 100.0% |
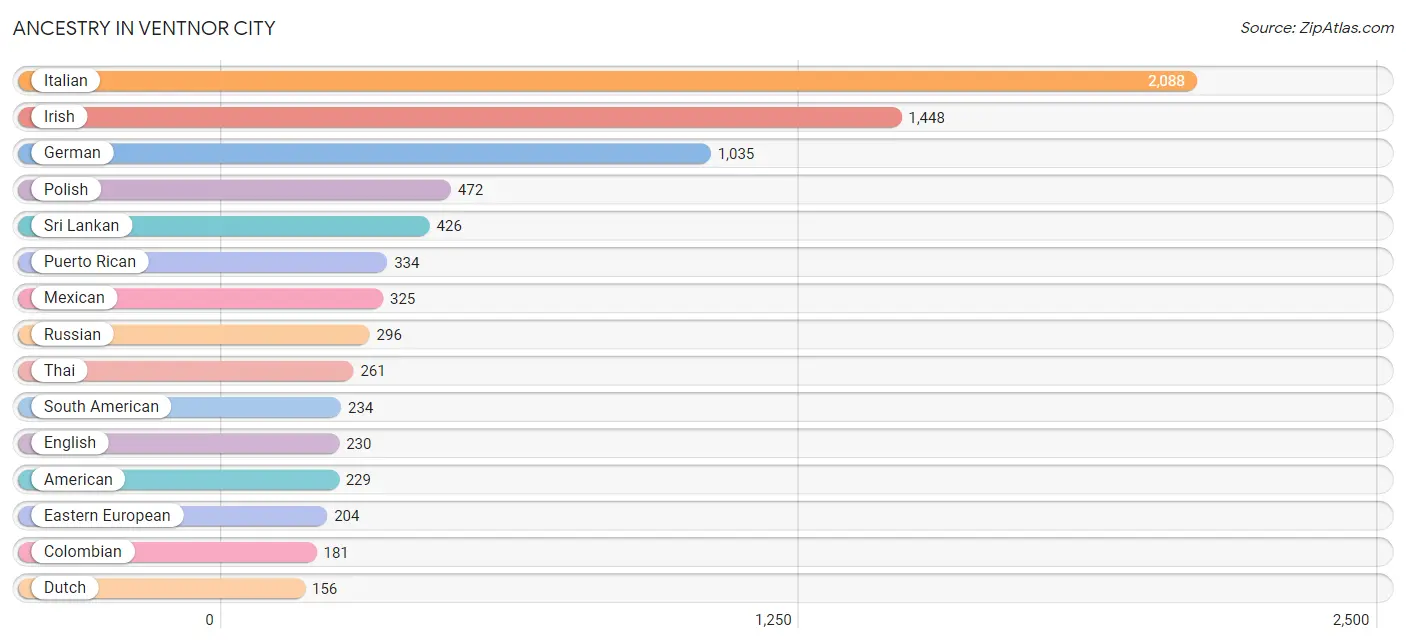
Ancestry in Ventnor City
The most populous ancestries reported in Ventnor City are Italian (2,088 | 22.5%), Irish (1,448 | 15.6%), German (1,035 | 11.2%), Polish (472 | 5.1%), and Sri Lankan (426 | 4.6%), together accounting for 58.9% of all Ventnor City residents.
| Ancestry | # Population | % Population |
| Afghan | 66 | 0.7% |
| African | 6 | 0.1% |
| American | 229 | 2.5% |
| Arab | 62 | 0.7% |
| Armenian | 9 | 0.1% |
| Austrian | 30 | 0.3% |
| Bhutanese | 117 | 1.3% |
| Brazilian | 22 | 0.2% |
| British | 9 | 0.1% |
| Burmese | 43 | 0.5% |
| Cambodian | 4 | 0.0% |
| Central American | 142 | 1.5% |
| Colombian | 181 | 1.9% |
| Croatian | 36 | 0.4% |
| Danish | 15 | 0.2% |
| Dominican | 115 | 1.2% |
| Dutch | 156 | 1.7% |
| Eastern European | 204 | 2.2% |
| Ecuadorian | 53 | 0.6% |
| Egyptian | 19 | 0.2% |
| English | 230 | 2.5% |
| European | 55 | 0.6% |
| French | 61 | 0.7% |
| German | 1,035 | 11.2% |
| Greek | 58 | 0.6% |
| Honduran | 65 | 0.7% |
| Hungarian | 84 | 0.9% |
| Indian (Asian) | 106 | 1.1% |
| Irish | 1,448 | 15.6% |
| Iroquois | 25 | 0.3% |
| Italian | 2,088 | 22.5% |
| Jordanian | 29 | 0.3% |
| Korean | 37 | 0.4% |
| Lebanese | 8 | 0.1% |
| Lithuanian | 44 | 0.5% |
| Mexican | 325 | 3.5% |
| Nicaraguan | 77 | 0.8% |
| Norwegian | 33 | 0.4% |
| Palestinian | 35 | 0.4% |
| Pennsylvania German | 38 | 0.4% |
| Polish | 472 | 5.1% |
| Portuguese | 6 | 0.1% |
| Puerto Rican | 334 | 3.6% |
| Romanian | 74 | 0.8% |
| Russian | 296 | 3.2% |
| Scotch-Irish | 15 | 0.2% |
| Scottish | 44 | 0.5% |
| Slavic | 16 | 0.2% |
| Slovak | 22 | 0.2% |
| South American | 234 | 2.5% |
| Spaniard | 63 | 0.7% |
| Sri Lankan | 426 | 4.6% |
| Subsaharan African | 6 | 0.1% |
| Swedish | 76 | 0.8% |
| Thai | 261 | 2.8% |
| Turkish | 22 | 0.2% |
| Ukrainian | 125 | 1.3% |
| Vietnamese | 15 | 0.2% |
| Welsh | 52 | 0.6% | View All 59 Rows |
Immigrants in Ventnor City
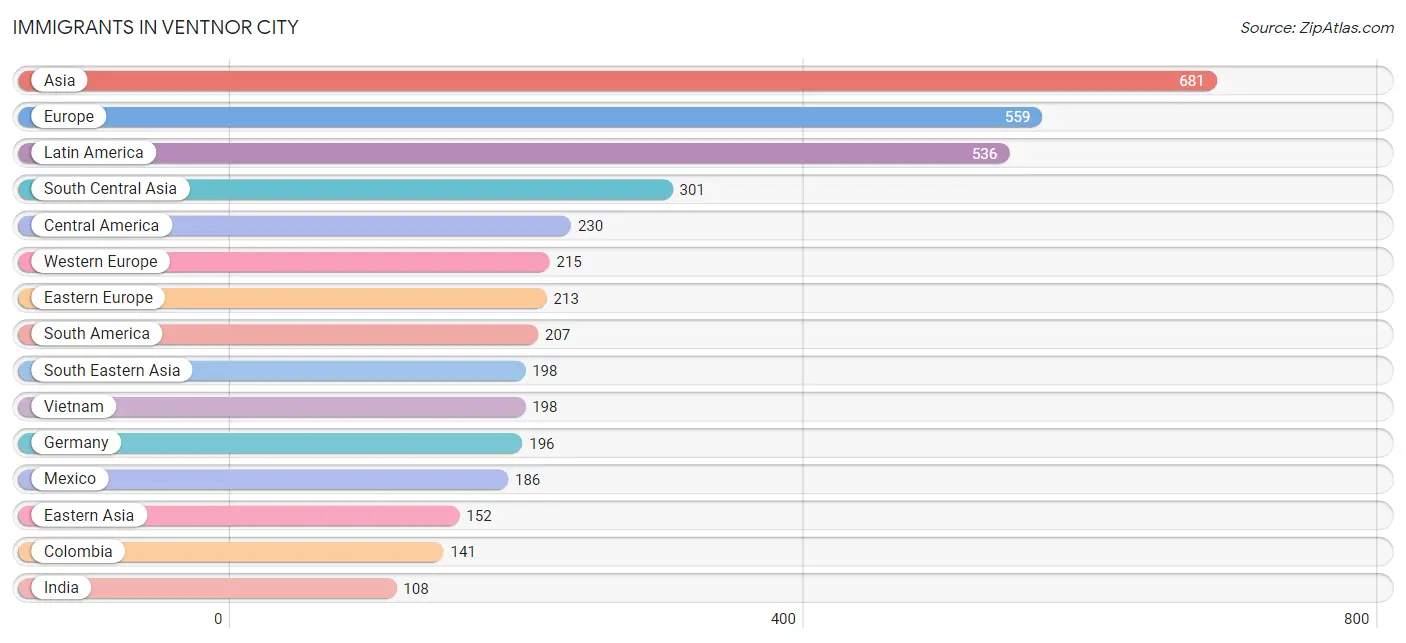
The most numerous immigrant groups reported in Ventnor City came from Asia (681 | 7.3%), Europe (559 | 6.0%), Latin America (536 | 5.8%), South Central Asia (301 | 3.2%), and Central America (230 | 2.5%), together accounting for 24.8% of all Ventnor City residents.
| Immigration Origin | # Population | % Population |
| Afghanistan | 66 | 0.7% |
| Africa | 83 | 0.9% |
| Asia | 681 | 7.3% |
| Bangladesh | 71 | 0.8% |
| Brazil | 22 | 0.2% |
| Caribbean | 99 | 1.1% |
| Central America | 230 | 2.5% |
| China | 70 | 0.7% |
| Colombia | 141 | 1.5% |
| Dominican Republic | 49 | 0.5% |
| Eastern Asia | 152 | 1.6% |
| Eastern Europe | 213 | 2.3% |
| Ecuador | 44 | 0.5% |
| Egypt | 77 | 0.8% |
| England | 63 | 0.7% |
| Europe | 559 | 6.0% |
| France | 8 | 0.1% |
| Germany | 196 | 2.1% |
| Ghana | 6 | 0.1% |
| Greece | 31 | 0.3% |
| Honduras | 44 | 0.5% |
| India | 108 | 1.2% |
| Italy | 37 | 0.4% |
| Japan | 52 | 0.6% |
| Jordan | 8 | 0.1% |
| Korea | 30 | 0.3% |
| Kuwait | 6 | 0.1% |
| Latin America | 536 | 5.8% |
| Mexico | 186 | 2.0% |
| Moldova | 28 | 0.3% |
| Netherlands | 11 | 0.1% |
| Northern Africa | 77 | 0.8% |
| Northern Europe | 63 | 0.7% |
| Pakistan | 33 | 0.4% |
| Poland | 73 | 0.8% |
| Romania | 5 | 0.1% |
| Russia | 74 | 0.8% |
| South America | 207 | 2.2% |
| South Central Asia | 301 | 3.2% |
| South Eastern Asia | 198 | 2.1% |
| Southern Europe | 68 | 0.7% |
| Taiwan | 6 | 0.1% |
| Turkey | 16 | 0.2% |
| Ukraine | 33 | 0.4% |
| Uzbekistan | 23 | 0.3% |
| Vietnam | 198 | 2.1% |
| Western Africa | 6 | 0.1% |
| Western Asia | 30 | 0.3% |
| Western Europe | 215 | 2.3% | View All 49 Rows |
Sex and Age in Ventnor City
Sex and Age in Ventnor City
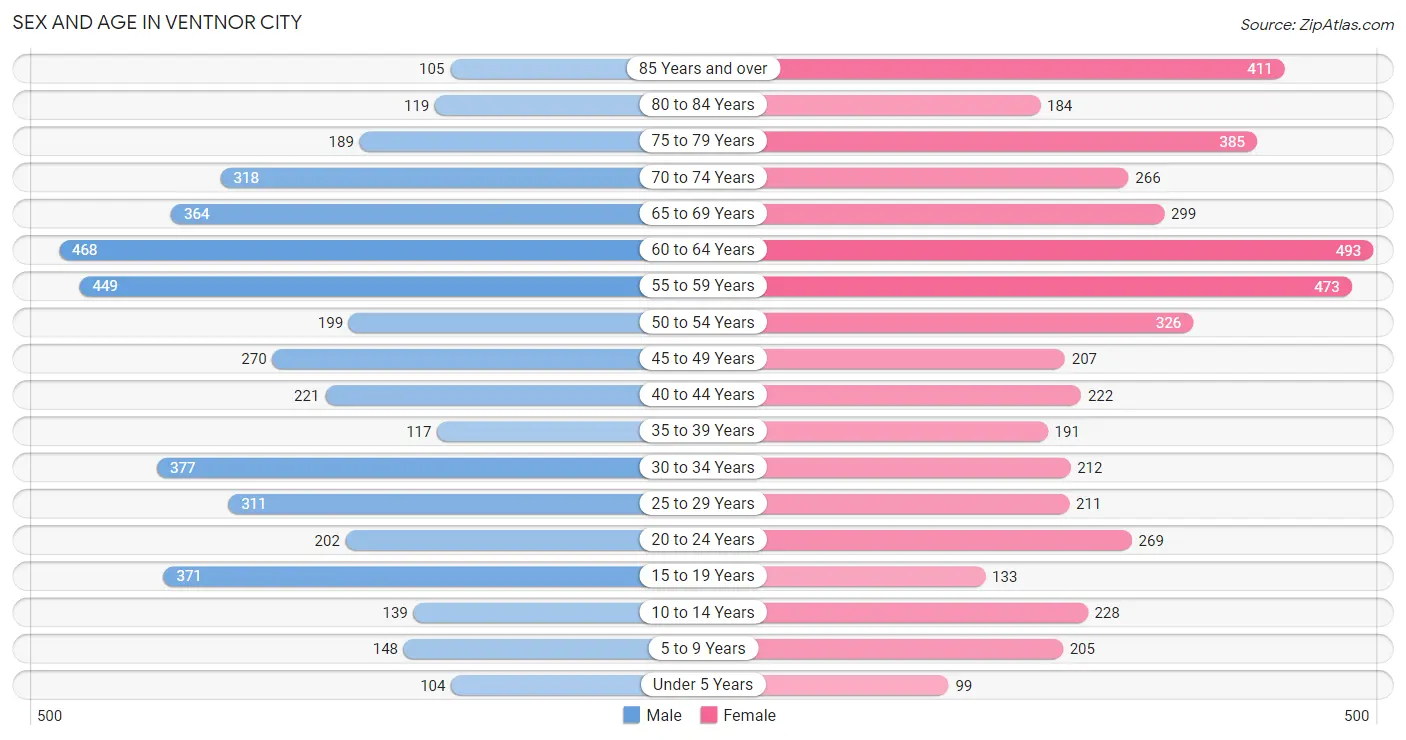
The most populous age groups in Ventnor City are 60 to 64 Years (468 | 10.5%) for men and 60 to 64 Years (493 | 10.2%) for women.
| Age Bracket | Male | Female |
| Under 5 Years | 104 (2.3%) | 99 (2.1%) |
| 5 to 9 Years | 148 (3.3%) | 205 (4.3%) |
| 10 to 14 Years | 139 (3.1%) | 228 (4.7%) |
| 15 to 19 Years | 371 (8.3%) | 133 (2.8%) |
| 20 to 24 Years | 202 (4.5%) | 269 (5.6%) |
| 25 to 29 Years | 311 (7.0%) | 211 (4.4%) |
| 30 to 34 Years | 377 (8.4%) | 212 (4.4%) |
| 35 to 39 Years | 117 (2.6%) | 191 (4.0%) |
| 40 to 44 Years | 221 (4.9%) | 222 (4.6%) |
| 45 to 49 Years | 270 (6.0%) | 207 (4.3%) |
| 50 to 54 Years | 199 (4.4%) | 326 (6.8%) |
| 55 to 59 Years | 449 (10.0%) | 473 (9.8%) |
| 60 to 64 Years | 468 (10.5%) | 493 (10.2%) |
| 65 to 69 Years | 364 (8.1%) | 299 (6.2%) |
| 70 to 74 Years | 318 (7.1%) | 266 (5.5%) |
| 75 to 79 Years | 189 (4.2%) | 385 (8.0%) |
| 80 to 84 Years | 119 (2.7%) | 184 (3.8%) |
| 85 Years and over | 105 (2.4%) | 411 (8.5%) |
| Total | 4,471 (100.0%) | 4,814 (100.0%) |
Families and Households in Ventnor City
Median Family Size in Ventnor City
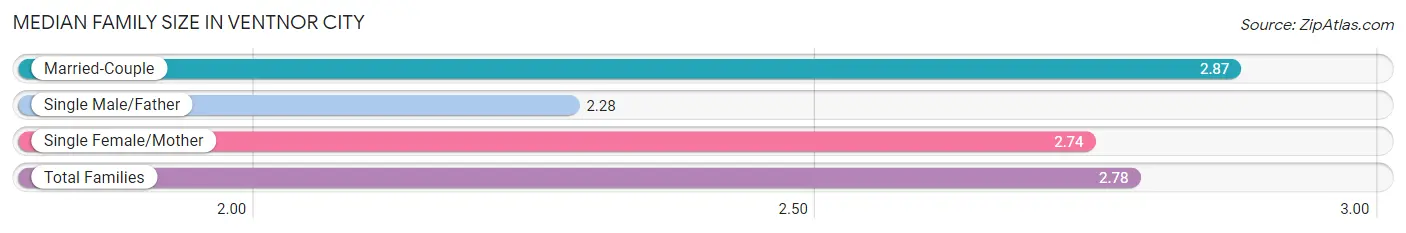
The median family size in Ventnor City is 2.78 persons per family, with married-couple families (1,828 | 75.2%) accounting for the largest median family size of 2.87 persons per family. On the other hand, single male/father families (263 | 10.8%) represent the smallest median family size with 2.28 persons per family.
| Family Type | # Families | Family Size |
| Married-Couple | 1,828 (75.2%) | 2.87 |
| Single Male/Father | 263 (10.8%) | 2.28 |
| Single Female/Mother | 341 (14.0%) | 2.74 |
| Total Families | 2,432 (100.0%) | 2.78 |
Median Household Size in Ventnor City
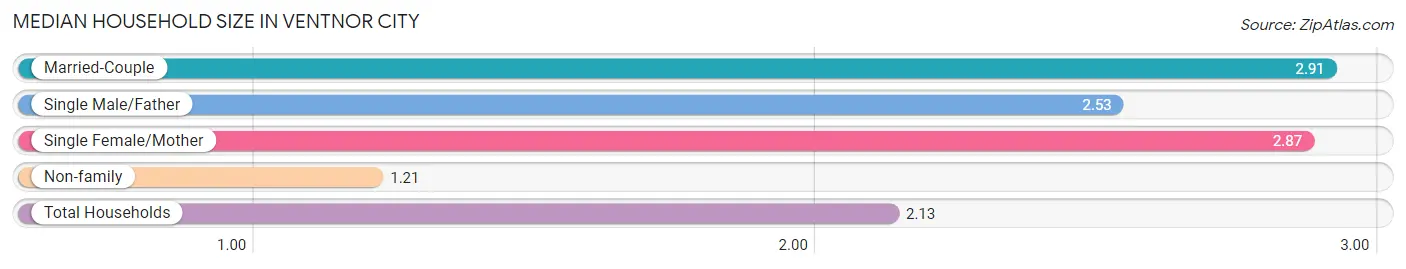
The median household size in Ventnor City is 2.13 persons per household, with married-couple households (1,828 | 42.0%) accounting for the largest median household size of 2.91 persons per household. non-family households (1,916 | 44.1%) represent the smallest median household size with 1.21 persons per household.
| Household Type | # Households | Household Size |
| Married-Couple | 1,828 (42.0%) | 2.91 |
| Single Male/Father | 263 (6.0%) | 2.53 |
| Single Female/Mother | 341 (7.8%) | 2.87 |
| Non-family | 1,916 (44.1%) | 1.21 |
| Total Households | 4,348 (100.0%) | 2.13 |
Household Size by Marriage Status in Ventnor City
Out of a total of 4,348 households in Ventnor City, 2,432 (55.9%) are family households, while 1,916 (44.1%) are nonfamily households. The most numerous type of family households are 2-person households, comprising 1,372, and the most common type of nonfamily households are 1-person households, comprising 1,602.
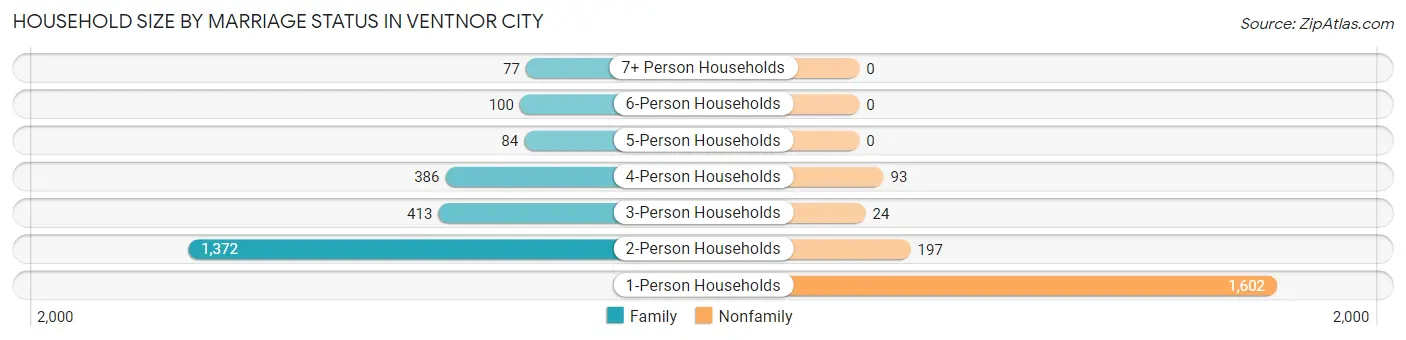
| Household Size | Family Households | Nonfamily Households |
| 1-Person Households | - | 1,602 (36.8%) |
| 2-Person Households | 1,372 (31.6%) | 197 (4.5%) |
| 3-Person Households | 413 (9.5%) | 24 (0.5%) |
| 4-Person Households | 386 (8.9%) | 93 (2.1%) |
| 5-Person Households | 84 (1.9%) | 0 (0.0%) |
| 6-Person Households | 100 (2.3%) | 0 (0.0%) |
| 7+ Person Households | 77 (1.8%) | 0 (0.0%) |
| Total | 2,432 (55.9%) | 1,916 (44.1%) |
Female Fertility in Ventnor City
Fertility by Age in Ventnor City
Average fertility rate in Ventnor City is 60.0 births per 1,000 women. Women in the age bracket of 35 to 50 years have the highest fertility rate with 77.0 births per 1,000 women. Women in the age bracket of 35 to 50 years acount for 57.3% of all women with births.
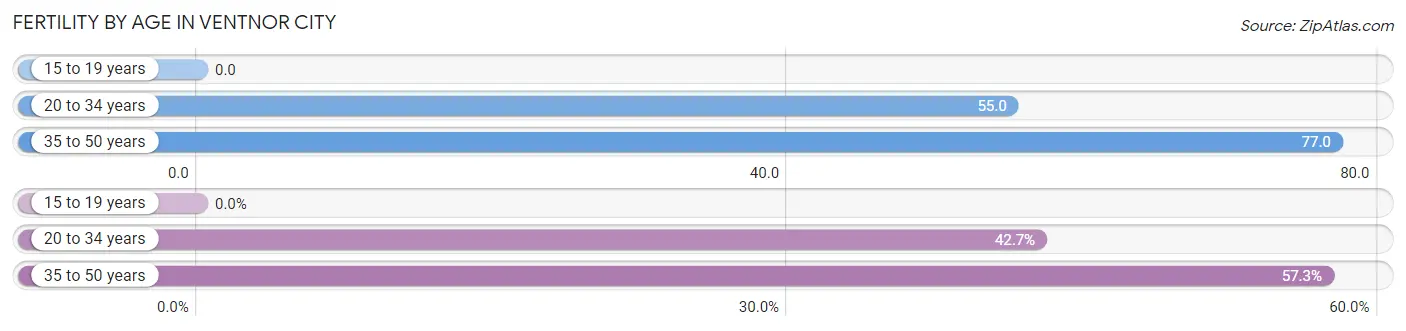
| Age Bracket | Women with Births | Births / 1,000 Women |
| 15 to 19 years | 0 (0.0%) | 0.0 |
| 20 to 34 years | 38 (42.7%) | 55.0 |
| 35 to 50 years | 51 (57.3%) | 77.0 |
| Total | 89 (100.0%) | 60.0 |
Fertility by Age by Marriage Status in Ventnor City
64.0% of women with births (89) in Ventnor City are married. The highest percentage of unmarried women with births falls into 20 to 34 years age bracket with 84.2% of them unmarried at the time of birth, while the lowest percentage of unmarried women with births belong to 35 to 50 years age bracket with 0.0% of them unmarried.
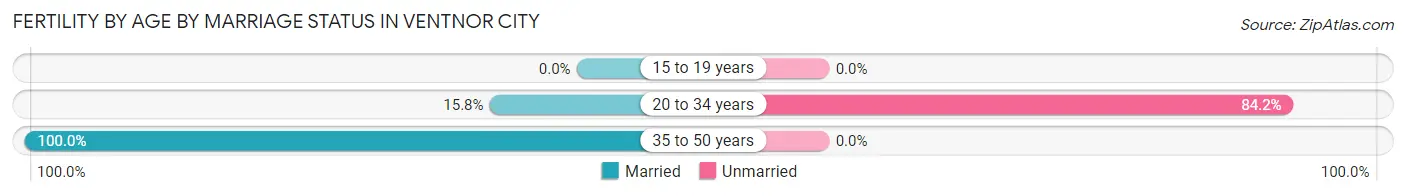
| Age Bracket | Married | Unmarried |
| 15 to 19 years | 0 (0.0%) | 0 (0.0%) |
| 20 to 34 years | 6 (15.8%) | 32 (84.2%) |
| 35 to 50 years | 51 (100.0%) | 0 (0.0%) |
| Total | 57 (64.0%) | 32 (36.0%) |
Fertility by Education in Ventnor City
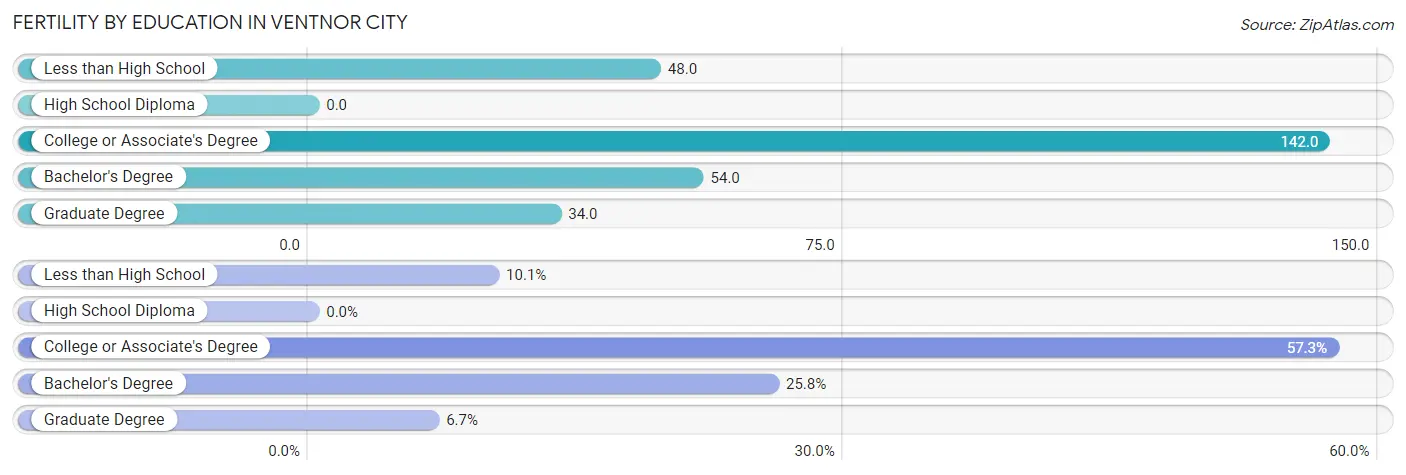
| Educational Attainment | Women with Births | Births / 1,000 Women |
| Less than High School | 9 (10.1%) | 48.0 |
| High School Diploma | 0 (0.0%) | 0.0 |
| College or Associate's Degree | 51 (57.3%) | 142.0 |
| Bachelor's Degree | 23 (25.8%) | 54.0 |
| Graduate Degree | 6 (6.7%) | 34.0 |
| Total | 89 (100.0%) | 60.0 |
Fertility by Education by Marriage Status in Ventnor City
36.0% of women with births in Ventnor City are unmarried. Women with the educational attainment of less than high school are most likely to be married with 100.0% of them married at childbirth, while women with the educational attainment of college or associate's degree are least likely to be married with 62.7% of them unmarried at childbirth.
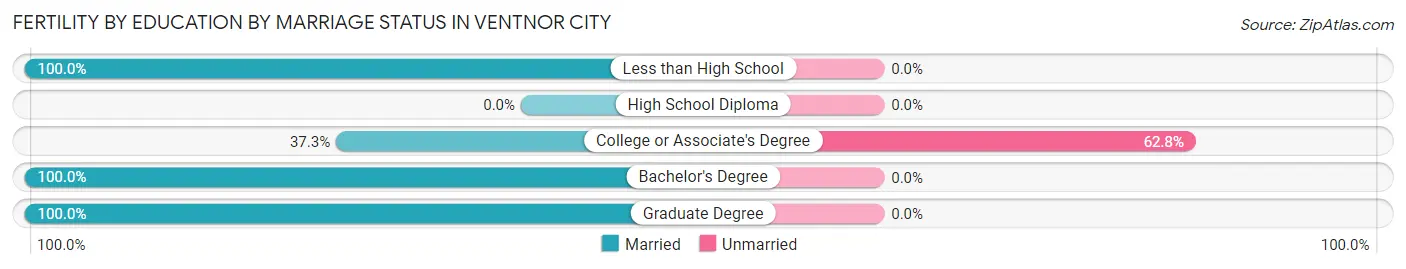
| Educational Attainment | Married | Unmarried |
| Less than High School | 9 (100.0%) | 0 (0.0%) |
| High School Diploma | 0 (0.0%) | 0 (0.0%) |
| College or Associate's Degree | 19 (37.2%) | 32 (62.7%) |
| Bachelor's Degree | 23 (100.0%) | 0 (0.0%) |
| Graduate Degree | 6 (100.0%) | 0 (0.0%) |
| Total | 57 (64.0%) | 32 (36.0%) |
Employment Characteristics in Ventnor City
Employment by Class of Employer in Ventnor City
Among the 4,377 employed individuals in Ventnor City, private company employees (2,945 | 67.3%), local government employees (411 | 9.4%), and not-for-profit organizations (310 | 7.1%) make up the most common classes of employment.
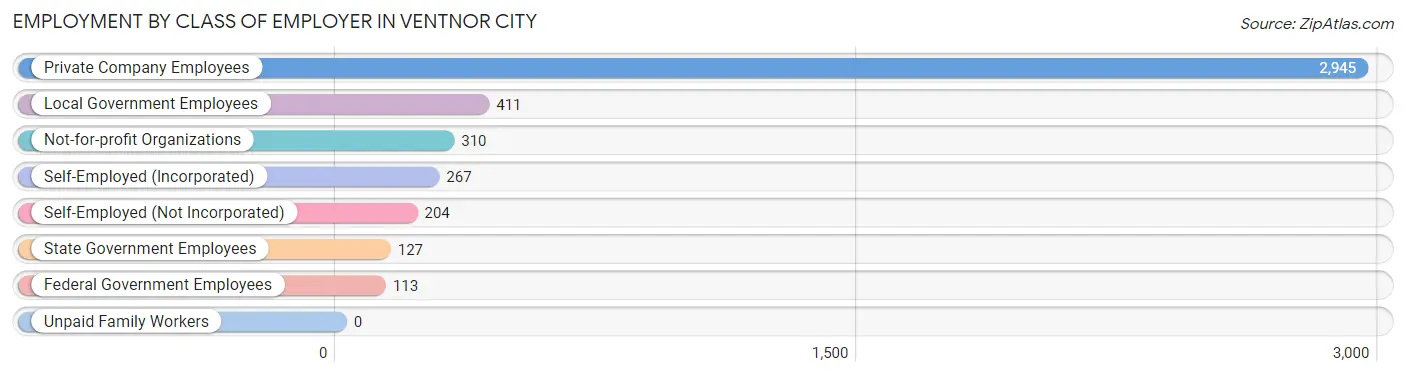
| Employer Class | # Employees | % Employees |
| Private Company Employees | 2,945 | 67.3% |
| Self-Employed (Incorporated) | 267 | 6.1% |
| Self-Employed (Not Incorporated) | 204 | 4.7% |
| Not-for-profit Organizations | 310 | 7.1% |
| Local Government Employees | 411 | 9.4% |
| State Government Employees | 127 | 2.9% |
| Federal Government Employees | 113 | 2.6% |
| Unpaid Family Workers | 0 | 0.0% |
| Total | 4,377 | 100.0% |
Employment Status by Age in Ventnor City
According to the labor force statistics for Ventnor City, out of the total population over 16 years of age (8,277), 58.2% or 4,817 individuals are in the labor force, with 7.2% or 347 of them unemployed. The age group with the highest labor force participation rate is 25 to 29 years, with 97.3% or 508 individuals in the labor force. Within the labor force, the 20 to 24 years age range has the highest percentage of unemployed individuals, with 27.1% or 82 of them being unemployed.
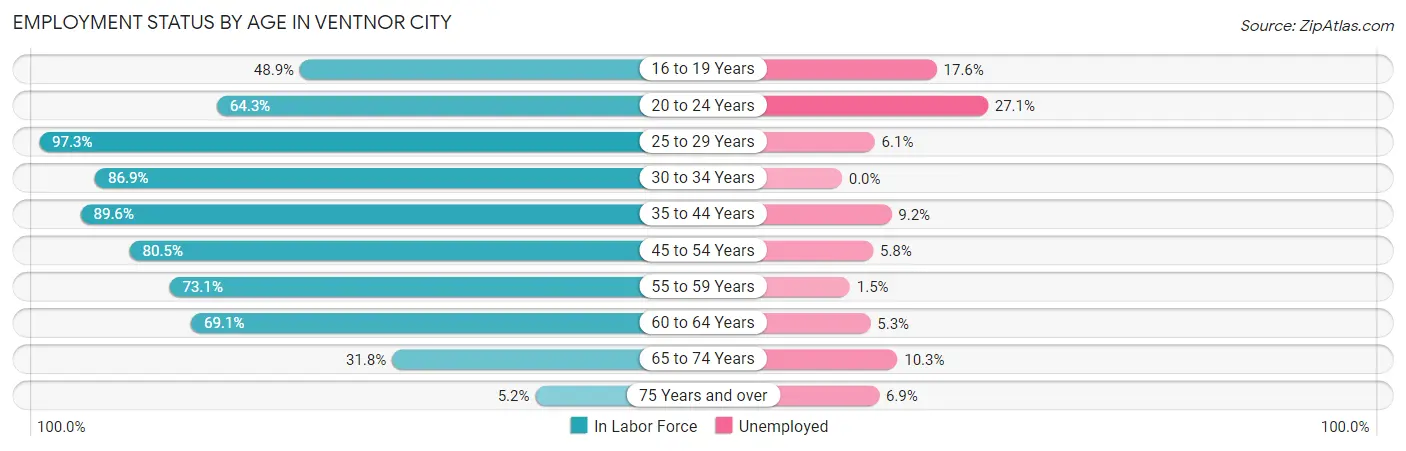
| Age Bracket | In Labor Force | Unemployed |
| 16 to 19 Years | 205 (48.9%) | 36 (17.6%) |
| 20 to 24 Years | 303 (64.3%) | 82 (27.1%) |
| 25 to 29 Years | 508 (97.3%) | 31 (6.1%) |
| 30 to 34 Years | 512 (86.9%) | 0 (0.0%) |
| 35 to 44 Years | 673 (89.6%) | 62 (9.2%) |
| 45 to 54 Years | 807 (80.5%) | 47 (5.8%) |
| 55 to 59 Years | 674 (73.1%) | 10 (1.5%) |
| 60 to 64 Years | 664 (69.1%) | 35 (5.3%) |
| 65 to 74 Years | 397 (31.8%) | 41 (10.3%) |
| 75 Years and over | 72 (5.2%) | 5 (6.9%) |
| Total | 4,817 (58.2%) | 347 (7.2%) |
Employment Status by Educational Attainment in Ventnor City
According to labor force statistics for Ventnor City, 80.9% of individuals (3,840) out of the total population between 25 and 64 years of age (4,747) are in the labor force, with 4.8% or 184 of them being unemployed. The group with the highest labor force participation rate are those with the educational attainment of college / associate degree, with 84.7% or 1,078 individuals in the labor force. Within the labor force, individuals with less than high school education have the highest percentage of unemployment, with 18.9% or 50 of them being unemployed.
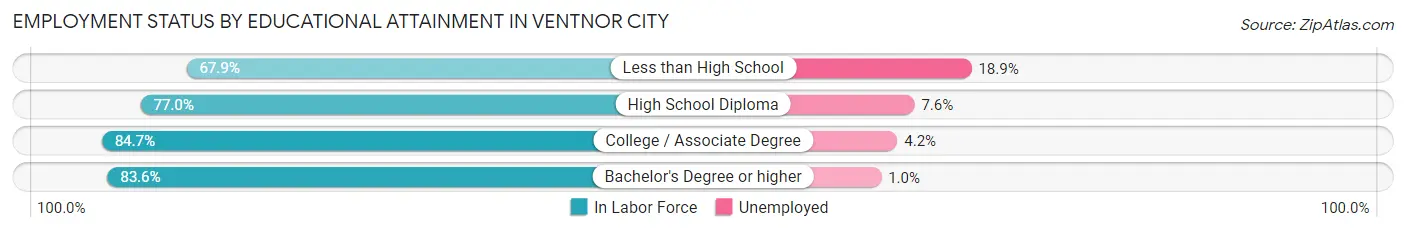
| Educational Attainment | In Labor Force | Unemployed |
| Less than High School | 265 (67.9%) | 74 (18.9%) |
| High School Diploma | 969 (77.0%) | 96 (7.6%) |
| College / Associate Degree | 1,078 (84.7%) | 53 (4.2%) |
| Bachelor's Degree or higher | 1,527 (83.6%) | 18 (1.0%) |
| Total | 3,840 (80.9%) | 228 (4.8%) |
Employment Occupations by Sex in Ventnor City
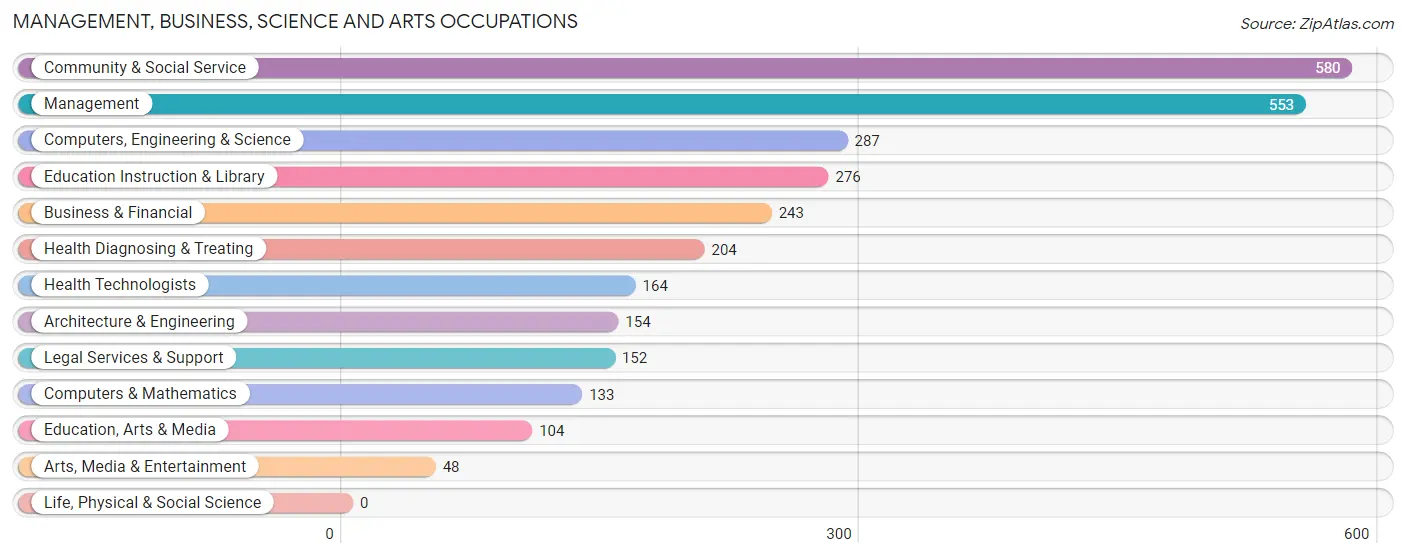
Management, Business, Science and Arts Occupations
The most common Management, Business, Science and Arts occupations in Ventnor City are Community & Social Service (580 | 13.0%), Management (553 | 12.4%), Computers, Engineering & Science (287 | 6.4%), Education Instruction & Library (276 | 6.2%), and Business & Financial (243 | 5.4%).
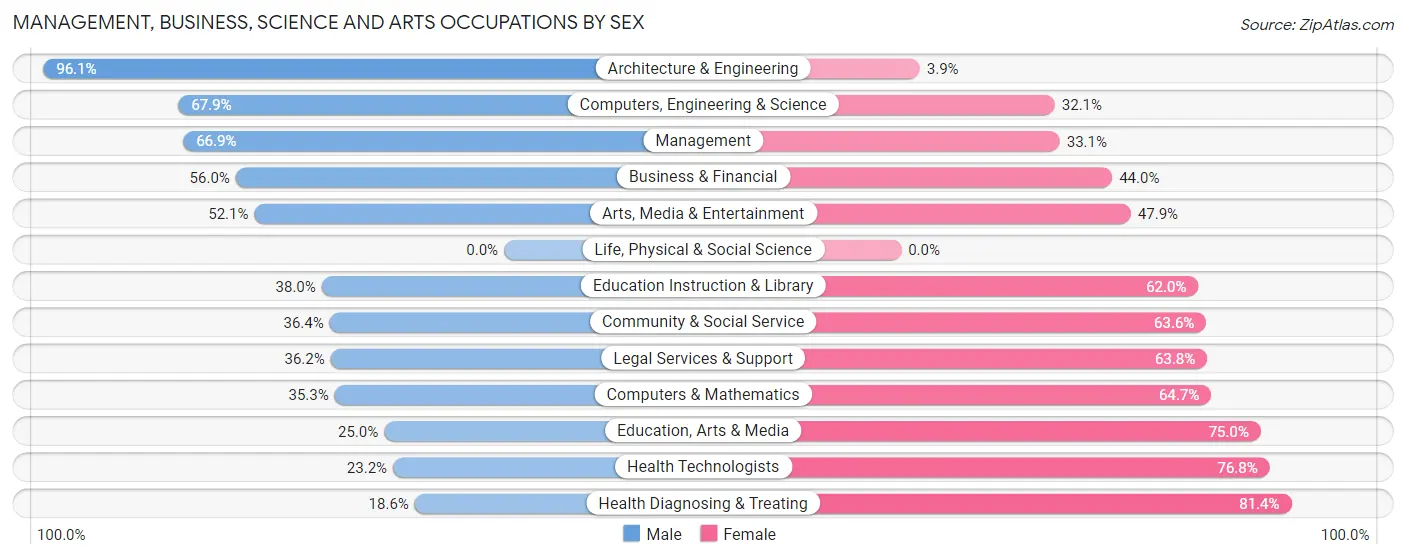
Management, Business, Science and Arts Occupations by Sex
Within the Management, Business, Science and Arts occupations in Ventnor City, the most male-oriented occupations are Architecture & Engineering (96.1%), Computers, Engineering & Science (67.9%), and Management (66.9%), while the most female-oriented occupations are Health Diagnosing & Treating (81.4%), Health Technologists (76.8%), and Education, Arts & Media (75.0%).
| Occupation | Male | Female |
| Management | 370 (66.9%) | 183 (33.1%) |
| Business & Financial | 136 (56.0%) | 107 (44.0%) |
| Computers, Engineering & Science | 195 (67.9%) | 92 (32.1%) |
| Computers & Mathematics | 47 (35.3%) | 86 (64.7%) |
| Architecture & Engineering | 148 (96.1%) | 6 (3.9%) |
| Life, Physical & Social Science | 0 (0.0%) | 0 (0.0%) |
| Community & Social Service | 211 (36.4%) | 369 (63.6%) |
| Education, Arts & Media | 26 (25.0%) | 78 (75.0%) |
| Legal Services & Support | 55 (36.2%) | 97 (63.8%) |
| Education Instruction & Library | 105 (38.0%) | 171 (62.0%) |
| Arts, Media & Entertainment | 25 (52.1%) | 23 (47.9%) |
| Health Diagnosing & Treating | 38 (18.6%) | 166 (81.4%) |
| Health Technologists | 38 (23.2%) | 126 (76.8%) |
| Total (Category) | 950 (50.9%) | 917 (49.1%) |
| Total (Overall) | 2,453 (54.9%) | 2,013 (45.1%) |
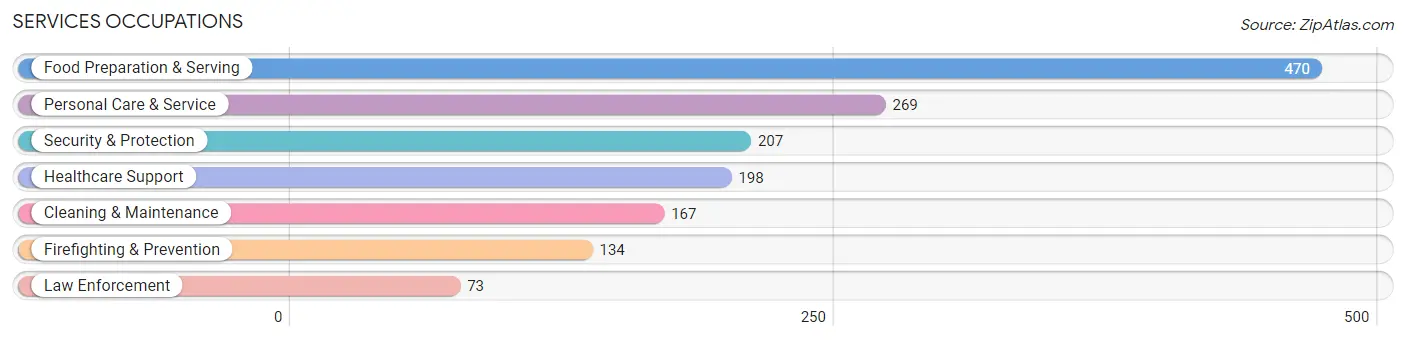
Services Occupations
The most common Services occupations in Ventnor City are Food Preparation & Serving (470 | 10.5%), Personal Care & Service (269 | 6.0%), Security & Protection (207 | 4.6%), Healthcare Support (198 | 4.4%), and Cleaning & Maintenance (167 | 3.7%).
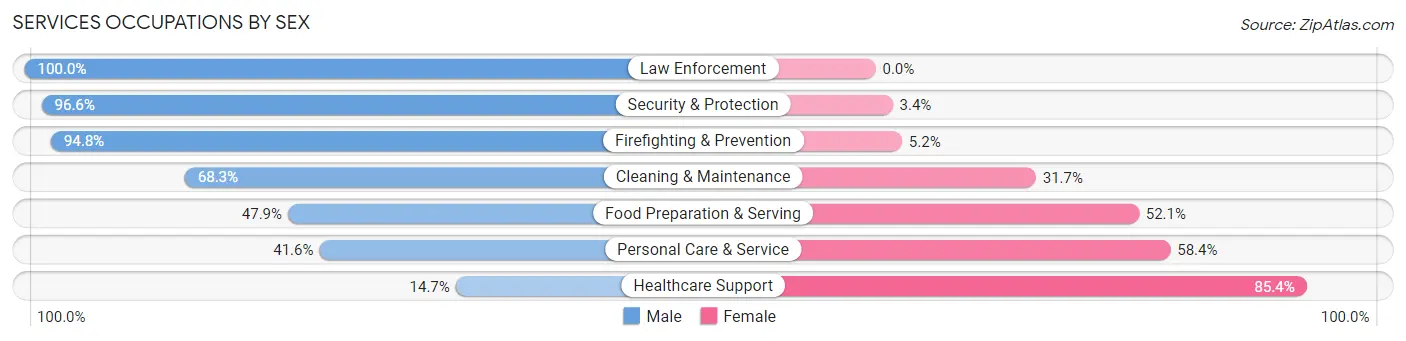
Services Occupations by Sex
Within the Services occupations in Ventnor City, the most male-oriented occupations are Law Enforcement (100.0%), Security & Protection (96.6%), and Firefighting & Prevention (94.8%), while the most female-oriented occupations are Healthcare Support (85.4%), Personal Care & Service (58.4%), and Food Preparation & Serving (52.1%).
| Occupation | Male | Female |
| Healthcare Support | 29 (14.6%) | 169 (85.4%) |
| Security & Protection | 200 (96.6%) | 7 (3.4%) |
| Firefighting & Prevention | 127 (94.8%) | 7 (5.2%) |
| Law Enforcement | 73 (100.0%) | 0 (0.0%) |
| Food Preparation & Serving | 225 (47.9%) | 245 (52.1%) |
| Cleaning & Maintenance | 114 (68.3%) | 53 (31.7%) |
| Personal Care & Service | 112 (41.6%) | 157 (58.4%) |
| Total (Category) | 680 (51.9%) | 631 (48.1%) |
| Total (Overall) | 2,453 (54.9%) | 2,013 (45.1%) |
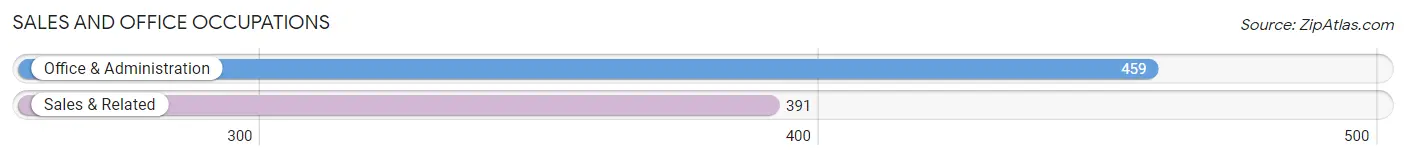
Sales and Office Occupations
The most common Sales and Office occupations in Ventnor City are Office & Administration (459 | 10.3%), and Sales & Related (391 | 8.8%).
Sales and Office Occupations by Sex
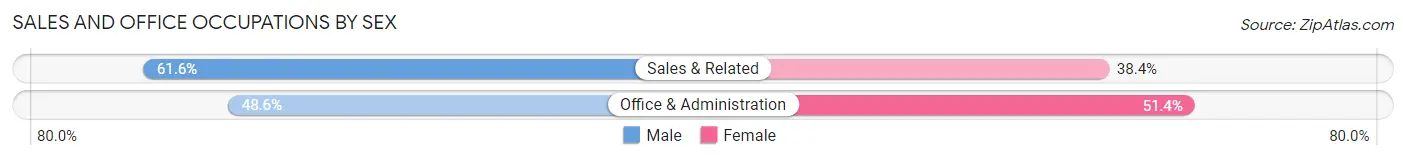
| Occupation | Male | Female |
| Sales & Related | 241 (61.6%) | 150 (38.4%) |
| Office & Administration | 223 (48.6%) | 236 (51.4%) |
| Total (Category) | 464 (54.6%) | 386 (45.4%) |
| Total (Overall) | 2,453 (54.9%) | 2,013 (45.1%) |
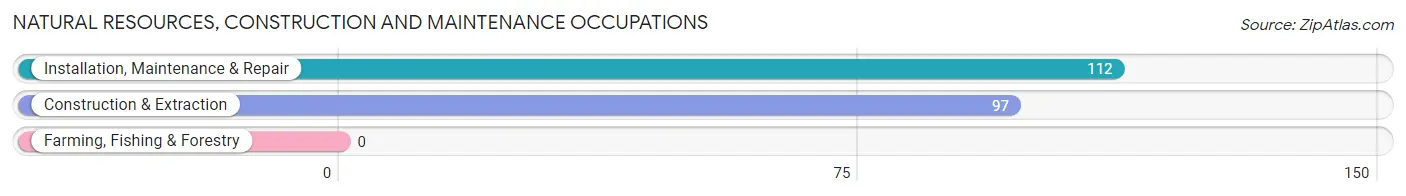
Natural Resources, Construction and Maintenance Occupations
The most common Natural Resources, Construction and Maintenance occupations in Ventnor City are Installation, Maintenance & Repair (112 | 2.5%), and Construction & Extraction (97 | 2.2%).
Natural Resources, Construction and Maintenance Occupations by Sex
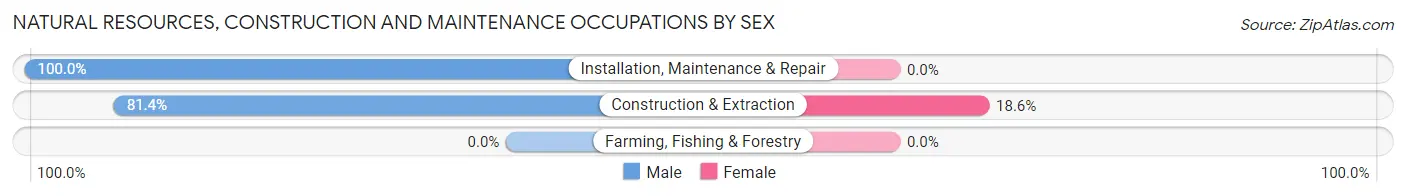
| Occupation | Male | Female |
| Farming, Fishing & Forestry | 0 (0.0%) | 0 (0.0%) |
| Construction & Extraction | 79 (81.4%) | 18 (18.6%) |
| Installation, Maintenance & Repair | 112 (100.0%) | 0 (0.0%) |
| Total (Category) | 191 (91.4%) | 18 (8.6%) |
| Total (Overall) | 2,453 (54.9%) | 2,013 (45.1%) |
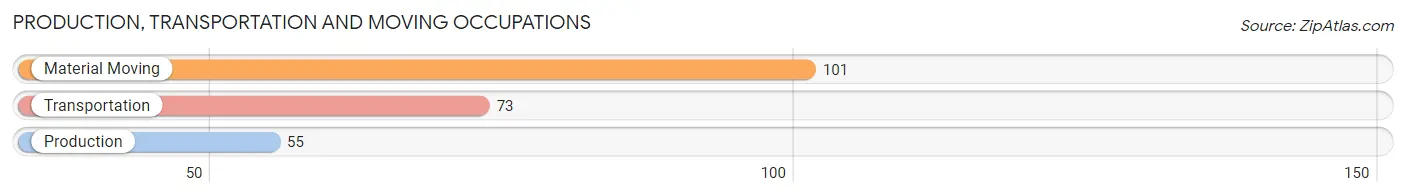
Production, Transportation and Moving Occupations
The most common Production, Transportation and Moving occupations in Ventnor City are Material Moving (101 | 2.3%), Transportation (73 | 1.6%), and Production (55 | 1.2%).
Production, Transportation and Moving Occupations by Sex

| Occupation | Male | Female |
| Production | 20 (36.4%) | 35 (63.6%) |
| Transportation | 73 (100.0%) | 0 (0.0%) |
| Material Moving | 75 (74.3%) | 26 (25.7%) |
| Total (Category) | 168 (73.4%) | 61 (26.6%) |
| Total (Overall) | 2,453 (54.9%) | 2,013 (45.1%) |
Employment Industries by Sex in Ventnor City
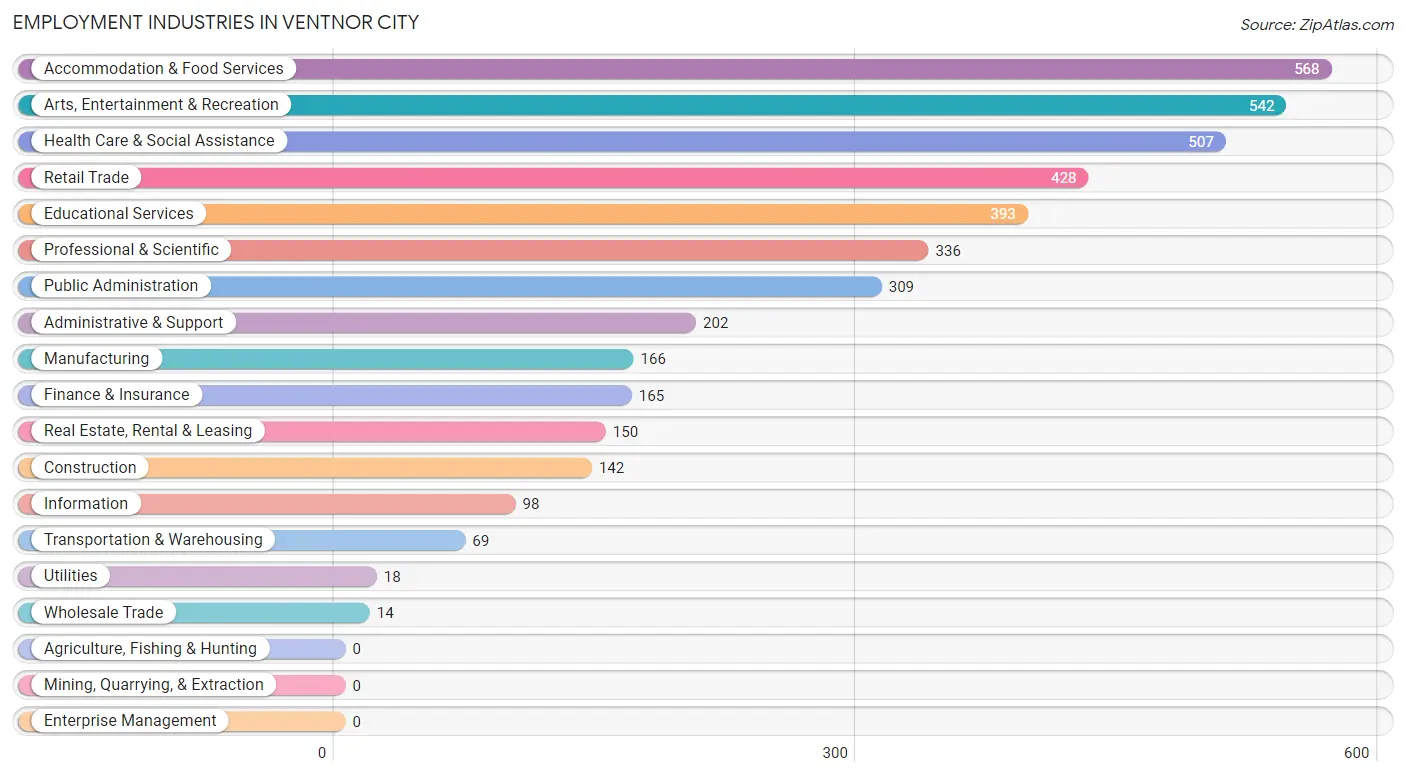
Employment Industries in Ventnor City
The major employment industries in Ventnor City include Accommodation & Food Services (568 | 12.7%), Arts, Entertainment & Recreation (542 | 12.1%), Health Care & Social Assistance (507 | 11.4%), Retail Trade (428 | 9.6%), and Educational Services (393 | 8.8%).
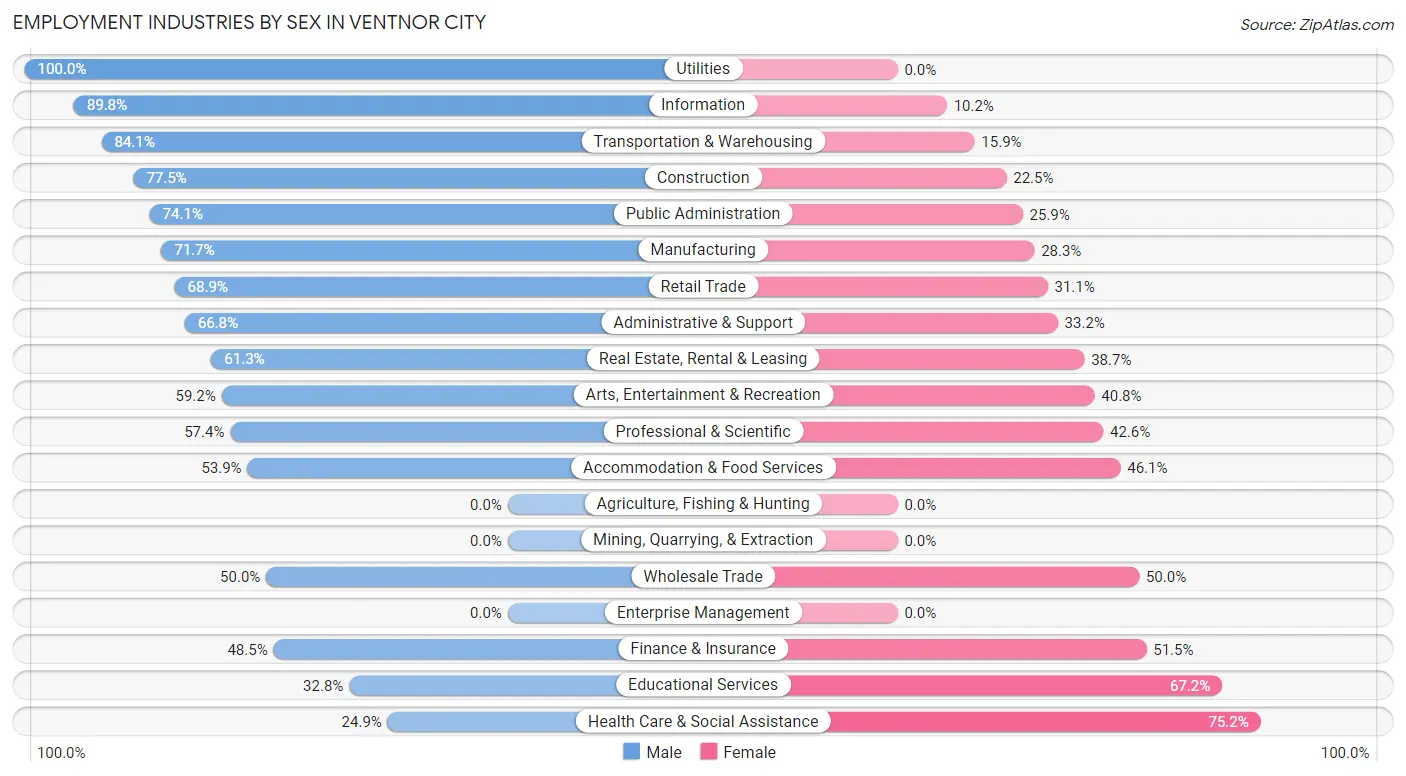
Employment Industries by Sex in Ventnor City
The Ventnor City industries that see more men than women are Utilities (100.0%), Information (89.8%), and Transportation & Warehousing (84.1%), whereas the industries that tend to have a higher number of women are Health Care & Social Assistance (75.1%), Educational Services (67.2%), and Finance & Insurance (51.5%).
| Industry | Male | Female |
| Agriculture, Fishing & Hunting | 0 (0.0%) | 0 (0.0%) |
| Mining, Quarrying, & Extraction | 0 (0.0%) | 0 (0.0%) |
| Construction | 110 (77.5%) | 32 (22.5%) |
| Manufacturing | 119 (71.7%) | 47 (28.3%) |
| Wholesale Trade | 7 (50.0%) | 7 (50.0%) |
| Retail Trade | 295 (68.9%) | 133 (31.1%) |
| Transportation & Warehousing | 58 (84.1%) | 11 (15.9%) |
| Utilities | 18 (100.0%) | 0 (0.0%) |
| Information | 88 (89.8%) | 10 (10.2%) |
| Finance & Insurance | 80 (48.5%) | 85 (51.5%) |
| Real Estate, Rental & Leasing | 92 (61.3%) | 58 (38.7%) |
| Professional & Scientific | 193 (57.4%) | 143 (42.6%) |
| Enterprise Management | 0 (0.0%) | 0 (0.0%) |
| Administrative & Support | 135 (66.8%) | 67 (33.2%) |
| Educational Services | 129 (32.8%) | 264 (67.2%) |
| Health Care & Social Assistance | 126 (24.8%) | 381 (75.1%) |
| Arts, Entertainment & Recreation | 321 (59.2%) | 221 (40.8%) |
| Accommodation & Food Services | 306 (53.9%) | 262 (46.1%) |
| Public Administration | 229 (74.1%) | 80 (25.9%) |
| Total | 2,453 (54.9%) | 2,013 (45.1%) |
Education in Ventnor City
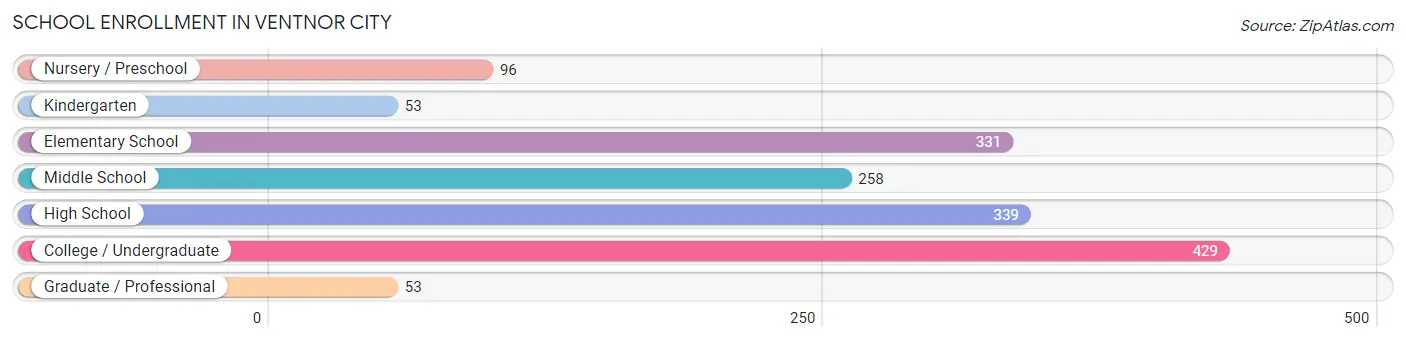
School Enrollment in Ventnor City
The most common levels of schooling among the 1,559 students in Ventnor City are college / undergraduate (429 | 27.5%), high school (339 | 21.7%), and elementary school (331 | 21.2%).
| School Level | # Students | % Students |
| Nursery / Preschool | 96 | 6.2% |
| Kindergarten | 53 | 3.4% |
| Elementary School | 331 | 21.2% |
| Middle School | 258 | 16.6% |
| High School | 339 | 21.7% |
| College / Undergraduate | 429 | 27.5% |
| Graduate / Professional | 53 | 3.4% |
| Total | 1,559 | 100.0% |
School Enrollment by Age by Funding Source in Ventnor City
Out of a total of 1,559 students who are enrolled in schools in Ventnor City, 181 (11.6%) attend a private institution, while the remaining 1,378 (88.4%) are enrolled in public schools. The age group of 35 years and over has the highest likelihood of being enrolled in private schools, with 13 (28.9% in the age bracket) enrolled. Conversely, the age group of 5 to 9 year old has the lowest likelihood of being enrolled in a private school, with 330 (96.8% in the age bracket) attending a public institution.
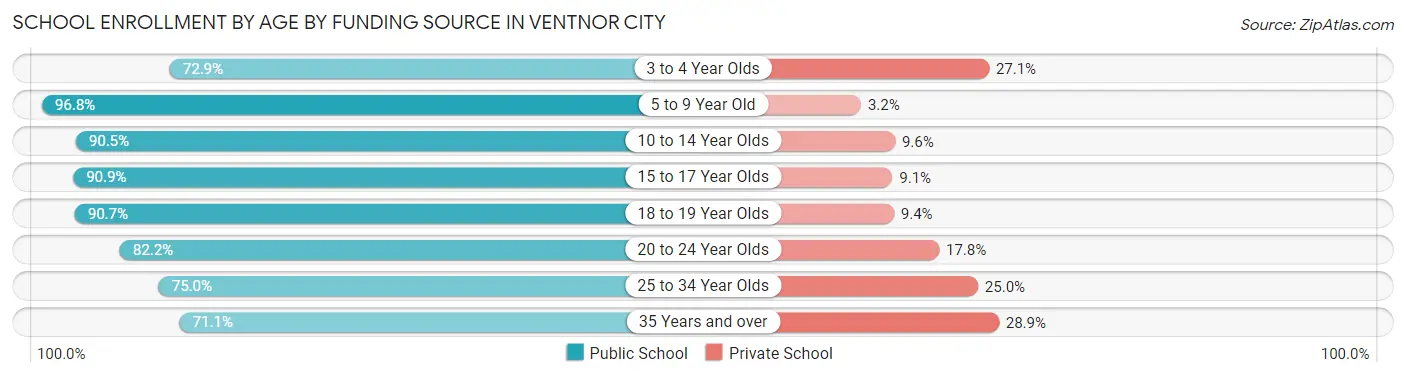
| Age Bracket | Public School | Private School |
| 3 to 4 Year Olds | 62 (72.9%) | 23 (27.1%) |
| 5 to 9 Year Old | 330 (96.8%) | 11 (3.2%) |
| 10 to 14 Year Olds | 303 (90.4%) | 32 (9.6%) |
| 15 to 17 Year Olds | 261 (90.9%) | 26 (9.1%) |
| 18 to 19 Year Olds | 126 (90.6%) | 13 (9.3%) |
| 20 to 24 Year Olds | 213 (82.2%) | 46 (17.8%) |
| 25 to 34 Year Olds | 51 (75.0%) | 17 (25.0%) |
| 35 Years and over | 32 (71.1%) | 13 (28.9%) |
| Total | 1,378 (88.4%) | 181 (11.6%) |
Educational Attainment by Field of Study in Ventnor City
Business (522 | 18.2%), education (475 | 16.6%), science & technology (318 | 11.1%), social sciences (294 | 10.2%), and psychology (241 | 8.4%) are the most common fields of study among 2,870 individuals in Ventnor City who have obtained a bachelor's degree or higher.
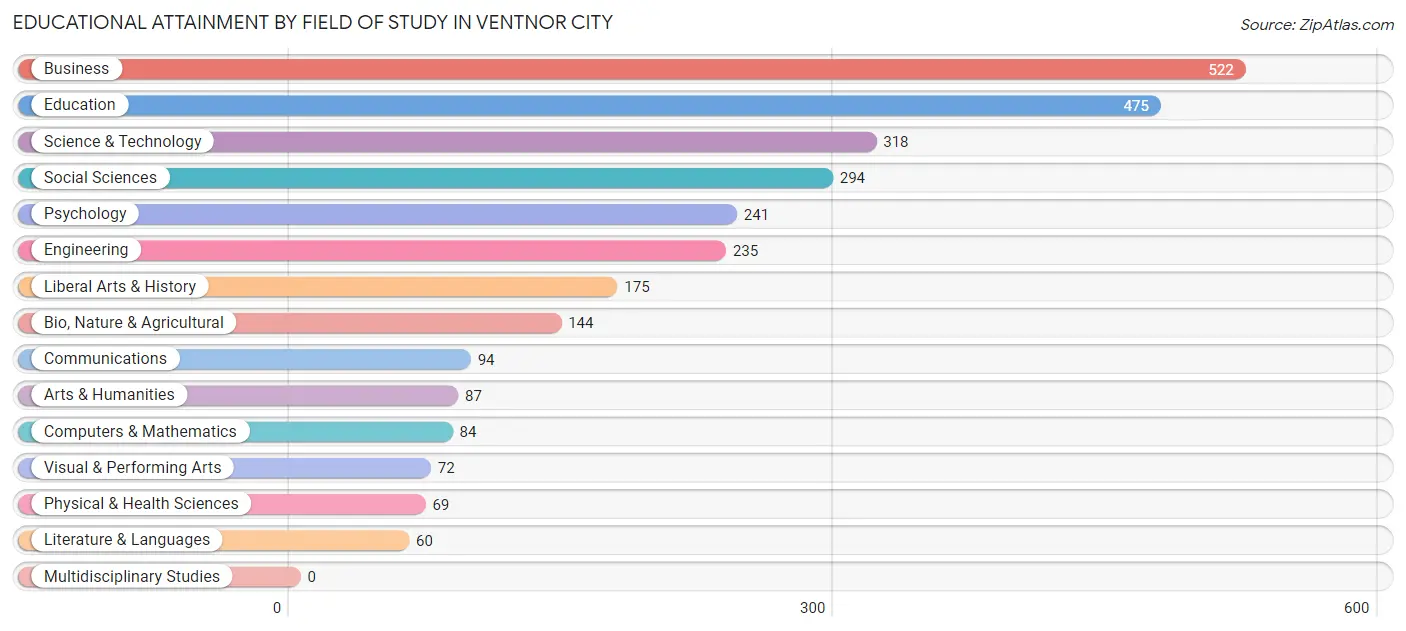
| Field of Study | # Graduates | % Graduates |
| Computers & Mathematics | 84 | 2.9% |
| Bio, Nature & Agricultural | 144 | 5.0% |
| Physical & Health Sciences | 69 | 2.4% |
| Psychology | 241 | 8.4% |
| Social Sciences | 294 | 10.2% |
| Engineering | 235 | 8.2% |
| Multidisciplinary Studies | 0 | 0.0% |
| Science & Technology | 318 | 11.1% |
| Business | 522 | 18.2% |
| Education | 475 | 16.6% |
| Literature & Languages | 60 | 2.1% |
| Liberal Arts & History | 175 | 6.1% |
| Visual & Performing Arts | 72 | 2.5% |
| Communications | 94 | 3.3% |
| Arts & Humanities | 87 | 3.0% |
| Total | 2,870 | 100.0% |
Transportation & Commute in Ventnor City
Vehicle Availability by Sex in Ventnor City
The most prevalent vehicle ownership categories in Ventnor City are males with 1 vehicle (897, accounting for 37.4%) and females with 1 vehicle (600, making up 45.6%).
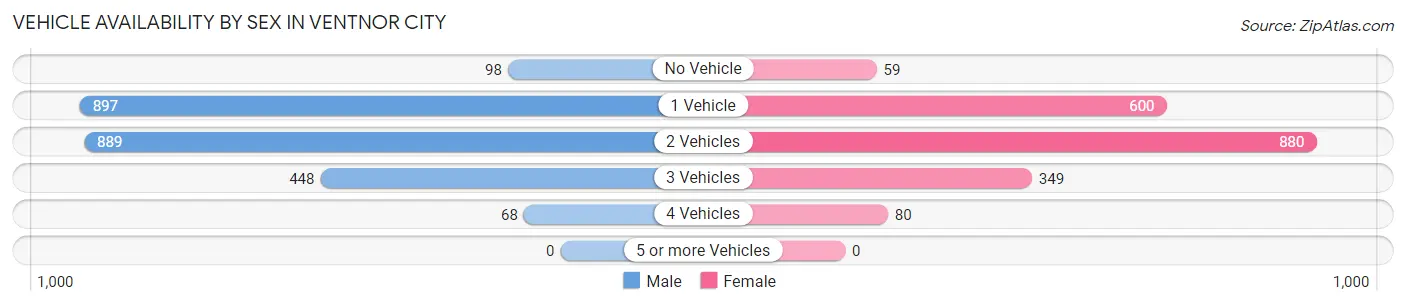
| Vehicles Available | Male | Female |
| No Vehicle | 98 (4.1%) | 59 (3.0%) |
| 1 Vehicle | 897 (37.4%) | 600 (30.5%) |
| 2 Vehicles | 889 (37.0%) | 880 (44.7%) |
| 3 Vehicles | 448 (18.7%) | 349 (17.7%) |
| 4 Vehicles | 68 (2.8%) | 80 (4.1%) |
| 5 or more Vehicles | 0 (0.0%) | 0 (0.0%) |
| Total | 2,400 (100.0%) | 1,968 (100.0%) |
Commute Time in Ventnor City
The most frequently occuring commute durations in Ventnor City are 15 to 19 minutes (976 commuters, 24.8%), 20 to 24 minutes (641 commuters, 16.3%), and 10 to 14 minutes (536 commuters, 13.6%).
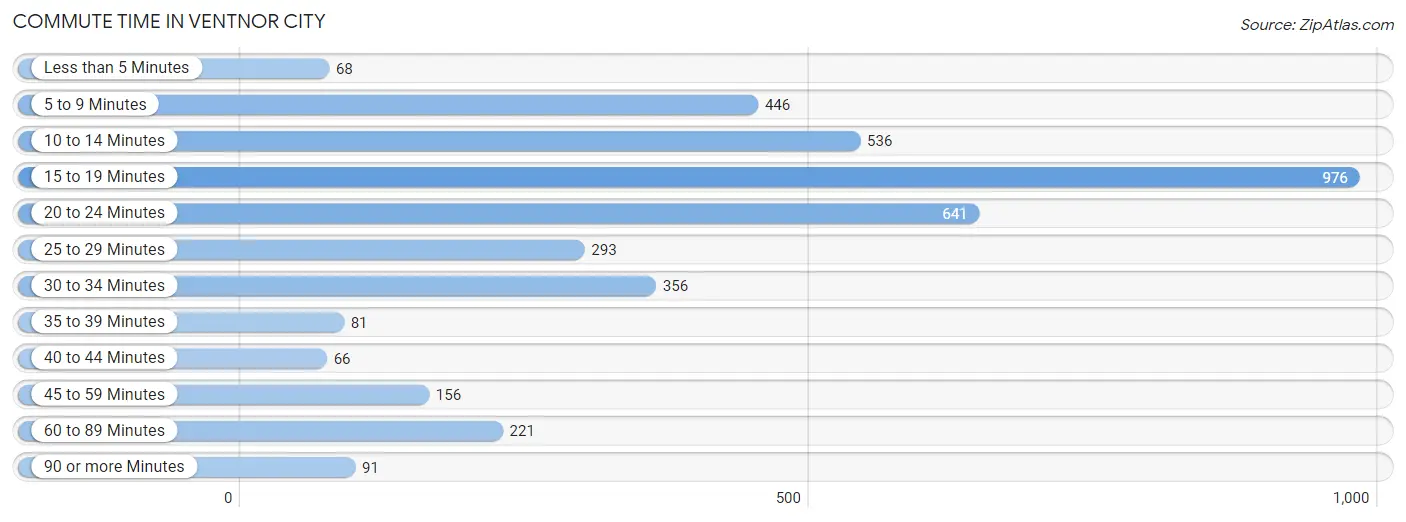
| Commute Time | # Commuters | % Commuters |
| Less than 5 Minutes | 68 | 1.7% |
| 5 to 9 Minutes | 446 | 11.4% |
| 10 to 14 Minutes | 536 | 13.6% |
| 15 to 19 Minutes | 976 | 24.8% |
| 20 to 24 Minutes | 641 | 16.3% |
| 25 to 29 Minutes | 293 | 7.4% |
| 30 to 34 Minutes | 356 | 9.1% |
| 35 to 39 Minutes | 81 | 2.1% |
| 40 to 44 Minutes | 66 | 1.7% |
| 45 to 59 Minutes | 156 | 4.0% |
| 60 to 89 Minutes | 221 | 5.6% |
| 90 or more Minutes | 91 | 2.3% |
Commute Time by Sex in Ventnor City
The most common commute times in Ventnor City are 15 to 19 minutes (771 commuters, 34.3%) for males and 20 to 24 minutes (341 commuters, 20.2%) for females.
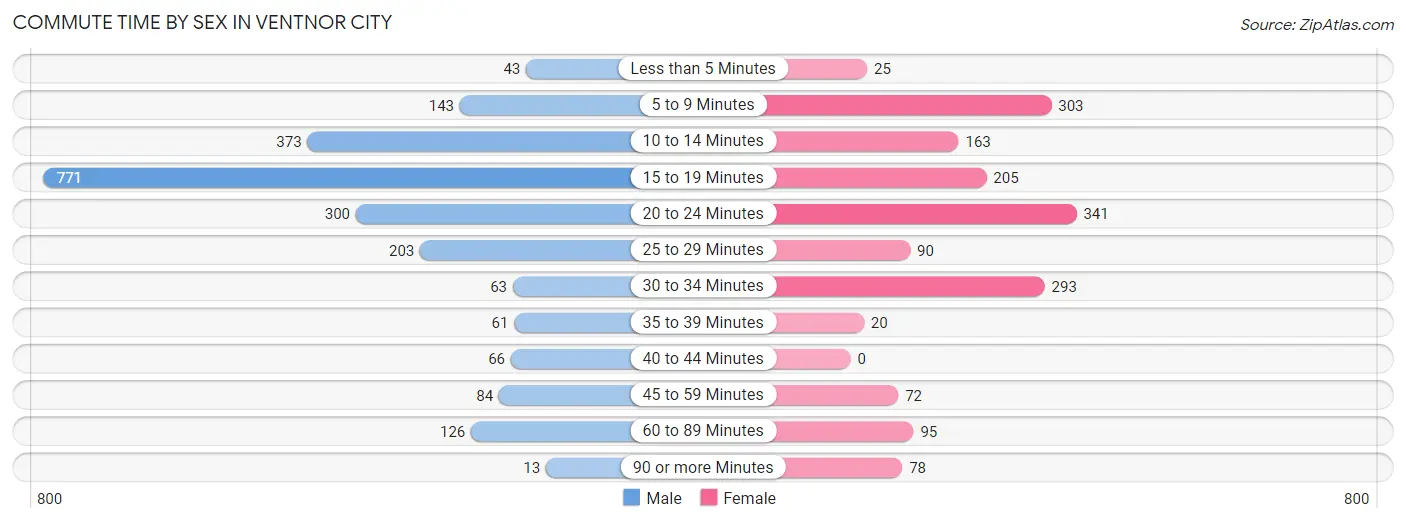
| Commute Time | Male | Female |
| Less than 5 Minutes | 43 (1.9%) | 25 (1.5%) |
| 5 to 9 Minutes | 143 (6.4%) | 303 (18.0%) |
| 10 to 14 Minutes | 373 (16.6%) | 163 (9.7%) |
| 15 to 19 Minutes | 771 (34.3%) | 205 (12.2%) |
| 20 to 24 Minutes | 300 (13.4%) | 341 (20.2%) |
| 25 to 29 Minutes | 203 (9.0%) | 90 (5.3%) |
| 30 to 34 Minutes | 63 (2.8%) | 293 (17.4%) |
| 35 to 39 Minutes | 61 (2.7%) | 20 (1.2%) |
| 40 to 44 Minutes | 66 (2.9%) | 0 (0.0%) |
| 45 to 59 Minutes | 84 (3.7%) | 72 (4.3%) |
| 60 to 89 Minutes | 126 (5.6%) | 95 (5.6%) |
| 90 or more Minutes | 13 (0.6%) | 78 (4.6%) |
Time of Departure to Work by Sex in Ventnor City
The most frequent times of departure to work in Ventnor City are 12:00 PM to 3:59 PM (315, 14.0%) for males and 8:00 AM to 8:29 AM (267, 15.9%) for females.
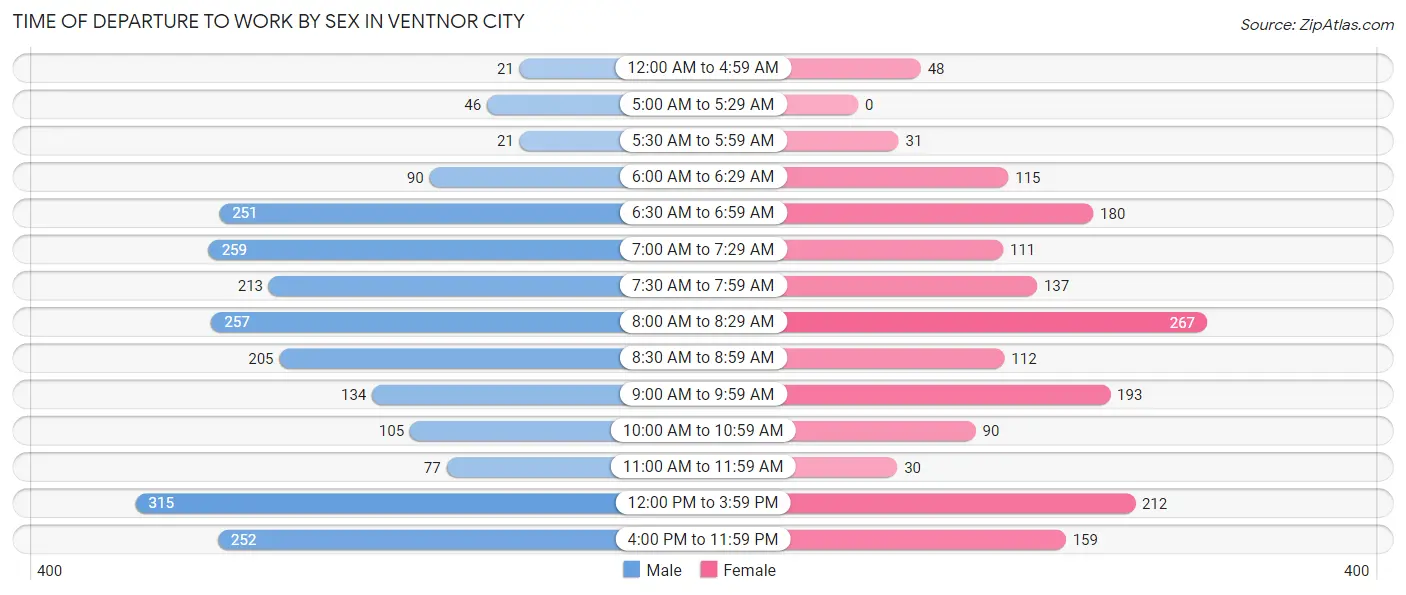
| Time of Departure | Male | Female |
| 12:00 AM to 4:59 AM | 21 (0.9%) | 48 (2.9%) |
| 5:00 AM to 5:29 AM | 46 (2.1%) | 0 (0.0%) |
| 5:30 AM to 5:59 AM | 21 (0.9%) | 31 (1.8%) |
| 6:00 AM to 6:29 AM | 90 (4.0%) | 115 (6.8%) |
| 6:30 AM to 6:59 AM | 251 (11.2%) | 180 (10.7%) |
| 7:00 AM to 7:29 AM | 259 (11.5%) | 111 (6.6%) |
| 7:30 AM to 7:59 AM | 213 (9.5%) | 137 (8.1%) |
| 8:00 AM to 8:29 AM | 257 (11.4%) | 267 (15.9%) |
| 8:30 AM to 8:59 AM | 205 (9.1%) | 112 (6.7%) |
| 9:00 AM to 9:59 AM | 134 (6.0%) | 193 (11.5%) |
| 10:00 AM to 10:59 AM | 105 (4.7%) | 90 (5.3%) |
| 11:00 AM to 11:59 AM | 77 (3.4%) | 30 (1.8%) |
| 12:00 PM to 3:59 PM | 315 (14.0%) | 212 (12.6%) |
| 4:00 PM to 11:59 PM | 252 (11.2%) | 159 (9.4%) |
| Total | 2,246 (100.0%) | 1,685 (100.0%) |
Housing Occupancy in Ventnor City
Occupancy by Ownership in Ventnor City
Of the total 4,348 dwellings in Ventnor City, owner-occupied units account for 2,748 (63.2%), while renter-occupied units make up 1,600 (36.8%).
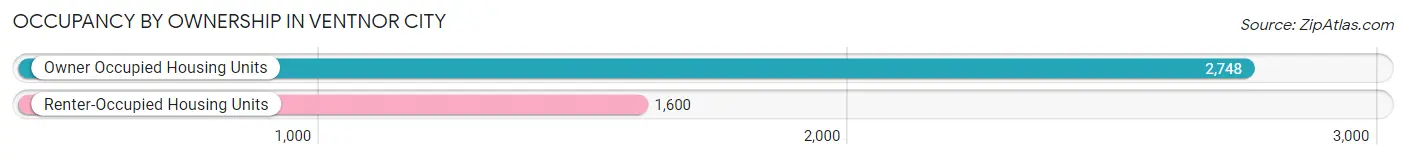
| Occupancy | # Housing Units | % Housing Units |
| Owner Occupied Housing Units | 2,748 | 63.2% |
| Renter-Occupied Housing Units | 1,600 | 36.8% |
| Total Occupied Housing Units | 4,348 | 100.0% |
Occupancy by Household Size in Ventnor City
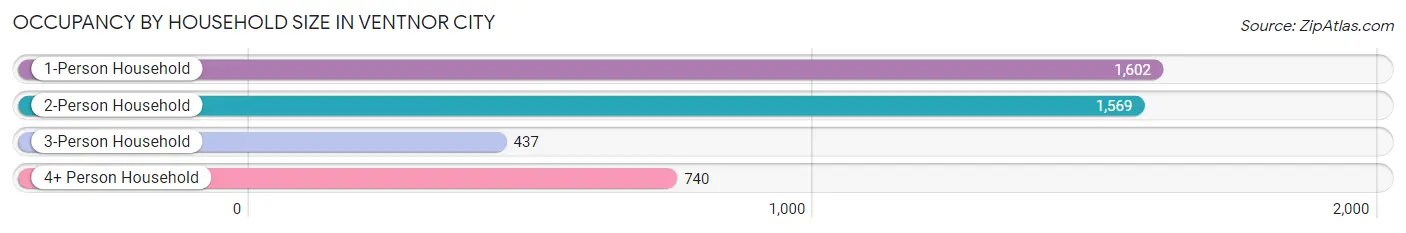
| Household Size | # Housing Units | % Housing Units |
| 1-Person Household | 1,602 | 36.8% |
| 2-Person Household | 1,569 | 36.1% |
| 3-Person Household | 437 | 10.1% |
| 4+ Person Household | 740 | 17.0% |
| Total Housing Units | 4,348 | 100.0% |
Occupancy by Ownership by Household Size in Ventnor City
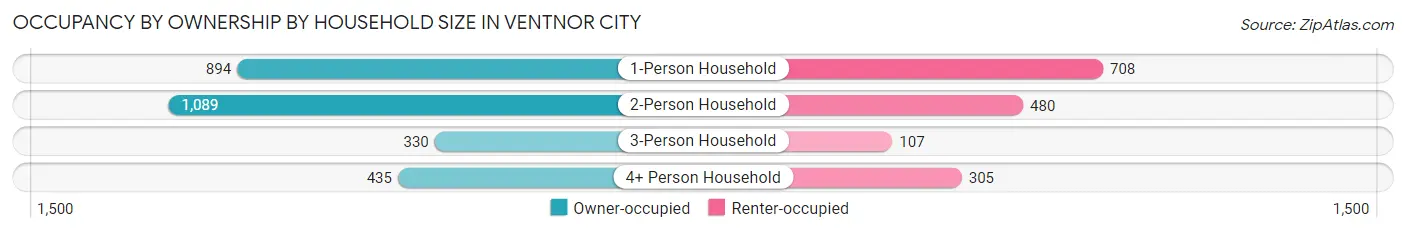
| Household Size | Owner-occupied | Renter-occupied |
| 1-Person Household | 894 (55.8%) | 708 (44.2%) |
| 2-Person Household | 1,089 (69.4%) | 480 (30.6%) |
| 3-Person Household | 330 (75.5%) | 107 (24.5%) |
| 4+ Person Household | 435 (58.8%) | 305 (41.2%) |
| Total Housing Units | 2,748 (63.2%) | 1,600 (36.8%) |
Occupancy by Educational Attainment in Ventnor City
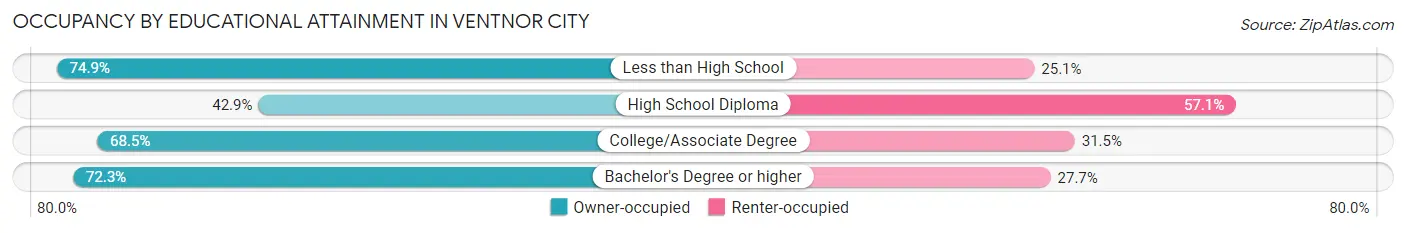
| Household Size | Owner-occupied | Renter-occupied |
| Less than High School | 200 (74.9%) | 67 (25.1%) |
| High School Diploma | 519 (42.9%) | 690 (57.1%) |
| College/Associate Degree | 863 (68.5%) | 397 (31.5%) |
| Bachelor's Degree or higher | 1,166 (72.3%) | 446 (27.7%) |
Occupancy by Age of Householder in Ventnor City
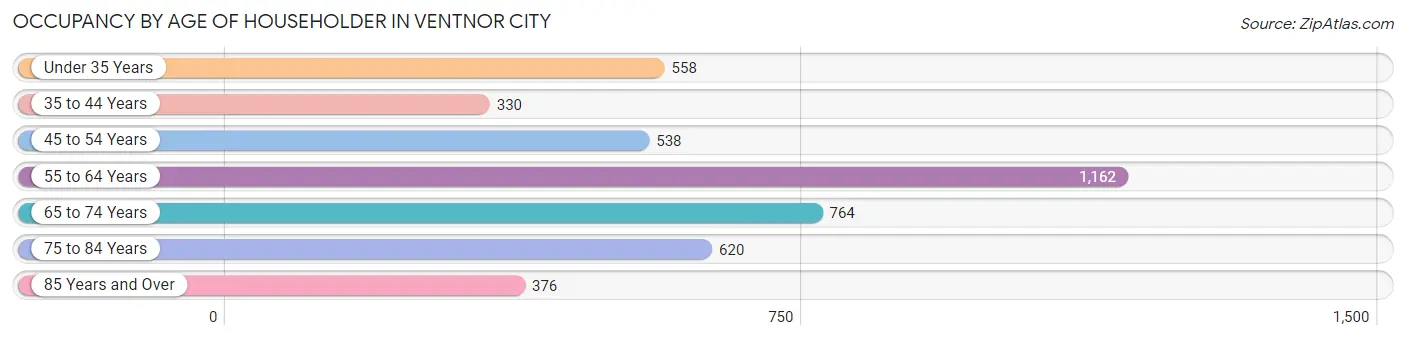
| Age Bracket | # Households | % Households |
| Under 35 Years | 558 | 12.8% |
| 35 to 44 Years | 330 | 7.6% |
| 45 to 54 Years | 538 | 12.4% |
| 55 to 64 Years | 1,162 | 26.7% |
| 65 to 74 Years | 764 | 17.6% |
| 75 to 84 Years | 620 | 14.3% |
| 85 Years and Over | 376 | 8.6% |
| Total | 4,348 | 100.0% |
Housing Finances in Ventnor City
Median Income by Occupancy in Ventnor City
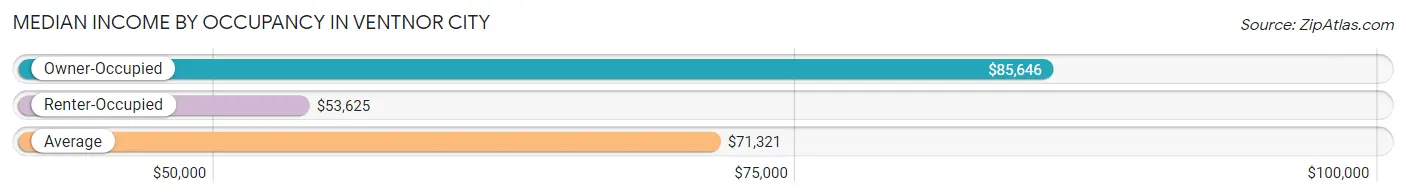
| Occupancy Type | # Households | Median Income |
| Owner-Occupied | 2,748 (63.2%) | $85,646 |
| Renter-Occupied | 1,600 (36.8%) | $53,625 |
| Average | 4,348 (100.0%) | $71,321 |
Occupancy by Householder Income Bracket in Ventnor City
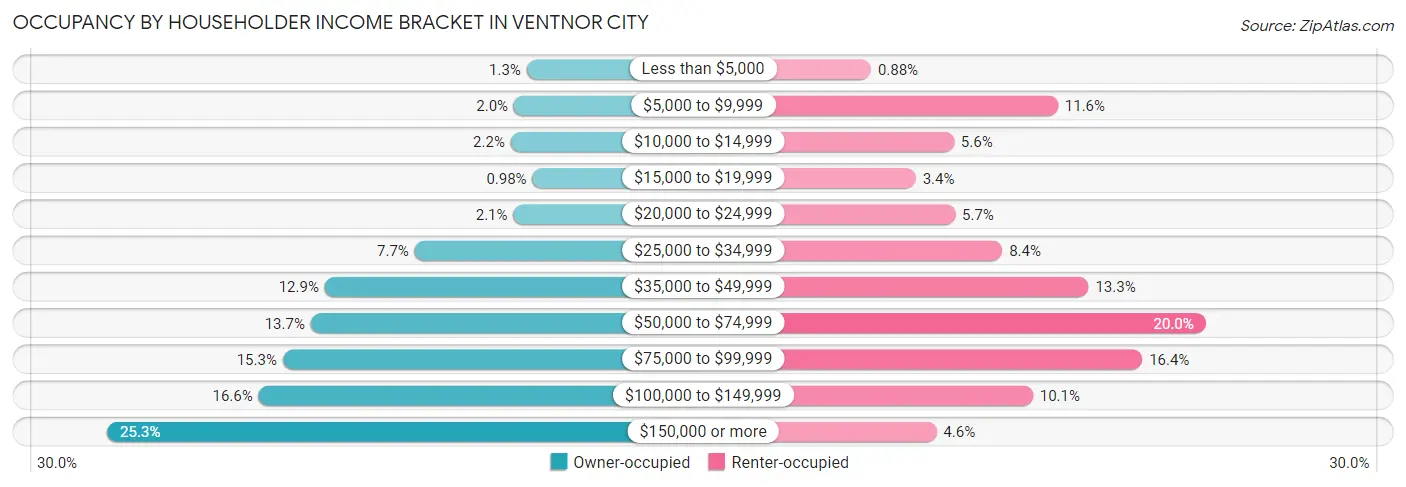
| Income Bracket | Owner-occupied | Renter-occupied |
| Less than $5,000 | 36 (1.3%) | 14 (0.9%) |
| $5,000 to $9,999 | 56 (2.0%) | 185 (11.6%) |
| $10,000 to $14,999 | 61 (2.2%) | 90 (5.6%) |
| $15,000 to $19,999 | 27 (1.0%) | 55 (3.4%) |
| $20,000 to $24,999 | 57 (2.1%) | 91 (5.7%) |
| $25,000 to $34,999 | 212 (7.7%) | 134 (8.4%) |
| $35,000 to $49,999 | 353 (12.9%) | 213 (13.3%) |
| $50,000 to $74,999 | 375 (13.7%) | 320 (20.0%) |
| $75,000 to $99,999 | 419 (15.2%) | 262 (16.4%) |
| $100,000 to $149,999 | 457 (16.6%) | 162 (10.1%) |
| $150,000 or more | 695 (25.3%) | 74 (4.6%) |
| Total | 2,748 (100.0%) | 1,600 (100.0%) |
Monthly Housing Cost Tiers in Ventnor City
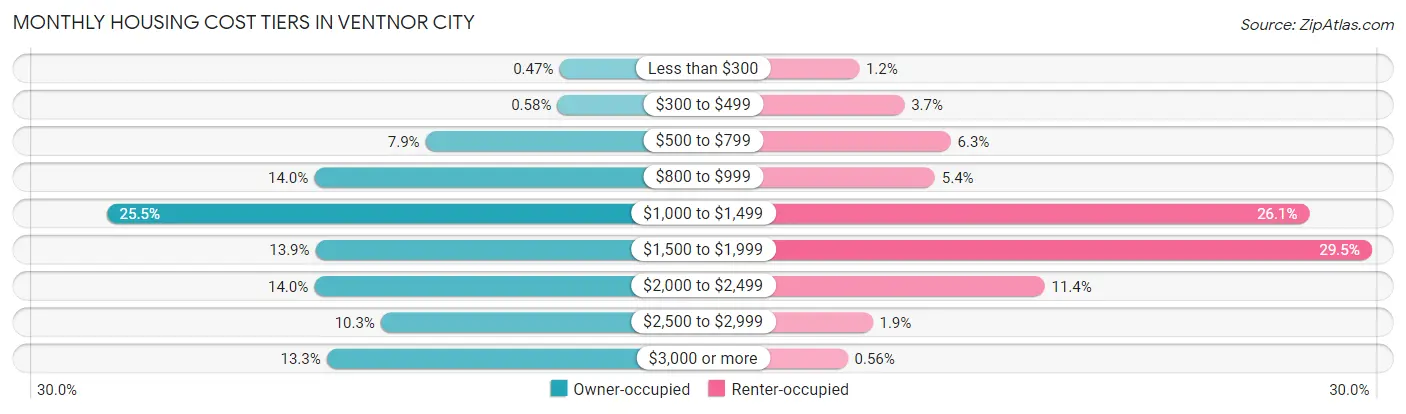
| Monthly Cost | Owner-occupied | Renter-occupied |
| Less than $300 | 13 (0.5%) | 19 (1.2%) |
| $300 to $499 | 16 (0.6%) | 59 (3.7%) |
| $500 to $799 | 216 (7.9%) | 100 (6.2%) |
| $800 to $999 | 385 (14.0%) | 86 (5.4%) |
| $1,000 to $1,499 | 700 (25.5%) | 417 (26.1%) |
| $1,500 to $1,999 | 383 (13.9%) | 472 (29.5%) |
| $2,000 to $2,499 | 385 (14.0%) | 183 (11.4%) |
| $2,500 to $2,999 | 284 (10.3%) | 31 (1.9%) |
| $3,000 or more | 366 (13.3%) | 9 (0.6%) |
| Total | 2,748 (100.0%) | 1,600 (100.0%) |
Physical Housing Characteristics in Ventnor City
Housing Structures in Ventnor City
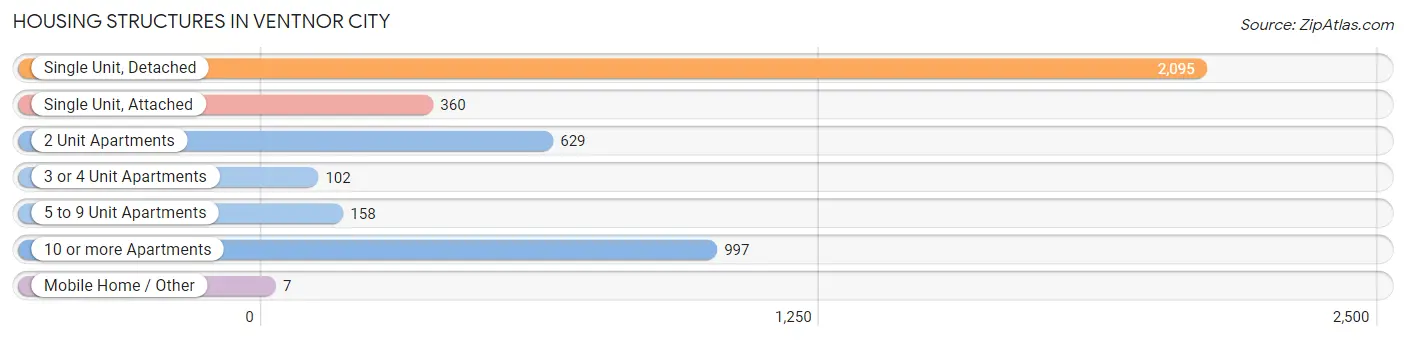
| Structure Type | # Housing Units | % Housing Units |
| Single Unit, Detached | 2,095 | 48.2% |
| Single Unit, Attached | 360 | 8.3% |
| 2 Unit Apartments | 629 | 14.5% |
| 3 or 4 Unit Apartments | 102 | 2.4% |
| 5 to 9 Unit Apartments | 158 | 3.6% |
| 10 or more Apartments | 997 | 22.9% |
| Mobile Home / Other | 7 | 0.2% |
| Total | 4,348 | 100.0% |
Housing Structures by Occupancy in Ventnor City
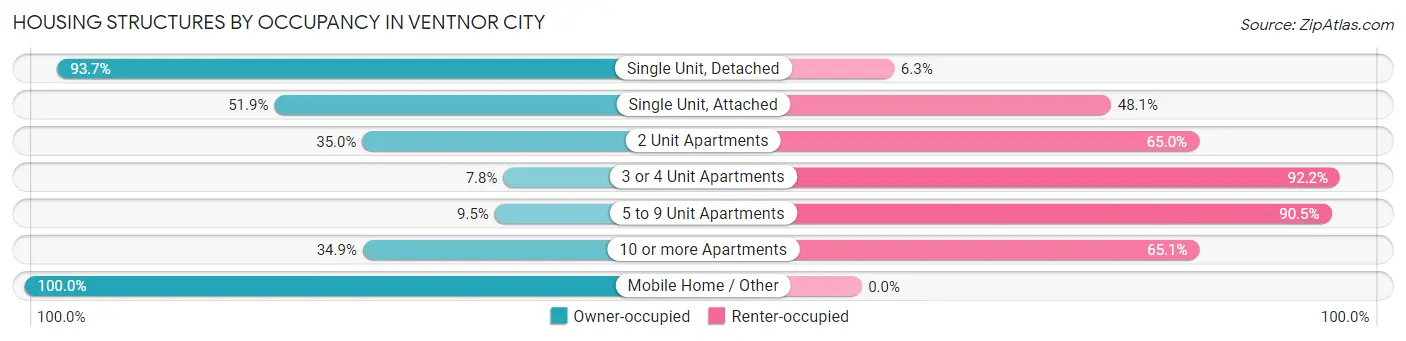
| Structure Type | Owner-occupied | Renter-occupied |
| Single Unit, Detached | 1,963 (93.7%) | 132 (6.3%) |
| Single Unit, Attached | 187 (51.9%) | 173 (48.1%) |
| 2 Unit Apartments | 220 (35.0%) | 409 (65.0%) |
| 3 or 4 Unit Apartments | 8 (7.8%) | 94 (92.2%) |
| 5 to 9 Unit Apartments | 15 (9.5%) | 143 (90.5%) |
| 10 or more Apartments | 348 (34.9%) | 649 (65.1%) |
| Mobile Home / Other | 7 (100.0%) | 0 (0.0%) |
| Total | 2,748 (63.2%) | 1,600 (36.8%) |
Housing Structures by Number of Rooms in Ventnor City
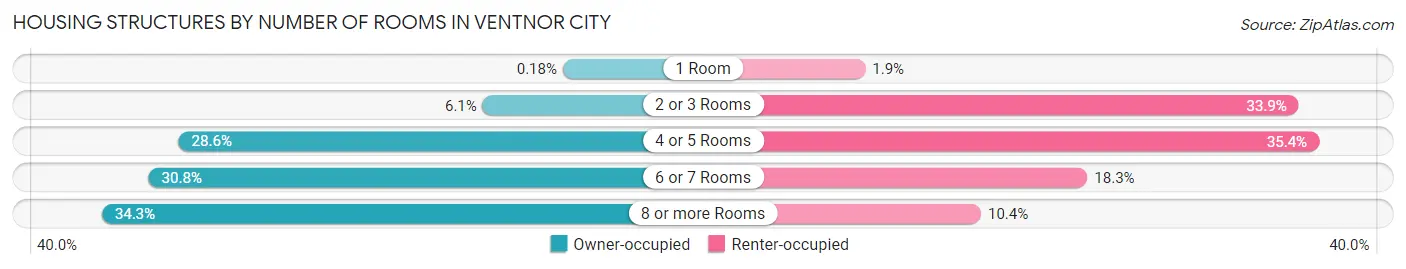
| Number of Rooms | Owner-occupied | Renter-occupied |
| 1 Room | 5 (0.2%) | 30 (1.9%) |
| 2 or 3 Rooms | 168 (6.1%) | 543 (33.9%) |
| 4 or 5 Rooms | 786 (28.6%) | 567 (35.4%) |
| 6 or 7 Rooms | 847 (30.8%) | 293 (18.3%) |
| 8 or more Rooms | 942 (34.3%) | 167 (10.4%) |
| Total | 2,748 (100.0%) | 1,600 (100.0%) |
Housing Structure by Heating Type in Ventnor City
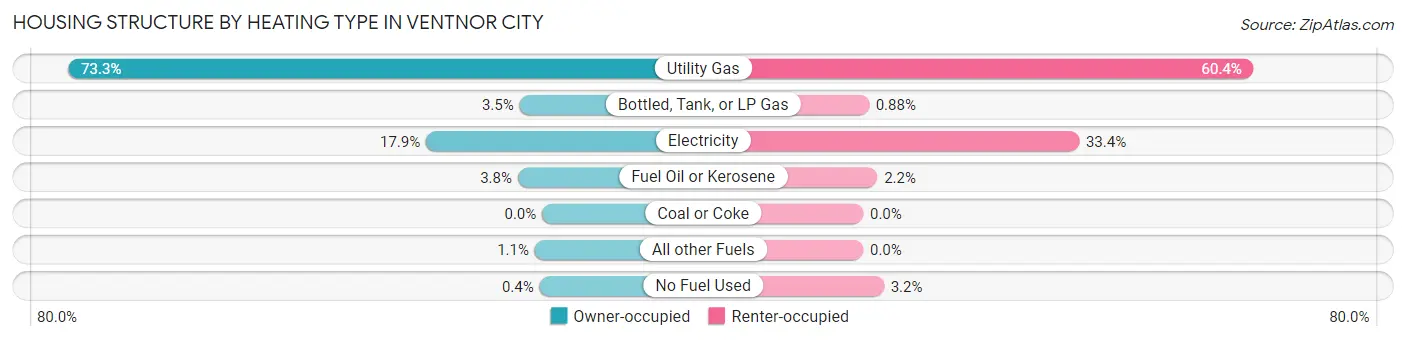
| Heating Type | Owner-occupied | Renter-occupied |
| Utility Gas | 2,014 (73.3%) | 966 (60.4%) |
| Bottled, Tank, or LP Gas | 96 (3.5%) | 14 (0.9%) |
| Electricity | 493 (17.9%) | 534 (33.4%) |
| Fuel Oil or Kerosene | 103 (3.7%) | 35 (2.2%) |
| Coal or Coke | 0 (0.0%) | 0 (0.0%) |
| All other Fuels | 31 (1.1%) | 0 (0.0%) |
| No Fuel Used | 11 (0.4%) | 51 (3.2%) |
| Total | 2,748 (100.0%) | 1,600 (100.0%) |
Household Vehicle Usage in Ventnor City
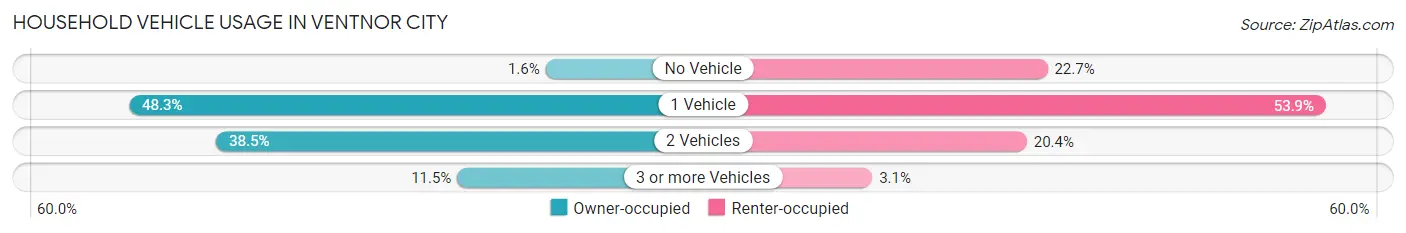
| Vehicles per Household | Owner-occupied | Renter-occupied |
| No Vehicle | 45 (1.6%) | 363 (22.7%) |
| 1 Vehicle | 1,327 (48.3%) | 862 (53.9%) |
| 2 Vehicles | 1,059 (38.5%) | 326 (20.4%) |
| 3 or more Vehicles | 317 (11.5%) | 49 (3.1%) |
| Total | 2,748 (100.0%) | 1,600 (100.0%) |
Real Estate & Mortgages in Ventnor City
Real Estate and Mortgage Overview in Ventnor City
| Characteristic | Without Mortgage | With Mortgage |
| Housing Units | 1,433 | 1,315 |
| Median Property Value | $285,600 | $376,100 |
| Median Household Income | $64,827 | $441 |
| Monthly Housing Costs | $1,179 | $332 |
| Real Estate Taxes | $6,585 | $14 |
Property Value by Mortgage Status in Ventnor City
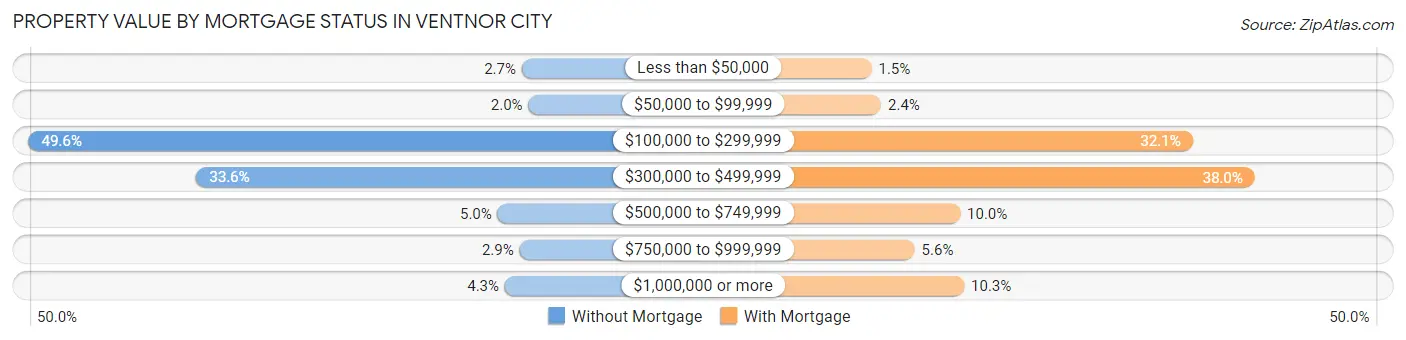
| Property Value | Without Mortgage | With Mortgage |
| Less than $50,000 | 38 (2.6%) | 20 (1.5%) |
| $50,000 to $99,999 | 29 (2.0%) | 32 (2.4%) |
| $100,000 to $299,999 | 711 (49.6%) | 422 (32.1%) |
| $300,000 to $499,999 | 482 (33.6%) | 500 (38.0%) |
| $500,000 to $749,999 | 71 (5.0%) | 131 (10.0%) |
| $750,000 to $999,999 | 41 (2.9%) | 74 (5.6%) |
| $1,000,000 or more | 61 (4.3%) | 136 (10.3%) |
| Total | 1,433 (100.0%) | 1,315 (100.0%) |
Household Income by Mortgage Status in Ventnor City
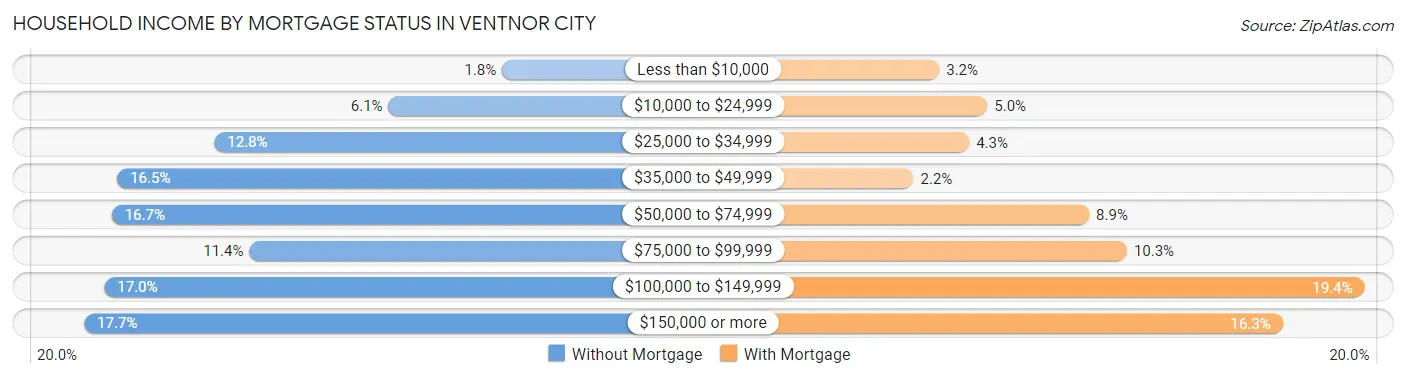
| Household Income | Without Mortgage | With Mortgage |
| Less than $10,000 | 26 (1.8%) | 42 (3.2%) |
| $10,000 to $24,999 | 88 (6.1%) | 66 (5.0%) |
| $25,000 to $34,999 | 183 (12.8%) | 57 (4.3%) |
| $35,000 to $49,999 | 236 (16.5%) | 29 (2.2%) |
| $50,000 to $74,999 | 239 (16.7%) | 117 (8.9%) |
| $75,000 to $99,999 | 164 (11.4%) | 136 (10.3%) |
| $100,000 to $149,999 | 243 (17.0%) | 255 (19.4%) |
| $150,000 or more | 254 (17.7%) | 214 (16.3%) |
| Total | 1,433 (100.0%) | 1,315 (100.0%) |
Property Value to Household Income Ratio in Ventnor City
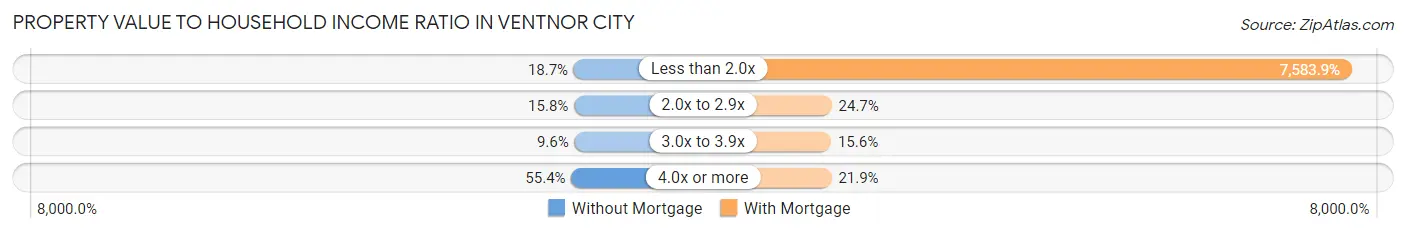
| Value-to-Income Ratio | Without Mortgage | With Mortgage |
| Less than 2.0x | 268 (18.7%) | 99,728 (7,583.9%) |
| 2.0x to 2.9x | 226 (15.8%) | 325 (24.7%) |
| 3.0x to 3.9x | 138 (9.6%) | 205 (15.6%) |
| 4.0x or more | 794 (55.4%) | 288 (21.9%) |
| Total | 1,433 (100.0%) | 1,315 (100.0%) |
Real Estate Taxes by Mortgage Status in Ventnor City
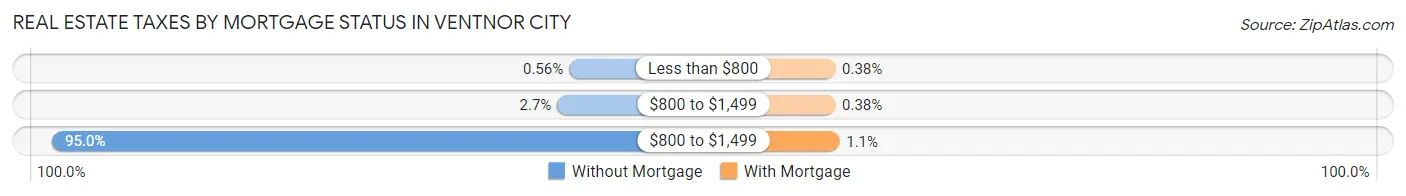
| Property Taxes | Without Mortgage | With Mortgage |
| Less than $800 | 8 (0.6%) | 5 (0.4%) |
| $800 to $1,499 | 39 (2.7%) | 5 (0.4%) |
| $800 to $1,499 | 1,361 (95.0%) | 15 (1.1%) |
| Total | 1,433 (100.0%) | 1,315 (100.0%) |
Health & Disability in Ventnor City
Health Insurance Coverage by Age in Ventnor City
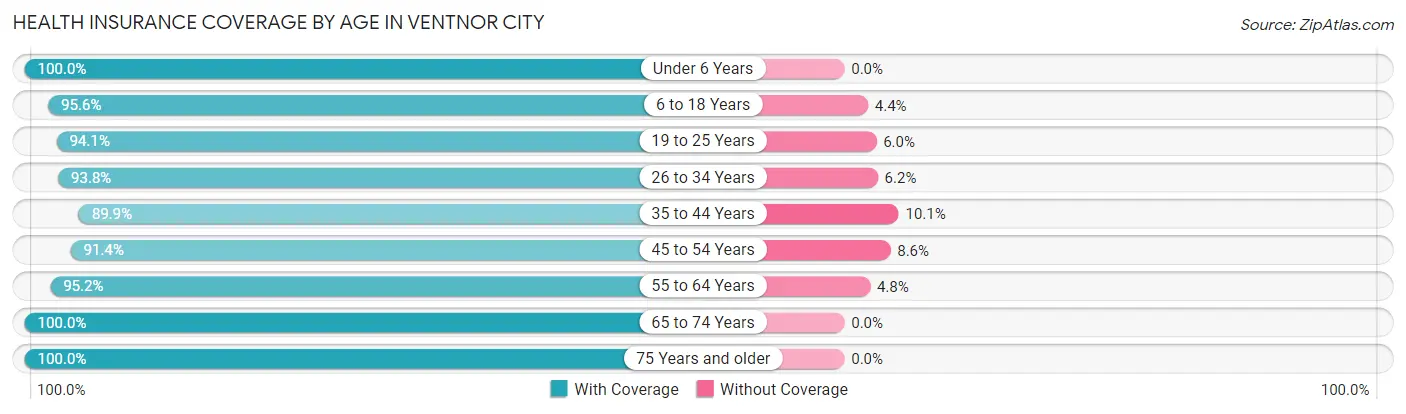
| Age Bracket | With Coverage | Without Coverage |
| Under 6 Years | 267 (100.0%) | 0 (0.0%) |
| 6 to 18 Years | 979 (95.6%) | 45 (4.4%) |
| 19 to 25 Years | 648 (94.1%) | 41 (5.9%) |
| 26 to 34 Years | 965 (93.8%) | 64 (6.2%) |
| 35 to 44 Years | 675 (89.9%) | 76 (10.1%) |
| 45 to 54 Years | 916 (91.4%) | 86 (8.6%) |
| 55 to 64 Years | 1,793 (95.2%) | 90 (4.8%) |
| 65 to 74 Years | 1,247 (100.0%) | 0 (0.0%) |
| 75 Years and older | 1,393 (100.0%) | 0 (0.0%) |
| Total | 8,883 (95.7%) | 402 (4.3%) |
Health Insurance Coverage by Citizenship Status in Ventnor City
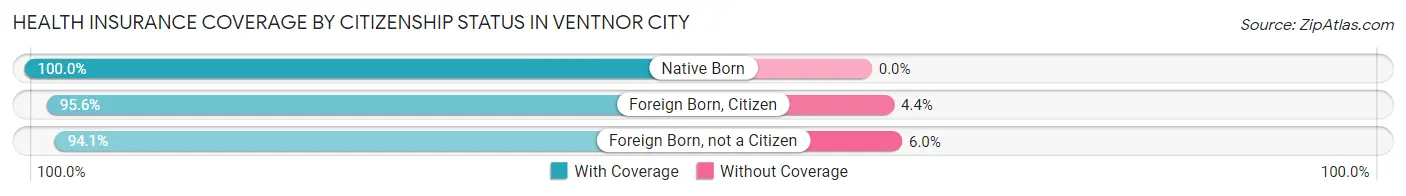
| Citizenship Status | With Coverage | Without Coverage |
| Native Born | 267 (100.0%) | 0 (0.0%) |
| Foreign Born, Citizen | 979 (95.6%) | 45 (4.4%) |
| Foreign Born, not a Citizen | 648 (94.1%) | 41 (5.9%) |
Health Insurance Coverage by Household Income in Ventnor City
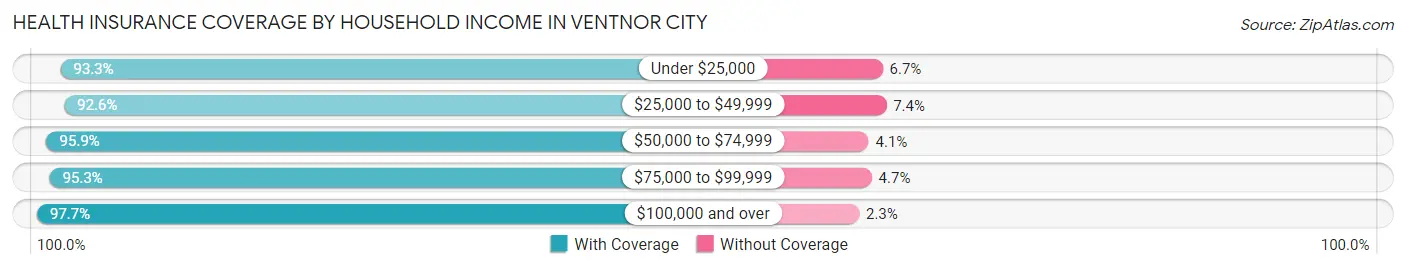
| Household Income | With Coverage | Without Coverage |
| Under $25,000 | 848 (93.3%) | 61 (6.7%) |
| $25,000 to $49,999 | 1,680 (92.6%) | 134 (7.4%) |
| $50,000 to $74,999 | 1,267 (95.9%) | 54 (4.1%) |
| $75,000 to $99,999 | 1,331 (95.3%) | 65 (4.7%) |
| $100,000 and over | 3,747 (97.7%) | 88 (2.3%) |
Public vs Private Health Insurance Coverage by Age in Ventnor City
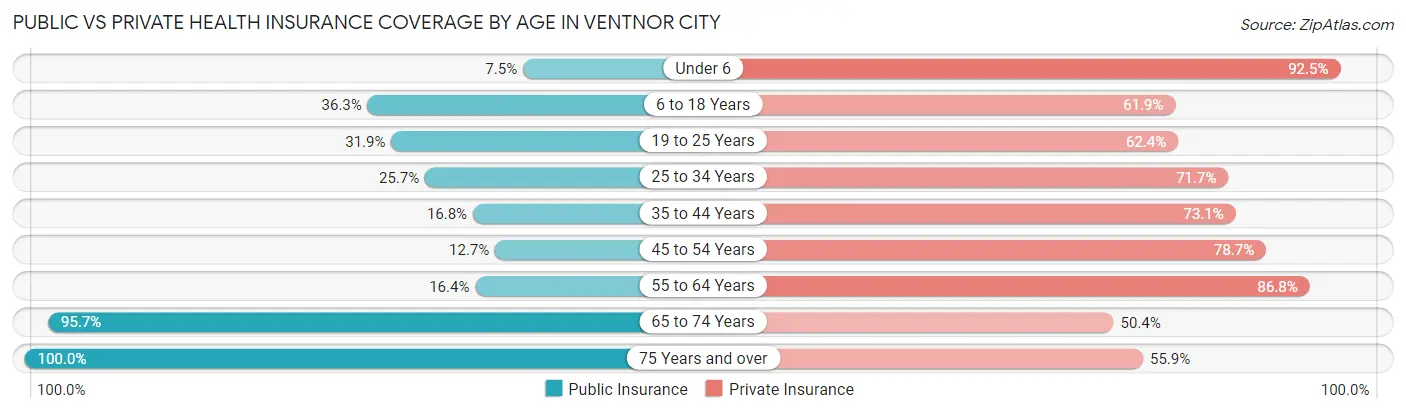
| Age Bracket | Public Insurance | Private Insurance |
| Under 6 | 20 (7.5%) | 247 (92.5%) |
| 6 to 18 Years | 372 (36.3%) | 634 (61.9%) |
| 19 to 25 Years | 220 (31.9%) | 430 (62.4%) |
| 25 to 34 Years | 264 (25.7%) | 738 (71.7%) |
| 35 to 44 Years | 126 (16.8%) | 549 (73.1%) |
| 45 to 54 Years | 127 (12.7%) | 789 (78.7%) |
| 55 to 64 Years | 308 (16.4%) | 1,635 (86.8%) |
| 65 to 74 Years | 1,193 (95.7%) | 629 (50.4%) |
| 75 Years and over | 1,393 (100.0%) | 779 (55.9%) |
| Total | 4,023 (43.3%) | 6,430 (69.3%) |
Disability Status by Sex by Age in Ventnor City
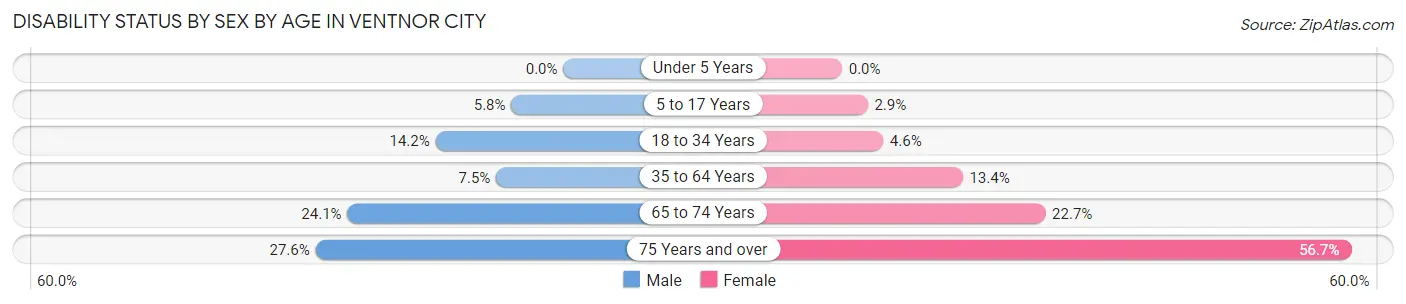
| Age Bracket | Male | Female |
| Under 5 Years | 0 (0.0%) | 0 (0.0%) |
| 5 to 17 Years | 29 (5.8%) | 16 (2.9%) |
| 18 to 34 Years | 149 (14.2%) | 32 (4.6%) |
| 35 to 64 Years | 129 (7.5%) | 257 (13.4%) |
| 65 to 74 Years | 164 (24.0%) | 128 (22.7%) |
| 75 Years and over | 114 (27.6%) | 556 (56.7%) |
Disability Class by Sex by Age in Ventnor City
Disability Class: Hearing Difficulty
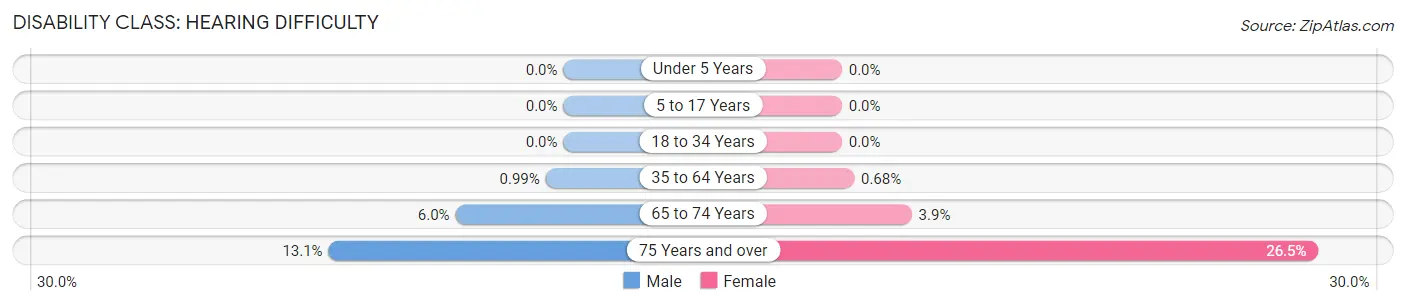
| Age Bracket | Male | Female |
| Under 5 Years | 0 (0.0%) | 0 (0.0%) |
| 5 to 17 Years | 0 (0.0%) | 0 (0.0%) |
| 18 to 34 Years | 0 (0.0%) | 0 (0.0%) |
| 35 to 64 Years | 17 (1.0%) | 13 (0.7%) |
| 65 to 74 Years | 41 (6.0%) | 22 (3.9%) |
| 75 Years and over | 54 (13.1%) | 260 (26.5%) |
Disability Class: Vision Difficulty
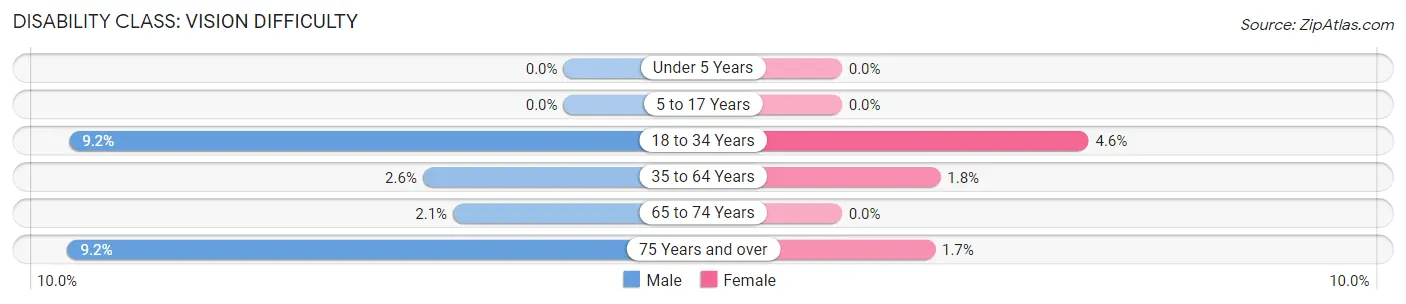
| Age Bracket | Male | Female |
| Under 5 Years | 0 (0.0%) | 0 (0.0%) |
| 5 to 17 Years | 0 (0.0%) | 0 (0.0%) |
| 18 to 34 Years | 96 (9.2%) | 32 (4.6%) |
| 35 to 64 Years | 45 (2.6%) | 35 (1.8%) |
| 65 to 74 Years | 14 (2.1%) | 0 (0.0%) |
| 75 Years and over | 38 (9.2%) | 17 (1.7%) |
Disability Class: Cognitive Difficulty
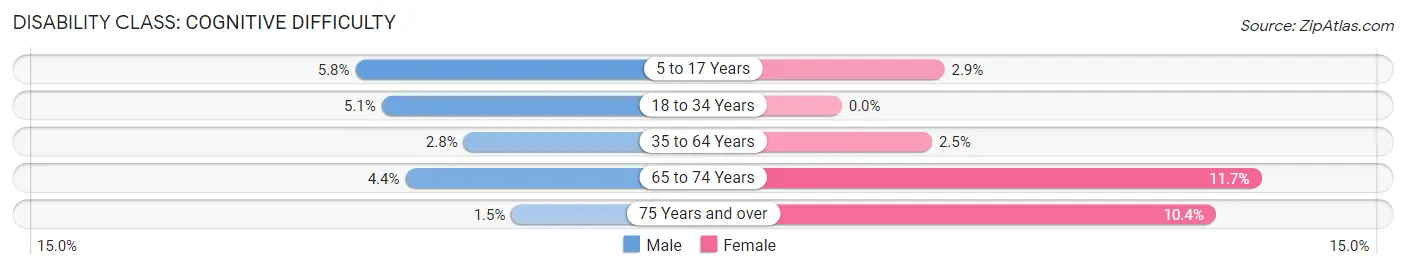
| Age Bracket | Male | Female |
| 5 to 17 Years | 29 (5.8%) | 16 (2.9%) |
| 18 to 34 Years | 53 (5.1%) | 0 (0.0%) |
| 35 to 64 Years | 48 (2.8%) | 48 (2.5%) |
| 65 to 74 Years | 30 (4.4%) | 66 (11.7%) |
| 75 Years and over | 6 (1.5%) | 102 (10.4%) |
Disability Class: Ambulatory Difficulty
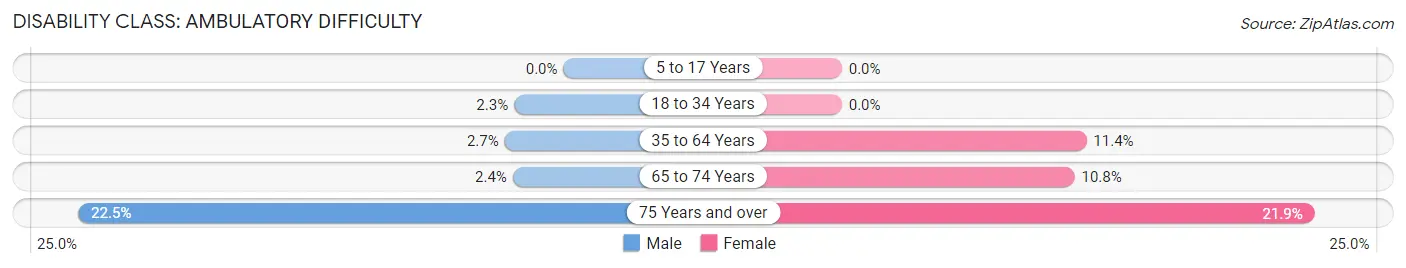
| Age Bracket | Male | Female |
| 5 to 17 Years | 0 (0.0%) | 0 (0.0%) |
| 18 to 34 Years | 24 (2.3%) | 0 (0.0%) |
| 35 to 64 Years | 47 (2.7%) | 217 (11.4%) |
| 65 to 74 Years | 16 (2.4%) | 61 (10.8%) |
| 75 Years and over | 93 (22.5%) | 215 (21.9%) |
Disability Class: Self-Care Difficulty
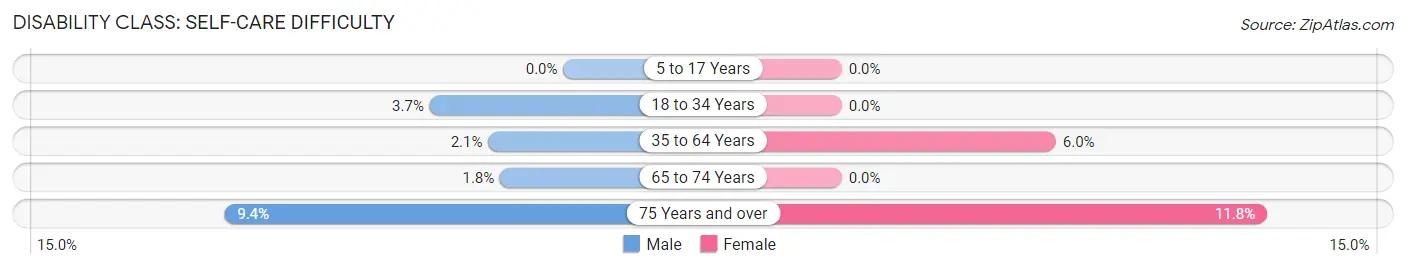
| Age Bracket | Male | Female |
| 5 to 17 Years | 0 (0.0%) | 0 (0.0%) |
| 18 to 34 Years | 39 (3.7%) | 0 (0.0%) |
| 35 to 64 Years | 36 (2.1%) | 114 (6.0%) |
| 65 to 74 Years | 12 (1.8%) | 0 (0.0%) |
| 75 Years and over | 39 (9.4%) | 116 (11.8%) |
Technology Access in Ventnor City
Computing Device Access in Ventnor City
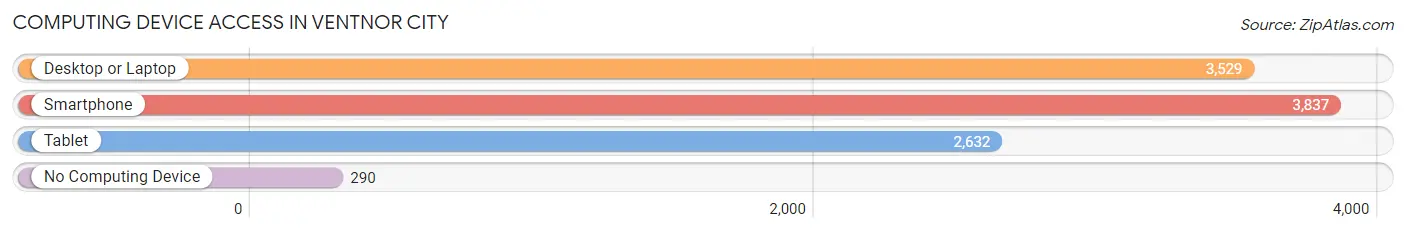
| Device Type | # Households | % Households |
| Desktop or Laptop | 3,529 | 81.2% |
| Smartphone | 3,837 | 88.2% |
| Tablet | 2,632 | 60.5% |
| No Computing Device | 290 | 6.7% |
| Total | 4,348 | 100.0% |
Internet Access in Ventnor City
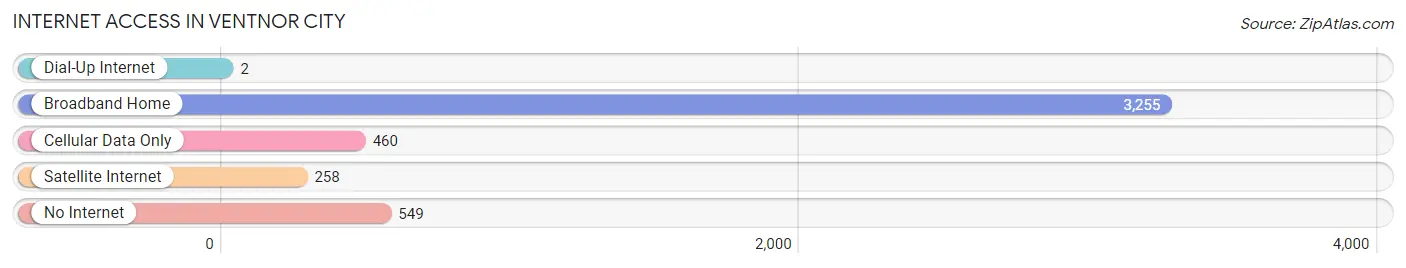
| Internet Type | # Households | % Households |
| Dial-Up Internet | 2 | 0.1% |
| Broadband Home | 3,255 | 74.9% |
| Cellular Data Only | 460 | 10.6% |
| Satellite Internet | 258 | 5.9% |
| No Internet | 549 | 12.6% |
| Total | 4,348 | 100.0% |
Ventnor City Summary
Ventnor City is a city located in Atlantic County, New Jersey, United States. It is part of the Atlantic City metropolitan area. As of the 2010 United States Census, the city's population was 10,650, reflecting a decline of 1,260 (-10.6%) from the 11,910 counted in the 2000 Census, which had in turn declined by 1,039 (-8.0%) from the 12,949 counted in the 1990 Census.
History
Ventnor City was incorporated as a borough by an act of the New Jersey Legislature on March 17, 1903, from portions of Egg Harbor Township, based on the results of a referendum held on April 28, 1903. On April 30, 1906, Ventnor City was incorporated as a city, replacing Ventnor City borough, based on the results of a referendum held that same day.
The city was named for Ventnor, a seaside resort on the Isle of Wight in England. The name was suggested by Dr. Charles G. Hildreth, a resident of the city.
Geography
Ventnor City is located at 39 20 N 74 25 W 39 3345 74 4133
According to the United States Census Bureau, the city had a total area of 2.09 square miles (5.41 km2), including 1.90 square miles (4.93 km2) of land and 0.19 square miles (0.48 km2) of water (9.09%).
The city is located on 8.1 miles (13.0 km) of Atlantic Ocean beachfront. It is bounded on the north by Atlantic City, on the east by the Atlantic Ocean, on the south by Margate City and on the west by Longport.
Economy
Ventnor City's economy is largely based on tourism. The city is home to many hotels, restaurants, and other businesses catering to tourists. The city also has a number of small businesses, including retail stores, professional services, and other businesses.
Demographics
As of the 2010 United States Census, there were 10,650 people, 4,845 households, and 2,717.921 families residing in the city. The population density was 5,619.3 per square mile (2,174.2/km2). There were 5,845 housing units at an average density of 3,093.3 per square mile (1,192.2/km2). The racial makeup of the city was 87.90% (9,400) White, 4.02% (430) Black or African American, 0.17% (18) Native American, 1.90% (204) Asian, 0.02% (2) Pacific Islander, 3.75% (403) from other races, and 2.24% (241) from two or more races. Hispanic or Latino of any race were 8.45% (901) of the population.
As of the 2000 United States Census there were 11,910 people, 5,092 households, and 2,945 families residing in the city. The population density was 6,272.2 people per square mile (2,420.2/km2). There were 5,717 housing units at an average density of 3,039.2 per square mile (1,173.2/km2). The racial makeup of the city was 89.90% White, 4.02% African American, 0.17% Native American, 1.90% Asian, 0.02% Pacific Islander, 2.75% from other races, and 1.24% from two or more races. Hispanic or Latino of any race were 6.45% of the population.
Common Questions
What is Per Capita Income in Ventnor City?
Per Capita income in Ventnor City is $48,344.
What is the Median Family Income in Ventnor City?
Median Family Income in Ventnor City is $86,011.
What is the Median Household income in Ventnor City?
Median Household Income in Ventnor City is $71,321.
What is Income or Wage Gap in Ventnor City?
Income or Wage Gap in Ventnor City is 19.2%.
Women in Ventnor City earn 80.8 cents for every dollar earned by a man.
What is Inequality or Gini Index in Ventnor City?
Inequality or Gini Index in Ventnor City is 0.51.
What is the Total Population of Ventnor City?
Total Population of Ventnor City is 9,285.
What is the Total Male Population of Ventnor City?
Total Male Population of Ventnor City is 4,471.
What is the Total Female Population of Ventnor City?
Total Female Population of Ventnor City is 4,814.
What is the Ratio of Males per 100 Females in Ventnor City?
There are 92.87 Males per 100 Females in Ventnor City.
What is the Ratio of Females per 100 Males in Ventnor City?
There are 107.67 Females per 100 Males in Ventnor City.
What is the Median Population Age in Ventnor City?
Median Population Age in Ventnor City is 54.4 Years.
What is the Average Family Size in Ventnor City
Average Family Size in Ventnor City is 2.8 People.
What is the Average Household Size in Ventnor City
Average Household Size in Ventnor City is 2.1 People.
How Large is the Labor Force in Ventnor City?
There are 4,817 People in the Labor Forcein in Ventnor City.
What is the Percentage of People in the Labor Force in Ventnor City?
58.2% of People are in the Labor Force in Ventnor City.
What is the Unemployment Rate in Ventnor City?
Unemployment Rate in Ventnor City is 7.2%.