Cities with the Highest Percentage of Danish Population in New Jersey
RELATED REPORTS & OPTIONS
Danish
New Jersey
Compare Cities
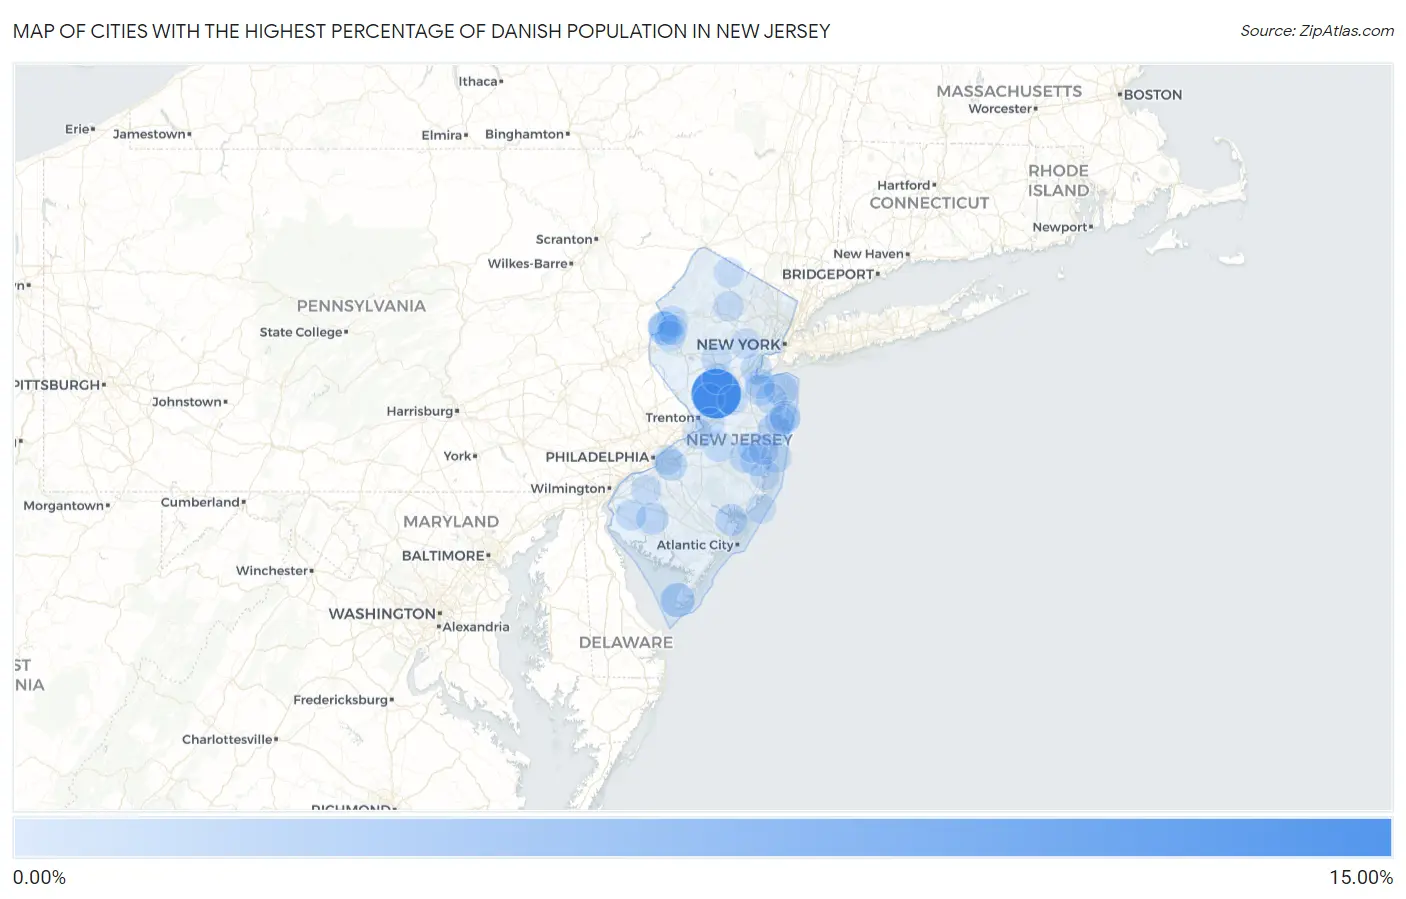
Map of Cities with the Highest Percentage of Danish Population in New Jersey
0.00%
15.00%
Cities with the Highest Percentage of Danish Population in New Jersey
| City | Danish | vs State | vs National | |
| 1. | Kingston | 10.78% | 0.16%(+10.6)#1 | 0.36%(+10.4)#181 |
| 2. | Green | 5.64% | 0.16%(+5.47)#2 | 0.36%(+5.28)#483 |
| 3. | Hopelawn | 3.95% | 0.16%(+3.79)#3 | 0.36%(+3.59)#788 |
| 4. | Flagtown | 3.31% | 0.16%(+3.15)#4 | 0.36%(+2.96)#992 |
| 5. | South Dennis | 3.13% | 0.16%(+2.96)#5 | 0.36%(+2.77)#1,066 |
| 6. | Surf City Borough | 2.94% | 0.16%(+2.78)#6 | 0.36%(+2.59)#1,151 |
| 7. | North Cape May | 2.64% | 0.16%(+2.47)#7 | 0.36%(+2.28)#1,307 |
| 8. | Riverton Borough | 2.39% | 0.16%(+2.22)#8 | 0.36%(+2.03)#1,461 |
| 9. | Brookfield | 2.33% | 0.16%(+2.16)#9 | 0.36%(+1.97)#1,511 |
| 10. | Navesink | 2.08% | 0.16%(+1.92)#10 | 0.36%(+1.73)#1,684 |
| 11. | Allenwood | 1.77% | 0.16%(+1.60)#11 | 0.36%(+1.41)#2,010 |
| 12. | Lower Berkshire Valley | 1.70% | 0.16%(+1.54)#12 | 0.36%(+1.34)#2,092 |
| 13. | Port Republic | 1.63% | 0.16%(+1.47)#13 | 0.36%(+1.28)#2,179 |
| 14. | Hewitt | 1.57% | 0.16%(+1.41)#14 | 0.36%(+1.22)#2,251 |
| 15. | Olivet | 1.56% | 0.16%(+1.40)#15 | 0.36%(+1.21)#2,272 |
| 16. | Milford Borough | 1.53% | 0.16%(+1.36)#16 | 0.36%(+1.17)#2,336 |
| 17. | Holiday Heights | 1.51% | 0.16%(+1.35)#17 | 0.36%(+1.16)#2,358 |
| 18. | Cranford | 1.50% | 0.16%(+1.34)#18 | 0.36%(+1.15)#2,376 |
| 19. | Oceanport Borough | 1.47% | 0.16%(+1.31)#19 | 0.36%(+1.11)#2,438 |
| 20. | Mountain Lakes Borough | 1.47% | 0.16%(+1.30)#20 | 0.36%(+1.11)#2,449 |
| 21. | Jobstown | 1.40% | 0.16%(+1.24)#21 | 0.36%(+1.04)#2,554 |
| 22. | Flemington Borough | 1.38% | 0.16%(+1.21)#22 | 0.36%(+1.02)#2,601 |
| 23. | Little Silver Borough | 1.31% | 0.16%(+1.15)#23 | 0.36%(+0.953)#2,751 |
| 24. | Barclay | 1.27% | 0.16%(+1.10)#24 | 0.36%(+0.908)#2,857 |
| 25. | Harvey Cedars Borough | 1.25% | 0.16%(+1.09)#25 | 0.36%(+0.895)#2,889 |
| 26. | Silver Lake Cdp Warren County | 1.23% | 0.16%(+1.07)#26 | 0.36%(+0.877)#2,927 |
| 27. | Hampton Borough | 1.22% | 0.16%(+1.06)#27 | 0.36%(+0.865)#2,955 |
| 28. | Monmouth Beach Borough | 1.22% | 0.16%(+1.06)#28 | 0.36%(+0.862)#2,970 |
| 29. | The Hills | 1.22% | 0.16%(+1.05)#29 | 0.36%(+0.859)#2,981 |
| 30. | Sussex Borough | 1.20% | 0.16%(+1.04)#30 | 0.36%(+0.842)#3,014 |
| 31. | Gillette | 1.14% | 0.16%(+0.973)#31 | 0.36%(+0.779)#3,193 |
| 32. | Pennington Borough | 1.12% | 0.16%(+0.952)#32 | 0.36%(+0.758)#3,256 |
| 33. | Mountain Lake | 1.10% | 0.16%(+0.942)#33 | 0.36%(+0.748)#3,286 |
| 34. | Allendale Borough | 1.09% | 0.16%(+0.922)#34 | 0.36%(+0.728)#3,347 |
| 35. | Sewaren | 1.08% | 0.16%(+0.913)#35 | 0.36%(+0.719)#3,378 |
| 36. | Belvidere | 1.07% | 0.16%(+0.903)#36 | 0.36%(+0.709)#3,403 |
| 37. | Mcguire Afb | 1.04% | 0.16%(+0.881)#37 | 0.36%(+0.687)#3,456 |
| 38. | Strathmore | 1.03% | 0.16%(+0.865)#38 | 0.36%(+0.671)#3,520 |
| 39. | National Park Borough | 1.02% | 0.16%(+0.861)#39 | 0.36%(+0.667)#3,538 |
| 40. | Brass Castle | 1.02% | 0.16%(+0.857)#40 | 0.36%(+0.662)#3,553 |
| 41. | Mountainside Borough | 0.99% | 0.16%(+0.824)#41 | 0.36%(+0.630)#3,653 |
| 42. | Lincroft | 0.99% | 0.16%(+0.823)#42 | 0.36%(+0.629)#3,657 |
| 43. | Spotswood Borough | 0.97% | 0.16%(+0.808)#43 | 0.36%(+0.614)#3,705 |
| 44. | Crestwood Village | 0.96% | 0.16%(+0.792)#44 | 0.36%(+0.598)#3,763 |
| 45. | Flanders | 0.94% | 0.16%(+0.775)#45 | 0.36%(+0.581)#3,835 |
| 46. | Alloway | 0.91% | 0.16%(+0.747)#46 | 0.36%(+0.553)#3,927 |
| 47. | Loch Arbour | 0.91% | 0.16%(+0.746)#47 | 0.36%(+0.552)#3,934 |
| 48. | Princeton | 0.87% | 0.16%(+0.704)#48 | 0.36%(+0.510)#4,091 |
| 49. | Blackwells Mills | 0.87% | 0.16%(+0.703)#49 | 0.36%(+0.509)#4,094 |
| 50. | Pines Lake | 0.86% | 0.16%(+0.694)#50 | 0.36%(+0.500)#4,134 |
| 51. | Port Morris | 0.84% | 0.16%(+0.673)#51 | 0.36%(+0.479)#4,226 |
| 52. | Pine Beach Borough | 0.83% | 0.16%(+0.670)#52 | 0.36%(+0.475)#4,239 |
| 53. | Dover Beaches South | 0.81% | 0.16%(+0.651)#53 | 0.36%(+0.457)#4,325 |
| 54. | Leisure Knoll | 0.80% | 0.16%(+0.638)#54 | 0.36%(+0.444)#4,379 |
| 55. | Roebling | 0.80% | 0.16%(+0.633)#55 | 0.36%(+0.439)#4,400 |
| 56. | Mullica Hill | 0.76% | 0.16%(+0.600)#56 | 0.36%(+0.406)#4,535 |
| 57. | Stirling | 0.73% | 0.16%(+0.570)#57 | 0.36%(+0.376)#4,679 |
| 58. | Shark River Hills | 0.73% | 0.16%(+0.568)#58 | 0.36%(+0.374)#4,687 |
| 59. | Ledgewood | 0.72% | 0.16%(+0.561)#59 | 0.36%(+0.367)#4,721 |
| 60. | The College Of New Jersey | 0.72% | 0.16%(+0.558)#60 | 0.36%(+0.364)#4,743 |
| 61. | Carlstadt Borough | 0.71% | 0.16%(+0.547)#61 | 0.36%(+0.352)#4,804 |
| 62. | Ocean Grove | 0.70% | 0.16%(+0.540)#62 | 0.36%(+0.346)#4,846 |
| 63. | Spring Lake Heights Borough | 0.70% | 0.16%(+0.536)#63 | 0.36%(+0.342)#4,871 |
| 64. | Summit | 0.70% | 0.16%(+0.533)#64 | 0.36%(+0.339)#4,885 |
| 65. | Lake Telemark | 0.69% | 0.16%(+0.529)#65 | 0.36%(+0.335)#4,908 |
| 66. | Millstone Borough | 0.68% | 0.16%(+0.522)#66 | 0.36%(+0.328)#4,946 |
| 67. | Red Bank Borough | 0.66% | 0.16%(+0.497)#67 | 0.36%(+0.303)#5,065 |
| 68. | Golden Triangle | 0.65% | 0.16%(+0.482)#68 | 0.36%(+0.288)#5,142 |
| 69. | Oxford | 0.64% | 0.16%(+0.477)#69 | 0.36%(+0.283)#5,171 |
| 70. | Keyport Borough | 0.64% | 0.16%(+0.477)#70 | 0.36%(+0.283)#5,176 |
| 71. | Westmont | 0.63% | 0.16%(+0.466)#71 | 0.36%(+0.272)#5,229 |
| 72. | Rossmoor | 0.61% | 0.16%(+0.450)#72 | 0.36%(+0.256)#5,313 |
| 73. | Vernon Center | 0.60% | 0.16%(+0.440)#73 | 0.36%(+0.246)#5,371 |
| 74. | Newfield Borough | 0.60% | 0.16%(+0.438)#74 | 0.36%(+0.244)#5,383 |
| 75. | Cliffwood Beach | 0.60% | 0.16%(+0.435)#75 | 0.36%(+0.241)#5,403 |
| 76. | Pemberton Borough | 0.60% | 0.16%(+0.435)#76 | 0.36%(+0.241)#5,404 |
| 77. | Cedar Knolls | 0.57% | 0.16%(+0.411)#77 | 0.36%(+0.217)#5,525 |
| 78. | Seaside Park Borough | 0.56% | 0.16%(+0.393)#78 | 0.36%(+0.199)#5,643 |
| 79. | Upper Saddle River Borough | 0.55% | 0.16%(+0.390)#79 | 0.36%(+0.196)#5,658 |
| 80. | Green Knoll | 0.54% | 0.16%(+0.379)#80 | 0.36%(+0.185)#5,726 |
| 81. | Forked River | 0.54% | 0.16%(+0.377)#81 | 0.36%(+0.182)#5,741 |
| 82. | Metuchen Borough | 0.53% | 0.16%(+0.372)#82 | 0.36%(+0.178)#5,767 |
| 83. | North Beach Haven | 0.53% | 0.16%(+0.370)#83 | 0.36%(+0.176)#5,778 |
| 84. | Waldwick Borough | 0.53% | 0.16%(+0.363)#84 | 0.36%(+0.169)#5,829 |
| 85. | Florham Park Borough | 0.52% | 0.16%(+0.361)#85 | 0.36%(+0.167)#5,844 |
| 86. | Mendham Borough | 0.52% | 0.16%(+0.360)#86 | 0.36%(+0.166)#5,853 |
| 87. | Yardville | 0.50% | 0.16%(+0.337)#87 | 0.36%(+0.142)#6,002 |
| 88. | Upper Greenwood Lake | 0.50% | 0.16%(+0.334)#88 | 0.36%(+0.140)#6,021 |
| 89. | South Toms River Borough | 0.49% | 0.16%(+0.328)#89 | 0.36%(+0.134)#6,065 |
| 90. | Toms River | 0.49% | 0.16%(+0.327)#90 | 0.36%(+0.133)#6,074 |
| 91. | Allenhurst Borough | 0.49% | 0.16%(+0.322)#91 | 0.36%(+0.128)#6,110 |
| 92. | Mount Hope | 0.49% | 0.16%(+0.322)#92 | 0.36%(+0.128)#6,113 |
| 93. | Hightstown Borough | 0.48% | 0.16%(+0.314)#93 | 0.36%(+0.120)#6,167 |
| 94. | Lake Hopatcong | 0.47% | 0.16%(+0.304)#94 | 0.36%(+0.110)#6,245 |
| 95. | Deal Borough | 0.47% | 0.16%(+0.302)#95 | 0.36%(+0.108)#6,262 |
| 96. | Caldwell Borough | 0.46% | 0.16%(+0.298)#96 | 0.36%(+0.104)#6,288 |
| 97. | South Plainfield Borough | 0.45% | 0.16%(+0.290)#97 | 0.36%(+0.096)#6,348 |
| 98. | Fair Haven Borough | 0.45% | 0.16%(+0.287)#98 | 0.36%(+0.093)#6,375 |
| 99. | High Bridge Borough | 0.45% | 0.16%(+0.286)#99 | 0.36%(+0.092)#6,383 |
| 100. | Beachwood Borough | 0.45% | 0.16%(+0.285)#100 | 0.36%(+0.091)#6,393 |
Common Questions
What are the Top 10 Cities with the Highest Percentage of Danish Population in New Jersey?
Top 10 Cities with the Highest Percentage of Danish Population in New Jersey are:
#1
10.78%
#2
2.64%
#3
2.33%
#4
2.08%
#5
1.77%
#6
1.63%
#7
1.56%
#8
1.51%
#9
1.27%
#10
1.10%
What city has the Highest Percentage of Danish Population in New Jersey?
Kingston has the Highest Percentage of Danish Population in New Jersey with 10.78%.
What is the Percentage of Danish Population in the State of New Jersey?
Percentage of Danish Population in New Jersey is 0.16%.
What is the Percentage of Danish Population in the United States?
Percentage of Danish Population in the United States is 0.36%.