Somerset, NJ Map & Demographics
Somerset Map
Somerset Overview
$55,428
PER CAPITA INCOME
$138,489
AVG FAMILY INCOME
$110,859
AVG HOUSEHOLD INCOME
11.7%
WAGE / INCOME GAP [ % ]
88.3¢/ $1
WAGE / INCOME GAP [ $ ]
$8,212
FAMILY INCOME DEFICIT
0.39
INEQUALITY / GINI INDEX
24,246
TOTAL POPULATION
11,828
MALE POPULATION
12,418
FEMALE POPULATION
95.25
MALES / 100 FEMALES
104.99
FEMALES / 100 MALES
41.5
MEDIAN AGE
3.1
AVG FAMILY SIZE
2.4
AVG HOUSEHOLD SIZE
14,187
LABOR FORCE [ PEOPLE ]
70.5%
PERCENT IN LABOR FORCE
5.4%
UNEMPLOYMENT RATE
Somerset Zip Codes
Income in Somerset
Income Overview in Somerset
Per Capita Income in Somerset is $55,428, while median incomes of families and households are $138,489 and $110,859 respectively.
| Characteristic | Number | Measure |
| Per Capita Income | 24,246 | $55,428 |
| Median Family Income | 6,017 | $138,489 |
| Mean Family Income | 6,017 | $158,851 |
| Median Household Income | 9,981 | $110,859 |
| Mean Household Income | 9,981 | $132,594 |
| Income Deficit | 6,017 | $8,212 |
| Wage / Income Gap (%) | 24,246 | 11.67% |
| Wage / Income Gap ($) | 24,246 | 88.33¢ per $1 |
| Gini / Inequality Index | 24,246 | 0.39 |
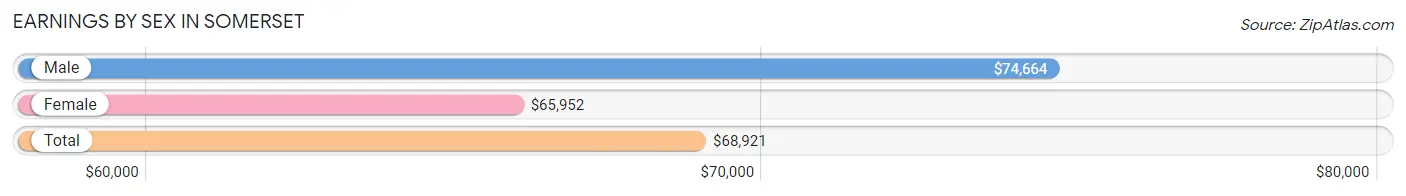
Earnings by Sex in Somerset
Average Earnings in Somerset are $68,921, $74,664 for men and $65,952 for women, a difference of 11.7%.
| Sex | Number | Average Earnings |
| Male | 7,745 (54.0%) | $74,664 |
| Female | 6,608 (46.0%) | $65,952 |
| Total | 14,353 (100.0%) | $68,921 |
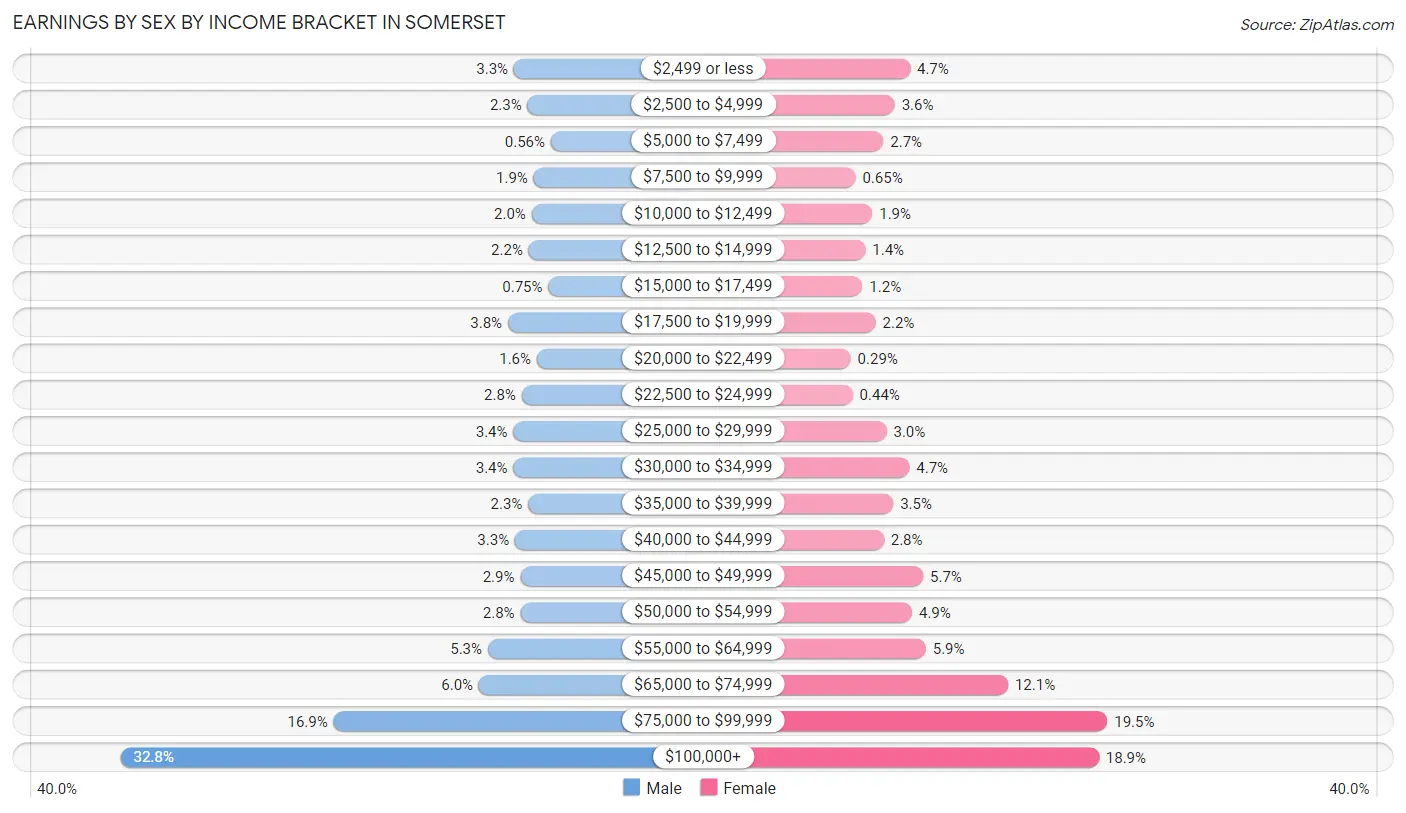
Earnings by Sex by Income Bracket in Somerset
The most common earnings brackets in Somerset are $100,000+ for men (2,541 | 32.8%) and $75,000 to $99,999 for women (1,290 | 19.5%).
| Income | Male | Female |
| $2,499 or less | 258 (3.3%) | 313 (4.7%) |
| $2,500 to $4,999 | 179 (2.3%) | 237 (3.6%) |
| $5,000 to $7,499 | 43 (0.6%) | 181 (2.7%) |
| $7,500 to $9,999 | 143 (1.8%) | 43 (0.6%) |
| $10,000 to $12,499 | 155 (2.0%) | 126 (1.9%) |
| $12,500 to $14,999 | 172 (2.2%) | 92 (1.4%) |
| $15,000 to $17,499 | 58 (0.7%) | 77 (1.2%) |
| $17,500 to $19,999 | 293 (3.8%) | 143 (2.2%) |
| $20,000 to $22,499 | 125 (1.6%) | 19 (0.3%) |
| $22,500 to $24,999 | 213 (2.8%) | 29 (0.4%) |
| $25,000 to $29,999 | 261 (3.4%) | 197 (3.0%) |
| $30,000 to $34,999 | 261 (3.4%) | 310 (4.7%) |
| $35,000 to $39,999 | 175 (2.3%) | 230 (3.5%) |
| $40,000 to $44,999 | 252 (3.3%) | 183 (2.8%) |
| $45,000 to $49,999 | 221 (2.9%) | 378 (5.7%) |
| $50,000 to $54,999 | 220 (2.8%) | 323 (4.9%) |
| $55,000 to $64,999 | 409 (5.3%) | 391 (5.9%) |
| $65,000 to $74,999 | 461 (5.9%) | 798 (12.1%) |
| $75,000 to $99,999 | 1,305 (16.9%) | 1,290 (19.5%) |
| $100,000+ | 2,541 (32.8%) | 1,248 (18.9%) |
| Total | 7,745 (100.0%) | 6,608 (100.0%) |
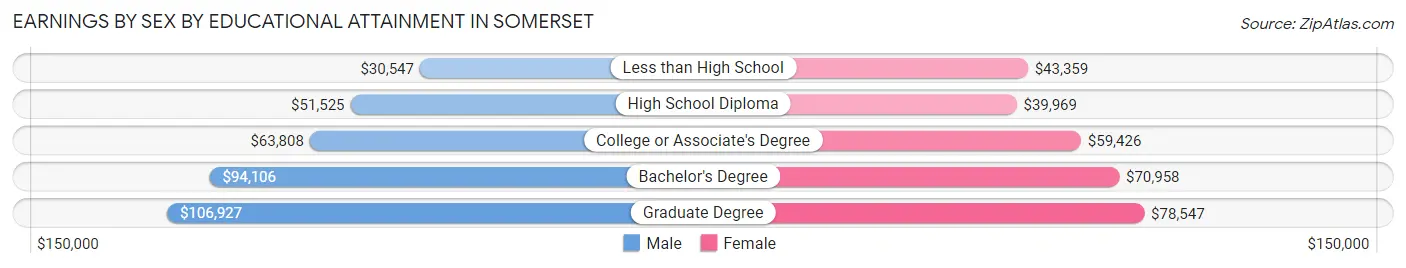
Earnings by Sex by Educational Attainment in Somerset
Average earnings in Somerset are $80,254 for men and $68,873 for women, a difference of 14.2%. Men with an educational attainment of graduate degree enjoy the highest average annual earnings of $106,927, while those with less than high school education earn the least with $30,547. Women with an educational attainment of graduate degree earn the most with the average annual earnings of $78,547, while those with high school diploma education have the smallest earnings of $39,969.
| Educational Attainment | Male Income | Female Income |
| Less than High School | $30,547 | $43,359 |
| High School Diploma | $51,525 | $39,969 |
| College or Associate's Degree | $63,808 | $59,426 |
| Bachelor's Degree | $94,106 | $70,958 |
| Graduate Degree | $106,927 | $78,547 |
| Total | $80,254 | $68,873 |
Family Income in Somerset
Family Income Brackets in Somerset
According to the Somerset family income data, there are 1,414 families falling into the $200,000+ income range, which is the most common income bracket and makes up 23.5% of all families. Conversely, the $10,000 to $14,999 income bracket is the least frequent group with only 24 families (0.4%) belonging to this category.
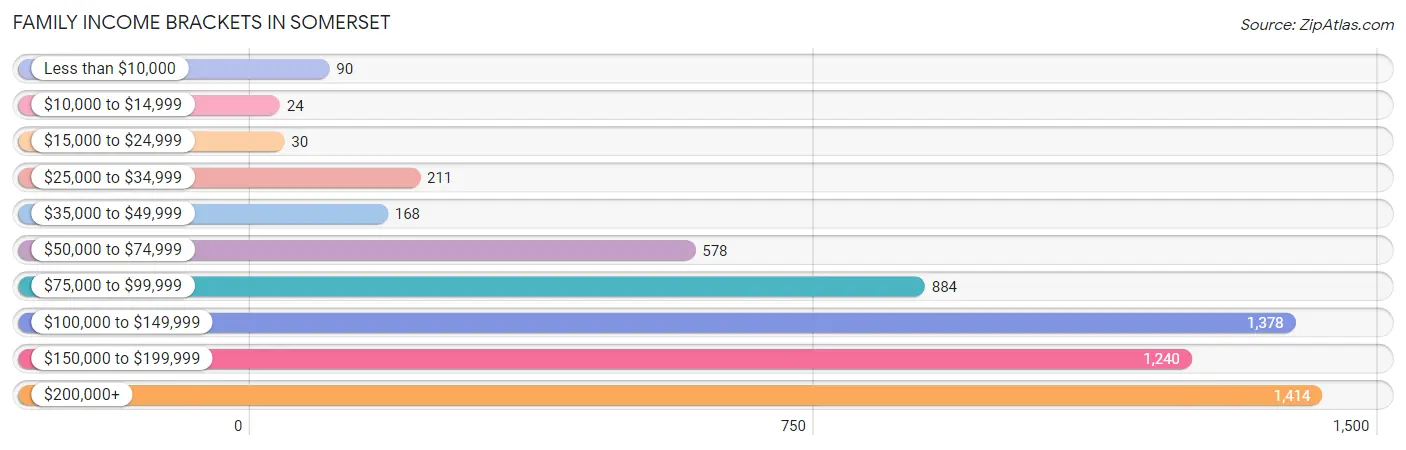
| Income Bracket | # Families | % Families |
| Less than $10,000 | 90 | 1.5% |
| $10,000 to $14,999 | 24 | 0.4% |
| $15,000 to $24,999 | 30 | 0.5% |
| $25,000 to $34,999 | 211 | 3.5% |
| $35,000 to $49,999 | 168 | 2.8% |
| $50,000 to $74,999 | 578 | 9.6% |
| $75,000 to $99,999 | 884 | 14.7% |
| $100,000 to $149,999 | 1,378 | 22.9% |
| $150,000 to $199,999 | 1,240 | 20.6% |
| $200,000+ | 1,414 | 23.5% |
Family Income by Famaliy Size in Somerset
7+ person families (125 | 2.1%) account for the highest median family income in Somerset with $194,205 per family, while 2-person families (2,794 | 46.4%) have the highest median income of $56,844 per family member.
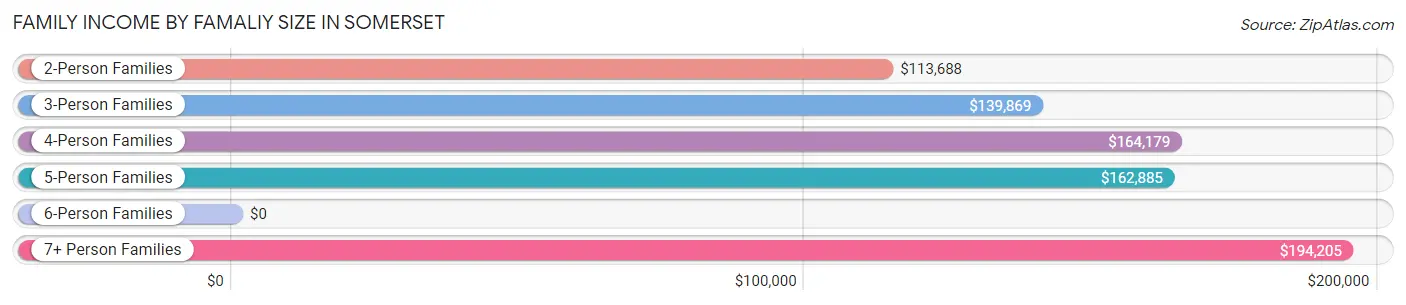
| Income Bracket | # Families | Median Income |
| 2-Person Families | 2,794 (46.4%) | $113,688 |
| 3-Person Families | 1,683 (28.0%) | $139,869 |
| 4-Person Families | 965 (16.0%) | $164,179 |
| 5-Person Families | 432 (7.2%) | $162,885 |
| 6-Person Families | 18 (0.3%) | $0 |
| 7+ Person Families | 125 (2.1%) | $194,205 |
| Total | 6,017 (100.0%) | $138,489 |
Family Income by Number of Earners in Somerset
The median family income in Somerset is $138,489, with families comprising 3+ earners (844) having the highest median family income of $194,595, while families with no earners (672) have the lowest median family income of $66,750, accounting for 14.0% and 11.2% of families, respectively.
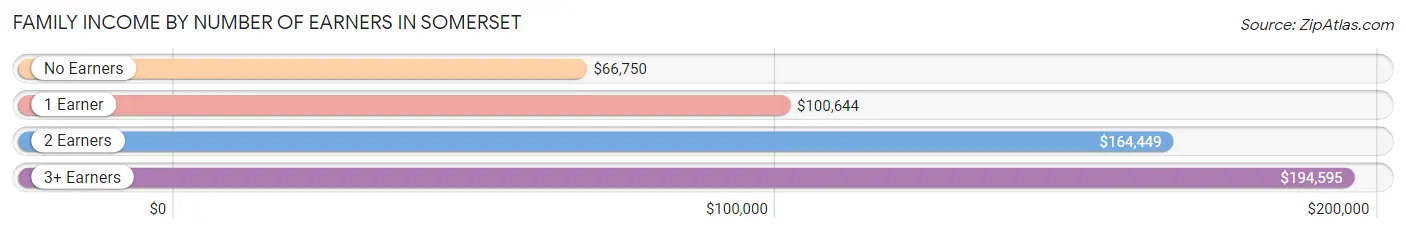
| Number of Earners | # Families | Median Income |
| No Earners | 672 (11.2%) | $66,750 |
| 1 Earner | 1,491 (24.8%) | $100,644 |
| 2 Earners | 3,010 (50.0%) | $164,449 |
| 3+ Earners | 844 (14.0%) | $194,595 |
| Total | 6,017 (100.0%) | $138,489 |
Household Income in Somerset
Household Income Brackets in Somerset
With 2,126 households falling in the category, the $100,000 to $149,999 income range is the most frequent in Somerset, accounting for 21.3% of all households. In contrast, only 260 households (2.6%) fall into the $10,000 to $14,999 income bracket, making it the least populous group.
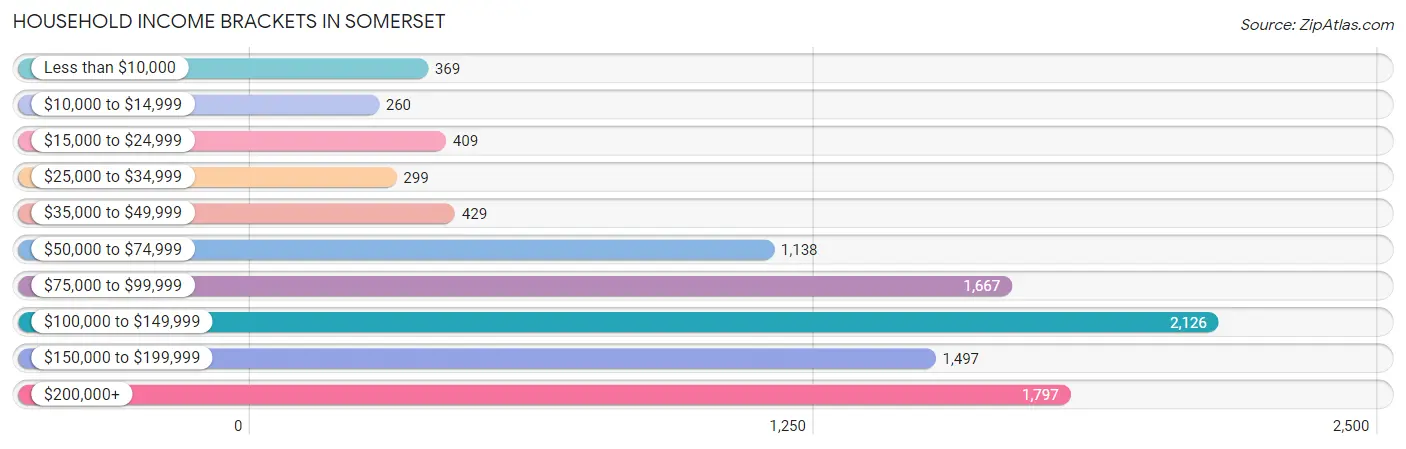
| Income Bracket | # Households | % Households |
| Less than $10,000 | 369 | 3.7% |
| $10,000 to $14,999 | 260 | 2.6% |
| $15,000 to $24,999 | 409 | 4.1% |
| $25,000 to $34,999 | 299 | 3.0% |
| $35,000 to $49,999 | 429 | 4.3% |
| $50,000 to $74,999 | 1,138 | 11.4% |
| $75,000 to $99,999 | 1,667 | 16.7% |
| $100,000 to $149,999 | 2,126 | 21.3% |
| $150,000 to $199,999 | 1,497 | 15.0% |
| $200,000+ | 1,797 | 18.0% |
Household Income by Householder Age in Somerset
The median household income in Somerset is $110,859, with the highest median household income of $133,308 found in the 45 to 64 years age bracket for the primary householder. A total of 3,971 households (39.8%) fall into this category. Meanwhile, the 15 to 24 years age bracket for the primary householder has the lowest median household income of $0, with 255 households (2.5%) in this group.
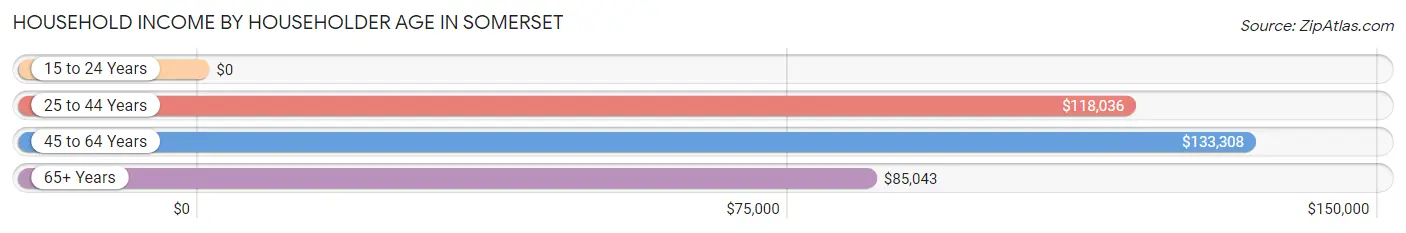
| Income Bracket | # Households | Median Income |
| 15 to 24 Years | 255 (2.5%) | $0 |
| 25 to 44 Years | 3,246 (32.5%) | $118,036 |
| 45 to 64 Years | 3,971 (39.8%) | $133,308 |
| 65+ Years | 2,509 (25.1%) | $85,043 |
| Total | 9,981 (100.0%) | $110,859 |
Poverty in Somerset
Income Below Poverty by Sex and Age in Somerset
With 6.2% poverty level for males and 6.1% for females among the residents of Somerset, 18 to 24 year old males and 18 to 24 year old females are the most vulnerable to poverty, with 337 males (28.9%) and 236 females (24.9%) in their respective age groups living below the poverty level.
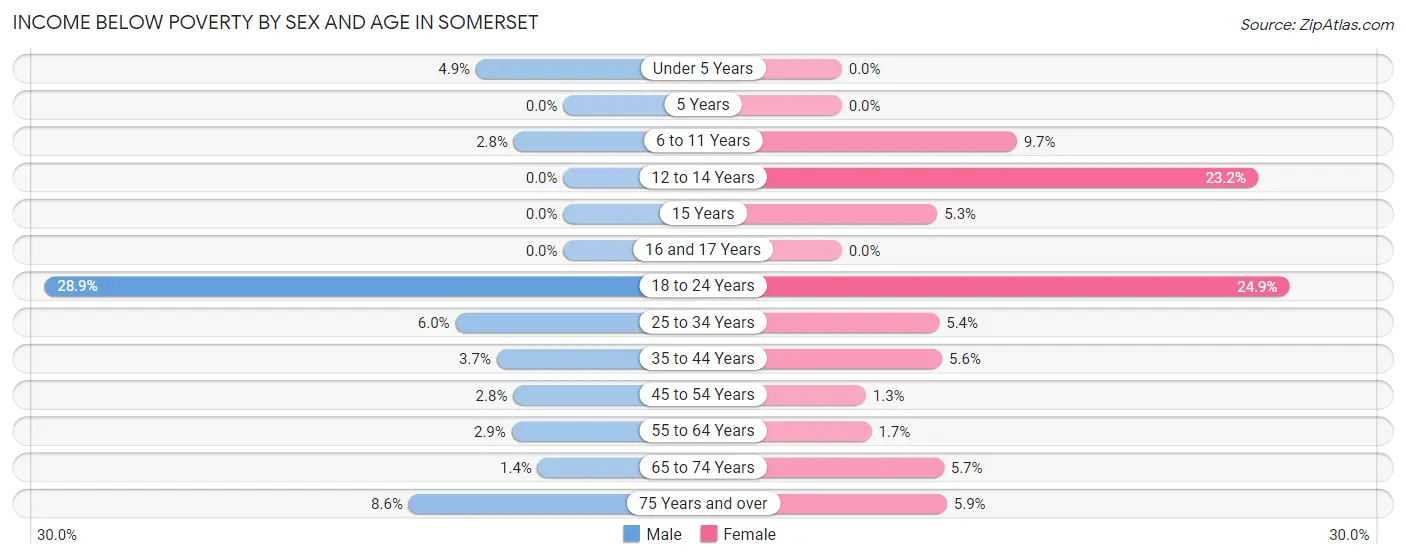
| Age Bracket | Male | Female |
| Under 5 Years | 24 (4.9%) | 0 (0.0%) |
| 5 Years | 0 (0.0%) | 0 (0.0%) |
| 6 to 11 Years | 24 (2.8%) | 63 (9.7%) |
| 12 to 14 Years | 0 (0.0%) | 63 (23.2%) |
| 15 Years | 0 (0.0%) | 24 (5.3%) |
| 16 and 17 Years | 0 (0.0%) | 0 (0.0%) |
| 18 to 24 Years | 337 (28.9%) | 236 (24.9%) |
| 25 to 34 Years | 114 (6.0%) | 89 (5.4%) |
| 35 to 44 Years | 60 (3.7%) | 88 (5.6%) |
| 45 to 54 Years | 52 (2.8%) | 23 (1.3%) |
| 55 to 64 Years | 43 (2.9%) | 27 (1.7%) |
| 65 to 74 Years | 13 (1.4%) | 72 (5.7%) |
| 75 Years and over | 50 (8.6%) | 66 (5.9%) |
| Total | 717 (6.2%) | 751 (6.1%) |
Income Above Poverty by Sex and Age in Somerset
According to the poverty statistics in Somerset, males aged 5 years and females aged under 5 years are the age groups that are most secure financially, with 100.0% of males and 100.0% of females in these age groups living above the poverty line.
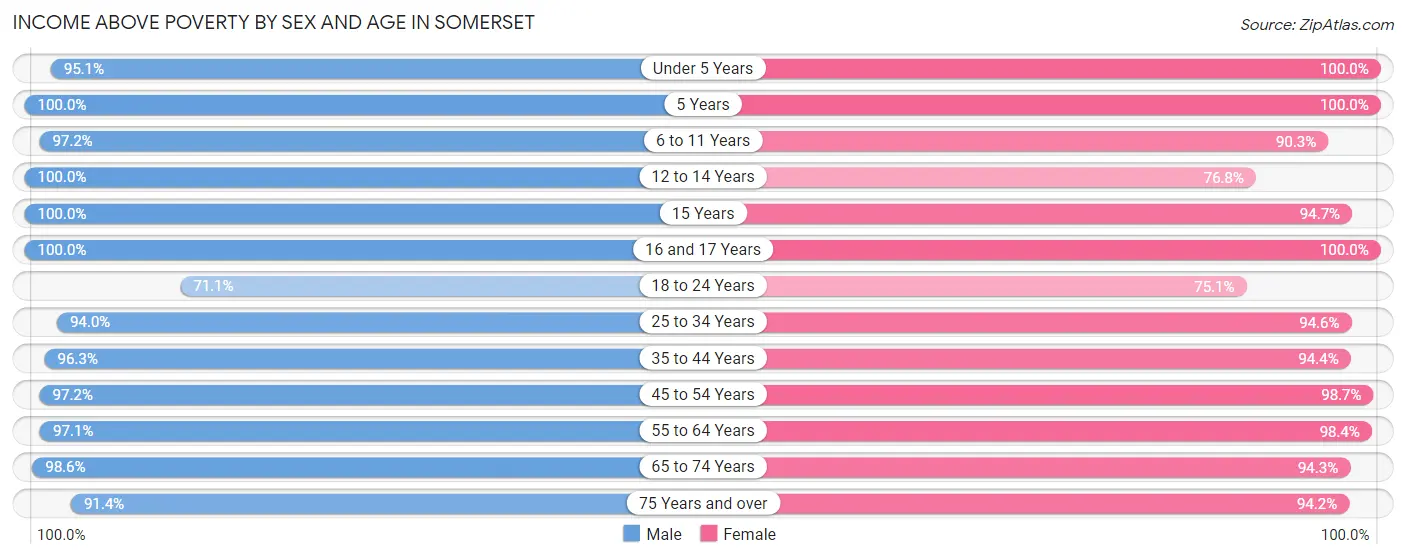
| Age Bracket | Male | Female |
| Under 5 Years | 469 (95.1%) | 544 (100.0%) |
| 5 Years | 101 (100.0%) | 214 (100.0%) |
| 6 to 11 Years | 847 (97.2%) | 584 (90.3%) |
| 12 to 14 Years | 420 (100.0%) | 209 (76.8%) |
| 15 Years | 34 (100.0%) | 427 (94.7%) |
| 16 and 17 Years | 129 (100.0%) | 203 (100.0%) |
| 18 to 24 Years | 829 (71.1%) | 711 (75.1%) |
| 25 to 34 Years | 1,783 (94.0%) | 1,550 (94.6%) |
| 35 to 44 Years | 1,558 (96.3%) | 1,485 (94.4%) |
| 45 to 54 Years | 1,813 (97.2%) | 1,688 (98.7%) |
| 55 to 64 Years | 1,452 (97.1%) | 1,613 (98.4%) |
| 65 to 74 Years | 893 (98.6%) | 1,195 (94.3%) |
| 75 Years and over | 531 (91.4%) | 1,062 (94.2%) |
| Total | 10,859 (93.8%) | 11,485 (93.9%) |
Income Below Poverty Among Married-Couple Families in Somerset
The poverty statistics for married-couple families in Somerset show that 0.8% or 37 of the total 4,687 families live below the poverty line. Families with 3 or 4 children have the highest poverty rate of 4.6%, comprising of 12 families. On the other hand, families with no children have the lowest poverty rate of 0.5%, which includes 13 families.
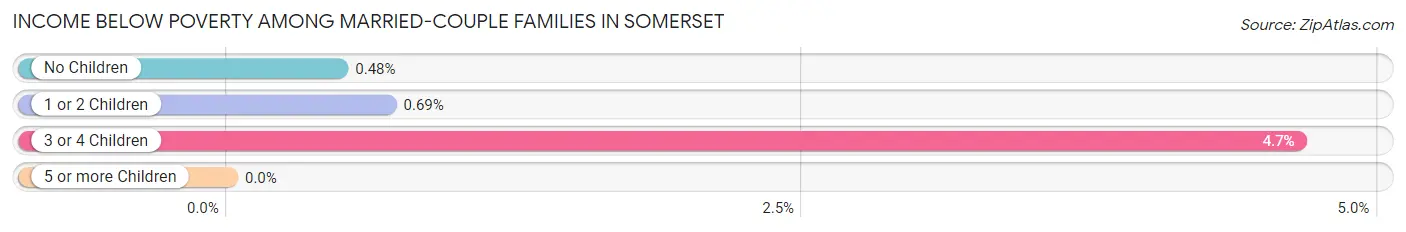
| Children | Above Poverty | Below Poverty |
| No Children | 2,686 (99.5%) | 13 (0.5%) |
| 1 or 2 Children | 1,718 (99.3%) | 12 (0.7%) |
| 3 or 4 Children | 246 (95.4%) | 12 (4.6%) |
| 5 or more Children | 0 (0.0%) | 0 (0.0%) |
| Total | 4,650 (99.2%) | 37 (0.8%) |
Income Below Poverty Among Single-Parent Households in Somerset
According to the poverty data in Somerset, 31.1% or 78 single-father households and 9.3% or 100 single-mother households are living below the poverty line. Among single-father households, those with 1 or 2 children have the highest poverty rate, with 34 households (61.8%) experiencing poverty. Likewise, among single-mother households, those with 1 or 2 children have the highest poverty rate, with 66 households (14.9%) falling below the poverty line.
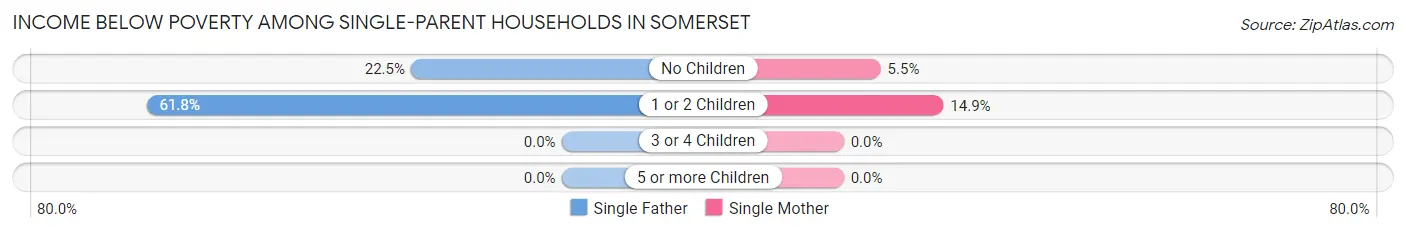
| Children | Single Father | Single Mother |
| No Children | 44 (22.5%) | 34 (5.5%) |
| 1 or 2 Children | 34 (61.8%) | 66 (14.9%) |
| 3 or 4 Children | 0 (0.0%) | 0 (0.0%) |
| 5 or more Children | 0 (0.0%) | 0 (0.0%) |
| Total | 78 (31.1%) | 100 (9.3%) |
Income Below Poverty Among Married-Couple vs Single-Parent Households in Somerset
The poverty data for Somerset shows that 37 of the married-couple family households (0.8%) and 178 of the single-parent households (13.4%) are living below the poverty level. Within the married-couple family households, those with 3 or 4 children have the highest poverty rate, with 12 households (4.6%) falling below the poverty line. Among the single-parent households, those with 1 or 2 children have the highest poverty rate, with 100 household (20.0%) living below poverty.
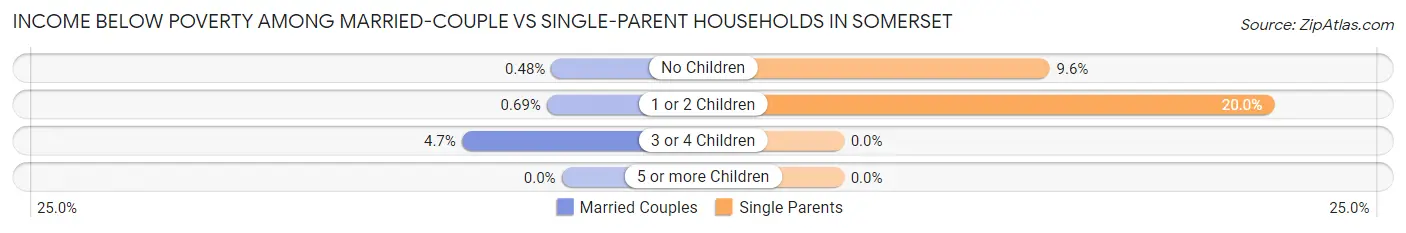
| Children | Married-Couple Families | Single-Parent Households |
| No Children | 13 (0.5%) | 78 (9.6%) |
| 1 or 2 Children | 12 (0.7%) | 100 (20.0%) |
| 3 or 4 Children | 12 (4.6%) | 0 (0.0%) |
| 5 or more Children | 0 (0.0%) | 0 (0.0%) |
| Total | 37 (0.8%) | 178 (13.4%) |
Race in Somerset
The most populous races in Somerset are White / Caucasian (9,579 | 39.5%), Black / African American (7,612 | 31.4%), and Asian (5,095 | 21.0%).
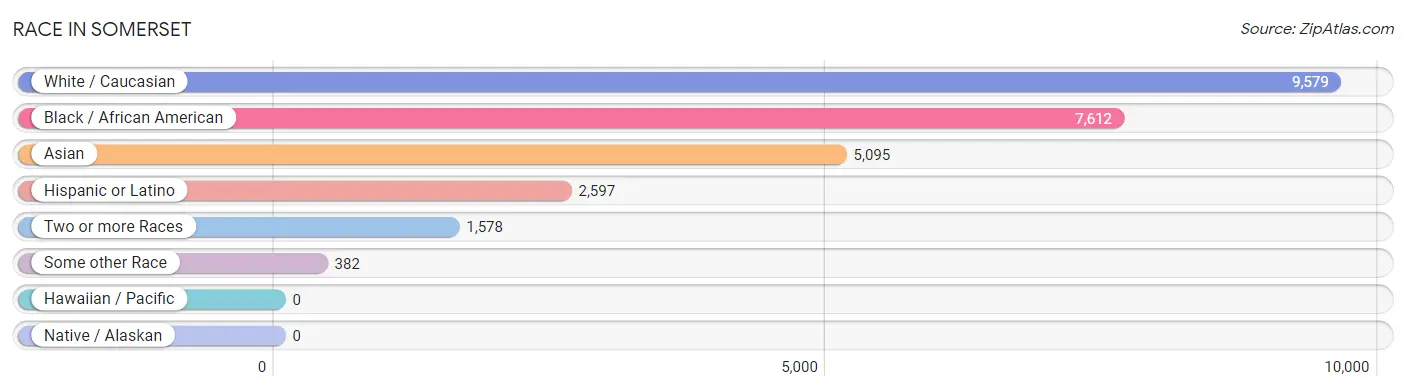
| Race | # Population | % Population |
| Asian | 5,095 | 21.0% |
| Black / African American | 7,612 | 31.4% |
| Hawaiian / Pacific | 0 | 0.0% |
| Hispanic or Latino | 2,597 | 10.7% |
| Native / Alaskan | 0 | 0.0% |
| White / Caucasian | 9,579 | 39.5% |
| Two or more Races | 1,578 | 6.5% |
| Some other Race | 382 | 1.6% |
| Total | 24,246 | 100.0% |
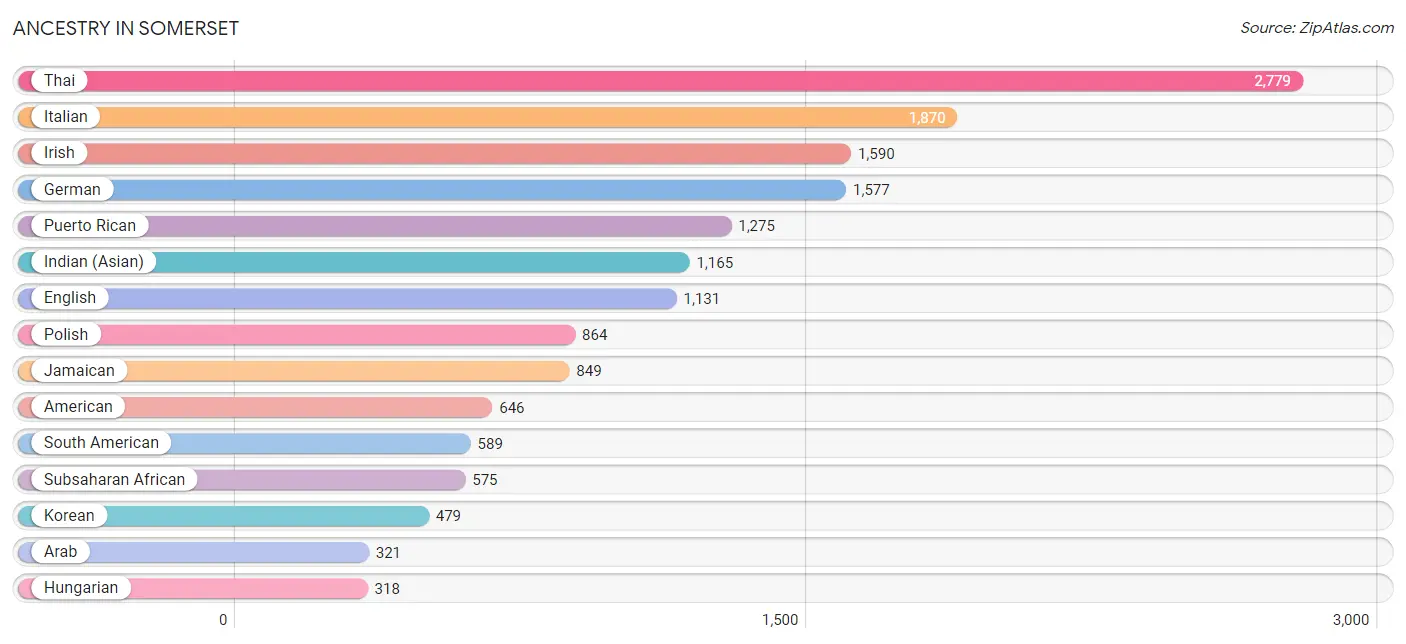
Ancestry in Somerset
The most populous ancestries reported in Somerset are Thai (2,779 | 11.5%), Italian (1,870 | 7.7%), Irish (1,590 | 6.6%), German (1,577 | 6.5%), and Puerto Rican (1,275 | 5.3%), together accounting for 37.5% of all Somerset residents.
| Ancestry | # Population | % Population |
| African | 196 | 0.8% |
| American | 646 | 2.7% |
| Arab | 321 | 1.3% |
| Argentinean | 111 | 0.5% |
| Armenian | 50 | 0.2% |
| Austrian | 88 | 0.4% |
| Bahamian | 72 | 0.3% |
| Barbadian | 26 | 0.1% |
| Belgian | 22 | 0.1% |
| Belizean | 17 | 0.1% |
| Bhutanese | 50 | 0.2% |
| Blackfeet | 55 | 0.2% |
| Brazilian | 17 | 0.1% |
| British | 102 | 0.4% |
| British West Indian | 112 | 0.5% |
| Burmese | 227 | 0.9% |
| Canadian | 55 | 0.2% |
| Central American | 81 | 0.3% |
| Central American Indian | 28 | 0.1% |
| Cherokee | 31 | 0.1% |
| Chilean | 17 | 0.1% |
| Choctaw | 16 | 0.1% |
| Colombian | 225 | 0.9% |
| Costa Rican | 39 | 0.2% |
| Creek | 25 | 0.1% |
| Croatian | 6 | 0.0% |
| Cuban | 162 | 0.7% |
| Czech | 15 | 0.1% |
| Delaware | 260 | 1.1% |
| Dominican | 292 | 1.2% |
| Dutch | 107 | 0.4% |
| Eastern European | 82 | 0.3% |
| Ecuadorian | 190 | 0.8% |
| Egyptian | 144 | 0.6% |
| English | 1,131 | 4.7% |
| European | 103 | 0.4% |
| Filipino | 137 | 0.6% |
| Finnish | 7 | 0.0% |
| French | 182 | 0.7% |
| French Canadian | 78 | 0.3% |
| German | 1,577 | 6.5% |
| Ghanaian | 125 | 0.5% |
| Greek | 28 | 0.1% |
| Guyanese | 68 | 0.3% |
| Haitian | 38 | 0.2% |
| Honduran | 3 | 0.0% |
| Hungarian | 318 | 1.3% |
| Icelander | 3 | 0.0% |
| Indian (Asian) | 1,165 | 4.8% |
| Iranian | 18 | 0.1% |
| Iraqi | 9 | 0.0% |
| Irish | 1,590 | 6.6% |
| Israeli | 11 | 0.1% |
| Italian | 1,870 | 7.7% |
| Jamaican | 849 | 3.5% |
| Korean | 479 | 2.0% |
| Latvian | 32 | 0.1% |
| Lebanese | 26 | 0.1% |
| Lithuanian | 94 | 0.4% |
| Macedonian | 24 | 0.1% |
| Mexican | 53 | 0.2% |
| Moroccan | 20 | 0.1% |
| Northern European | 23 | 0.1% |
| Norwegian | 38 | 0.2% |
| Pakistani | 5 | 0.0% |
| Palestinian | 73 | 0.3% |
| Panamanian | 39 | 0.2% |
| Paraguayan | 18 | 0.1% |
| Peruvian | 28 | 0.1% |
| Polish | 864 | 3.6% |
| Portuguese | 9 | 0.0% |
| Puerto Rican | 1,275 | 5.3% |
| Russian | 242 | 1.0% |
| Scandinavian | 21 | 0.1% |
| Scotch-Irish | 5 | 0.0% |
| Scottish | 189 | 0.8% |
| Seminole | 13 | 0.1% |
| Sierra Leonean | 90 | 0.4% |
| Slavic | 26 | 0.1% |
| Slovak | 75 | 0.3% |
| Slovene | 31 | 0.1% |
| South American | 589 | 2.4% |
| South American Indian | 28 | 0.1% |
| Spaniard | 28 | 0.1% |
| Spanish | 55 | 0.2% |
| Sri Lankan | 134 | 0.5% |
| Subsaharan African | 575 | 2.4% |
| Swedish | 114 | 0.5% |
| Swiss | 96 | 0.4% |
| Syrian | 37 | 0.2% |
| Thai | 2,779 | 11.5% |
| Trinidadian and Tobagonian | 77 | 0.3% |
| Turkish | 142 | 0.6% |
| Ukrainian | 192 | 0.8% |
| Vietnamese | 39 | 0.2% |
| Welsh | 51 | 0.2% | View All 96 Rows |
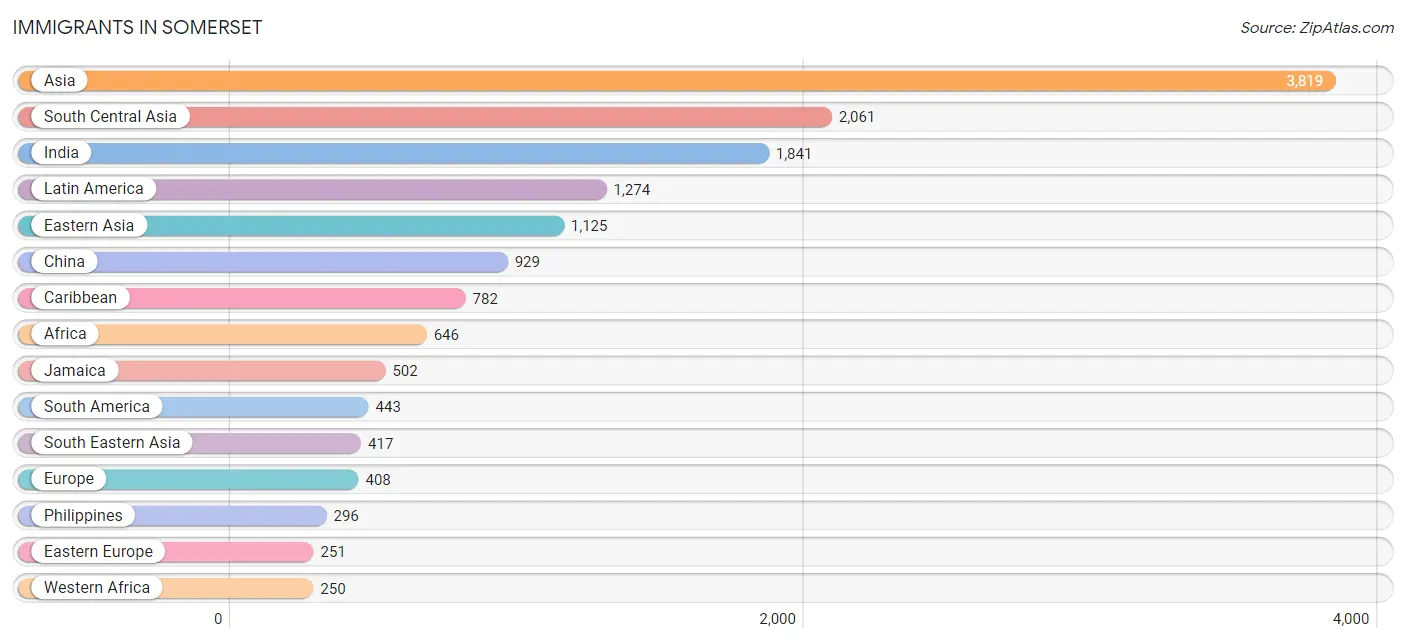
Immigrants in Somerset
The most numerous immigrant groups reported in Somerset came from Asia (3,819 | 15.8%), South Central Asia (2,061 | 8.5%), India (1,841 | 7.6%), Latin America (1,274 | 5.2%), and Eastern Asia (1,125 | 4.6%), together accounting for 41.7% of all Somerset residents.
| Immigration Origin | # Population | % Population |
| Africa | 646 | 2.7% |
| Argentina | 105 | 0.4% |
| Asia | 3,819 | 15.8% |
| Australia | 5 | 0.0% |
| Bahamas | 42 | 0.2% |
| Bangladesh | 39 | 0.2% |
| Belarus | 12 | 0.1% |
| Brazil | 17 | 0.1% |
| Cambodia | 26 | 0.1% |
| Canada | 37 | 0.2% |
| Caribbean | 782 | 3.2% |
| Central America | 49 | 0.2% |
| China | 929 | 3.8% |
| Colombia | 80 | 0.3% |
| Costa Rica | 15 | 0.1% |
| Croatia | 6 | 0.0% |
| Cuba | 57 | 0.2% |
| Czechoslovakia | 17 | 0.1% |
| Dominican Republic | 159 | 0.7% |
| Eastern Africa | 126 | 0.5% |
| Eastern Asia | 1,125 | 4.6% |
| Eastern Europe | 251 | 1.0% |
| Ecuador | 103 | 0.4% |
| Egypt | 80 | 0.3% |
| England | 36 | 0.2% |
| Europe | 408 | 1.7% |
| France | 33 | 0.1% |
| Germany | 10 | 0.0% |
| Ghana | 125 | 0.5% |
| Greece | 9 | 0.0% |
| Guyana | 101 | 0.4% |
| Haiti | 22 | 0.1% |
| Hong Kong | 112 | 0.5% |
| Hungary | 30 | 0.1% |
| India | 1,841 | 7.6% |
| Iran | 18 | 0.1% |
| Iraq | 9 | 0.0% |
| Israel | 18 | 0.1% |
| Italy | 16 | 0.1% |
| Jamaica | 502 | 2.1% |
| Japan | 14 | 0.1% |
| Kenya | 126 | 0.5% |
| Korea | 182 | 0.7% |
| Kuwait | 18 | 0.1% |
| Latin America | 1,274 | 5.2% |
| Lebanon | 9 | 0.0% |
| Malaysia | 25 | 0.1% |
| Mexico | 34 | 0.1% |
| North Macedonia | 15 | 0.1% |
| Northern Africa | 80 | 0.3% |
| Northern Europe | 89 | 0.4% |
| Oceania | 5 | 0.0% |
| Pakistan | 129 | 0.5% |
| Peru | 19 | 0.1% |
| Philippines | 296 | 1.2% |
| Poland | 109 | 0.4% |
| Russia | 42 | 0.2% |
| Scotland | 26 | 0.1% |
| Senegal | 66 | 0.3% |
| Sierra Leone | 59 | 0.2% |
| South Africa | 30 | 0.1% |
| South America | 443 | 1.8% |
| South Central Asia | 2,061 | 8.5% |
| South Eastern Asia | 417 | 1.7% |
| Southern Europe | 25 | 0.1% |
| Sri Lanka | 34 | 0.1% |
| Sweden | 15 | 0.1% |
| Syria | 28 | 0.1% |
| Taiwan | 205 | 0.9% |
| Thailand | 5 | 0.0% |
| Turkey | 134 | 0.5% |
| Ukraine | 20 | 0.1% |
| Vietnam | 65 | 0.3% |
| Western Africa | 250 | 1.0% |
| Western Asia | 216 | 0.9% |
| Western Europe | 43 | 0.2% | View All 76 Rows |
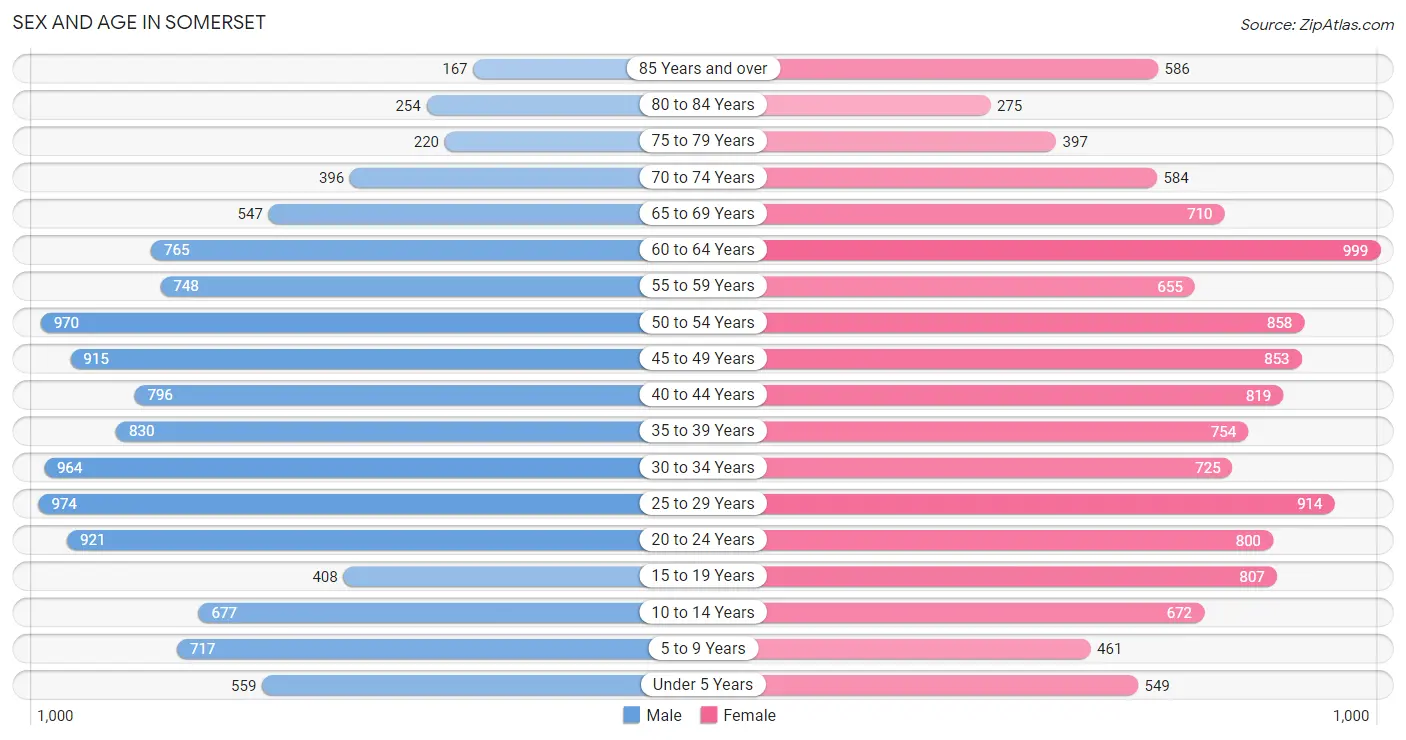
Sex and Age in Somerset
Sex and Age in Somerset
The most populous age groups in Somerset are 25 to 29 Years (974 | 8.2%) for men and 60 to 64 Years (999 | 8.0%) for women.
| Age Bracket | Male | Female |
| Under 5 Years | 559 (4.7%) | 549 (4.4%) |
| 5 to 9 Years | 717 (6.1%) | 461 (3.7%) |
| 10 to 14 Years | 677 (5.7%) | 672 (5.4%) |
| 15 to 19 Years | 408 (3.5%) | 807 (6.5%) |
| 20 to 24 Years | 921 (7.8%) | 800 (6.4%) |
| 25 to 29 Years | 974 (8.2%) | 914 (7.4%) |
| 30 to 34 Years | 964 (8.2%) | 725 (5.8%) |
| 35 to 39 Years | 830 (7.0%) | 754 (6.1%) |
| 40 to 44 Years | 796 (6.7%) | 819 (6.6%) |
| 45 to 49 Years | 915 (7.7%) | 853 (6.9%) |
| 50 to 54 Years | 970 (8.2%) | 858 (6.9%) |
| 55 to 59 Years | 748 (6.3%) | 655 (5.3%) |
| 60 to 64 Years | 765 (6.5%) | 999 (8.0%) |
| 65 to 69 Years | 547 (4.6%) | 710 (5.7%) |
| 70 to 74 Years | 396 (3.4%) | 584 (4.7%) |
| 75 to 79 Years | 220 (1.9%) | 397 (3.2%) |
| 80 to 84 Years | 254 (2.1%) | 275 (2.2%) |
| 85 Years and over | 167 (1.4%) | 586 (4.7%) |
| Total | 11,828 (100.0%) | 12,418 (100.0%) |
Families and Households in Somerset
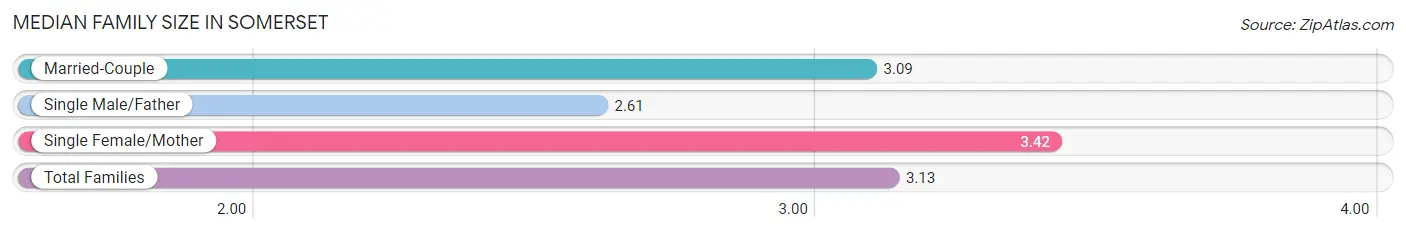
Median Family Size in Somerset
The median family size in Somerset is 3.13 persons per family, with single female/mother families (1,079 | 17.9%) accounting for the largest median family size of 3.42 persons per family. On the other hand, single male/father families (251 | 4.2%) represent the smallest median family size with 2.61 persons per family.
| Family Type | # Families | Family Size |
| Married-Couple | 4,687 (77.9%) | 3.09 |
| Single Male/Father | 251 (4.2%) | 2.61 |
| Single Female/Mother | 1,079 (17.9%) | 3.42 |
| Total Families | 6,017 (100.0%) | 3.13 |
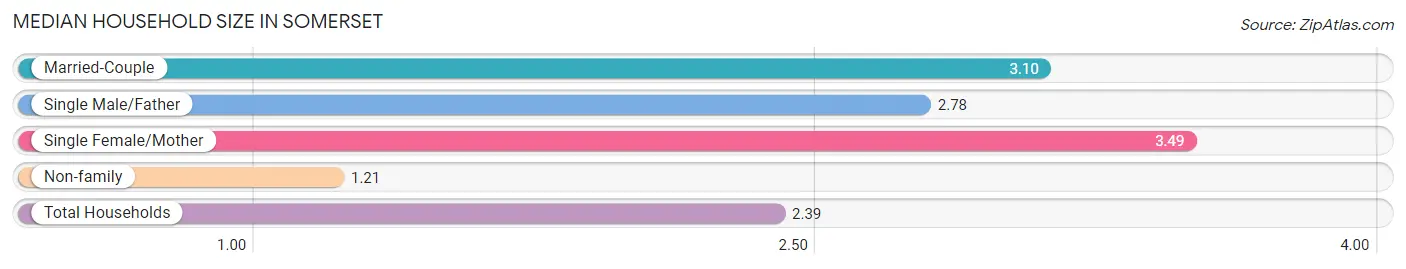
Median Household Size in Somerset
The median household size in Somerset is 2.39 persons per household, with single female/mother households (1,079 | 10.8%) accounting for the largest median household size of 3.49 persons per household. non-family households (3,964 | 39.7%) represent the smallest median household size with 1.21 persons per household.
| Household Type | # Households | Household Size |
| Married-Couple | 4,687 (47.0%) | 3.10 |
| Single Male/Father | 251 (2.5%) | 2.78 |
| Single Female/Mother | 1,079 (10.8%) | 3.49 |
| Non-family | 3,964 (39.7%) | 1.21 |
| Total Households | 9,981 (100.0%) | 2.39 |
Household Size by Marriage Status in Somerset
Out of a total of 9,981 households in Somerset, 6,017 (60.3%) are family households, while 3,964 (39.7%) are nonfamily households. The most numerous type of family households are 2-person households, comprising 2,778, and the most common type of nonfamily households are 1-person households, comprising 3,318.
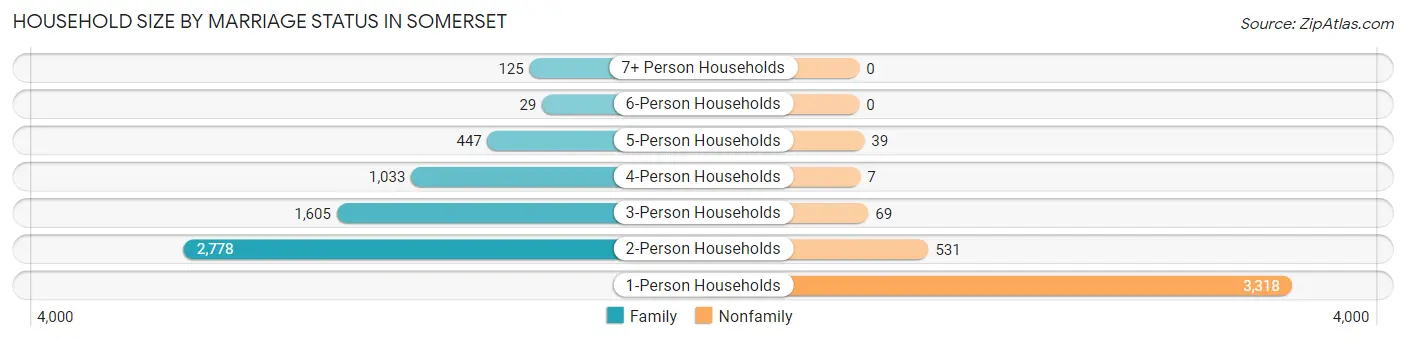
| Household Size | Family Households | Nonfamily Households |
| 1-Person Households | - | 3,318 (33.2%) |
| 2-Person Households | 2,778 (27.8%) | 531 (5.3%) |
| 3-Person Households | 1,605 (16.1%) | 69 (0.7%) |
| 4-Person Households | 1,033 (10.3%) | 7 (0.1%) |
| 5-Person Households | 447 (4.5%) | 39 (0.4%) |
| 6-Person Households | 29 (0.3%) | 0 (0.0%) |
| 7+ Person Households | 125 (1.3%) | 0 (0.0%) |
| Total | 6,017 (60.3%) | 3,964 (39.7%) |
Female Fertility in Somerset
Fertility by Age in Somerset
Average fertility rate in Somerset is 48.0 births per 1,000 women. Women in the age bracket of 20 to 34 years have the highest fertility rate with 77.0 births per 1,000 women. Women in the age bracket of 20 to 34 years acount for 67.5% of all women with births.
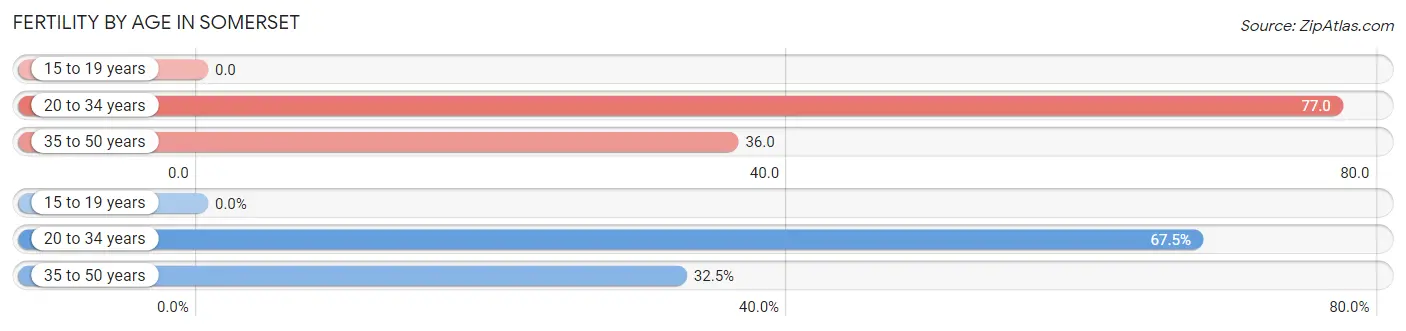
| Age Bracket | Women with Births | Births / 1,000 Women |
| 15 to 19 years | 0 (0.0%) | 0.0 |
| 20 to 34 years | 189 (67.5%) | 77.0 |
| 35 to 50 years | 91 (32.5%) | 36.0 |
| Total | 280 (100.0%) | 48.0 |
Fertility by Age by Marriage Status in Somerset
96.8% of women with births (280) in Somerset are married. The highest percentage of unmarried women with births falls into 20 to 34 years age bracket with 4.8% of them unmarried at the time of birth, while the lowest percentage of unmarried women with births belong to 35 to 50 years age bracket with 0.0% of them unmarried.
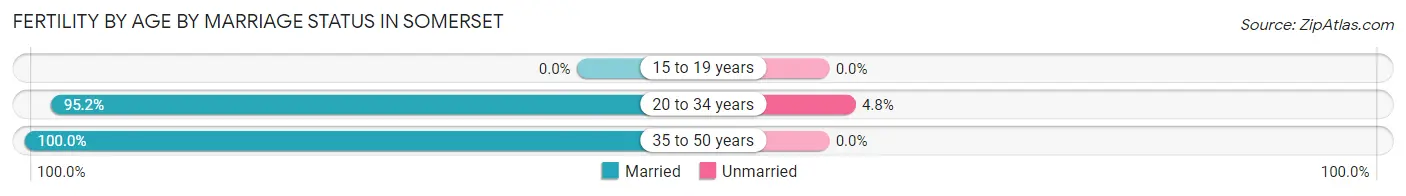
| Age Bracket | Married | Unmarried |
| 15 to 19 years | 0 (0.0%) | 0 (0.0%) |
| 20 to 34 years | 180 (95.2%) | 9 (4.8%) |
| 35 to 50 years | 91 (100.0%) | 0 (0.0%) |
| Total | 271 (96.8%) | 9 (3.2%) |
Fertility by Education in Somerset
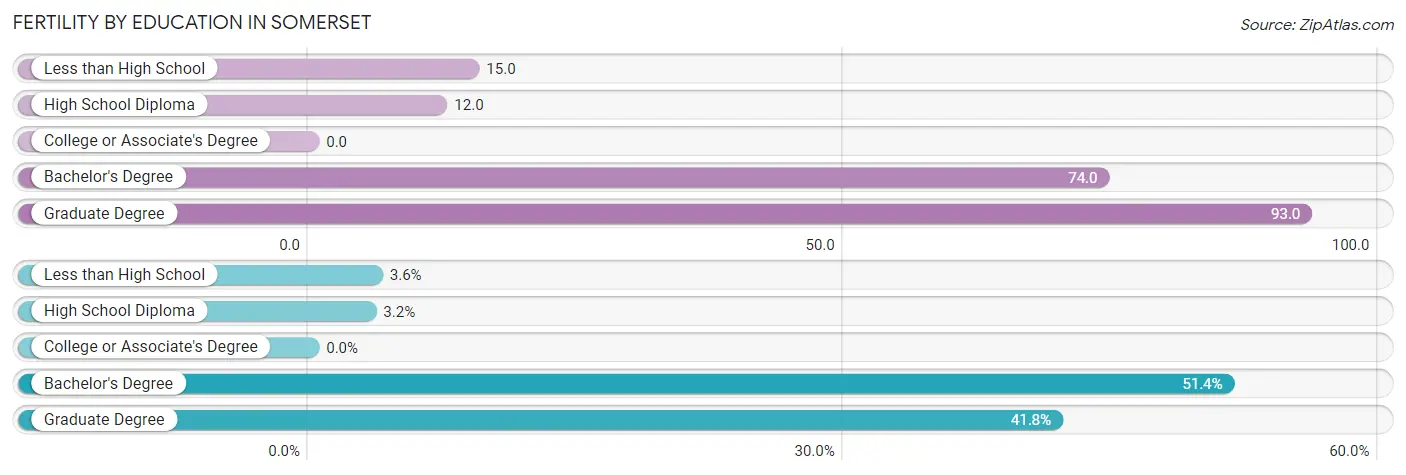
| Educational Attainment | Women with Births | Births / 1,000 Women |
| Less than High School | 10 (3.6%) | 15.0 |
| High School Diploma | 9 (3.2%) | 12.0 |
| College or Associate's Degree | 0 (0.0%) | 0.0 |
| Bachelor's Degree | 144 (51.4%) | 74.0 |
| Graduate Degree | 117 (41.8%) | 93.0 |
| Total | 280 (100.0%) | 48.0 |
Fertility by Education by Marriage Status in Somerset
3.2% of women with births in Somerset are unmarried. Women with the educational attainment of less than high school are most likely to be married with 100.0% of them married at childbirth, while women with the educational attainment of high school diploma are least likely to be married with 100.0% of them unmarried at childbirth.
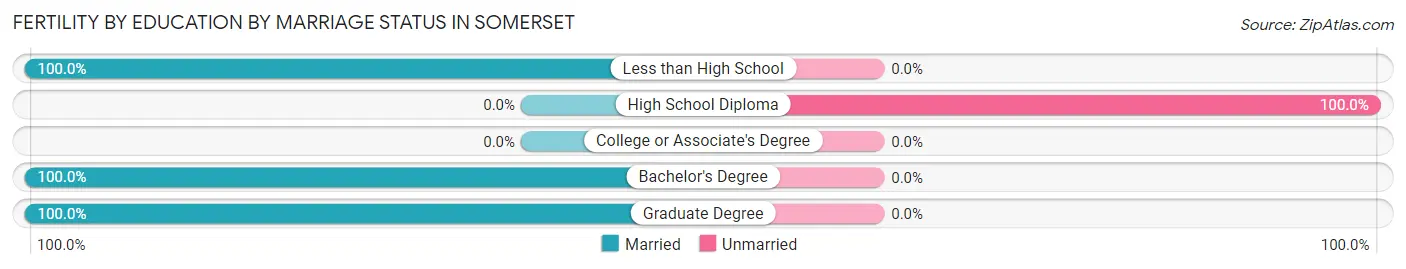
| Educational Attainment | Married | Unmarried |
| Less than High School | 10 (100.0%) | 0 (0.0%) |
| High School Diploma | 0 (0.0%) | 9 (100.0%) |
| College or Associate's Degree | 0 (0.0%) | 0 (0.0%) |
| Bachelor's Degree | 144 (100.0%) | 0 (0.0%) |
| Graduate Degree | 117 (100.0%) | 0 (0.0%) |
| Total | 271 (96.8%) | 9 (3.2%) |
Employment Characteristics in Somerset
Employment by Class of Employer in Somerset
Among the 13,282 employed individuals in Somerset, private company employees (9,097 | 68.5%), not-for-profit organizations (1,513 | 11.4%), and state government employees (788 | 5.9%) make up the most common classes of employment.
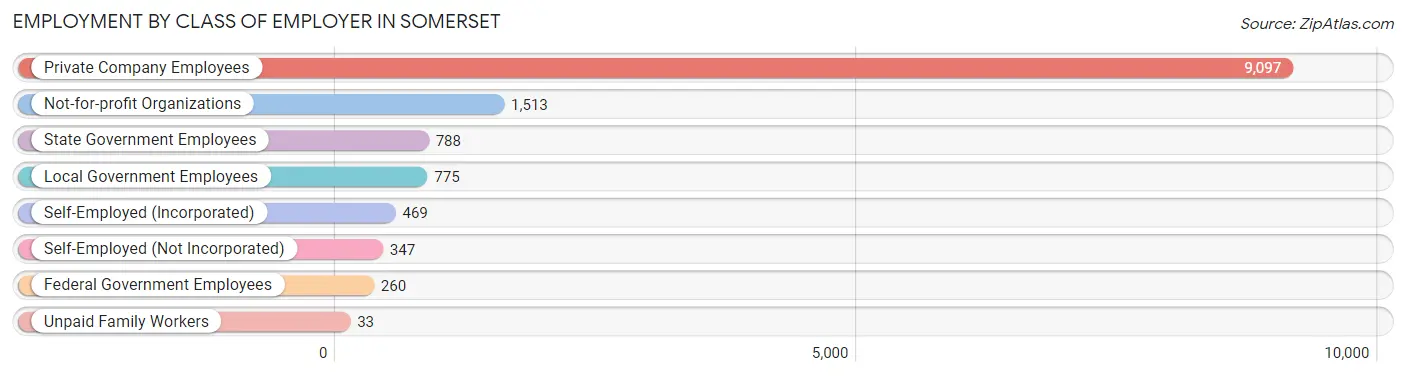
| Employer Class | # Employees | % Employees |
| Private Company Employees | 9,097 | 68.5% |
| Self-Employed (Incorporated) | 469 | 3.5% |
| Self-Employed (Not Incorporated) | 347 | 2.6% |
| Not-for-profit Organizations | 1,513 | 11.4% |
| Local Government Employees | 775 | 5.8% |
| State Government Employees | 788 | 5.9% |
| Federal Government Employees | 260 | 2.0% |
| Unpaid Family Workers | 33 | 0.3% |
| Total | 13,282 | 100.0% |
Employment Status by Age in Somerset
According to the labor force statistics for Somerset, out of the total population over 16 years of age (20,123), 70.5% or 14,187 individuals are in the labor force, with 5.4% or 766 of them unemployed. The age group with the highest labor force participation rate is 35 to 44 years, with 93.8% or 3,001 individuals in the labor force. Within the labor force, the 75 years and over age range has the highest percentage of unemployed individuals, with 14.0% or 34 of them being unemployed.
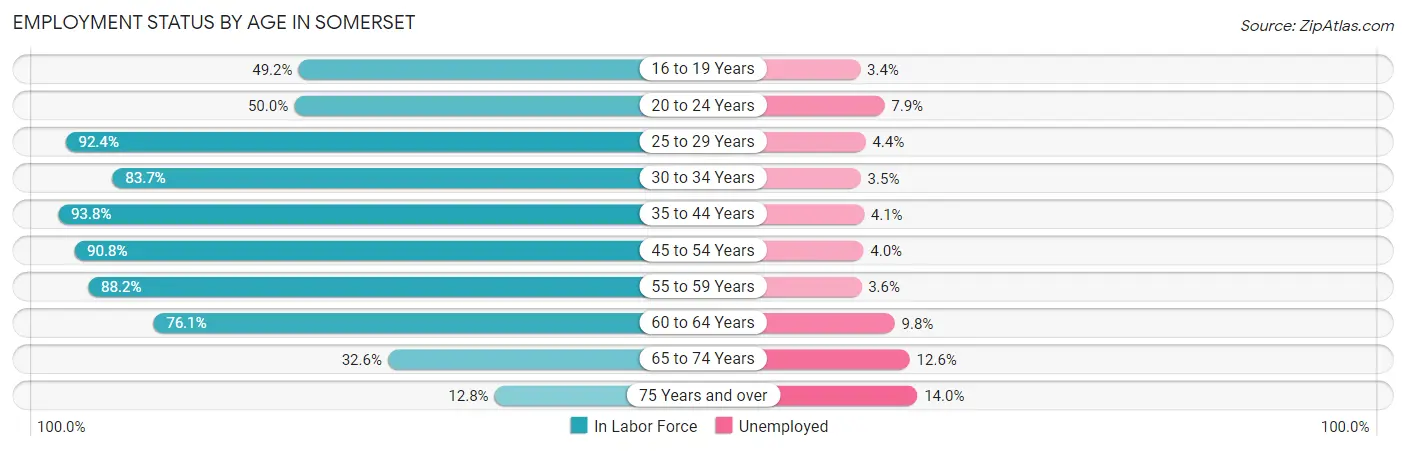
| Age Bracket | In Labor Force | Unemployed |
| 16 to 19 Years | 358 (49.2%) | 12 (3.4%) |
| 20 to 24 Years | 860 (50.0%) | 68 (7.9%) |
| 25 to 29 Years | 1,745 (92.4%) | 77 (4.4%) |
| 30 to 34 Years | 1,414 (83.7%) | 49 (3.5%) |
| 35 to 44 Years | 3,001 (93.8%) | 123 (4.1%) |
| 45 to 54 Years | 3,265 (90.8%) | 131 (4.0%) |
| 55 to 59 Years | 1,237 (88.2%) | 45 (3.6%) |
| 60 to 64 Years | 1,342 (76.1%) | 132 (9.8%) |
| 65 to 74 Years | 729 (32.6%) | 92 (12.6%) |
| 75 Years and over | 243 (12.8%) | 34 (14.0%) |
| Total | 14,187 (70.5%) | 766 (5.4%) |
Employment Status by Educational Attainment in Somerset
According to labor force statistics for Somerset, 88.6% of individuals (11,996) out of the total population between 25 and 64 years of age (13,539) are in the labor force, with 4.6% or 552 of them being unemployed. The group with the highest labor force participation rate are those with the educational attainment of bachelor's degree or higher, with 91.4% or 7,871 individuals in the labor force. Within the labor force, individuals with high school diploma education have the highest percentage of unemployment, with 6.6% or 100 of them being unemployed.
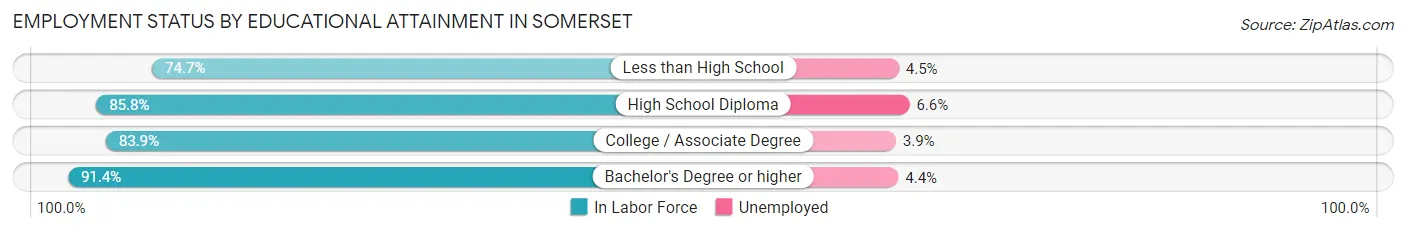
| Educational Attainment | In Labor Force | Unemployed |
| Less than High School | 290 (74.7%) | 17 (4.5%) |
| High School Diploma | 1,520 (85.8%) | 117 (6.6%) |
| College / Associate Degree | 2,322 (83.9%) | 108 (3.9%) |
| Bachelor's Degree or higher | 7,871 (91.4%) | 379 (4.4%) |
| Total | 11,996 (88.6%) | 623 (4.6%) |
Employment Occupations by Sex in Somerset
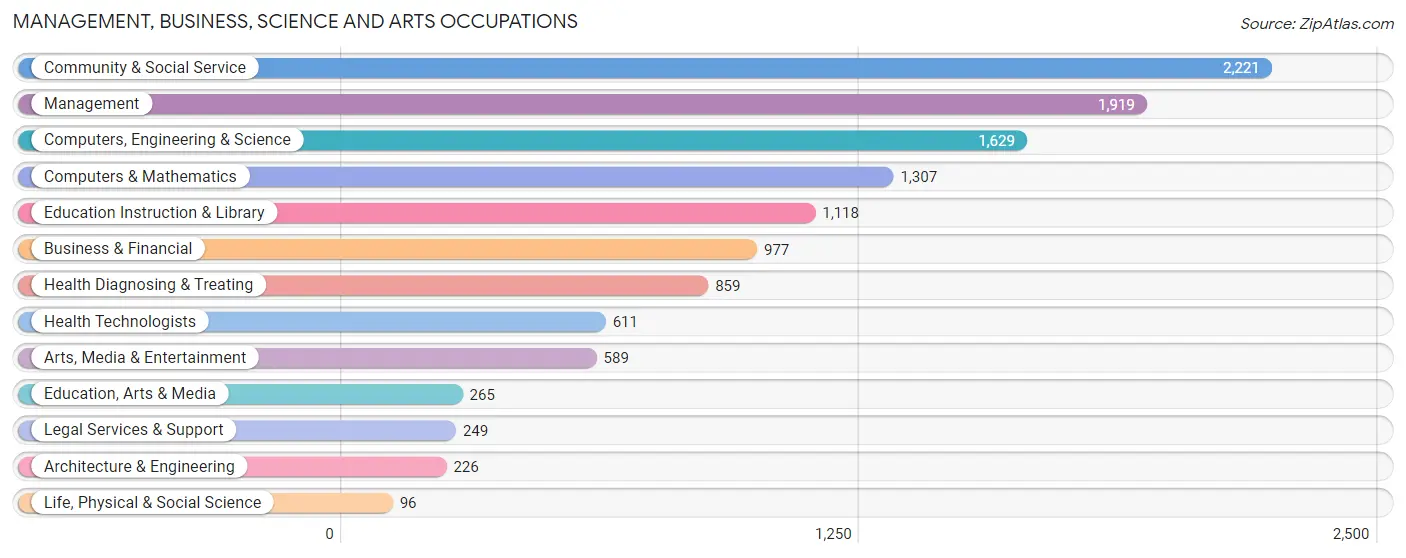
Management, Business, Science and Arts Occupations
The most common Management, Business, Science and Arts occupations in Somerset are Community & Social Service (2,221 | 16.6%), Management (1,919 | 14.3%), Computers, Engineering & Science (1,629 | 12.2%), Computers & Mathematics (1,307 | 9.8%), and Education Instruction & Library (1,118 | 8.4%).
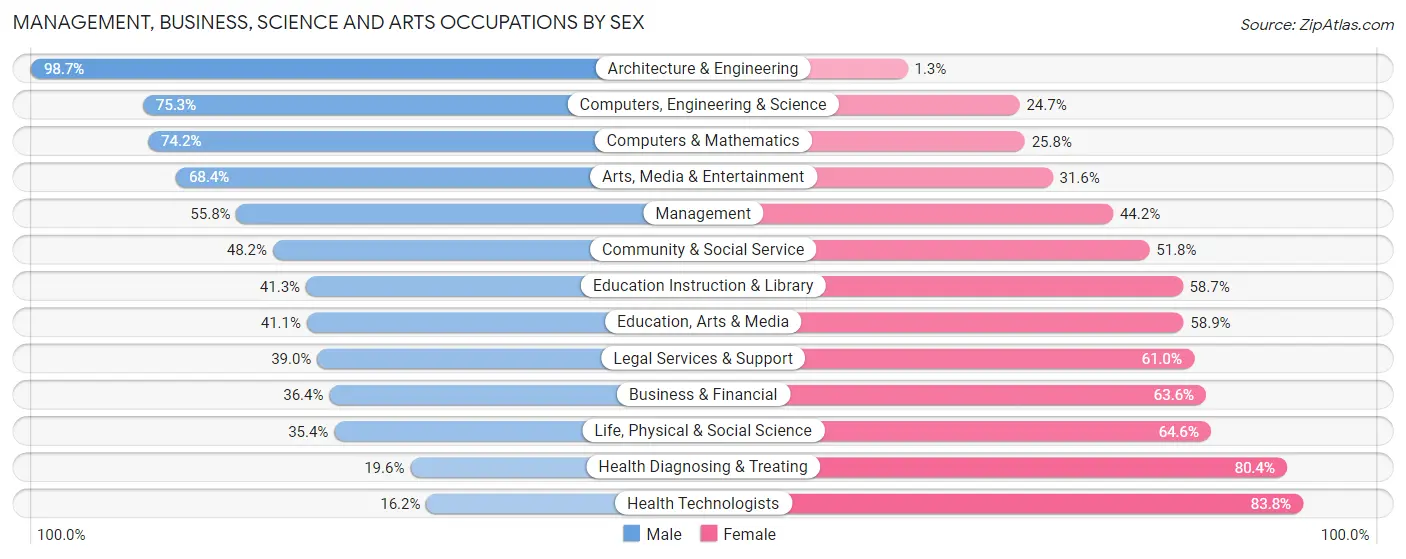
Management, Business, Science and Arts Occupations by Sex
Within the Management, Business, Science and Arts occupations in Somerset, the most male-oriented occupations are Architecture & Engineering (98.7%), Computers, Engineering & Science (75.3%), and Computers & Mathematics (74.2%), while the most female-oriented occupations are Health Technologists (83.8%), Health Diagnosing & Treating (80.4%), and Life, Physical & Social Science (64.6%).
| Occupation | Male | Female |
| Management | 1,071 (55.8%) | 848 (44.2%) |
| Business & Financial | 356 (36.4%) | 621 (63.6%) |
| Computers, Engineering & Science | 1,227 (75.3%) | 402 (24.7%) |
| Computers & Mathematics | 970 (74.2%) | 337 (25.8%) |
| Architecture & Engineering | 223 (98.7%) | 3 (1.3%) |
| Life, Physical & Social Science | 34 (35.4%) | 62 (64.6%) |
| Community & Social Service | 1,071 (48.2%) | 1,150 (51.8%) |
| Education, Arts & Media | 109 (41.1%) | 156 (58.9%) |
| Legal Services & Support | 97 (39.0%) | 152 (61.0%) |
| Education Instruction & Library | 462 (41.3%) | 656 (58.7%) |
| Arts, Media & Entertainment | 403 (68.4%) | 186 (31.6%) |
| Health Diagnosing & Treating | 168 (19.6%) | 691 (80.4%) |
| Health Technologists | 99 (16.2%) | 512 (83.8%) |
| Total (Category) | 3,893 (51.2%) | 3,712 (48.8%) |
| Total (Overall) | 7,210 (53.9%) | 6,161 (46.1%) |
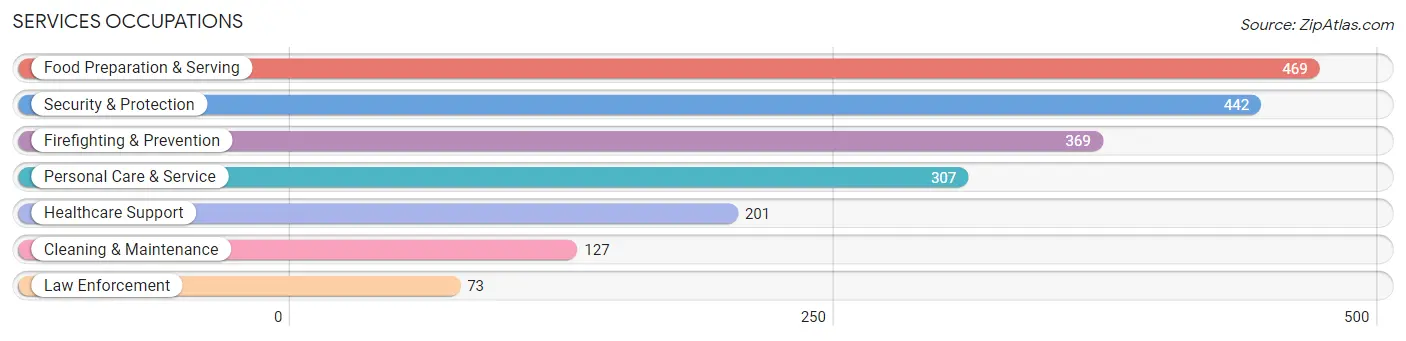
Services Occupations
The most common Services occupations in Somerset are Food Preparation & Serving (469 | 3.5%), Security & Protection (442 | 3.3%), Firefighting & Prevention (369 | 2.8%), Personal Care & Service (307 | 2.3%), and Healthcare Support (201 | 1.5%).
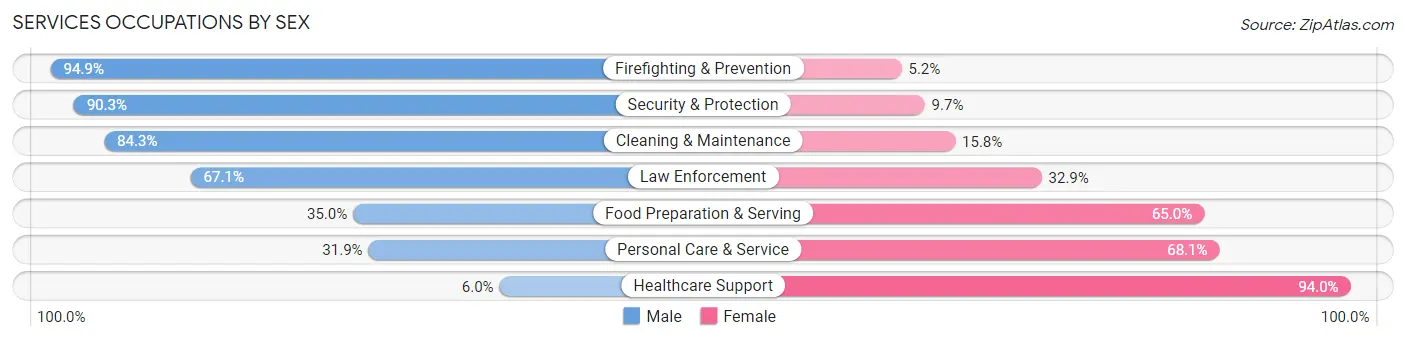
Services Occupations by Sex
Within the Services occupations in Somerset, the most male-oriented occupations are Firefighting & Prevention (94.9%), Security & Protection (90.3%), and Cleaning & Maintenance (84.3%), while the most female-oriented occupations are Healthcare Support (94.0%), Personal Care & Service (68.1%), and Food Preparation & Serving (65.0%).
| Occupation | Male | Female |
| Healthcare Support | 12 (6.0%) | 189 (94.0%) |
| Security & Protection | 399 (90.3%) | 43 (9.7%) |
| Firefighting & Prevention | 350 (94.9%) | 19 (5.1%) |
| Law Enforcement | 49 (67.1%) | 24 (32.9%) |
| Food Preparation & Serving | 164 (35.0%) | 305 (65.0%) |
| Cleaning & Maintenance | 107 (84.3%) | 20 (15.8%) |
| Personal Care & Service | 98 (31.9%) | 209 (68.1%) |
| Total (Category) | 780 (50.4%) | 766 (49.5%) |
| Total (Overall) | 7,210 (53.9%) | 6,161 (46.1%) |
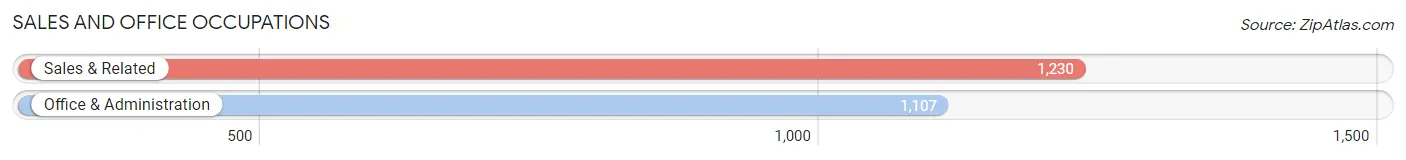
Sales and Office Occupations
The most common Sales and Office occupations in Somerset are Sales & Related (1,230 | 9.2%), and Office & Administration (1,107 | 8.3%).
Sales and Office Occupations by Sex
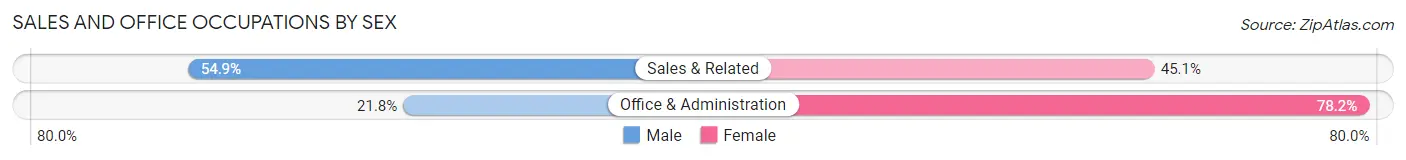
| Occupation | Male | Female |
| Sales & Related | 675 (54.9%) | 555 (45.1%) |
| Office & Administration | 241 (21.8%) | 866 (78.2%) |
| Total (Category) | 916 (39.2%) | 1,421 (60.8%) |
| Total (Overall) | 7,210 (53.9%) | 6,161 (46.1%) |
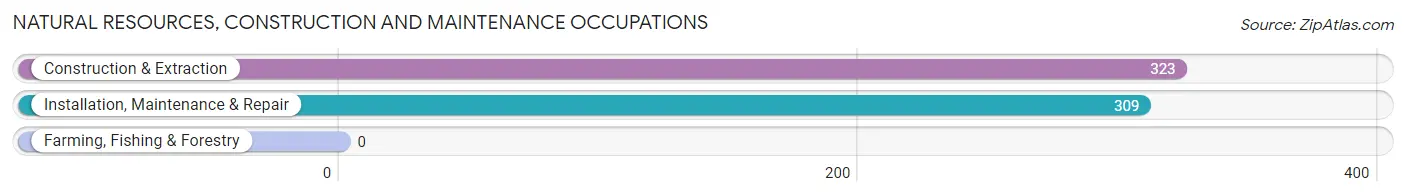
Natural Resources, Construction and Maintenance Occupations
The most common Natural Resources, Construction and Maintenance occupations in Somerset are Construction & Extraction (323 | 2.4%), and Installation, Maintenance & Repair (309 | 2.3%).
Natural Resources, Construction and Maintenance Occupations by Sex
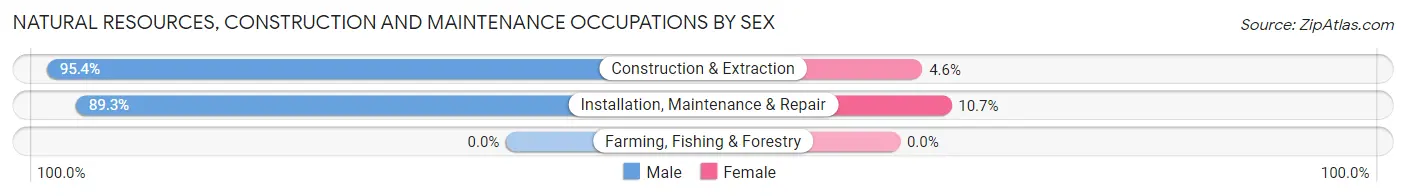
| Occupation | Male | Female |
| Farming, Fishing & Forestry | 0 (0.0%) | 0 (0.0%) |
| Construction & Extraction | 308 (95.4%) | 15 (4.6%) |
| Installation, Maintenance & Repair | 276 (89.3%) | 33 (10.7%) |
| Total (Category) | 584 (92.4%) | 48 (7.6%) |
| Total (Overall) | 7,210 (53.9%) | 6,161 (46.1%) |
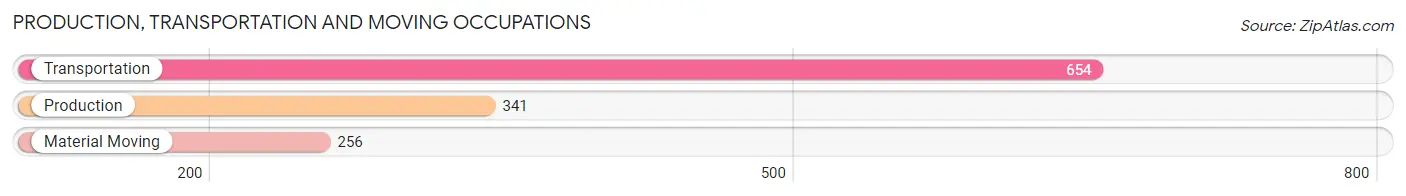
Production, Transportation and Moving Occupations
The most common Production, Transportation and Moving occupations in Somerset are Transportation (654 | 4.9%), Production (341 | 2.5%), and Material Moving (256 | 1.9%).
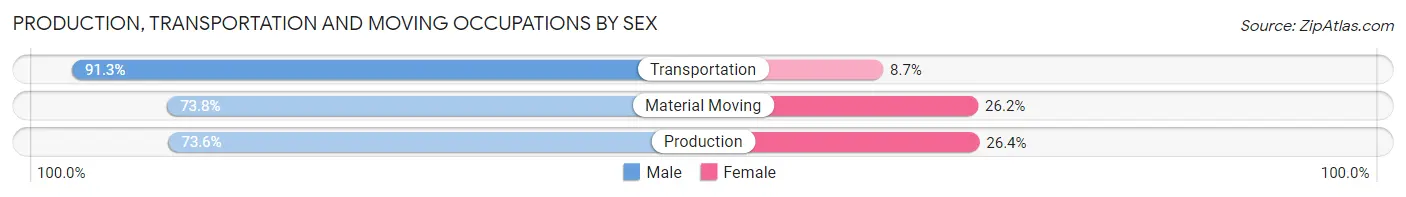
Production, Transportation and Moving Occupations by Sex
| Occupation | Male | Female |
| Production | 251 (73.6%) | 90 (26.4%) |
| Transportation | 597 (91.3%) | 57 (8.7%) |
| Material Moving | 189 (73.8%) | 67 (26.2%) |
| Total (Category) | 1,037 (82.9%) | 214 (17.1%) |
| Total (Overall) | 7,210 (53.9%) | 6,161 (46.1%) |
Employment Industries by Sex in Somerset
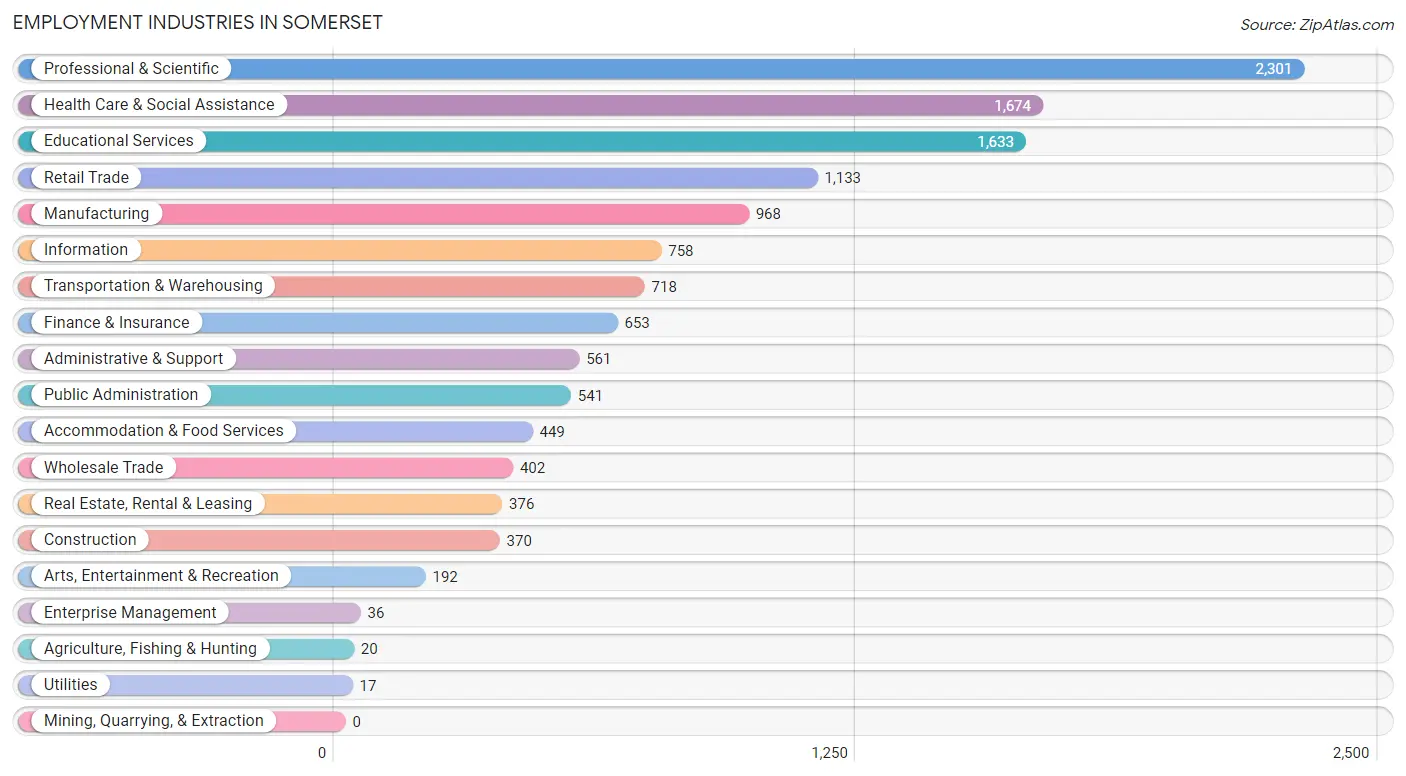
Employment Industries in Somerset
The major employment industries in Somerset include Professional & Scientific (2,301 | 17.2%), Health Care & Social Assistance (1,674 | 12.5%), Educational Services (1,633 | 12.2%), Retail Trade (1,133 | 8.5%), and Manufacturing (968 | 7.2%).
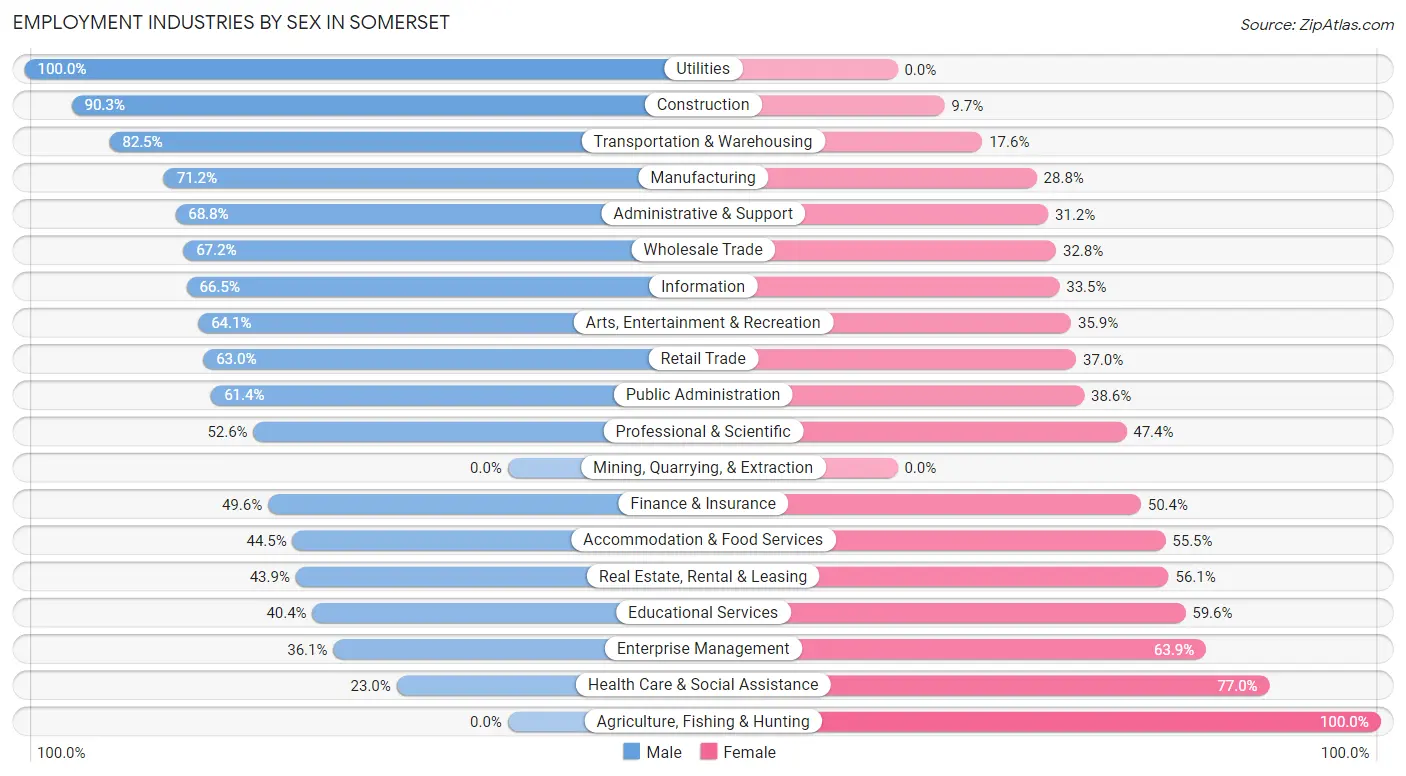
Employment Industries by Sex in Somerset
The Somerset industries that see more men than women are Utilities (100.0%), Construction (90.3%), and Transportation & Warehousing (82.5%), whereas the industries that tend to have a higher number of women are Agriculture, Fishing & Hunting (100.0%), Health Care & Social Assistance (77.0%), and Enterprise Management (63.9%).
| Industry | Male | Female |
| Agriculture, Fishing & Hunting | 0 (0.0%) | 20 (100.0%) |
| Mining, Quarrying, & Extraction | 0 (0.0%) | 0 (0.0%) |
| Construction | 334 (90.3%) | 36 (9.7%) |
| Manufacturing | 689 (71.2%) | 279 (28.8%) |
| Wholesale Trade | 270 (67.2%) | 132 (32.8%) |
| Retail Trade | 714 (63.0%) | 419 (37.0%) |
| Transportation & Warehousing | 592 (82.5%) | 126 (17.5%) |
| Utilities | 17 (100.0%) | 0 (0.0%) |
| Information | 504 (66.5%) | 254 (33.5%) |
| Finance & Insurance | 324 (49.6%) | 329 (50.4%) |
| Real Estate, Rental & Leasing | 165 (43.9%) | 211 (56.1%) |
| Professional & Scientific | 1,211 (52.6%) | 1,090 (47.4%) |
| Enterprise Management | 13 (36.1%) | 23 (63.9%) |
| Administrative & Support | 386 (68.8%) | 175 (31.2%) |
| Educational Services | 660 (40.4%) | 973 (59.6%) |
| Health Care & Social Assistance | 385 (23.0%) | 1,289 (77.0%) |
| Arts, Entertainment & Recreation | 123 (64.1%) | 69 (35.9%) |
| Accommodation & Food Services | 200 (44.5%) | 249 (55.5%) |
| Public Administration | 332 (61.4%) | 209 (38.6%) |
| Total | 7,210 (53.9%) | 6,161 (46.1%) |
Education in Somerset
School Enrollment in Somerset
The most common levels of schooling among the 5,597 students in Somerset are college / undergraduate (1,424 | 25.4%), high school (1,149 | 20.5%), and elementary school (981 | 17.5%).
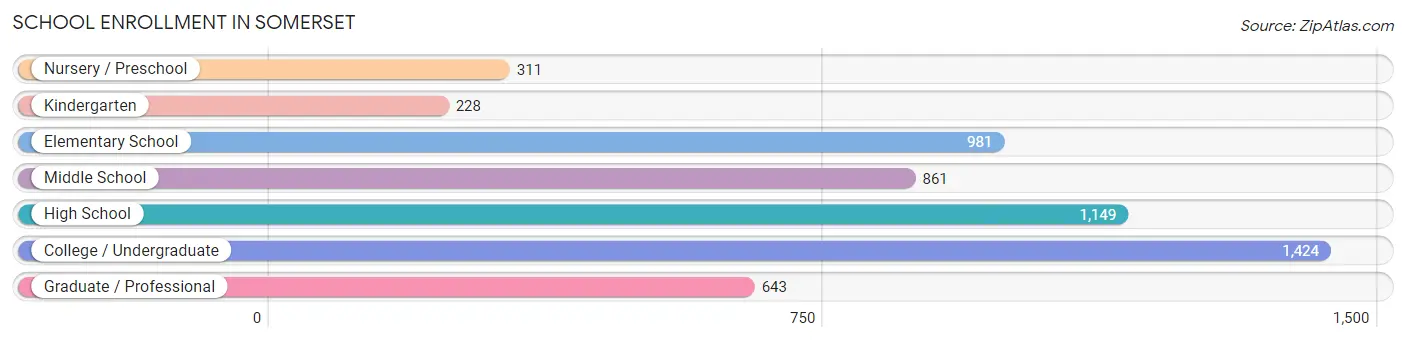
| School Level | # Students | % Students |
| Nursery / Preschool | 311 | 5.6% |
| Kindergarten | 228 | 4.1% |
| Elementary School | 981 | 17.5% |
| Middle School | 861 | 15.4% |
| High School | 1,149 | 20.5% |
| College / Undergraduate | 1,424 | 25.4% |
| Graduate / Professional | 643 | 11.5% |
| Total | 5,597 | 100.0% |
School Enrollment by Age by Funding Source in Somerset
Out of a total of 5,597 students who are enrolled in schools in Somerset, 951 (17.0%) attend a private institution, while the remaining 4,646 (83.0%) are enrolled in public schools. The age group of 3 to 4 year olds has the highest likelihood of being enrolled in private schools, with 86 (40.8% in the age bracket) enrolled. Conversely, the age group of 20 to 24 year olds has the lowest likelihood of being enrolled in a private school, with 945 (90.8% in the age bracket) attending a public institution.
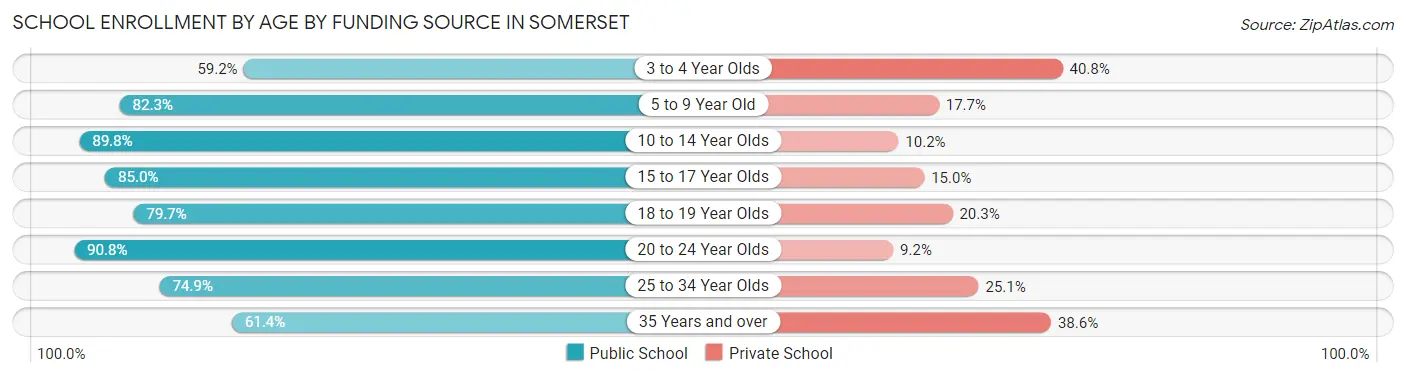
| Age Bracket | Public School | Private School |
| 3 to 4 Year Olds | 125 (59.2%) | 86 (40.8%) |
| 5 to 9 Year Old | 911 (82.3%) | 196 (17.7%) |
| 10 to 14 Year Olds | 1,164 (89.8%) | 132 (10.2%) |
| 15 to 17 Year Olds | 685 (85.0%) | 121 (15.0%) |
| 18 to 19 Year Olds | 291 (79.7%) | 74 (20.3%) |
| 20 to 24 Year Olds | 945 (90.8%) | 96 (9.2%) |
| 25 to 34 Year Olds | 298 (74.9%) | 100 (25.1%) |
| 35 Years and over | 229 (61.4%) | 144 (38.6%) |
| Total | 4,646 (83.0%) | 951 (17.0%) |
Educational Attainment by Field of Study in Somerset
Business (1,988 | 17.5%), engineering (1,222 | 10.8%), computers & mathematics (1,062 | 9.4%), science & technology (1,029 | 9.1%), and social sciences (909 | 8.0%) are the most common fields of study among 11,350 individuals in Somerset who have obtained a bachelor's degree or higher.
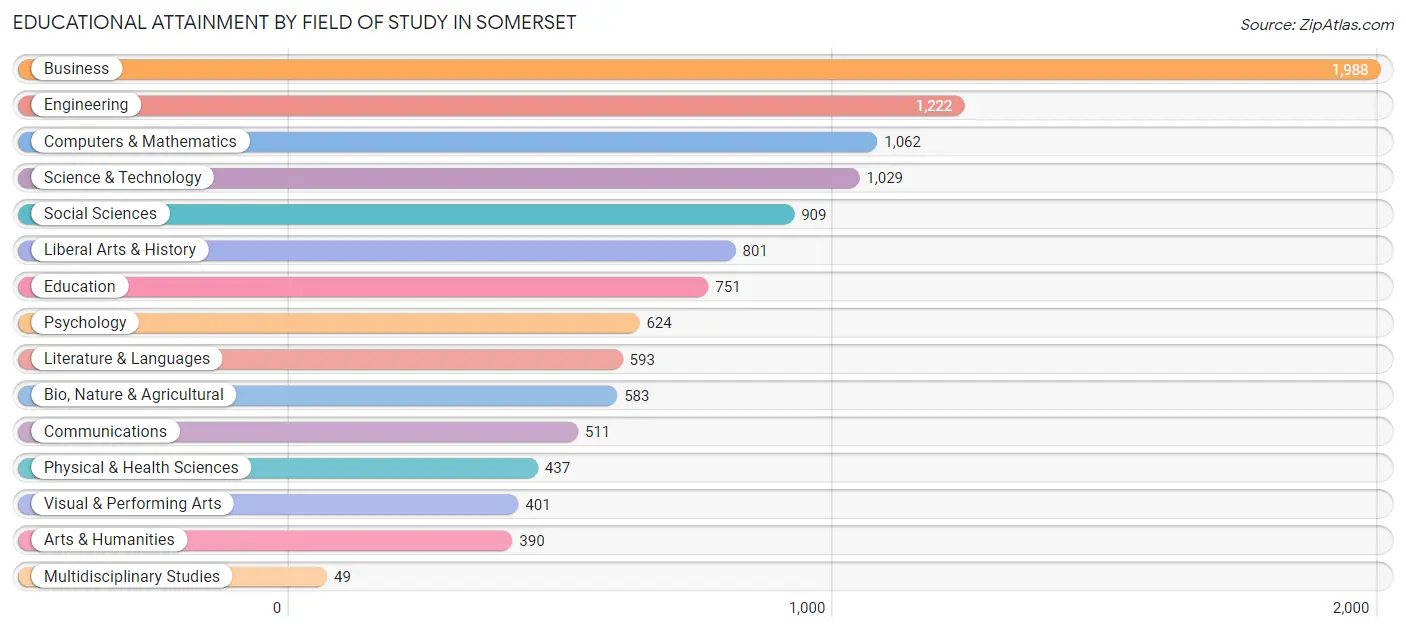
| Field of Study | # Graduates | % Graduates |
| Computers & Mathematics | 1,062 | 9.4% |
| Bio, Nature & Agricultural | 583 | 5.1% |
| Physical & Health Sciences | 437 | 3.8% |
| Psychology | 624 | 5.5% |
| Social Sciences | 909 | 8.0% |
| Engineering | 1,222 | 10.8% |
| Multidisciplinary Studies | 49 | 0.4% |
| Science & Technology | 1,029 | 9.1% |
| Business | 1,988 | 17.5% |
| Education | 751 | 6.6% |
| Literature & Languages | 593 | 5.2% |
| Liberal Arts & History | 801 | 7.1% |
| Visual & Performing Arts | 401 | 3.5% |
| Communications | 511 | 4.5% |
| Arts & Humanities | 390 | 3.4% |
| Total | 11,350 | 100.0% |
Transportation & Commute in Somerset
Vehicle Availability by Sex in Somerset
The most prevalent vehicle ownership categories in Somerset are males with 2 vehicles (3,383, accounting for 47.2%) and females with 2 vehicles (2,564, making up 55.3%).
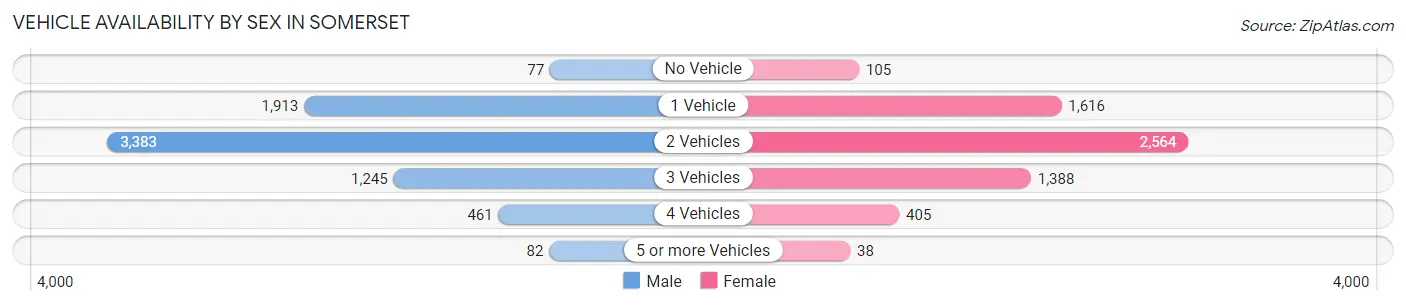
| Vehicles Available | Male | Female |
| No Vehicle | 77 (1.1%) | 105 (1.7%) |
| 1 Vehicle | 1,913 (26.7%) | 1,616 (26.4%) |
| 2 Vehicles | 3,383 (47.2%) | 2,564 (41.9%) |
| 3 Vehicles | 1,245 (17.4%) | 1,388 (22.7%) |
| 4 Vehicles | 461 (6.4%) | 405 (6.6%) |
| 5 or more Vehicles | 82 (1.1%) | 38 (0.6%) |
| Total | 7,161 (100.0%) | 6,116 (100.0%) |
Commute Time in Somerset
The most frequently occuring commute durations in Somerset are 30 to 34 minutes (1,788 commuters, 16.0%), 15 to 19 minutes (1,569 commuters, 14.0%), and 60 to 89 minutes (1,333 commuters, 11.9%).
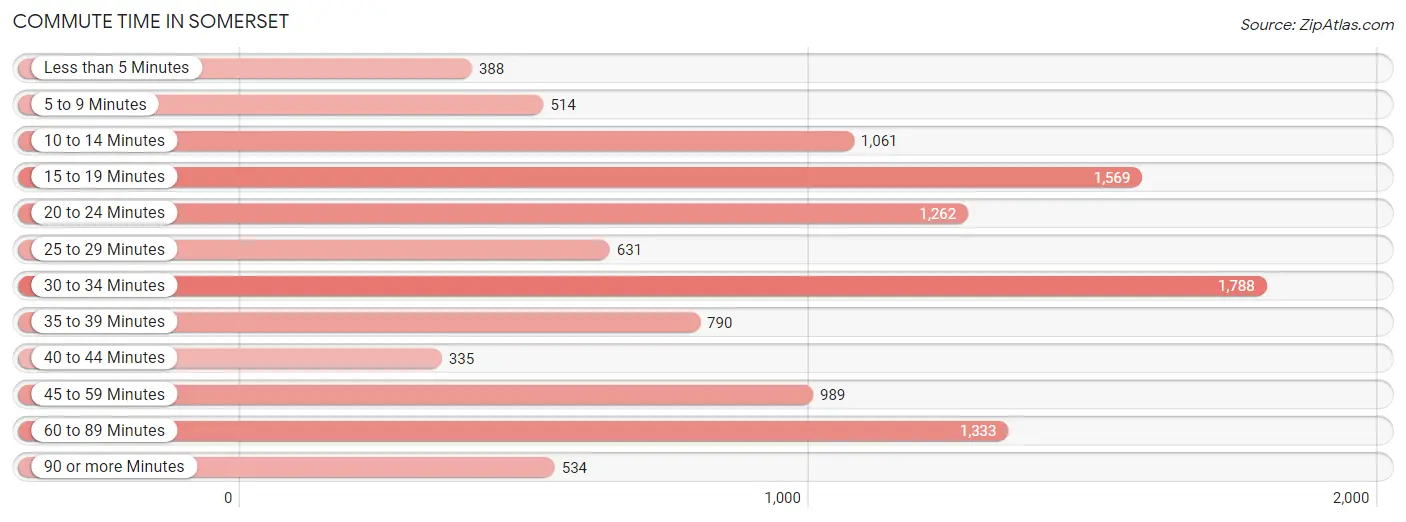
| Commute Time | # Commuters | % Commuters |
| Less than 5 Minutes | 388 | 3.5% |
| 5 to 9 Minutes | 514 | 4.6% |
| 10 to 14 Minutes | 1,061 | 9.5% |
| 15 to 19 Minutes | 1,569 | 14.0% |
| 20 to 24 Minutes | 1,262 | 11.3% |
| 25 to 29 Minutes | 631 | 5.6% |
| 30 to 34 Minutes | 1,788 | 16.0% |
| 35 to 39 Minutes | 790 | 7.1% |
| 40 to 44 Minutes | 335 | 3.0% |
| 45 to 59 Minutes | 989 | 8.8% |
| 60 to 89 Minutes | 1,333 | 11.9% |
| 90 or more Minutes | 534 | 4.8% |
Commute Time by Sex in Somerset
The most common commute times in Somerset are 60 to 89 minutes (876 commuters, 14.5%) for males and 30 to 34 minutes (1,065 commuters, 20.6%) for females.
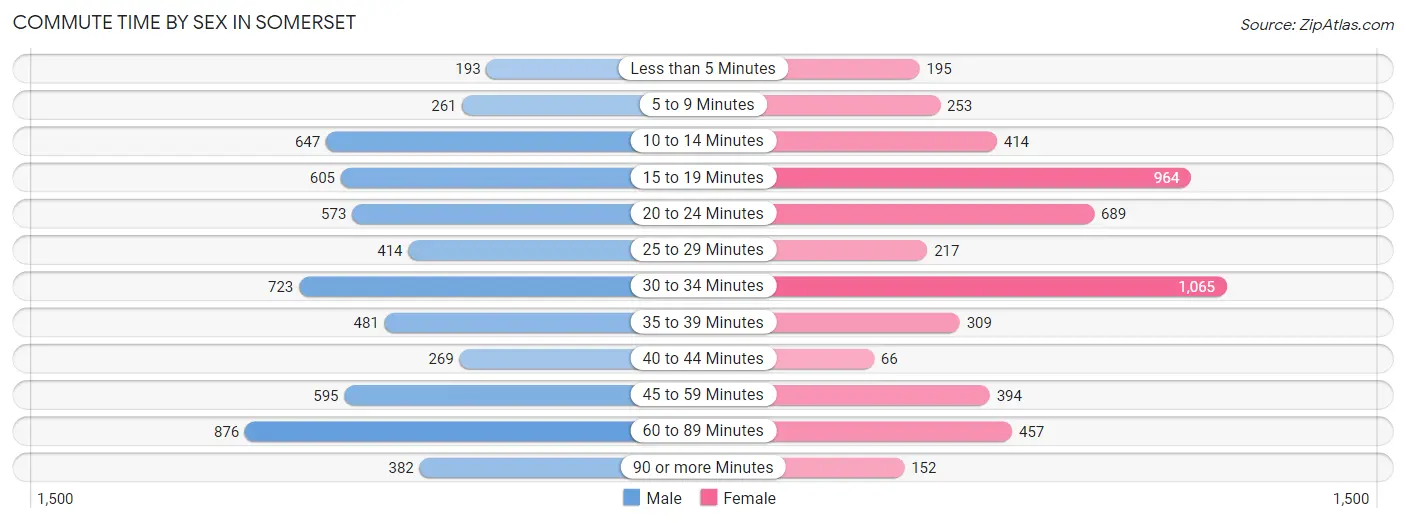
| Commute Time | Male | Female |
| Less than 5 Minutes | 193 (3.2%) | 195 (3.8%) |
| 5 to 9 Minutes | 261 (4.3%) | 253 (4.9%) |
| 10 to 14 Minutes | 647 (10.7%) | 414 (8.0%) |
| 15 to 19 Minutes | 605 (10.1%) | 964 (18.6%) |
| 20 to 24 Minutes | 573 (9.5%) | 689 (13.3%) |
| 25 to 29 Minutes | 414 (6.9%) | 217 (4.2%) |
| 30 to 34 Minutes | 723 (12.0%) | 1,065 (20.6%) |
| 35 to 39 Minutes | 481 (8.0%) | 309 (6.0%) |
| 40 to 44 Minutes | 269 (4.5%) | 66 (1.3%) |
| 45 to 59 Minutes | 595 (9.9%) | 394 (7.6%) |
| 60 to 89 Minutes | 876 (14.5%) | 457 (8.8%) |
| 90 or more Minutes | 382 (6.4%) | 152 (2.9%) |
Time of Departure to Work by Sex in Somerset
The most frequent times of departure to work in Somerset are 7:00 AM to 7:29 AM (936, 15.5%) for males and 8:30 AM to 8:59 AM (769, 14.9%) for females.
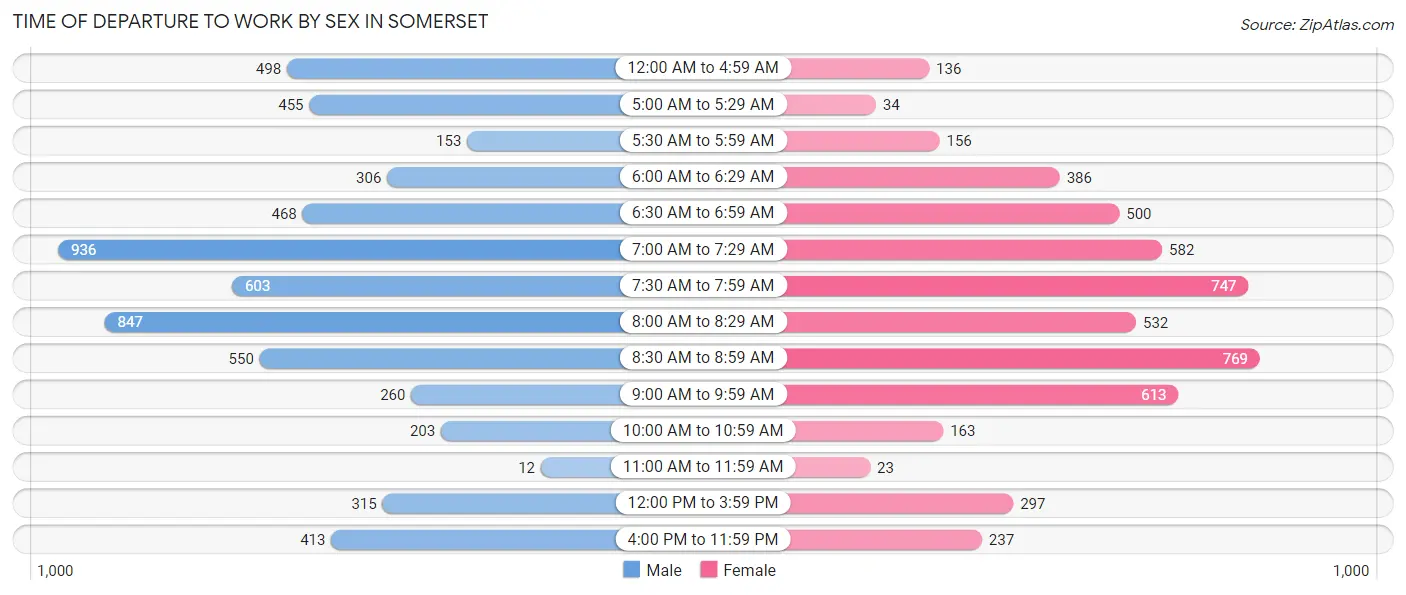
| Time of Departure | Male | Female |
| 12:00 AM to 4:59 AM | 498 (8.3%) | 136 (2.6%) |
| 5:00 AM to 5:29 AM | 455 (7.6%) | 34 (0.7%) |
| 5:30 AM to 5:59 AM | 153 (2.5%) | 156 (3.0%) |
| 6:00 AM to 6:29 AM | 306 (5.1%) | 386 (7.5%) |
| 6:30 AM to 6:59 AM | 468 (7.8%) | 500 (9.7%) |
| 7:00 AM to 7:29 AM | 936 (15.5%) | 582 (11.3%) |
| 7:30 AM to 7:59 AM | 603 (10.0%) | 747 (14.4%) |
| 8:00 AM to 8:29 AM | 847 (14.1%) | 532 (10.3%) |
| 8:30 AM to 8:59 AM | 550 (9.1%) | 769 (14.9%) |
| 9:00 AM to 9:59 AM | 260 (4.3%) | 613 (11.8%) |
| 10:00 AM to 10:59 AM | 203 (3.4%) | 163 (3.2%) |
| 11:00 AM to 11:59 AM | 12 (0.2%) | 23 (0.4%) |
| 12:00 PM to 3:59 PM | 315 (5.2%) | 297 (5.7%) |
| 4:00 PM to 11:59 PM | 413 (6.9%) | 237 (4.6%) |
| Total | 6,019 (100.0%) | 5,175 (100.0%) |
Housing Occupancy in Somerset
Occupancy by Ownership in Somerset
Of the total 9,981 dwellings in Somerset, owner-occupied units account for 7,388 (74.0%), while renter-occupied units make up 2,593 (26.0%).
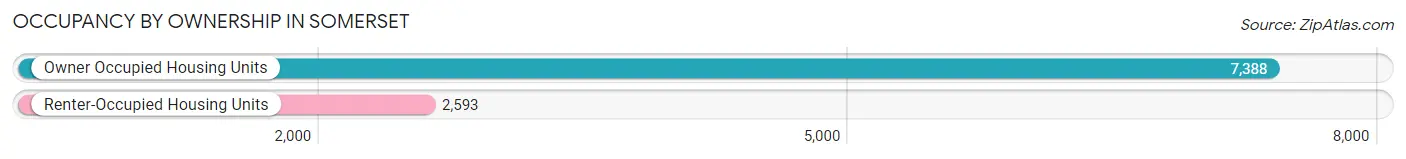
| Occupancy | # Housing Units | % Housing Units |
| Owner Occupied Housing Units | 7,388 | 74.0% |
| Renter-Occupied Housing Units | 2,593 | 26.0% |
| Total Occupied Housing Units | 9,981 | 100.0% |
Occupancy by Household Size in Somerset
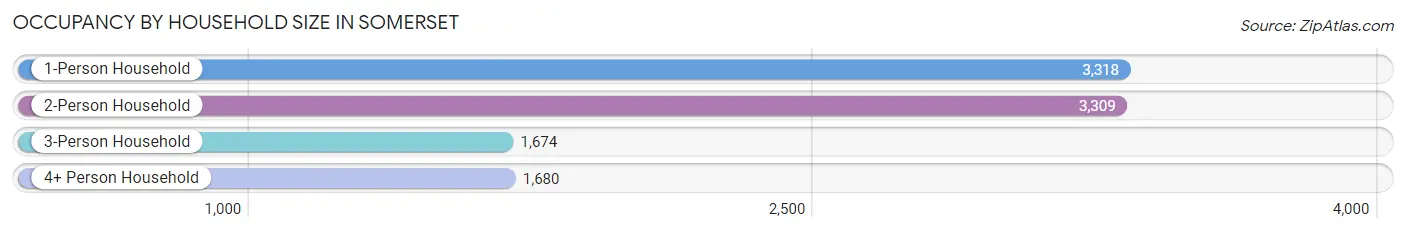
| Household Size | # Housing Units | % Housing Units |
| 1-Person Household | 3,318 | 33.2% |
| 2-Person Household | 3,309 | 33.2% |
| 3-Person Household | 1,674 | 16.8% |
| 4+ Person Household | 1,680 | 16.8% |
| Total Housing Units | 9,981 | 100.0% |
Occupancy by Ownership by Household Size in Somerset
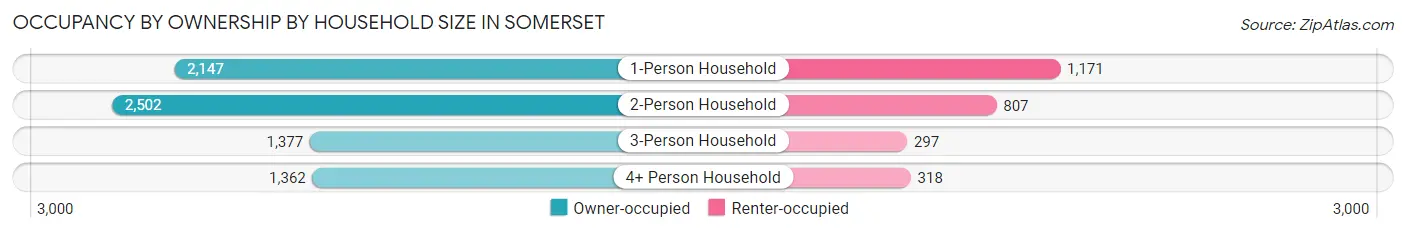
| Household Size | Owner-occupied | Renter-occupied |
| 1-Person Household | 2,147 (64.7%) | 1,171 (35.3%) |
| 2-Person Household | 2,502 (75.6%) | 807 (24.4%) |
| 3-Person Household | 1,377 (82.3%) | 297 (17.7%) |
| 4+ Person Household | 1,362 (81.1%) | 318 (18.9%) |
| Total Housing Units | 7,388 (74.0%) | 2,593 (26.0%) |
Occupancy by Educational Attainment in Somerset
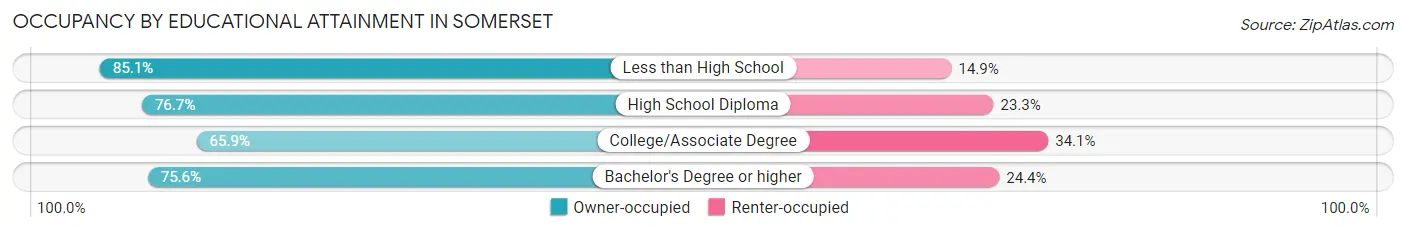
| Household Size | Owner-occupied | Renter-occupied |
| Less than High School | 148 (85.1%) | 26 (14.9%) |
| High School Diploma | 1,127 (76.7%) | 342 (23.3%) |
| College/Associate Degree | 1,276 (65.9%) | 661 (34.1%) |
| Bachelor's Degree or higher | 4,837 (75.6%) | 1,564 (24.4%) |
Occupancy by Age of Householder in Somerset
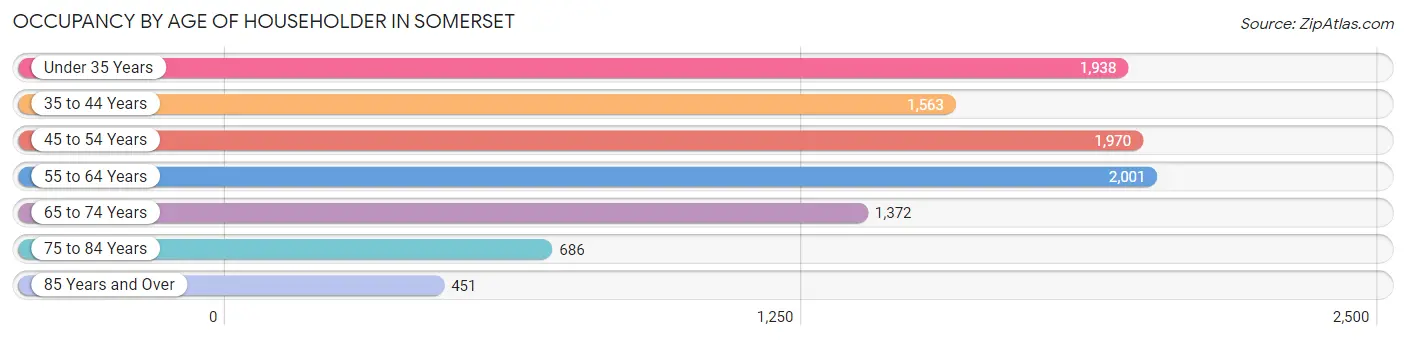
| Age Bracket | # Households | % Households |
| Under 35 Years | 1,938 | 19.4% |
| 35 to 44 Years | 1,563 | 15.7% |
| 45 to 54 Years | 1,970 | 19.7% |
| 55 to 64 Years | 2,001 | 20.1% |
| 65 to 74 Years | 1,372 | 13.8% |
| 75 to 84 Years | 686 | 6.9% |
| 85 Years and Over | 451 | 4.5% |
| Total | 9,981 | 100.0% |
Housing Finances in Somerset
Median Income by Occupancy in Somerset
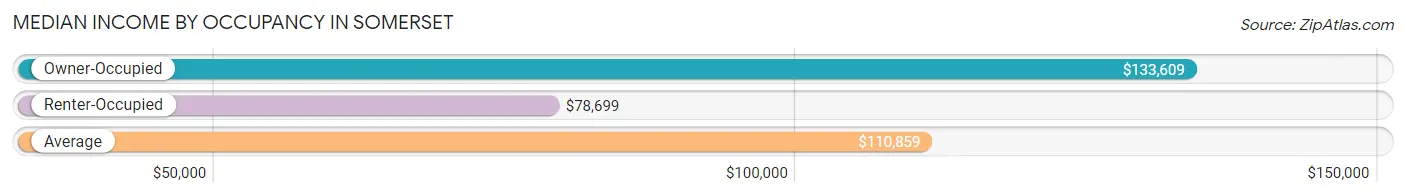
| Occupancy Type | # Households | Median Income |
| Owner-Occupied | 7,388 (74.0%) | $133,609 |
| Renter-Occupied | 2,593 (26.0%) | $78,699 |
| Average | 9,981 (100.0%) | $110,859 |
Occupancy by Householder Income Bracket in Somerset
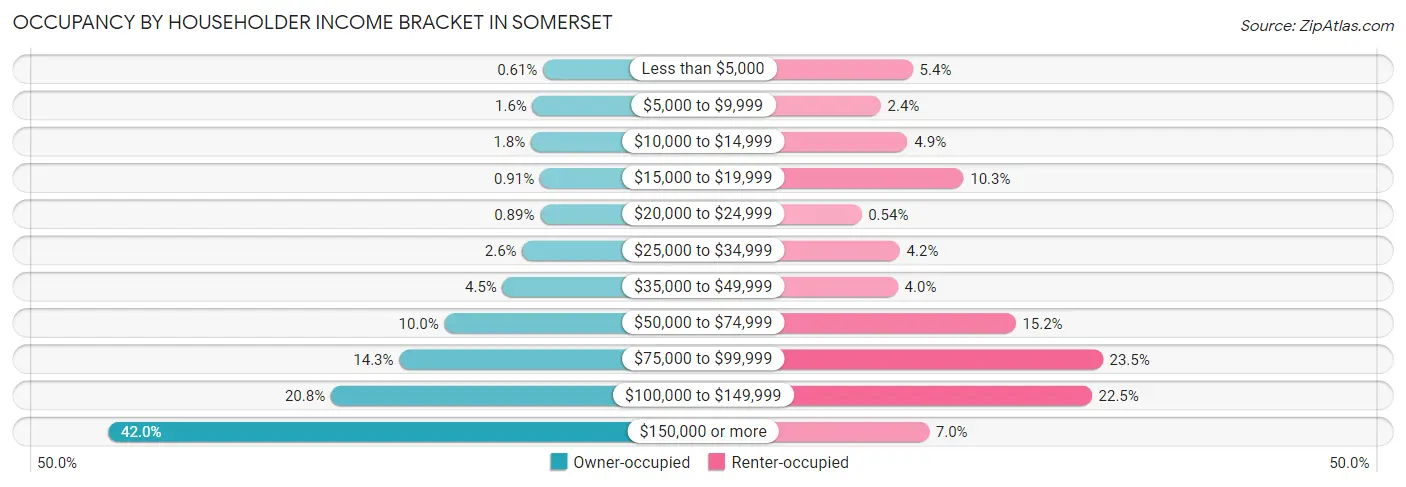
| Income Bracket | Owner-occupied | Renter-occupied |
| Less than $5,000 | 45 (0.6%) | 141 (5.4%) |
| $5,000 to $9,999 | 119 (1.6%) | 62 (2.4%) |
| $10,000 to $14,999 | 130 (1.8%) | 128 (4.9%) |
| $15,000 to $19,999 | 67 (0.9%) | 266 (10.3%) |
| $20,000 to $24,999 | 66 (0.9%) | 14 (0.5%) |
| $25,000 to $34,999 | 191 (2.6%) | 109 (4.2%) |
| $35,000 to $49,999 | 330 (4.5%) | 104 (4.0%) |
| $50,000 to $74,999 | 739 (10.0%) | 395 (15.2%) |
| $75,000 to $99,999 | 1,057 (14.3%) | 610 (23.5%) |
| $100,000 to $149,999 | 1,538 (20.8%) | 583 (22.5%) |
| $150,000 or more | 3,106 (42.0%) | 181 (7.0%) |
| Total | 7,388 (100.0%) | 2,593 (100.0%) |
Monthly Housing Cost Tiers in Somerset
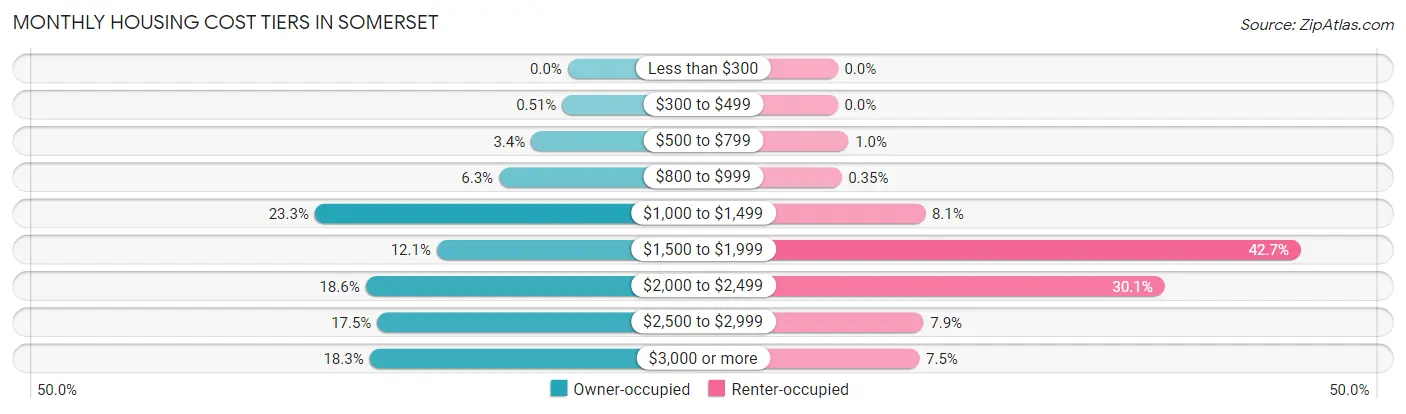
| Monthly Cost | Owner-occupied | Renter-occupied |
| Less than $300 | 0 (0.0%) | 0 (0.0%) |
| $300 to $499 | 38 (0.5%) | 0 (0.0%) |
| $500 to $799 | 250 (3.4%) | 26 (1.0%) |
| $800 to $999 | 468 (6.3%) | 9 (0.4%) |
| $1,000 to $1,499 | 1,721 (23.3%) | 209 (8.1%) |
| $1,500 to $1,999 | 891 (12.1%) | 1,106 (42.6%) |
| $2,000 to $2,499 | 1,376 (18.6%) | 781 (30.1%) |
| $2,500 to $2,999 | 1,296 (17.5%) | 205 (7.9%) |
| $3,000 or more | 1,348 (18.2%) | 195 (7.5%) |
| Total | 7,388 (100.0%) | 2,593 (100.0%) |
Physical Housing Characteristics in Somerset
Housing Structures in Somerset
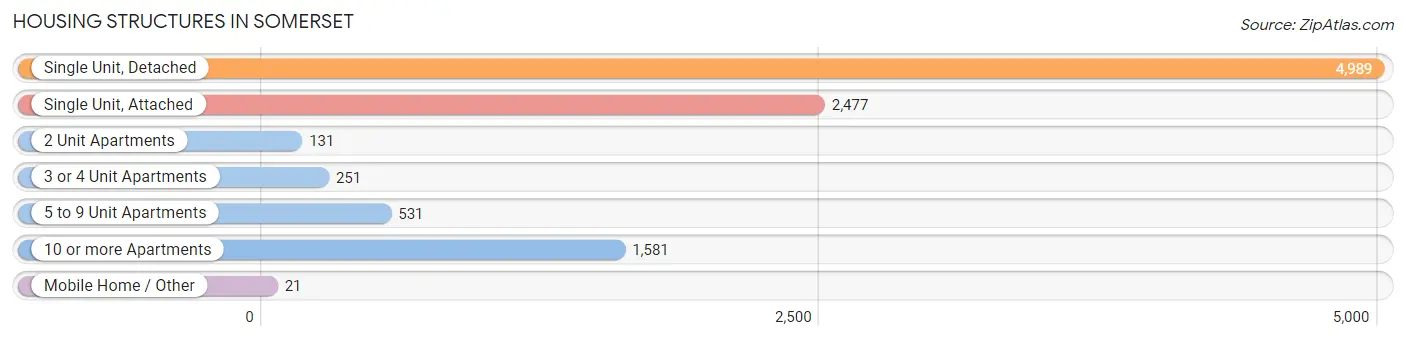
| Structure Type | # Housing Units | % Housing Units |
| Single Unit, Detached | 4,989 | 50.0% |
| Single Unit, Attached | 2,477 | 24.8% |
| 2 Unit Apartments | 131 | 1.3% |
| 3 or 4 Unit Apartments | 251 | 2.5% |
| 5 to 9 Unit Apartments | 531 | 5.3% |
| 10 or more Apartments | 1,581 | 15.8% |
| Mobile Home / Other | 21 | 0.2% |
| Total | 9,981 | 100.0% |
Housing Structures by Occupancy in Somerset
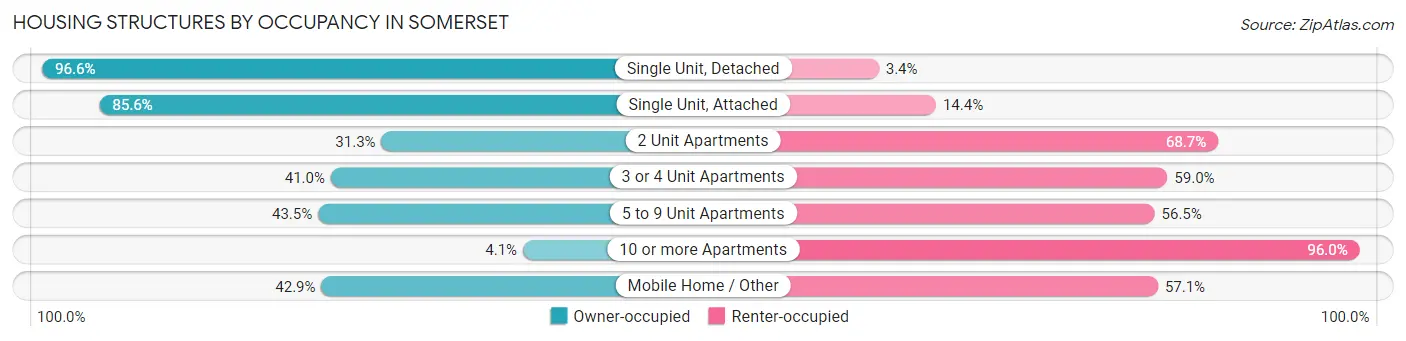
| Structure Type | Owner-occupied | Renter-occupied |
| Single Unit, Detached | 4,820 (96.6%) | 169 (3.4%) |
| Single Unit, Attached | 2,120 (85.6%) | 357 (14.4%) |
| 2 Unit Apartments | 41 (31.3%) | 90 (68.7%) |
| 3 or 4 Unit Apartments | 103 (41.0%) | 148 (59.0%) |
| 5 to 9 Unit Apartments | 231 (43.5%) | 300 (56.5%) |
| 10 or more Apartments | 64 (4.1%) | 1,517 (96.0%) |
| Mobile Home / Other | 9 (42.9%) | 12 (57.1%) |
| Total | 7,388 (74.0%) | 2,593 (26.0%) |
Housing Structures by Number of Rooms in Somerset
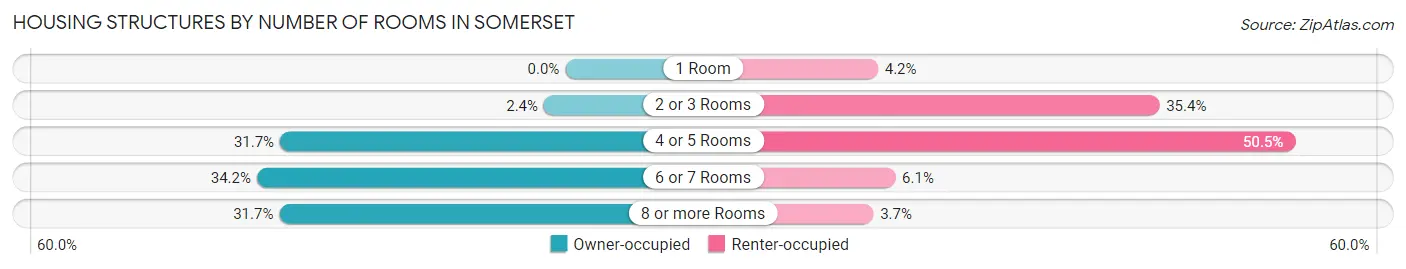
| Number of Rooms | Owner-occupied | Renter-occupied |
| 1 Room | 0 (0.0%) | 109 (4.2%) |
| 2 or 3 Rooms | 175 (2.4%) | 919 (35.4%) |
| 4 or 5 Rooms | 2,339 (31.7%) | 1,310 (50.5%) |
| 6 or 7 Rooms | 2,529 (34.2%) | 159 (6.1%) |
| 8 or more Rooms | 2,345 (31.7%) | 96 (3.7%) |
| Total | 7,388 (100.0%) | 2,593 (100.0%) |
Housing Structure by Heating Type in Somerset
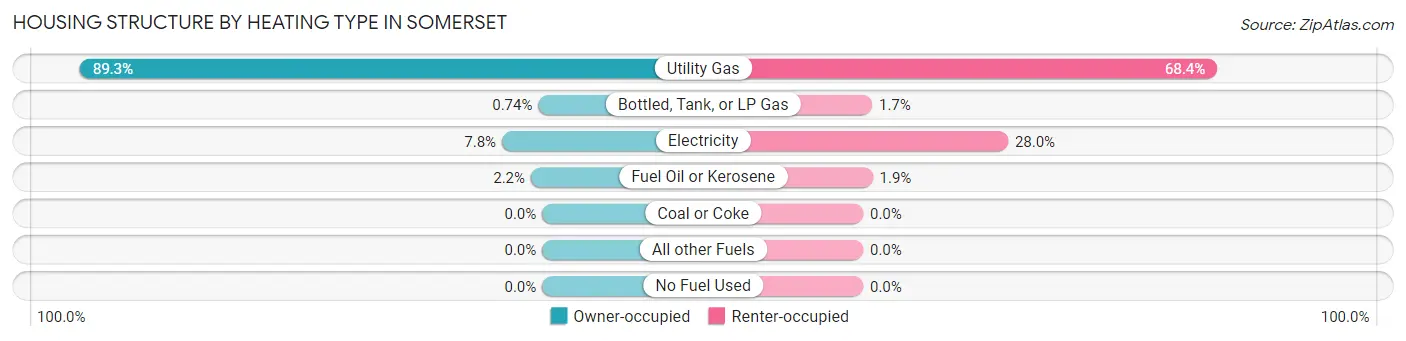
| Heating Type | Owner-occupied | Renter-occupied |
| Utility Gas | 6,600 (89.3%) | 1,774 (68.4%) |
| Bottled, Tank, or LP Gas | 55 (0.7%) | 45 (1.7%) |
| Electricity | 573 (7.8%) | 726 (28.0%) |
| Fuel Oil or Kerosene | 160 (2.2%) | 48 (1.8%) |
| Coal or Coke | 0 (0.0%) | 0 (0.0%) |
| All other Fuels | 0 (0.0%) | 0 (0.0%) |
| No Fuel Used | 0 (0.0%) | 0 (0.0%) |
| Total | 7,388 (100.0%) | 2,593 (100.0%) |
Household Vehicle Usage in Somerset
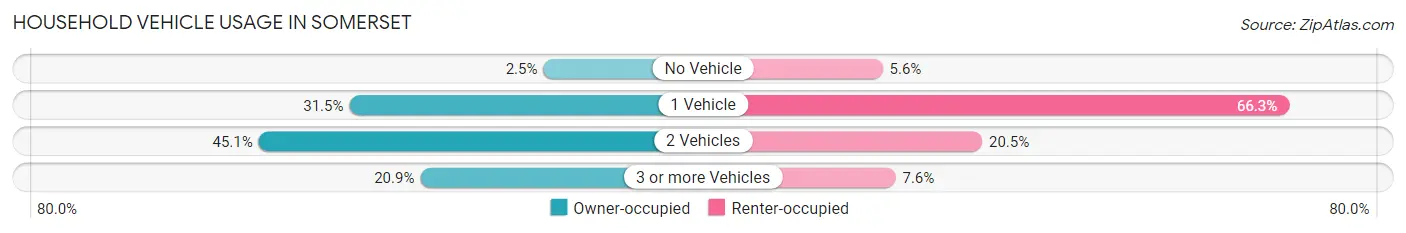
| Vehicles per Household | Owner-occupied | Renter-occupied |
| No Vehicle | 187 (2.5%) | 146 (5.6%) |
| 1 Vehicle | 2,327 (31.5%) | 1,720 (66.3%) |
| 2 Vehicles | 3,329 (45.1%) | 531 (20.5%) |
| 3 or more Vehicles | 1,545 (20.9%) | 196 (7.6%) |
| Total | 7,388 (100.0%) | 2,593 (100.0%) |
Real Estate & Mortgages in Somerset
Real Estate and Mortgage Overview in Somerset
| Characteristic | Without Mortgage | With Mortgage |
| Housing Units | 2,303 | 5,085 |
| Median Property Value | $377,500 | $383,600 |
| Median Household Income | $98,705 | $2,472 |
| Monthly Housing Costs | $1,108 | $1,328 |
| Real Estate Taxes | $8,008 | $9 |
Property Value by Mortgage Status in Somerset
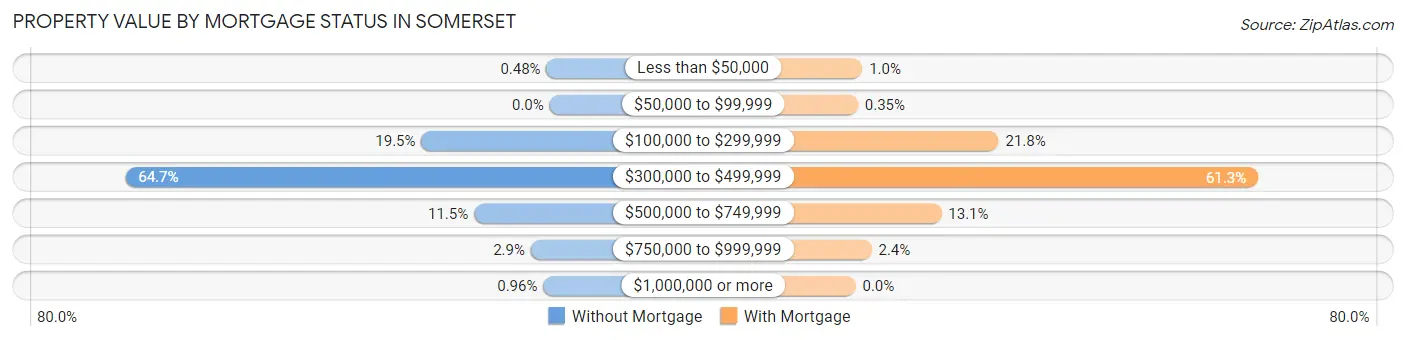
| Property Value | Without Mortgage | With Mortgage |
| Less than $50,000 | 11 (0.5%) | 52 (1.0%) |
| $50,000 to $99,999 | 0 (0.0%) | 18 (0.4%) |
| $100,000 to $299,999 | 450 (19.5%) | 1,108 (21.8%) |
| $300,000 to $499,999 | 1,489 (64.6%) | 3,118 (61.3%) |
| $500,000 to $749,999 | 265 (11.5%) | 665 (13.1%) |
| $750,000 to $999,999 | 66 (2.9%) | 124 (2.4%) |
| $1,000,000 or more | 22 (1.0%) | 0 (0.0%) |
| Total | 2,303 (100.0%) | 5,085 (100.0%) |
Household Income by Mortgage Status in Somerset
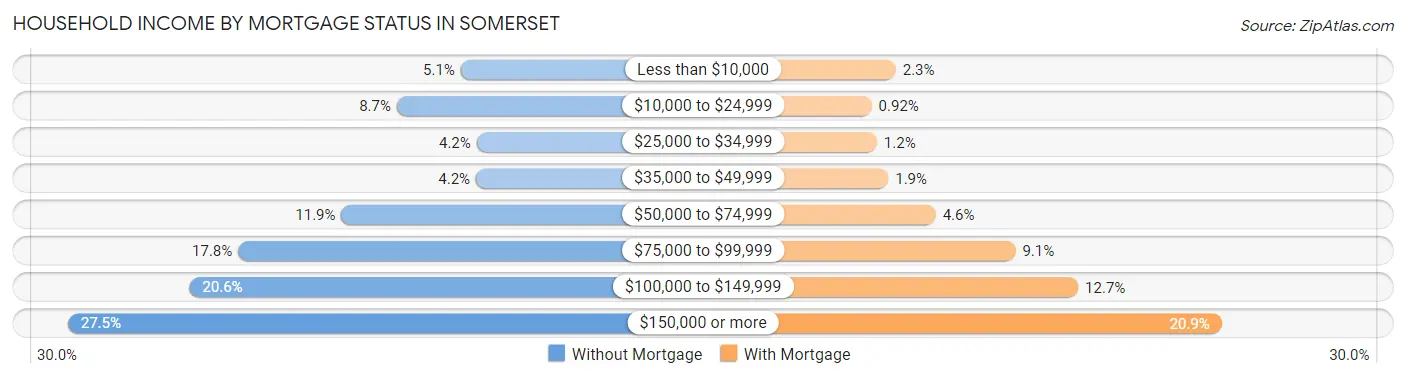
| Household Income | Without Mortgage | With Mortgage |
| Less than $10,000 | 117 (5.1%) | 117 (2.3%) |
| $10,000 to $24,999 | 201 (8.7%) | 47 (0.9%) |
| $25,000 to $34,999 | 96 (4.2%) | 62 (1.2%) |
| $35,000 to $49,999 | 97 (4.2%) | 95 (1.9%) |
| $50,000 to $74,999 | 274 (11.9%) | 233 (4.6%) |
| $75,000 to $99,999 | 410 (17.8%) | 465 (9.1%) |
| $100,000 to $149,999 | 474 (20.6%) | 647 (12.7%) |
| $150,000 or more | 634 (27.5%) | 1,064 (20.9%) |
| Total | 2,303 (100.0%) | 5,085 (100.0%) |
Property Value to Household Income Ratio in Somerset
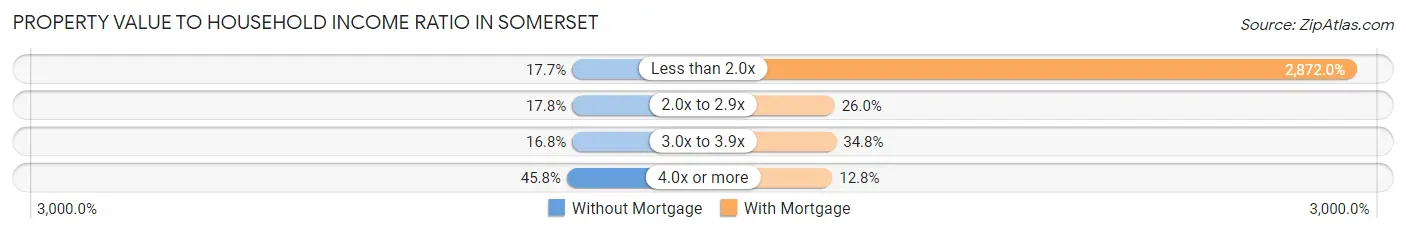
| Value-to-Income Ratio | Without Mortgage | With Mortgage |
| Less than 2.0x | 408 (17.7%) | 146,043 (2,872.0%) |
| 2.0x to 2.9x | 409 (17.8%) | 1,324 (26.0%) |
| 3.0x to 3.9x | 386 (16.8%) | 1,771 (34.8%) |
| 4.0x or more | 1,055 (45.8%) | 652 (12.8%) |
| Total | 2,303 (100.0%) | 5,085 (100.0%) |
Real Estate Taxes by Mortgage Status in Somerset
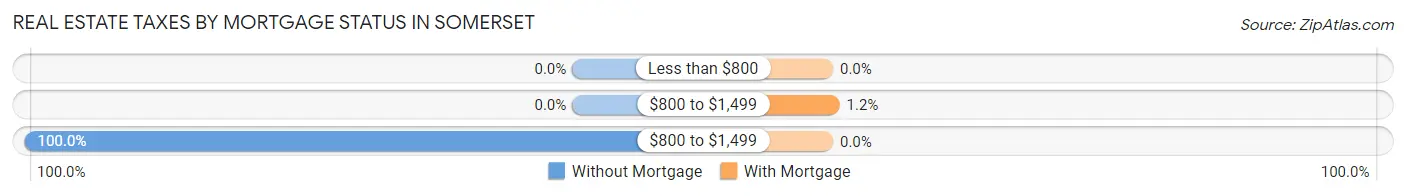
| Property Taxes | Without Mortgage | With Mortgage |
| Less than $800 | 0 (0.0%) | 0 (0.0%) |
| $800 to $1,499 | 0 (0.0%) | 61 (1.2%) |
| $800 to $1,499 | 2,303 (100.0%) | 0 (0.0%) |
| Total | 2,303 (100.0%) | 5,085 (100.0%) |
Health & Disability in Somerset
Health Insurance Coverage by Age in Somerset
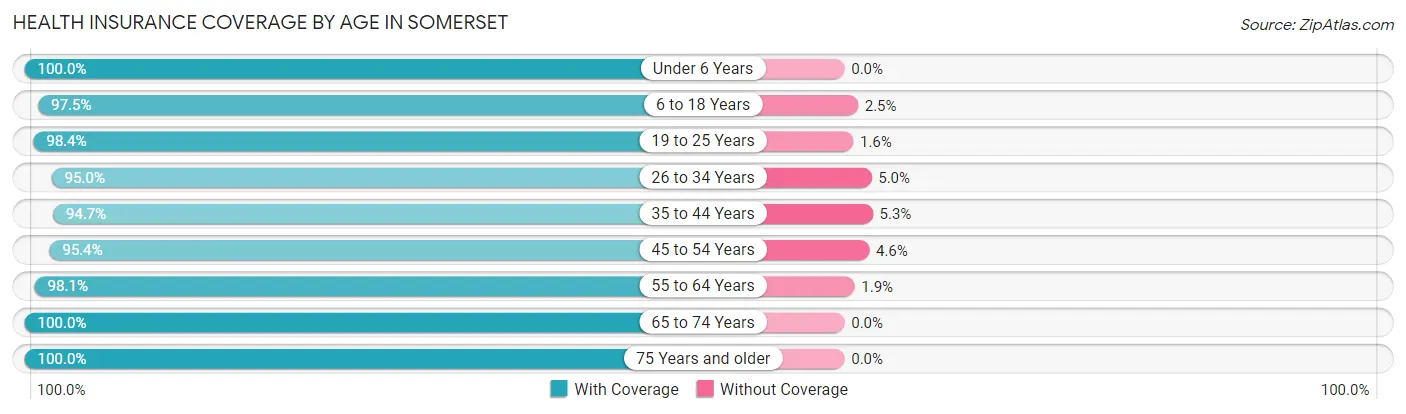
| Age Bracket | With Coverage | Without Coverage |
| Under 6 Years | 1,423 (100.0%) | 0 (0.0%) |
| 6 to 18 Years | 3,141 (97.5%) | 81 (2.5%) |
| 19 to 25 Years | 2,236 (98.4%) | 37 (1.6%) |
| 26 to 34 Years | 3,021 (95.0%) | 160 (5.0%) |
| 35 to 44 Years | 2,961 (94.7%) | 165 (5.3%) |
| 45 to 54 Years | 3,411 (95.4%) | 165 (4.6%) |
| 55 to 64 Years | 3,076 (98.1%) | 59 (1.9%) |
| 65 to 74 Years | 2,173 (100.0%) | 0 (0.0%) |
| 75 Years and older | 1,709 (100.0%) | 0 (0.0%) |
| Total | 23,151 (97.2%) | 667 (2.8%) |
Health Insurance Coverage by Citizenship Status in Somerset
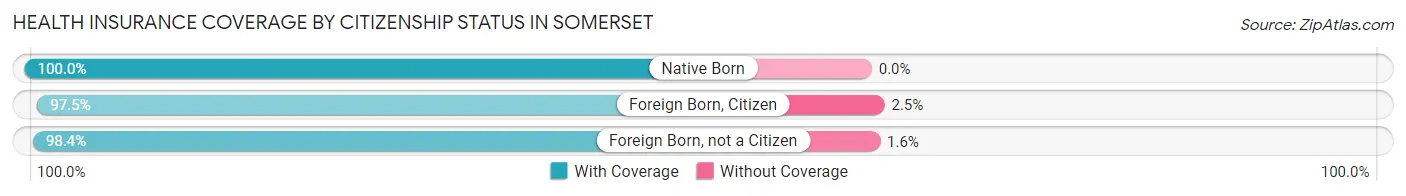
| Citizenship Status | With Coverage | Without Coverage |
| Native Born | 1,423 (100.0%) | 0 (0.0%) |
| Foreign Born, Citizen | 3,141 (97.5%) | 81 (2.5%) |
| Foreign Born, not a Citizen | 2,236 (98.4%) | 37 (1.6%) |
Health Insurance Coverage by Household Income in Somerset
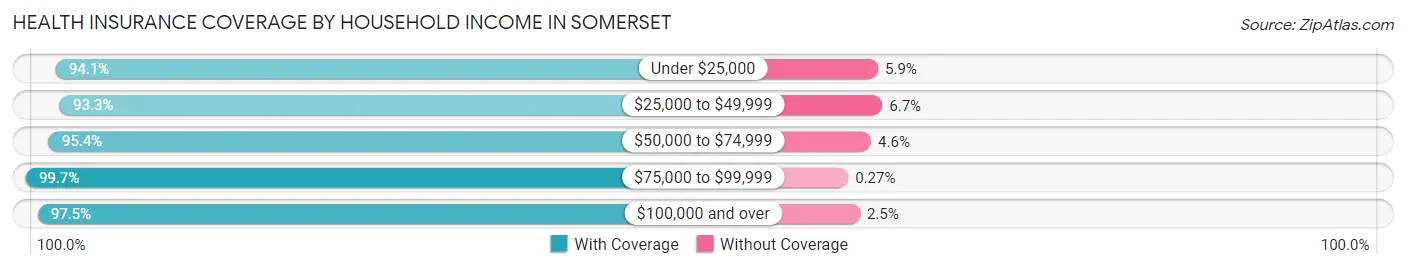
| Household Income | With Coverage | Without Coverage |
| Under $25,000 | 1,362 (94.1%) | 85 (5.9%) |
| $25,000 to $49,999 | 1,387 (93.3%) | 99 (6.7%) |
| $50,000 to $74,999 | 2,155 (95.4%) | 103 (4.6%) |
| $75,000 to $99,999 | 3,655 (99.7%) | 10 (0.3%) |
| $100,000 and over | 14,534 (97.5%) | 370 (2.5%) |
Public vs Private Health Insurance Coverage by Age in Somerset
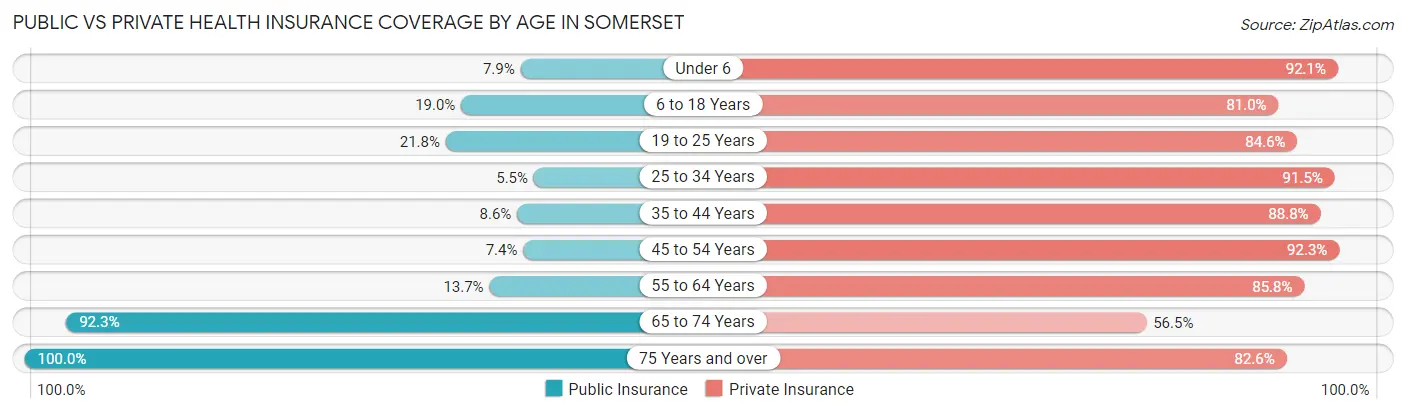
| Age Bracket | Public Insurance | Private Insurance |
| Under 6 | 113 (7.9%) | 1,310 (92.1%) |
| 6 to 18 Years | 611 (19.0%) | 2,611 (81.0%) |
| 19 to 25 Years | 496 (21.8%) | 1,922 (84.6%) |
| 25 to 34 Years | 174 (5.5%) | 2,910 (91.5%) |
| 35 to 44 Years | 268 (8.6%) | 2,777 (88.8%) |
| 45 to 54 Years | 266 (7.4%) | 3,301 (92.3%) |
| 55 to 64 Years | 430 (13.7%) | 2,691 (85.8%) |
| 65 to 74 Years | 2,005 (92.3%) | 1,228 (56.5%) |
| 75 Years and over | 1,709 (100.0%) | 1,411 (82.6%) |
| Total | 6,072 (25.5%) | 20,161 (84.7%) |
Disability Status by Sex by Age in Somerset
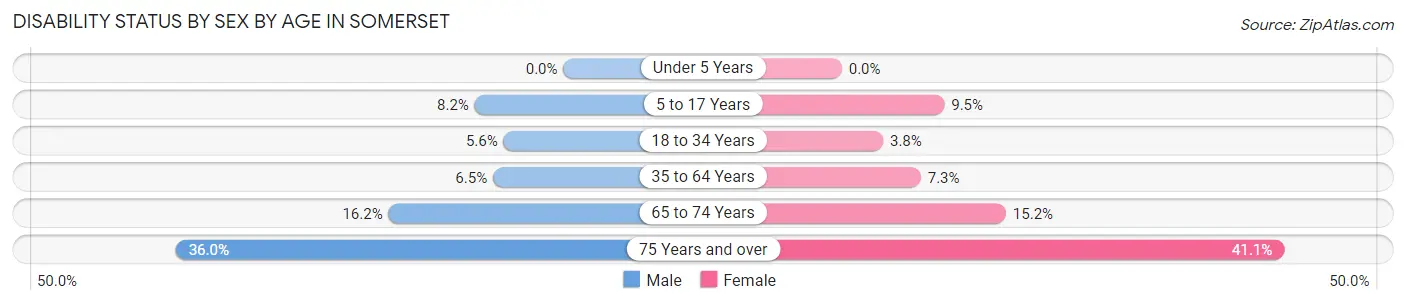
| Age Bracket | Male | Female |
| Under 5 Years | 0 (0.0%) | 0 (0.0%) |
| 5 to 17 Years | 128 (8.2%) | 170 (9.5%) |
| 18 to 34 Years | 170 (5.6%) | 99 (3.8%) |
| 35 to 64 Years | 321 (6.5%) | 361 (7.3%) |
| 65 to 74 Years | 147 (16.2%) | 193 (15.2%) |
| 75 Years and over | 209 (36.0%) | 463 (41.0%) |
Disability Class by Sex by Age in Somerset
Disability Class: Hearing Difficulty
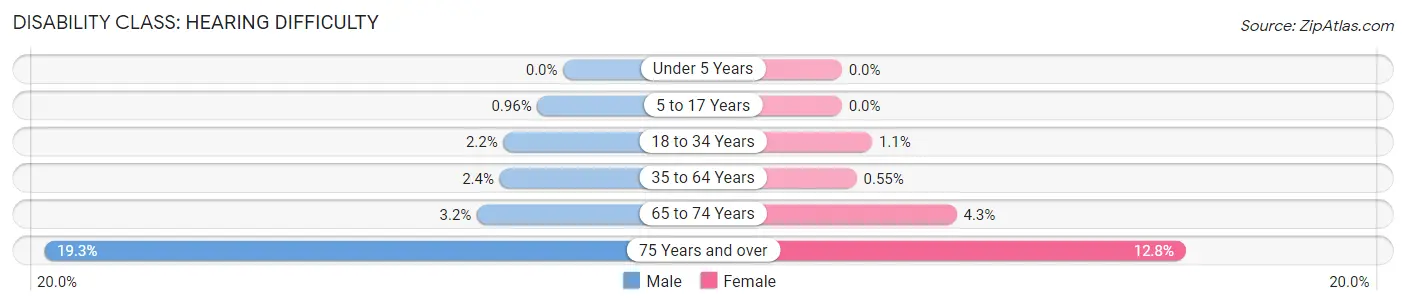
| Age Bracket | Male | Female |
| Under 5 Years | 0 (0.0%) | 0 (0.0%) |
| 5 to 17 Years | 15 (1.0%) | 0 (0.0%) |
| 18 to 34 Years | 68 (2.2%) | 29 (1.1%) |
| 35 to 64 Years | 116 (2.4%) | 27 (0.5%) |
| 65 to 74 Years | 29 (3.2%) | 54 (4.3%) |
| 75 Years and over | 112 (19.3%) | 144 (12.8%) |
Disability Class: Vision Difficulty
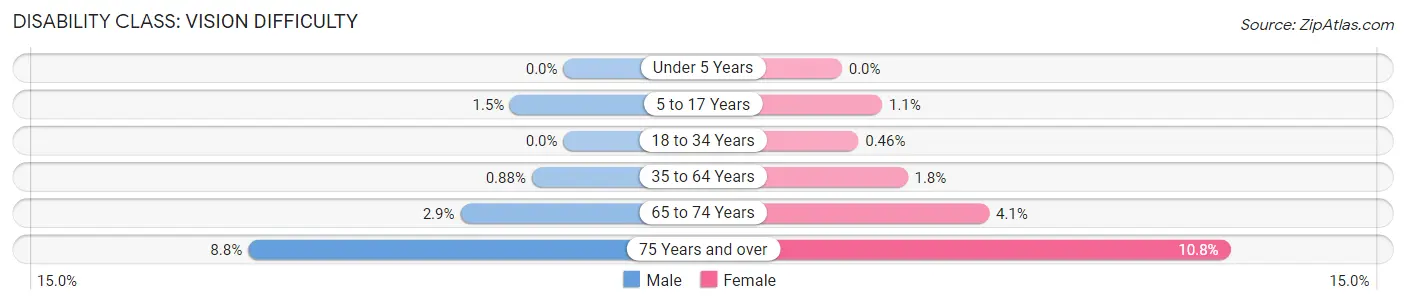
| Age Bracket | Male | Female |
| Under 5 Years | 0 (0.0%) | 0 (0.0%) |
| 5 to 17 Years | 23 (1.5%) | 20 (1.1%) |
| 18 to 34 Years | 0 (0.0%) | 12 (0.5%) |
| 35 to 64 Years | 43 (0.9%) | 90 (1.8%) |
| 65 to 74 Years | 26 (2.9%) | 52 (4.1%) |
| 75 Years and over | 51 (8.8%) | 122 (10.8%) |
Disability Class: Cognitive Difficulty
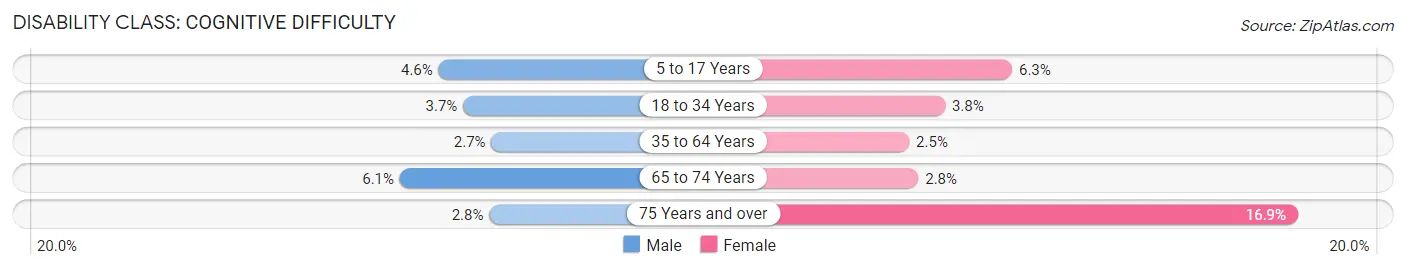
| Age Bracket | Male | Female |
| 5 to 17 Years | 72 (4.6%) | 113 (6.3%) |
| 18 to 34 Years | 114 (3.7%) | 99 (3.8%) |
| 35 to 64 Years | 131 (2.7%) | 123 (2.5%) |
| 65 to 74 Years | 55 (6.1%) | 36 (2.8%) |
| 75 Years and over | 16 (2.8%) | 191 (16.9%) |
Disability Class: Ambulatory Difficulty
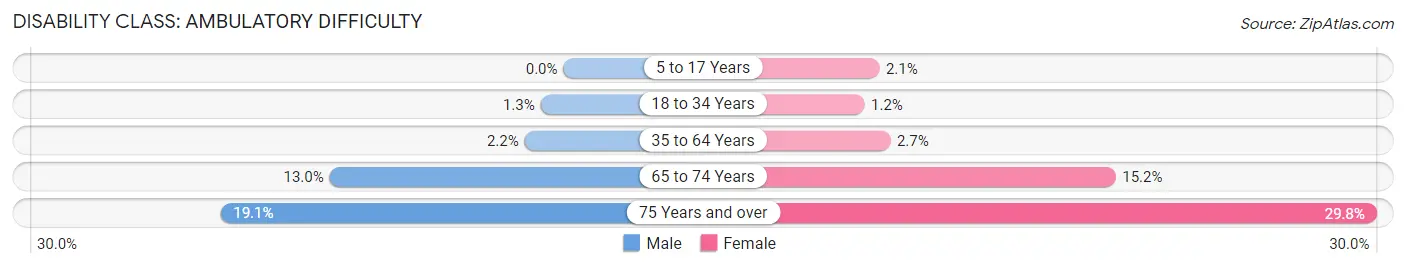
| Age Bracket | Male | Female |
| 5 to 17 Years | 0 (0.0%) | 37 (2.1%) |
| 18 to 34 Years | 39 (1.3%) | 32 (1.2%) |
| 35 to 64 Years | 106 (2.2%) | 132 (2.7%) |
| 65 to 74 Years | 118 (13.0%) | 193 (15.2%) |
| 75 Years and over | 111 (19.1%) | 336 (29.8%) |
Disability Class: Self-Care Difficulty
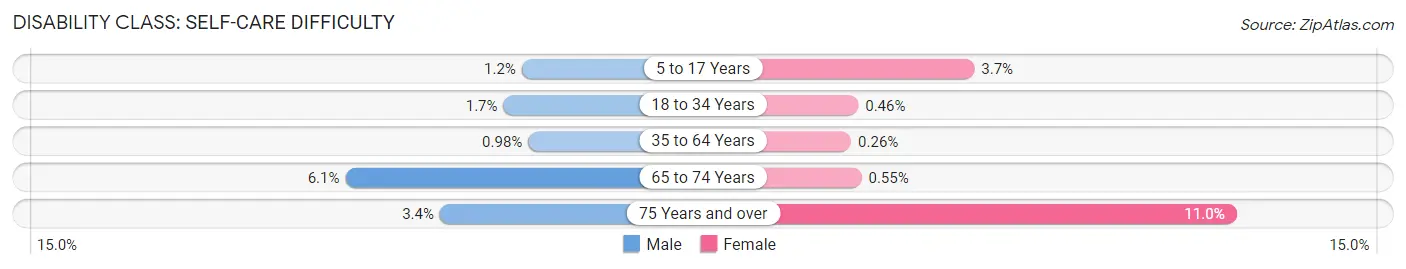
| Age Bracket | Male | Female |
| 5 to 17 Years | 18 (1.2%) | 66 (3.7%) |
| 18 to 34 Years | 51 (1.7%) | 12 (0.5%) |
| 35 to 64 Years | 48 (1.0%) | 13 (0.3%) |
| 65 to 74 Years | 55 (6.1%) | 7 (0.5%) |
| 75 Years and over | 20 (3.4%) | 124 (11.0%) |
Technology Access in Somerset
Computing Device Access in Somerset
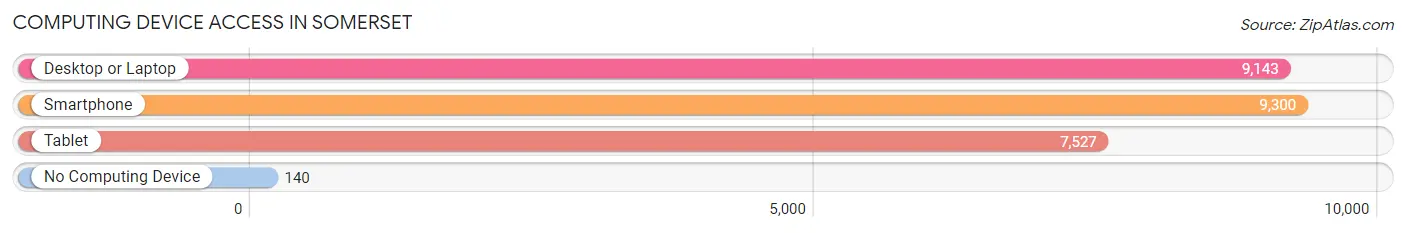
| Device Type | # Households | % Households |
| Desktop or Laptop | 9,143 | 91.6% |
| Smartphone | 9,300 | 93.2% |
| Tablet | 7,527 | 75.4% |
| No Computing Device | 140 | 1.4% |
| Total | 9,981 | 100.0% |
Internet Access in Somerset
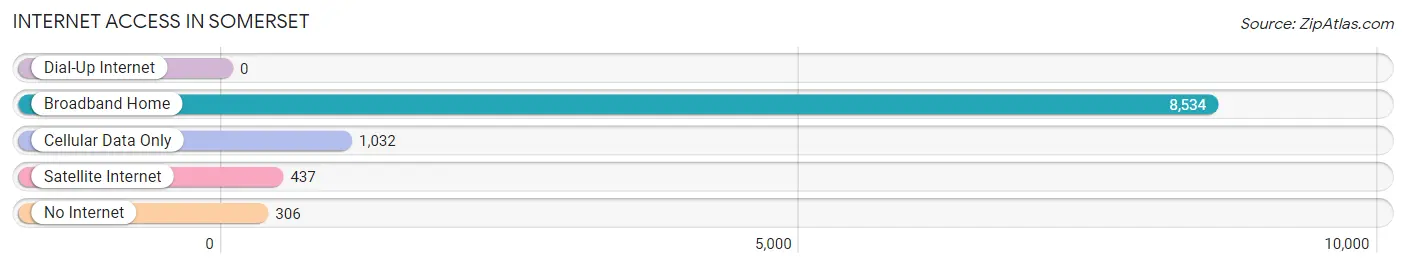
| Internet Type | # Households | % Households |
| Dial-Up Internet | 0 | 0.0% |
| Broadband Home | 8,534 | 85.5% |
| Cellular Data Only | 1,032 | 10.3% |
| Satellite Internet | 437 | 4.4% |
| No Internet | 306 | 3.1% |
| Total | 9,981 | 100.0% |
Somerset Summary
Somerset is a township located in Somerset County, New Jersey. It is situated in the Raritan Valley region of Central New Jersey, and is bordered by Franklin Township, Hillsborough Township, Manville, and Bound Brook. The township is home to a population of approximately 22,000 people, and is known for its diverse population, rich history, and vibrant economy.
Geography
Somerset is located in the Raritan Valley region of Central New Jersey, and is bordered by Franklin Township, Hillsborough Township, Manville, and Bound Brook. The township covers an area of approximately 11.5 square miles, and is home to a population of approximately 22,000 people. The township is situated in the northern part of Somerset County, and is located approximately 25 miles from New York City. The township is home to several parks and recreational areas, including Colonial Park, Duke Island Park, and Washington Valley Park.
History
Somerset was originally inhabited by the Lenape Native Americans, who were later displaced by Dutch and English settlers in the 17th century. The area was originally part of Franklin Township, and was incorporated as its own township in 1798. The township was named after the English county of Somerset, and was home to a thriving agricultural industry in the 19th century. The township experienced a period of rapid growth in the late 19th and early 20th centuries, and was home to several factories and businesses. The township was also home to a large Italian-American population, and was the site of several Italian-American festivals and events.
Economy
Somerset is home to a vibrant economy, and is home to several major employers, including Johnson & Johnson, Robert Wood Johnson University Hospital, and Rutgers University. The township is also home to several retail and commercial businesses, and is home to several shopping centers and malls. The township is also home to several industrial parks, and is home to several manufacturing and technology companies.
Demographics
As of the 2010 census, the population of Somerset was 22,044, with a population density of 1,919 people per square mile. The racial makeup of the township was 79.2% White, 8.2% African American, 0.3% Native American, 6.2% Asian, and 4.9% from other races. The median household income was $76,837, and the median family income was $90,917. The per capita income was $35,945.
Conclusion
Somerset is a vibrant township located in Somerset County, New Jersey. It is situated in the Raritan Valley region of Central New Jersey, and is bordered by Franklin Township, Hillsborough Township, Manville, and Bound Brook. The township is home to a population of approximately 22,000 people, and is known for its diverse population, rich history, and vibrant economy. The township is home to several major employers, and is home to several retail and commercial businesses. The township is also home to several industrial parks, and is home to several manufacturing and technology companies. The median household income was $76,837, and the median family income was $90,917. The per capita income was $35,945.
Common Questions
What is Per Capita Income in Somerset?
Per Capita income in Somerset is $55,428.
What is the Median Family Income in Somerset?
Median Family Income in Somerset is $138,489.
What is the Median Household income in Somerset?
Median Household Income in Somerset is $110,859.
What is Income or Wage Gap in Somerset?
Income or Wage Gap in Somerset is 11.7%.
Women in Somerset earn 88.3 cents for every dollar earned by a man.
What is Family Income Deficit in Somerset?
Family Income Deficit in Somerset is $8,212.
Families that are below poverty line in Somerset earn $8,212 less on average than the poverty threshold level.
What is Inequality or Gini Index in Somerset?
Inequality or Gini Index in Somerset is 0.39.
What is the Total Population of Somerset?
Total Population of Somerset is 24,246.
What is the Total Male Population of Somerset?
Total Male Population of Somerset is 11,828.
What is the Total Female Population of Somerset?
Total Female Population of Somerset is 12,418.
What is the Ratio of Males per 100 Females in Somerset?
There are 95.25 Males per 100 Females in Somerset.
What is the Ratio of Females per 100 Males in Somerset?
There are 104.99 Females per 100 Males in Somerset.
What is the Median Population Age in Somerset?
Median Population Age in Somerset is 41.5 Years.
What is the Average Family Size in Somerset
Average Family Size in Somerset is 3.1 People.
What is the Average Household Size in Somerset
Average Household Size in Somerset is 2.4 People.
How Large is the Labor Force in Somerset?
There are 14,187 People in the Labor Forcein in Somerset.
What is the Percentage of People in the Labor Force in Somerset?
70.5% of People are in the Labor Force in Somerset.
What is the Unemployment Rate in Somerset?
Unemployment Rate in Somerset is 5.4%.