Phillipsburg, NJ Map & Demographics
Phillipsburg Map
Phillipsburg Overview
$33,659
PER CAPITA INCOME
$72,031
AVG FAMILY INCOME
$64,130
AVG HOUSEHOLD INCOME
32.4%
WAGE / INCOME GAP [ % ]
67.6¢/ $1
WAGE / INCOME GAP [ $ ]
0.45
INEQUALITY / GINI INDEX
15,206
TOTAL POPULATION
7,553
MALE POPULATION
7,653
FEMALE POPULATION
98.69
MALES / 100 FEMALES
101.32
FEMALES / 100 MALES
41.2
MEDIAN AGE
2.9
AVG FAMILY SIZE
2.3
AVG HOUSEHOLD SIZE
8,138
LABOR FORCE [ PEOPLE ]
65.6%
PERCENT IN LABOR FORCE
8.4%
UNEMPLOYMENT RATE
Phillipsburg Zip Codes
Phillipsburg Area Codes
Income in Phillipsburg
Income Overview in Phillipsburg
Per Capita Income in Phillipsburg is $33,659, while median incomes of families and households are $72,031 and $64,130 respectively.
| Characteristic | Number | Measure |
| Per Capita Income | 15,206 | $33,659 |
| Median Family Income | 3,765 | $72,031 |
| Mean Family Income | 3,765 | $87,192 |
| Median Household Income | 6,602 | $64,130 |
| Mean Household Income | 6,602 | $75,251 |
| Income Deficit | 3,765 | $0 |
| Wage / Income Gap (%) | 15,206 | 32.43% |
| Wage / Income Gap ($) | 15,206 | 67.57¢ per $1 |
| Gini / Inequality Index | 15,206 | 0.45 |
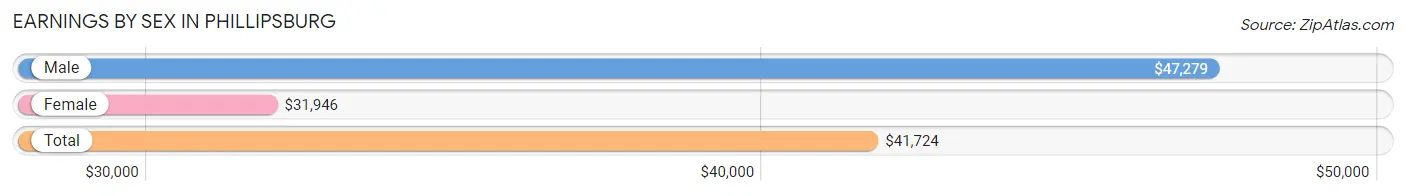
Earnings by Sex in Phillipsburg
Average Earnings in Phillipsburg are $41,724, $47,279 for men and $31,946 for women, a difference of 32.4%.
| Sex | Number | Average Earnings |
| Male | 4,518 (55.9%) | $47,279 |
| Female | 3,560 (44.1%) | $31,946 |
| Total | 8,078 (100.0%) | $41,724 |
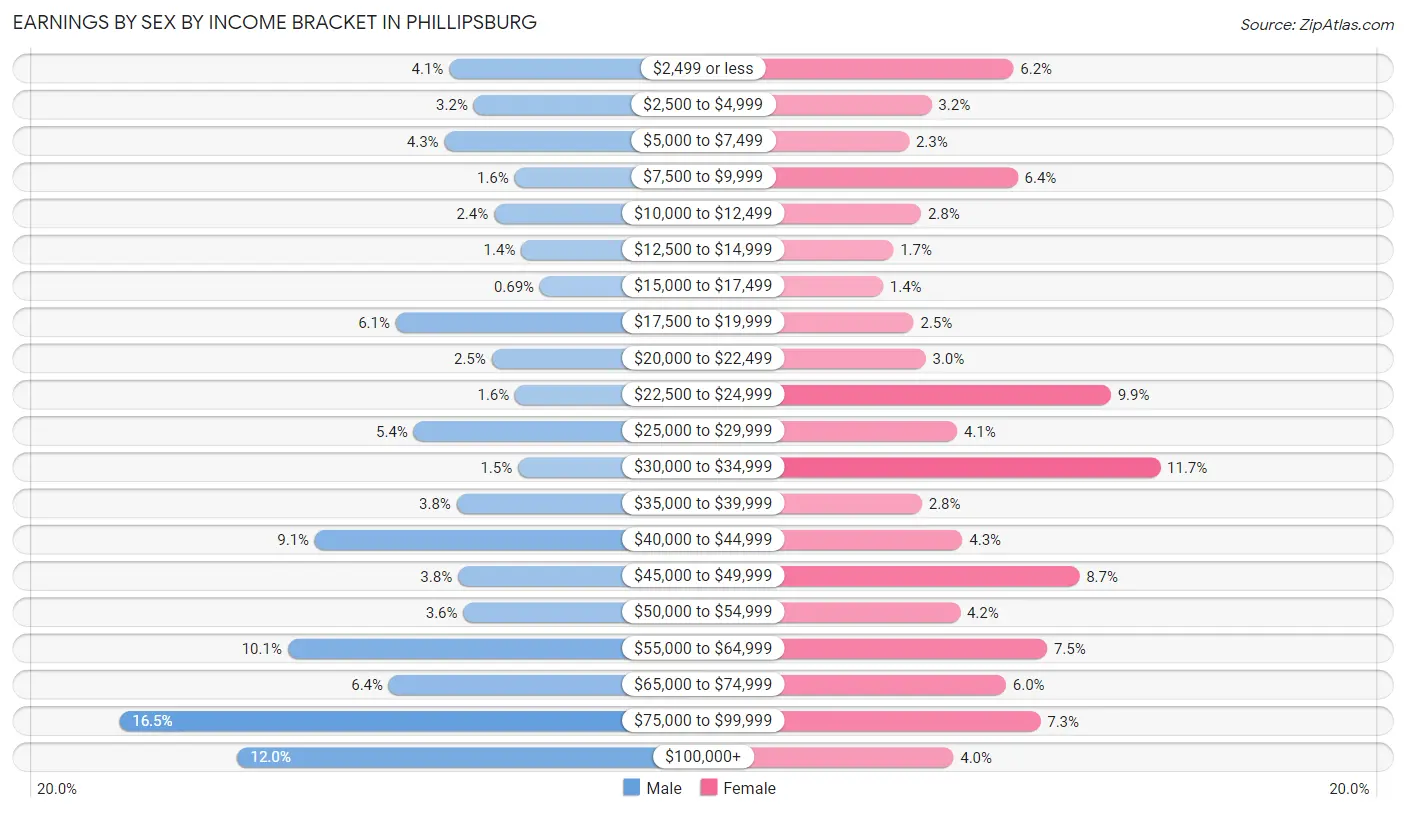
Earnings by Sex by Income Bracket in Phillipsburg
The most common earnings brackets in Phillipsburg are $75,000 to $99,999 for men (743 | 16.5%) and $30,000 to $34,999 for women (418 | 11.7%).
| Income | Male | Female |
| $2,499 or less | 185 (4.1%) | 222 (6.2%) |
| $2,500 to $4,999 | 143 (3.2%) | 113 (3.2%) |
| $5,000 to $7,499 | 193 (4.3%) | 83 (2.3%) |
| $7,500 to $9,999 | 74 (1.6%) | 228 (6.4%) |
| $10,000 to $12,499 | 109 (2.4%) | 99 (2.8%) |
| $12,500 to $14,999 | 63 (1.4%) | 62 (1.7%) |
| $15,000 to $17,499 | 31 (0.7%) | 48 (1.3%) |
| $17,500 to $19,999 | 275 (6.1%) | 89 (2.5%) |
| $20,000 to $22,499 | 113 (2.5%) | 105 (2.9%) |
| $22,500 to $24,999 | 73 (1.6%) | 352 (9.9%) |
| $25,000 to $29,999 | 245 (5.4%) | 147 (4.1%) |
| $30,000 to $34,999 | 68 (1.5%) | 418 (11.7%) |
| $35,000 to $39,999 | 172 (3.8%) | 100 (2.8%) |
| $40,000 to $44,999 | 412 (9.1%) | 154 (4.3%) |
| $45,000 to $49,999 | 170 (3.8%) | 310 (8.7%) |
| $50,000 to $54,999 | 161 (3.6%) | 151 (4.2%) |
| $55,000 to $64,999 | 458 (10.1%) | 267 (7.5%) |
| $65,000 to $74,999 | 287 (6.4%) | 212 (6.0%) |
| $75,000 to $99,999 | 743 (16.5%) | 258 (7.2%) |
| $100,000+ | 543 (12.0%) | 142 (4.0%) |
| Total | 4,518 (100.0%) | 3,560 (100.0%) |
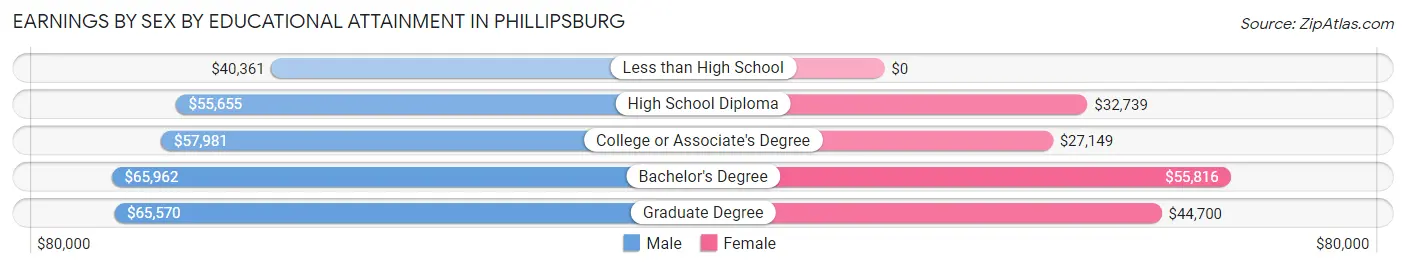
Earnings by Sex by Educational Attainment in Phillipsburg
Average earnings in Phillipsburg are $57,070 for men and $33,448 for women, a difference of 41.4%. Men with an educational attainment of bachelor's degree enjoy the highest average annual earnings of $65,962, while those with less than high school education earn the least with $40,361. Women with an educational attainment of bachelor's degree earn the most with the average annual earnings of $55,816, while those with college or associate's degree education have the smallest earnings of $27,149.
| Educational Attainment | Male Income | Female Income |
| Less than High School | $40,361 | $0 |
| High School Diploma | $55,655 | $32,739 |
| College or Associate's Degree | $57,981 | $27,149 |
| Bachelor's Degree | $65,962 | $55,816 |
| Graduate Degree | $65,570 | $44,700 |
| Total | $57,070 | $33,448 |
Family Income in Phillipsburg
Family Income Brackets in Phillipsburg
According to the Phillipsburg family income data, there are 730 families falling into the $50,000 to $74,999 income range, which is the most common income bracket and makes up 19.4% of all families. Conversely, the $15,000 to $24,999 income bracket is the least frequent group with only 147 families (3.9%) belonging to this category.
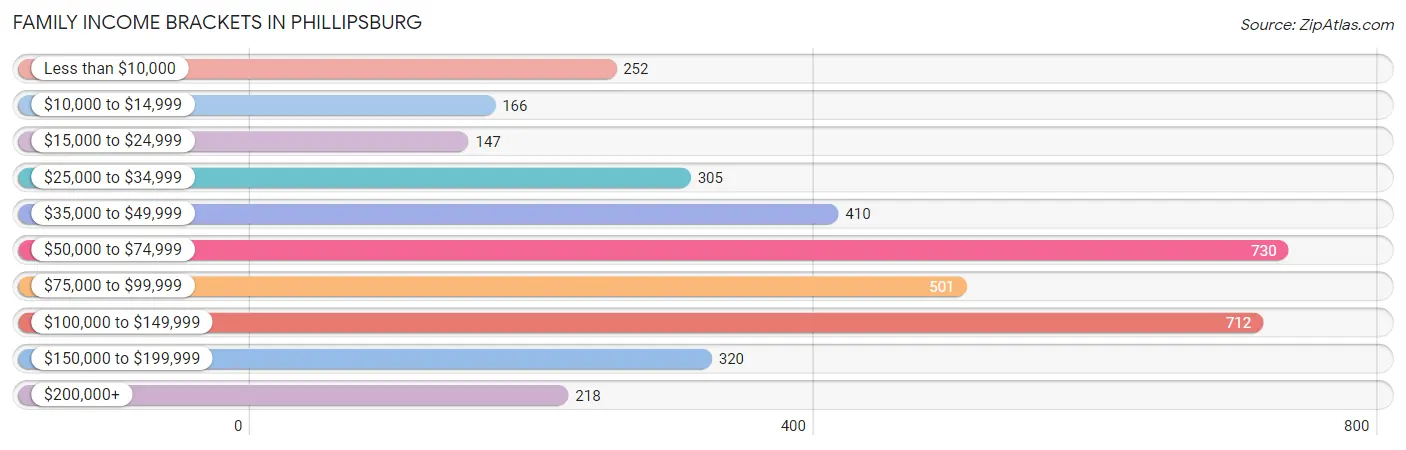
| Income Bracket | # Families | % Families |
| Less than $10,000 | 252 | 6.7% |
| $10,000 to $14,999 | 166 | 4.4% |
| $15,000 to $24,999 | 147 | 3.9% |
| $25,000 to $34,999 | 305 | 8.1% |
| $35,000 to $49,999 | 410 | 10.9% |
| $50,000 to $74,999 | 730 | 19.4% |
| $75,000 to $99,999 | 501 | 13.3% |
| $100,000 to $149,999 | 712 | 18.9% |
| $150,000 to $199,999 | 320 | 8.5% |
| $200,000+ | 218 | 5.8% |
Family Income by Famaliy Size in Phillipsburg
4-person families (754 | 20.0%) account for the highest median family income in Phillipsburg with $93,869 per family, while 2-person families (1,955 | 51.9%) have the highest median income of $32,753 per family member.
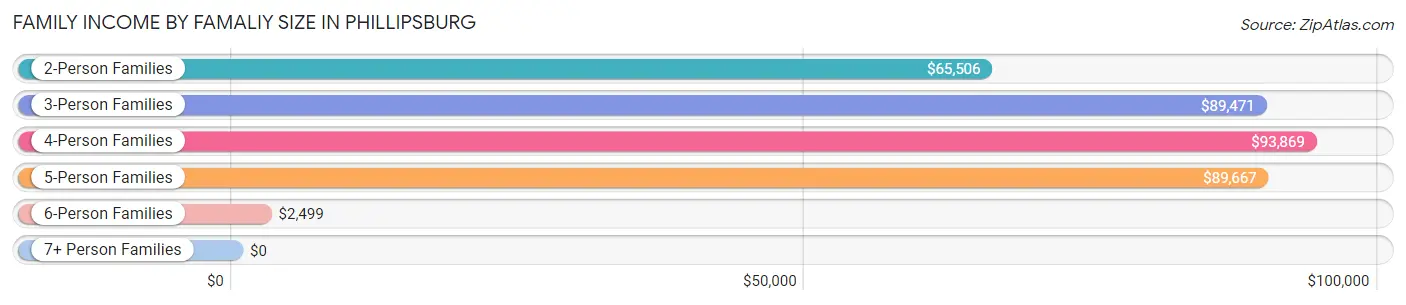
| Income Bracket | # Families | Median Income |
| 2-Person Families | 1,955 (51.9%) | $65,506 |
| 3-Person Families | 645 (17.1%) | $89,471 |
| 4-Person Families | 754 (20.0%) | $93,869 |
| 5-Person Families | 318 (8.5%) | $89,667 |
| 6-Person Families | 69 (1.8%) | $2,499 |
| 7+ Person Families | 24 (0.6%) | $0 |
| Total | 3,765 (100.0%) | $72,031 |
Family Income by Number of Earners in Phillipsburg
The median family income in Phillipsburg is $72,031, with families comprising 3+ earners (378) having the highest median family income of $144,792, while families with no earners (804) have the lowest median family income of $32,264, accounting for 10.0% and 21.3% of families, respectively.
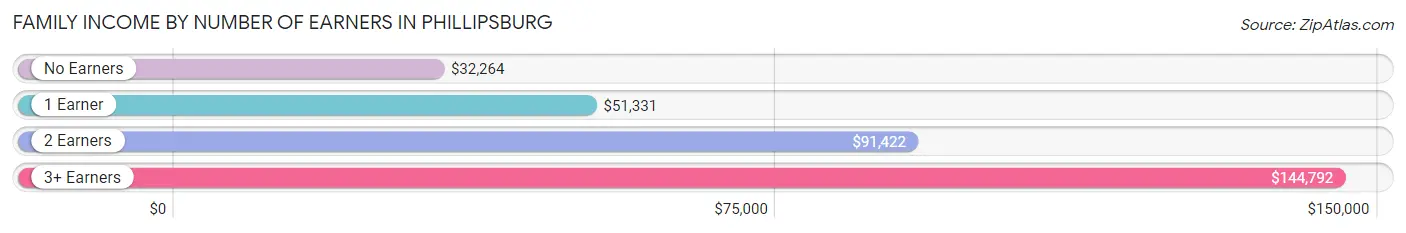
| Number of Earners | # Families | Median Income |
| No Earners | 804 (21.3%) | $32,264 |
| 1 Earner | 1,061 (28.2%) | $51,331 |
| 2 Earners | 1,522 (40.4%) | $91,422 |
| 3+ Earners | 378 (10.0%) | $144,792 |
| Total | 3,765 (100.0%) | $72,031 |
Household Income in Phillipsburg
Household Income Brackets in Phillipsburg
With 1,142 households falling in the category, the $100,000 to $149,999 income range is the most frequent in Phillipsburg, accounting for 17.3% of all households. In contrast, only 284 households (4.3%) fall into the $200,000+ income bracket, making it the least populous group.
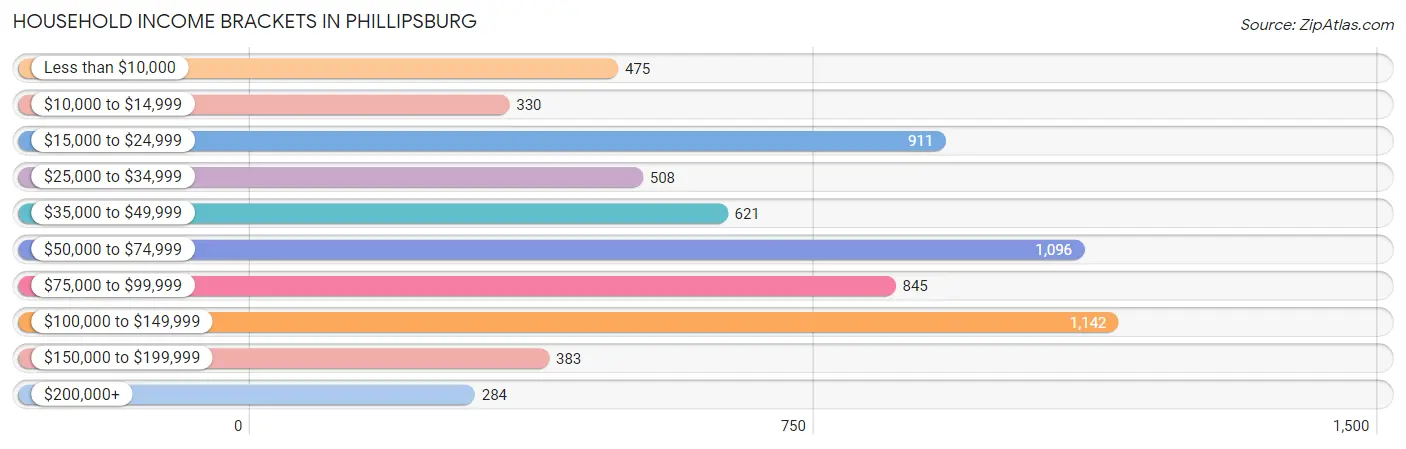
| Income Bracket | # Households | % Households |
| Less than $10,000 | 475 | 7.2% |
| $10,000 to $14,999 | 330 | 5.0% |
| $15,000 to $24,999 | 911 | 13.8% |
| $25,000 to $34,999 | 508 | 7.7% |
| $35,000 to $49,999 | 621 | 9.4% |
| $50,000 to $74,999 | 1,096 | 16.6% |
| $75,000 to $99,999 | 845 | 12.8% |
| $100,000 to $149,999 | 1,142 | 17.3% |
| $150,000 to $199,999 | 383 | 5.8% |
| $200,000+ | 284 | 4.3% |
Household Income by Householder Age in Phillipsburg
The median household income in Phillipsburg is $64,130, with the highest median household income of $69,854 found in the 45 to 64 years age bracket for the primary householder. A total of 2,539 households (38.5%) fall into this category. Meanwhile, the 15 to 24 years age bracket for the primary householder has the lowest median household income of $0, with 109 households (1.7%) in this group.
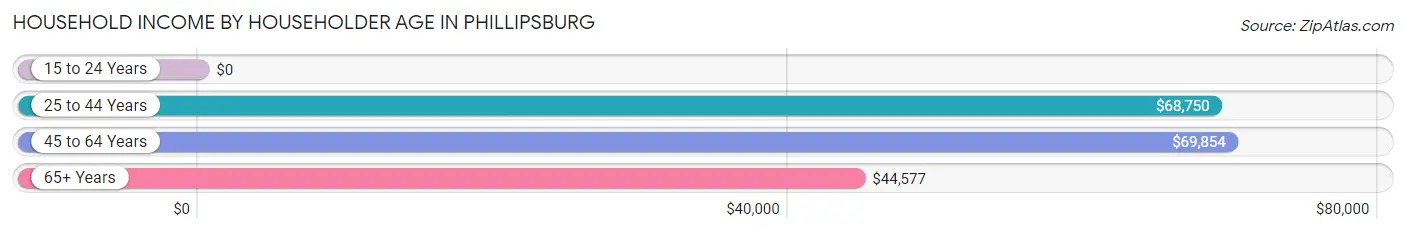
| Income Bracket | # Households | Median Income |
| 15 to 24 Years | 109 (1.7%) | $0 |
| 25 to 44 Years | 2,202 (33.4%) | $68,750 |
| 45 to 64 Years | 2,539 (38.5%) | $69,854 |
| 65+ Years | 1,752 (26.5%) | $44,577 |
| Total | 6,602 (100.0%) | $64,130 |
Poverty in Phillipsburg
Income Below Poverty by Sex and Age in Phillipsburg
With 10.8% poverty level for males and 20.3% for females among the residents of Phillipsburg, under 5 year old males and 15 year old females are the most vulnerable to poverty, with 147 males (45.1%) and 53 females (86.9%) in their respective age groups living below the poverty level.
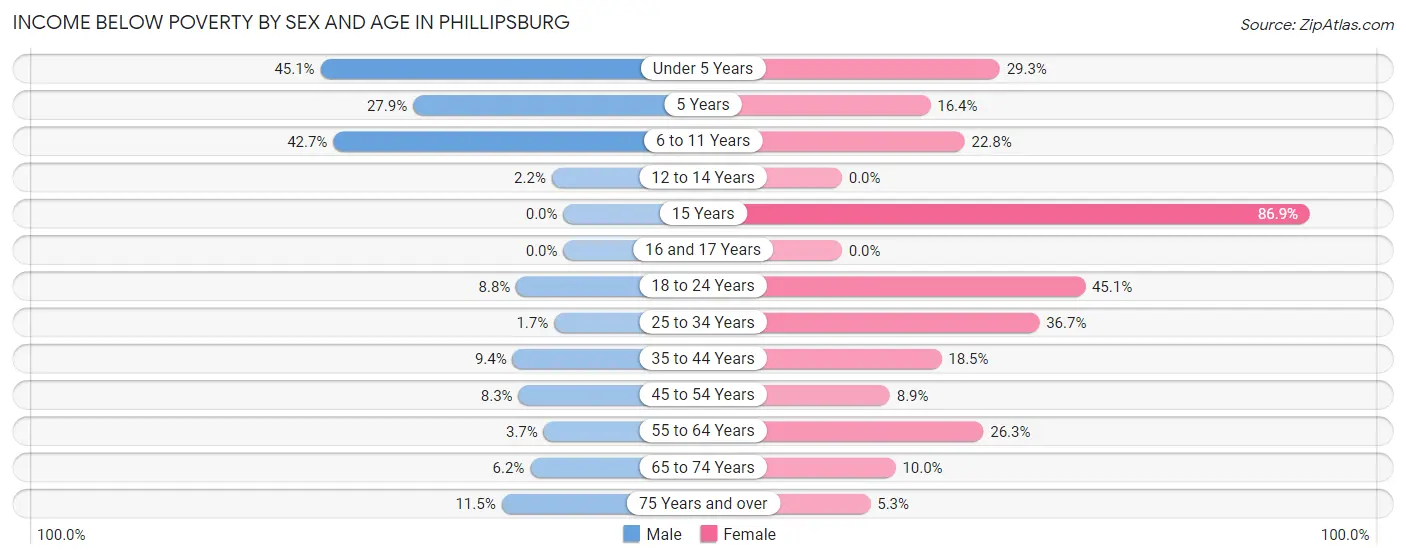
| Age Bracket | Male | Female |
| Under 5 Years | 147 (45.1%) | 97 (29.3%) |
| 5 Years | 24 (27.9%) | 11 (16.4%) |
| 6 to 11 Years | 258 (42.7%) | 136 (22.8%) |
| 12 to 14 Years | 8 (2.2%) | 0 (0.0%) |
| 15 Years | 0 (0.0%) | 53 (86.9%) |
| 16 and 17 Years | 0 (0.0%) | 0 (0.0%) |
| 18 to 24 Years | 66 (8.8%) | 195 (45.1%) |
| 25 to 34 Years | 18 (1.7%) | 298 (36.6%) |
| 35 to 44 Years | 97 (9.4%) | 224 (18.5%) |
| 45 to 54 Years | 69 (8.3%) | 96 (8.9%) |
| 55 to 64 Years | 42 (3.7%) | 317 (26.3%) |
| 65 to 74 Years | 42 (6.1%) | 75 (10.0%) |
| 75 Years and over | 38 (11.5%) | 35 (5.3%) |
| Total | 809 (10.8%) | 1,537 (20.3%) |
Income Above Poverty by Sex and Age in Phillipsburg
According to the poverty statistics in Phillipsburg, males aged 15 years and females aged 12 to 14 years are the age groups that are most secure financially, with 100.0% of males and 100.0% of females in these age groups living above the poverty line.
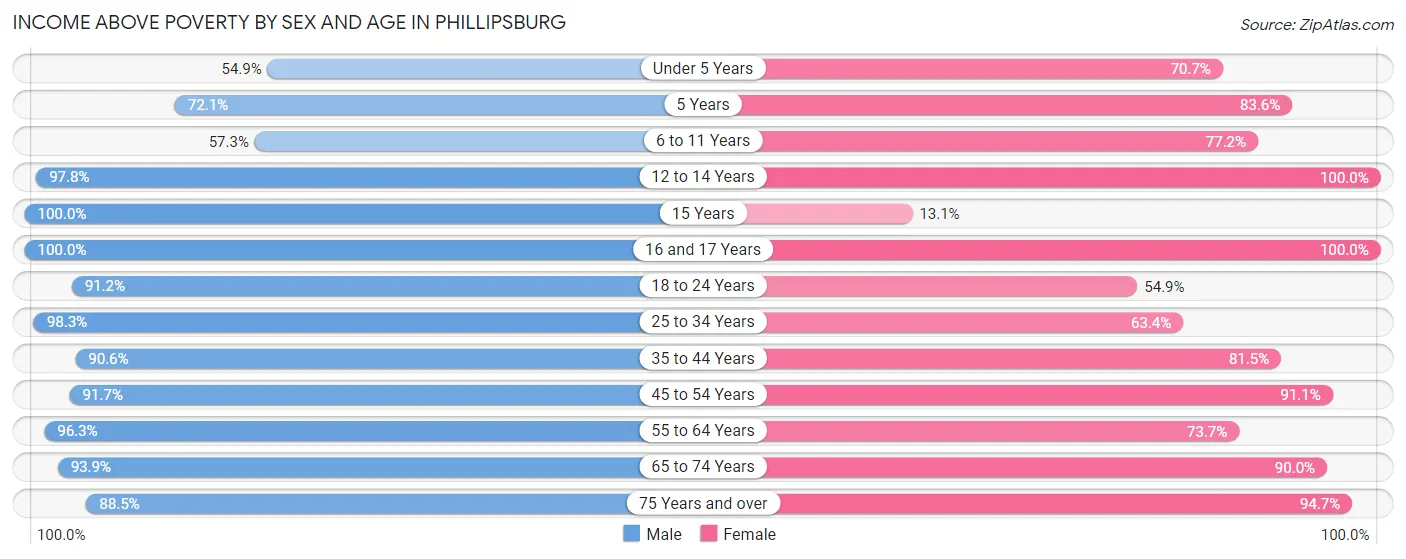
| Age Bracket | Male | Female |
| Under 5 Years | 179 (54.9%) | 234 (70.7%) |
| 5 Years | 62 (72.1%) | 56 (83.6%) |
| 6 to 11 Years | 346 (57.3%) | 461 (77.2%) |
| 12 to 14 Years | 362 (97.8%) | 211 (100.0%) |
| 15 Years | 47 (100.0%) | 8 (13.1%) |
| 16 and 17 Years | 247 (100.0%) | 129 (100.0%) |
| 18 to 24 Years | 687 (91.2%) | 237 (54.9%) |
| 25 to 34 Years | 1,025 (98.3%) | 515 (63.3%) |
| 35 to 44 Years | 932 (90.6%) | 988 (81.5%) |
| 45 to 54 Years | 758 (91.7%) | 982 (91.1%) |
| 55 to 64 Years | 1,106 (96.3%) | 890 (73.7%) |
| 65 to 74 Years | 641 (93.9%) | 678 (90.0%) |
| 75 Years and over | 293 (88.5%) | 627 (94.7%) |
| Total | 6,685 (89.2%) | 6,016 (79.6%) |
Income Below Poverty Among Married-Couple Families in Phillipsburg
The poverty statistics for married-couple families in Phillipsburg show that 3.5% or 81 of the total 2,301 families live below the poverty line. Families with 1 or 2 children have the highest poverty rate of 5.3%, comprising of 46 families. On the other hand, families with 3 or 4 children have the lowest poverty rate of 0.0%, which includes 0 families.
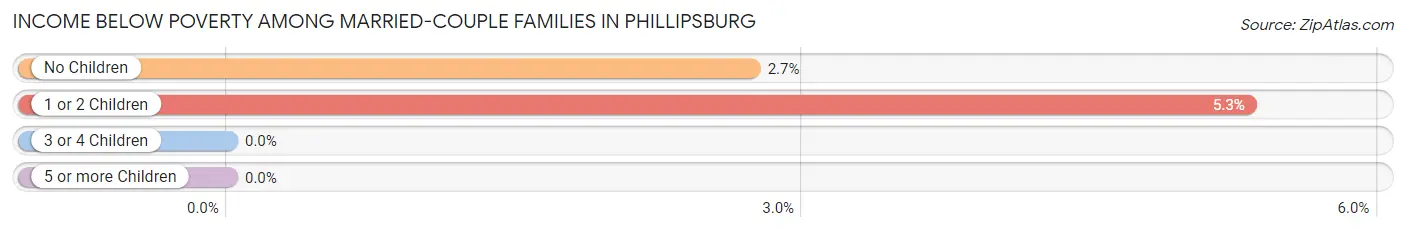
| Children | Above Poverty | Below Poverty |
| No Children | 1,246 (97.3%) | 35 (2.7%) |
| 1 or 2 Children | 819 (94.7%) | 46 (5.3%) |
| 3 or 4 Children | 155 (100.0%) | 0 (0.0%) |
| 5 or more Children | 0 (0.0%) | 0 (0.0%) |
| Total | 2,220 (96.5%) | 81 (3.5%) |
Income Below Poverty Among Single-Parent Households in Phillipsburg
According to the poverty data in Phillipsburg, 3.1% or 10 single-father households and 38.6% or 439 single-mother households are living below the poverty line. Among single-father households, those with no children have the highest poverty rate, with 10 households (6.7%) experiencing poverty. Likewise, among single-mother households, those with 3 or 4 children have the highest poverty rate, with 58 households (100.0%) falling below the poverty line.
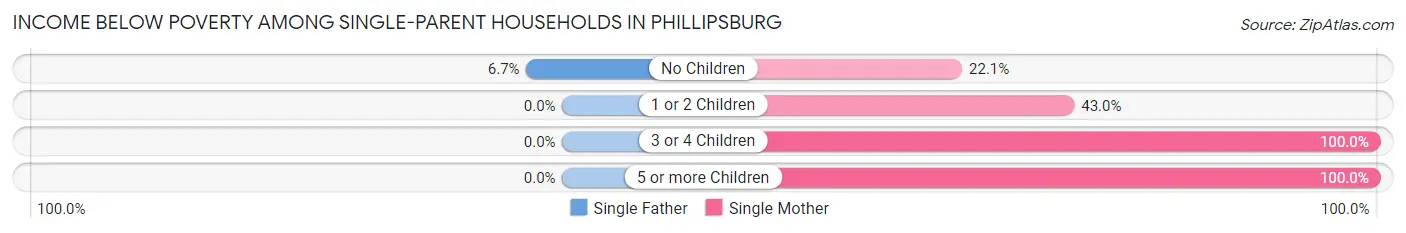
| Children | Single Father | Single Mother |
| No Children | 10 (6.7%) | 120 (22.1%) |
| 1 or 2 Children | 0 (0.0%) | 207 (42.9%) |
| 3 or 4 Children | 0 (0.0%) | 58 (100.0%) |
| 5 or more Children | 0 (0.0%) | 54 (100.0%) |
| Total | 10 (3.1%) | 439 (38.6%) |
Income Below Poverty Among Married-Couple vs Single-Parent Households in Phillipsburg
The poverty data for Phillipsburg shows that 81 of the married-couple family households (3.5%) and 449 of the single-parent households (30.7%) are living below the poverty level. Within the married-couple family households, those with 1 or 2 children have the highest poverty rate, with 46 households (5.3%) falling below the poverty line. Among the single-parent households, those with 3 or 4 children have the highest poverty rate, with 58 household (100.0%) living below poverty.
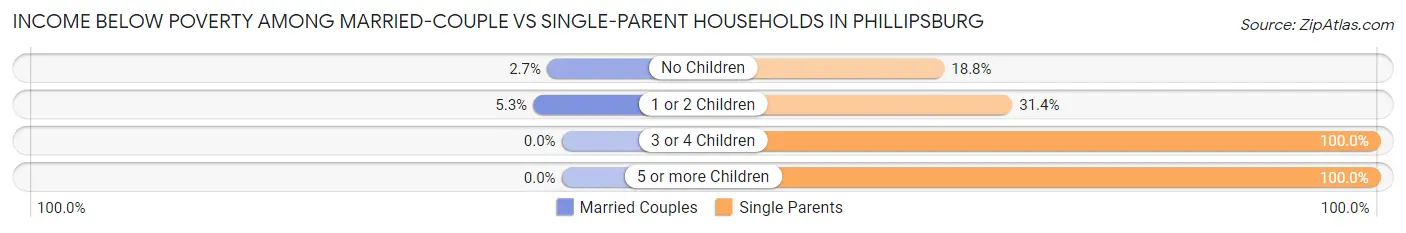
| Children | Married-Couple Families | Single-Parent Households |
| No Children | 35 (2.7%) | 130 (18.8%) |
| 1 or 2 Children | 46 (5.3%) | 207 (31.4%) |
| 3 or 4 Children | 0 (0.0%) | 58 (100.0%) |
| 5 or more Children | 0 (0.0%) | 54 (100.0%) |
| Total | 81 (3.5%) | 449 (30.7%) |
Race in Phillipsburg
The most populous races in Phillipsburg are White / Caucasian (10,766 | 70.8%), Hispanic or Latino (2,146 | 14.1%), and Black / African American (1,857 | 12.2%).
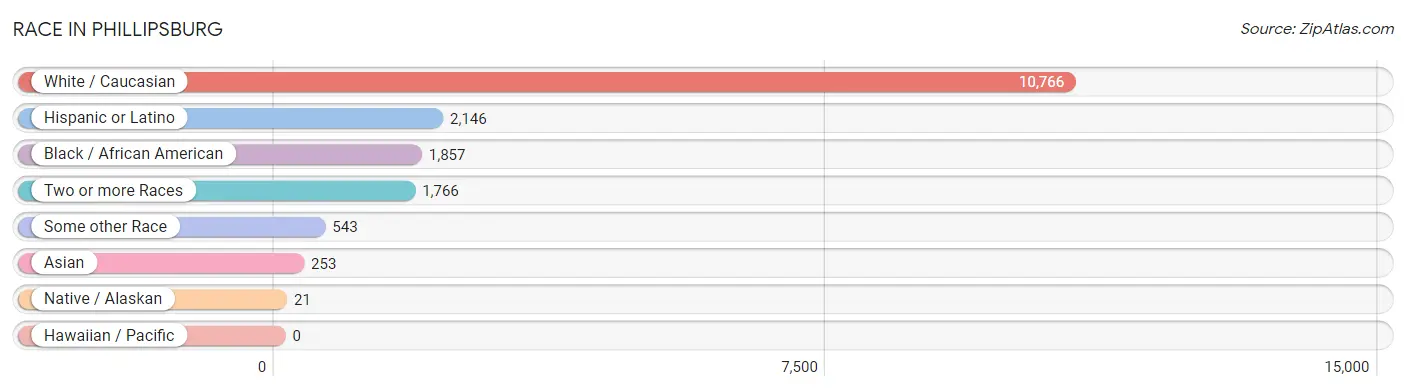
| Race | # Population | % Population |
| Asian | 253 | 1.7% |
| Black / African American | 1,857 | 12.2% |
| Hawaiian / Pacific | 0 | 0.0% |
| Hispanic or Latino | 2,146 | 14.1% |
| Native / Alaskan | 21 | 0.1% |
| White / Caucasian | 10,766 | 70.8% |
| Two or more Races | 1,766 | 11.6% |
| Some other Race | 543 | 3.6% |
| Total | 15,206 | 100.0% |
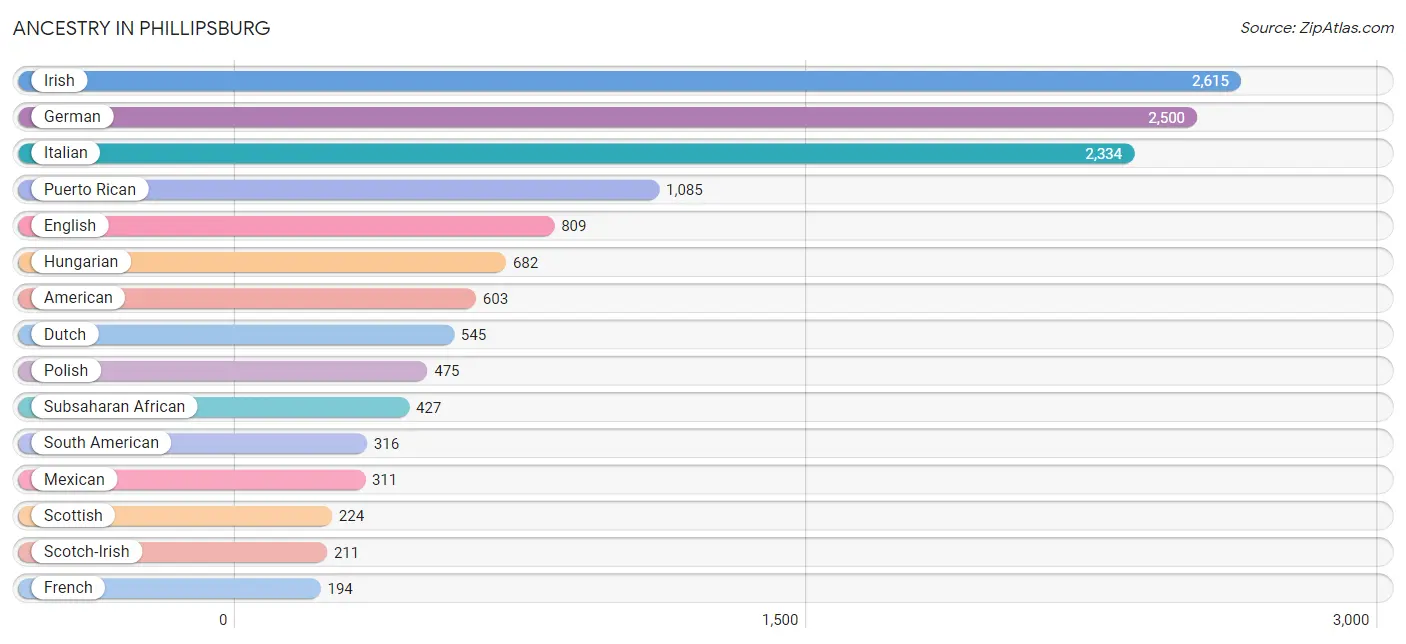
Ancestry in Phillipsburg
The most populous ancestries reported in Phillipsburg are Irish (2,615 | 17.2%), German (2,500 | 16.4%), Italian (2,334 | 15.3%), Puerto Rican (1,085 | 7.1%), and English (809 | 5.3%), together accounting for 61.5% of all Phillipsburg residents.
| Ancestry | # Population | % Population |
| African | 31 | 0.2% |
| American | 603 | 4.0% |
| Arab | 91 | 0.6% |
| Austrian | 11 | 0.1% |
| Bhutanese | 47 | 0.3% |
| Blackfeet | 49 | 0.3% |
| British | 20 | 0.1% |
| Bulgarian | 31 | 0.2% |
| Central American | 175 | 1.1% |
| Cherokee | 58 | 0.4% |
| Chilean | 23 | 0.2% |
| Colombian | 131 | 0.9% |
| Costa Rican | 38 | 0.3% |
| Crow | 6 | 0.0% |
| Cuban | 15 | 0.1% |
| Czech | 59 | 0.4% |
| Czechoslovakian | 11 | 0.1% |
| Danish | 27 | 0.2% |
| Delaware | 41 | 0.3% |
| Dominican | 144 | 0.9% |
| Dutch | 545 | 3.6% |
| Eastern European | 66 | 0.4% |
| Ecuadorian | 56 | 0.4% |
| Egyptian | 91 | 0.6% |
| English | 809 | 5.3% |
| European | 106 | 0.7% |
| French | 194 | 1.3% |
| French Canadian | 22 | 0.1% |
| German | 2,500 | 16.4% |
| Ghanaian | 140 | 0.9% |
| Greek | 18 | 0.1% |
| Guatemalan | 58 | 0.4% |
| Guyanese | 6 | 0.0% |
| Haitian | 37 | 0.2% |
| Honduran | 18 | 0.1% |
| Hungarian | 682 | 4.5% |
| Indian (Asian) | 130 | 0.9% |
| Inupiat | 4 | 0.0% |
| Irish | 2,615 | 17.2% |
| Italian | 2,334 | 15.3% |
| Jamaican | 11 | 0.1% |
| Korean | 93 | 0.6% |
| Lithuanian | 35 | 0.2% |
| Mexican | 311 | 2.1% |
| Nigerian | 78 | 0.5% |
| Norwegian | 71 | 0.5% |
| Pennsylvania German | 38 | 0.3% |
| Peruvian | 106 | 0.7% |
| Polish | 475 | 3.1% |
| Portuguese | 32 | 0.2% |
| Puerto Rican | 1,085 | 7.1% |
| Romanian | 18 | 0.1% |
| Russian | 57 | 0.4% |
| Salvadoran | 61 | 0.4% |
| Scotch-Irish | 211 | 1.4% |
| Scottish | 224 | 1.5% |
| Slovak | 74 | 0.5% |
| South American | 316 | 2.1% |
| South American Indian | 12 | 0.1% |
| Spaniard | 37 | 0.2% |
| Spanish | 7 | 0.1% |
| Sri Lankan | 1 | 0.0% |
| Subsaharan African | 427 | 2.8% |
| Swedish | 50 | 0.3% |
| Swiss | 10 | 0.1% |
| Ugandan | 178 | 1.2% |
| Ukrainian | 39 | 0.3% |
| Vietnamese | 49 | 0.3% |
| Welsh | 96 | 0.6% |
| Yugoslavian | 70 | 0.5% | View All 70 Rows |
Immigrants in Phillipsburg
The most numerous immigrant groups reported in Phillipsburg came from Latin America (677 | 4.4%), South America (284 | 1.9%), Central America (244 | 1.6%), Africa (214 | 1.4%), and Asia (195 | 1.3%), together accounting for 10.6% of all Phillipsburg residents.
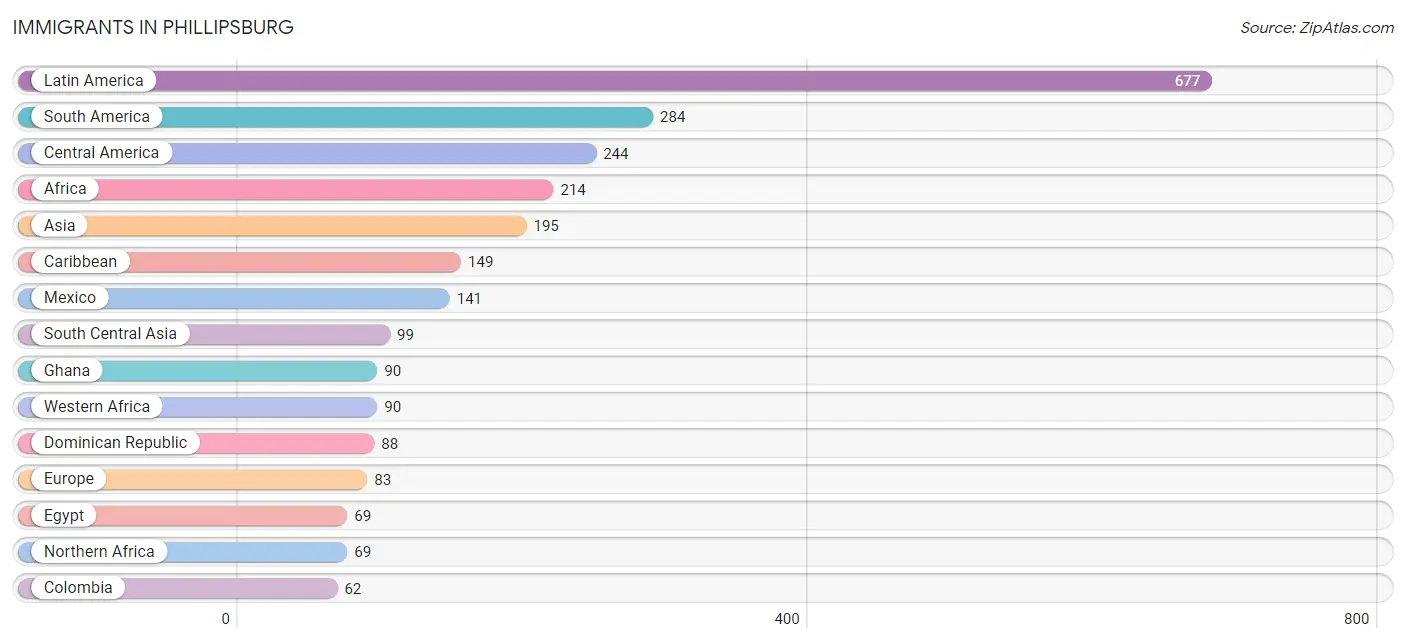
| Immigration Origin | # Population | % Population |
| Africa | 214 | 1.4% |
| Asia | 195 | 1.3% |
| Bangladesh | 49 | 0.3% |
| Brazil | 51 | 0.3% |
| Bulgaria | 31 | 0.2% |
| Caribbean | 149 | 1.0% |
| Central America | 244 | 1.6% |
| Chile | 23 | 0.2% |
| China | 56 | 0.4% |
| Colombia | 62 | 0.4% |
| Costa Rica | 40 | 0.3% |
| Dominican Republic | 88 | 0.6% |
| Eastern Africa | 55 | 0.4% |
| Eastern Asia | 56 | 0.4% |
| Eastern Europe | 40 | 0.3% |
| Ecuador | 62 | 0.4% |
| Egypt | 69 | 0.4% |
| El Salvador | 26 | 0.2% |
| Europe | 83 | 0.5% |
| Ghana | 90 | 0.6% |
| Guatemala | 19 | 0.1% |
| Guyana | 41 | 0.3% |
| Haiti | 26 | 0.2% |
| Honduras | 18 | 0.1% |
| Italy | 9 | 0.1% |
| Jamaica | 35 | 0.2% |
| Latin America | 677 | 4.4% |
| Mexico | 141 | 0.9% |
| Northern Africa | 69 | 0.4% |
| Northern Europe | 34 | 0.2% |
| Pakistan | 50 | 0.3% |
| Peru | 45 | 0.3% |
| Philippines | 39 | 0.3% |
| Romania | 9 | 0.1% |
| South America | 284 | 1.9% |
| South Central Asia | 99 | 0.6% |
| South Eastern Asia | 40 | 0.3% |
| Southern Europe | 9 | 0.1% |
| Uganda | 55 | 0.4% |
| Vietnam | 1 | 0.0% |
| Western Africa | 90 | 0.6% | View All 41 Rows |
Sex and Age in Phillipsburg
Sex and Age in Phillipsburg
The most populous age groups in Phillipsburg are 40 to 44 Years (597 | 7.9%) for men and 35 to 39 Years (650 | 8.5%) for women.
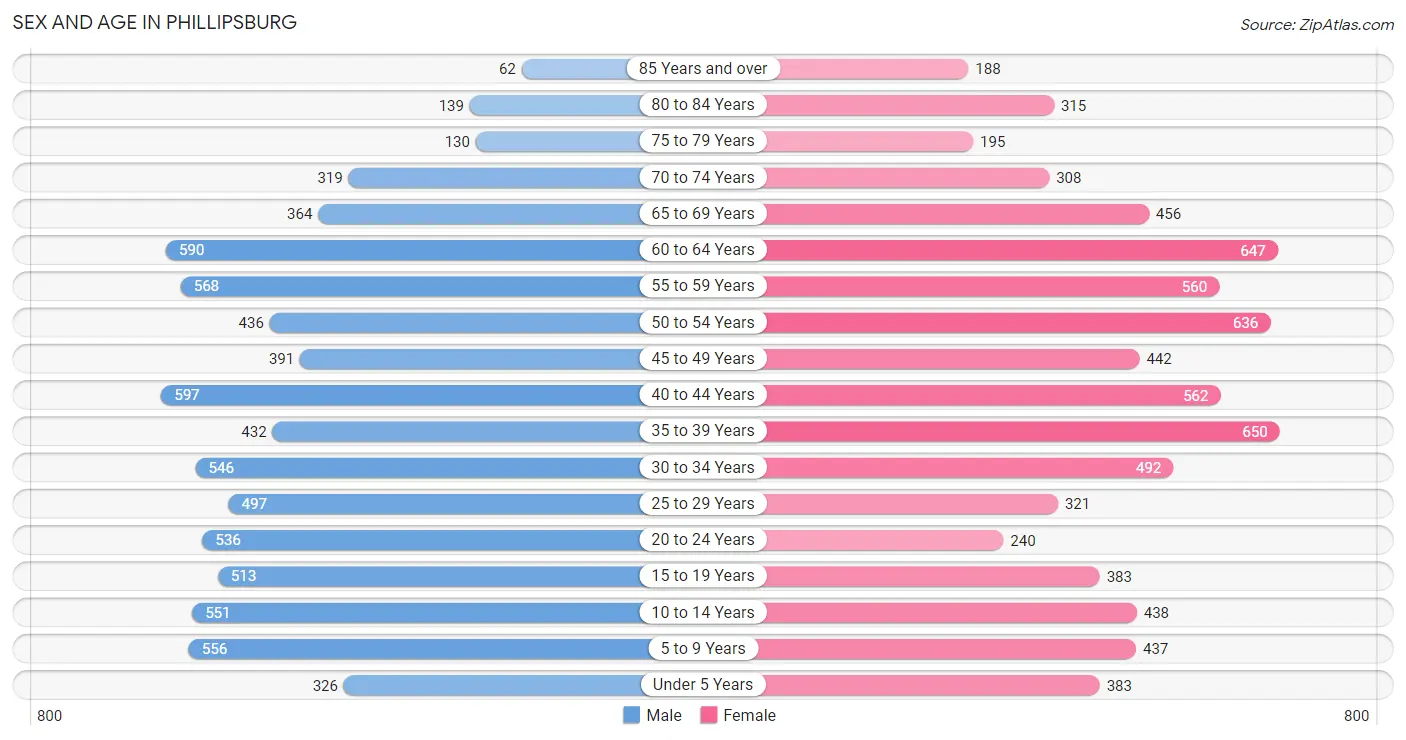
| Age Bracket | Male | Female |
| Under 5 Years | 326 (4.3%) | 383 (5.0%) |
| 5 to 9 Years | 556 (7.4%) | 437 (5.7%) |
| 10 to 14 Years | 551 (7.3%) | 438 (5.7%) |
| 15 to 19 Years | 513 (6.8%) | 383 (5.0%) |
| 20 to 24 Years | 536 (7.1%) | 240 (3.1%) |
| 25 to 29 Years | 497 (6.6%) | 321 (4.2%) |
| 30 to 34 Years | 546 (7.2%) | 492 (6.4%) |
| 35 to 39 Years | 432 (5.7%) | 650 (8.5%) |
| 40 to 44 Years | 597 (7.9%) | 562 (7.3%) |
| 45 to 49 Years | 391 (5.2%) | 442 (5.8%) |
| 50 to 54 Years | 436 (5.8%) | 636 (8.3%) |
| 55 to 59 Years | 568 (7.5%) | 560 (7.3%) |
| 60 to 64 Years | 590 (7.8%) | 647 (8.5%) |
| 65 to 69 Years | 364 (4.8%) | 456 (6.0%) |
| 70 to 74 Years | 319 (4.2%) | 308 (4.0%) |
| 75 to 79 Years | 130 (1.7%) | 195 (2.5%) |
| 80 to 84 Years | 139 (1.8%) | 315 (4.1%) |
| 85 Years and over | 62 (0.8%) | 188 (2.5%) |
| Total | 7,553 (100.0%) | 7,653 (100.0%) |
Families and Households in Phillipsburg
Median Family Size in Phillipsburg
The median family size in Phillipsburg is 2.94 persons per family, with married-couple families (2,301 | 61.1%) accounting for the largest median family size of 3.1 persons per family. On the other hand, single male/father families (326 | 8.7%) represent the smallest median family size with 2.66 persons per family.
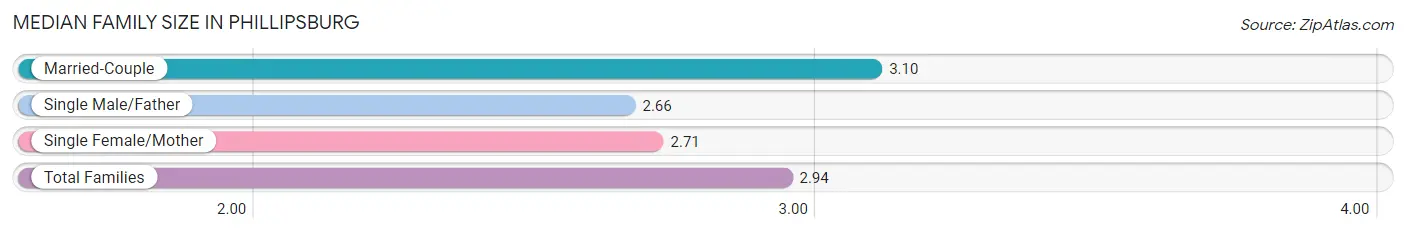
| Family Type | # Families | Family Size |
| Married-Couple | 2,301 (61.1%) | 3.10 |
| Single Male/Father | 326 (8.7%) | 2.66 |
| Single Female/Mother | 1,138 (30.2%) | 2.71 |
| Total Families | 3,765 (100.0%) | 2.94 |
Median Household Size in Phillipsburg
The median household size in Phillipsburg is 2.29 persons per household, with single male/father households (326 | 4.9%) accounting for the largest median household size of 3.28 persons per household. non-family households (2,837 | 43.0%) represent the smallest median household size with 1.25 persons per household.
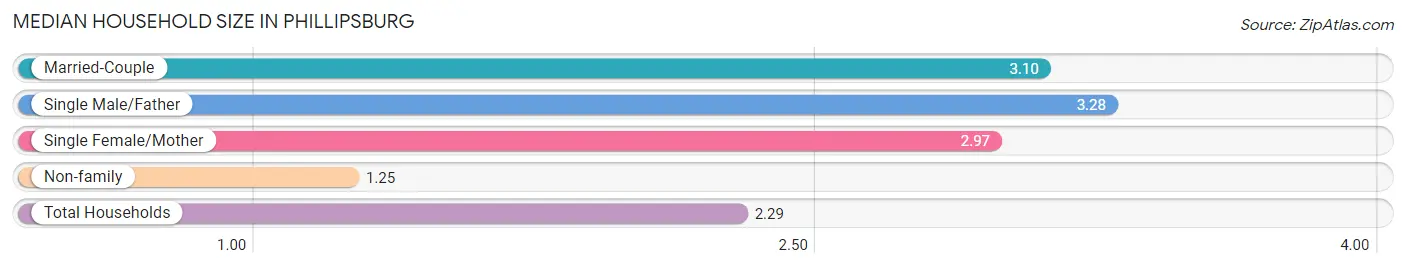
| Household Type | # Households | Household Size |
| Married-Couple | 2,301 (34.8%) | 3.10 |
| Single Male/Father | 326 (4.9%) | 3.28 |
| Single Female/Mother | 1,138 (17.2%) | 2.97 |
| Non-family | 2,837 (43.0%) | 1.25 |
| Total Households | 6,602 (100.0%) | 2.29 |
Household Size by Marriage Status in Phillipsburg
Out of a total of 6,602 households in Phillipsburg, 3,765 (57.0%) are family households, while 2,837 (43.0%) are nonfamily households. The most numerous type of family households are 2-person households, comprising 1,753, and the most common type of nonfamily households are 1-person households, comprising 2,410.
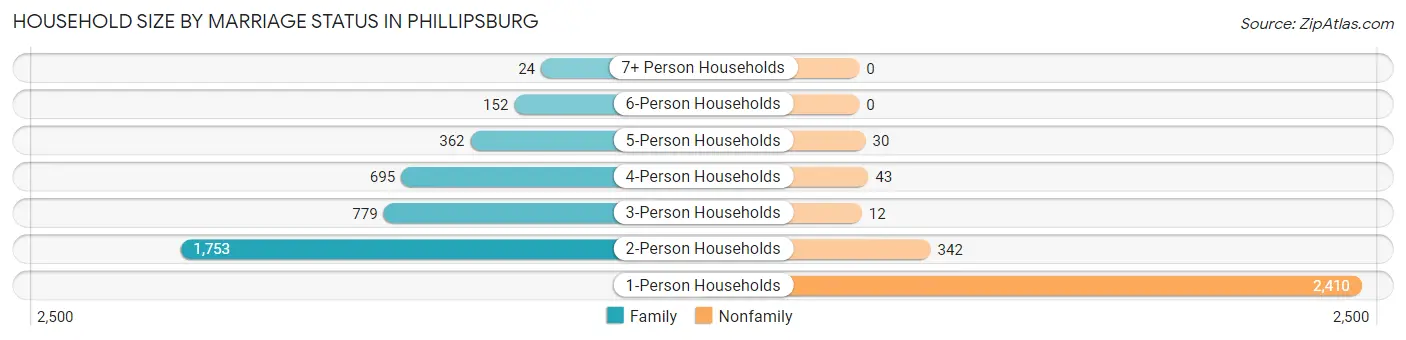
| Household Size | Family Households | Nonfamily Households |
| 1-Person Households | - | 2,410 (36.5%) |
| 2-Person Households | 1,753 (26.6%) | 342 (5.2%) |
| 3-Person Households | 779 (11.8%) | 12 (0.2%) |
| 4-Person Households | 695 (10.5%) | 43 (0.6%) |
| 5-Person Households | 362 (5.5%) | 30 (0.4%) |
| 6-Person Households | 152 (2.3%) | 0 (0.0%) |
| 7+ Person Households | 24 (0.4%) | 0 (0.0%) |
| Total | 3,765 (57.0%) | 2,837 (43.0%) |
Female Fertility in Phillipsburg
Fertility by Age in Phillipsburg
Average fertility rate in Phillipsburg is 39.0 births per 1,000 women. Women in the age bracket of 20 to 34 years have the highest fertility rate with 63.0 births per 1,000 women. Women in the age bracket of 20 to 34 years acount for 52.0% of all women with births.
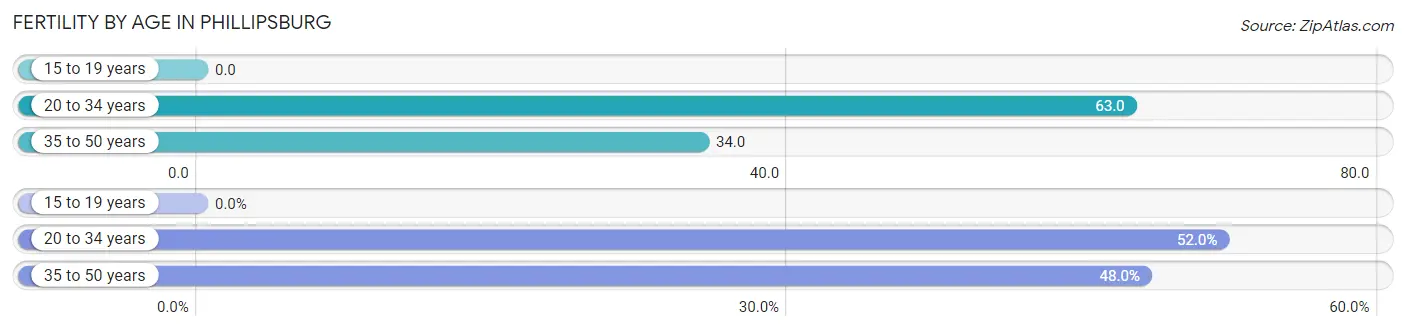
| Age Bracket | Women with Births | Births / 1,000 Women |
| 15 to 19 years | 0 (0.0%) | 0.0 |
| 20 to 34 years | 66 (52.0%) | 63.0 |
| 35 to 50 years | 61 (48.0%) | 34.0 |
| Total | 127 (100.0%) | 39.0 |
Fertility by Age by Marriage Status in Phillipsburg
93.7% of women with births (127) in Phillipsburg are married. The highest percentage of unmarried women with births falls into 20 to 34 years age bracket with 12.1% of them unmarried at the time of birth, while the lowest percentage of unmarried women with births belong to 35 to 50 years age bracket with 0.0% of them unmarried.
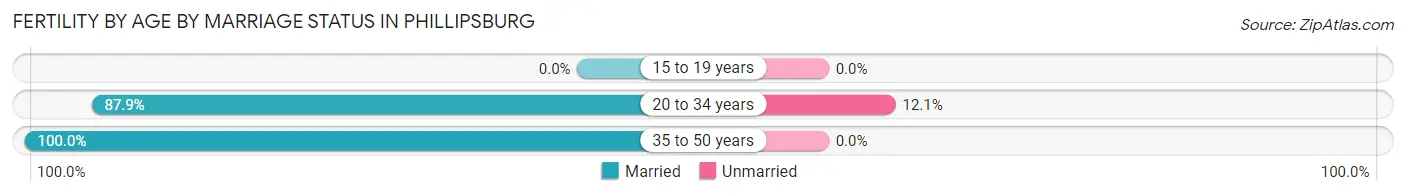
| Age Bracket | Married | Unmarried |
| 15 to 19 years | 0 (0.0%) | 0 (0.0%) |
| 20 to 34 years | 58 (87.9%) | 8 (12.1%) |
| 35 to 50 years | 61 (100.0%) | 0 (0.0%) |
| Total | 119 (93.7%) | 8 (6.3%) |
Fertility by Education in Phillipsburg
Average fertility rate in Phillipsburg is 39.0 births per 1,000 women. Women with the education attainment of graduate degree have the highest fertility rate of 87.0 births per 1,000 women, while women with the education attainment of less than high school have the lowest fertility at 19.0 births per 1,000 women. Women with the education attainment of college or associate's degree represent 31.5% of all women with births.
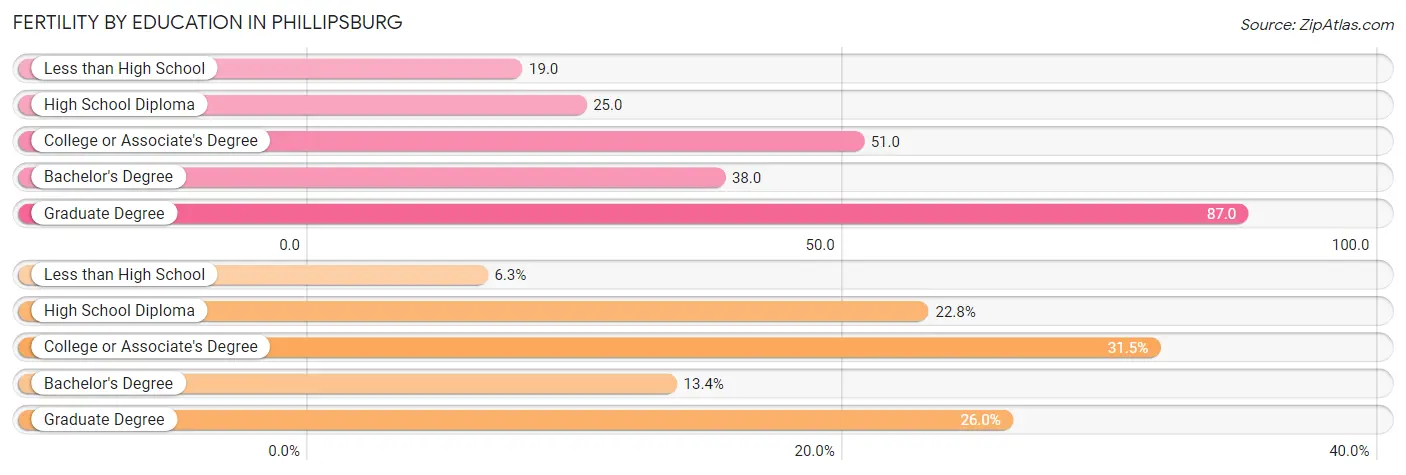
| Educational Attainment | Women with Births | Births / 1,000 Women |
| Less than High School | 8 (6.3%) | 19.0 |
| High School Diploma | 29 (22.8%) | 25.0 |
| College or Associate's Degree | 40 (31.5%) | 51.0 |
| Bachelor's Degree | 17 (13.4%) | 38.0 |
| Graduate Degree | 33 (26.0%) | 87.0 |
| Total | 127 (100.0%) | 39.0 |
Fertility by Education by Marriage Status in Phillipsburg
6.3% of women with births in Phillipsburg are unmarried. Women with the educational attainment of high school diploma are most likely to be married with 100.0% of them married at childbirth, while women with the educational attainment of less than high school are least likely to be married with 100.0% of them unmarried at childbirth.
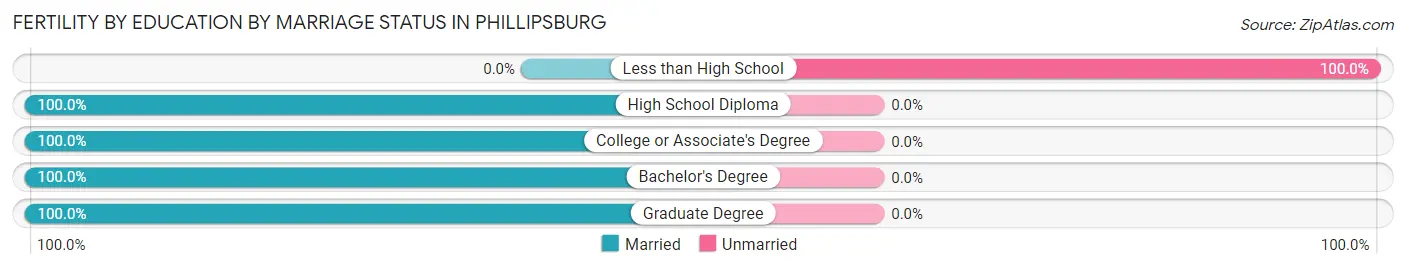
| Educational Attainment | Married | Unmarried |
| Less than High School | 0 (0.0%) | 8 (100.0%) |
| High School Diploma | 29 (100.0%) | 0 (0.0%) |
| College or Associate's Degree | 40 (100.0%) | 0 (0.0%) |
| Bachelor's Degree | 17 (100.0%) | 0 (0.0%) |
| Graduate Degree | 33 (100.0%) | 0 (0.0%) |
| Total | 119 (93.7%) | 8 (6.3%) |
Employment Characteristics in Phillipsburg
Employment by Class of Employer in Phillipsburg
Among the 7,232 employed individuals in Phillipsburg, private company employees (5,027 | 69.5%), not-for-profit organizations (879 | 12.1%), and local government employees (557 | 7.7%) make up the most common classes of employment.
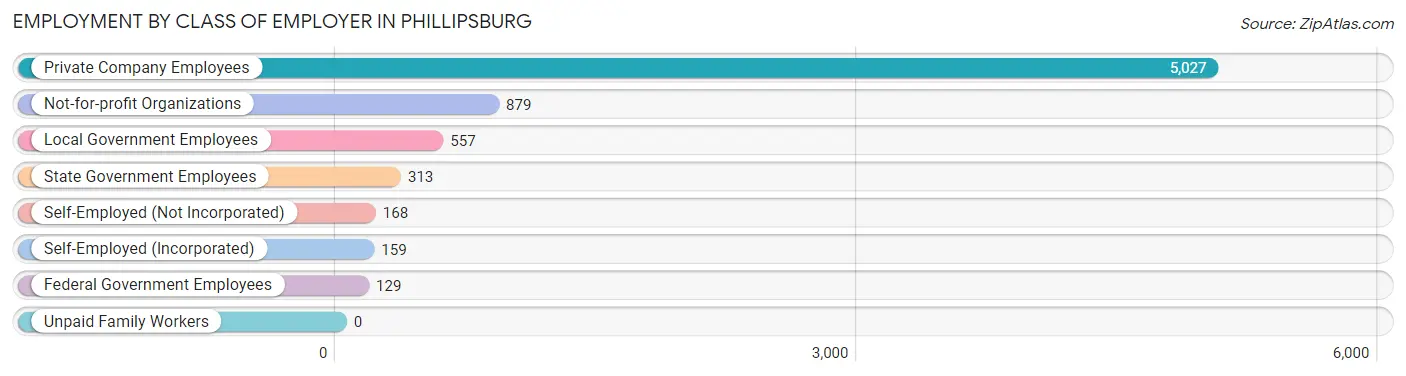
| Employer Class | # Employees | % Employees |
| Private Company Employees | 5,027 | 69.5% |
| Self-Employed (Incorporated) | 159 | 2.2% |
| Self-Employed (Not Incorporated) | 168 | 2.3% |
| Not-for-profit Organizations | 879 | 12.1% |
| Local Government Employees | 557 | 7.7% |
| State Government Employees | 313 | 4.3% |
| Federal Government Employees | 129 | 1.8% |
| Unpaid Family Workers | 0 | 0.0% |
| Total | 7,232 | 100.0% |
Employment Status by Age in Phillipsburg
According to the labor force statistics for Phillipsburg, out of the total population over 16 years of age (12,406), 65.6% or 8,138 individuals are in the labor force, with 8.4% or 684 of them unemployed. The age group with the highest labor force participation rate is 25 to 29 years, with 91.2% or 746 individuals in the labor force. Within the labor force, the 16 to 19 years age range has the highest percentage of unemployed individuals, with 12.8% or 56 of them being unemployed.
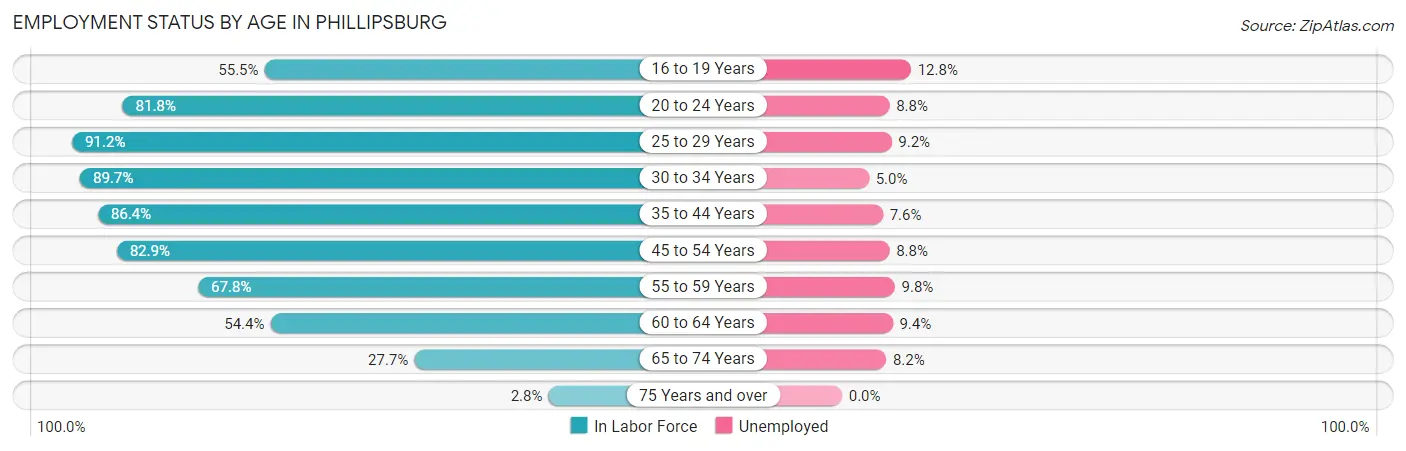
| Age Bracket | In Labor Force | Unemployed |
| 16 to 19 Years | 437 (55.5%) | 56 (12.8%) |
| 20 to 24 Years | 635 (81.8%) | 56 (8.8%) |
| 25 to 29 Years | 746 (91.2%) | 69 (9.2%) |
| 30 to 34 Years | 931 (89.7%) | 47 (5.0%) |
| 35 to 44 Years | 1,936 (86.4%) | 147 (7.6%) |
| 45 to 54 Years | 1,579 (82.9%) | 139 (8.8%) |
| 55 to 59 Years | 765 (67.8%) | 75 (9.8%) |
| 60 to 64 Years | 673 (54.4%) | 63 (9.4%) |
| 65 to 74 Years | 401 (27.7%) | 33 (8.2%) |
| 75 Years and over | 29 (2.8%) | 0 (0.0%) |
| Total | 8,138 (65.6%) | 684 (8.4%) |
Employment Status by Educational Attainment in Phillipsburg
According to labor force statistics for Phillipsburg, 79.3% of individuals (6,635) out of the total population between 25 and 64 years of age (8,367) are in the labor force, with 8.1% or 537 of them being unemployed. The group with the highest labor force participation rate are those with the educational attainment of bachelor's degree or higher, with 94.3% or 1,883 individuals in the labor force. Within the labor force, individuals with college / associate degree education have the highest percentage of unemployment, with 13.2% or 217 of them being unemployed.
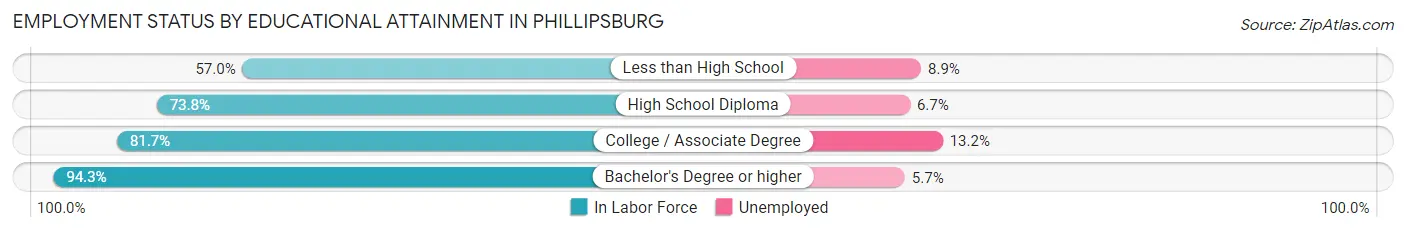
| Educational Attainment | In Labor Force | Unemployed |
| Less than High School | 382 (57.0%) | 60 (8.9%) |
| High School Diploma | 2,724 (73.8%) | 247 (6.7%) |
| College / Associate Degree | 1,641 (81.7%) | 265 (13.2%) |
| Bachelor's Degree or higher | 1,883 (94.3%) | 114 (5.7%) |
| Total | 6,635 (79.3%) | 678 (8.1%) |
Employment Occupations by Sex in Phillipsburg
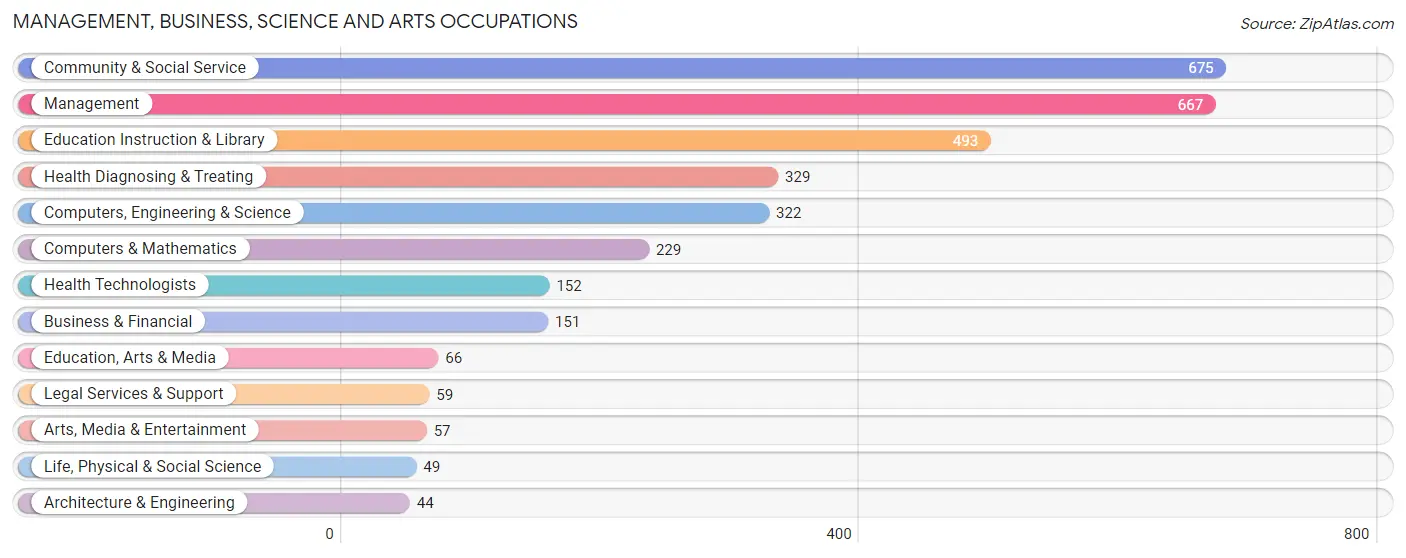
Management, Business, Science and Arts Occupations
The most common Management, Business, Science and Arts occupations in Phillipsburg are Community & Social Service (675 | 9.1%), Management (667 | 8.9%), Education Instruction & Library (493 | 6.6%), Health Diagnosing & Treating (329 | 4.4%), and Computers, Engineering & Science (322 | 4.3%).
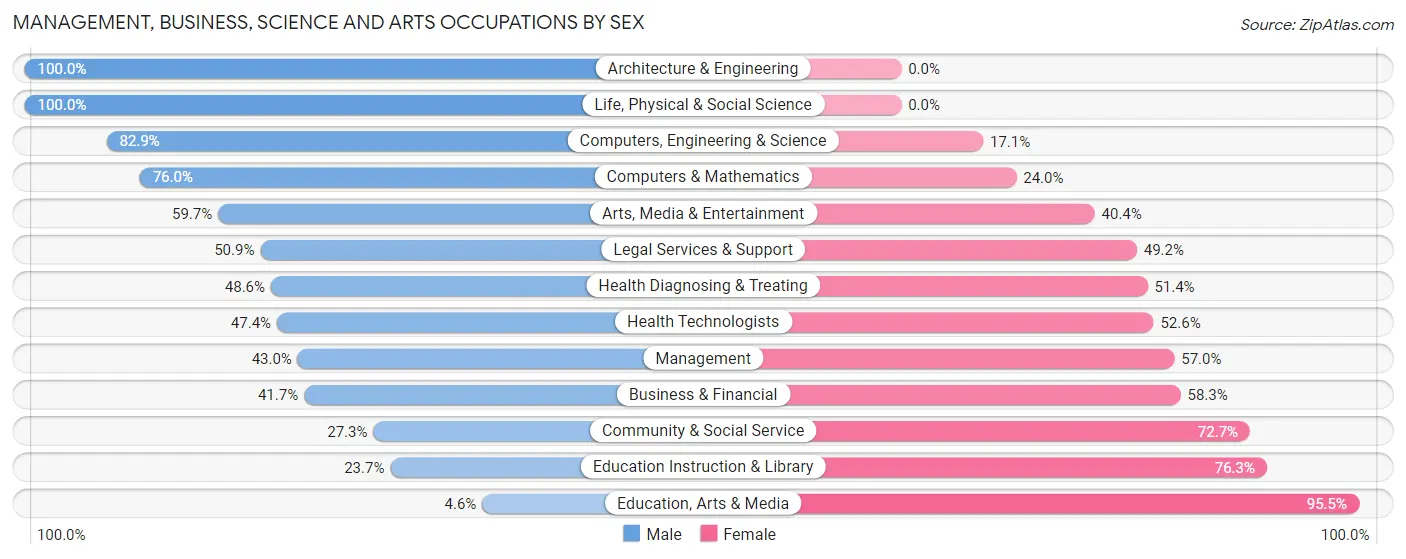
Management, Business, Science and Arts Occupations by Sex
Within the Management, Business, Science and Arts occupations in Phillipsburg, the most male-oriented occupations are Architecture & Engineering (100.0%), Life, Physical & Social Science (100.0%), and Computers, Engineering & Science (82.9%), while the most female-oriented occupations are Education, Arts & Media (95.5%), Education Instruction & Library (76.3%), and Community & Social Service (72.7%).
| Occupation | Male | Female |
| Management | 287 (43.0%) | 380 (57.0%) |
| Business & Financial | 63 (41.7%) | 88 (58.3%) |
| Computers, Engineering & Science | 267 (82.9%) | 55 (17.1%) |
| Computers & Mathematics | 174 (76.0%) | 55 (24.0%) |
| Architecture & Engineering | 44 (100.0%) | 0 (0.0%) |
| Life, Physical & Social Science | 49 (100.0%) | 0 (0.0%) |
| Community & Social Service | 184 (27.3%) | 491 (72.7%) |
| Education, Arts & Media | 3 (4.5%) | 63 (95.5%) |
| Legal Services & Support | 30 (50.8%) | 29 (49.1%) |
| Education Instruction & Library | 117 (23.7%) | 376 (76.3%) |
| Arts, Media & Entertainment | 34 (59.7%) | 23 (40.4%) |
| Health Diagnosing & Treating | 160 (48.6%) | 169 (51.4%) |
| Health Technologists | 72 (47.4%) | 80 (52.6%) |
| Total (Category) | 961 (44.8%) | 1,183 (55.2%) |
| Total (Overall) | 4,181 (56.1%) | 3,268 (43.9%) |
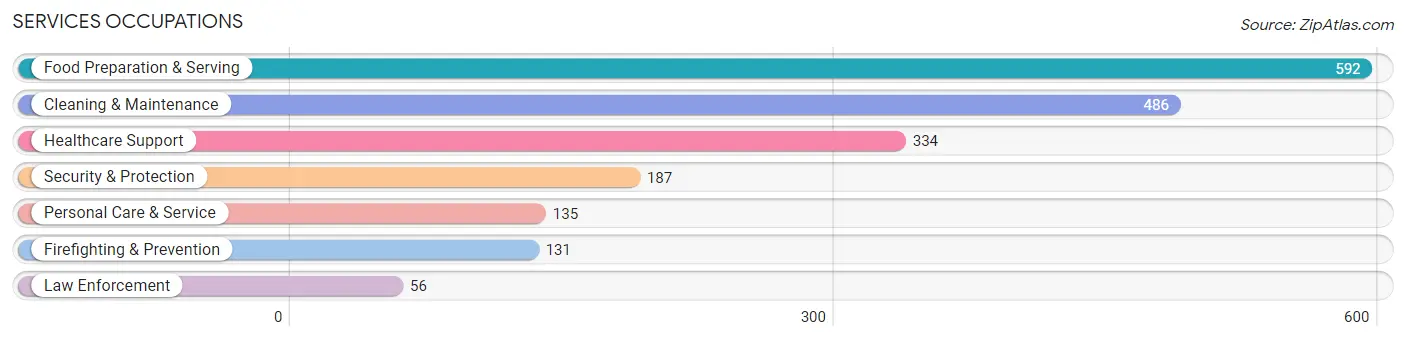
Services Occupations
The most common Services occupations in Phillipsburg are Food Preparation & Serving (592 | 8.0%), Cleaning & Maintenance (486 | 6.5%), Healthcare Support (334 | 4.5%), Security & Protection (187 | 2.5%), and Personal Care & Service (135 | 1.8%).
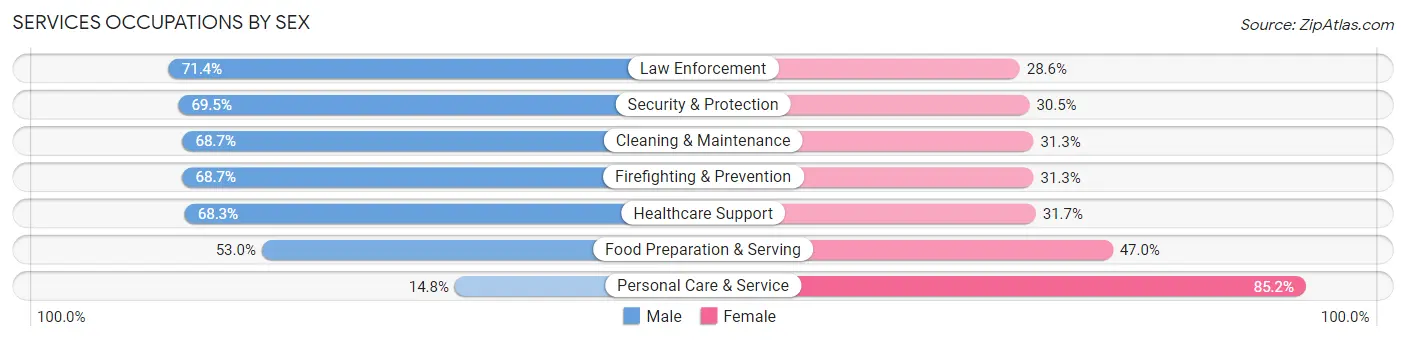
Services Occupations by Sex
Within the Services occupations in Phillipsburg, the most male-oriented occupations are Law Enforcement (71.4%), Security & Protection (69.5%), and Cleaning & Maintenance (68.7%), while the most female-oriented occupations are Personal Care & Service (85.2%), Food Preparation & Serving (47.0%), and Healthcare Support (31.7%).
| Occupation | Male | Female |
| Healthcare Support | 228 (68.3%) | 106 (31.7%) |
| Security & Protection | 130 (69.5%) | 57 (30.5%) |
| Firefighting & Prevention | 90 (68.7%) | 41 (31.3%) |
| Law Enforcement | 40 (71.4%) | 16 (28.6%) |
| Food Preparation & Serving | 314 (53.0%) | 278 (47.0%) |
| Cleaning & Maintenance | 334 (68.7%) | 152 (31.3%) |
| Personal Care & Service | 20 (14.8%) | 115 (85.2%) |
| Total (Category) | 1,026 (59.2%) | 708 (40.8%) |
| Total (Overall) | 4,181 (56.1%) | 3,268 (43.9%) |
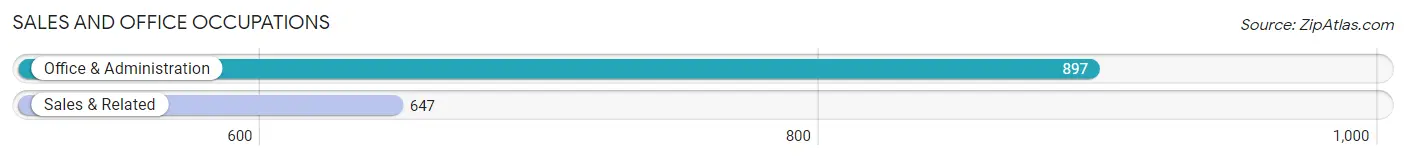
Sales and Office Occupations
The most common Sales and Office occupations in Phillipsburg are Office & Administration (897 | 12.0%), and Sales & Related (647 | 8.7%).
Sales and Office Occupations by Sex
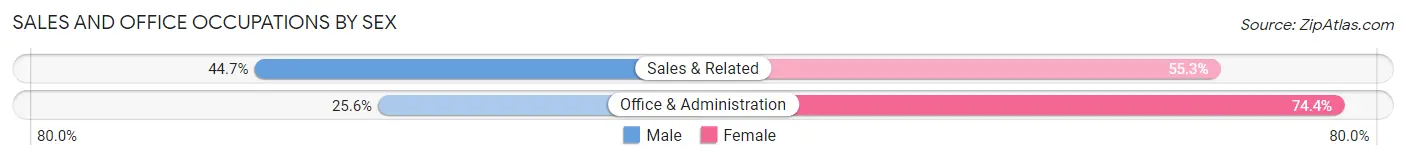
| Occupation | Male | Female |
| Sales & Related | 289 (44.7%) | 358 (55.3%) |
| Office & Administration | 230 (25.6%) | 667 (74.4%) |
| Total (Category) | 519 (33.6%) | 1,025 (66.4%) |
| Total (Overall) | 4,181 (56.1%) | 3,268 (43.9%) |
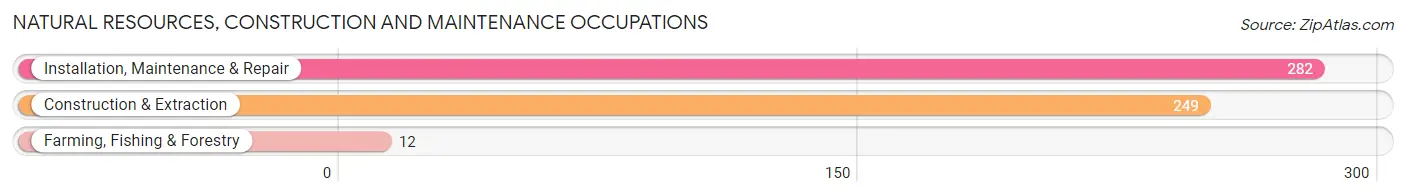
Natural Resources, Construction and Maintenance Occupations
The most common Natural Resources, Construction and Maintenance occupations in Phillipsburg are Installation, Maintenance & Repair (282 | 3.8%), Construction & Extraction (249 | 3.3%), and Farming, Fishing & Forestry (12 | 0.2%).
Natural Resources, Construction and Maintenance Occupations by Sex
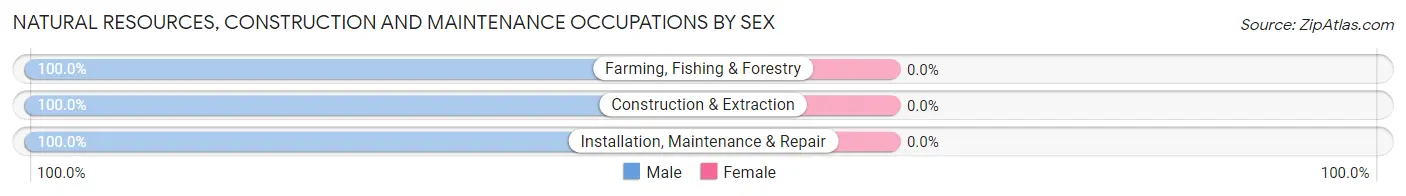
| Occupation | Male | Female |
| Farming, Fishing & Forestry | 12 (100.0%) | 0 (0.0%) |
| Construction & Extraction | 249 (100.0%) | 0 (0.0%) |
| Installation, Maintenance & Repair | 282 (100.0%) | 0 (0.0%) |
| Total (Category) | 543 (100.0%) | 0 (0.0%) |
| Total (Overall) | 4,181 (56.1%) | 3,268 (43.9%) |
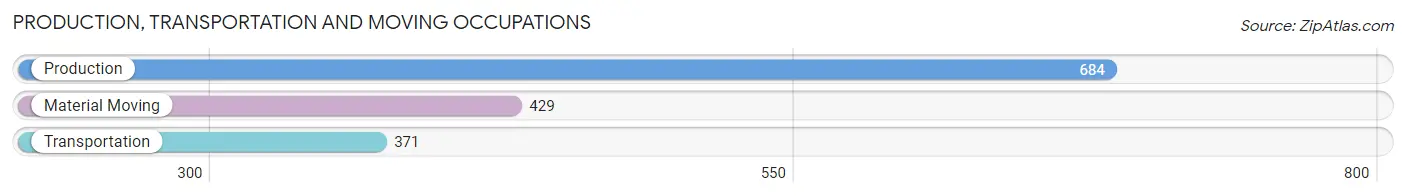
Production, Transportation and Moving Occupations
The most common Production, Transportation and Moving occupations in Phillipsburg are Production (684 | 9.2%), Material Moving (429 | 5.8%), and Transportation (371 | 5.0%).
Production, Transportation and Moving Occupations by Sex
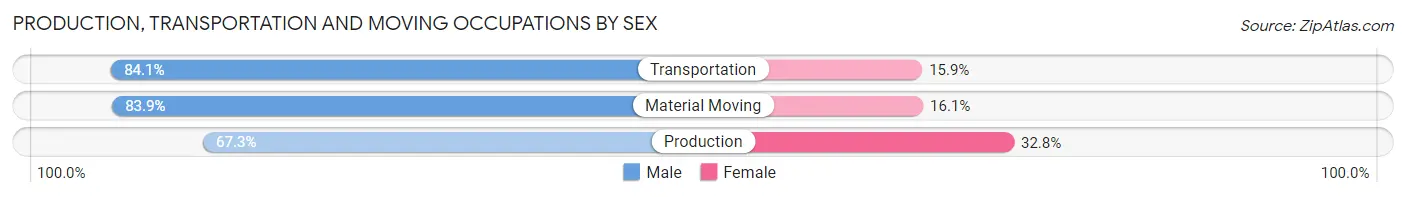
| Occupation | Male | Female |
| Production | 460 (67.2%) | 224 (32.8%) |
| Transportation | 312 (84.1%) | 59 (15.9%) |
| Material Moving | 360 (83.9%) | 69 (16.1%) |
| Total (Category) | 1,132 (76.3%) | 352 (23.7%) |
| Total (Overall) | 4,181 (56.1%) | 3,268 (43.9%) |
Employment Industries by Sex in Phillipsburg
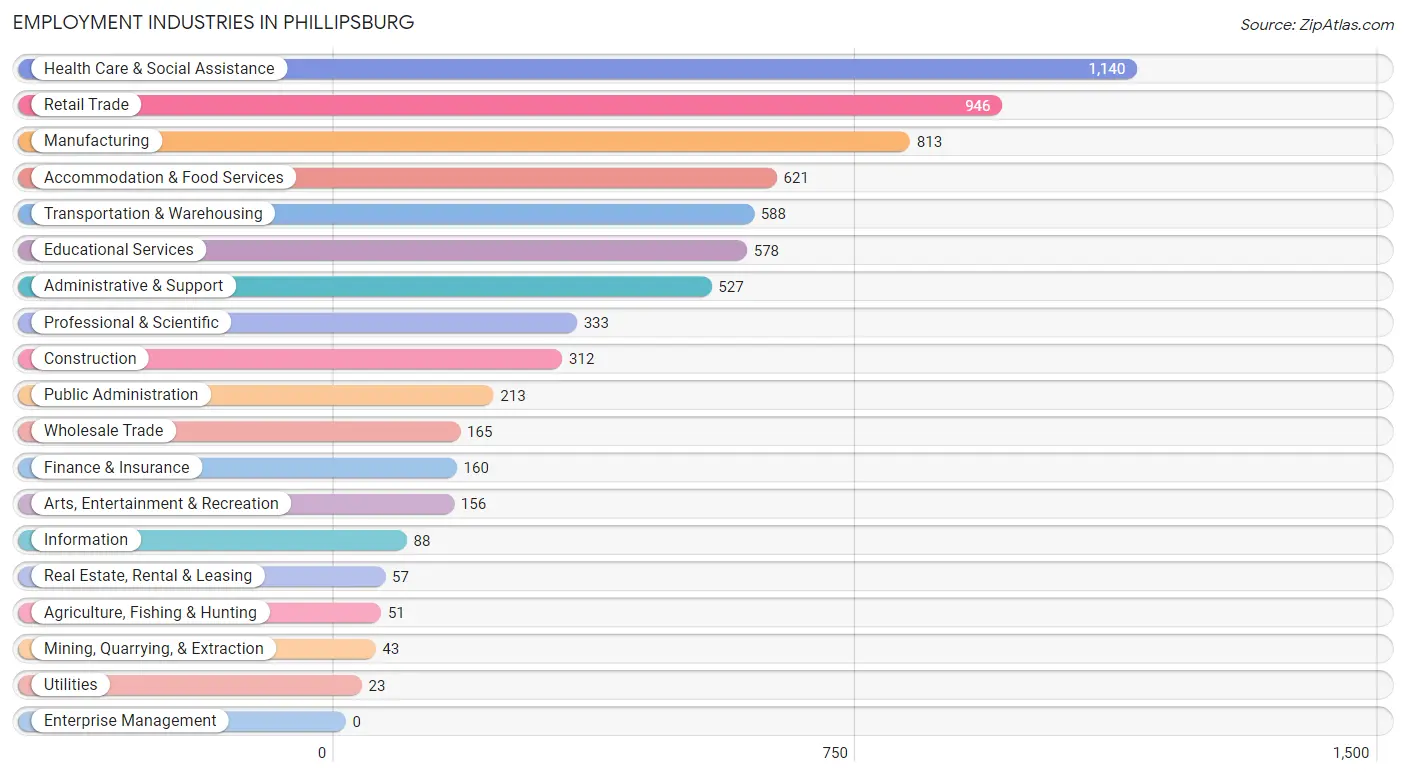
Employment Industries in Phillipsburg
The major employment industries in Phillipsburg include Health Care & Social Assistance (1,140 | 15.3%), Retail Trade (946 | 12.7%), Manufacturing (813 | 10.9%), Accommodation & Food Services (621 | 8.3%), and Transportation & Warehousing (588 | 7.9%).
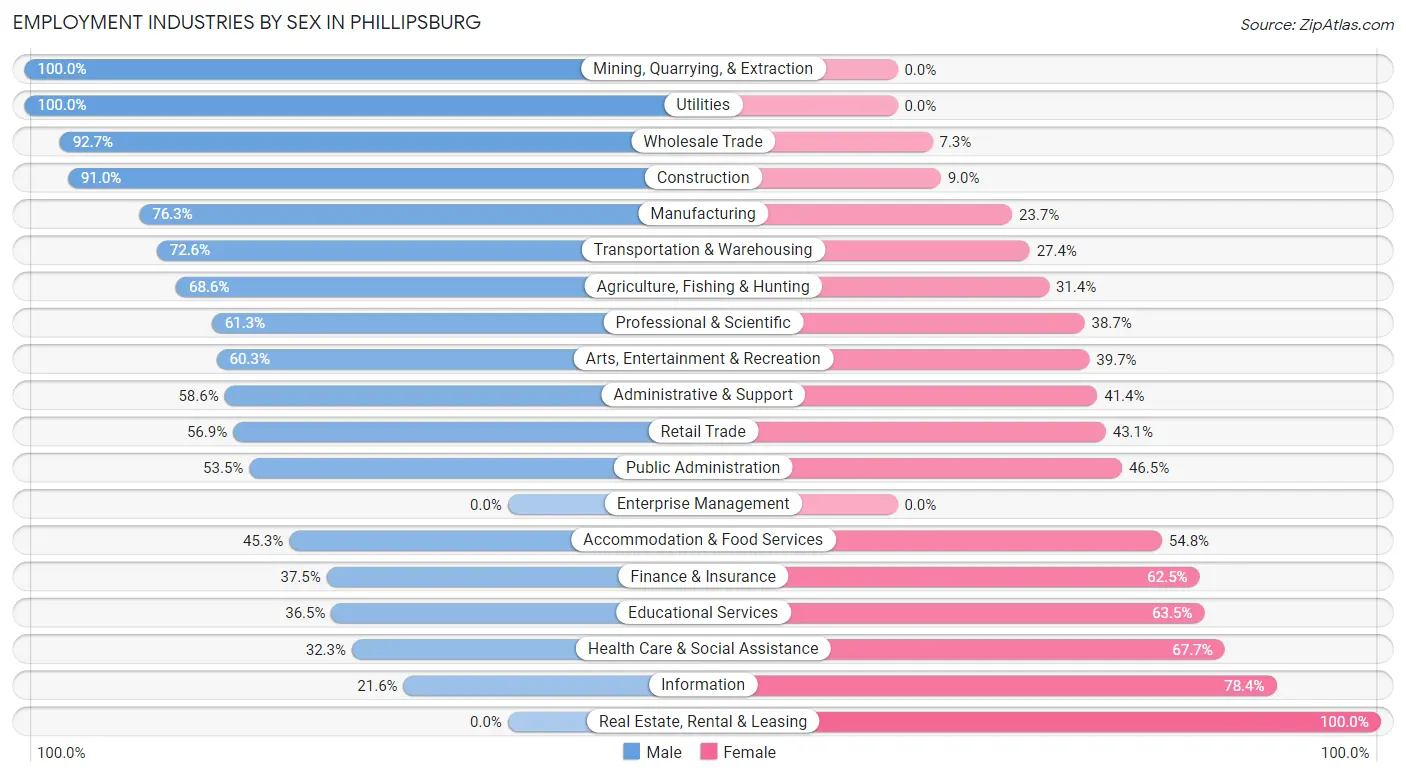
Employment Industries by Sex in Phillipsburg
The Phillipsburg industries that see more men than women are Mining, Quarrying, & Extraction (100.0%), Utilities (100.0%), and Wholesale Trade (92.7%), whereas the industries that tend to have a higher number of women are Real Estate, Rental & Leasing (100.0%), Information (78.4%), and Health Care & Social Assistance (67.7%).
| Industry | Male | Female |
| Agriculture, Fishing & Hunting | 35 (68.6%) | 16 (31.4%) |
| Mining, Quarrying, & Extraction | 43 (100.0%) | 0 (0.0%) |
| Construction | 284 (91.0%) | 28 (9.0%) |
| Manufacturing | 620 (76.3%) | 193 (23.7%) |
| Wholesale Trade | 153 (92.7%) | 12 (7.3%) |
| Retail Trade | 538 (56.9%) | 408 (43.1%) |
| Transportation & Warehousing | 427 (72.6%) | 161 (27.4%) |
| Utilities | 23 (100.0%) | 0 (0.0%) |
| Information | 19 (21.6%) | 69 (78.4%) |
| Finance & Insurance | 60 (37.5%) | 100 (62.5%) |
| Real Estate, Rental & Leasing | 0 (0.0%) | 57 (100.0%) |
| Professional & Scientific | 204 (61.3%) | 129 (38.7%) |
| Enterprise Management | 0 (0.0%) | 0 (0.0%) |
| Administrative & Support | 309 (58.6%) | 218 (41.4%) |
| Educational Services | 211 (36.5%) | 367 (63.5%) |
| Health Care & Social Assistance | 368 (32.3%) | 772 (67.7%) |
| Arts, Entertainment & Recreation | 94 (60.3%) | 62 (39.7%) |
| Accommodation & Food Services | 281 (45.3%) | 340 (54.7%) |
| Public Administration | 114 (53.5%) | 99 (46.5%) |
| Total | 4,181 (56.1%) | 3,268 (43.9%) |
Education in Phillipsburg
School Enrollment in Phillipsburg
The most common levels of schooling among the 3,123 students in Phillipsburg are middle school (904 | 28.9%), high school (658 | 21.1%), and elementary school (577 | 18.5%).
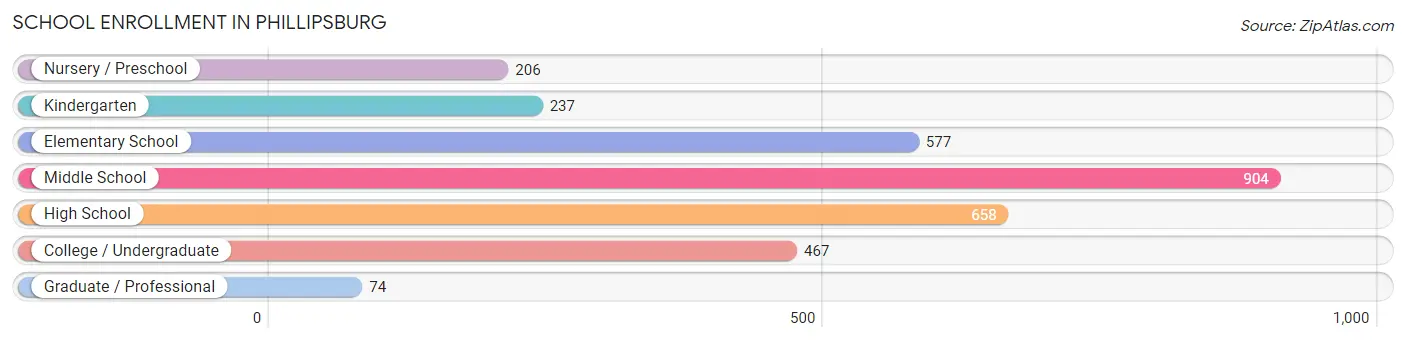
| School Level | # Students | % Students |
| Nursery / Preschool | 206 | 6.6% |
| Kindergarten | 237 | 7.6% |
| Elementary School | 577 | 18.5% |
| Middle School | 904 | 28.9% |
| High School | 658 | 21.1% |
| College / Undergraduate | 467 | 14.9% |
| Graduate / Professional | 74 | 2.4% |
| Total | 3,123 | 100.0% |
School Enrollment by Age by Funding Source in Phillipsburg
Out of a total of 3,123 students who are enrolled in schools in Phillipsburg, 575 (18.4%) attend a private institution, while the remaining 2,548 (81.6%) are enrolled in public schools. The age group of 35 years and over has the highest likelihood of being enrolled in private schools, with 58 (66.7% in the age bracket) enrolled. Conversely, the age group of 3 to 4 year olds has the lowest likelihood of being enrolled in a private school, with 182 (98.4% in the age bracket) attending a public institution.
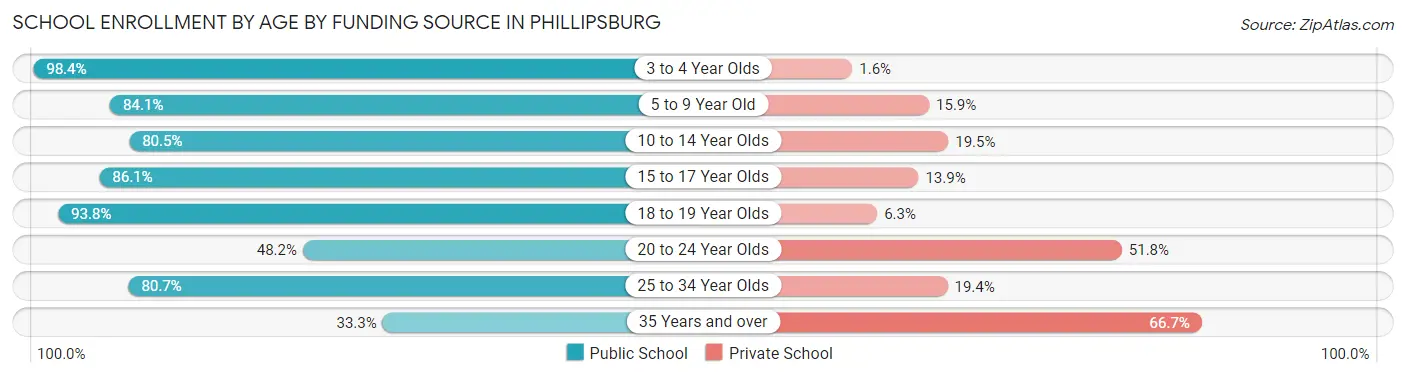
| Age Bracket | Public School | Private School |
| 3 to 4 Year Olds | 182 (98.4%) | 3 (1.6%) |
| 5 to 9 Year Old | 745 (84.1%) | 141 (15.9%) |
| 10 to 14 Year Olds | 789 (80.5%) | 191 (19.5%) |
| 15 to 17 Year Olds | 377 (86.1%) | 61 (13.9%) |
| 18 to 19 Year Olds | 210 (93.8%) | 14 (6.2%) |
| 20 to 24 Year Olds | 66 (48.2%) | 71 (51.8%) |
| 25 to 34 Year Olds | 150 (80.6%) | 36 (19.4%) |
| 35 Years and over | 29 (33.3%) | 58 (66.7%) |
| Total | 2,548 (81.6%) | 575 (18.4%) |
Educational Attainment by Field of Study in Phillipsburg
Business (568 | 21.1%), education (448 | 16.7%), computers & mathematics (247 | 9.2%), social sciences (220 | 8.2%), and physical & health sciences (209 | 7.8%) are the most common fields of study among 2,685 individuals in Phillipsburg who have obtained a bachelor's degree or higher.
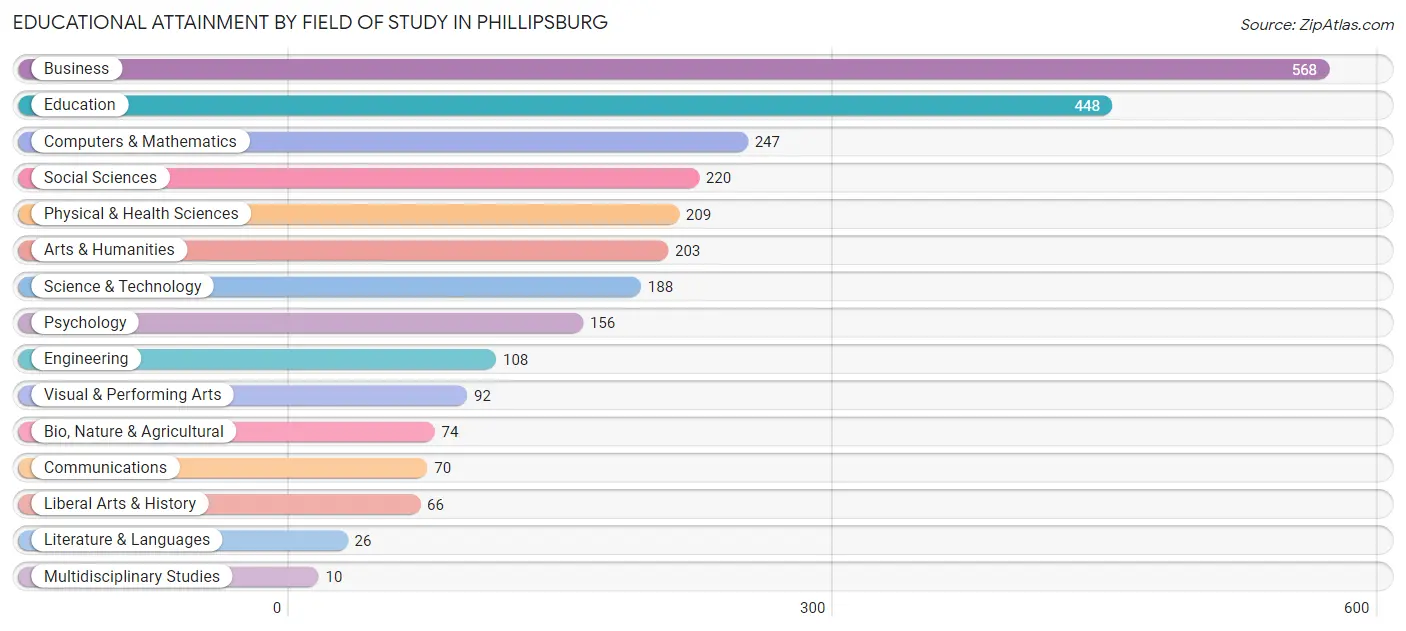
| Field of Study | # Graduates | % Graduates |
| Computers & Mathematics | 247 | 9.2% |
| Bio, Nature & Agricultural | 74 | 2.8% |
| Physical & Health Sciences | 209 | 7.8% |
| Psychology | 156 | 5.8% |
| Social Sciences | 220 | 8.2% |
| Engineering | 108 | 4.0% |
| Multidisciplinary Studies | 10 | 0.4% |
| Science & Technology | 188 | 7.0% |
| Business | 568 | 21.1% |
| Education | 448 | 16.7% |
| Literature & Languages | 26 | 1.0% |
| Liberal Arts & History | 66 | 2.5% |
| Visual & Performing Arts | 92 | 3.4% |
| Communications | 70 | 2.6% |
| Arts & Humanities | 203 | 7.6% |
| Total | 2,685 | 100.0% |
Transportation & Commute in Phillipsburg
Vehicle Availability by Sex in Phillipsburg
The most prevalent vehicle ownership categories in Phillipsburg are males with 2 vehicles (1,497, accounting for 36.5%) and females with 2 vehicles (1,097, making up 47.9%).
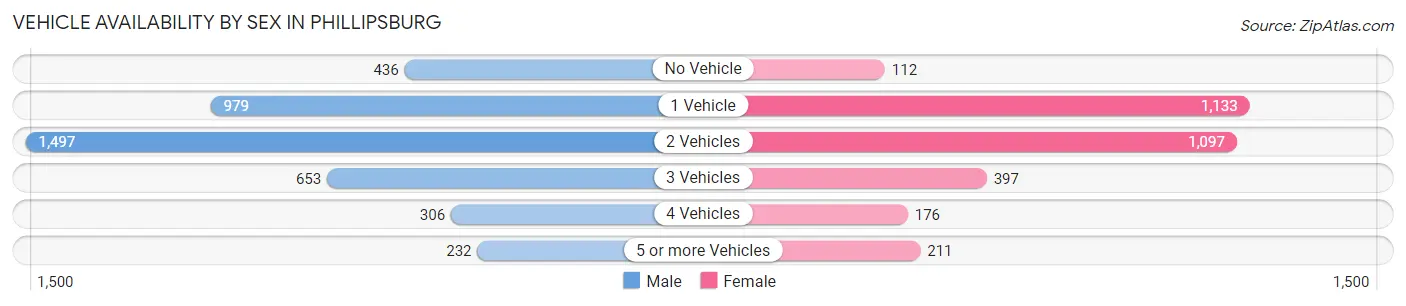
| Vehicles Available | Male | Female |
| No Vehicle | 436 (10.6%) | 112 (3.6%) |
| 1 Vehicle | 979 (23.9%) | 1,133 (36.2%) |
| 2 Vehicles | 1,497 (36.5%) | 1,097 (35.1%) |
| 3 Vehicles | 653 (15.9%) | 397 (12.7%) |
| 4 Vehicles | 306 (7.5%) | 176 (5.6%) |
| 5 or more Vehicles | 232 (5.7%) | 211 (6.8%) |
| Total | 4,103 (100.0%) | 3,126 (100.0%) |
Commute Time in Phillipsburg
The most frequently occuring commute durations in Phillipsburg are 5 to 9 minutes (1,120 commuters, 16.0%), 10 to 14 minutes (977 commuters, 14.0%), and 60 to 89 minutes (836 commuters, 11.9%).
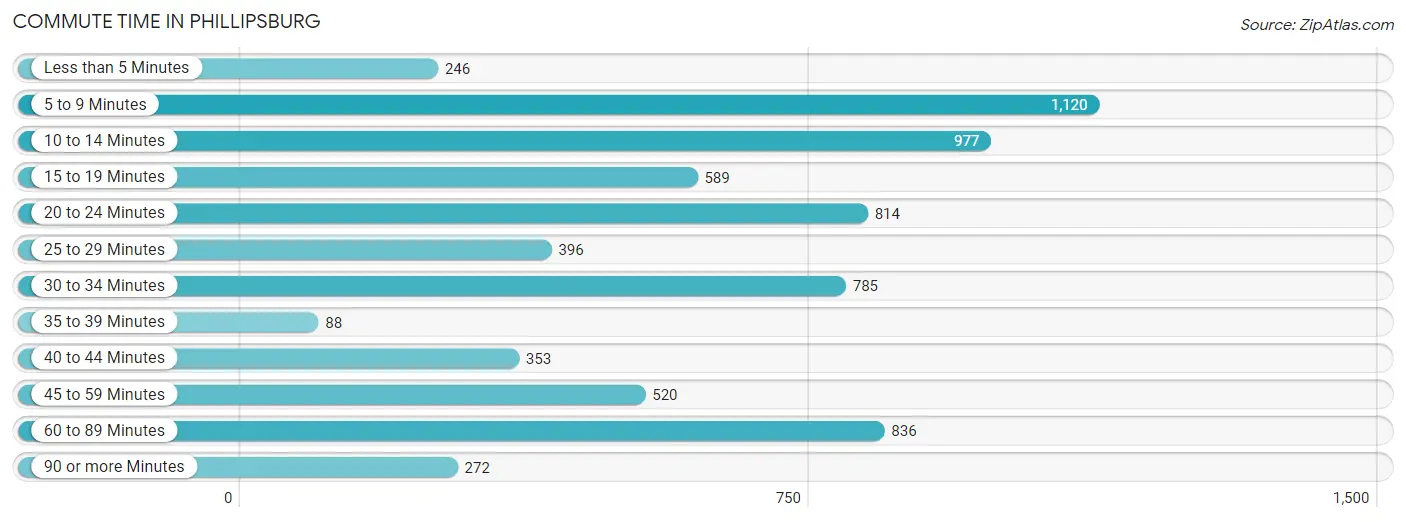
| Commute Time | # Commuters | % Commuters |
| Less than 5 Minutes | 246 | 3.5% |
| 5 to 9 Minutes | 1,120 | 16.0% |
| 10 to 14 Minutes | 977 | 14.0% |
| 15 to 19 Minutes | 589 | 8.4% |
| 20 to 24 Minutes | 814 | 11.6% |
| 25 to 29 Minutes | 396 | 5.7% |
| 30 to 34 Minutes | 785 | 11.2% |
| 35 to 39 Minutes | 88 | 1.3% |
| 40 to 44 Minutes | 353 | 5.1% |
| 45 to 59 Minutes | 520 | 7.4% |
| 60 to 89 Minutes | 836 | 11.9% |
| 90 or more Minutes | 272 | 3.9% |
Commute Time by Sex in Phillipsburg
The most common commute times in Phillipsburg are 10 to 14 minutes (538 commuters, 13.4%) for males and 5 to 9 minutes (741 commuters, 25.0%) for females.
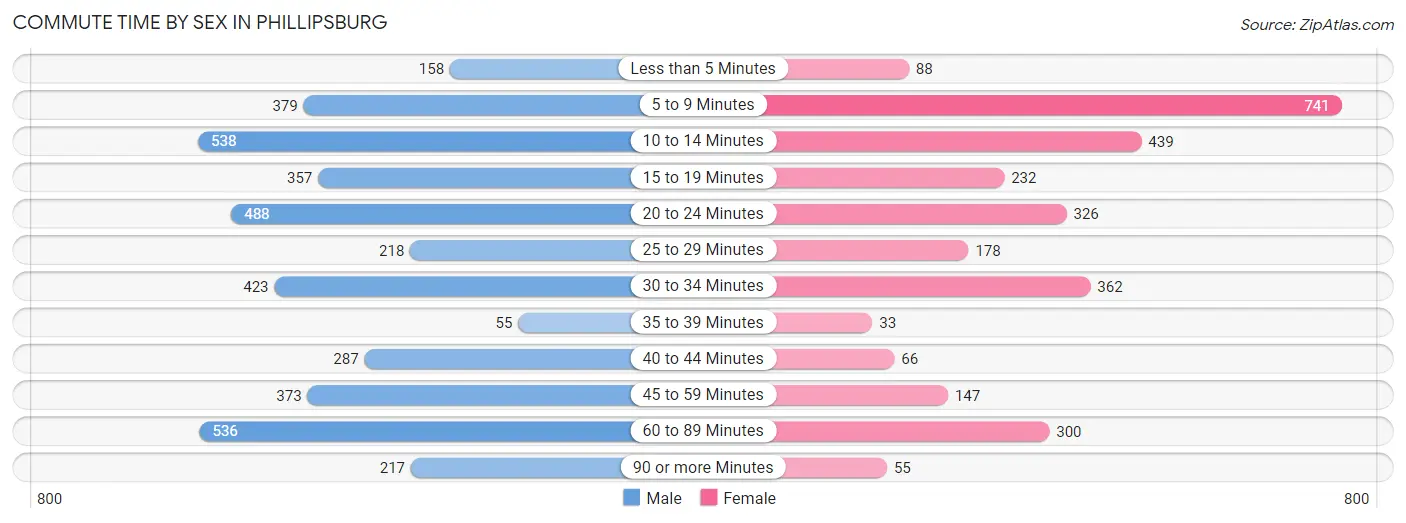
| Commute Time | Male | Female |
| Less than 5 Minutes | 158 (3.9%) | 88 (3.0%) |
| 5 to 9 Minutes | 379 (9.4%) | 741 (25.0%) |
| 10 to 14 Minutes | 538 (13.4%) | 439 (14.8%) |
| 15 to 19 Minutes | 357 (8.9%) | 232 (7.8%) |
| 20 to 24 Minutes | 488 (12.1%) | 326 (11.0%) |
| 25 to 29 Minutes | 218 (5.4%) | 178 (6.0%) |
| 30 to 34 Minutes | 423 (10.5%) | 362 (12.2%) |
| 35 to 39 Minutes | 55 (1.4%) | 33 (1.1%) |
| 40 to 44 Minutes | 287 (7.1%) | 66 (2.2%) |
| 45 to 59 Minutes | 373 (9.3%) | 147 (5.0%) |
| 60 to 89 Minutes | 536 (13.3%) | 300 (10.1%) |
| 90 or more Minutes | 217 (5.4%) | 55 (1.8%) |
Time of Departure to Work by Sex in Phillipsburg
The most frequent times of departure to work in Phillipsburg are 6:00 AM to 6:29 AM (642, 15.9%) for males and 7:30 AM to 7:59 AM (479, 16.1%) for females.
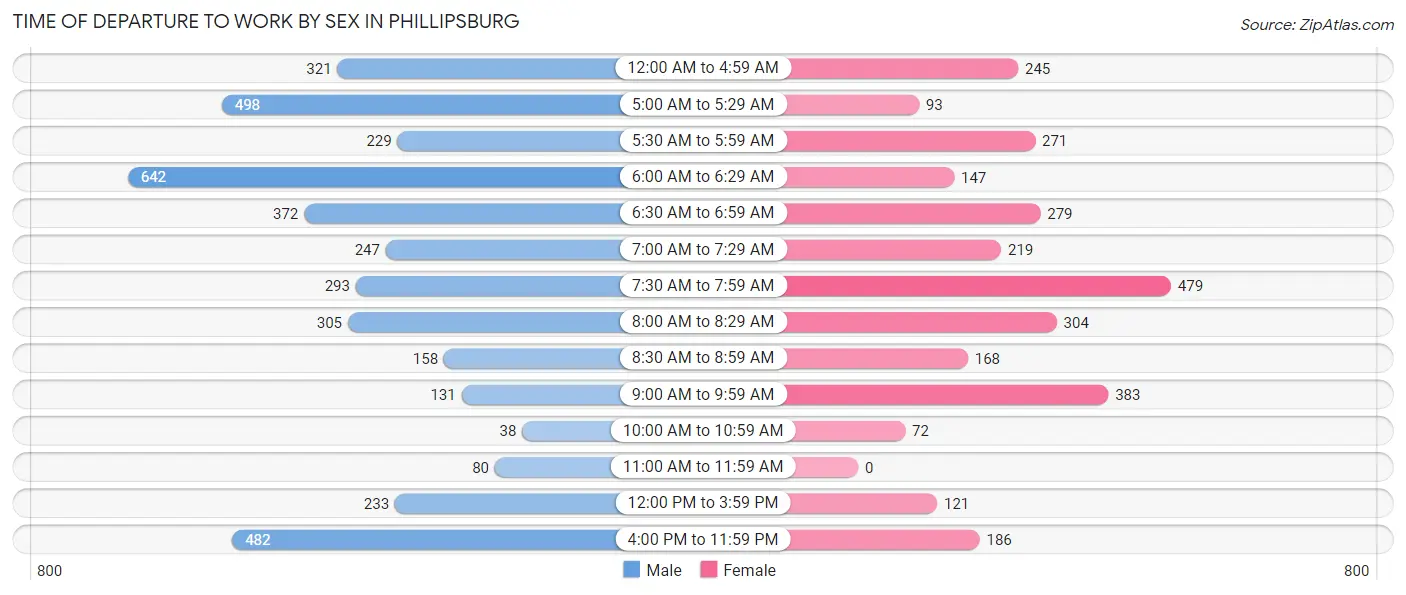
| Time of Departure | Male | Female |
| 12:00 AM to 4:59 AM | 321 (8.0%) | 245 (8.3%) |
| 5:00 AM to 5:29 AM | 498 (12.4%) | 93 (3.1%) |
| 5:30 AM to 5:59 AM | 229 (5.7%) | 271 (9.1%) |
| 6:00 AM to 6:29 AM | 642 (15.9%) | 147 (5.0%) |
| 6:30 AM to 6:59 AM | 372 (9.2%) | 279 (9.4%) |
| 7:00 AM to 7:29 AM | 247 (6.1%) | 219 (7.4%) |
| 7:30 AM to 7:59 AM | 293 (7.3%) | 479 (16.1%) |
| 8:00 AM to 8:29 AM | 305 (7.6%) | 304 (10.2%) |
| 8:30 AM to 8:59 AM | 158 (3.9%) | 168 (5.7%) |
| 9:00 AM to 9:59 AM | 131 (3.3%) | 383 (12.9%) |
| 10:00 AM to 10:59 AM | 38 (0.9%) | 72 (2.4%) |
| 11:00 AM to 11:59 AM | 80 (2.0%) | 0 (0.0%) |
| 12:00 PM to 3:59 PM | 233 (5.8%) | 121 (4.1%) |
| 4:00 PM to 11:59 PM | 482 (12.0%) | 186 (6.3%) |
| Total | 4,029 (100.0%) | 2,967 (100.0%) |
Housing Occupancy in Phillipsburg
Occupancy by Ownership in Phillipsburg
Of the total 6,602 dwellings in Phillipsburg, owner-occupied units account for 3,866 (58.6%), while renter-occupied units make up 2,736 (41.4%).
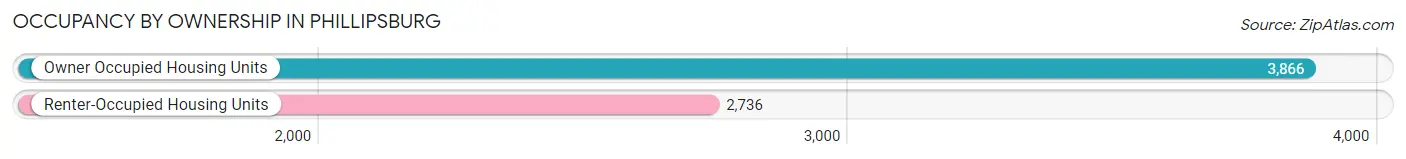
| Occupancy | # Housing Units | % Housing Units |
| Owner Occupied Housing Units | 3,866 | 58.6% |
| Renter-Occupied Housing Units | 2,736 | 41.4% |
| Total Occupied Housing Units | 6,602 | 100.0% |
Occupancy by Household Size in Phillipsburg
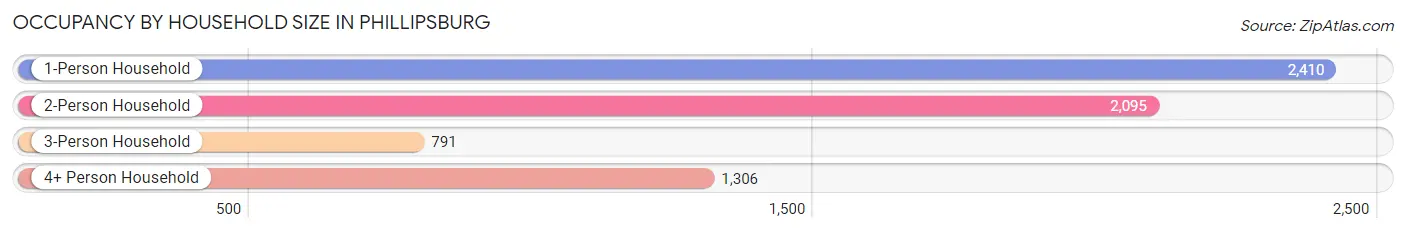
| Household Size | # Housing Units | % Housing Units |
| 1-Person Household | 2,410 | 36.5% |
| 2-Person Household | 2,095 | 31.7% |
| 3-Person Household | 791 | 12.0% |
| 4+ Person Household | 1,306 | 19.8% |
| Total Housing Units | 6,602 | 100.0% |
Occupancy by Ownership by Household Size in Phillipsburg
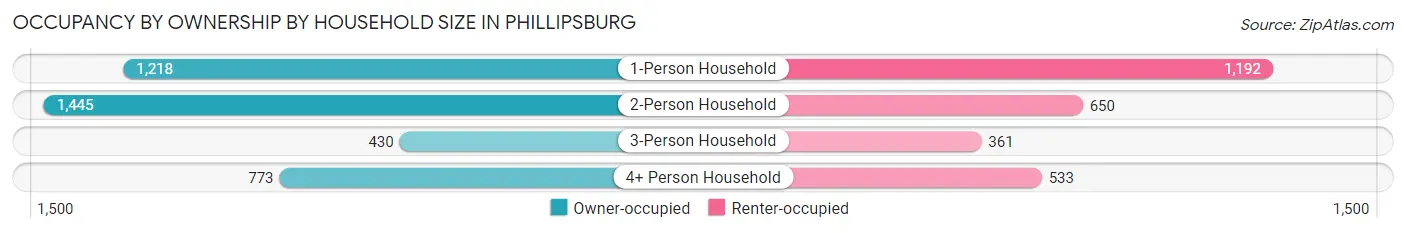
| Household Size | Owner-occupied | Renter-occupied |
| 1-Person Household | 1,218 (50.5%) | 1,192 (49.5%) |
| 2-Person Household | 1,445 (69.0%) | 650 (31.0%) |
| 3-Person Household | 430 (54.4%) | 361 (45.6%) |
| 4+ Person Household | 773 (59.2%) | 533 (40.8%) |
| Total Housing Units | 3,866 (58.6%) | 2,736 (41.4%) |
Occupancy by Educational Attainment in Phillipsburg
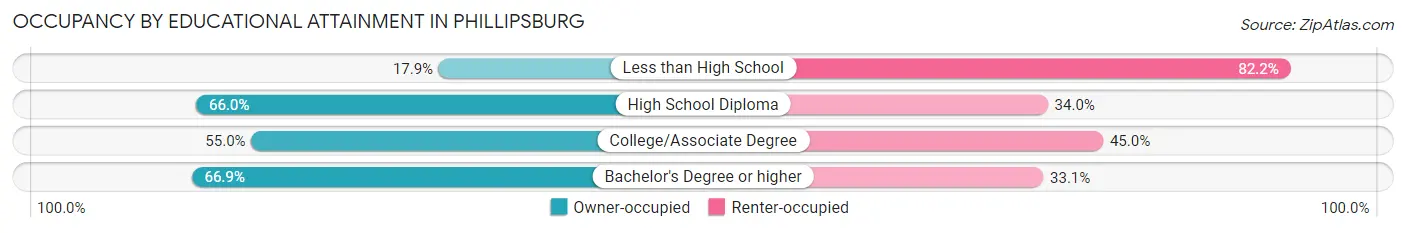
| Household Size | Owner-occupied | Renter-occupied |
| Less than High School | 113 (17.8%) | 520 (82.2%) |
| High School Diploma | 1,895 (66.0%) | 976 (34.0%) |
| College/Associate Degree | 995 (55.0%) | 813 (45.0%) |
| Bachelor's Degree or higher | 863 (66.9%) | 427 (33.1%) |
Occupancy by Age of Householder in Phillipsburg
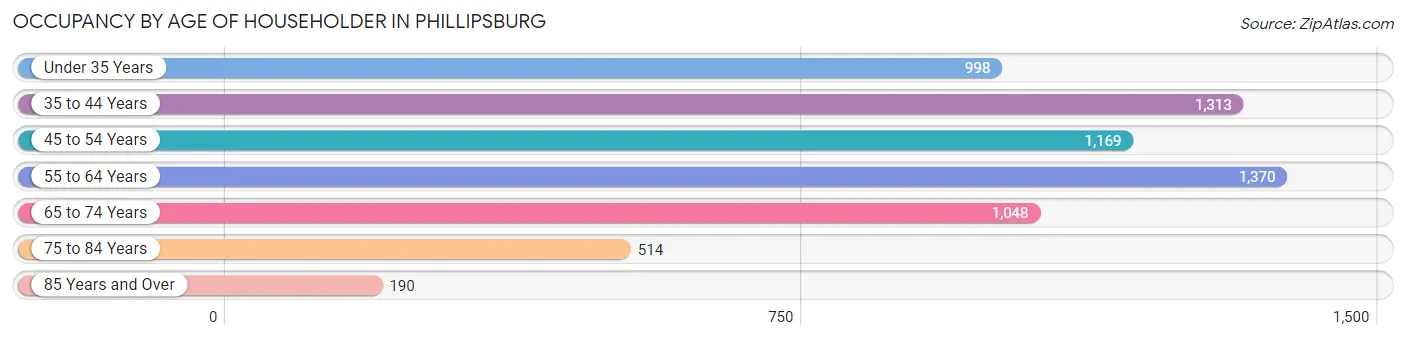
| Age Bracket | # Households | % Households |
| Under 35 Years | 998 | 15.1% |
| 35 to 44 Years | 1,313 | 19.9% |
| 45 to 54 Years | 1,169 | 17.7% |
| 55 to 64 Years | 1,370 | 20.7% |
| 65 to 74 Years | 1,048 | 15.9% |
| 75 to 84 Years | 514 | 7.8% |
| 85 Years and Over | 190 | 2.9% |
| Total | 6,602 | 100.0% |
Housing Finances in Phillipsburg
Median Income by Occupancy in Phillipsburg
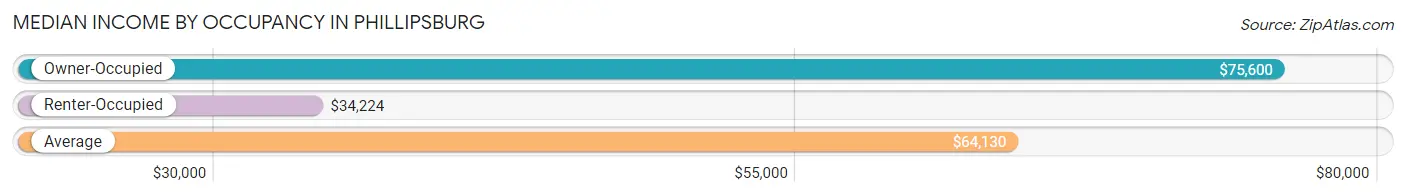
| Occupancy Type | # Households | Median Income |
| Owner-Occupied | 3,866 (58.6%) | $75,600 |
| Renter-Occupied | 2,736 (41.4%) | $34,224 |
| Average | 6,602 (100.0%) | $64,130 |
Occupancy by Householder Income Bracket in Phillipsburg
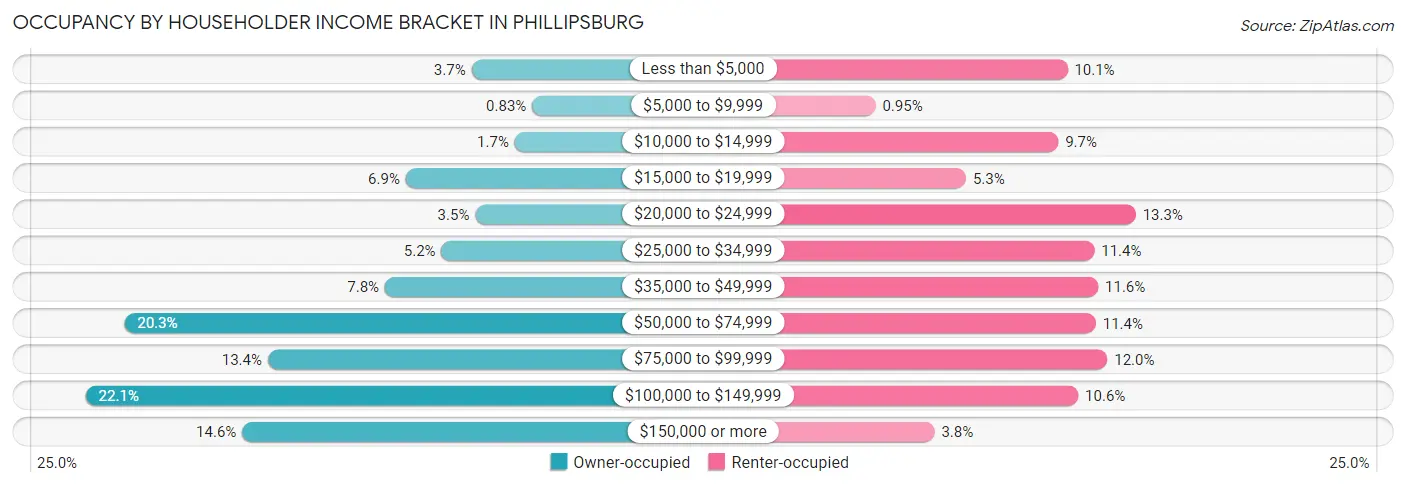
| Income Bracket | Owner-occupied | Renter-occupied |
| Less than $5,000 | 144 (3.7%) | 276 (10.1%) |
| $5,000 to $9,999 | 32 (0.8%) | 26 (0.9%) |
| $10,000 to $14,999 | 64 (1.7%) | 264 (9.7%) |
| $15,000 to $19,999 | 265 (6.9%) | 144 (5.3%) |
| $20,000 to $24,999 | 137 (3.5%) | 365 (13.3%) |
| $25,000 to $34,999 | 199 (5.1%) | 311 (11.4%) |
| $35,000 to $49,999 | 303 (7.8%) | 316 (11.6%) |
| $50,000 to $74,999 | 783 (20.3%) | 313 (11.4%) |
| $75,000 to $99,999 | 519 (13.4%) | 328 (12.0%) |
| $100,000 to $149,999 | 854 (22.1%) | 290 (10.6%) |
| $150,000 or more | 566 (14.6%) | 103 (3.8%) |
| Total | 3,866 (100.0%) | 2,736 (100.0%) |
Monthly Housing Cost Tiers in Phillipsburg
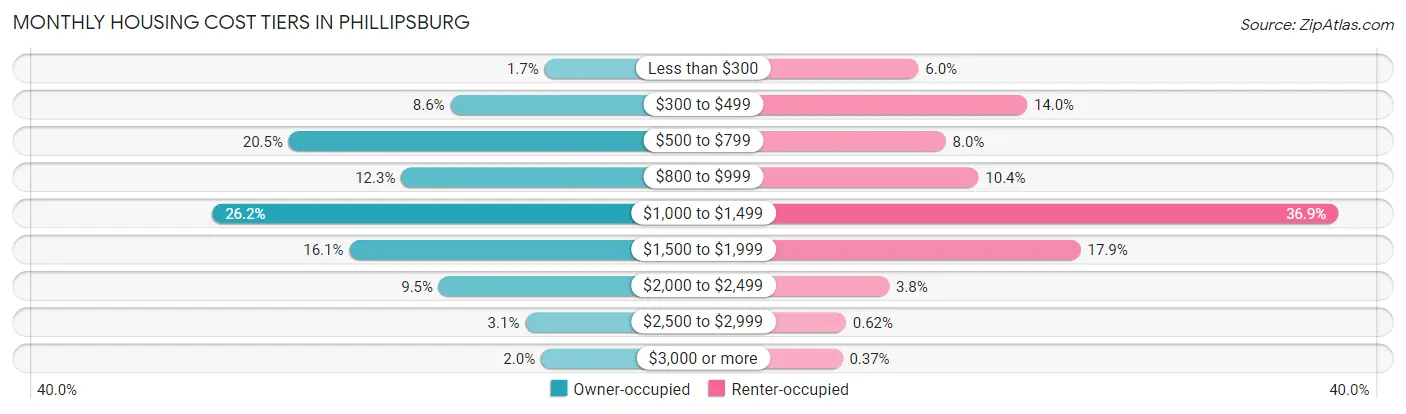
| Monthly Cost | Owner-occupied | Renter-occupied |
| Less than $300 | 66 (1.7%) | 163 (6.0%) |
| $300 to $499 | 334 (8.6%) | 382 (14.0%) |
| $500 to $799 | 794 (20.5%) | 218 (8.0%) |
| $800 to $999 | 474 (12.3%) | 284 (10.4%) |
| $1,000 to $1,499 | 1,012 (26.2%) | 1,009 (36.9%) |
| $1,500 to $1,999 | 622 (16.1%) | 490 (17.9%) |
| $2,000 to $2,499 | 367 (9.5%) | 104 (3.8%) |
| $2,500 to $2,999 | 121 (3.1%) | 17 (0.6%) |
| $3,000 or more | 76 (2.0%) | 10 (0.4%) |
| Total | 3,866 (100.0%) | 2,736 (100.0%) |
Physical Housing Characteristics in Phillipsburg
Housing Structures in Phillipsburg
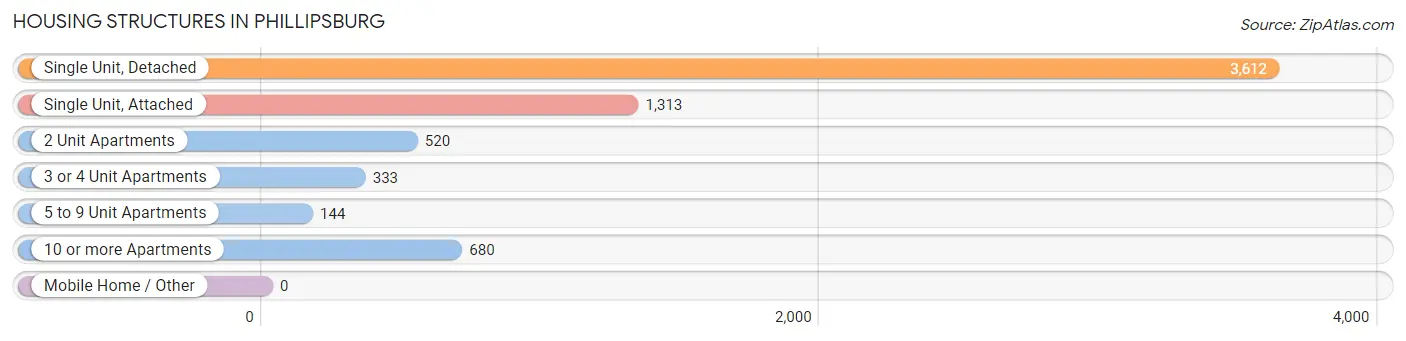
| Structure Type | # Housing Units | % Housing Units |
| Single Unit, Detached | 3,612 | 54.7% |
| Single Unit, Attached | 1,313 | 19.9% |
| 2 Unit Apartments | 520 | 7.9% |
| 3 or 4 Unit Apartments | 333 | 5.0% |
| 5 to 9 Unit Apartments | 144 | 2.2% |
| 10 or more Apartments | 680 | 10.3% |
| Mobile Home / Other | 0 | 0.0% |
| Total | 6,602 | 100.0% |
Housing Structures by Occupancy in Phillipsburg
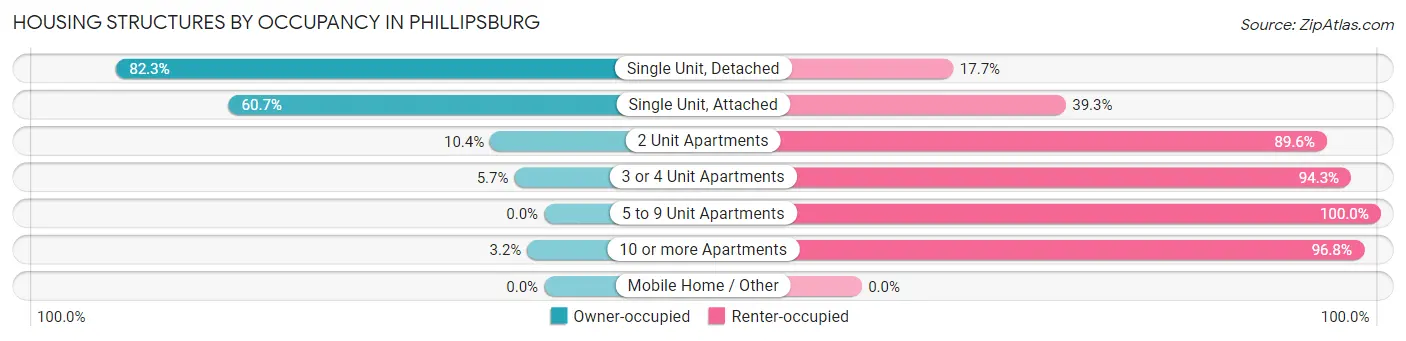
| Structure Type | Owner-occupied | Renter-occupied |
| Single Unit, Detached | 2,974 (82.3%) | 638 (17.7%) |
| Single Unit, Attached | 797 (60.7%) | 516 (39.3%) |
| 2 Unit Apartments | 54 (10.4%) | 466 (89.6%) |
| 3 or 4 Unit Apartments | 19 (5.7%) | 314 (94.3%) |
| 5 to 9 Unit Apartments | 0 (0.0%) | 144 (100.0%) |
| 10 or more Apartments | 22 (3.2%) | 658 (96.8%) |
| Mobile Home / Other | 0 (0.0%) | 0 (0.0%) |
| Total | 3,866 (58.6%) | 2,736 (41.4%) |
Housing Structures by Number of Rooms in Phillipsburg
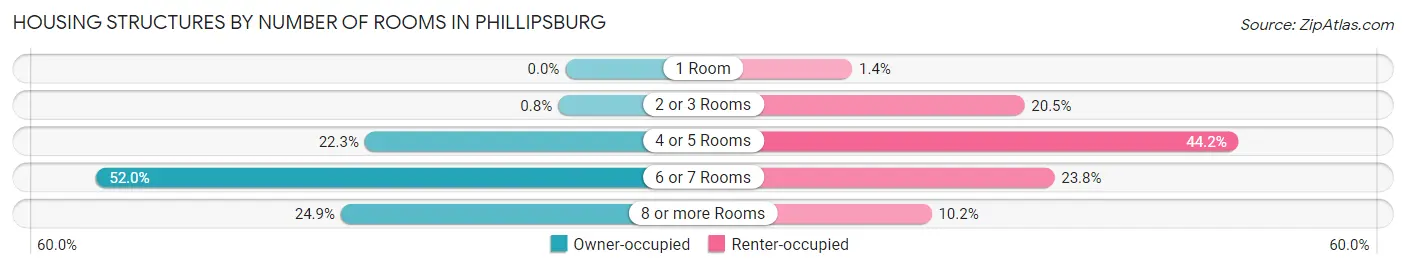
| Number of Rooms | Owner-occupied | Renter-occupied |
| 1 Room | 0 (0.0%) | 37 (1.3%) |
| 2 or 3 Rooms | 31 (0.8%) | 560 (20.5%) |
| 4 or 5 Rooms | 860 (22.3%) | 1,210 (44.2%) |
| 6 or 7 Rooms | 2,012 (52.0%) | 651 (23.8%) |
| 8 or more Rooms | 963 (24.9%) | 278 (10.2%) |
| Total | 3,866 (100.0%) | 2,736 (100.0%) |
Housing Structure by Heating Type in Phillipsburg
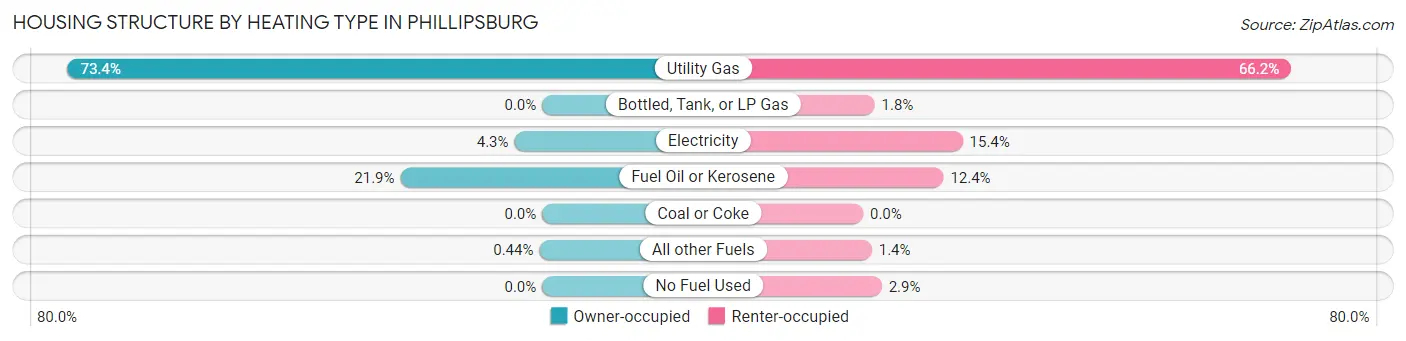
| Heating Type | Owner-occupied | Renter-occupied |
| Utility Gas | 2,836 (73.4%) | 1,810 (66.1%) |
| Bottled, Tank, or LP Gas | 0 (0.0%) | 49 (1.8%) |
| Electricity | 166 (4.3%) | 421 (15.4%) |
| Fuel Oil or Kerosene | 847 (21.9%) | 340 (12.4%) |
| Coal or Coke | 0 (0.0%) | 0 (0.0%) |
| All other Fuels | 17 (0.4%) | 37 (1.3%) |
| No Fuel Used | 0 (0.0%) | 79 (2.9%) |
| Total | 3,866 (100.0%) | 2,736 (100.0%) |
Household Vehicle Usage in Phillipsburg
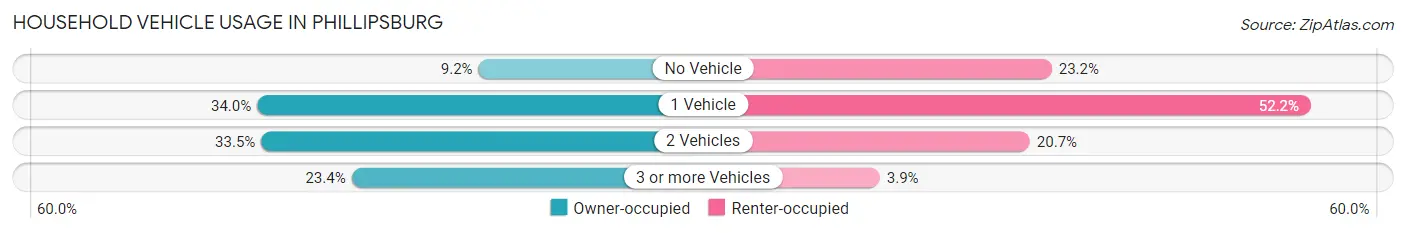
| Vehicles per Household | Owner-occupied | Renter-occupied |
| No Vehicle | 354 (9.2%) | 634 (23.2%) |
| 1 Vehicle | 1,313 (34.0%) | 1,428 (52.2%) |
| 2 Vehicles | 1,295 (33.5%) | 567 (20.7%) |
| 3 or more Vehicles | 904 (23.4%) | 107 (3.9%) |
| Total | 3,866 (100.0%) | 2,736 (100.0%) |
Real Estate & Mortgages in Phillipsburg
Real Estate and Mortgage Overview in Phillipsburg
| Characteristic | Without Mortgage | With Mortgage |
| Housing Units | 1,598 | 2,268 |
| Median Property Value | $147,800 | $163,300 |
| Median Household Income | $54,564 | $447 |
| Monthly Housing Costs | $662 | $76 |
| Real Estate Taxes | $4,472 | $21 |
Property Value by Mortgage Status in Phillipsburg
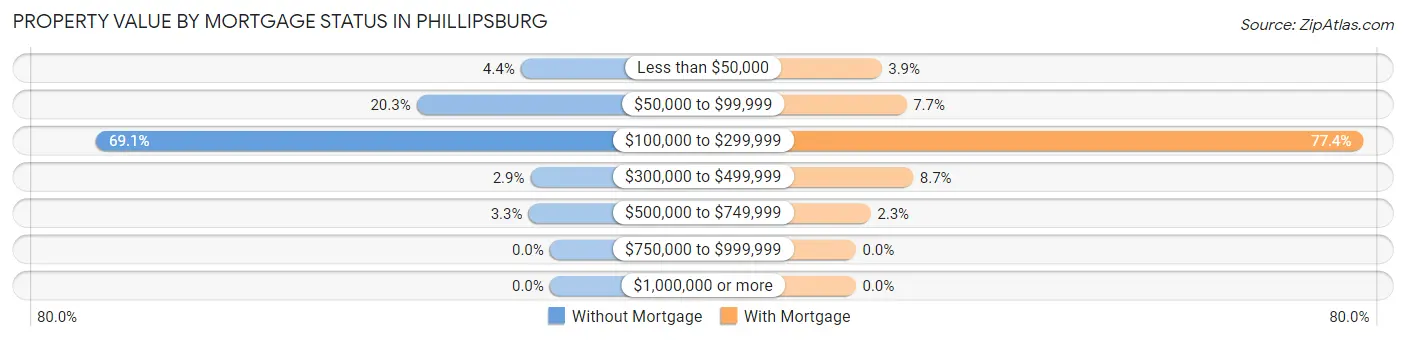
| Property Value | Without Mortgage | With Mortgage |
| Less than $50,000 | 71 (4.4%) | 89 (3.9%) |
| $50,000 to $99,999 | 324 (20.3%) | 175 (7.7%) |
| $100,000 to $299,999 | 1,104 (69.1%) | 1,755 (77.4%) |
| $300,000 to $499,999 | 47 (2.9%) | 198 (8.7%) |
| $500,000 to $749,999 | 52 (3.3%) | 51 (2.2%) |
| $750,000 to $999,999 | 0 (0.0%) | 0 (0.0%) |
| $1,000,000 or more | 0 (0.0%) | 0 (0.0%) |
| Total | 1,598 (100.0%) | 2,268 (100.0%) |
Household Income by Mortgage Status in Phillipsburg
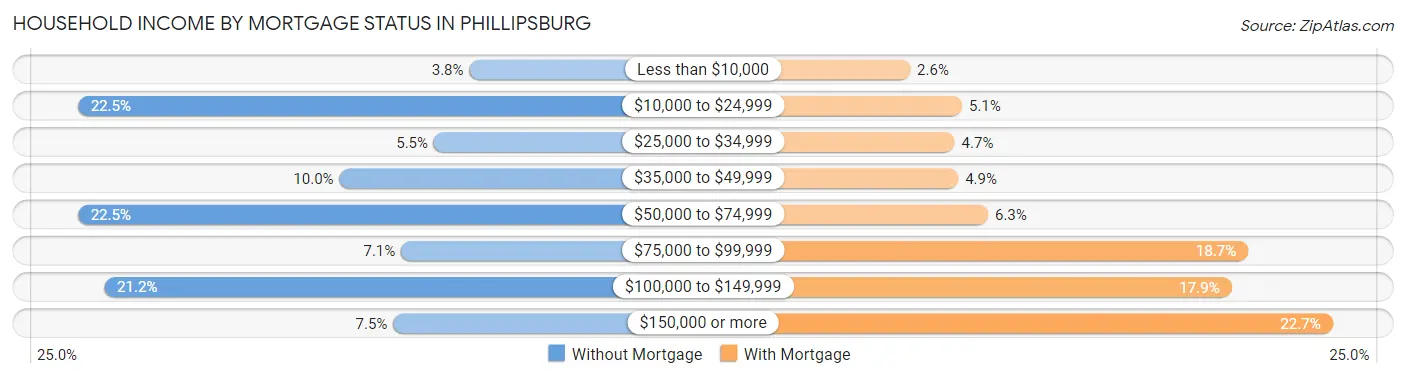
| Household Income | Without Mortgage | With Mortgage |
| Less than $10,000 | 61 (3.8%) | 59 (2.6%) |
| $10,000 to $24,999 | 359 (22.5%) | 115 (5.1%) |
| $25,000 to $34,999 | 88 (5.5%) | 107 (4.7%) |
| $35,000 to $49,999 | 160 (10.0%) | 111 (4.9%) |
| $50,000 to $74,999 | 359 (22.5%) | 143 (6.3%) |
| $75,000 to $99,999 | 113 (7.1%) | 424 (18.7%) |
| $100,000 to $149,999 | 339 (21.2%) | 406 (17.9%) |
| $150,000 or more | 119 (7.4%) | 515 (22.7%) |
| Total | 1,598 (100.0%) | 2,268 (100.0%) |
Property Value to Household Income Ratio in Phillipsburg
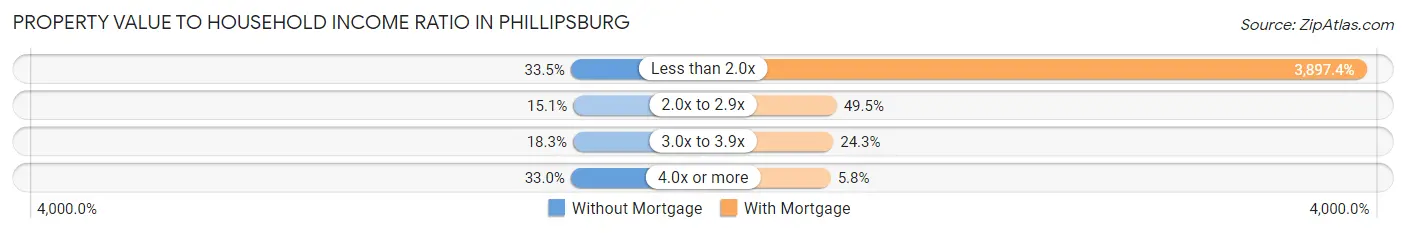
| Value-to-Income Ratio | Without Mortgage | With Mortgage |
| Less than 2.0x | 536 (33.5%) | 88,393 (3,897.4%) |
| 2.0x to 2.9x | 242 (15.1%) | 1,122 (49.5%) |
| 3.0x to 3.9x | 292 (18.3%) | 552 (24.3%) |
| 4.0x or more | 528 (33.0%) | 132 (5.8%) |
| Total | 1,598 (100.0%) | 2,268 (100.0%) |
Real Estate Taxes by Mortgage Status in Phillipsburg
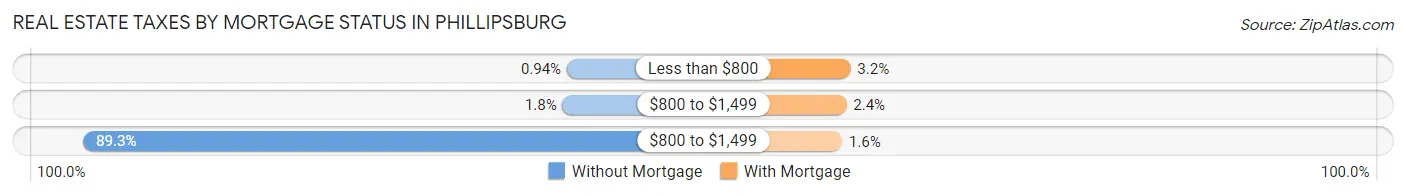
| Property Taxes | Without Mortgage | With Mortgage |
| Less than $800 | 15 (0.9%) | 72 (3.2%) |
| $800 to $1,499 | 28 (1.8%) | 55 (2.4%) |
| $800 to $1,499 | 1,427 (89.3%) | 37 (1.6%) |
| Total | 1,598 (100.0%) | 2,268 (100.0%) |
Health & Disability in Phillipsburg
Health Insurance Coverage by Age in Phillipsburg
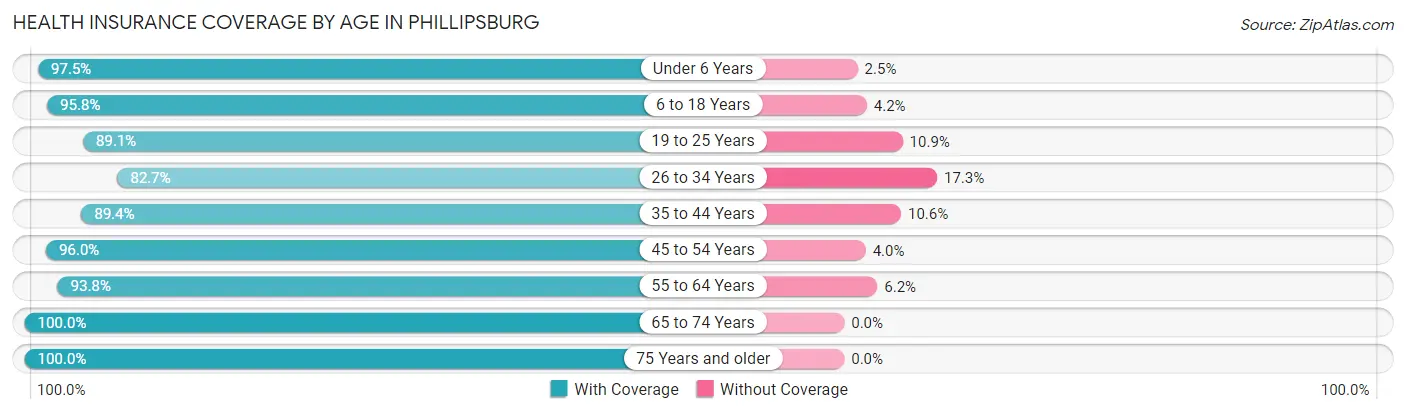
| Age Bracket | With Coverage | Without Coverage |
| Under 6 Years | 861 (97.5%) | 22 (2.5%) |
| 6 to 18 Years | 2,342 (95.8%) | 103 (4.2%) |
| 19 to 25 Years | 1,048 (89.1%) | 128 (10.9%) |
| 26 to 34 Years | 1,416 (82.7%) | 296 (17.3%) |
| 35 to 44 Years | 2,004 (89.4%) | 237 (10.6%) |
| 45 to 54 Years | 1,829 (96.0%) | 76 (4.0%) |
| 55 to 64 Years | 2,210 (93.8%) | 145 (6.2%) |
| 65 to 74 Years | 1,436 (100.0%) | 0 (0.0%) |
| 75 Years and older | 993 (100.0%) | 0 (0.0%) |
| Total | 14,139 (93.3%) | 1,007 (6.7%) |
Health Insurance Coverage by Citizenship Status in Phillipsburg
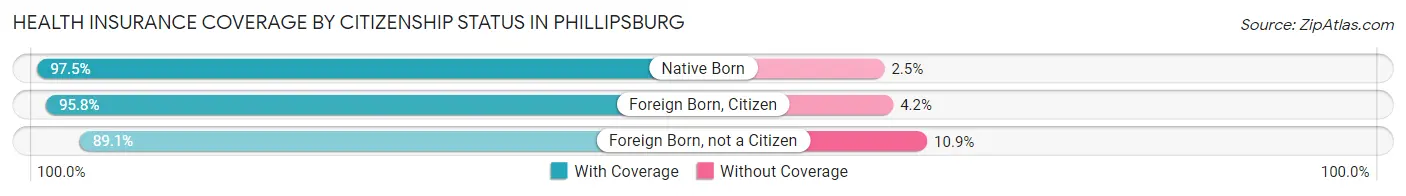
| Citizenship Status | With Coverage | Without Coverage |
| Native Born | 861 (97.5%) | 22 (2.5%) |
| Foreign Born, Citizen | 2,342 (95.8%) | 103 (4.2%) |
| Foreign Born, not a Citizen | 1,048 (89.1%) | 128 (10.9%) |
Health Insurance Coverage by Household Income in Phillipsburg
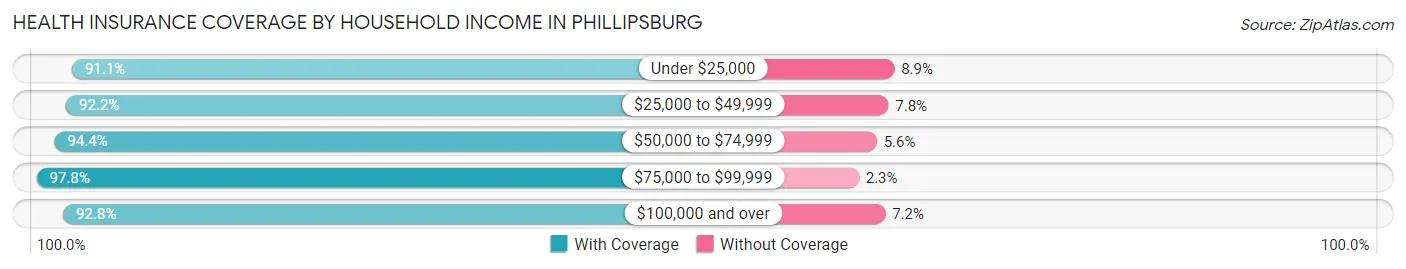
| Household Income | With Coverage | Without Coverage |
| Under $25,000 | 2,289 (91.1%) | 223 (8.9%) |
| $25,000 to $49,999 | 2,248 (92.2%) | 190 (7.8%) |
| $50,000 to $74,999 | 2,392 (94.4%) | 142 (5.6%) |
| $75,000 to $99,999 | 1,957 (97.8%) | 45 (2.2%) |
| $100,000 and over | 5,244 (92.8%) | 407 (7.2%) |
Public vs Private Health Insurance Coverage by Age in Phillipsburg
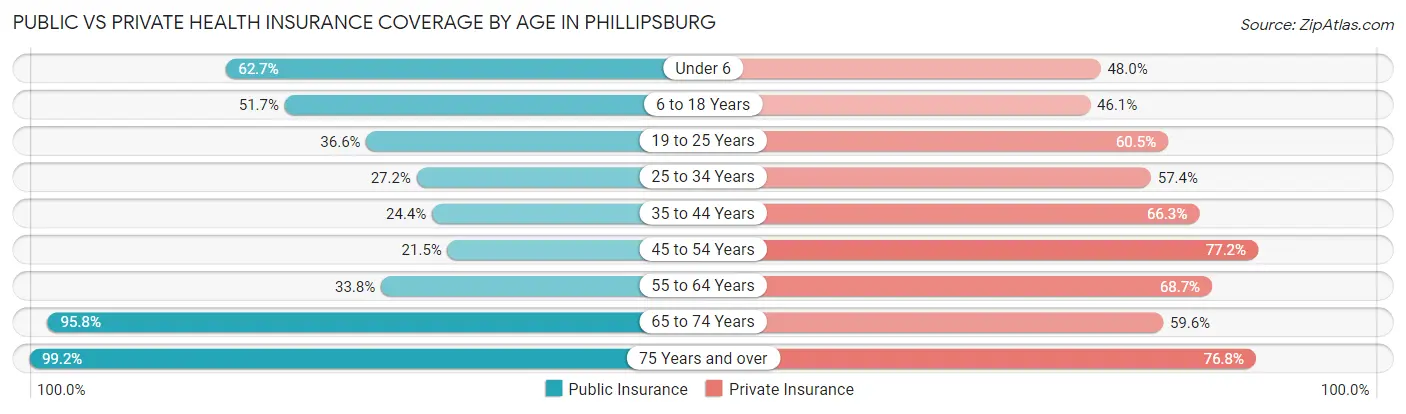
| Age Bracket | Public Insurance | Private Insurance |
| Under 6 | 554 (62.7%) | 424 (48.0%) |
| 6 to 18 Years | 1,264 (51.7%) | 1,127 (46.1%) |
| 19 to 25 Years | 430 (36.6%) | 712 (60.5%) |
| 25 to 34 Years | 466 (27.2%) | 982 (57.4%) |
| 35 to 44 Years | 546 (24.4%) | 1,486 (66.3%) |
| 45 to 54 Years | 409 (21.5%) | 1,471 (77.2%) |
| 55 to 64 Years | 797 (33.8%) | 1,618 (68.7%) |
| 65 to 74 Years | 1,375 (95.8%) | 856 (59.6%) |
| 75 Years and over | 985 (99.2%) | 763 (76.8%) |
| Total | 6,826 (45.1%) | 9,439 (62.3%) |
Disability Status by Sex by Age in Phillipsburg
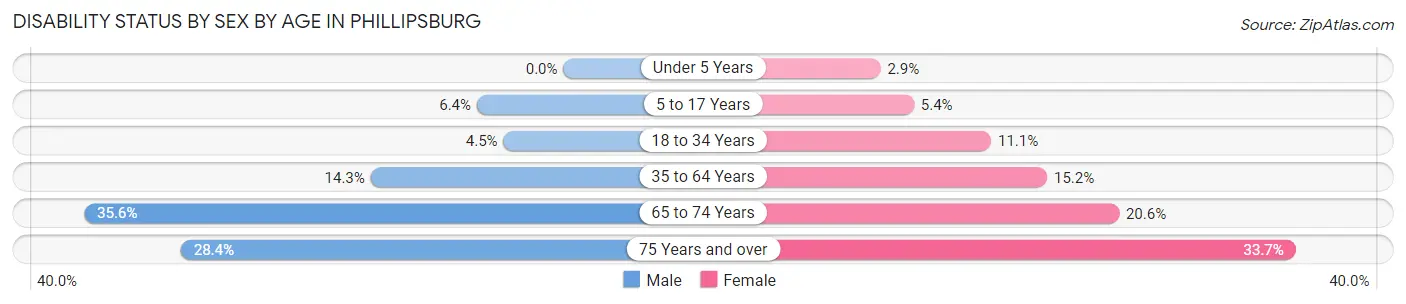
| Age Bracket | Male | Female |
| Under 5 Years | 0 (0.0%) | 11 (2.9%) |
| 5 to 17 Years | 90 (6.4%) | 57 (5.3%) |
| 18 to 34 Years | 80 (4.4%) | 138 (11.1%) |
| 35 to 64 Years | 430 (14.3%) | 533 (15.2%) |
| 65 to 74 Years | 243 (35.6%) | 155 (20.6%) |
| 75 Years and over | 94 (28.4%) | 223 (33.7%) |
Disability Class by Sex by Age in Phillipsburg
Disability Class: Hearing Difficulty
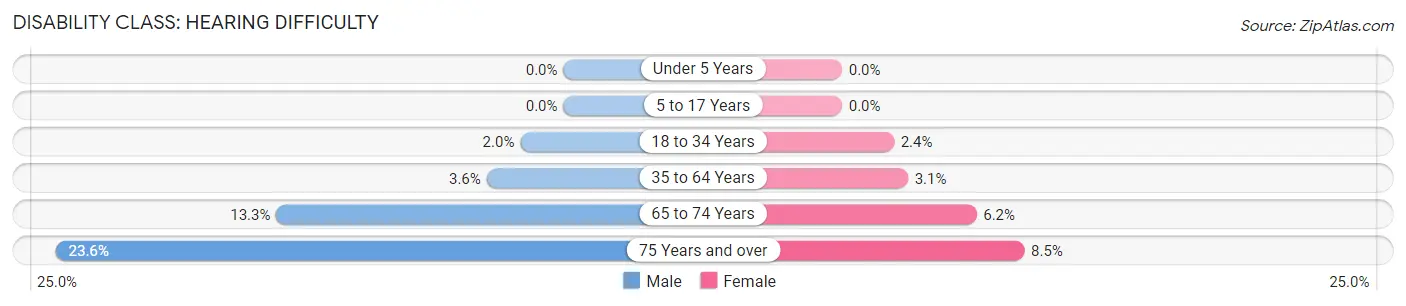
| Age Bracket | Male | Female |
| Under 5 Years | 0 (0.0%) | 0 (0.0%) |
| 5 to 17 Years | 0 (0.0%) | 0 (0.0%) |
| 18 to 34 Years | 36 (2.0%) | 30 (2.4%) |
| 35 to 64 Years | 107 (3.6%) | 107 (3.1%) |
| 65 to 74 Years | 91 (13.3%) | 47 (6.2%) |
| 75 Years and over | 78 (23.6%) | 56 (8.5%) |
Disability Class: Vision Difficulty
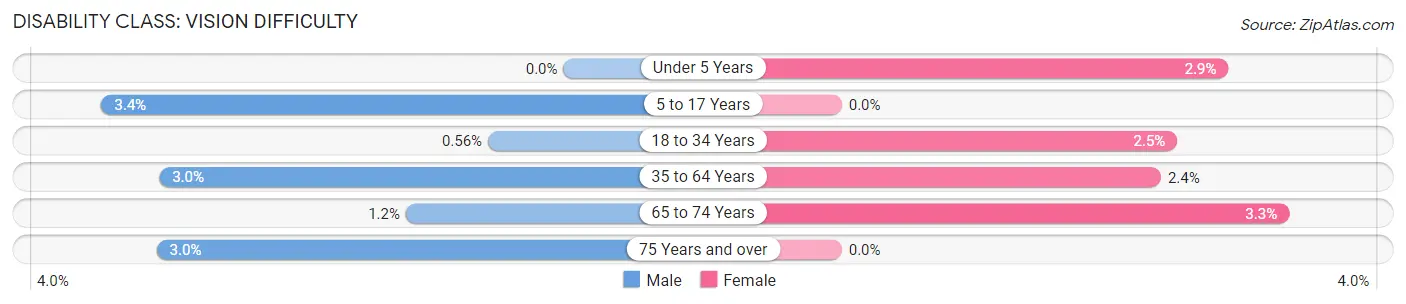
| Age Bracket | Male | Female |
| Under 5 Years | 0 (0.0%) | 11 (2.9%) |
| 5 to 17 Years | 48 (3.4%) | 0 (0.0%) |
| 18 to 34 Years | 10 (0.6%) | 31 (2.5%) |
| 35 to 64 Years | 90 (3.0%) | 83 (2.4%) |
| 65 to 74 Years | 8 (1.2%) | 25 (3.3%) |
| 75 Years and over | 10 (3.0%) | 0 (0.0%) |
Disability Class: Cognitive Difficulty
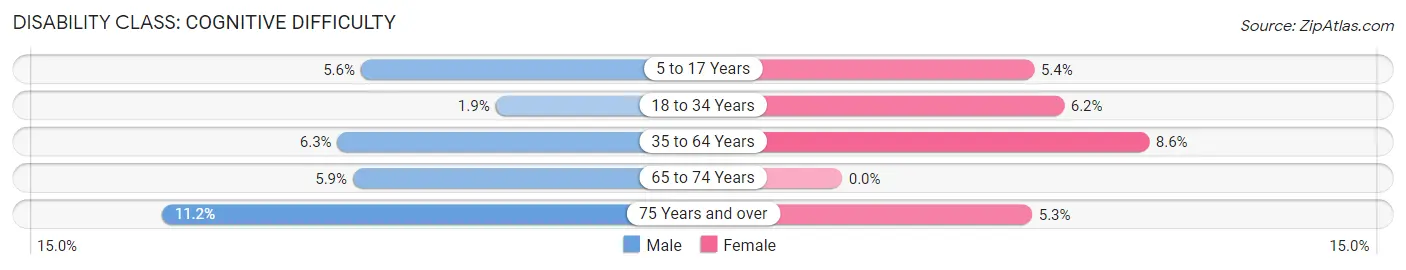
| Age Bracket | Male | Female |
| 5 to 17 Years | 79 (5.6%) | 57 (5.3%) |
| 18 to 34 Years | 34 (1.9%) | 77 (6.2%) |
| 35 to 64 Years | 189 (6.3%) | 299 (8.6%) |
| 65 to 74 Years | 40 (5.9%) | 0 (0.0%) |
| 75 Years and over | 37 (11.2%) | 35 (5.3%) |
Disability Class: Ambulatory Difficulty
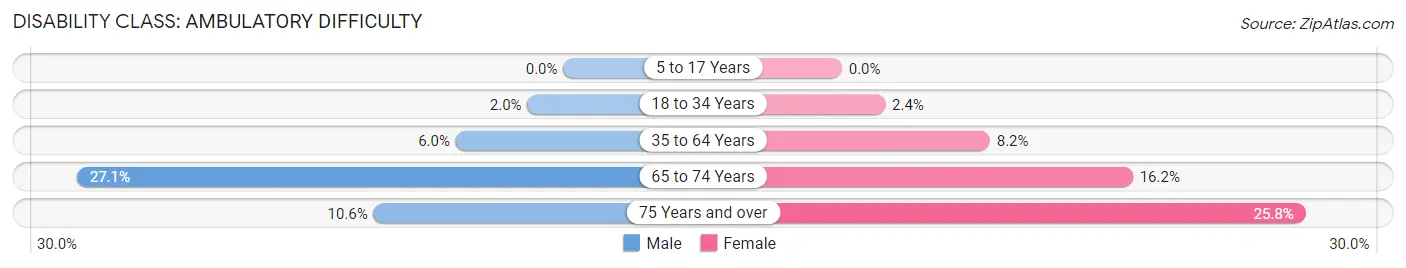
| Age Bracket | Male | Female |
| 5 to 17 Years | 0 (0.0%) | 0 (0.0%) |
| 18 to 34 Years | 36 (2.0%) | 30 (2.4%) |
| 35 to 64 Years | 180 (6.0%) | 288 (8.2%) |
| 65 to 74 Years | 185 (27.1%) | 122 (16.2%) |
| 75 Years and over | 35 (10.6%) | 171 (25.8%) |
Disability Class: Self-Care Difficulty
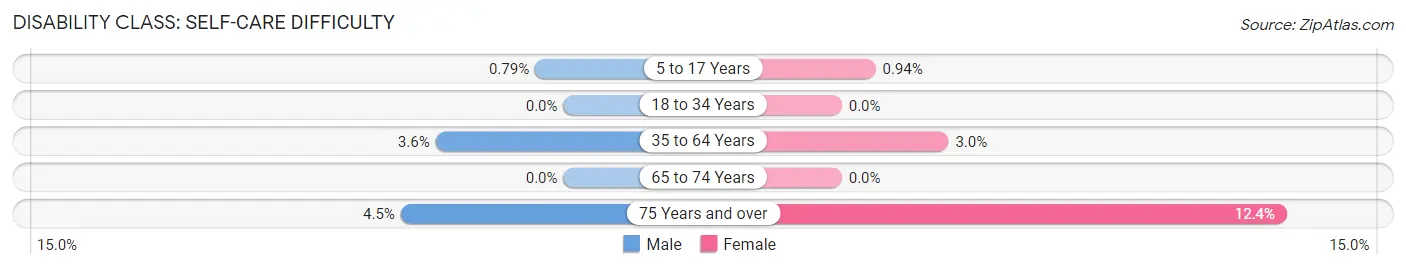
| Age Bracket | Male | Female |
| 5 to 17 Years | 11 (0.8%) | 10 (0.9%) |
| 18 to 34 Years | 0 (0.0%) | 0 (0.0%) |
| 35 to 64 Years | 107 (3.6%) | 104 (3.0%) |
| 65 to 74 Years | 0 (0.0%) | 0 (0.0%) |
| 75 Years and over | 15 (4.5%) | 82 (12.4%) |
Technology Access in Phillipsburg
Computing Device Access in Phillipsburg
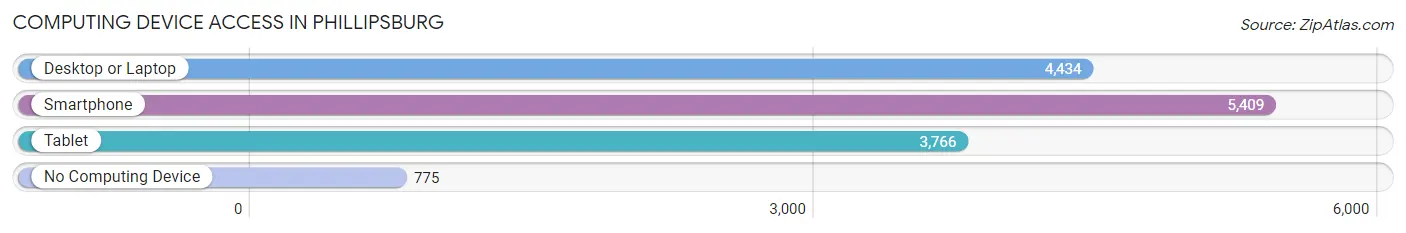
| Device Type | # Households | % Households |
| Desktop or Laptop | 4,434 | 67.2% |
| Smartphone | 5,409 | 81.9% |
| Tablet | 3,766 | 57.0% |
| No Computing Device | 775 | 11.7% |
| Total | 6,602 | 100.0% |
Internet Access in Phillipsburg
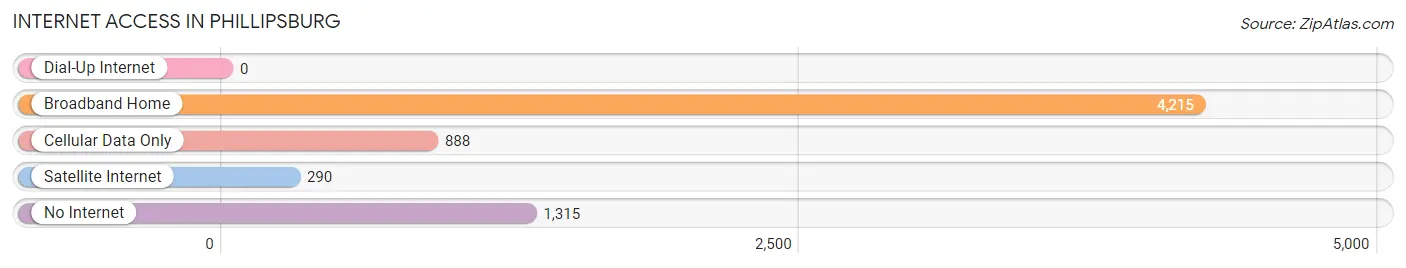
| Internet Type | # Households | % Households |
| Dial-Up Internet | 0 | 0.0% |
| Broadband Home | 4,215 | 63.8% |
| Cellular Data Only | 888 | 13.5% |
| Satellite Internet | 290 | 4.4% |
| No Internet | 1,315 | 19.9% |
| Total | 6,602 | 100.0% |
Phillipsburg Summary
Phillipsburg, NJ is a small town located in Warren County, New Jersey. It is situated on the banks of the Delaware River, just across from Easton, Pennsylvania. The town has a population of 14,950, according to the 2010 census.
History
Phillipsburg was founded in 1735 by William Phillips, a Quaker from England. The town was originally known as Phillipsburg, but the name was changed to Phillipsburg in 1845. The town was an important stop on the Morris Canal, which connected the Delaware River to the Hudson River. The canal was used to transport coal, iron ore, and other goods.
Phillipsburg was an important industrial center during the 19th century. The town was home to several iron and steel mills, as well as a number of other factories. The town was also home to a large number of immigrants, who came to work in the factories.
Geography
Phillipsburg is located in Warren County, New Jersey. The town is situated on the banks of the Delaware River, just across from Easton, Pennsylvania. The town is located in the Lehigh Valley region of New Jersey. The town is bordered by the towns of Alpha, Pohatcong Township, and Lopatcong Township.
The town has a total area of 2.3 square miles, all of which is land. The town is located at an elevation of approximately 200 feet above sea level.
Economy
Phillipsburg is a small town with a limited economy. The town is home to a number of small businesses, including restaurants, retail stores, and professional services. The town is also home to a number of manufacturing companies, including a steel mill and a paper mill.
The town is also home to a number of government offices, including the Warren County Courthouse and the Phillipsburg Town Hall. The town is also home to a number of educational institutions, including Phillipsburg High School and Warren County Community College.
Demographics
According to the 2010 census, Phillipsburg has a population of 14,950. The town has a median household income of $45,945, and a median family income of $54,945. The town has a poverty rate of 13.3%, and a median age of 38.7 years.
The town is predominantly white, with a population that is 88.3% white, 5.3% Hispanic, 2.2% African American, and 1.2% Asian. The town is also home to a large number of immigrants, with a foreign-born population of 11.3%.
Conclusion
Phillipsburg, NJ is a small town located in Warren County, New Jersey. The town has a population of 14,950, according to the 2010 census. The town is situated on the banks of the Delaware River, just across from Easton, Pennsylvania. The town has a limited economy, with a number of small businesses, manufacturing companies, and government offices. The town is predominantly white, with a population that is 88.3% white, 5.3% Hispanic, 2.2% African American, and 1.2% Asian. The town has a median household income of $45,945, and a median family income of $54,945.
Common Questions
What is Per Capita Income in Phillipsburg?
Per Capita income in Phillipsburg is $33,659.
What is the Median Family Income in Phillipsburg?
Median Family Income in Phillipsburg is $72,031.
What is the Median Household income in Phillipsburg?
Median Household Income in Phillipsburg is $64,130.
What is Income or Wage Gap in Phillipsburg?
Income or Wage Gap in Phillipsburg is 32.4%.
Women in Phillipsburg earn 67.6 cents for every dollar earned by a man.
What is Inequality or Gini Index in Phillipsburg?
Inequality or Gini Index in Phillipsburg is 0.45.
What is the Total Population of Phillipsburg?
Total Population of Phillipsburg is 15,206.
What is the Total Male Population of Phillipsburg?
Total Male Population of Phillipsburg is 7,553.
What is the Total Female Population of Phillipsburg?
Total Female Population of Phillipsburg is 7,653.
What is the Ratio of Males per 100 Females in Phillipsburg?
There are 98.69 Males per 100 Females in Phillipsburg.
What is the Ratio of Females per 100 Males in Phillipsburg?
There are 101.32 Females per 100 Males in Phillipsburg.
What is the Median Population Age in Phillipsburg?
Median Population Age in Phillipsburg is 41.2 Years.
What is the Average Family Size in Phillipsburg
Average Family Size in Phillipsburg is 2.9 People.
What is the Average Household Size in Phillipsburg
Average Household Size in Phillipsburg is 2.3 People.
How Large is the Labor Force in Phillipsburg?
There are 8,138 People in the Labor Forcein in Phillipsburg.
What is the Percentage of People in the Labor Force in Phillipsburg?
65.6% of People are in the Labor Force in Phillipsburg.
What is the Unemployment Rate in Phillipsburg?
Unemployment Rate in Phillipsburg is 8.4%.