Zip Codes with the Highest Percentage of Population with a Degree in Visual and Performing Arts in the United States
RELATED REPORTS & OPTIONS
Visual and Performing Arts
United States
Compare Zip Codes
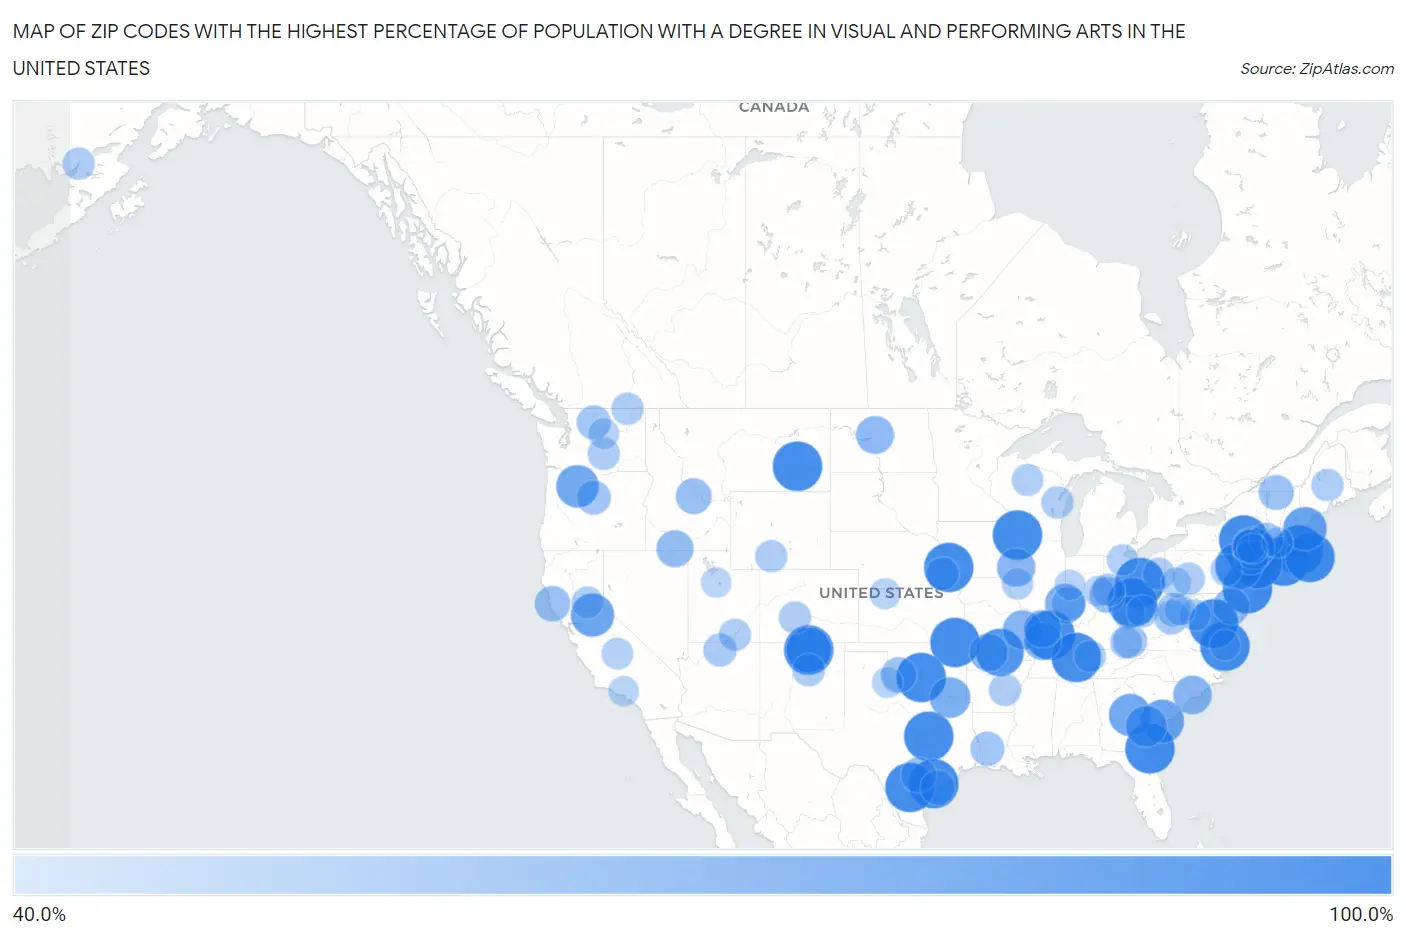
Map of Zip Codes with the Highest Percentage of Population with a Degree in Visual and Performing Arts in the United States
40.0%
100.0%
Zip Codes with the Highest Percentage of Population with a Degree in Visual and Performing Arts in the United States
| Zip Code | % Graduates | vs State | vs National | |
| 1. | 76798 | 100.0% | 3.2%(+96.8)#1 | 4.3%(+95.7)#1 |
| 2. | 31547 | 100.0% | 3.8%(+96.2)#1 | 4.3%(+95.7)#2 |
| 3. | 02357 | 100.0% | 4.7%(+95.3)#1 | 4.3%(+95.7)#3 |
| 4. | 23709 | 100.0% | 3.7%(+96.3)#1 | 4.3%(+95.7)#4 |
| 5. | 77977 | 100.0% | 3.2%(+96.8)#2 | 4.3%(+95.7)#5 |
| 6. | 43005 | 100.0% | 3.7%(+96.3)#1 | 4.3%(+95.7)#6 |
| 7. | 45673 | 100.0% | 3.7%(+96.3)#2 | 4.3%(+95.7)#7 |
| 8. | 78007 | 100.0% | 3.2%(+96.8)#3 | 4.3%(+95.7)#8 |
| 9. | 22476 | 100.0% | 3.7%(+96.3)#2 | 4.3%(+95.7)#9 |
| 10. | 67332 | 100.0% | 3.4%(+96.6)#1 | 4.3%(+95.7)#10 |
| 11. | 87580 | 100.0% | 4.8%(+95.2)#1 | 4.3%(+95.7)#11 |
| 12. | 12489 | 100.0% | 6.8%(+93.2)#1 | 4.3%(+95.7)#12 |
| 13. | 53802 | 100.0% | 3.7%(+96.3)#1 | 4.3%(+95.7)#13 |
| 14. | 13834 | 100.0% | 6.8%(+93.2)#2 | 4.3%(+95.7)#14 |
| 15. | 51554 | 100.0% | 3.5%(+96.5)#1 | 4.3%(+95.7)#15 |
| 16. | 06353 | 100.0% | 4.7%(+95.3)#1 | 4.3%(+95.7)#16 |
| 17. | 62928 | 100.0% | 4.4%(+95.6)#1 | 4.3%(+95.7)#17 |
| 18. | 08011 | 100.0% | 4.0%(+96.0)#1 | 4.3%(+95.7)#18 |
| 19. | 73031 | 100.0% | 2.9%(+97.1)#1 | 4.3%(+95.7)#19 |
| 20. | 37213 | 100.0% | 4.1%(+95.9)#1 | 4.3%(+95.7)#20 |
| 21. | 59333 | 100.0% | 3.8%(+96.2)#1 | 4.3%(+95.7)#21 |
| 22. | 02672 | 100.0% | 4.7%(+95.3)#2 | 4.3%(+95.7)#22 |
| 23. | 10911 | 100.0% | 6.8%(+93.2)#3 | 4.3%(+95.7)#23 |
| 24. | 72538 | 94.1% | 3.1%(+91.0)#1 | 4.3%(+89.8)#24 |
| 25. | 18342 | 93.0% | 3.8%(+89.1)#1 | 4.3%(+88.7)#25 |
| 26. | 87525 | 87.2% | 4.8%(+82.4)#2 | 4.3%(+82.9)#26 |
| 27. | 03911 | 82.2% | 5.6%(+76.6)#1 | 4.3%(+78.0)#27 |
| 28. | 95675 | 81.6% | 5.7%(+75.9)#1 | 4.3%(+77.3)#28 |
| 29. | 29904 | 81.6% | 3.3%(+78.3)#1 | 4.3%(+77.3)#29 |
| 30. | 97028 | 79.5% | 5.7%(+73.8)#1 | 4.3%(+75.2)#30 |
| 31. | 31067 | 78.6% | 3.8%(+74.8)#2 | 4.3%(+74.3)#31 |
| 32. | 12450 | 78.2% | 6.8%(+71.4)#4 | 4.3%(+73.9)#32 |
| 33. | 12416 | 75.8% | 6.8%(+69.0)#5 | 4.3%(+71.5)#33 |
| 34. | 30423 | 75.0% | 3.8%(+71.2)#3 | 4.3%(+70.7)#34 |
| 35. | 75411 | 74.0% | 3.2%(+70.8)#4 | 4.3%(+69.7)#35 |
| 36. | 47849 | 72.2% | 3.2%(+69.0)#1 | 4.3%(+68.0)#36 |
| 37. | 63637 | 70.0% | 3.8%(+66.2)#1 | 4.3%(+65.7)#37 |
| 38. | 28452 | 68.0% | 3.6%(+64.4)#1 | 4.3%(+63.7)#38 |
| 39. | 61442 | 67.5% | 4.4%(+63.1)#2 | 4.3%(+63.2)#39 |
| 40. | 72630 | 66.7% | 3.1%(+63.6)#2 | 4.3%(+62.4)#40 |
| 41. | 58778 | 66.1% | 2.3%(+63.8)#1 | 4.3%(+61.8)#41 |
| 42. | 62963 | 65.8% | 4.4%(+61.3)#3 | 4.3%(+61.5)#42 |
| 43. | 62915 | 65.2% | 4.4%(+60.8)#4 | 4.3%(+61.0)#43 |
| 44. | 83302 | 63.6% | 4.0%(+59.7)#1 | 4.3%(+59.4)#44 |
| 45. | 21636 | 62.0% | 3.8%(+58.2)#1 | 4.3%(+57.8)#45 |
| 46. | 45330 | 60.0% | 3.7%(+56.3)#3 | 4.3%(+55.7)#46 |
| 47. | 83465 | 60.0% | 4.0%(+56.0)#2 | 4.3%(+55.7)#47 |
| 48. | 73664 | 59.4% | 2.9%(+56.5)#2 | 4.3%(+55.1)#48 |
| 49. | 95463 | 59.4% | 5.7%(+53.6)#2 | 4.3%(+55.1)#49 |
| 50. | 78143 | 59.1% | 3.2%(+55.9)#5 | 4.3%(+54.9)#50 |
| 51. | 05447 | 57.9% | 6.7%(+51.2)#1 | 4.3%(+53.6)#51 |
| 52. | 77982 | 56.8% | 3.2%(+53.6)#6 | 4.3%(+52.6)#52 |
| 53. | 12169 | 56.0% | 6.8%(+49.2)#6 | 4.3%(+51.7)#53 |
| 54. | 47855 | 55.6% | 3.2%(+52.3)#2 | 4.3%(+51.3)#54 |
| 55. | 97711 | 55.6% | 5.7%(+49.9)#2 | 4.3%(+51.3)#55 |
| 56. | 98852 | 55.6% | 4.6%(+50.9)#1 | 4.3%(+51.3)#56 |
| 57. | 12769 | 55.4% | 6.8%(+48.6)#7 | 4.3%(+51.1)#57 |
| 58. | 70662 | 55.2% | 3.3%(+51.9)#1 | 4.3%(+50.9)#58 |
| 59. | 41821 | 54.5% | 3.2%(+51.3)#1 | 4.3%(+50.3)#59 |
| 60. | 26291 | 54.2% | 2.9%(+51.3)#1 | 4.3%(+49.9)#60 |
| 61. | 26259 | 53.8% | 2.9%(+50.9)#2 | 4.3%(+49.6)#61 |
| 62. | 12438 | 52.9% | 6.8%(+46.2)#8 | 4.3%(+48.7)#62 |
| 63. | 86036 | 52.6% | 3.6%(+49.1)#1 | 4.3%(+48.4)#63 |
| 64. | 68307 | 52.4% | 3.3%(+49.1)#1 | 4.3%(+48.1)#64 |
| 65. | 41174 | 51.4% | 3.2%(+48.2)#2 | 4.3%(+47.2)#65 |
| 66. | 45378 | 51.4% | 3.7%(+47.6)#4 | 4.3%(+47.1)#66 |
| 67. | 87565 | 51.2% | 4.8%(+46.5)#3 | 4.3%(+47.0)#67 |
| 68. | 41777 | 50.0% | 3.2%(+46.8)#3 | 4.3%(+45.7)#68 |
| 69. | 54307 | 50.0% | 3.7%(+46.3)#2 | 4.3%(+45.7)#69 |
| 70. | 44625 | 50.0% | 3.7%(+46.3)#5 | 4.3%(+45.7)#70 |
| 71. | 25106 | 50.0% | 2.9%(+47.1)#3 | 4.3%(+45.7)#71 |
| 72. | 72175 | 50.0% | 3.1%(+46.9)#3 | 4.3%(+45.7)#72 |
| 73. | 04415 | 50.0% | 5.6%(+44.4)#2 | 4.3%(+45.7)#73 |
| 74. | 82336 | 50.0% | 3.4%(+46.6)#1 | 4.3%(+45.7)#74 |
| 75. | 81248 | 50.0% | 4.3%(+45.7)#1 | 4.3%(+45.7)#75 |
| 76. | 84533 | 50.0% | 4.3%(+45.7)#1 | 4.3%(+45.7)#76 |
| 77. | 15922 | 50.0% | 3.8%(+46.2)#2 | 4.3%(+45.7)#77 |
| 78. | 99146 | 50.0% | 4.6%(+45.4)#2 | 4.3%(+45.7)#78 |
| 79. | 98950 | 50.0% | 4.6%(+45.4)#3 | 4.3%(+45.7)#79 |
| 80. | 99625 | 50.0% | 3.3%(+46.7)#1 | 4.3%(+45.7)#80 |
| 81. | 95975 | 48.9% | 5.7%(+43.1)#3 | 4.3%(+44.6)#81 |
| 82. | 38564 | 48.6% | 4.1%(+44.5)#2 | 4.3%(+44.3)#82 |
| 83. | 54513 | 48.5% | 3.7%(+44.7)#3 | 4.3%(+44.2)#83 |
| 84. | 18246 | 48.3% | 3.8%(+44.5)#3 | 4.3%(+44.0)#84 |
| 85. | 22743 | 47.8% | 3.7%(+44.1)#3 | 4.3%(+43.6)#85 |
| 86. | 62311 | 47.6% | 4.4%(+43.2)#5 | 4.3%(+43.4)#86 |
| 87. | 93244 | 47.6% | 5.7%(+41.9)#4 | 4.3%(+43.4)#87 |
| 88. | 43463 | 47.5% | 3.7%(+43.7)#6 | 4.3%(+43.2)#88 |
| 89. | 26884 | 46.3% | 2.9%(+43.4)#4 | 4.3%(+42.1)#89 |
| 90. | 01066 | 46.2% | 4.7%(+41.4)#3 | 4.3%(+41.9)#90 |
| 91. | 67629 | 46.2% | 3.4%(+42.7)#2 | 4.3%(+41.9)#91 |
| 92. | 79230 | 46.2% | 3.2%(+42.9)#7 | 4.3%(+41.9)#92 |
| 93. | 98817 | 45.9% | 4.6%(+41.3)#4 | 4.3%(+41.7)#93 |
| 94. | 23708 | 45.5% | 3.7%(+41.7)#4 | 4.3%(+41.2)#94 |
| 95. | 47370 | 45.5% | 3.2%(+42.2)#3 | 4.3%(+41.2)#95 |
| 96. | 15678 | 44.8% | 3.8%(+41.0)#4 | 4.3%(+40.6)#96 |
| 97. | 47969 | 44.8% | 3.2%(+41.6)#4 | 4.3%(+40.6)#97 |
| 98. | 84013 | 44.7% | 4.3%(+40.5)#2 | 4.3%(+40.5)#98 |
| 99. | 12480 | 44.7% | 6.8%(+37.9)#9 | 4.3%(+40.5)#99 |
| 100. | 91330 | 44.5% | 5.7%(+38.8)#5 | 4.3%(+40.3)#100 |
Common Questions
What are the Top 10 Zip Codes with the Highest Percentage of Population with a Degree in Visual and Performing Arts in the United States?
Top 10 Zip Codes with the Highest Percentage of Population with a Degree in Visual and Performing Arts in the United States are:
What zip code has the Highest Percentage of Population with a Degree in Visual and Performing Arts in the United States?
76798 has the Highest Percentage of Population with a Degree in Visual and Performing Arts in the United States with 100.0%.
What is the Percentage of Population with a Degree in Visual and Performing Arts in the United States?
Percentage of Population with a Degree in Visual and Performing Arts in the United States is 4.3%.