Zip Codes with the Highest Percentage of Population with a Degree in Visual and Performing Arts in Tennessee
RELATED REPORTS & OPTIONS
Visual and Performing Arts
Tennessee
Compare Zip Codes
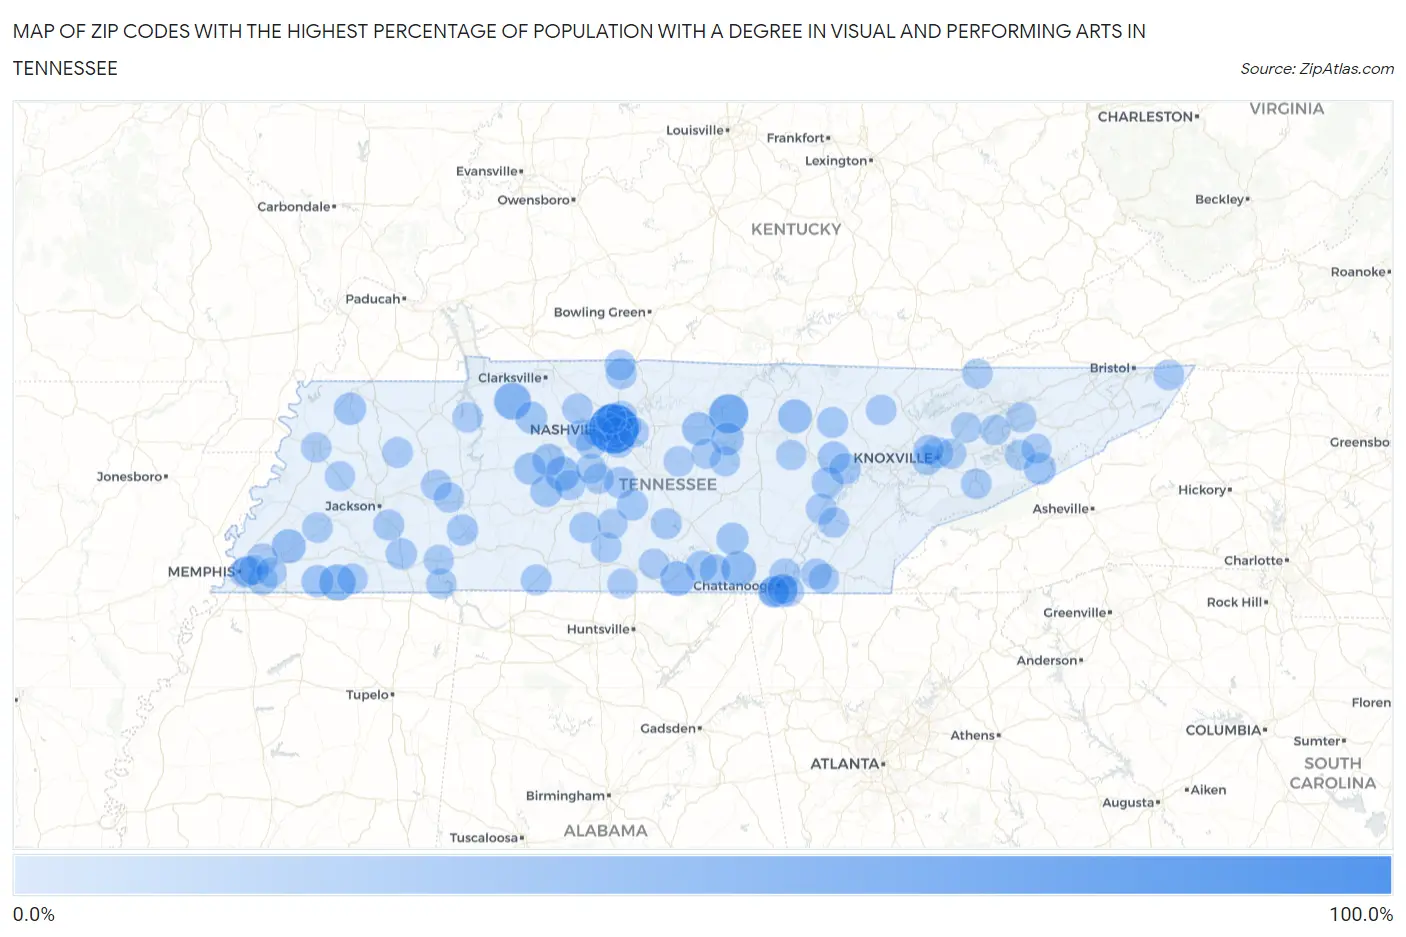
Map of Zip Codes with the Highest Percentage of Population with a Degree in Visual and Performing Arts in Tennessee
0.0%
100.0%
Zip Codes with the Highest Percentage of Population with a Degree in Visual and Performing Arts in Tennessee
| Zip Code | % Graduates | vs State | vs National | |
| 1. | 37213 | 100.0% | 4.1%(+95.9)#1 | 4.3%(+95.7)#20 |
| 2. | 38564 | 48.6% | 4.1%(+44.5)#2 | 4.3%(+44.3)#82 |
| 3. | 37050 | 37.1% | 4.1%(+33.0)#3 | 4.3%(+32.8)#137 |
| 4. | 38039 | 33.9% | 4.1%(+29.8)#4 | 4.3%(+29.7)#165 |
| 5. | 37374 | 28.1% | 4.1%(+24.0)#5 | 4.3%(+23.8)#254 |
| 6. | 37306 | 26.1% | 4.1%(+22.0)#6 | 4.3%(+21.8)#288 |
| 7. | 38476 | 25.7% | 4.1%(+21.6)#7 | 4.3%(+21.4)#299 |
| 8. | 38036 | 23.7% | 4.1%(+19.6)#8 | 4.3%(+19.4)#343 |
| 9. | 38554 | 22.8% | 4.1%(+18.8)#9 | 4.3%(+18.6)#364 |
| 10. | 38547 | 20.1% | 4.1%(+16.0)#10 | 4.3%(+15.8)#469 |
| 11. | 38582 | 17.9% | 4.1%(+13.8)#11 | 4.3%(+13.6)#586 |
| 12. | 37025 | 17.1% | 4.1%(+13.0)#12 | 4.3%(+12.9)#630 |
| 13. | 38253 | 16.0% | 4.1%(+12.0)#13 | 4.3%(+11.8)#709 |
| 14. | 38057 | 15.1% | 4.1%(+11.1)#14 | 4.3%(+10.9)#800 |
| 15. | 37727 | 15.0% | 4.1%(+10.9)#15 | 4.3%(+10.7)#809 |
| 16. | 37723 | 14.8% | 4.1%(+10.7)#16 | 4.3%(+10.5)#841 |
| 17. | 37407 | 14.7% | 4.1%(+10.7)#17 | 4.3%(+10.5)#848 |
| 18. | 37313 | 14.3% | 4.1%(+10.2)#18 | 4.3%(+10.0)#905 |
| 19. | 37216 | 13.8% | 4.1%(+9.74)#19 | 4.3%(+9.56)#978 |
| 20. | 37181 | 13.6% | 4.1%(+9.51)#20 | 4.3%(+9.32)#1,013 |
| 21. | 37137 | 13.2% | 4.1%(+9.16)#21 | 4.3%(+8.98)#1,063 |
| 22. | 37206 | 13.2% | 4.1%(+9.15)#22 | 4.3%(+8.96)#1,065 |
| 23. | 38454 | 13.0% | 4.1%(+8.94)#23 | 4.3%(+8.76)#1,104 |
| 24. | 37337 | 12.2% | 4.1%(+8.17)#24 | 4.3%(+7.98)#1,245 |
| 25. | 37854 | 11.8% | 4.1%(+7.76)#25 | 4.3%(+7.57)#1,325 |
| 26. | 37318 | 11.3% | 4.1%(+7.20)#26 | 4.3%(+7.02)#1,448 |
| 27. | 38315 | 11.3% | 4.1%(+7.19)#27 | 4.3%(+7.00)#1,455 |
| 28. | 37046 | 11.0% | 4.1%(+6.94)#28 | 4.3%(+6.75)#1,531 |
| 29. | 37180 | 10.9% | 4.1%(+6.80)#29 | 4.3%(+6.62)#1,571 |
| 30. | 38311 | 10.7% | 4.1%(+6.67)#30 | 4.3%(+6.48)#1,613 |
| 31. | 37214 | 10.6% | 4.1%(+6.56)#31 | 4.3%(+6.37)#1,649 |
| 32. | 37375 | 10.3% | 4.1%(+6.20)#32 | 4.3%(+6.01)#1,752 |
| 33. | 37726 | 10.1% | 4.1%(+6.01)#33 | 4.3%(+5.82)#1,797 |
| 34. | 37183 | 9.9% | 4.1%(+5.83)#34 | 4.3%(+5.64)#1,877 |
| 35. | 38451 | 9.9% | 4.1%(+5.82)#35 | 4.3%(+5.63)#1,880 |
| 36. | 38366 | 9.6% | 4.1%(+5.58)#36 | 4.3%(+5.39)#1,963 |
| 37. | 37204 | 9.4% | 4.1%(+5.36)#37 | 4.3%(+5.17)#2,054 |
| 38. | 37917 | 9.3% | 4.1%(+5.26)#38 | 4.3%(+5.07)#2,095 |
| 39. | 37143 | 8.9% | 4.1%(+4.86)#39 | 4.3%(+4.67)#2,293 |
| 40. | 37049 | 8.8% | 4.1%(+4.75)#40 | 4.3%(+4.57)#2,345 |
| 41. | 38469 | 8.8% | 4.1%(+4.71)#41 | 4.3%(+4.53)#2,370 |
| 42. | 37332 | 8.7% | 4.1%(+4.68)#42 | 4.3%(+4.49)#2,395 |
| 43. | 37415 | 8.7% | 4.1%(+4.66)#43 | 4.3%(+4.48)#2,400 |
| 44. | 38388 | 8.6% | 4.1%(+4.54)#44 | 4.3%(+4.35)#2,472 |
| 45. | 38220 | 8.6% | 4.1%(+4.52)#45 | 4.3%(+4.33)#2,481 |
| 46. | 37219 | 8.5% | 4.1%(+4.48)#46 | 4.3%(+4.29)#2,502 |
| 47. | 38104 | 8.4% | 4.1%(+4.30)#47 | 4.3%(+4.11)#2,619 |
| 48. | 37208 | 8.0% | 4.1%(+3.93)#48 | 4.3%(+3.74)#2,854 |
| 49. | 37353 | 8.0% | 4.1%(+3.89)#49 | 4.3%(+3.71)#2,885 |
| 50. | 37322 | 7.9% | 4.1%(+3.87)#50 | 4.3%(+3.68)#2,896 |
| 51. | 37115 | 7.9% | 4.1%(+3.86)#51 | 4.3%(+3.67)#2,906 |
| 52. | 38135 | 7.9% | 4.1%(+3.83)#52 | 4.3%(+3.64)#2,928 |
| 53. | 37350 | 7.8% | 4.1%(+3.76)#53 | 4.3%(+3.57)#2,965 |
| 54. | 37210 | 7.8% | 4.1%(+3.73)#54 | 4.3%(+3.54)#2,993 |
| 55. | 37015 | 7.8% | 4.1%(+3.72)#55 | 4.3%(+3.53)#3,000 |
| 56. | 37409 | 7.7% | 4.1%(+3.59)#56 | 4.3%(+3.40)#3,101 |
| 57. | 37211 | 7.6% | 4.1%(+3.55)#57 | 4.3%(+3.36)#3,131 |
| 58. | 37141 | 7.6% | 4.1%(+3.52)#58 | 4.3%(+3.33)#3,150 |
| 59. | 38069 | 7.5% | 4.1%(+3.43)#59 | 4.3%(+3.24)#3,218 |
| 60. | 37047 | 7.5% | 4.1%(+3.40)#60 | 4.3%(+3.22)#3,241 |
| 61. | 37688 | 7.5% | 4.1%(+3.39)#61 | 4.3%(+3.20)#3,253 |
| 62. | 38067 | 7.4% | 4.1%(+3.38)#62 | 4.3%(+3.19)#3,260 |
| 63. | 37756 | 7.3% | 4.1%(+3.27)#63 | 4.3%(+3.09)#3,339 |
| 64. | 38112 | 7.3% | 4.1%(+3.27)#64 | 4.3%(+3.08)#3,348 |
| 65. | 37863 | 7.3% | 4.1%(+3.24)#65 | 4.3%(+3.05)#3,369 |
| 66. | 38328 | 7.3% | 4.1%(+3.22)#66 | 4.3%(+3.03)#3,387 |
| 67. | 37179 | 7.3% | 4.1%(+3.20)#67 | 4.3%(+3.01)#3,412 |
| 68. | 37311 | 7.2% | 4.1%(+3.10)#68 | 4.3%(+2.91)#3,494 |
| 69. | 37412 | 7.1% | 4.1%(+3.07)#69 | 4.3%(+2.88)#3,535 |
| 70. | 37404 | 7.1% | 4.1%(+3.06)#70 | 4.3%(+2.88)#3,536 |
| 71. | 37209 | 7.1% | 4.1%(+3.03)#71 | 4.3%(+2.84)#3,565 |
| 72. | 38326 | 6.9% | 4.1%(+2.84)#72 | 4.3%(+2.65)#3,754 |
| 73. | 38221 | 6.9% | 4.1%(+2.80)#73 | 4.3%(+2.61)#3,794 |
| 74. | 38024 | 6.8% | 4.1%(+2.70)#74 | 4.3%(+2.51)#3,915 |
| 75. | 38488 | 6.7% | 4.1%(+2.64)#75 | 4.3%(+2.45)#3,979 |
| 76. | 37076 | 6.7% | 4.1%(+2.63)#76 | 4.3%(+2.44)#3,990 |
| 77. | 37221 | 6.7% | 4.1%(+2.62)#77 | 4.3%(+2.43)#3,997 |
| 78. | 37207 | 6.6% | 4.1%(+2.55)#78 | 4.3%(+2.36)#4,105 |
| 79. | 37860 | 6.6% | 4.1%(+2.54)#79 | 4.3%(+2.35)#4,118 |
| 80. | 37877 | 6.6% | 4.1%(+2.52)#80 | 4.3%(+2.34)#4,129 |
| 81. | 37909 | 6.4% | 4.1%(+2.38)#81 | 4.3%(+2.20)#4,293 |
| 82. | 37359 | 6.4% | 4.1%(+2.37)#82 | 4.3%(+2.18)#4,305 |
| 83. | 37821 | 6.4% | 4.1%(+2.33)#83 | 4.3%(+2.14)#4,349 |
| 84. | 38578 | 6.3% | 4.1%(+2.25)#84 | 4.3%(+2.06)#4,453 |
| 85. | 37709 | 6.3% | 4.1%(+2.22)#85 | 4.3%(+2.03)#4,488 |
| 86. | 37752 | 6.3% | 4.1%(+2.22)#86 | 4.3%(+2.03)#4,492 |
| 87. | 37118 | 6.3% | 4.1%(+2.21)#87 | 4.3%(+2.02)#4,504 |
| 88. | 37091 | 6.3% | 4.1%(+2.20)#88 | 4.3%(+2.02)#4,515 |
| 89. | 37166 | 6.2% | 4.1%(+2.11)#89 | 4.3%(+1.93)#4,632 |
| 90. | 38119 | 6.1% | 4.1%(+2.08)#90 | 4.3%(+1.90)#4,679 |
| 91. | 37914 | 6.1% | 4.1%(+2.08)#91 | 4.3%(+1.89)#4,681 |
| 92. | 38482 | 6.1% | 4.1%(+2.06)#92 | 4.3%(+1.88)#4,703 |
| 93. | 37095 | 6.1% | 4.1%(+2.03)#93 | 4.3%(+1.84)#4,741 |
| 94. | 37912 | 6.1% | 4.1%(+2.03)#94 | 4.3%(+1.84)#4,742 |
| 95. | 38327 | 6.1% | 4.1%(+2.00)#95 | 4.3%(+1.81)#4,790 |
| 96. | 37064 | 6.0% | 4.1%(+1.98)#96 | 4.3%(+1.80)#4,807 |
| 97. | 38122 | 6.0% | 4.1%(+1.92)#97 | 4.3%(+1.73)#4,900 |
| 98. | 37843 | 6.0% | 4.1%(+1.92)#98 | 4.3%(+1.73)#4,902 |
| 99. | 38001 | 6.0% | 4.1%(+1.89)#99 | 4.3%(+1.71)#4,930 |
| 100. | 38018 | 5.9% | 4.1%(+1.88)#100 | 4.3%(+1.69)#4,946 |
Common Questions
What are the Top 10 Zip Codes with the Highest Percentage of Population with a Degree in Visual and Performing Arts in Tennessee?
Top 10 Zip Codes with the Highest Percentage of Population with a Degree in Visual and Performing Arts in Tennessee are:
What zip code has the Highest Percentage of Population with a Degree in Visual and Performing Arts in Tennessee?
37213 has the Highest Percentage of Population with a Degree in Visual and Performing Arts in Tennessee with 100.0%.
What is the Percentage of Population with a Degree in Visual and Performing Arts in the State of Tennessee?
Percentage of Population with a Degree in Visual and Performing Arts in Tennessee is 4.1%.
What is the Percentage of Population with a Degree in Visual and Performing Arts in the United States?
Percentage of Population with a Degree in Visual and Performing Arts in the United States is 4.3%.