Zip Codes with the Highest Percentage of Families with Income Below $10,000 in Washington
RELATED REPORTS & OPTIONS
Family Income | $0-10k
Washington
Compare Zip Codes
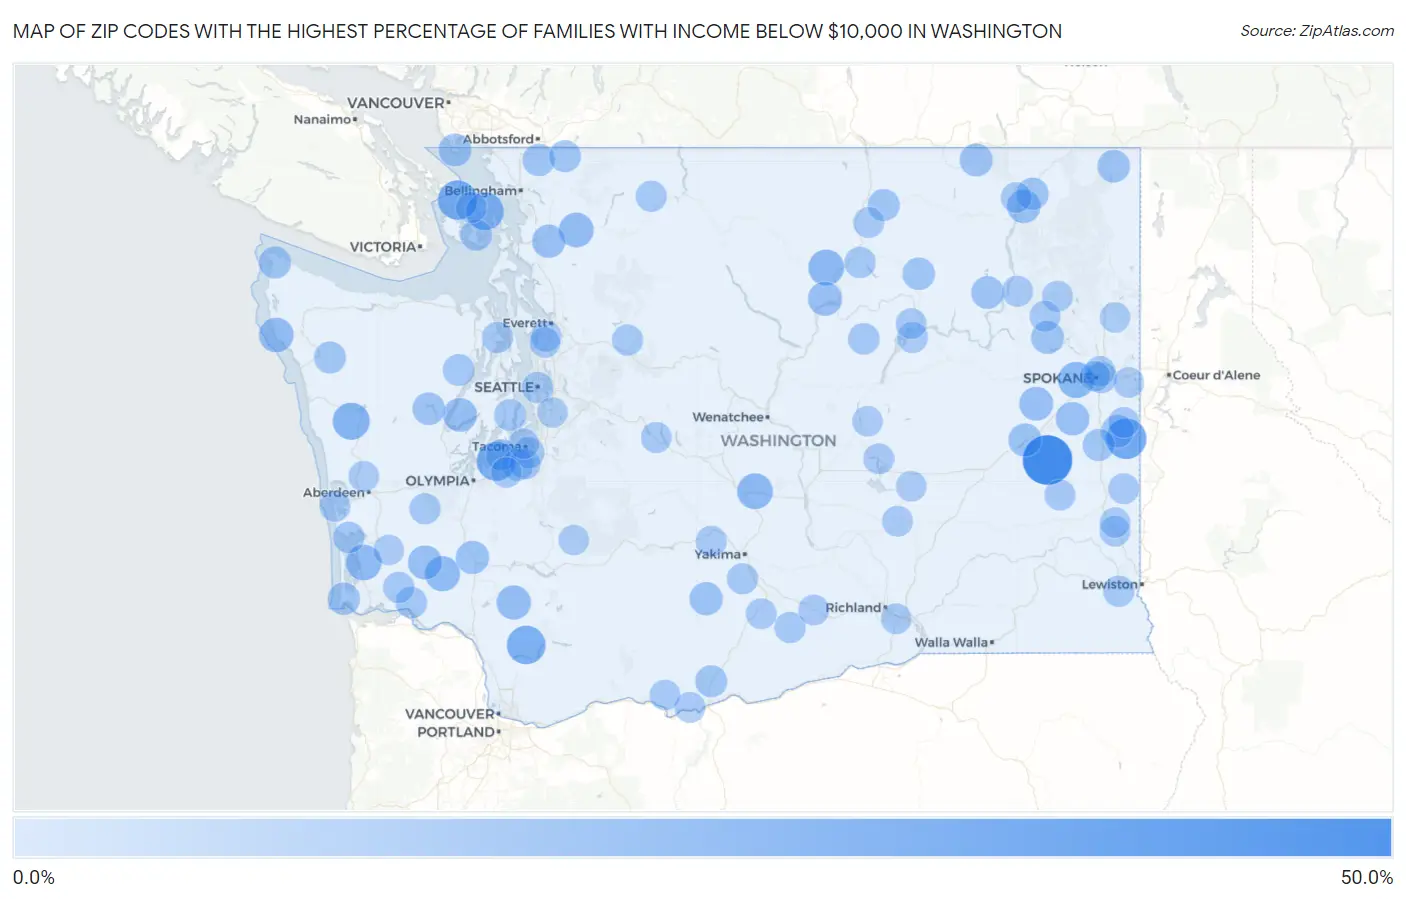
Map of Zip Codes with the Highest Percentage of Families with Income Below $10,000 in Washington
0.0%
50.0%
Zip Codes with the Highest Percentage of Families with Income Below $10,000 in Washington
| Zip Code | Families with Income < $10k | vs State | vs National | |
| 1. | 99017 | 41.7% | 2.4%(+39.3)#1 | 3.1%(+38.6)#96 |
| 2. | 99018 | 23.8% | 2.4%(+21.4)#2 | 3.1%(+20.7)#342 |
| 3. | 98297 | 21.4% | 2.4%(+19.0)#3 | 3.1%(+18.3)#427 |
| 4. | 98303 | 21.2% | 2.4%(+18.8)#4 | 3.1%(+18.1)#430 |
| 5. | 98603 | 20.3% | 2.4%(+17.9)#5 | 3.1%(+17.2)#463 |
| 6. | 98279 | 18.6% | 2.4%(+16.2)#6 | 3.1%(+15.5)#552 |
| 7. | 98566 | 17.2% | 2.4%(+14.8)#7 | 3.1%(+14.1)#652 |
| 8. | 99001 | 15.4% | 2.4%(+13.0)#8 | 3.1%(+12.3)#810 |
| 9. | 98829 | 14.8% | 2.4%(+12.4)#9 | 3.1%(+11.7)#889 |
| 10. | 98934 | 14.6% | 2.4%(+12.2)#10 | 3.1%(+11.5)#909 |
| 11. | 98586 | 14.3% | 2.4%(+11.9)#11 | 3.1%(+11.2)#935 |
| 12. | 98538 | 13.4% | 2.4%(+11.0)#12 | 3.1%(+10.3)#1,063 |
| 13. | 98255 | 12.6% | 2.4%(+10.2)#13 | 3.1%(+9.50)#1,210 |
| 14. | 98350 | 12.5% | 2.4%(+10.1)#14 | 3.1%(+9.40)#1,228 |
| 15. | 98649 | 11.9% | 2.4%(+9.50)#15 | 3.1%(+8.80)#1,360 |
| 16. | 98812 | 11.4% | 2.4%(+9.00)#16 | 3.1%(+8.30)#1,480 |
| 17. | 98572 | 11.4% | 2.4%(+9.00)#17 | 3.1%(+8.30)#1,493 |
| 18. | 98588 | 11.0% | 2.4%(+8.60)#18 | 3.1%(+7.90)#1,599 |
| 19. | 99008 | 10.9% | 2.4%(+8.50)#19 | 3.1%(+7.80)#1,636 |
| 20. | 99151 | 10.7% | 2.4%(+8.30)#20 | 3.1%(+7.60)#1,697 |
| 21. | 99004 | 10.2% | 2.4%(+7.80)#21 | 3.1%(+7.10)#1,832 |
| 22. | 98235 | 10.1% | 2.4%(+7.70)#22 | 3.1%(+7.00)#1,894 |
| 23. | 98565 | 10.0% | 2.4%(+7.60)#23 | 3.1%(+6.90)#1,931 |
| 24. | 98952 | 9.9% | 2.4%(+7.50)#24 | 3.1%(+6.80)#1,968 |
| 25. | 99032 | 9.7% | 2.4%(+7.30)#25 | 3.1%(+6.60)#2,057 |
| 26. | 99121 | 9.3% | 2.4%(+6.90)#26 | 3.1%(+6.20)#2,234 |
| 27. | 99013 | 9.1% | 2.4%(+6.70)#27 | 3.1%(+6.00)#2,329 |
| 28. | 99039 | 8.9% | 2.4%(+6.50)#28 | 3.1%(+5.80)#2,448 |
| 29. | 98281 | 8.8% | 2.4%(+6.40)#29 | 3.1%(+5.70)#2,482 |
| 30. | 99138 | 8.8% | 2.4%(+6.40)#30 | 3.1%(+5.70)#2,485 |
| 31. | 98548 | 8.6% | 2.4%(+6.20)#31 | 3.1%(+5.50)#2,587 |
| 32. | 99153 | 8.6% | 2.4%(+6.20)#32 | 3.1%(+5.50)#2,618 |
| 33. | 99155 | 8.5% | 2.4%(+6.10)#33 | 3.1%(+5.40)#2,682 |
| 34. | 98644 | 8.4% | 2.4%(+6.00)#34 | 3.1%(+5.30)#2,758 |
| 35. | 98276 | 8.1% | 2.4%(+5.70)#35 | 3.1%(+5.00)#2,930 |
| 36. | 99126 | 8.0% | 2.4%(+5.60)#36 | 3.1%(+4.90)#3,000 |
| 37. | 98357 | 7.7% | 2.4%(+5.30)#37 | 3.1%(+4.60)#3,157 |
| 38. | 98331 | 7.5% | 2.4%(+5.10)#38 | 3.1%(+4.40)#3,290 |
| 39. | 99170 | 7.5% | 2.4%(+5.10)#39 | 3.1%(+4.40)#3,314 |
| 40. | 98266 | 7.4% | 2.4%(+5.00)#40 | 3.1%(+4.30)#3,359 |
| 41. | 98620 | 7.3% | 2.4%(+4.90)#41 | 3.1%(+4.20)#3,412 |
| 42. | 98855 | 7.3% | 2.4%(+4.90)#42 | 3.1%(+4.20)#3,418 |
| 43. | 98359 | 7.1% | 2.4%(+4.70)#43 | 3.1%(+4.00)#3,573 |
| 44. | 98320 | 7.1% | 2.4%(+4.70)#44 | 3.1%(+4.00)#3,592 |
| 45. | 98261 | 6.8% | 2.4%(+4.40)#45 | 3.1%(+3.70)#3,837 |
| 46. | 98647 | 6.8% | 2.4%(+4.40)#46 | 3.1%(+3.70)#3,876 |
| 47. | 98830 | 6.6% | 2.4%(+4.20)#47 | 3.1%(+3.50)#4,076 |
| 48. | 98104 | 6.5% | 2.4%(+4.10)#48 | 3.1%(+3.40)#4,118 |
| 49. | 98439 | 6.4% | 2.4%(+4.00)#49 | 3.1%(+3.30)#4,243 |
| 50. | 98590 | 6.4% | 2.4%(+4.00)#50 | 3.1%(+3.30)#4,279 |
| 51. | 98840 | 6.3% | 2.4%(+3.90)#51 | 3.1%(+3.20)#4,345 |
| 52. | 99202 | 6.2% | 2.4%(+3.80)#52 | 3.1%(+3.10)#4,437 |
| 53. | 98388 | 6.2% | 2.4%(+3.80)#53 | 3.1%(+3.10)#4,466 |
| 54. | 98621 | 6.1% | 2.4%(+3.70)#54 | 3.1%(+3.00)#4,627 |
| 55. | 99403 | 6.0% | 2.4%(+3.60)#55 | 3.1%(+2.90)#4,654 |
| 56. | 98404 | 5.9% | 2.4%(+3.50)#56 | 3.1%(+2.80)#4,773 |
| 57. | 98444 | 5.9% | 2.4%(+3.50)#57 | 3.1%(+2.80)#4,774 |
| 58. | 98935 | 5.9% | 2.4%(+3.50)#58 | 3.1%(+2.80)#4,826 |
| 59. | 98951 | 5.8% | 2.4%(+3.40)#59 | 3.1%(+2.70)#4,932 |
| 60. | 98365 | 5.8% | 2.4%(+3.40)#60 | 3.1%(+2.70)#4,949 |
| 61. | 98568 | 5.8% | 2.4%(+3.40)#61 | 3.1%(+2.70)#4,959 |
| 62. | 98283 | 5.8% | 2.4%(+3.40)#62 | 3.1%(+2.70)#4,995 |
| 63. | 98251 | 5.7% | 2.4%(+3.30)#63 | 3.1%(+2.60)#5,065 |
| 64. | 98947 | 5.6% | 2.4%(+3.20)#64 | 3.1%(+2.50)#5,231 |
| 65. | 99012 | 5.6% | 2.4%(+3.20)#65 | 3.1%(+2.50)#5,259 |
| 66. | 98925 | 5.6% | 2.4%(+3.20)#66 | 3.1%(+2.50)#5,272 |
| 67. | 99181 | 5.5% | 2.4%(+3.10)#67 | 3.1%(+2.40)#5,389 |
| 68. | 99173 | 5.5% | 2.4%(+3.10)#68 | 3.1%(+2.40)#5,390 |
| 69. | 98849 | 5.5% | 2.4%(+3.10)#69 | 3.1%(+2.40)#5,403 |
| 70. | 99123 | 5.5% | 2.4%(+3.10)#70 | 3.1%(+2.40)#5,406 |
| 71. | 99125 | 5.5% | 2.4%(+3.10)#71 | 3.1%(+2.40)#5,410 |
| 72. | 99137 | 5.5% | 2.4%(+3.10)#72 | 3.1%(+2.40)#5,419 |
| 73. | 98245 | 5.4% | 2.4%(+3.00)#73 | 3.1%(+2.30)#5,517 |
| 74. | 98595 | 5.4% | 2.4%(+3.00)#74 | 3.1%(+2.30)#5,530 |
| 75. | 99130 | 5.4% | 2.4%(+3.00)#75 | 3.1%(+2.30)#5,567 |
| 76. | 99133 | 5.3% | 2.4%(+2.90)#76 | 3.1%(+2.20)#5,698 |
| 77. | 98837 | 5.2% | 2.4%(+2.80)#77 | 3.1%(+2.10)#5,753 |
| 78. | 99344 | 5.2% | 2.4%(+2.80)#78 | 3.1%(+2.10)#5,781 |
| 79. | 98673 | 5.2% | 2.4%(+2.80)#79 | 3.1%(+2.10)#5,901 |
| 80. | 99336 | 5.1% | 2.4%(+2.70)#80 | 3.1%(+2.00)#5,915 |
| 81. | 99163 | 5.1% | 2.4%(+2.70)#81 | 3.1%(+2.00)#5,932 |
| 82. | 98930 | 5.1% | 2.4%(+2.70)#82 | 3.1%(+2.00)#5,961 |
| 83. | 98403 | 5.1% | 2.4%(+2.70)#83 | 3.1%(+2.00)#5,980 |
| 84. | 99141 | 5.1% | 2.4%(+2.70)#84 | 3.1%(+2.00)#5,990 |
| 85. | 98204 | 5.0% | 2.4%(+2.60)#85 | 3.1%(+1.90)#6,084 |
| 86. | 98433 | 5.0% | 2.4%(+2.60)#86 | 3.1%(+1.90)#6,117 |
| 87. | 98948 | 5.0% | 2.4%(+2.60)#87 | 3.1%(+1.90)#6,131 |
| 88. | 98087 | 4.9% | 2.4%(+2.50)#88 | 3.1%(+1.80)#6,252 |
| 89. | 98520 | 4.9% | 2.4%(+2.50)#89 | 3.1%(+1.80)#6,279 |
| 90. | 98635 | 4.9% | 2.4%(+2.50)#90 | 3.1%(+1.80)#6,375 |
| 91. | 99207 | 4.8% | 2.4%(+2.40)#91 | 3.1%(+1.70)#6,430 |
| 92. | 99016 | 4.8% | 2.4%(+2.40)#92 | 3.1%(+1.70)#6,465 |
| 93. | 98857 | 4.8% | 2.4%(+2.40)#93 | 3.1%(+1.70)#6,527 |
| 94. | 99102 | 4.8% | 2.4%(+2.40)#94 | 3.1%(+1.70)#6,582 |
| 95. | 98851 | 4.7% | 2.4%(+2.30)#95 | 3.1%(+1.60)#6,702 |
| 96. | 99201 | 4.6% | 2.4%(+2.20)#96 | 3.1%(+1.50)#6,853 |
| 97. | 98577 | 4.6% | 2.4%(+2.20)#97 | 3.1%(+1.50)#6,881 |
| 98. | 99009 | 4.6% | 2.4%(+2.20)#98 | 3.1%(+1.50)#6,902 |
| 99. | 98355 | 4.6% | 2.4%(+2.20)#99 | 3.1%(+1.50)#6,960 |
| 100. | 98055 | 4.5% | 2.4%(+2.10)#100 | 3.1%(+1.40)#7,015 |
Common Questions
What are the Top 10 Zip Codes with the Highest Percentage of Families with Income Below $10,000 in Washington?
Top 10 Zip Codes with the Highest Percentage of Families with Income Below $10,000 in Washington are:
What zip code has the Highest Percentage of Families with Income Below $10,000 in Washington?
99017 has the Highest Percentage of Families with Income Below $10,000 in Washington with 41.7%.
What is the Percentage of Families with Income Below $10,000 in the State of Washington?
Percentage of Families with Income Below $10,000 in Washington is 2.4%.
What is the Percentage of Families with Income Below $10,000 in the United States?
Percentage of Families with Income Below $10,000 in the United States is 3.1%.