Zip Codes with the Highest Percentage of Families with Income Below $10,000 in Papillion, NE
RELATED REPORTS & OPTIONS
Family Income | $0-10k
Papillion
Compare Zip Codes
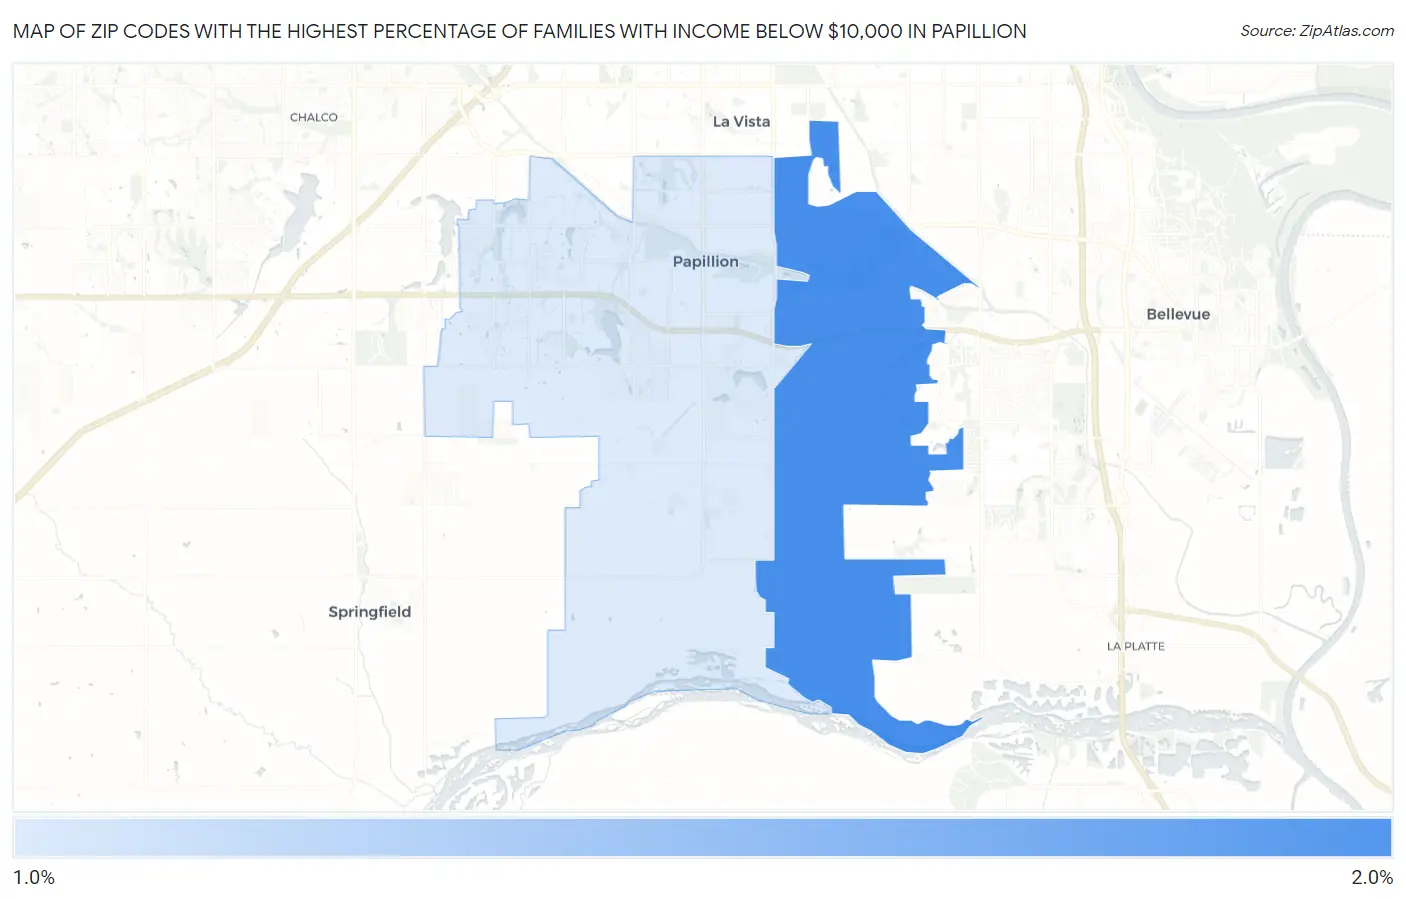
Map of Zip Codes with the Highest Percentage of Families with Income Below $10,000 in Papillion
1.0%
1.8%
Zip Codes with the Highest Percentage of Families with Income Below $10,000 in Papillion, NE
| Zip Code | Families with Income < $10k | vs State | vs National | |
| 1. | 68133 | 1.8% | 2.1%(-0.300)#201 | 3.1%(-1.30)#16,401 |
| 2. | 68046 | 1.0% | 2.1%(-1.10)#266 | 3.1%(-2.10)#20,245 |
1
Common Questions
What are the Top Zip Codes with the Highest Percentage of Families with Income Below $10,000 in Papillion, NE?
Top Zip Codes with the Highest Percentage of Families with Income Below $10,000 in Papillion, NE are:
What zip code has the Highest Percentage of Families with Income Below $10,000 in Papillion, NE?
68133 has the Highest Percentage of Families with Income Below $10,000 in Papillion, NE with 1.8%.
What is the Percentage of Families with Income Below $10,000 in Papillion, NE?
Percentage of Families with Income Below $10,000 in Papillion is 0.80%.
What is the Percentage of Families with Income Below $10,000 in Nebraska?
Percentage of Families with Income Below $10,000 in Nebraska is 2.1%.
What is the Percentage of Families with Income Below $10,000 in the United States?
Percentage of Families with Income Below $10,000 in the United States is 3.1%.