Zip Codes with the Highest Percentage of Families with Income Above $200,000 in New Mexico
RELATED REPORTS & OPTIONS
Family Income | $200k+
New Mexico
Compare Zip Codes
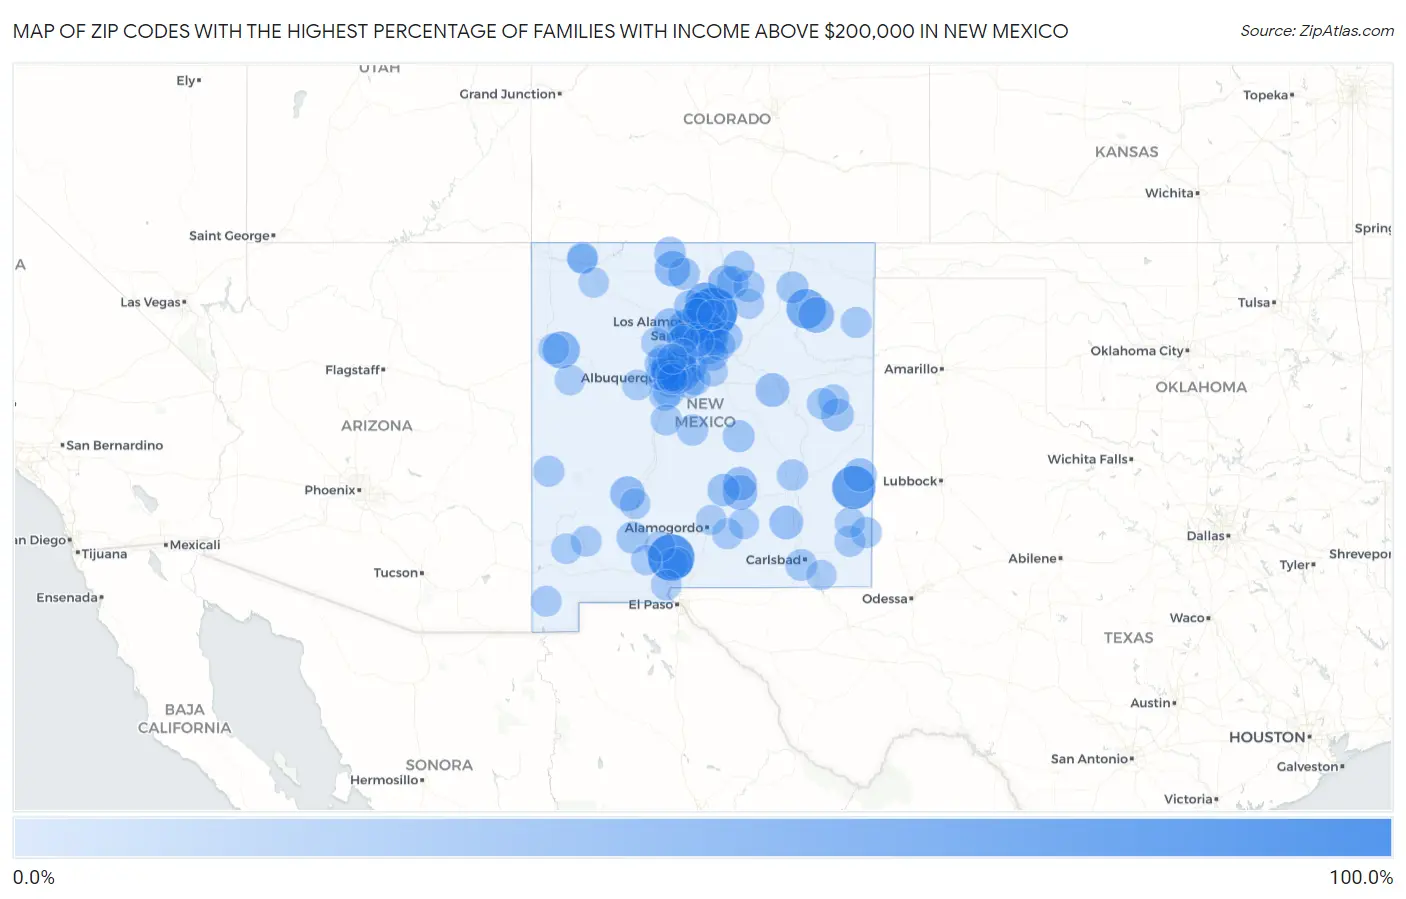
Map of Zip Codes with the Highest Percentage of Families with Income Above $200,000 in New Mexico
0.0%
100.0%
Zip Codes with the Highest Percentage of Families with Income Above $200,000 in New Mexico
| Zip Code | Families with Income > $200k | vs State | vs National | |
| 1. | 87523 | 100.0% | 8.2%(+91.8)#1 | 14.8%(+85.2)#11 |
| 2. | 88052 | 84.6% | 8.2%(+76.4)#2 | 14.8%(+69.8)#63 |
| 3. | 88114 | 68.2% | 8.2%(+60.0)#3 | 14.8%(+53.4)#142 |
| 4. | 87582 | 52.5% | 8.2%(+44.3)#4 | 14.8%(+37.7)#553 |
| 5. | 87730 | 50.0% | 8.2%(+41.8)#5 | 14.8%(+35.2)#673 |
| 6. | 87122 | 42.4% | 8.2%(+34.2)#6 | 14.8%(+27.6)#1,107 |
| 7. | 87316 | 38.3% | 8.2%(+30.1)#7 | 14.8%(+23.5)#1,484 |
| 8. | 87547 | 36.7% | 8.2%(+28.5)#8 | 14.8%(+21.9)#1,648 |
| 9. | 87544 | 35.3% | 8.2%(+27.1)#9 | 14.8%(+20.5)#1,803 |
| 10. | 87008 | 35.0% | 8.2%(+26.8)#10 | 14.8%(+20.2)#1,848 |
| 11. | 87743 | 31.4% | 8.2%(+23.2)#11 | 14.8%(+16.6)#2,314 |
| 12. | 87575 | 29.9% | 8.2%(+21.7)#12 | 14.8%(+15.1)#2,530 |
| 13. | 87048 | 28.1% | 8.2%(+19.9)#13 | 14.8%(+13.3)#2,854 |
| 14. | 87939 | 26.6% | 8.2%(+18.4)#14 | 14.8%(+11.8)#3,142 |
| 15. | 88348 | 26.4% | 8.2%(+18.2)#15 | 14.8%(+11.6)#3,174 |
| 16. | 87501 | 26.1% | 8.2%(+17.9)#16 | 14.8%(+11.3)#3,220 |
| 17. | 87529 | 23.7% | 8.2%(+15.5)#17 | 14.8%(+8.90)#3,791 |
| 18. | 87506 | 23.4% | 8.2%(+15.2)#18 | 14.8%(+8.60)#3,856 |
| 19. | 88435 | 22.5% | 8.2%(+14.3)#19 | 14.8%(+7.70)#4,089 |
| 20. | 88338 | 21.6% | 8.2%(+13.4)#20 | 14.8%(+6.80)#4,345 |
| 21. | 88253 | 21.2% | 8.2%(+13.0)#21 | 14.8%(+6.40)#4,458 |
| 22. | 88125 | 21.1% | 8.2%(+12.9)#22 | 14.8%(+6.30)#4,492 |
| 23. | 87047 | 20.6% | 8.2%(+12.4)#23 | 14.8%(+5.80)#4,634 |
| 24. | 87025 | 20.0% | 8.2%(+11.8)#24 | 14.8%(+5.20)#4,825 |
| 25. | 87508 | 19.1% | 8.2%(+10.9)#25 | 14.8%(+4.30)#5,115 |
| 26. | 87111 | 19.0% | 8.2%(+10.8)#26 | 14.8%(+4.20)#5,137 |
| 27. | 87043 | 18.7% | 8.2%(+10.5)#27 | 14.8%(+3.90)#5,296 |
| 28. | 88124 | 17.2% | 8.2%(+9.00)#28 | 14.8%(+2.40)#5,913 |
| 29. | 88312 | 16.0% | 8.2%(+7.80)#29 | 14.8%(+1.20)#6,465 |
| 30. | 87505 | 15.6% | 8.2%(+7.40)#30 | 14.8%(+0.800)#6,629 |
| 31. | 87571 | 15.3% | 8.2%(+7.10)#31 | 14.8%(+0.500)#6,804 |
| 32. | 87552 | 14.7% | 8.2%(+6.50)#32 | 14.8%(-0.100)#7,188 |
| 33. | 87106 | 14.0% | 8.2%(+5.80)#33 | 14.8%(-0.800)#7,537 |
| 34. | 88318 | 13.9% | 8.2%(+5.70)#34 | 14.8%(-0.900)#7,644 |
| 35. | 87515 | 13.4% | 8.2%(+5.20)#35 | 14.8%(-1.40)#7,973 |
| 36. | 87936 | 13.3% | 8.2%(+5.10)#36 | 14.8%(-1.50)#8,054 |
| 37. | 87747 | 13.2% | 8.2%(+5.00)#37 | 14.8%(-1.60)#8,104 |
| 38. | 87068 | 13.1% | 8.2%(+4.90)#38 | 14.8%(-1.70)#8,153 |
| 39. | 87537 | 13.1% | 8.2%(+4.90)#39 | 14.8%(-1.70)#8,162 |
| 40. | 87104 | 13.0% | 8.2%(+4.80)#40 | 14.8%(-1.80)#8,218 |
| 41. | 87059 | 12.6% | 8.2%(+4.40)#41 | 14.8%(-2.20)#8,508 |
| 42. | 87540 | 12.6% | 8.2%(+4.40)#42 | 14.8%(-2.20)#8,540 |
| 43. | 88220 | 11.9% | 8.2%(+3.70)#43 | 14.8%(-2.90)#9,042 |
| 44. | 87710 | 11.8% | 8.2%(+3.60)#44 | 14.8%(-3.00)#9,154 |
| 45. | 87113 | 11.5% | 8.2%(+3.30)#45 | 14.8%(-3.30)#9,364 |
| 46. | 87520 | 11.0% | 8.2%(+2.80)#46 | 14.8%(-3.80)#9,861 |
| 47. | 87042 | 10.9% | 8.2%(+2.70)#47 | 14.8%(-3.90)#9,942 |
| 48. | 88011 | 10.8% | 8.2%(+2.60)#48 | 14.8%(-4.00)#10,005 |
| 49. | 87109 | 10.6% | 8.2%(+2.40)#49 | 14.8%(-4.20)#10,198 |
| 50. | 87107 | 10.6% | 8.2%(+2.40)#50 | 14.8%(-4.20)#10,208 |
| 51. | 88201 | 10.3% | 8.2%(+2.10)#51 | 14.8%(-4.50)#10,481 |
| 52. | 87120 | 9.9% | 8.2%(+1.70)#52 | 14.8%(-4.90)#10,885 |
| 53. | 87036 | 9.8% | 8.2%(+1.60)#53 | 14.8%(-5.00)#11,049 |
| 54. | 88427 | 9.7% | 8.2%(+1.50)#54 | 14.8%(-5.10)#11,181 |
| 55. | 87072 | 9.6% | 8.2%(+1.40)#55 | 14.8%(-5.20)#11,285 |
| 56. | 88121 | 9.6% | 8.2%(+1.40)#56 | 14.8%(-5.20)#11,297 |
| 57. | 88002 | 9.5% | 8.2%(+1.30)#57 | 14.8%(-5.30)#11,373 |
| 58. | 88242 | 9.4% | 8.2%(+1.20)#58 | 14.8%(-5.40)#11,450 |
| 59. | 87062 | 9.3% | 8.2%(+1.10)#59 | 14.8%(-5.50)#11,601 |
| 60. | 87322 | 9.2% | 8.2%(+1.00)#60 | 14.8%(-5.60)#11,740 |
| 61. | 87144 | 9.1% | 8.2%(+0.900)#61 | 14.8%(-5.70)#11,756 |
| 62. | 88410 | 9.1% | 8.2%(+0.900)#62 | 14.8%(-5.70)#11,879 |
| 63. | 88240 | 9.0% | 8.2%(+0.800)#63 | 14.8%(-5.80)#11,888 |
| 64. | 87830 | 9.0% | 8.2%(+0.800)#64 | 14.8%(-5.80)#11,987 |
| 65. | 87114 | 8.9% | 8.2%(+0.700)#65 | 14.8%(-5.90)#12,006 |
| 66. | 87535 | 8.9% | 8.2%(+0.700)#66 | 14.8%(-5.90)#12,090 |
| 67. | 87402 | 8.8% | 8.2%(+0.600)#67 | 14.8%(-6.00)#12,158 |
| 68. | 88317 | 8.8% | 8.2%(+0.600)#68 | 14.8%(-6.00)#12,191 |
| 69. | 87123 | 8.6% | 8.2%(+0.400)#69 | 14.8%(-6.20)#12,378 |
| 70. | 87558 | 8.6% | 8.2%(+0.400)#70 | 14.8%(-6.20)#12,473 |
| 71. | 87112 | 8.4% | 8.2%(+0.200)#71 | 14.8%(-6.40)#12,633 |
| 72. | 87015 | 8.4% | 8.2%(+0.200)#72 | 14.8%(-6.40)#12,666 |
| 73. | 87124 | 8.0% | 8.2%(-0.200)#73 | 14.8%(-6.80)#13,162 |
| 74. | 88339 | 7.8% | 8.2%(-0.400)#74 | 14.8%(-7.00)#13,560 |
| 75. | 87935 | 7.7% | 8.2%(-0.500)#75 | 14.8%(-7.10)#13,664 |
| 76. | 88020 | 7.7% | 8.2%(-0.500)#76 | 14.8%(-7.10)#13,686 |
| 77. | 88012 | 7.5% | 8.2%(-0.700)#77 | 14.8%(-7.30)#13,869 |
| 78. | 87110 | 7.4% | 8.2%(-0.800)#78 | 14.8%(-7.40)#14,013 |
| 79. | 88023 | 7.4% | 8.2%(-0.800)#79 | 14.8%(-7.40)#14,097 |
| 80. | 87566 | 7.3% | 8.2%(-0.900)#80 | 14.8%(-7.50)#14,251 |
| 81. | 87108 | 7.2% | 8.2%(-1.000)#81 | 14.8%(-7.60)#14,328 |
| 82. | 87507 | 7.1% | 8.2%(-1.10)#82 | 14.8%(-7.70)#14,460 |
| 83. | 88027 | 7.1% | 8.2%(-1.10)#83 | 14.8%(-7.70)#14,626 |
| 84. | 87026 | 7.0% | 8.2%(-1.20)#84 | 14.8%(-7.80)#14,753 |
| 85. | 87056 | 6.9% | 8.2%(-1.30)#85 | 14.8%(-7.90)#14,969 |
| 86. | 88007 | 6.7% | 8.2%(-1.50)#86 | 14.8%(-8.10)#15,196 |
| 87. | 88061 | 6.6% | 8.2%(-1.60)#87 | 14.8%(-8.20)#15,396 |
| 88. | 87532 | 6.5% | 8.2%(-1.70)#88 | 14.8%(-8.30)#15,528 |
| 89. | 87321 | 6.3% | 8.2%(-1.90)#89 | 14.8%(-8.50)#15,988 |
| 90. | 87083 | 6.3% | 8.2%(-1.90)#90 | 14.8%(-8.50)#16,042 |
| 91. | 87401 | 6.0% | 8.2%(-2.20)#91 | 14.8%(-8.80)#16,423 |
| 92. | 87053 | 5.9% | 8.2%(-2.30)#92 | 14.8%(-8.90)#16,742 |
| 93. | 87001 | 5.8% | 8.2%(-2.40)#93 | 14.8%(-9.00)#16,868 |
| 94. | 88337 | 5.8% | 8.2%(-2.40)#94 | 14.8%(-9.00)#16,890 |
| 95. | 88260 | 5.7% | 8.2%(-2.50)#95 | 14.8%(-9.10)#16,998 |
| 96. | 87004 | 5.7% | 8.2%(-2.50)#96 | 14.8%(-9.10)#17,010 |
| 97. | 87522 | 5.6% | 8.2%(-2.60)#97 | 14.8%(-9.20)#17,263 |
| 98. | 87722 | 5.6% | 8.2%(-2.60)#98 | 14.8%(-9.20)#17,351 |
| 99. | 87413 | 5.4% | 8.2%(-2.80)#99 | 14.8%(-9.40)#17,605 |
| 100. | 88256 | 5.4% | 8.2%(-2.80)#100 | 14.8%(-9.40)#17,692 |
Common Questions
What are the Top 10 Zip Codes with the Highest Percentage of Families with Income Above $200,000 in New Mexico?
Top 10 Zip Codes with the Highest Percentage of Families with Income Above $200,000 in New Mexico are:
What zip code has the Highest Percentage of Families with Income Above $200,000 in New Mexico?
87523 has the Highest Percentage of Families with Income Above $200,000 in New Mexico with 100.0%.
What is the Percentage of Families with Income Above $200,000 in the State of New Mexico?
Percentage of Families with Income Above $200,000 in New Mexico is 8.2%.
What is the Percentage of Families with Income Above $200,000 in the United States?
Percentage of Families with Income Above $200,000 in the United States is 14.8%.