Zip Codes with the Highest Percentage of Families with Income Above $200,000 in Pennsylvania
RELATED REPORTS & OPTIONS
Family Income | $200k+
Pennsylvania
Compare Zip Codes
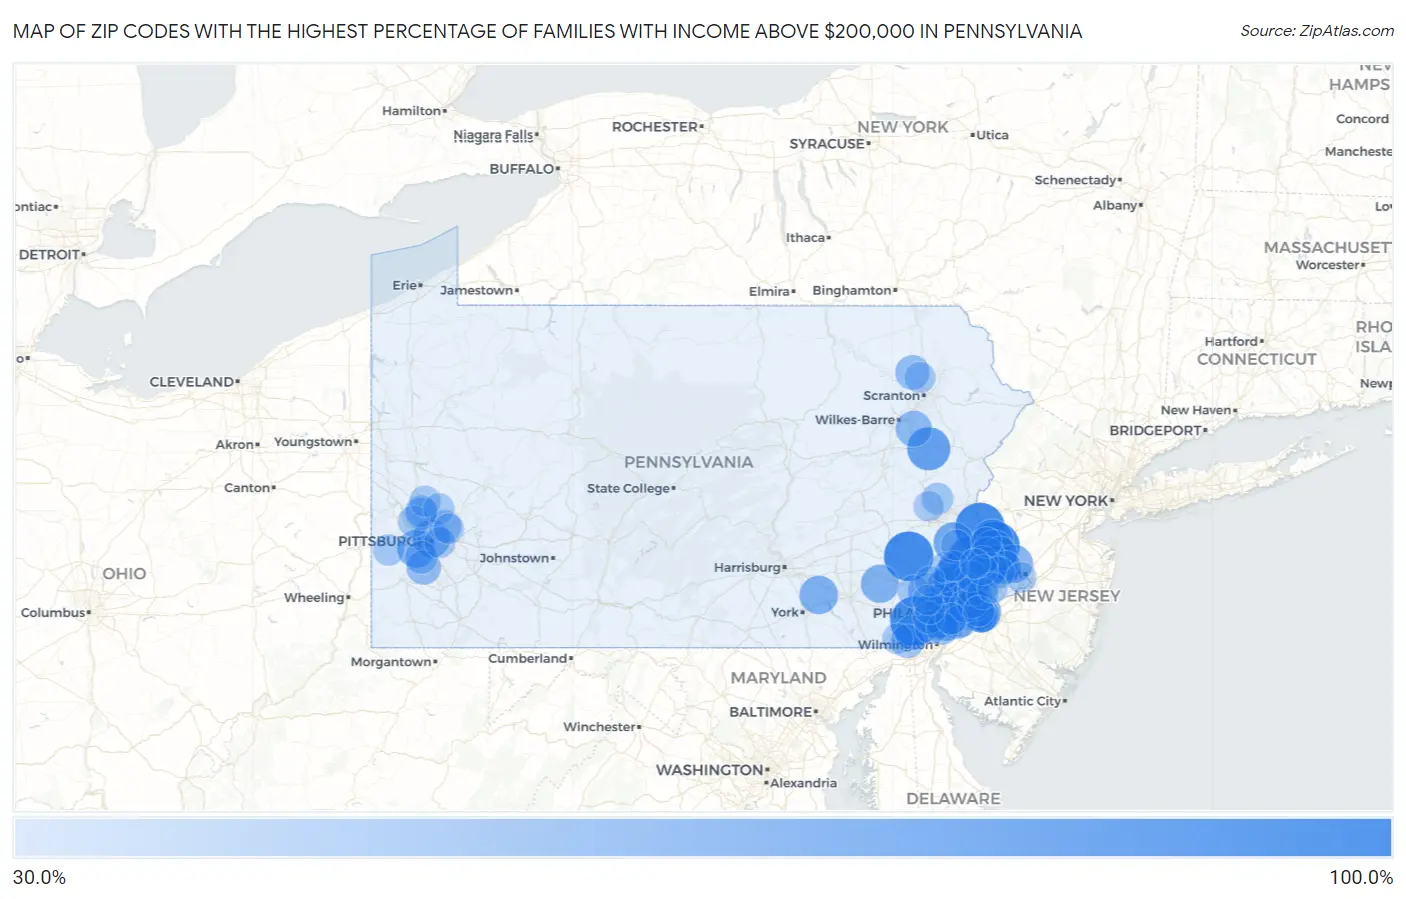
Map of Zip Codes with the Highest Percentage of Families with Income Above $200,000 in Pennsylvania
30.0%
100.0%
Zip Codes with the Highest Percentage of Families with Income Above $200,000 in Pennsylvania
| Zip Code | Families with Income > $200k | vs State | vs National | |
| 1. | 19490 | 100.0% | 14.0%(+86.0)#1 | 14.8%(+85.2)#8 |
| 2. | 19375 | 100.0% | 14.0%(+86.0)#2 | 14.8%(+85.2)#14 |
| 3. | 18921 | 100.0% | 14.0%(+86.0)#3 | 14.8%(+85.2)#18 |
| 4. | 18933 | 100.0% | 14.0%(+86.0)#4 | 14.8%(+85.2)#19 |
| 5. | 19535 | 100.0% | 14.0%(+86.0)#5 | 14.8%(+85.2)#30 |
| 6. | 18927 | 88.6% | 14.0%(+74.6)#6 | 14.8%(+73.8)#57 |
| 7. | 18936 | 84.6% | 14.0%(+70.6)#7 | 14.8%(+69.8)#62 |
| 8. | 18624 | 77.2% | 14.0%(+63.2)#8 | 14.8%(+62.4)#73 |
| 9. | 19035 | 75.0% | 14.0%(+61.0)#9 | 14.8%(+60.2)#82 |
| 10. | 19085 | 72.6% | 14.0%(+58.6)#10 | 14.8%(+57.8)#95 |
| 11. | 18950 | 70.8% | 14.0%(+56.8)#11 | 14.8%(+56.0)#115 |
| 12. | 19066 | 67.7% | 14.0%(+53.7)#12 | 14.8%(+52.9)#146 |
| 13. | 18913 | 67.7% | 14.0%(+53.7)#13 | 14.8%(+52.9)#147 |
| 14. | 18935 | 67.6% | 14.0%(+53.6)#14 | 14.8%(+52.8)#150 |
| 15. | 19108 | 65.5% | 14.0%(+51.5)#15 | 14.8%(+50.7)#180 |
| 16. | 19041 | 62.9% | 14.0%(+48.9)#16 | 14.8%(+48.1)#225 |
| 17. | 18946 | 62.7% | 14.0%(+48.7)#17 | 14.8%(+47.9)#232 |
| 18. | 18977 | 61.5% | 14.0%(+47.5)#18 | 14.8%(+46.7)#255 |
| 19. | 17550 | 61.5% | 14.0%(+47.5)#19 | 14.8%(+46.7)#256 |
| 20. | 19456 | 60.0% | 14.0%(+46.0)#20 | 14.8%(+45.2)#299 |
| 21. | 17581 | 60.0% | 14.0%(+46.0)#21 | 14.8%(+45.2)#300 |
| 22. | 15142 | 59.6% | 14.0%(+45.6)#22 | 14.8%(+44.8)#308 |
| 23. | 15222 | 59.0% | 14.0%(+45.0)#23 | 14.8%(+44.2)#323 |
| 24. | 19373 | 57.7% | 14.0%(+43.7)#24 | 14.8%(+42.9)#364 |
| 25. | 19096 | 57.5% | 14.0%(+43.5)#25 | 14.8%(+42.7)#373 |
| 26. | 18925 | 57.0% | 14.0%(+43.0)#26 | 14.8%(+42.2)#384 |
| 27. | 19312 | 56.7% | 14.0%(+42.7)#27 | 14.8%(+41.9)#393 |
| 28. | 19072 | 56.6% | 14.0%(+42.6)#28 | 14.8%(+41.8)#399 |
| 29. | 19017 | 55.4% | 14.0%(+41.4)#29 | 14.8%(+40.6)#446 |
| 30. | 19425 | 55.2% | 14.0%(+41.2)#30 | 14.8%(+40.4)#449 |
| 31. | 19102 | 54.6% | 14.0%(+40.6)#31 | 14.8%(+39.8)#470 |
| 32. | 19437 | 54.4% | 14.0%(+40.4)#32 | 14.8%(+39.6)#484 |
| 33. | 19333 | 54.3% | 14.0%(+40.3)#33 | 14.8%(+39.5)#491 |
| 34. | 18602 | 53.0% | 14.0%(+39.0)#34 | 14.8%(+38.2)#540 |
| 35. | 19301 | 51.9% | 14.0%(+37.9)#35 | 14.8%(+37.1)#579 |
| 36. | 19422 | 49.8% | 14.0%(+35.8)#36 | 14.8%(+35.0)#678 |
| 37. | 19025 | 49.6% | 14.0%(+35.6)#37 | 14.8%(+34.8)#688 |
| 38. | 18938 | 48.4% | 14.0%(+34.4)#38 | 14.8%(+33.6)#740 |
| 39. | 19087 | 48.3% | 14.0%(+34.3)#39 | 14.8%(+33.5)#744 |
| 40. | 19311 | 48.3% | 14.0%(+34.3)#40 | 14.8%(+33.5)#749 |
| 41. | 18440 | 48.1% | 14.0%(+34.1)#41 | 14.8%(+33.3)#758 |
| 42. | 19034 | 47.7% | 14.0%(+33.7)#42 | 14.8%(+32.9)#779 |
| 43. | 15367 | 47.4% | 14.0%(+33.4)#43 | 14.8%(+32.6)#794 |
| 44. | 19106 | 47.1% | 14.0%(+33.1)#44 | 14.8%(+32.3)#811 |
| 45. | 19319 | 46.2% | 14.0%(+32.2)#45 | 14.8%(+31.4)#857 |
| 46. | 19010 | 45.8% | 14.0%(+31.8)#46 | 14.8%(+31.0)#881 |
| 47. | 19118 | 45.5% | 14.0%(+31.5)#47 | 14.8%(+30.7)#906 |
| 48. | 19350 | 45.4% | 14.0%(+31.4)#48 | 14.8%(+30.6)#918 |
| 49. | 19355 | 45.1% | 14.0%(+31.1)#49 | 14.8%(+30.3)#934 |
| 50. | 19103 | 44.8% | 14.0%(+30.8)#50 | 14.8%(+30.0)#947 |
| 51. | 19073 | 44.5% | 14.0%(+30.5)#51 | 14.8%(+29.7)#960 |
| 52. | 19002 | 44.3% | 14.0%(+30.3)#52 | 14.8%(+29.5)#973 |
| 53. | 18940 | 43.9% | 14.0%(+29.9)#53 | 14.8%(+29.1)#997 |
| 54. | 19342 | 43.7% | 14.0%(+29.7)#54 | 14.8%(+28.9)#1,007 |
| 55. | 19444 | 43.7% | 14.0%(+29.7)#55 | 14.8%(+28.9)#1,008 |
| 56. | 18902 | 43.5% | 14.0%(+29.5)#56 | 14.8%(+28.7)#1,023 |
| 57. | 19317 | 42.7% | 14.0%(+28.7)#57 | 14.8%(+27.9)#1,072 |
| 58. | 19086 | 42.6% | 14.0%(+28.6)#58 | 14.8%(+27.8)#1,080 |
| 59. | 19426 | 42.4% | 14.0%(+28.4)#59 | 14.8%(+27.6)#1,102 |
| 60. | 19004 | 42.3% | 14.0%(+28.3)#60 | 14.8%(+27.5)#1,116 |
| 61. | 18929 | 42.0% | 14.0%(+28.0)#61 | 14.8%(+27.2)#1,138 |
| 62. | 15241 | 41.9% | 14.0%(+27.9)#62 | 14.8%(+27.1)#1,148 |
| 63. | 19147 | 41.7% | 14.0%(+27.7)#63 | 14.8%(+26.9)#1,167 |
| 64. | 19081 | 41.3% | 14.0%(+27.3)#64 | 14.8%(+26.5)#1,199 |
| 65. | 15238 | 41.2% | 14.0%(+27.2)#65 | 14.8%(+26.4)#1,206 |
| 66. | 19003 | 40.8% | 14.0%(+26.8)#66 | 14.8%(+26.0)#1,245 |
| 67. | 19343 | 39.6% | 14.0%(+25.6)#67 | 14.8%(+24.8)#1,349 |
| 68. | 15090 | 39.5% | 14.0%(+25.5)#68 | 14.8%(+24.7)#1,356 |
| 69. | 19382 | 39.3% | 14.0%(+25.3)#69 | 14.8%(+24.5)#1,380 |
| 70. | 18954 | 38.6% | 14.0%(+24.6)#70 | 14.8%(+23.8)#1,452 |
| 71. | 18059 | 38.6% | 14.0%(+24.6)#71 | 14.8%(+23.8)#1,454 |
| 72. | 15015 | 38.5% | 14.0%(+24.5)#72 | 14.8%(+23.7)#1,467 |
| 73. | 19127 | 37.9% | 14.0%(+23.9)#73 | 14.8%(+23.1)#1,512 |
| 74. | 19060 | 37.8% | 14.0%(+23.8)#74 | 14.8%(+23.0)#1,518 |
| 75. | 19031 | 37.4% | 14.0%(+23.4)#75 | 14.8%(+22.6)#1,570 |
| 76. | 19063 | 37.3% | 14.0%(+23.3)#76 | 14.8%(+22.5)#1,571 |
| 77. | 15053 | 37.0% | 14.0%(+23.0)#77 | 14.8%(+22.2)#1,615 |
| 78. | 15143 | 36.7% | 14.0%(+22.7)#78 | 14.8%(+21.9)#1,640 |
| 79. | 19436 | 36.6% | 14.0%(+22.6)#79 | 14.8%(+21.8)#1,664 |
| 80. | 16046 | 36.5% | 14.0%(+22.5)#80 | 14.8%(+21.7)#1,671 |
| 81. | 19095 | 36.4% | 14.0%(+22.4)#81 | 14.8%(+21.6)#1,690 |
| 82. | 15007 | 36.2% | 14.0%(+22.2)#82 | 14.8%(+21.4)#1,714 |
| 83. | 18901 | 35.8% | 14.0%(+21.8)#83 | 14.8%(+21.0)#1,745 |
| 84. | 18471 | 35.8% | 14.0%(+21.8)#84 | 14.8%(+21.0)#1,752 |
| 85. | 15217 | 35.6% | 14.0%(+21.6)#85 | 14.8%(+20.8)#1,770 |
| 86. | 19473 | 35.5% | 14.0%(+21.5)#86 | 14.8%(+20.7)#1,781 |
| 87. | 19380 | 35.2% | 14.0%(+21.2)#87 | 14.8%(+20.4)#1,816 |
| 88. | 19438 | 35.1% | 14.0%(+21.1)#88 | 14.8%(+20.3)#1,830 |
| 89. | 19130 | 35.0% | 14.0%(+21.0)#89 | 14.8%(+20.2)#1,838 |
| 90. | 19352 | 34.9% | 14.0%(+20.9)#90 | 14.8%(+20.1)#1,851 |
| 91. | 18970 | 34.9% | 14.0%(+20.9)#91 | 14.8%(+20.1)#1,855 |
| 92. | 18947 | 34.6% | 14.0%(+20.6)#92 | 14.8%(+19.8)#1,894 |
| 93. | 18078 | 34.4% | 14.0%(+20.4)#93 | 14.8%(+19.6)#1,916 |
| 94. | 18976 | 34.1% | 14.0%(+20.1)#94 | 14.8%(+19.3)#1,944 |
| 95. | 15139 | 34.1% | 14.0%(+20.1)#95 | 14.8%(+19.3)#1,953 |
| 96. | 19067 | 34.0% | 14.0%(+20.0)#96 | 14.8%(+19.2)#1,956 |
| 97. | 19341 | 33.6% | 14.0%(+19.6)#97 | 14.8%(+18.8)#2,010 |
| 98. | 19006 | 33.5% | 14.0%(+19.5)#98 | 14.8%(+18.7)#2,020 |
| 99. | 19475 | 33.5% | 14.0%(+19.5)#99 | 14.8%(+18.7)#2,027 |
| 100. | 18914 | 33.3% | 14.0%(+19.3)#100 | 14.8%(+18.5)#2,052 |
Common Questions
What are the Top 10 Zip Codes with the Highest Percentage of Families with Income Above $200,000 in Pennsylvania?
Top 10 Zip Codes with the Highest Percentage of Families with Income Above $200,000 in Pennsylvania are:
What zip code has the Highest Percentage of Families with Income Above $200,000 in Pennsylvania?
19490 has the Highest Percentage of Families with Income Above $200,000 in Pennsylvania with 100.0%.
What is the Percentage of Families with Income Above $200,000 in the State of Pennsylvania?
Percentage of Families with Income Above $200,000 in Pennsylvania is 14.0%.
What is the Percentage of Families with Income Above $200,000 in the United States?
Percentage of Families with Income Above $200,000 in the United States is 14.8%.