Zip Codes with the Highest Poverty Level Among Children Under the Age of 5 in New Mexico
RELATED REPORTS & OPTIONS
Highest Poverty | Child 0-5
New Mexico
Compare Zip Codes
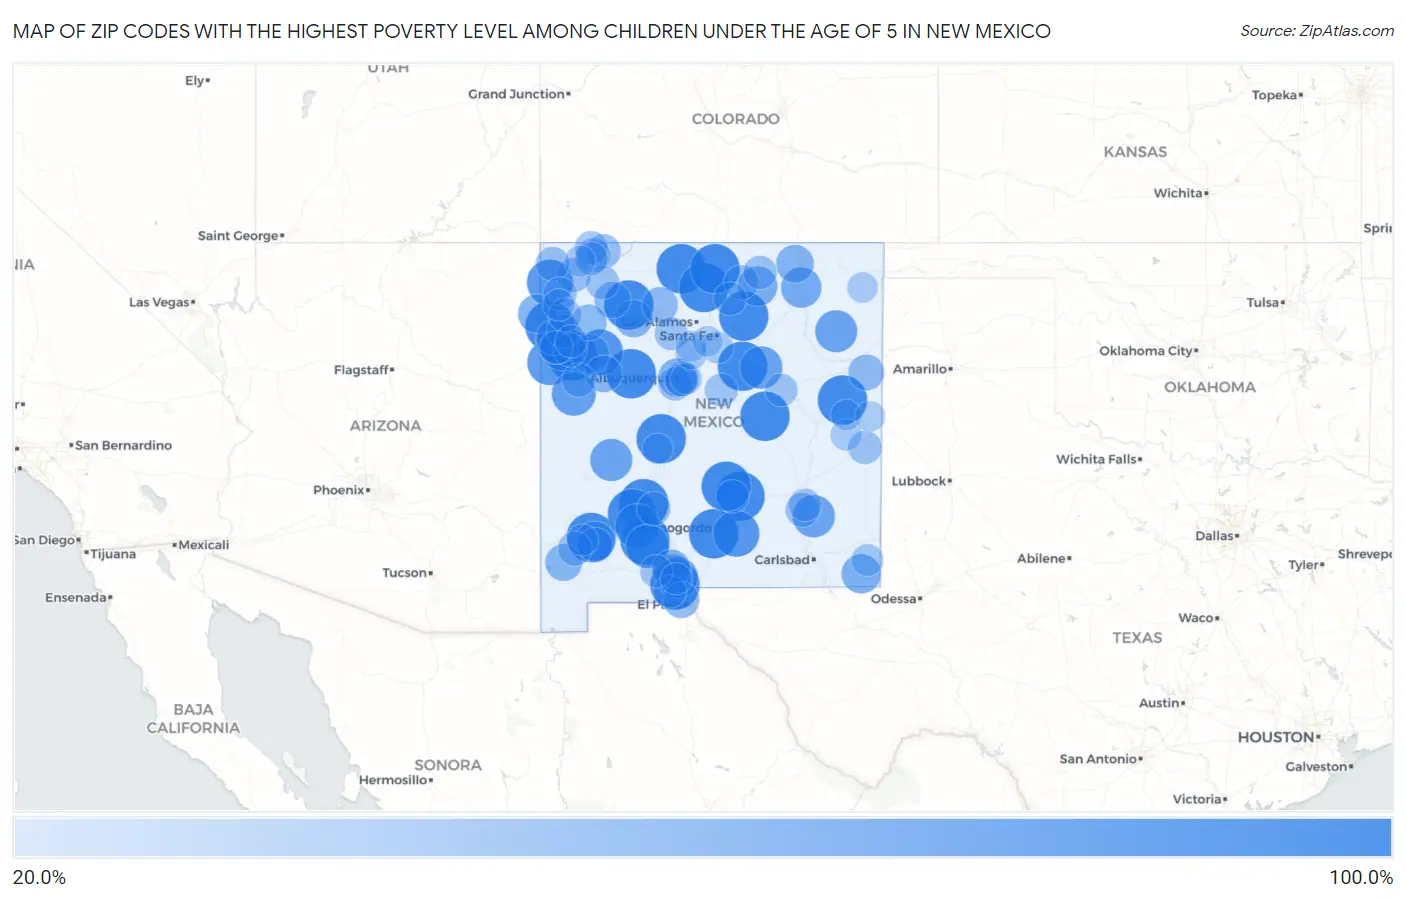
Map of Zip Codes with the Highest Poverty Level Among Children Under the Age of 5 in New Mexico
20.0%
100.0%
Zip Codes with the Highest Poverty Level Among Children Under the Age of 5 in New Mexico
| Zip Code | Child Poverty | vs State | vs National | |
| 1. | 88346 | 100.0% | 27.4%(+72.6)#1 | 18.1%(+81.9)#14 |
| 2. | 87935 | 100.0% | 27.4%(+72.6)#2 | 18.1%(+81.9)#32 |
| 3. | 87560 | 100.0% | 27.4%(+72.6)#3 | 18.1%(+81.9)#36 |
| 4. | 88026 | 100.0% | 27.4%(+72.6)#4 | 18.1%(+81.9)#37 |
| 5. | 87942 | 100.0% | 27.4%(+72.6)#5 | 18.1%(+81.9)#41 |
| 6. | 87732 | 100.0% | 27.4%(+72.6)#6 | 18.1%(+81.9)#75 |
| 7. | 87575 | 100.0% | 27.4%(+72.6)#7 | 18.1%(+81.9)#90 |
| 8. | 87530 | 100.0% | 27.4%(+72.6)#8 | 18.1%(+81.9)#93 |
| 9. | 87018 | 100.0% | 27.4%(+72.6)#9 | 18.1%(+81.9)#99 |
| 10. | 87941 | 100.0% | 27.4%(+72.6)#10 | 18.1%(+81.9)#112 |
| 11. | 88311 | 100.0% | 27.4%(+72.6)#11 | 18.1%(+81.9)#119 |
| 12. | 88027 | 100.0% | 27.4%(+72.6)#12 | 18.1%(+81.9)#156 |
| 13. | 87828 | 100.0% | 27.4%(+72.6)#13 | 18.1%(+81.9)#174 |
| 14. | 87320 | 100.0% | 27.4%(+72.6)#14 | 18.1%(+81.9)#194 |
| 15. | 87014 | 100.0% | 27.4%(+72.6)#15 | 18.1%(+81.9)#197 |
| 16. | 87577 | 100.0% | 27.4%(+72.6)#16 | 18.1%(+81.9)#198 |
| 17. | 88341 | 100.0% | 27.4%(+72.6)#17 | 18.1%(+81.9)#203 |
| 18. | 88353 | 100.0% | 27.4%(+72.6)#18 | 18.1%(+81.9)#224 |
| 19. | 87347 | 100.0% | 27.4%(+72.6)#19 | 18.1%(+81.9)#380 |
| 20. | 88427 | 100.0% | 27.4%(+72.6)#20 | 18.1%(+81.9)#510 |
| 21. | 88317 | 87.7% | 27.4%(+60.3)#21 | 18.1%(+69.7)#657 |
| 22. | 87461 | 87.5% | 27.4%(+60.1)#22 | 18.1%(+69.4)#662 |
| 23. | 87045 | 87.2% | 27.4%(+59.8)#23 | 18.1%(+69.1)#671 |
| 24. | 87326 | 85.2% | 27.4%(+57.8)#24 | 18.1%(+67.2)#705 |
| 25. | 87931 | 83.0% | 27.4%(+55.6)#25 | 18.1%(+64.9)#749 |
| 26. | 87357 | 79.6% | 27.4%(+52.2)#26 | 18.1%(+61.5)#832 |
| 27. | 87322 | 78.7% | 27.4%(+51.3)#27 | 18.1%(+60.7)#850 |
| 28. | 87937 | 77.7% | 27.4%(+50.3)#28 | 18.1%(+59.7)#884 |
| 29. | 87711 | 74.4% | 27.4%(+47.0)#29 | 18.1%(+56.4)#992 |
| 30. | 87317 | 74.1% | 27.4%(+46.8)#30 | 18.1%(+56.1)#1,000 |
| 31. | 88232 | 73.2% | 27.4%(+45.8)#31 | 18.1%(+55.1)#1,043 |
| 32. | 87825 | 72.9% | 27.4%(+45.5)#32 | 18.1%(+54.8)#1,052 |
| 33. | 87733 | 72.7% | 27.4%(+45.3)#33 | 18.1%(+54.7)#1,060 |
| 34. | 88072 | 69.2% | 27.4%(+41.8)#34 | 18.1%(+51.1)#1,189 |
| 35. | 87747 | 66.2% | 27.4%(+38.8)#35 | 18.1%(+48.1)#1,333 |
| 36. | 87710 | 64.0% | 27.4%(+36.6)#36 | 18.1%(+45.9)#1,450 |
| 37. | 88023 | 63.4% | 27.4%(+36.1)#37 | 18.1%(+45.4)#1,478 |
| 38. | 88252 | 62.3% | 27.4%(+34.9)#38 | 18.1%(+44.2)#1,547 |
| 39. | 87328 | 60.9% | 27.4%(+33.5)#39 | 18.1%(+42.8)#1,629 |
| 40. | 87323 | 59.3% | 27.4%(+32.0)#40 | 18.1%(+41.3)#1,740 |
| 41. | 88047 | 59.3% | 27.4%(+31.9)#41 | 18.1%(+41.2)#1,744 |
| 42. | 87102 | 58.8% | 27.4%(+31.4)#42 | 18.1%(+40.7)#1,785 |
| 43. | 88001 | 57.9% | 27.4%(+30.5)#43 | 18.1%(+39.9)#1,836 |
| 44. | 87740 | 56.9% | 27.4%(+29.6)#44 | 18.1%(+38.9)#1,914 |
| 45. | 87013 | 55.5% | 27.4%(+28.1)#45 | 18.1%(+37.4)#2,047 |
| 46. | 88045 | 53.4% | 27.4%(+26.0)#46 | 18.1%(+35.4)#2,200 |
| 47. | 87020 | 53.3% | 27.4%(+26.0)#47 | 18.1%(+35.3)#2,210 |
| 48. | 87037 | 51.0% | 27.4%(+23.6)#48 | 18.1%(+32.9)#2,432 |
| 49. | 88063 | 50.6% | 27.4%(+23.2)#49 | 18.1%(+32.5)#2,468 |
| 50. | 87313 | 50.4% | 27.4%(+23.0)#50 | 18.1%(+32.3)#2,491 |
| 51. | 87027 | 50.0% | 27.4%(+22.6)#51 | 18.1%(+31.9)#2,571 |
| 52. | 88434 | 50.0% | 27.4%(+22.6)#52 | 18.1%(+31.9)#2,581 |
| 53. | 87375 | 47.7% | 27.4%(+20.3)#53 | 18.1%(+29.6)#2,846 |
| 54. | 87108 | 45.9% | 27.4%(+18.5)#54 | 18.1%(+27.9)#3,058 |
| 55. | 88043 | 45.3% | 27.4%(+17.9)#55 | 18.1%(+27.2)#3,135 |
| 56. | 87571 | 45.0% | 27.4%(+17.7)#56 | 18.1%(+27.0)#3,177 |
| 57. | 87416 | 43.9% | 27.4%(+16.5)#57 | 18.1%(+25.8)#3,354 |
| 58. | 87410 | 43.8% | 27.4%(+16.4)#58 | 18.1%(+25.7)#3,366 |
| 59. | 88061 | 43.3% | 27.4%(+16.0)#59 | 18.1%(+25.3)#3,430 |
| 60. | 87310 | 43.1% | 27.4%(+15.7)#60 | 18.1%(+25.0)#3,460 |
| 61. | 88203 | 42.9% | 27.4%(+15.5)#61 | 18.1%(+24.8)#3,491 |
| 62. | 87415 | 42.6% | 27.4%(+15.3)#62 | 18.1%(+24.6)#3,542 |
| 63. | 87420 | 42.4% | 27.4%(+15.1)#63 | 18.1%(+24.4)#3,581 |
| 64. | 87105 | 41.7% | 27.4%(+14.3)#64 | 18.1%(+23.6)#3,698 |
| 65. | 87321 | 41.6% | 27.4%(+14.2)#65 | 18.1%(+23.5)#3,733 |
| 66. | 87316 | 41.6% | 27.4%(+14.2)#66 | 18.1%(+23.5)#3,739 |
| 67. | 87413 | 41.2% | 27.4%(+13.9)#67 | 18.1%(+23.2)#3,792 |
| 68. | 87901 | 41.1% | 27.4%(+13.7)#68 | 18.1%(+23.0)#3,815 |
| 69. | 88130 | 41.0% | 27.4%(+13.6)#69 | 18.1%(+22.9)#3,842 |
| 70. | 87718 | 40.9% | 27.4%(+13.5)#70 | 18.1%(+22.8)#3,856 |
| 71. | 87455 | 40.5% | 27.4%(+13.1)#71 | 18.1%(+22.4)#3,937 |
| 72. | 87301 | 40.2% | 27.4%(+12.8)#72 | 18.1%(+22.1)#3,987 |
| 73. | 87325 | 40.0% | 27.4%(+12.6)#73 | 18.1%(+21.9)#4,008 |
| 74. | 87553 | 40.0% | 27.4%(+12.6)#74 | 18.1%(+21.9)#4,011 |
| 75. | 87024 | 39.8% | 27.4%(+12.4)#75 | 18.1%(+21.7)#4,078 |
| 76. | 87035 | 39.3% | 27.4%(+11.9)#76 | 18.1%(+21.2)#4,150 |
| 77. | 87418 | 39.1% | 27.4%(+11.8)#77 | 18.1%(+21.1)#4,189 |
| 78. | 87401 | 39.0% | 27.4%(+11.6)#78 | 18.1%(+21.0)#4,211 |
| 79. | 88021 | 38.7% | 27.4%(+11.3)#79 | 18.1%(+20.6)#4,271 |
| 80. | 87116 | 38.6% | 27.4%(+11.3)#80 | 18.1%(+20.6)#4,272 |
| 81. | 88435 | 38.2% | 27.4%(+10.8)#81 | 18.1%(+20.2)#4,365 |
| 82. | 88230 | 38.1% | 27.4%(+10.7)#82 | 18.1%(+20.0)#4,385 |
| 83. | 88005 | 38.0% | 27.4%(+10.6)#83 | 18.1%(+19.9)#4,411 |
| 84. | 88345 | 37.9% | 27.4%(+10.6)#84 | 18.1%(+19.9)#4,422 |
| 85. | 87311 | 37.2% | 27.4%(+9.86)#85 | 18.1%(+19.2)#4,548 |
| 86. | 88231 | 35.5% | 27.4%(+8.09)#86 | 18.1%(+17.4)#4,959 |
| 87. | 87364 | 34.9% | 27.4%(+7.54)#87 | 18.1%(+16.9)#5,088 |
| 88. | 87508 | 34.6% | 27.4%(+7.21)#88 | 18.1%(+16.5)#5,162 |
| 89. | 88048 | 34.3% | 27.4%(+6.91)#89 | 18.1%(+16.2)#5,230 |
| 90. | 88118 | 33.3% | 27.4%(+5.95)#90 | 18.1%(+15.3)#5,524 |
| 91. | 87123 | 33.1% | 27.4%(+5.69)#91 | 18.1%(+15.0)#5,574 |
| 92. | 88065 | 33.1% | 27.4%(+5.69)#92 | 18.1%(+15.0)#5,576 |
| 93. | 87001 | 32.7% | 27.4%(+5.36)#93 | 18.1%(+14.7)#5,657 |
| 94. | 87417 | 32.3% | 27.4%(+4.93)#94 | 18.1%(+14.2)#5,768 |
| 95. | 87052 | 32.3% | 27.4%(+4.90)#95 | 18.1%(+14.2)#5,773 |
| 96. | 88415 | 30.9% | 27.4%(+3.54)#96 | 18.1%(+12.9)#6,116 |
| 97. | 88124 | 30.9% | 27.4%(+3.53)#97 | 18.1%(+12.8)#6,120 |
| 98. | 87507 | 30.4% | 27.4%(+3.01)#98 | 18.1%(+12.3)#6,244 |
| 99. | 87801 | 30.3% | 27.4%(+2.88)#99 | 18.1%(+12.2)#6,277 |
| 100. | 88101 | 29.8% | 27.4%(+2.45)#100 | 18.1%(+11.8)#6,392 |
Common Questions
What are the Top 10 Zip Codes with the Highest Poverty Level Among Children Under the Age of 5 in New Mexico?
Top 10 Zip Codes with the Highest Poverty Level Among Children Under the Age of 5 in New Mexico are:
What zip code has the Highest Poverty Level Among Children Under the Age of 5 in New Mexico?
88346 has the Highest Poverty Level Among Children Under the Age of 5 in New Mexico with 100.0%.
What is the Poverty Level Among Children Under the Age of 5 in the State of New Mexico?
Poverty Level Among Children Under the Age of 5 in New Mexico is 27.4%.
What is the Poverty Level Among Children Under the Age of 5 in the United States?
Poverty Level Among Children Under the Age of 5 in the United States is 18.1%.