Zip Codes with the Highest Poverty Level Among Children Under the Age of 5 in Georgia
RELATED REPORTS & OPTIONS
Highest Poverty | Child 0-5
Georgia
Compare Zip Codes
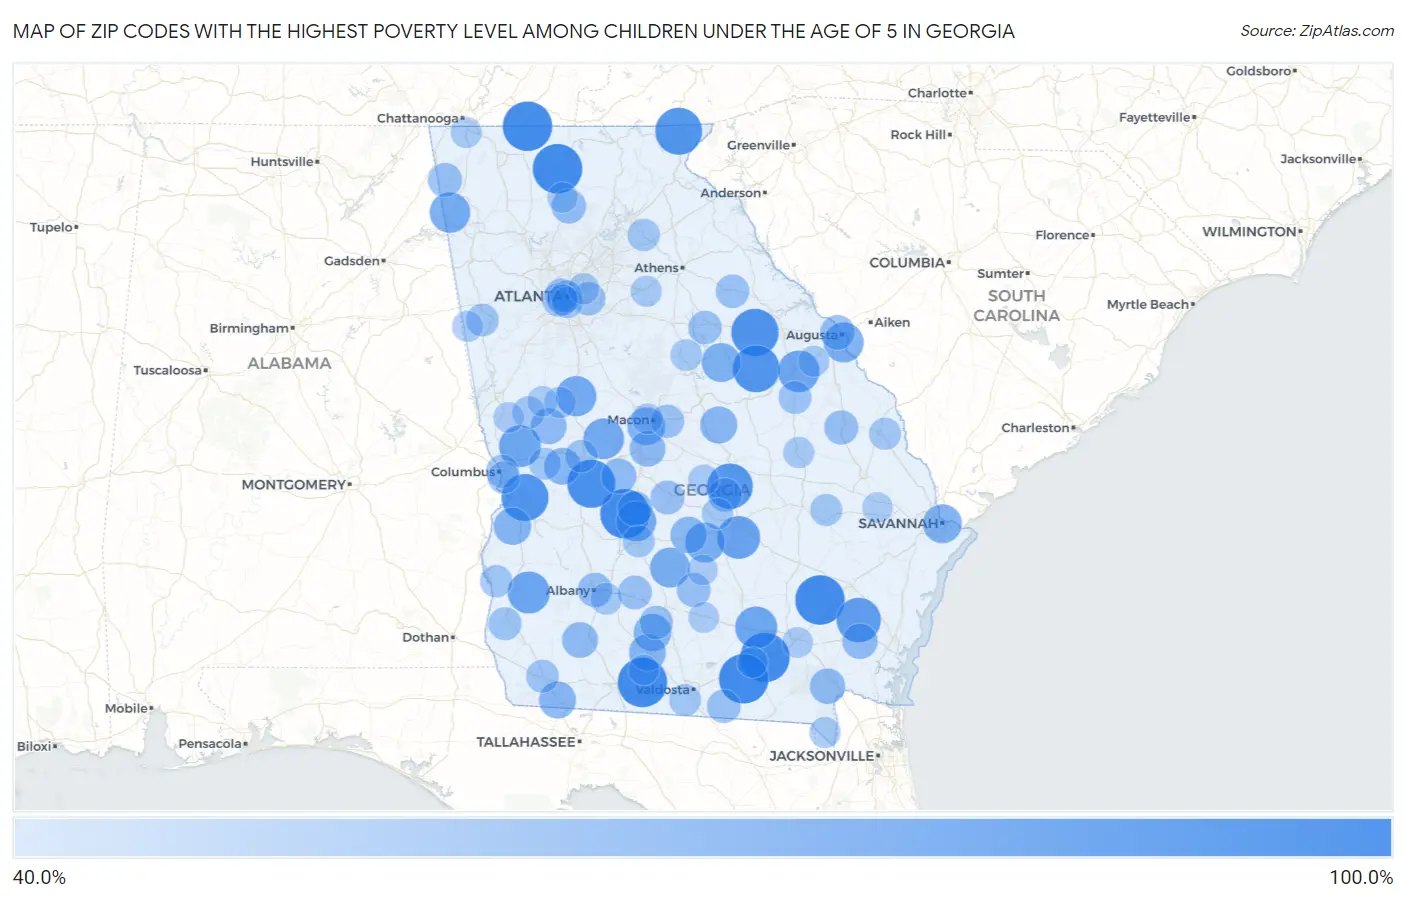
Map of Zip Codes with the Highest Poverty Level Among Children Under the Age of 5 in Georgia
40.0%
100.0%
Zip Codes with the Highest Poverty Level Among Children Under the Age of 5 in Georgia
| Zip Code | Child Poverty | vs State | vs National | |
| 1. | 31518 | 100.0% | 20.3%(+79.7)#1 | 18.1%(+81.9)#129 |
| 2. | 31623 | 100.0% | 20.3%(+79.7)#2 | 18.1%(+81.9)#234 |
| 3. | 31630 | 100.0% | 20.3%(+79.7)#3 | 18.1%(+81.9)#263 |
| 4. | 31720 | 100.0% | 20.3%(+79.7)#4 | 18.1%(+81.9)#311 |
| 5. | 30539 | 100.0% | 20.3%(+79.7)#5 | 18.1%(+81.9)#472 |
| 6. | 31051 | 100.0% | 20.3%(+79.7)#6 | 18.1%(+81.9)#494 |
| 7. | 30751 | 100.0% | 20.3%(+79.7)#7 | 18.1%(+81.9)#509 |
| 8. | 31041 | 95.4% | 20.3%(+75.1)#8 | 18.1%(+77.3)#577 |
| 9. | 30821 | 93.4% | 20.3%(+73.1)#9 | 18.1%(+75.4)#596 |
| 10. | 31805 | 92.6% | 20.3%(+72.3)#10 | 18.1%(+74.5)#604 |
| 11. | 30820 | 92.6% | 20.3%(+72.3)#11 | 18.1%(+74.5)#605 |
| 12. | 30568 | 92.1% | 20.3%(+71.8)#12 | 18.1%(+74.0)#615 |
| 13. | 31075 | 88.7% | 20.3%(+68.3)#13 | 18.1%(+70.6)#650 |
| 14. | 31543 | 84.7% | 20.3%(+64.4)#14 | 18.1%(+66.6)#711 |
| 15. | 31055 | 80.3% | 20.3%(+60.0)#15 | 18.1%(+62.3)#802 |
| 16. | 39846 | 78.1% | 20.3%(+57.7)#16 | 18.1%(+60.0)#867 |
| 17. | 31624 | 78.0% | 20.3%(+57.7)#17 | 18.1%(+59.9)#871 |
| 18. | 31807 | 77.6% | 20.3%(+57.3)#18 | 18.1%(+59.5)#886 |
| 19. | 30833 | 76.9% | 20.3%(+56.5)#19 | 18.1%(+58.8)#902 |
| 20. | 31078 | 73.8% | 20.3%(+53.5)#20 | 18.1%(+55.7)#1,014 |
| 21. | 30730 | 73.3% | 20.3%(+53.0)#21 | 18.1%(+55.3)#1,035 |
| 22. | 30256 | 72.7% | 20.3%(+52.4)#22 | 18.1%(+54.7)#1,056 |
| 23. | 31092 | 71.8% | 20.3%(+51.5)#23 | 18.1%(+53.7)#1,094 |
| 24. | 31077 | 71.4% | 20.3%(+51.1)#24 | 18.1%(+53.4)#1,098 |
| 25. | 30901 | 71.4% | 20.3%(+51.0)#25 | 18.1%(+53.3)#1,104 |
| 26. | 31783 | 71.3% | 20.3%(+51.0)#26 | 18.1%(+53.3)#1,105 |
| 27. | 31087 | 69.2% | 20.3%(+48.9)#27 | 18.1%(+51.1)#1,190 |
| 28. | 31401 | 68.6% | 20.3%(+48.3)#28 | 18.1%(+50.5)#1,206 |
| 29. | 31206 | 65.9% | 20.3%(+45.6)#29 | 18.1%(+47.9)#1,344 |
| 30. | 31771 | 64.9% | 20.3%(+44.6)#30 | 18.1%(+46.8)#1,391 |
| 31. | 31815 | 64.4% | 20.3%(+44.1)#31 | 18.1%(+46.3)#1,416 |
| 32. | 31090 | 63.6% | 20.3%(+43.3)#32 | 18.1%(+45.6)#1,469 |
| 33. | 31788 | 63.1% | 20.3%(+42.8)#33 | 18.1%(+45.1)#1,497 |
| 34. | 39815 | 63.0% | 20.3%(+42.7)#34 | 18.1%(+45.0)#1,502 |
| 35. | 31058 | 62.7% | 20.3%(+42.4)#35 | 18.1%(+44.6)#1,513 |
| 36. | 31001 | 62.0% | 20.3%(+41.7)#36 | 18.1%(+44.0)#1,555 |
| 37. | 31836 | 60.0% | 20.3%(+39.7)#37 | 18.1%(+41.9)#1,685 |
| 38. | 31028 | 59.8% | 20.3%(+39.5)#38 | 18.1%(+41.8)#1,711 |
| 39. | 31730 | 59.8% | 20.3%(+39.4)#39 | 18.1%(+41.7)#1,714 |
| 40. | 31566 | 58.4% | 20.3%(+38.1)#40 | 18.1%(+40.4)#1,800 |
| 41. | 31537 | 58.4% | 20.3%(+38.0)#41 | 18.1%(+40.3)#1,803 |
| 42. | 31057 | 58.2% | 20.3%(+37.9)#42 | 18.1%(+40.2)#1,810 |
| 43. | 31070 | 57.1% | 20.3%(+36.8)#43 | 18.1%(+39.1)#1,889 |
| 44. | 30904 | 56.5% | 20.3%(+36.2)#44 | 18.1%(+38.4)#1,949 |
| 45. | 30177 | 56.2% | 20.3%(+35.8)#45 | 18.1%(+38.1)#1,976 |
| 46. | 31701 | 55.9% | 20.3%(+35.6)#46 | 18.1%(+37.9)#1,994 |
| 47. | 30731 | 55.1% | 20.3%(+34.8)#47 | 18.1%(+37.0)#2,063 |
| 48. | 30442 | 54.7% | 20.3%(+34.4)#48 | 18.1%(+36.7)#2,088 |
| 49. | 31774 | 54.6% | 20.3%(+34.3)#49 | 18.1%(+36.5)#2,094 |
| 50. | 31036 | 54.1% | 20.3%(+33.7)#50 | 18.1%(+36.0)#2,137 |
| 51. | 31009 | 53.9% | 20.3%(+33.6)#51 | 18.1%(+35.9)#2,148 |
| 52. | 31781 | 53.8% | 20.3%(+33.5)#52 | 18.1%(+35.7)#2,161 |
| 53. | 31648 | 53.3% | 20.3%(+33.0)#53 | 18.1%(+35.3)#2,220 |
| 54. | 30660 | 53.2% | 20.3%(+32.9)#54 | 18.1%(+35.1)#2,236 |
| 55. | 31775 | 53.0% | 20.3%(+32.7)#55 | 18.1%(+35.0)#2,246 |
| 56. | 30642 | 52.8% | 20.3%(+32.5)#56 | 18.1%(+34.8)#2,263 |
| 57. | 30035 | 52.8% | 20.3%(+32.5)#57 | 18.1%(+34.7)#2,268 |
| 58. | 31217 | 52.7% | 20.3%(+32.3)#58 | 18.1%(+34.6)#2,282 |
| 59. | 30311 | 51.9% | 20.3%(+31.6)#59 | 18.1%(+33.8)#2,352 |
| 60. | 30314 | 51.8% | 20.3%(+31.5)#60 | 18.1%(+33.7)#2,357 |
| 61. | 39823 | 51.8% | 20.3%(+31.5)#61 | 18.1%(+33.7)#2,358 |
| 62. | 31906 | 51.7% | 20.3%(+31.4)#62 | 18.1%(+33.7)#2,361 |
| 63. | 39817 | 51.4% | 20.3%(+31.1)#63 | 18.1%(+33.4)#2,395 |
| 64. | 30434 | 51.4% | 20.3%(+31.1)#64 | 18.1%(+33.3)#2,396 |
| 65. | 30117 | 50.6% | 20.3%(+30.2)#65 | 18.1%(+32.5)#2,474 |
| 66. | 31006 | 50.4% | 20.3%(+30.1)#66 | 18.1%(+32.3)#2,489 |
| 67. | 31830 | 50.0% | 20.3%(+29.7)#67 | 18.1%(+31.9)#2,530 |
| 68. | 39851 | 50.0% | 20.3%(+29.7)#68 | 18.1%(+31.9)#2,531 |
| 69. | 30575 | 50.0% | 20.3%(+29.7)#69 | 18.1%(+31.9)#2,532 |
| 70. | 31903 | 49.7% | 20.3%(+29.4)#70 | 18.1%(+31.7)#2,626 |
| 71. | 30421 | 49.1% | 20.3%(+28.7)#71 | 18.1%(+31.0)#2,686 |
| 72. | 30467 | 49.0% | 20.3%(+28.6)#72 | 18.1%(+30.9)#2,697 |
| 73. | 31015 | 48.9% | 20.3%(+28.6)#73 | 18.1%(+30.9)#2,700 |
| 74. | 30303 | 48.7% | 20.3%(+28.4)#74 | 18.1%(+30.7)#2,730 |
| 75. | 31601 | 48.5% | 20.3%(+28.1)#75 | 18.1%(+30.4)#2,758 |
| 76. | 31801 | 48.1% | 20.3%(+27.8)#76 | 18.1%(+30.0)#2,798 |
| 77. | 31705 | 48.0% | 20.3%(+27.6)#77 | 18.1%(+29.9)#2,812 |
| 78. | 30315 | 47.4% | 20.3%(+27.1)#78 | 18.1%(+29.4)#2,873 |
| 79. | 31024 | 47.4% | 20.3%(+27.1)#79 | 18.1%(+29.4)#2,877 |
| 80. | 30258 | 47.1% | 20.3%(+26.7)#80 | 18.1%(+29.0)#2,915 |
| 81. | 31011 | 47.1% | 20.3%(+26.7)#81 | 18.1%(+29.0)#2,919 |
| 82. | 30021 | 46.8% | 20.3%(+26.5)#82 | 18.1%(+28.7)#2,949 |
| 83. | 30310 | 46.2% | 20.3%(+25.9)#83 | 18.1%(+28.2)#3,009 |
| 84. | 30401 | 46.2% | 20.3%(+25.9)#84 | 18.1%(+28.2)#3,010 |
| 85. | 30655 | 46.2% | 20.3%(+25.8)#85 | 18.1%(+28.1)#3,023 |
| 86. | 31562 | 46.1% | 20.3%(+25.7)#86 | 18.1%(+28.0)#3,045 |
| 87. | 30805 | 45.9% | 20.3%(+25.6)#87 | 18.1%(+27.8)#3,068 |
| 88. | 30741 | 45.8% | 20.3%(+25.5)#88 | 18.1%(+27.7)#3,081 |
| 89. | 30108 | 45.7% | 20.3%(+25.4)#89 | 18.1%(+27.7)#3,084 |
| 90. | 31012 | 45.5% | 20.3%(+25.1)#90 | 18.1%(+27.4)#3,108 |
| 91. | 31204 | 45.2% | 20.3%(+24.9)#91 | 18.1%(+27.1)#3,154 |
| 92. | 31503 | 45.2% | 20.3%(+24.8)#92 | 18.1%(+27.1)#3,156 |
| 93. | 31622 | 45.1% | 20.3%(+24.8)#93 | 18.1%(+27.0)#3,167 |
| 94. | 31634 | 44.9% | 20.3%(+24.6)#94 | 18.1%(+26.9)#3,190 |
| 95. | 31822 | 44.9% | 20.3%(+24.6)#95 | 18.1%(+26.9)#3,193 |
| 96. | 31778 | 44.7% | 20.3%(+24.4)#96 | 18.1%(+26.7)#3,213 |
| 97. | 30143 | 44.6% | 20.3%(+24.2)#97 | 18.1%(+26.5)#3,239 |
| 98. | 31321 | 44.5% | 20.3%(+24.2)#98 | 18.1%(+26.4)#3,250 |
| 99. | 31750 | 44.4% | 20.3%(+24.1)#99 | 18.1%(+26.4)#3,252 |
| 100. | 30293 | 44.1% | 20.3%(+23.8)#100 | 18.1%(+26.1)#3,321 |
Common Questions
What are the Top 10 Zip Codes with the Highest Poverty Level Among Children Under the Age of 5 in Georgia?
Top 10 Zip Codes with the Highest Poverty Level Among Children Under the Age of 5 in Georgia are:
What zip code has the Highest Poverty Level Among Children Under the Age of 5 in Georgia?
31518 has the Highest Poverty Level Among Children Under the Age of 5 in Georgia with 100.0%.
What is the Poverty Level Among Children Under the Age of 5 in the State of Georgia?
Poverty Level Among Children Under the Age of 5 in Georgia is 20.3%.
What is the Poverty Level Among Children Under the Age of 5 in the United States?
Poverty Level Among Children Under the Age of 5 in the United States is 18.1%.