Waseca, MN Map & Demographics
Waseca Map
Waseca Overview
$32,940
PER CAPITA INCOME
$82,639
AVG FAMILY INCOME
$62,632
AVG HOUSEHOLD INCOME
34.8%
WAGE / INCOME GAP [ % ]
65.2¢/ $1
WAGE / INCOME GAP [ $ ]
0.45
INEQUALITY / GINI INDEX
9,208
TOTAL POPULATION
4,006
MALE POPULATION
5,202
FEMALE POPULATION
77.01
MALES / 100 FEMALES
129.86
FEMALES / 100 MALES
39.2
MEDIAN AGE
3.0
AVG FAMILY SIZE
2.4
AVG HOUSEHOLD SIZE
4,279
LABOR FORCE [ PEOPLE ]
59.8%
PERCENT IN LABOR FORCE
4.7%
UNEMPLOYMENT RATE
Waseca Zip Codes
Waseca Area Codes
Income in Waseca
Income Overview in Waseca
Per Capita Income in Waseca is $32,940, while median incomes of families and households are $82,639 and $62,632 respectively.
| Characteristic | Number | Measure |
| Per Capita Income | 9,208 | $32,940 |
| Median Family Income | 2,267 | $82,639 |
| Mean Family Income | 2,267 | $107,414 |
| Median Household Income | 3,584 | $62,632 |
| Mean Household Income | 3,584 | $85,923 |
| Income Deficit | 2,267 | $0 |
| Wage / Income Gap (%) | 9,208 | 34.76% |
| Wage / Income Gap ($) | 9,208 | 65.24¢ per $1 |
| Gini / Inequality Index | 9,208 | 0.45 |
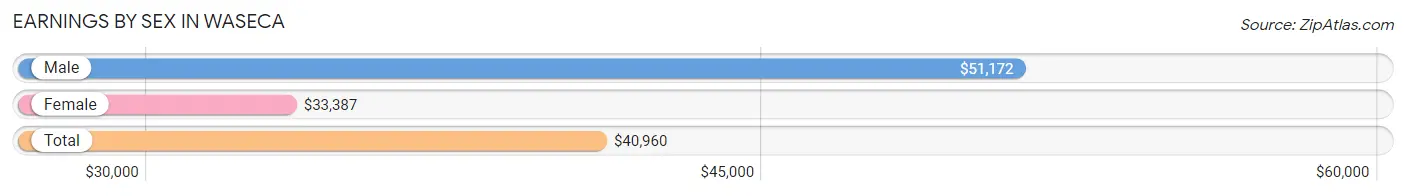
Earnings by Sex in Waseca
Average Earnings in Waseca are $40,960, $51,172 for men and $33,387 for women, a difference of 34.8%.
| Sex | Number | Average Earnings |
| Male | 2,264 (48.5%) | $51,172 |
| Female | 2,408 (51.5%) | $33,387 |
| Total | 4,672 (100.0%) | $40,960 |
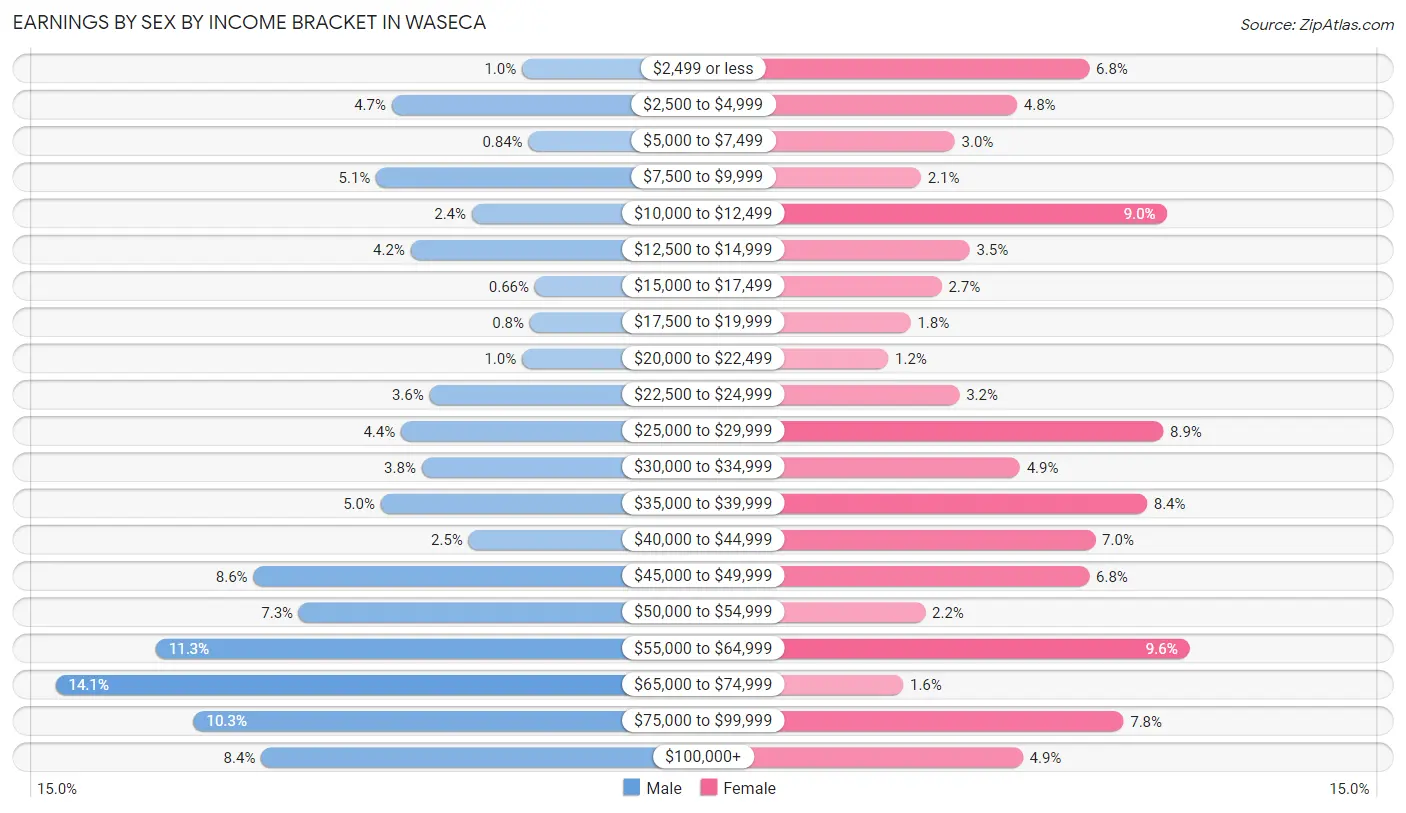
Earnings by Sex by Income Bracket in Waseca
The most common earnings brackets in Waseca are $65,000 to $74,999 for men (320 | 14.1%) and $55,000 to $64,999 for women (232 | 9.6%).
| Income | Male | Female |
| $2,499 or less | 23 (1.0%) | 164 (6.8%) |
| $2,500 to $4,999 | 106 (4.7%) | 115 (4.8%) |
| $5,000 to $7,499 | 19 (0.8%) | 73 (3.0%) |
| $7,500 to $9,999 | 116 (5.1%) | 50 (2.1%) |
| $10,000 to $12,499 | 55 (2.4%) | 217 (9.0%) |
| $12,500 to $14,999 | 94 (4.2%) | 83 (3.5%) |
| $15,000 to $17,499 | 15 (0.7%) | 64 (2.7%) |
| $17,500 to $19,999 | 18 (0.8%) | 43 (1.8%) |
| $20,000 to $22,499 | 23 (1.0%) | 28 (1.2%) |
| $22,500 to $24,999 | 82 (3.6%) | 76 (3.2%) |
| $25,000 to $29,999 | 100 (4.4%) | 214 (8.9%) |
| $30,000 to $34,999 | 87 (3.8%) | 117 (4.9%) |
| $35,000 to $39,999 | 113 (5.0%) | 203 (8.4%) |
| $40,000 to $44,999 | 57 (2.5%) | 168 (7.0%) |
| $45,000 to $49,999 | 194 (8.6%) | 164 (6.8%) |
| $50,000 to $54,999 | 165 (7.3%) | 53 (2.2%) |
| $55,000 to $64,999 | 256 (11.3%) | 232 (9.6%) |
| $65,000 to $74,999 | 320 (14.1%) | 38 (1.6%) |
| $75,000 to $99,999 | 232 (10.2%) | 187 (7.8%) |
| $100,000+ | 189 (8.4%) | 119 (4.9%) |
| Total | 2,264 (100.0%) | 2,408 (100.0%) |
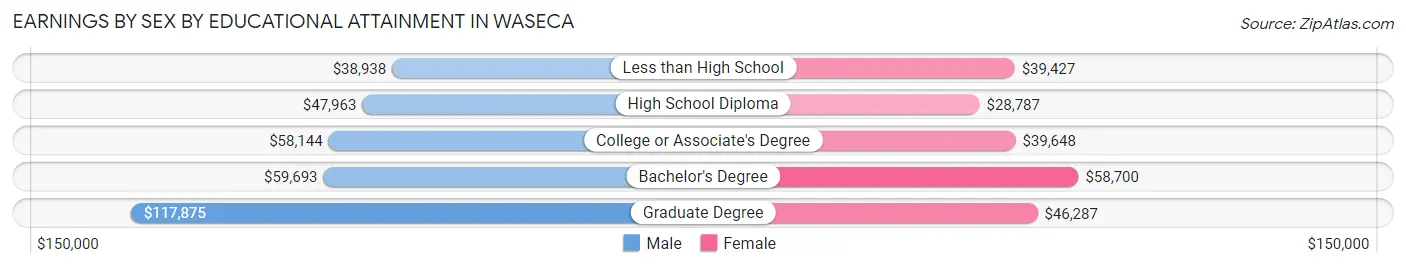
Earnings by Sex by Educational Attainment in Waseca
Average earnings in Waseca are $55,529 for men and $36,860 for women, a difference of 33.6%. Men with an educational attainment of graduate degree enjoy the highest average annual earnings of $117,875, while those with less than high school education earn the least with $38,938. Women with an educational attainment of bachelor's degree earn the most with the average annual earnings of $58,700, while those with high school diploma education have the smallest earnings of $28,787.
| Educational Attainment | Male Income | Female Income |
| Less than High School | $38,938 | $39,427 |
| High School Diploma | $47,963 | $28,787 |
| College or Associate's Degree | $58,144 | $39,648 |
| Bachelor's Degree | $59,693 | $58,700 |
| Graduate Degree | $117,875 | $46,287 |
| Total | $55,529 | $36,860 |
Family Income in Waseca
Family Income Brackets in Waseca
According to the Waseca family income data, there are 385 families falling into the $100,000 to $149,999 income range, which is the most common income bracket and makes up 17.0% of all families.
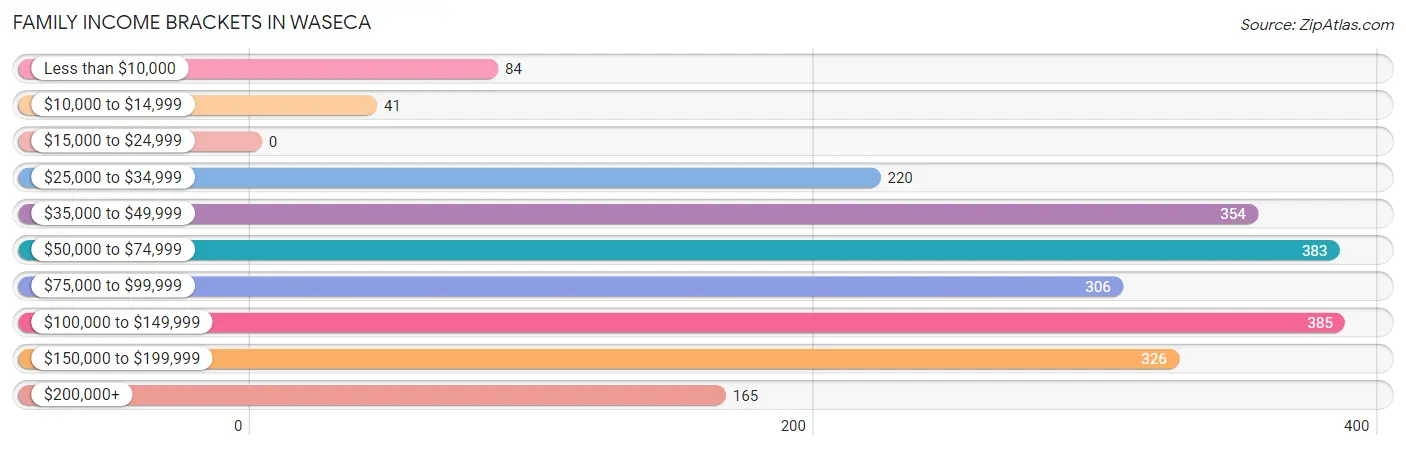
| Income Bracket | # Families | % Families |
| Less than $10,000 | 84 | 3.7% |
| $10,000 to $14,999 | 41 | 1.8% |
| $15,000 to $24,999 | 0 | 0.0% |
| $25,000 to $34,999 | 220 | 9.7% |
| $35,000 to $49,999 | 354 | 15.6% |
| $50,000 to $74,999 | 383 | 16.9% |
| $75,000 to $99,999 | 306 | 13.5% |
| $100,000 to $149,999 | 385 | 17.0% |
| $150,000 to $199,999 | 326 | 14.4% |
| $200,000+ | 165 | 7.3% |
Family Income by Famaliy Size in Waseca
7+ person families (72 | 3.2%) account for the highest median family income in Waseca with $181,944 per family, while 2-person families (920 | 40.6%) have the highest median income of $35,441 per family member.
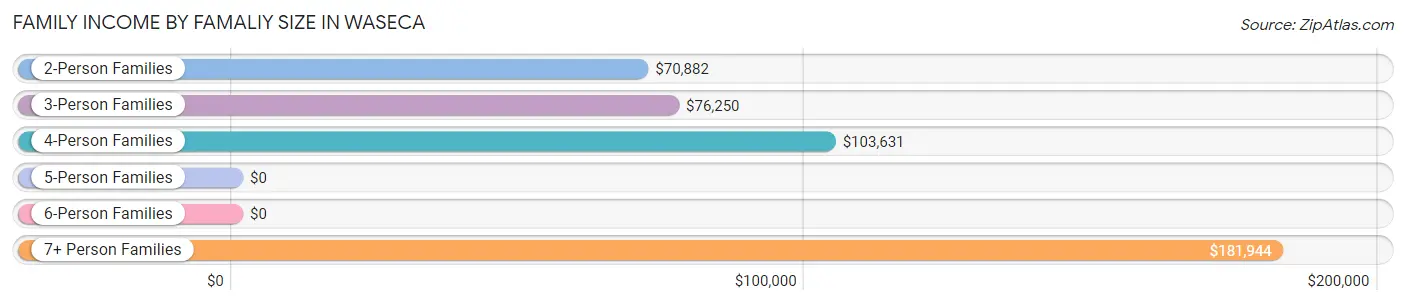
| Income Bracket | # Families | Median Income |
| 2-Person Families | 920 (40.6%) | $70,882 |
| 3-Person Families | 514 (22.7%) | $76,250 |
| 4-Person Families | 351 (15.5%) | $103,631 |
| 5-Person Families | 365 (16.1%) | $0 |
| 6-Person Families | 45 (2.0%) | $0 |
| 7+ Person Families | 72 (3.2%) | $181,944 |
| Total | 2,267 (100.0%) | $82,639 |
Family Income by Number of Earners in Waseca
The median family income in Waseca is $82,639, with families comprising 3+ earners (245) having the highest median family income of $181,875, while families with no earners (291) have the lowest median family income of $35,188, accounting for 10.8% and 12.8% of families, respectively.
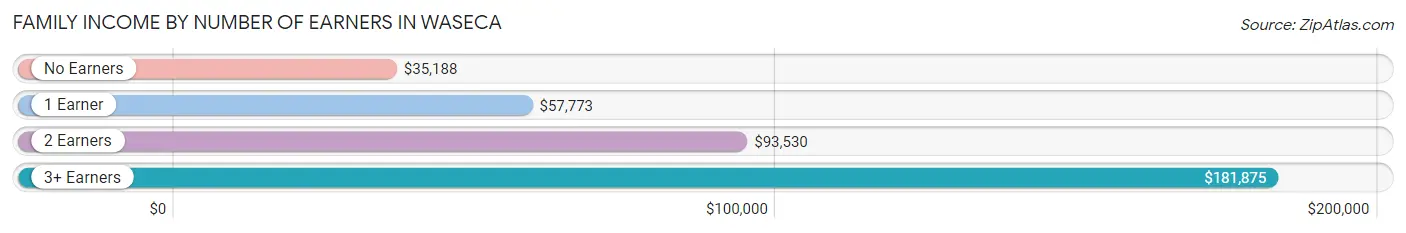
| Number of Earners | # Families | Median Income |
| No Earners | 291 (12.8%) | $35,188 |
| 1 Earner | 614 (27.1%) | $57,773 |
| 2 Earners | 1,117 (49.3%) | $93,530 |
| 3+ Earners | 245 (10.8%) | $181,875 |
| Total | 2,267 (100.0%) | $82,639 |
Household Income in Waseca
Household Income Brackets in Waseca
With 667 households falling in the category, the $35,000 to $49,999 income range is the most frequent in Waseca, accounting for 18.6% of all households. In contrast, only 11 households (0.3%) fall into the $10,000 to $14,999 income bracket, making it the least populous group.
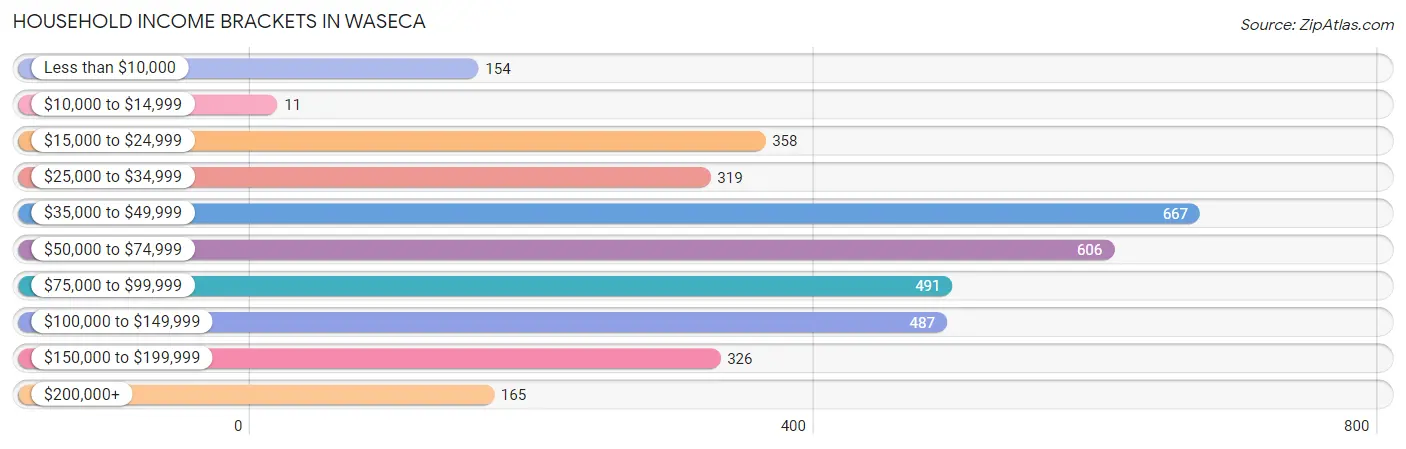
| Income Bracket | # Households | % Households |
| Less than $10,000 | 154 | 4.3% |
| $10,000 to $14,999 | 11 | 0.3% |
| $15,000 to $24,999 | 358 | 10.0% |
| $25,000 to $34,999 | 319 | 8.9% |
| $35,000 to $49,999 | 667 | 18.6% |
| $50,000 to $74,999 | 606 | 16.9% |
| $75,000 to $99,999 | 491 | 13.7% |
| $100,000 to $149,999 | 487 | 13.6% |
| $150,000 to $199,999 | 326 | 9.1% |
| $200,000+ | 165 | 4.6% |
Household Income by Householder Age in Waseca
The median household income in Waseca is $62,632, with the highest median household income of $92,763 found in the 45 to 64 years age bracket for the primary householder. A total of 1,034 households (28.8%) fall into this category. Meanwhile, the 65+ years age bracket for the primary householder has the lowest median household income of $36,227, with 1,063 households (29.7%) in this group.
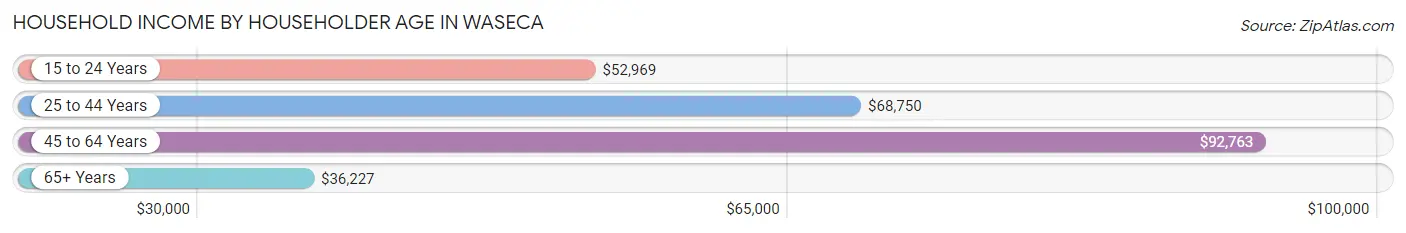
| Income Bracket | # Households | Median Income |
| 15 to 24 Years | 157 (4.4%) | $52,969 |
| 25 to 44 Years | 1,330 (37.1%) | $68,750 |
| 45 to 64 Years | 1,034 (28.8%) | $92,763 |
| 65+ Years | 1,063 (29.7%) | $36,227 |
| Total | 3,584 (100.0%) | $62,632 |
Poverty in Waseca
Income Below Poverty by Sex and Age in Waseca
With 4.5% poverty level for males and 9.5% for females among the residents of Waseca, 18 to 24 year old males and 18 to 24 year old females are the most vulnerable to poverty, with 49 males (15.5%) and 53 females (21.4%) in their respective age groups living below the poverty level.
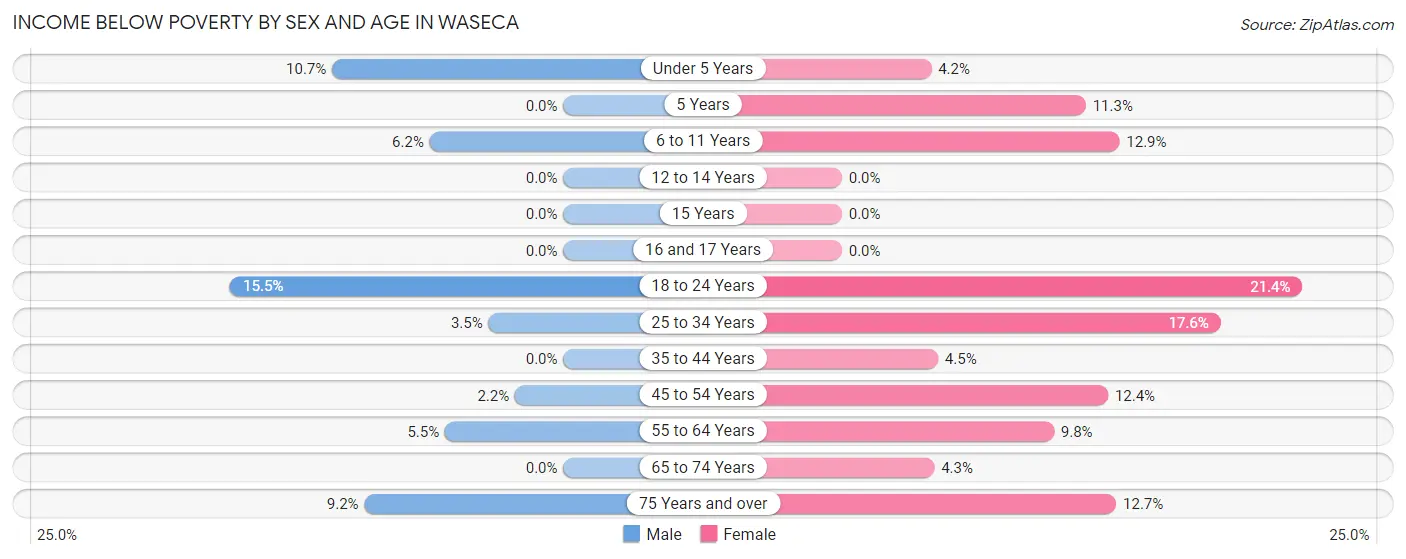
| Age Bracket | Male | Female |
| Under 5 Years | 28 (10.7%) | 16 (4.2%) |
| 5 Years | 0 (0.0%) | 12 (11.3%) |
| 6 to 11 Years | 23 (6.2%) | 42 (12.9%) |
| 12 to 14 Years | 0 (0.0%) | 0 (0.0%) |
| 15 Years | 0 (0.0%) | 0 (0.0%) |
| 16 and 17 Years | 0 (0.0%) | 0 (0.0%) |
| 18 to 24 Years | 49 (15.5%) | 53 (21.4%) |
| 25 to 34 Years | 14 (3.5%) | 106 (17.6%) |
| 35 to 44 Years | 0 (0.0%) | 33 (4.5%) |
| 45 to 54 Years | 13 (2.2%) | 50 (12.3%) |
| 55 to 64 Years | 27 (5.5%) | 49 (9.8%) |
| 65 to 74 Years | 0 (0.0%) | 19 (4.3%) |
| 75 Years and over | 25 (9.2%) | 55 (12.7%) |
| Total | 179 (4.5%) | 435 (9.5%) |
Income Above Poverty by Sex and Age in Waseca
According to the poverty statistics in Waseca, males aged 5 years and females aged 12 to 14 years are the age groups that are most secure financially, with 100.0% of males and 100.0% of females in these age groups living above the poverty line.
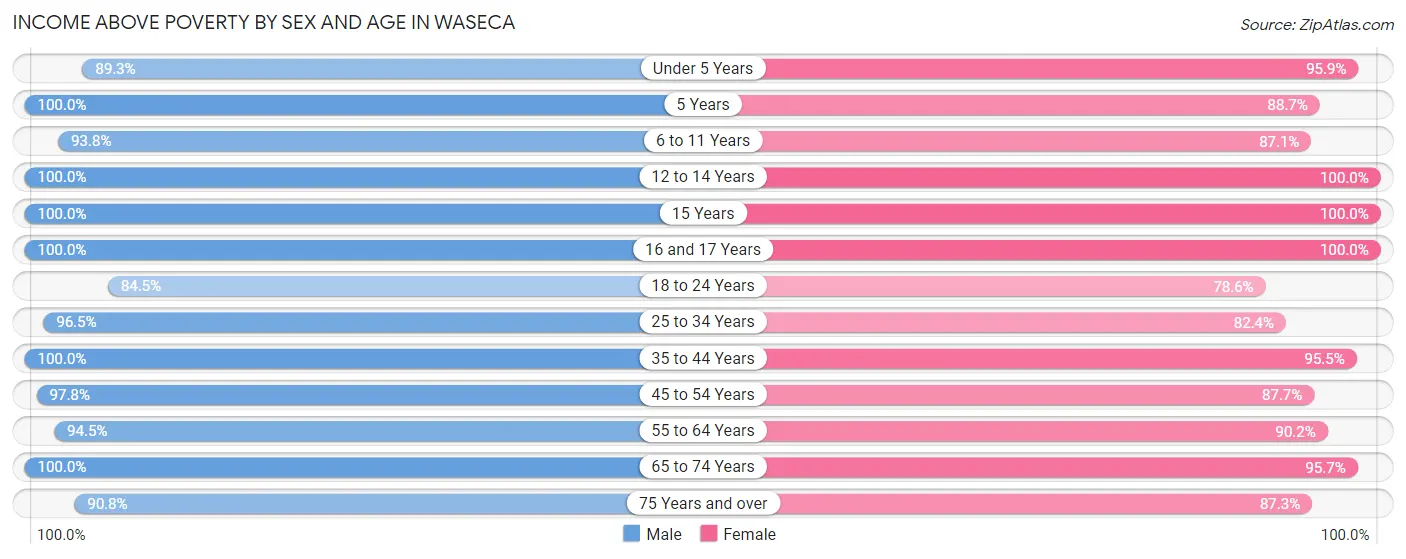
| Age Bracket | Male | Female |
| Under 5 Years | 233 (89.3%) | 370 (95.9%) |
| 5 Years | 101 (100.0%) | 94 (88.7%) |
| 6 to 11 Years | 348 (93.8%) | 284 (87.1%) |
| 12 to 14 Years | 122 (100.0%) | 243 (100.0%) |
| 15 Years | 72 (100.0%) | 58 (100.0%) |
| 16 and 17 Years | 119 (100.0%) | 73 (100.0%) |
| 18 to 24 Years | 268 (84.5%) | 195 (78.6%) |
| 25 to 34 Years | 390 (96.5%) | 497 (82.4%) |
| 35 to 44 Years | 509 (100.0%) | 707 (95.5%) |
| 45 to 54 Years | 567 (97.8%) | 355 (87.6%) |
| 55 to 64 Years | 465 (94.5%) | 449 (90.2%) |
| 65 to 74 Years | 338 (100.0%) | 424 (95.7%) |
| 75 Years and over | 246 (90.8%) | 377 (87.3%) |
| Total | 3,778 (95.5%) | 4,126 (90.5%) |
Income Below Poverty Among Married-Couple Families in Waseca
The poverty statistics for married-couple families in Waseca show that 0.3% or 5 of the total 1,669 families live below the poverty line. Families with no children have the highest poverty rate of 0.6%, comprising of 5 families. On the other hand, families with 1 or 2 children have the lowest poverty rate of 0.0%, which includes 0 families.
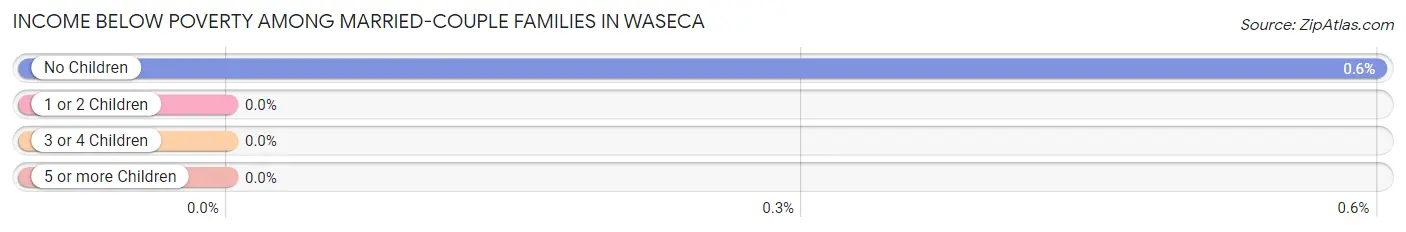
| Children | Above Poverty | Below Poverty |
| No Children | 833 (99.4%) | 5 (0.6%) |
| 1 or 2 Children | 626 (100.0%) | 0 (0.0%) |
| 3 or 4 Children | 205 (100.0%) | 0 (0.0%) |
| 5 or more Children | 0 (0.0%) | 0 (0.0%) |
| Total | 1,664 (99.7%) | 5 (0.3%) |
Income Below Poverty Among Single-Parent Households in Waseca
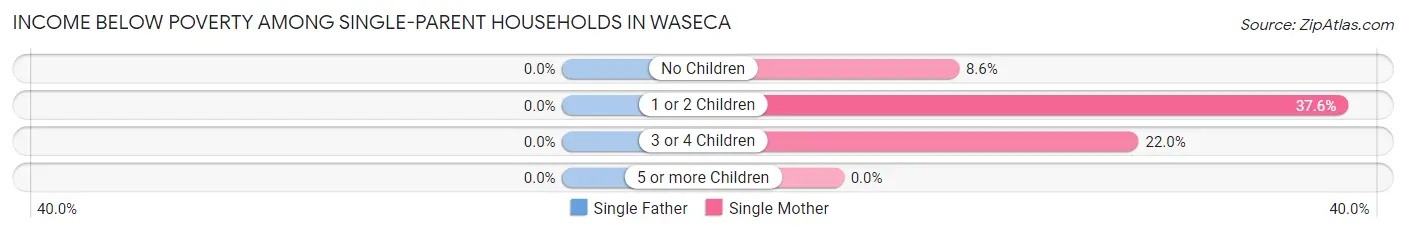
| Children | Single Father | Single Mother |
| No Children | 0 (0.0%) | 11 (8.6%) |
| 1 or 2 Children | 0 (0.0%) | 71 (37.6%) |
| 3 or 4 Children | 0 (0.0%) | 38 (22.0%) |
| 5 or more Children | 0 (0.0%) | 0 (0.0%) |
| Total | 0 (0.0%) | 120 (23.4%) |
Income Below Poverty Among Married-Couple vs Single-Parent Households in Waseca
The poverty data for Waseca shows that 5 of the married-couple family households (0.3%) and 120 of the single-parent households (20.1%) are living below the poverty level. Within the married-couple family households, those with no children have the highest poverty rate, with 5 households (0.6%) falling below the poverty line. Among the single-parent households, those with 1 or 2 children have the highest poverty rate, with 71 household (25.8%) living below poverty.
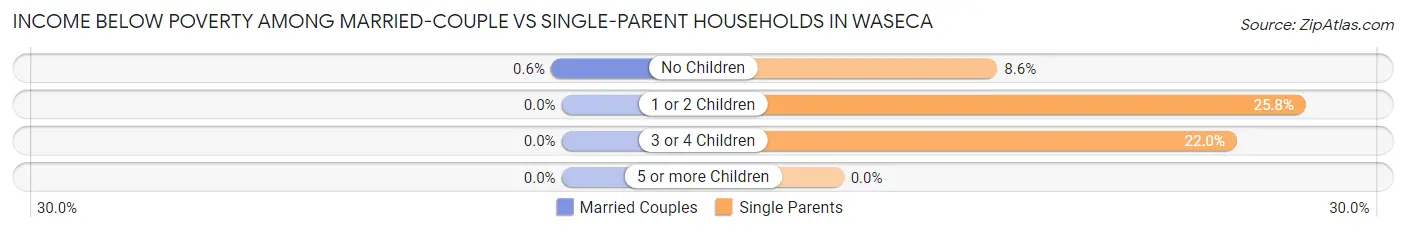
| Children | Married-Couple Families | Single-Parent Households |
| No Children | 5 (0.6%) | 11 (8.6%) |
| 1 or 2 Children | 0 (0.0%) | 71 (25.8%) |
| 3 or 4 Children | 0 (0.0%) | 38 (22.0%) |
| 5 or more Children | 0 (0.0%) | 0 (0.0%) |
| Total | 5 (0.3%) | 120 (20.1%) |
Race in Waseca
The most populous races in Waseca are White / Caucasian (7,775 | 84.4%), Hispanic or Latino (1,004 | 10.9%), and Some other Race (683 | 7.4%).
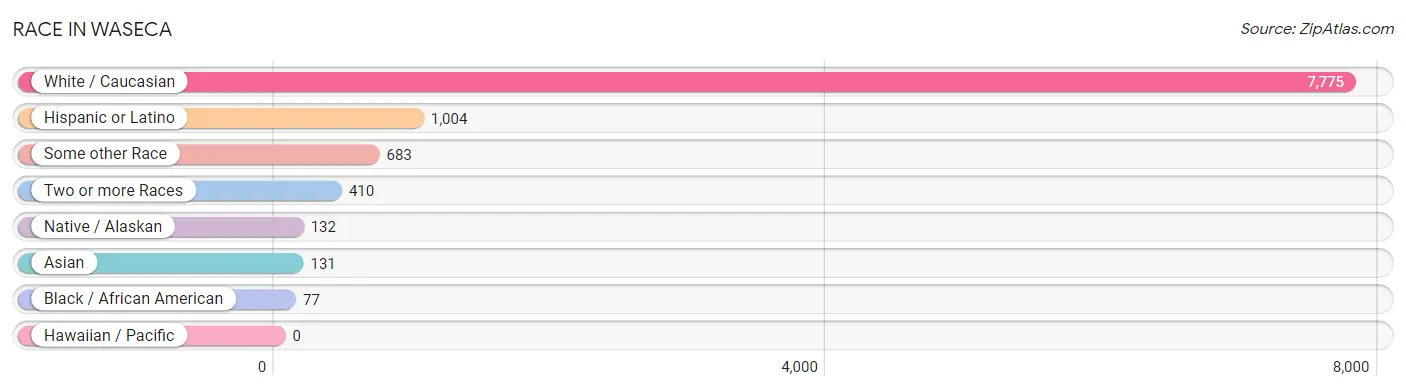
| Race | # Population | % Population |
| Asian | 131 | 1.4% |
| Black / African American | 77 | 0.8% |
| Hawaiian / Pacific | 0 | 0.0% |
| Hispanic or Latino | 1,004 | 10.9% |
| Native / Alaskan | 132 | 1.4% |
| White / Caucasian | 7,775 | 84.4% |
| Two or more Races | 410 | 4.4% |
| Some other Race | 683 | 7.4% |
| Total | 9,208 | 100.0% |
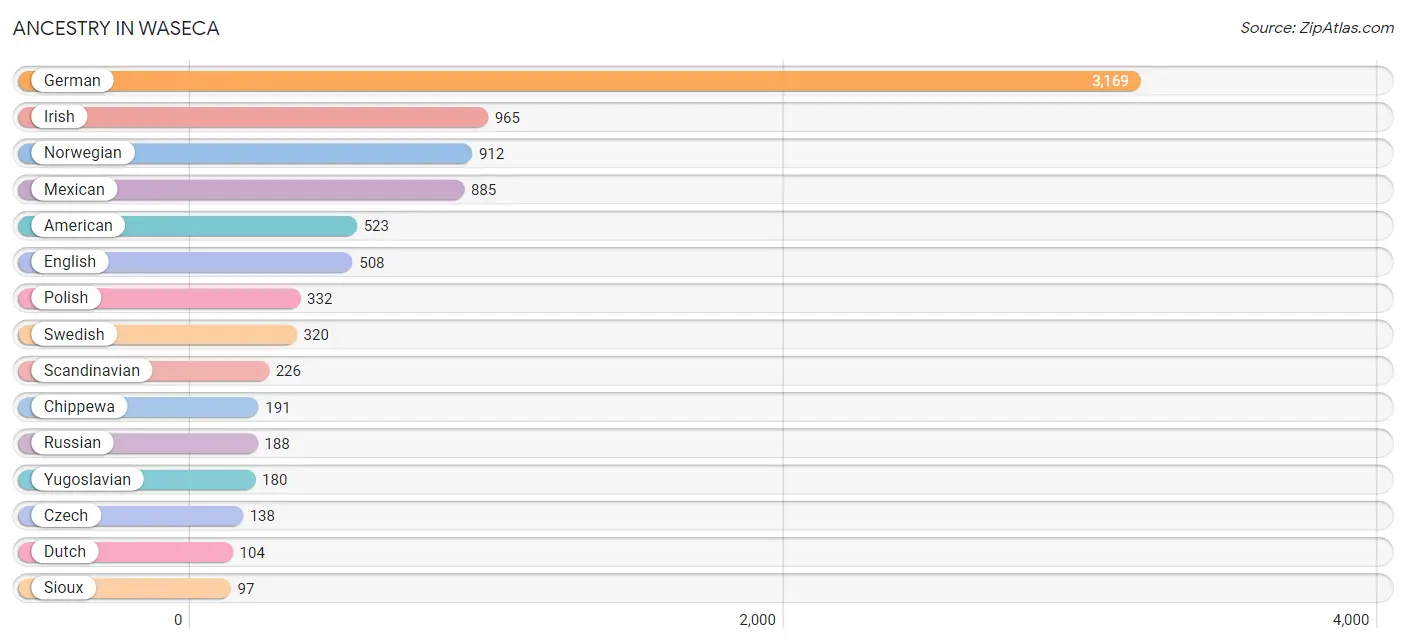
Ancestry in Waseca
The most populous ancestries reported in Waseca are German (3,169 | 34.4%), Irish (965 | 10.5%), Norwegian (912 | 9.9%), Mexican (885 | 9.6%), and American (523 | 5.7%), together accounting for 70.1% of all Waseca residents.
| Ancestry | # Population | % Population |
| African | 7 | 0.1% |
| Alsatian | 20 | 0.2% |
| American | 523 | 5.7% |
| Arab | 54 | 0.6% |
| Austrian | 16 | 0.2% |
| Blackfeet | 22 | 0.2% |
| British | 14 | 0.2% |
| Burmese | 24 | 0.3% |
| Canadian | 7 | 0.1% |
| Central American | 49 | 0.5% |
| Chippewa | 191 | 2.1% |
| Croatian | 6 | 0.1% |
| Czech | 138 | 1.5% |
| Czechoslovakian | 6 | 0.1% |
| Danish | 87 | 0.9% |
| Dutch | 104 | 1.1% |
| English | 508 | 5.5% |
| European | 17 | 0.2% |
| Finnish | 73 | 0.8% |
| French | 37 | 0.4% |
| French Canadian | 11 | 0.1% |
| German | 3,169 | 34.4% |
| Indian (Asian) | 67 | 0.7% |
| Irish | 965 | 10.5% |
| Italian | 26 | 0.3% |
| Lebanese | 16 | 0.2% |
| Mexican | 885 | 9.6% |
| Mongolian | 7 | 0.1% |
| Northern European | 19 | 0.2% |
| Norwegian | 912 | 9.9% |
| Pakistani | 9 | 0.1% |
| Polish | 332 | 3.6% |
| Russian | 188 | 2.0% |
| Salvadoran | 49 | 0.5% |
| Scandinavian | 226 | 2.5% |
| Scottish | 26 | 0.3% |
| Sioux | 97 | 1.1% |
| Slovak | 20 | 0.2% |
| Sri Lankan | 3 | 0.0% |
| Subsaharan African | 7 | 0.1% |
| Swedish | 320 | 3.5% |
| Swiss | 79 | 0.9% |
| Thai | 19 | 0.2% |
| Welsh | 21 | 0.2% |
| Yugoslavian | 180 | 1.9% | View All 45 Rows |
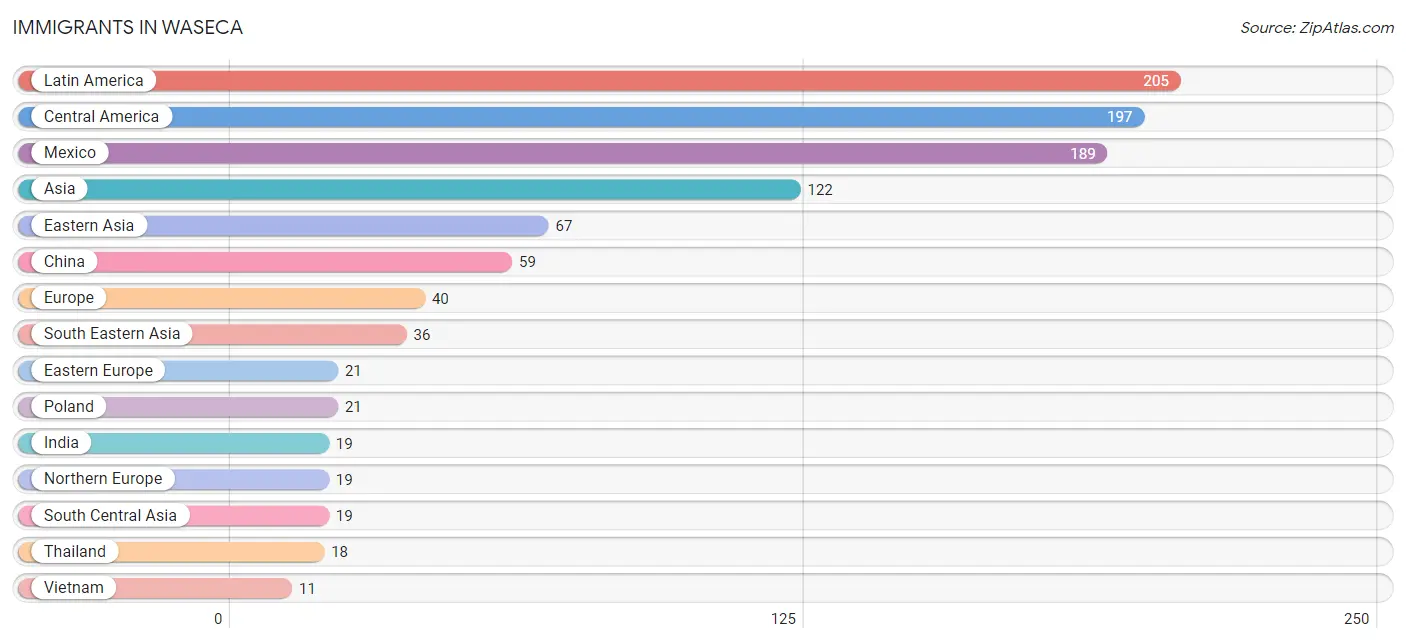
Immigrants in Waseca
The most numerous immigrant groups reported in Waseca came from Latin America (205 | 2.2%), Central America (197 | 2.1%), Mexico (189 | 2.1%), Asia (122 | 1.3%), and Eastern Asia (67 | 0.7%), together accounting for 8.5% of all Waseca residents.
| Immigration Origin | # Population | % Population |
| Africa | 7 | 0.1% |
| Asia | 122 | 1.3% |
| Central America | 197 | 2.1% |
| China | 59 | 0.6% |
| Eastern Africa | 7 | 0.1% |
| Eastern Asia | 67 | 0.7% |
| Eastern Europe | 21 | 0.2% |
| Europe | 40 | 0.4% |
| Guatemala | 8 | 0.1% |
| India | 19 | 0.2% |
| Korea | 8 | 0.1% |
| Latin America | 205 | 2.2% |
| Mexico | 189 | 2.1% |
| Northern Europe | 19 | 0.2% |
| Poland | 21 | 0.2% |
| Singapore | 7 | 0.1% |
| Somalia | 7 | 0.1% |
| South America | 8 | 0.1% |
| South Central Asia | 19 | 0.2% |
| South Eastern Asia | 36 | 0.4% |
| Thailand | 18 | 0.2% |
| Vietnam | 11 | 0.1% | View All 22 Rows |
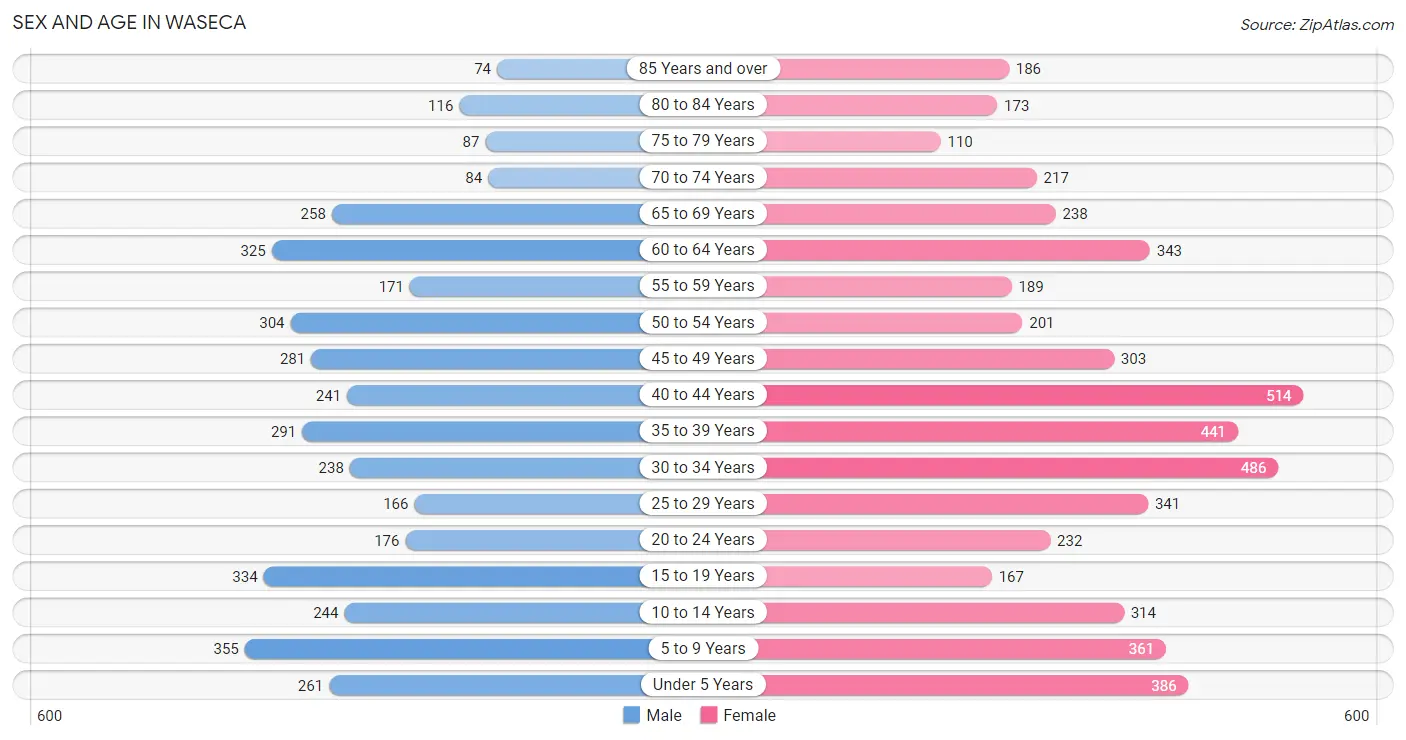
Sex and Age in Waseca
Sex and Age in Waseca
The most populous age groups in Waseca are 5 to 9 Years (355 | 8.9%) for men and 40 to 44 Years (514 | 9.9%) for women.
| Age Bracket | Male | Female |
| Under 5 Years | 261 (6.5%) | 386 (7.4%) |
| 5 to 9 Years | 355 (8.9%) | 361 (6.9%) |
| 10 to 14 Years | 244 (6.1%) | 314 (6.0%) |
| 15 to 19 Years | 334 (8.3%) | 167 (3.2%) |
| 20 to 24 Years | 176 (4.4%) | 232 (4.5%) |
| 25 to 29 Years | 166 (4.1%) | 341 (6.6%) |
| 30 to 34 Years | 238 (5.9%) | 486 (9.3%) |
| 35 to 39 Years | 291 (7.3%) | 441 (8.5%) |
| 40 to 44 Years | 241 (6.0%) | 514 (9.9%) |
| 45 to 49 Years | 281 (7.0%) | 303 (5.8%) |
| 50 to 54 Years | 304 (7.6%) | 201 (3.9%) |
| 55 to 59 Years | 171 (4.3%) | 189 (3.6%) |
| 60 to 64 Years | 325 (8.1%) | 343 (6.6%) |
| 65 to 69 Years | 258 (6.4%) | 238 (4.6%) |
| 70 to 74 Years | 84 (2.1%) | 217 (4.2%) |
| 75 to 79 Years | 87 (2.2%) | 110 (2.1%) |
| 80 to 84 Years | 116 (2.9%) | 173 (3.3%) |
| 85 Years and over | 74 (1.8%) | 186 (3.6%) |
| Total | 4,006 (100.0%) | 5,202 (100.0%) |
Families and Households in Waseca
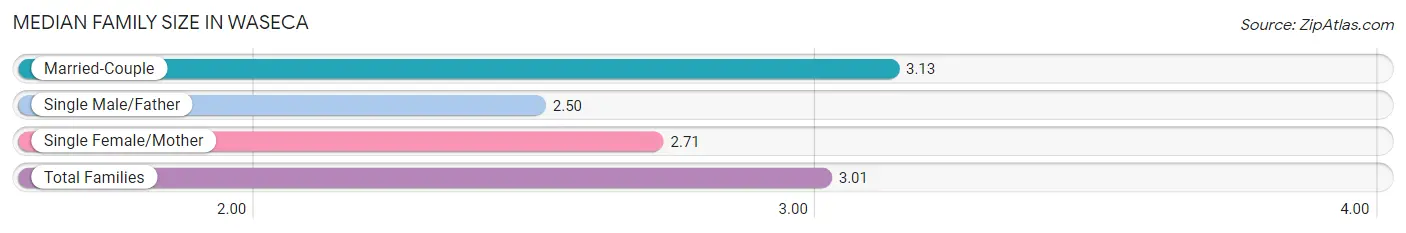
Median Family Size in Waseca
The median family size in Waseca is 3.01 persons per family, with married-couple families (1,669 | 73.6%) accounting for the largest median family size of 3.13 persons per family. On the other hand, single male/father families (86 | 3.8%) represent the smallest median family size with 2.50 persons per family.
| Family Type | # Families | Family Size |
| Married-Couple | 1,669 (73.6%) | 3.13 |
| Single Male/Father | 86 (3.8%) | 2.50 |
| Single Female/Mother | 512 (22.6%) | 2.71 |
| Total Families | 2,267 (100.0%) | 3.01 |
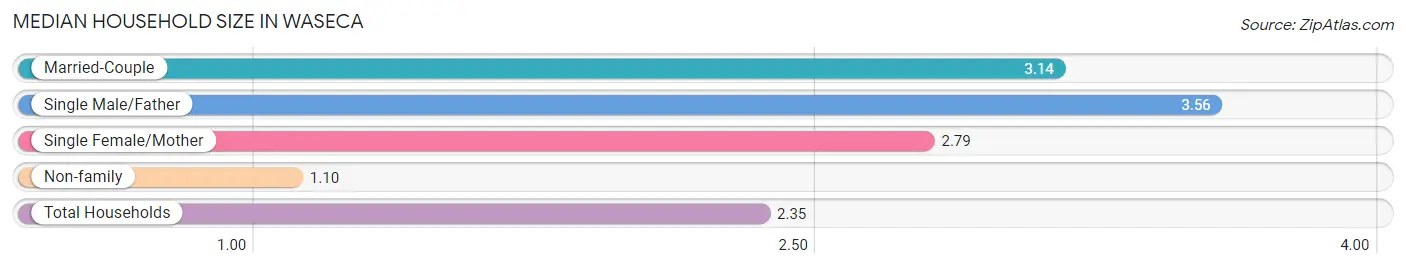
Median Household Size in Waseca
The median household size in Waseca is 2.35 persons per household, with single male/father households (86 | 2.4%) accounting for the largest median household size of 3.56 persons per household. non-family households (1,317 | 36.7%) represent the smallest median household size with 1.10 persons per household.
| Household Type | # Households | Household Size |
| Married-Couple | 1,669 (46.6%) | 3.14 |
| Single Male/Father | 86 (2.4%) | 3.56 |
| Single Female/Mother | 512 (14.3%) | 2.79 |
| Non-family | 1,317 (36.7%) | 1.10 |
| Total Households | 3,584 (100.0%) | 2.35 |
Household Size by Marriage Status in Waseca
Out of a total of 3,584 households in Waseca, 2,267 (63.2%) are family households, while 1,317 (36.7%) are nonfamily households. The most numerous type of family households are 2-person households, comprising 843, and the most common type of nonfamily households are 1-person households, comprising 1,186.
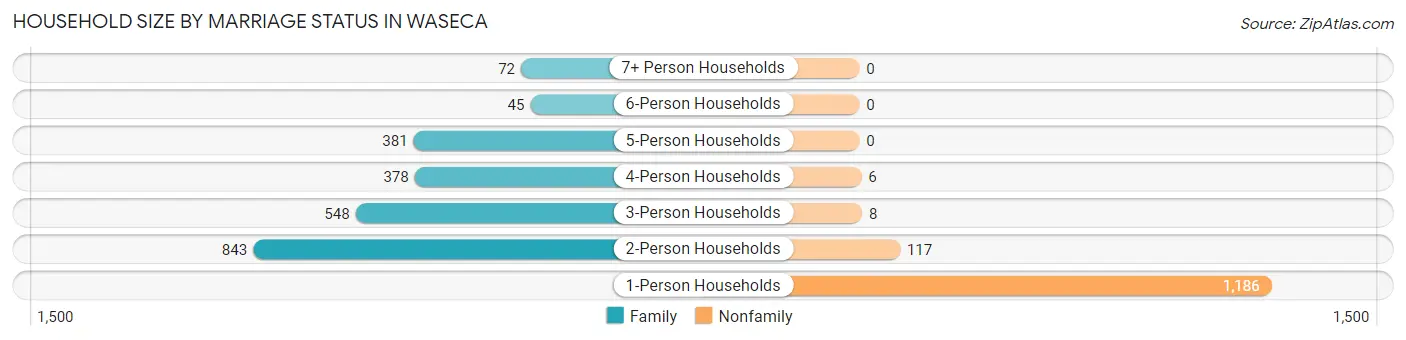
| Household Size | Family Households | Nonfamily Households |
| 1-Person Households | - | 1,186 (33.1%) |
| 2-Person Households | 843 (23.5%) | 117 (3.3%) |
| 3-Person Households | 548 (15.3%) | 8 (0.2%) |
| 4-Person Households | 378 (10.5%) | 6 (0.2%) |
| 5-Person Households | 381 (10.6%) | 0 (0.0%) |
| 6-Person Households | 45 (1.3%) | 0 (0.0%) |
| 7+ Person Households | 72 (2.0%) | 0 (0.0%) |
| Total | 2,267 (63.2%) | 1,317 (36.7%) |
Female Fertility in Waseca
Fertility by Age in Waseca
Average fertility rate in Waseca is 41.0 births per 1,000 women. Women in the age bracket of 20 to 34 years have the highest fertility rate with 92.0 births per 1,000 women. Women in the age bracket of 20 to 34 years acount for 92.4% of all women with births.
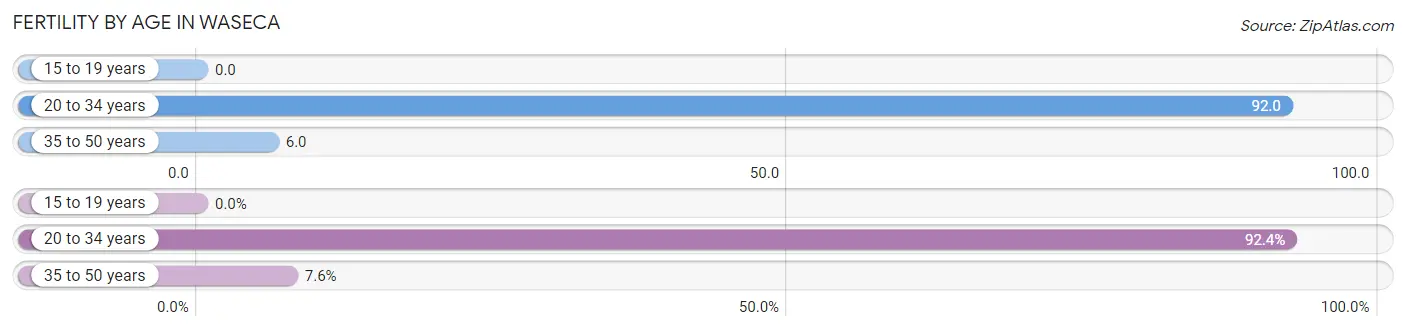
| Age Bracket | Women with Births | Births / 1,000 Women |
| 15 to 19 years | 0 (0.0%) | 0.0 |
| 20 to 34 years | 97 (92.4%) | 92.0 |
| 35 to 50 years | 8 (7.6%) | 6.0 |
| Total | 105 (100.0%) | 41.0 |
Fertility by Age by Marriage Status in Waseca
52.4% of women with births (105) in Waseca are married. The highest percentage of unmarried women with births falls into 20 to 34 years age bracket with 51.5% of them unmarried at the time of birth, while the lowest percentage of unmarried women with births belong to 35 to 50 years age bracket with 0.0% of them unmarried.
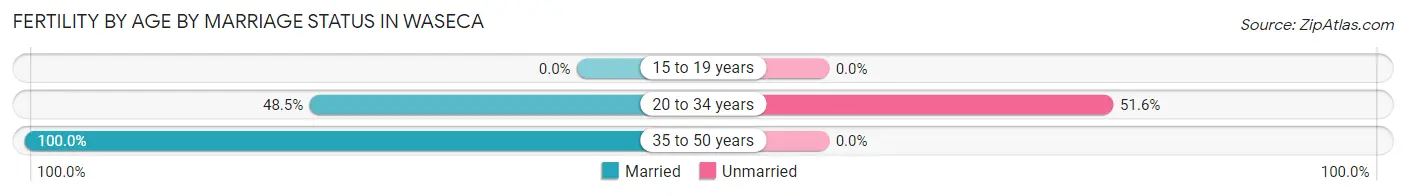
| Age Bracket | Married | Unmarried |
| 15 to 19 years | 0 (0.0%) | 0 (0.0%) |
| 20 to 34 years | 47 (48.4%) | 50 (51.5%) |
| 35 to 50 years | 8 (100.0%) | 0 (0.0%) |
| Total | 55 (52.4%) | 50 (47.6%) |
Fertility by Education in Waseca
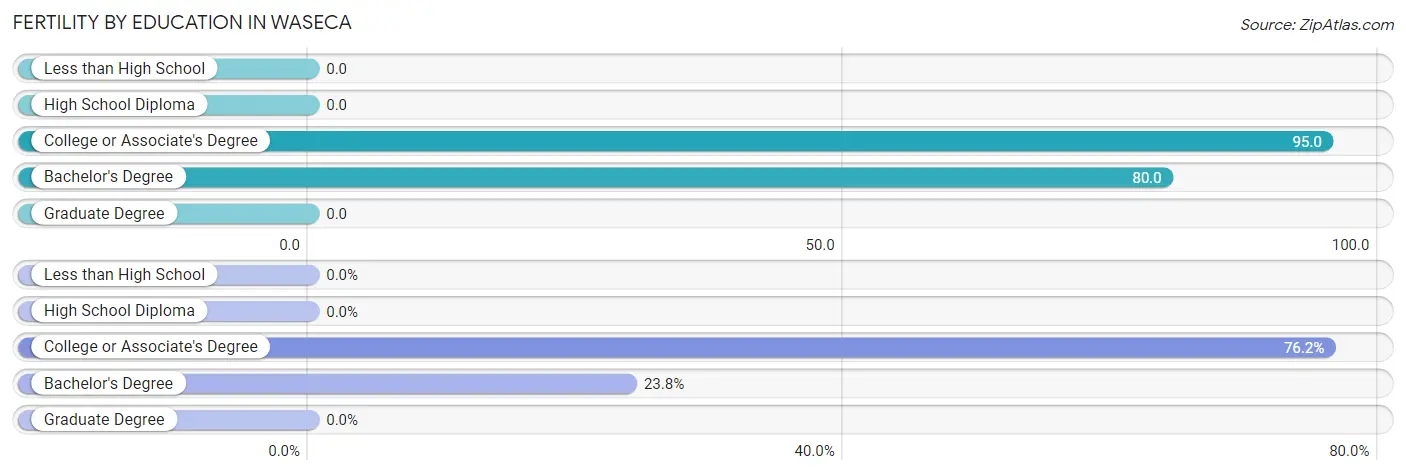
| Educational Attainment | Women with Births | Births / 1,000 Women |
| Less than High School | 0 (0.0%) | 0.0 |
| High School Diploma | 0 (0.0%) | 0.0 |
| College or Associate's Degree | 80 (76.2%) | 95.0 |
| Bachelor's Degree | 25 (23.8%) | 80.0 |
| Graduate Degree | 0 (0.0%) | 0.0 |
| Total | 105 (100.0%) | 41.0 |
Fertility by Education by Marriage Status in Waseca
47.6% of women with births in Waseca are unmarried. Women with the educational attainment of bachelor's degree are most likely to be married with 100.0% of them married at childbirth, while women with the educational attainment of college or associate's degree are least likely to be married with 62.5% of them unmarried at childbirth.
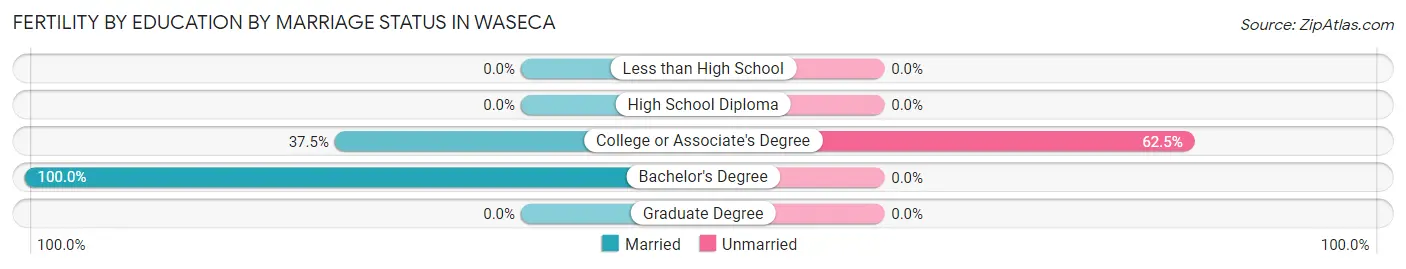
| Educational Attainment | Married | Unmarried |
| Less than High School | 0 (0.0%) | 0 (0.0%) |
| High School Diploma | 0 (0.0%) | 0 (0.0%) |
| College or Associate's Degree | 30 (37.5%) | 50 (62.5%) |
| Bachelor's Degree | 25 (100.0%) | 0 (0.0%) |
| Graduate Degree | 0 (0.0%) | 0 (0.0%) |
| Total | 55 (52.4%) | 50 (47.6%) |
Employment Characteristics in Waseca
Employment by Class of Employer in Waseca
Among the 4,052 employed individuals in Waseca, private company employees (2,944 | 72.7%), not-for-profit organizations (481 | 11.9%), and local government employees (181 | 4.5%) make up the most common classes of employment.
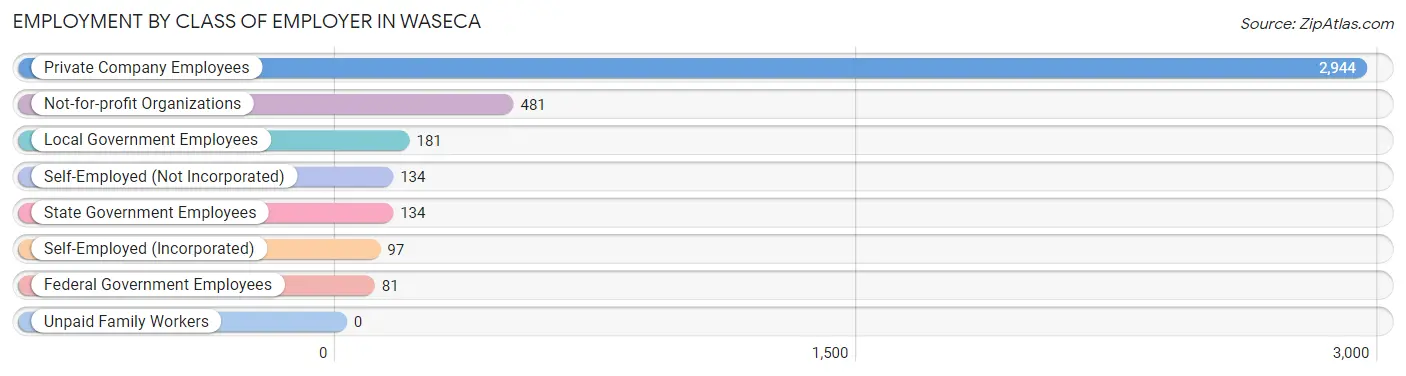
| Employer Class | # Employees | % Employees |
| Private Company Employees | 2,944 | 72.7% |
| Self-Employed (Incorporated) | 97 | 2.4% |
| Self-Employed (Not Incorporated) | 134 | 3.3% |
| Not-for-profit Organizations | 481 | 11.9% |
| Local Government Employees | 181 | 4.5% |
| State Government Employees | 134 | 3.3% |
| Federal Government Employees | 81 | 2.0% |
| Unpaid Family Workers | 0 | 0.0% |
| Total | 4,052 | 100.0% |
Employment Status by Age in Waseca
According to the labor force statistics for Waseca, out of the total population over 16 years of age (7,156), 59.8% or 4,279 individuals are in the labor force, with 4.7% or 201 of them unemployed. The age group with the highest labor force participation rate is 20 to 24 years, with 89.2% or 364 individuals in the labor force. Within the labor force, the 16 to 19 years age range has the highest percentage of unemployed individuals, with 15.0% or 25 of them being unemployed.
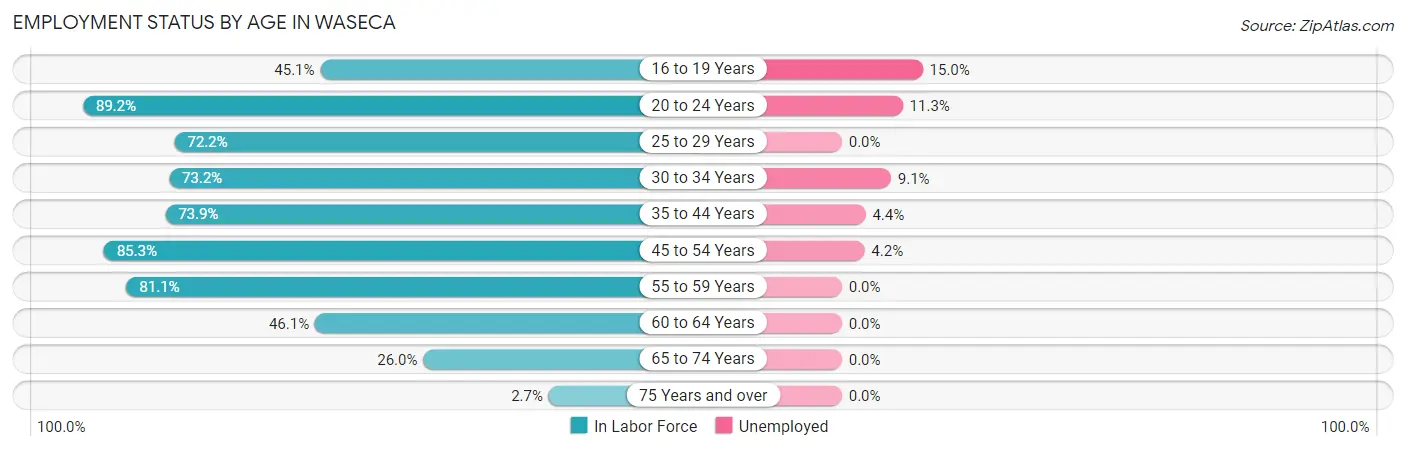
| Age Bracket | In Labor Force | Unemployed |
| 16 to 19 Years | 167 (45.1%) | 25 (15.0%) |
| 20 to 24 Years | 364 (89.2%) | 41 (11.3%) |
| 25 to 29 Years | 366 (72.2%) | 0 (0.0%) |
| 30 to 34 Years | 530 (73.2%) | 48 (9.1%) |
| 35 to 44 Years | 1,099 (73.9%) | 48 (4.4%) |
| 45 to 54 Years | 929 (85.3%) | 39 (4.2%) |
| 55 to 59 Years | 292 (81.1%) | 0 (0.0%) |
| 60 to 64 Years | 308 (46.1%) | 0 (0.0%) |
| 65 to 74 Years | 207 (26.0%) | 0 (0.0%) |
| 75 Years and over | 20 (2.7%) | 0 (0.0%) |
| Total | 4,279 (59.8%) | 201 (4.7%) |
Employment Status by Educational Attainment in Waseca
According to labor force statistics for Waseca, 72.9% of individuals (3,525) out of the total population between 25 and 64 years of age (4,835) are in the labor force, with 3.8% or 134 of them being unemployed. The group with the highest labor force participation rate are those with the educational attainment of bachelor's degree or higher, with 87.1% or 837 individuals in the labor force. Within the labor force, individuals with less than high school education have the highest percentage of unemployment, with 14.3% or 27 of them being unemployed.
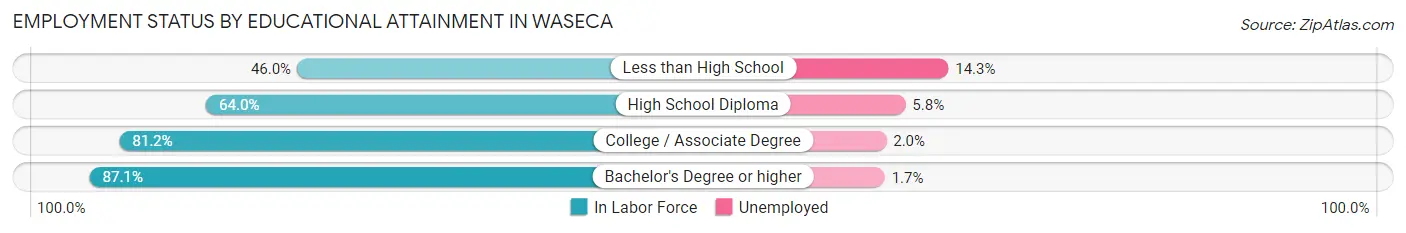
| Educational Attainment | In Labor Force | Unemployed |
| Less than High School | 189 (46.0%) | 59 (14.3%) |
| High School Diploma | 1,173 (64.0%) | 106 (5.8%) |
| College / Associate Degree | 1,324 (81.2%) | 33 (2.0%) |
| Bachelor's Degree or higher | 837 (87.1%) | 16 (1.7%) |
| Total | 3,525 (72.9%) | 184 (3.8%) |
Employment Occupations by Sex in Waseca
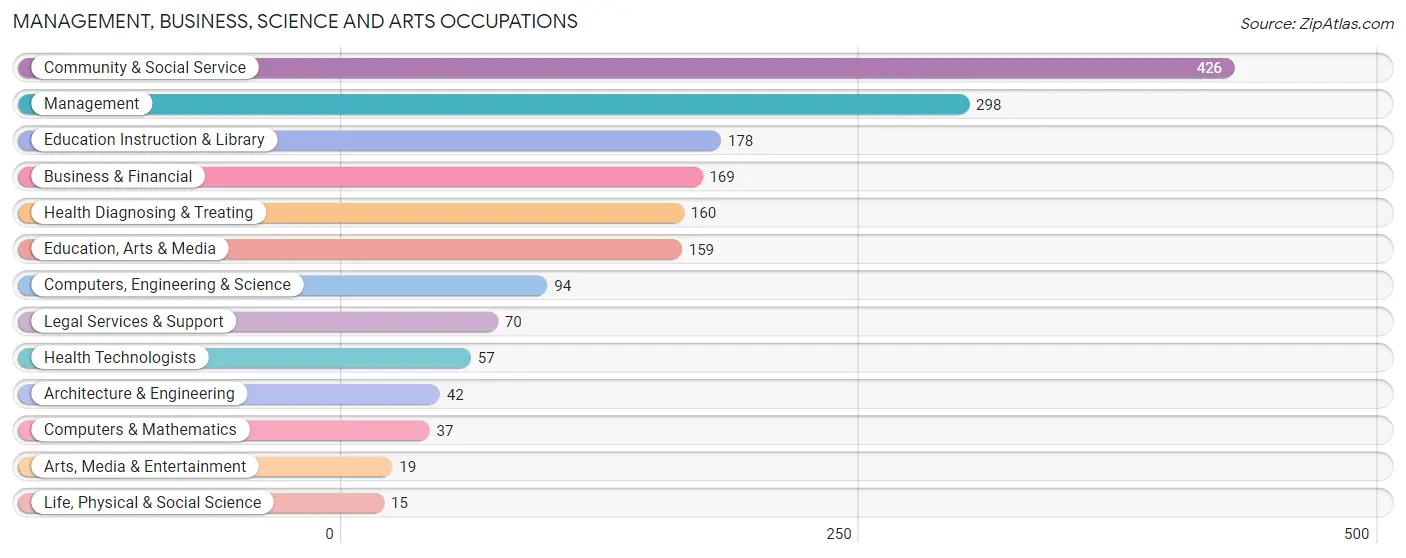
Management, Business, Science and Arts Occupations
The most common Management, Business, Science and Arts occupations in Waseca are Community & Social Service (426 | 10.4%), Management (298 | 7.3%), Education Instruction & Library (178 | 4.4%), Business & Financial (169 | 4.1%), and Health Diagnosing & Treating (160 | 3.9%).
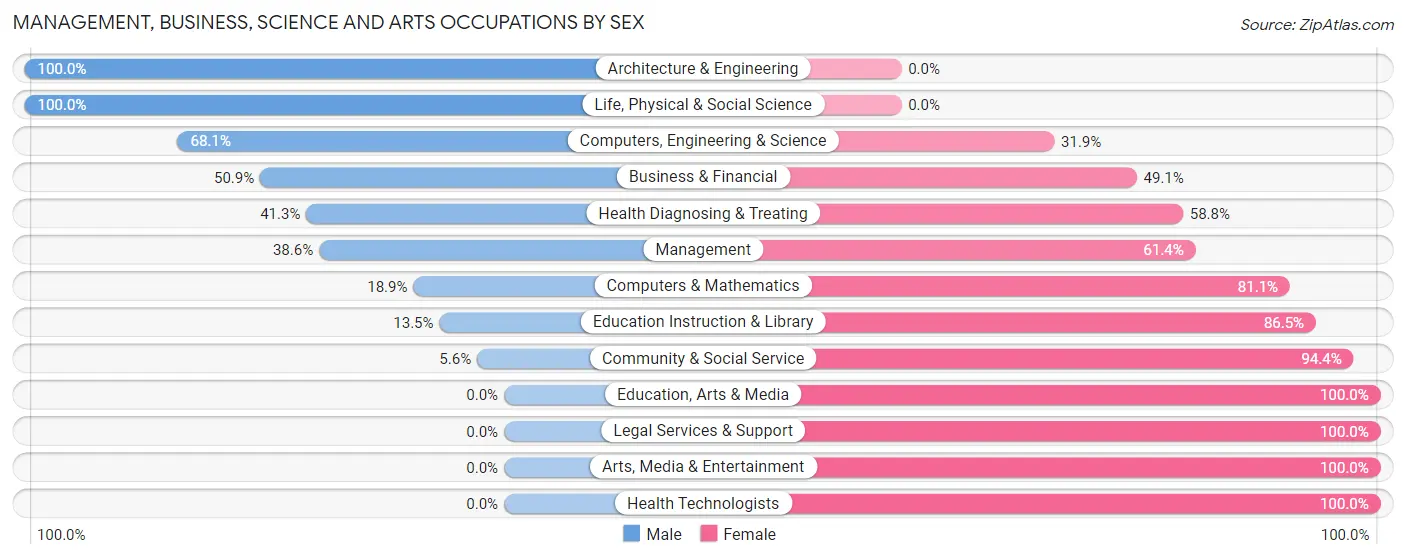
Management, Business, Science and Arts Occupations by Sex
Within the Management, Business, Science and Arts occupations in Waseca, the most male-oriented occupations are Architecture & Engineering (100.0%), Life, Physical & Social Science (100.0%), and Computers, Engineering & Science (68.1%), while the most female-oriented occupations are Education, Arts & Media (100.0%), Legal Services & Support (100.0%), and Arts, Media & Entertainment (100.0%).
| Occupation | Male | Female |
| Management | 115 (38.6%) | 183 (61.4%) |
| Business & Financial | 86 (50.9%) | 83 (49.1%) |
| Computers, Engineering & Science | 64 (68.1%) | 30 (31.9%) |
| Computers & Mathematics | 7 (18.9%) | 30 (81.1%) |
| Architecture & Engineering | 42 (100.0%) | 0 (0.0%) |
| Life, Physical & Social Science | 15 (100.0%) | 0 (0.0%) |
| Community & Social Service | 24 (5.6%) | 402 (94.4%) |
| Education, Arts & Media | 0 (0.0%) | 159 (100.0%) |
| Legal Services & Support | 0 (0.0%) | 70 (100.0%) |
| Education Instruction & Library | 24 (13.5%) | 154 (86.5%) |
| Arts, Media & Entertainment | 0 (0.0%) | 19 (100.0%) |
| Health Diagnosing & Treating | 66 (41.2%) | 94 (58.8%) |
| Health Technologists | 0 (0.0%) | 57 (100.0%) |
| Total (Category) | 355 (30.9%) | 792 (69.1%) |
| Total (Overall) | 1,988 (48.7%) | 2,093 (51.3%) |
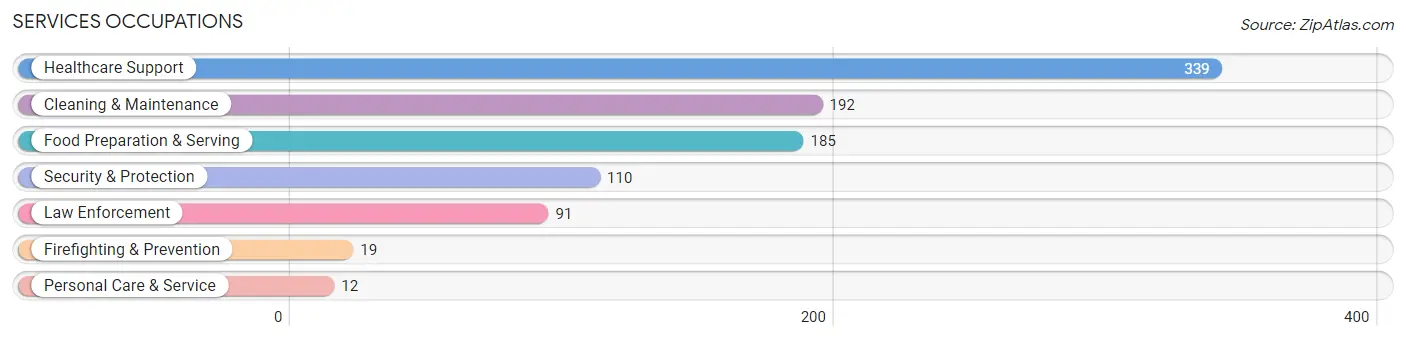
Services Occupations
The most common Services occupations in Waseca are Healthcare Support (339 | 8.3%), Cleaning & Maintenance (192 | 4.7%), Food Preparation & Serving (185 | 4.5%), Security & Protection (110 | 2.7%), and Law Enforcement (91 | 2.2%).
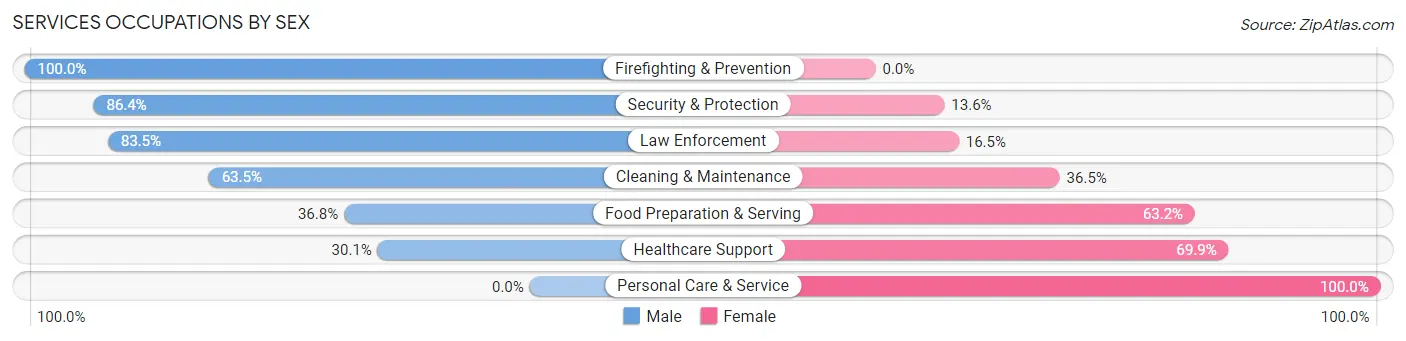
Services Occupations by Sex
Within the Services occupations in Waseca, the most male-oriented occupations are Firefighting & Prevention (100.0%), Security & Protection (86.4%), and Law Enforcement (83.5%), while the most female-oriented occupations are Personal Care & Service (100.0%), Healthcare Support (69.9%), and Food Preparation & Serving (63.2%).
| Occupation | Male | Female |
| Healthcare Support | 102 (30.1%) | 237 (69.9%) |
| Security & Protection | 95 (86.4%) | 15 (13.6%) |
| Firefighting & Prevention | 19 (100.0%) | 0 (0.0%) |
| Law Enforcement | 76 (83.5%) | 15 (16.5%) |
| Food Preparation & Serving | 68 (36.8%) | 117 (63.2%) |
| Cleaning & Maintenance | 122 (63.5%) | 70 (36.5%) |
| Personal Care & Service | 0 (0.0%) | 12 (100.0%) |
| Total (Category) | 387 (46.2%) | 451 (53.8%) |
| Total (Overall) | 1,988 (48.7%) | 2,093 (51.3%) |
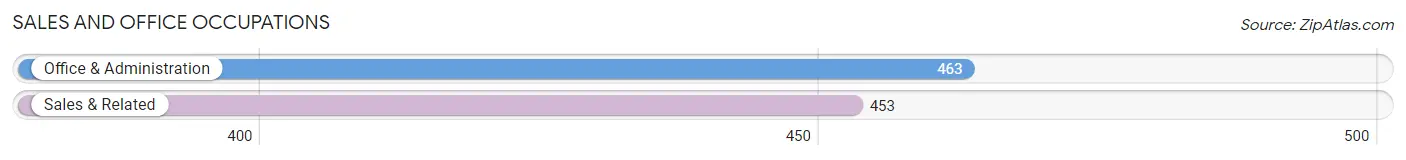
Sales and Office Occupations
The most common Sales and Office occupations in Waseca are Office & Administration (463 | 11.4%), and Sales & Related (453 | 11.1%).
Sales and Office Occupations by Sex
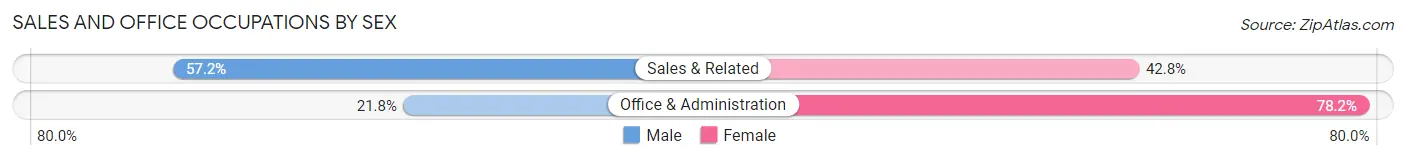
| Occupation | Male | Female |
| Sales & Related | 259 (57.2%) | 194 (42.8%) |
| Office & Administration | 101 (21.8%) | 362 (78.2%) |
| Total (Category) | 360 (39.3%) | 556 (60.7%) |
| Total (Overall) | 1,988 (48.7%) | 2,093 (51.3%) |
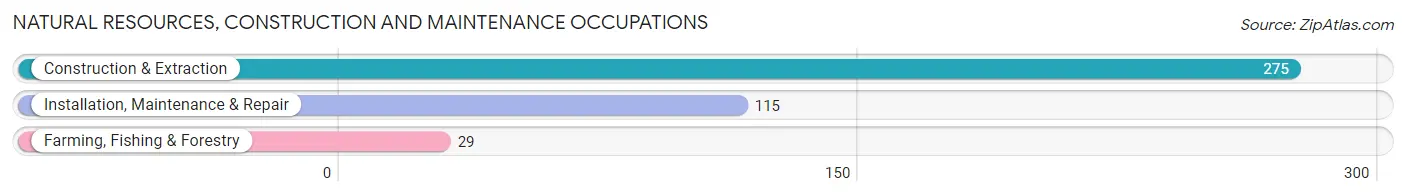
Natural Resources, Construction and Maintenance Occupations
The most common Natural Resources, Construction and Maintenance occupations in Waseca are Construction & Extraction (275 | 6.7%), Installation, Maintenance & Repair (115 | 2.8%), and Farming, Fishing & Forestry (29 | 0.7%).
Natural Resources, Construction and Maintenance Occupations by Sex
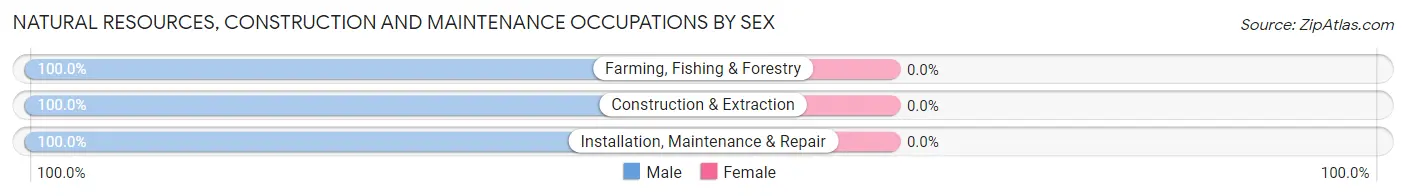
| Occupation | Male | Female |
| Farming, Fishing & Forestry | 29 (100.0%) | 0 (0.0%) |
| Construction & Extraction | 275 (100.0%) | 0 (0.0%) |
| Installation, Maintenance & Repair | 115 (100.0%) | 0 (0.0%) |
| Total (Category) | 419 (100.0%) | 0 (0.0%) |
| Total (Overall) | 1,988 (48.7%) | 2,093 (51.3%) |
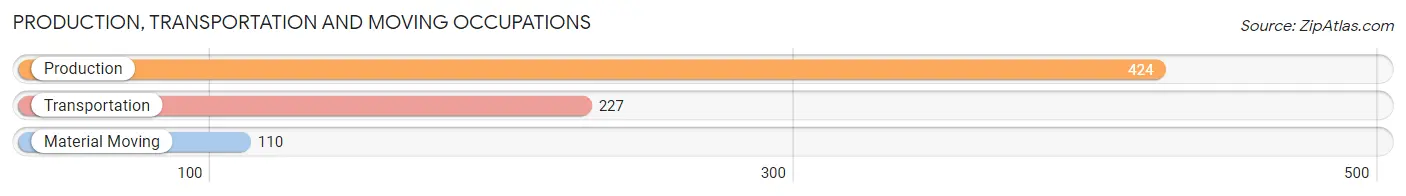
Production, Transportation and Moving Occupations
The most common Production, Transportation and Moving occupations in Waseca are Production (424 | 10.4%), Transportation (227 | 5.6%), and Material Moving (110 | 2.7%).
Production, Transportation and Moving Occupations by Sex
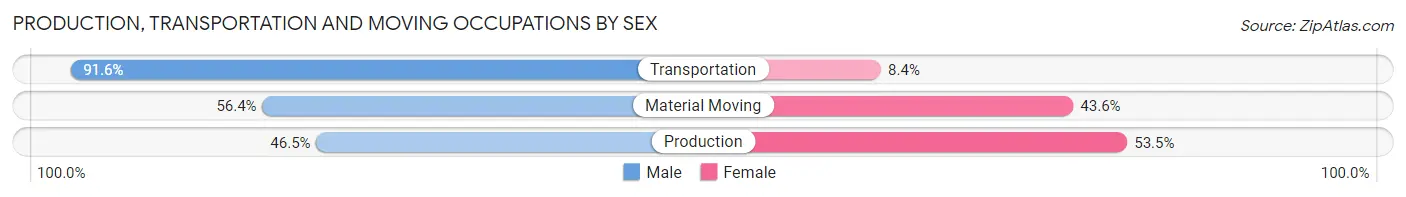
| Occupation | Male | Female |
| Production | 197 (46.5%) | 227 (53.5%) |
| Transportation | 208 (91.6%) | 19 (8.4%) |
| Material Moving | 62 (56.4%) | 48 (43.6%) |
| Total (Category) | 467 (61.4%) | 294 (38.6%) |
| Total (Overall) | 1,988 (48.7%) | 2,093 (51.3%) |
Employment Industries by Sex in Waseca
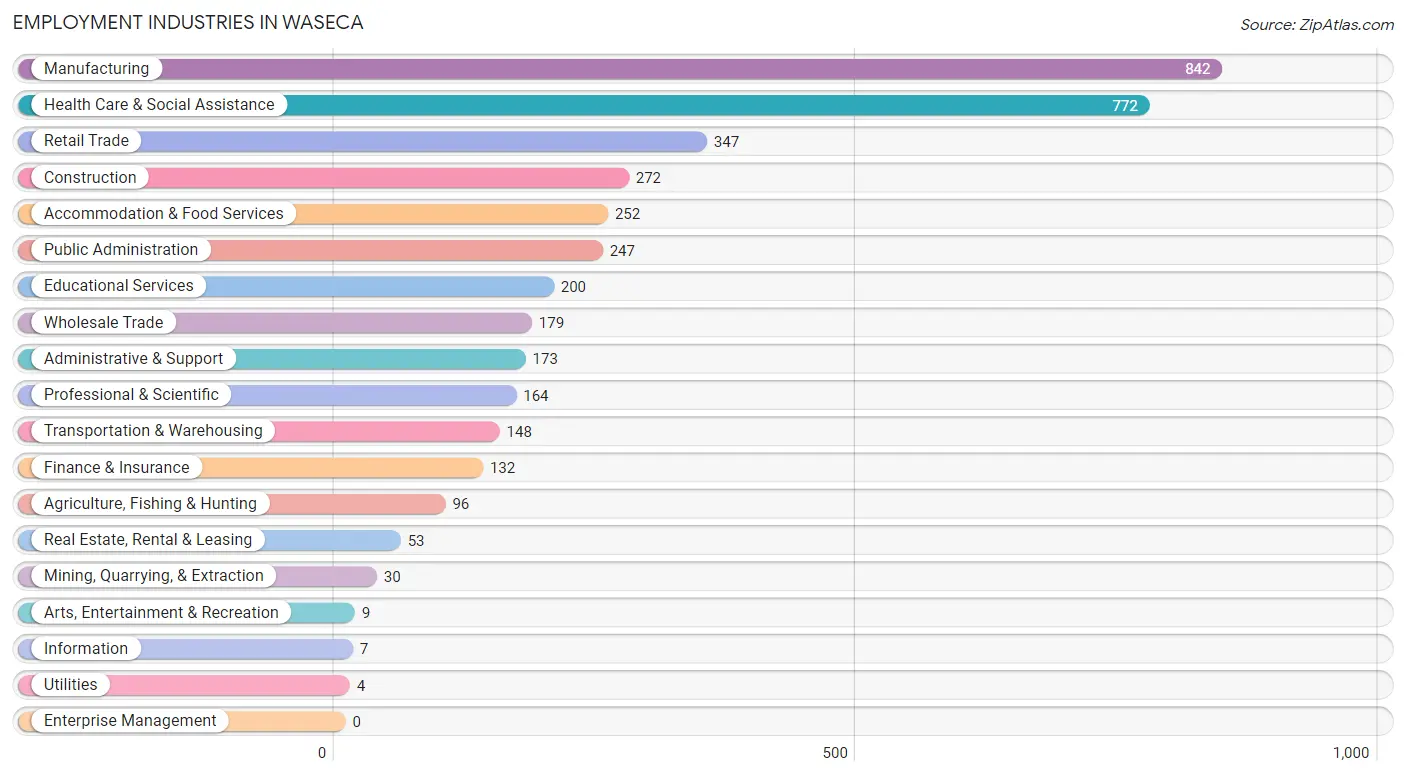
Employment Industries in Waseca
The major employment industries in Waseca include Manufacturing (842 | 20.6%), Health Care & Social Assistance (772 | 18.9%), Retail Trade (347 | 8.5%), Construction (272 | 6.7%), and Accommodation & Food Services (252 | 6.2%).
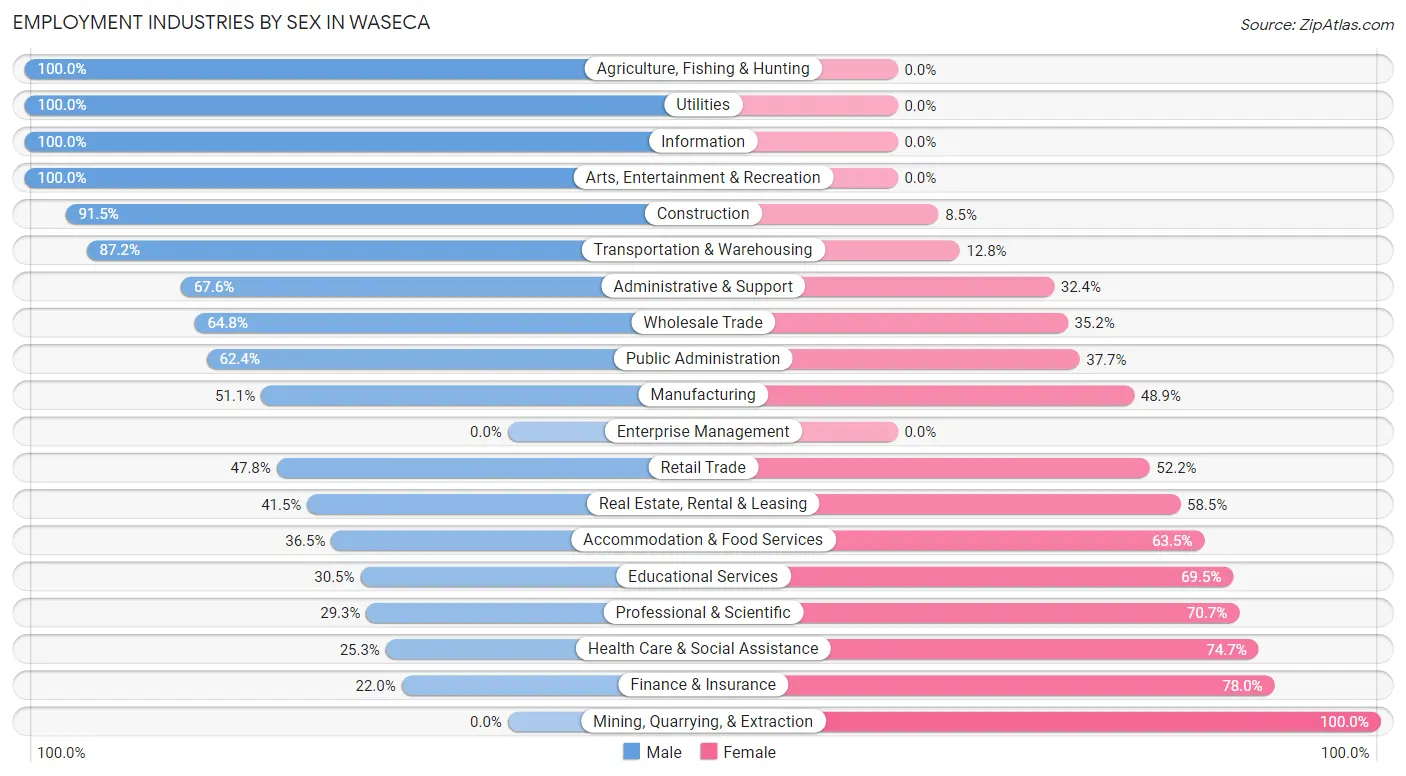
Employment Industries by Sex in Waseca
The Waseca industries that see more men than women are Agriculture, Fishing & Hunting (100.0%), Utilities (100.0%), and Information (100.0%), whereas the industries that tend to have a higher number of women are Mining, Quarrying, & Extraction (100.0%), Finance & Insurance (78.0%), and Health Care & Social Assistance (74.7%).
| Industry | Male | Female |
| Agriculture, Fishing & Hunting | 96 (100.0%) | 0 (0.0%) |
| Mining, Quarrying, & Extraction | 0 (0.0%) | 30 (100.0%) |
| Construction | 249 (91.5%) | 23 (8.5%) |
| Manufacturing | 430 (51.1%) | 412 (48.9%) |
| Wholesale Trade | 116 (64.8%) | 63 (35.2%) |
| Retail Trade | 166 (47.8%) | 181 (52.2%) |
| Transportation & Warehousing | 129 (87.2%) | 19 (12.8%) |
| Utilities | 4 (100.0%) | 0 (0.0%) |
| Information | 7 (100.0%) | 0 (0.0%) |
| Finance & Insurance | 29 (22.0%) | 103 (78.0%) |
| Real Estate, Rental & Leasing | 22 (41.5%) | 31 (58.5%) |
| Professional & Scientific | 48 (29.3%) | 116 (70.7%) |
| Enterprise Management | 0 (0.0%) | 0 (0.0%) |
| Administrative & Support | 117 (67.6%) | 56 (32.4%) |
| Educational Services | 61 (30.5%) | 139 (69.5%) |
| Health Care & Social Assistance | 195 (25.3%) | 577 (74.7%) |
| Arts, Entertainment & Recreation | 9 (100.0%) | 0 (0.0%) |
| Accommodation & Food Services | 92 (36.5%) | 160 (63.5%) |
| Public Administration | 154 (62.4%) | 93 (37.7%) |
| Total | 1,988 (48.7%) | 2,093 (51.3%) |
Education in Waseca
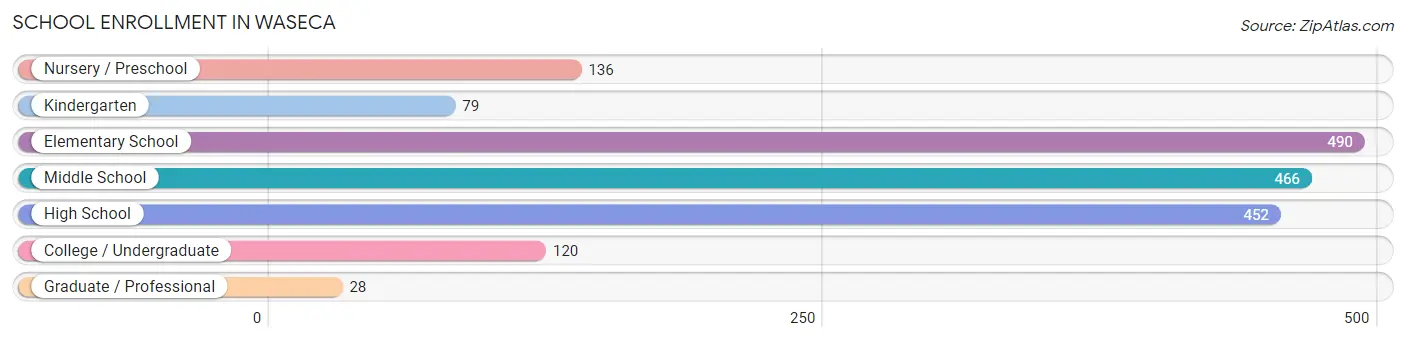
School Enrollment in Waseca
The most common levels of schooling among the 1,771 students in Waseca are elementary school (490 | 27.7%), middle school (466 | 26.3%), and high school (452 | 25.5%).
| School Level | # Students | % Students |
| Nursery / Preschool | 136 | 7.7% |
| Kindergarten | 79 | 4.5% |
| Elementary School | 490 | 27.7% |
| Middle School | 466 | 26.3% |
| High School | 452 | 25.5% |
| College / Undergraduate | 120 | 6.8% |
| Graduate / Professional | 28 | 1.6% |
| Total | 1,771 | 100.0% |
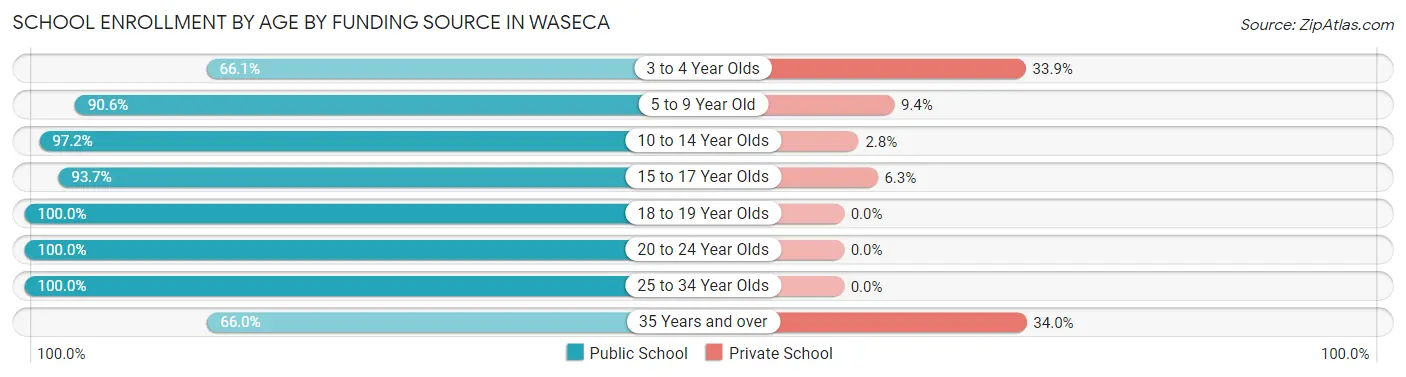
School Enrollment by Age by Funding Source in Waseca
Out of a total of 1,771 students who are enrolled in schools in Waseca, 128 (7.2%) attend a private institution, while the remaining 1,643 (92.8%) are enrolled in public schools. The age group of 35 years and over has the highest likelihood of being enrolled in private schools, with 16 (34.0% in the age bracket) enrolled. Conversely, the age group of 18 to 19 year olds has the lowest likelihood of being enrolled in a private school, with 72 (100.0% in the age bracket) attending a public institution.
| Age Bracket | Public School | Private School |
| 3 to 4 Year Olds | 39 (66.1%) | 20 (33.9%) |
| 5 to 9 Year Old | 551 (90.6%) | 57 (9.4%) |
| 10 to 14 Year Olds | 529 (97.2%) | 15 (2.8%) |
| 15 to 17 Year Olds | 283 (93.7%) | 19 (6.3%) |
| 18 to 19 Year Olds | 72 (100.0%) | 0 (0.0%) |
| 20 to 24 Year Olds | 57 (100.0%) | 0 (0.0%) |
| 25 to 34 Year Olds | 82 (100.0%) | 0 (0.0%) |
| 35 Years and over | 31 (66.0%) | 16 (34.0%) |
| Total | 1,643 (92.8%) | 128 (7.2%) |
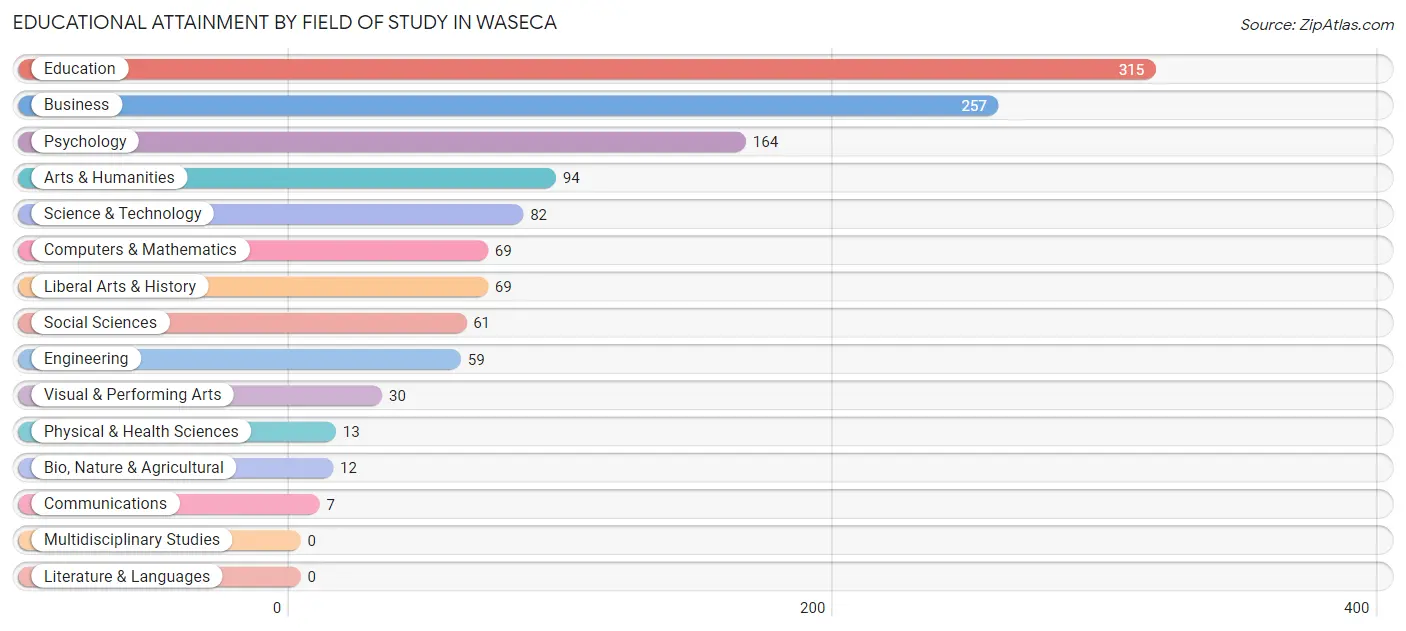
Educational Attainment by Field of Study in Waseca
Education (315 | 25.6%), business (257 | 20.9%), psychology (164 | 13.3%), arts & humanities (94 | 7.6%), and science & technology (82 | 6.7%) are the most common fields of study among 1,232 individuals in Waseca who have obtained a bachelor's degree or higher.
| Field of Study | # Graduates | % Graduates |
| Computers & Mathematics | 69 | 5.6% |
| Bio, Nature & Agricultural | 12 | 1.0% |
| Physical & Health Sciences | 13 | 1.1% |
| Psychology | 164 | 13.3% |
| Social Sciences | 61 | 5.0% |
| Engineering | 59 | 4.8% |
| Multidisciplinary Studies | 0 | 0.0% |
| Science & Technology | 82 | 6.7% |
| Business | 257 | 20.9% |
| Education | 315 | 25.6% |
| Literature & Languages | 0 | 0.0% |
| Liberal Arts & History | 69 | 5.6% |
| Visual & Performing Arts | 30 | 2.4% |
| Communications | 7 | 0.6% |
| Arts & Humanities | 94 | 7.6% |
| Total | 1,232 | 100.0% |
Transportation & Commute in Waseca
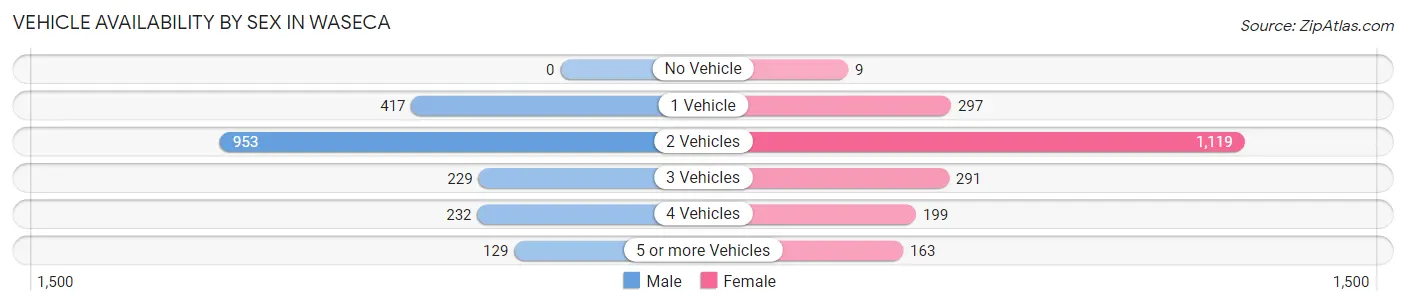
Vehicle Availability by Sex in Waseca
The most prevalent vehicle ownership categories in Waseca are males with 2 vehicles (953, accounting for 48.6%) and females with 2 vehicles (1,119, making up 45.9%).
| Vehicles Available | Male | Female |
| No Vehicle | 0 (0.0%) | 9 (0.4%) |
| 1 Vehicle | 417 (21.3%) | 297 (14.3%) |
| 2 Vehicles | 953 (48.6%) | 1,119 (53.8%) |
| 3 Vehicles | 229 (11.7%) | 291 (14.0%) |
| 4 Vehicles | 232 (11.8%) | 199 (9.6%) |
| 5 or more Vehicles | 129 (6.6%) | 163 (7.8%) |
| Total | 1,960 (100.0%) | 2,078 (100.0%) |
Commute Time in Waseca
The most frequently occuring commute durations in Waseca are 5 to 9 minutes (903 commuters, 22.8%), 10 to 14 minutes (525 commuters, 13.2%), and 20 to 24 minutes (494 commuters, 12.4%).
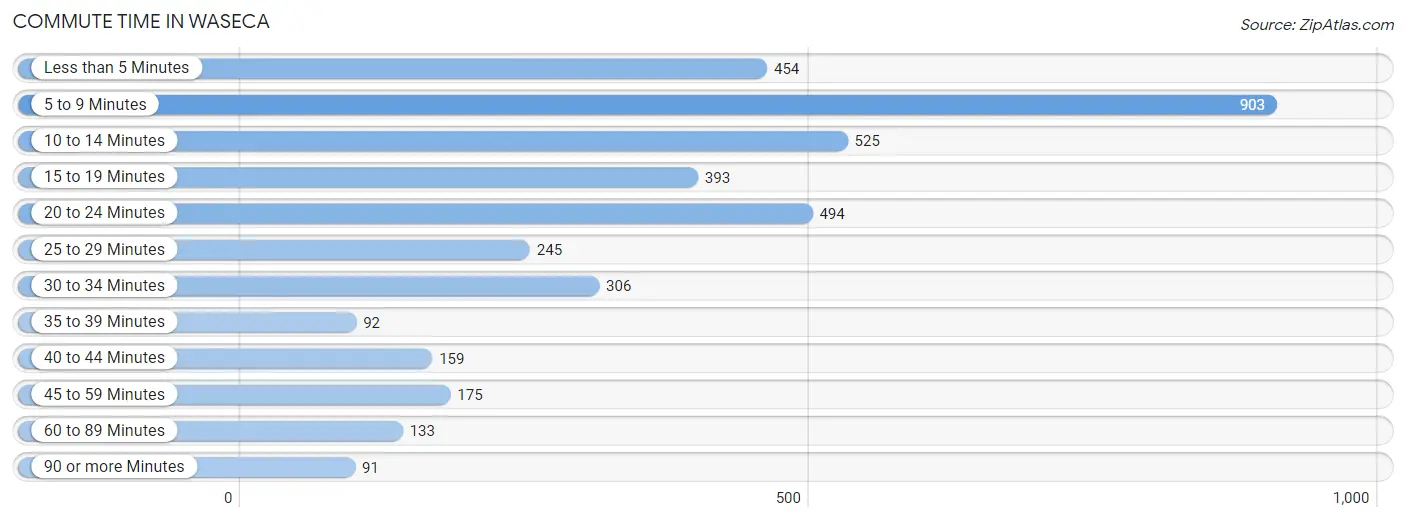
| Commute Time | # Commuters | % Commuters |
| Less than 5 Minutes | 454 | 11.4% |
| 5 to 9 Minutes | 903 | 22.8% |
| 10 to 14 Minutes | 525 | 13.2% |
| 15 to 19 Minutes | 393 | 9.9% |
| 20 to 24 Minutes | 494 | 12.4% |
| 25 to 29 Minutes | 245 | 6.2% |
| 30 to 34 Minutes | 306 | 7.7% |
| 35 to 39 Minutes | 92 | 2.3% |
| 40 to 44 Minutes | 159 | 4.0% |
| 45 to 59 Minutes | 175 | 4.4% |
| 60 to 89 Minutes | 133 | 3.4% |
| 90 or more Minutes | 91 | 2.3% |
Commute Time by Sex in Waseca
The most common commute times in Waseca are 5 to 9 minutes (409 commuters, 21.1%) for males and 5 to 9 minutes (494 commuters, 24.3%) for females.
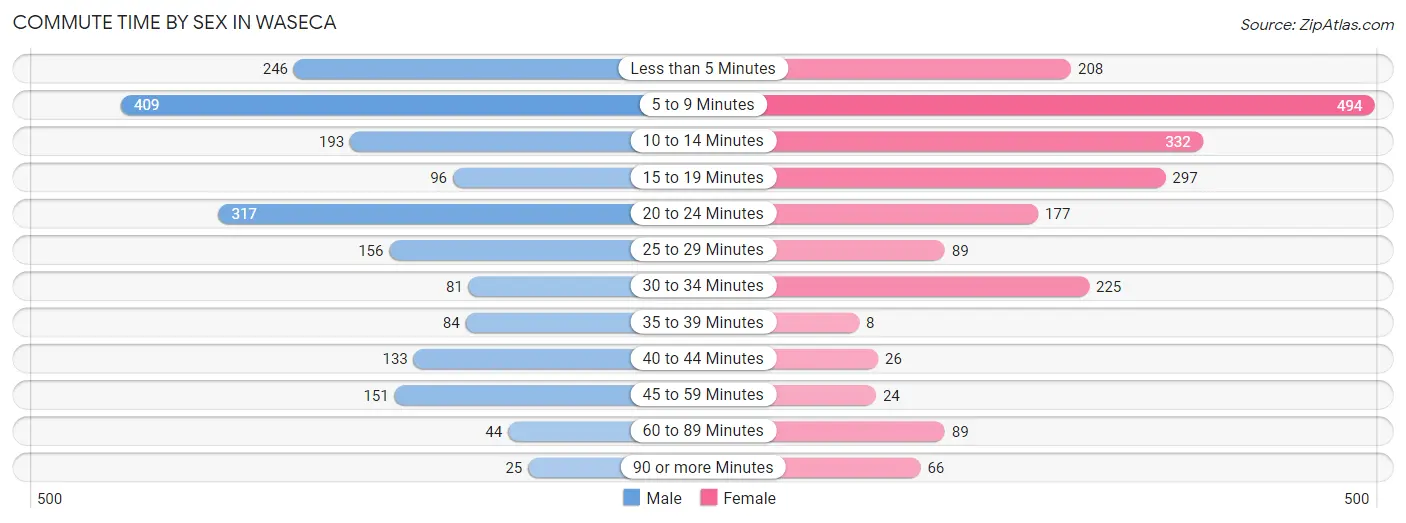
| Commute Time | Male | Female |
| Less than 5 Minutes | 246 (12.7%) | 208 (10.2%) |
| 5 to 9 Minutes | 409 (21.1%) | 494 (24.3%) |
| 10 to 14 Minutes | 193 (10.0%) | 332 (16.3%) |
| 15 to 19 Minutes | 96 (5.0%) | 297 (14.6%) |
| 20 to 24 Minutes | 317 (16.4%) | 177 (8.7%) |
| 25 to 29 Minutes | 156 (8.1%) | 89 (4.4%) |
| 30 to 34 Minutes | 81 (4.2%) | 225 (11.1%) |
| 35 to 39 Minutes | 84 (4.3%) | 8 (0.4%) |
| 40 to 44 Minutes | 133 (6.9%) | 26 (1.3%) |
| 45 to 59 Minutes | 151 (7.8%) | 24 (1.2%) |
| 60 to 89 Minutes | 44 (2.3%) | 89 (4.4%) |
| 90 or more Minutes | 25 (1.3%) | 66 (3.2%) |
Time of Departure to Work by Sex in Waseca
The most frequent times of departure to work in Waseca are 4:00 PM to 11:59 PM (374, 19.3%) for males and 7:00 AM to 7:29 AM (526, 25.9%) for females.
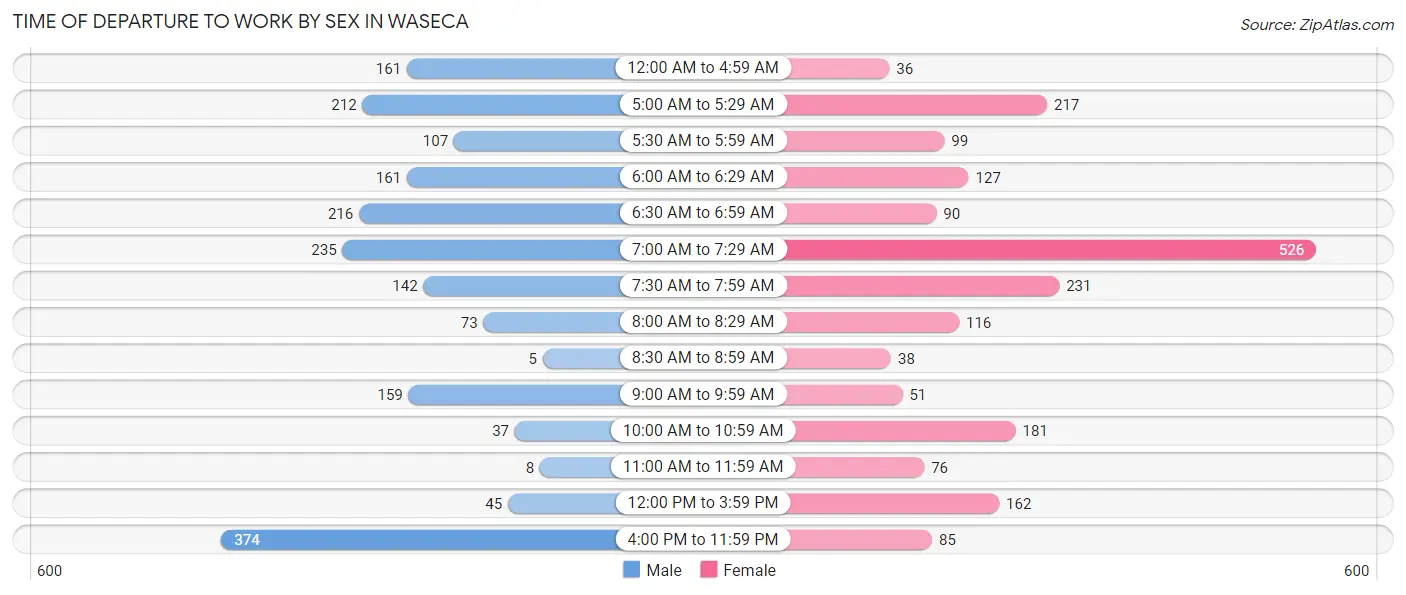
| Time of Departure | Male | Female |
| 12:00 AM to 4:59 AM | 161 (8.3%) | 36 (1.8%) |
| 5:00 AM to 5:29 AM | 212 (11.0%) | 217 (10.7%) |
| 5:30 AM to 5:59 AM | 107 (5.5%) | 99 (4.9%) |
| 6:00 AM to 6:29 AM | 161 (8.3%) | 127 (6.2%) |
| 6:30 AM to 6:59 AM | 216 (11.2%) | 90 (4.4%) |
| 7:00 AM to 7:29 AM | 235 (12.1%) | 526 (25.9%) |
| 7:30 AM to 7:59 AM | 142 (7.3%) | 231 (11.4%) |
| 8:00 AM to 8:29 AM | 73 (3.8%) | 116 (5.7%) |
| 8:30 AM to 8:59 AM | 5 (0.3%) | 38 (1.9%) |
| 9:00 AM to 9:59 AM | 159 (8.2%) | 51 (2.5%) |
| 10:00 AM to 10:59 AM | 37 (1.9%) | 181 (8.9%) |
| 11:00 AM to 11:59 AM | 8 (0.4%) | 76 (3.7%) |
| 12:00 PM to 3:59 PM | 45 (2.3%) | 162 (8.0%) |
| 4:00 PM to 11:59 PM | 374 (19.3%) | 85 (4.2%) |
| Total | 1,935 (100.0%) | 2,035 (100.0%) |
Housing Occupancy in Waseca
Occupancy by Ownership in Waseca
Of the total 3,584 dwellings in Waseca, owner-occupied units account for 2,690 (75.1%), while renter-occupied units make up 894 (24.9%).
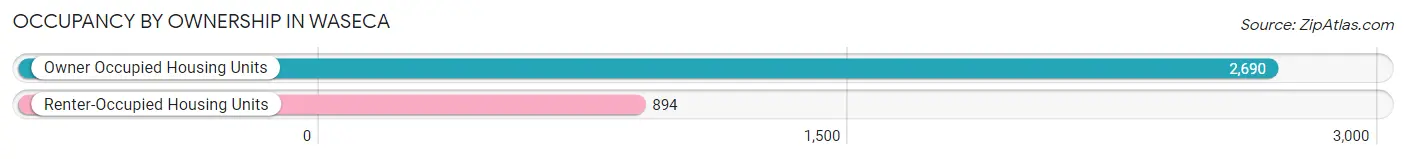
| Occupancy | # Housing Units | % Housing Units |
| Owner Occupied Housing Units | 2,690 | 75.1% |
| Renter-Occupied Housing Units | 894 | 24.9% |
| Total Occupied Housing Units | 3,584 | 100.0% |
Occupancy by Household Size in Waseca
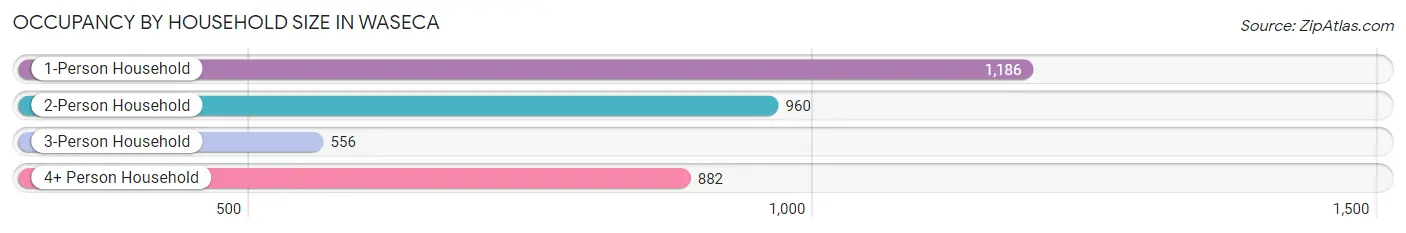
| Household Size | # Housing Units | % Housing Units |
| 1-Person Household | 1,186 | 33.1% |
| 2-Person Household | 960 | 26.8% |
| 3-Person Household | 556 | 15.5% |
| 4+ Person Household | 882 | 24.6% |
| Total Housing Units | 3,584 | 100.0% |
Occupancy by Ownership by Household Size in Waseca
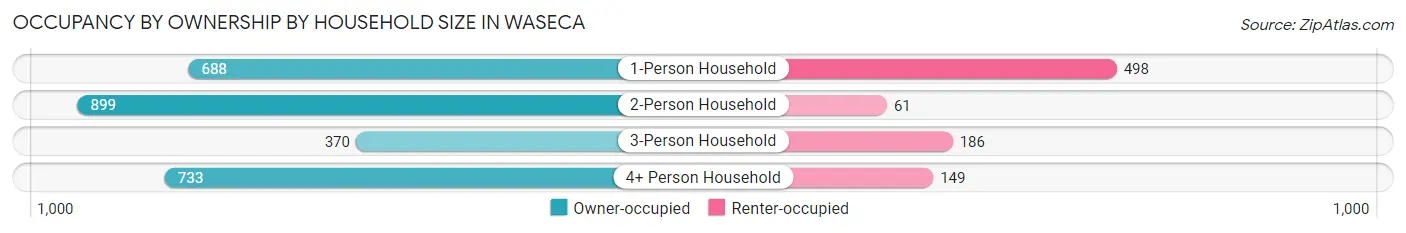
| Household Size | Owner-occupied | Renter-occupied |
| 1-Person Household | 688 (58.0%) | 498 (42.0%) |
| 2-Person Household | 899 (93.6%) | 61 (6.4%) |
| 3-Person Household | 370 (66.5%) | 186 (33.5%) |
| 4+ Person Household | 733 (83.1%) | 149 (16.9%) |
| Total Housing Units | 2,690 (75.1%) | 894 (24.9%) |
Occupancy by Educational Attainment in Waseca
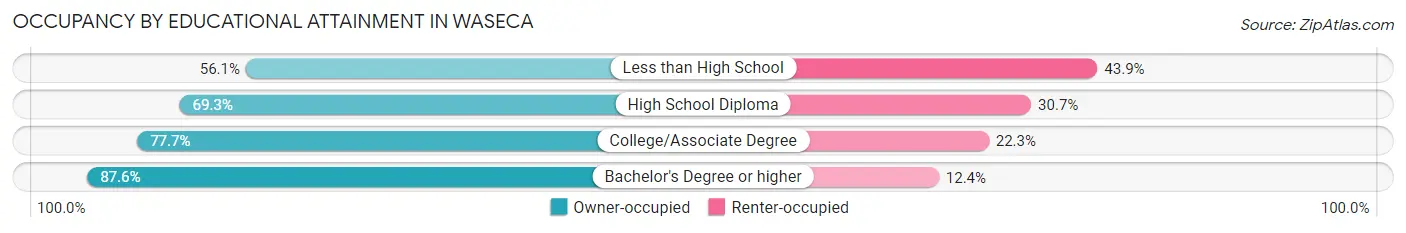
| Household Size | Owner-occupied | Renter-occupied |
| Less than High School | 96 (56.1%) | 75 (43.9%) |
| High School Diploma | 1,073 (69.3%) | 476 (30.7%) |
| College/Associate Degree | 873 (77.7%) | 251 (22.3%) |
| Bachelor's Degree or higher | 648 (87.6%) | 92 (12.4%) |
Occupancy by Age of Householder in Waseca
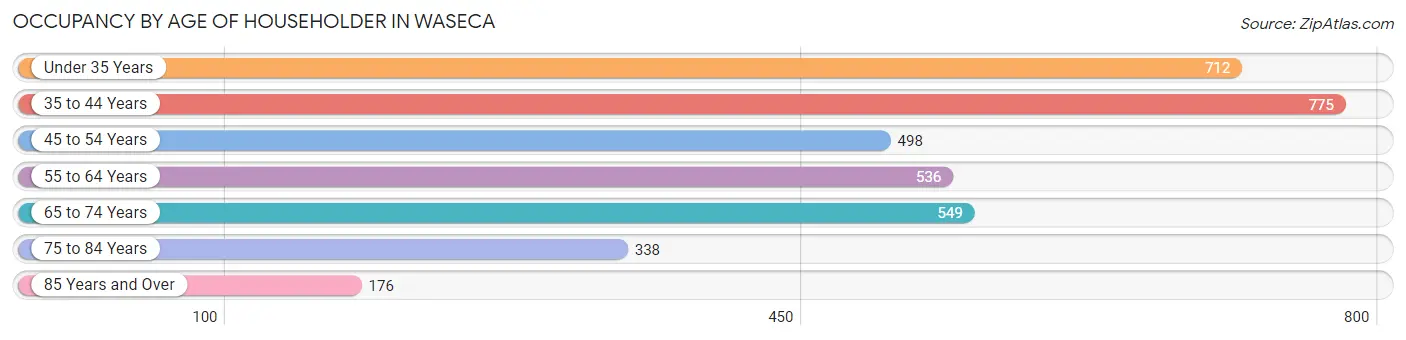
| Age Bracket | # Households | % Households |
| Under 35 Years | 712 | 19.9% |
| 35 to 44 Years | 775 | 21.6% |
| 45 to 54 Years | 498 | 13.9% |
| 55 to 64 Years | 536 | 15.0% |
| 65 to 74 Years | 549 | 15.3% |
| 75 to 84 Years | 338 | 9.4% |
| 85 Years and Over | 176 | 4.9% |
| Total | 3,584 | 100.0% |
Housing Finances in Waseca
Median Income by Occupancy in Waseca
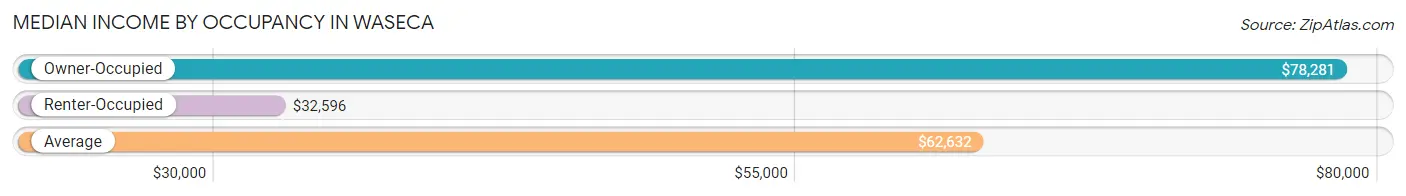
| Occupancy Type | # Households | Median Income |
| Owner-Occupied | 2,690 (75.1%) | $78,281 |
| Renter-Occupied | 894 (24.9%) | $32,596 |
| Average | 3,584 (100.0%) | $62,632 |
Occupancy by Householder Income Bracket in Waseca
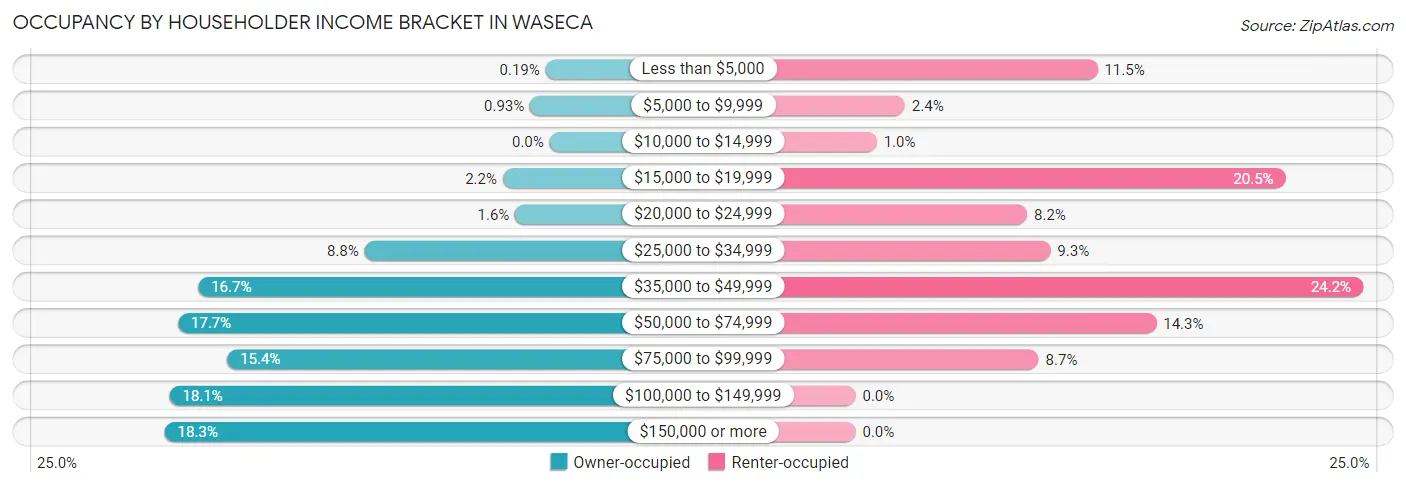
| Income Bracket | Owner-occupied | Renter-occupied |
| Less than $5,000 | 5 (0.2%) | 103 (11.5%) |
| $5,000 to $9,999 | 25 (0.9%) | 21 (2.4%) |
| $10,000 to $14,999 | 0 (0.0%) | 9 (1.0%) |
| $15,000 to $19,999 | 60 (2.2%) | 183 (20.5%) |
| $20,000 to $24,999 | 44 (1.6%) | 73 (8.2%) |
| $25,000 to $34,999 | 237 (8.8%) | 83 (9.3%) |
| $35,000 to $49,999 | 450 (16.7%) | 216 (24.2%) |
| $50,000 to $74,999 | 476 (17.7%) | 128 (14.3%) |
| $75,000 to $99,999 | 413 (15.3%) | 78 (8.7%) |
| $100,000 to $149,999 | 487 (18.1%) | 0 (0.0%) |
| $150,000 or more | 493 (18.3%) | 0 (0.0%) |
| Total | 2,690 (100.0%) | 894 (100.0%) |
Monthly Housing Cost Tiers in Waseca
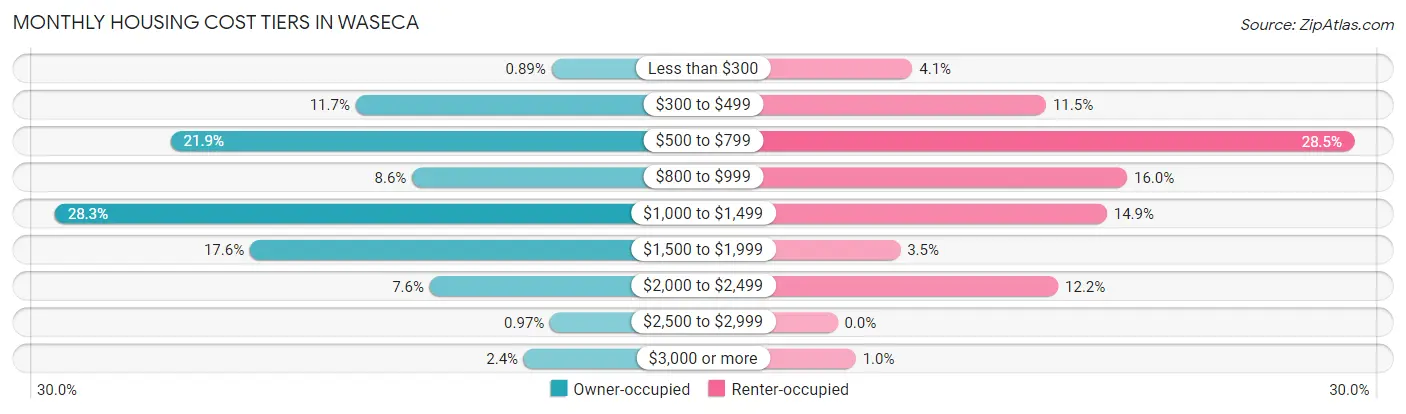
| Monthly Cost | Owner-occupied | Renter-occupied |
| Less than $300 | 24 (0.9%) | 37 (4.1%) |
| $300 to $499 | 315 (11.7%) | 103 (11.5%) |
| $500 to $799 | 590 (21.9%) | 255 (28.5%) |
| $800 to $999 | 231 (8.6%) | 143 (16.0%) |
| $1,000 to $1,499 | 762 (28.3%) | 133 (14.9%) |
| $1,500 to $1,999 | 472 (17.5%) | 31 (3.5%) |
| $2,000 to $2,499 | 205 (7.6%) | 109 (12.2%) |
| $2,500 to $2,999 | 26 (1.0%) | 0 (0.0%) |
| $3,000 or more | 65 (2.4%) | 9 (1.0%) |
| Total | 2,690 (100.0%) | 894 (100.0%) |
Physical Housing Characteristics in Waseca
Housing Structures in Waseca
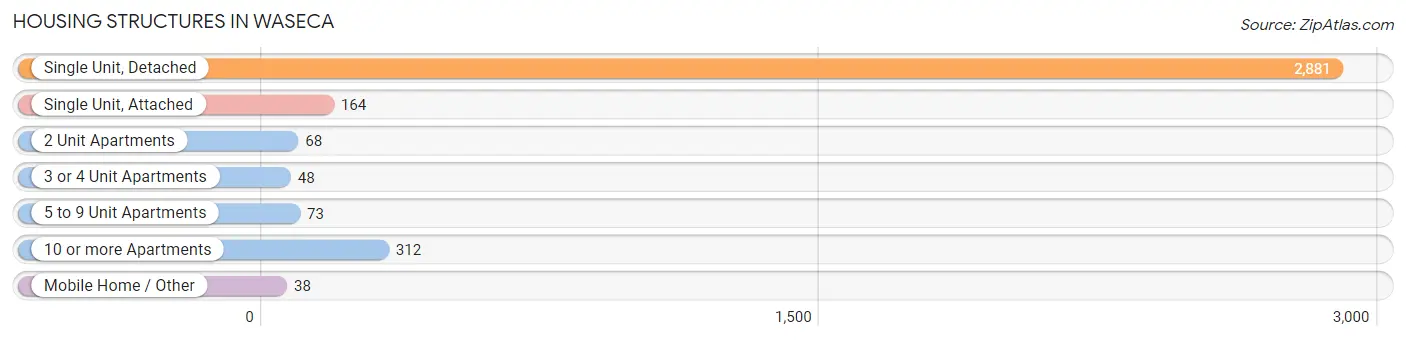
| Structure Type | # Housing Units | % Housing Units |
| Single Unit, Detached | 2,881 | 80.4% |
| Single Unit, Attached | 164 | 4.6% |
| 2 Unit Apartments | 68 | 1.9% |
| 3 or 4 Unit Apartments | 48 | 1.3% |
| 5 to 9 Unit Apartments | 73 | 2.0% |
| 10 or more Apartments | 312 | 8.7% |
| Mobile Home / Other | 38 | 1.1% |
| Total | 3,584 | 100.0% |
Housing Structures by Occupancy in Waseca
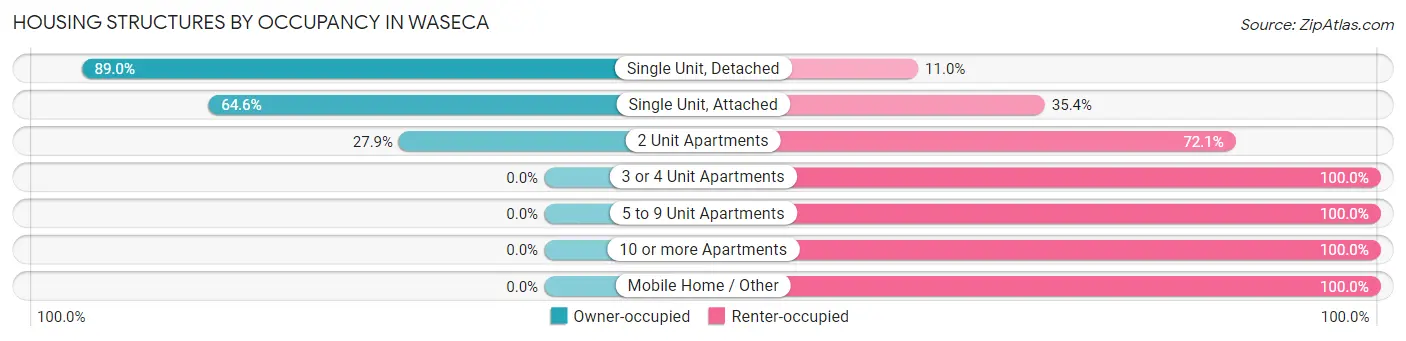
| Structure Type | Owner-occupied | Renter-occupied |
| Single Unit, Detached | 2,565 (89.0%) | 316 (11.0%) |
| Single Unit, Attached | 106 (64.6%) | 58 (35.4%) |
| 2 Unit Apartments | 19 (27.9%) | 49 (72.1%) |
| 3 or 4 Unit Apartments | 0 (0.0%) | 48 (100.0%) |
| 5 to 9 Unit Apartments | 0 (0.0%) | 73 (100.0%) |
| 10 or more Apartments | 0 (0.0%) | 312 (100.0%) |
| Mobile Home / Other | 0 (0.0%) | 38 (100.0%) |
| Total | 2,690 (75.1%) | 894 (24.9%) |
Housing Structures by Number of Rooms in Waseca
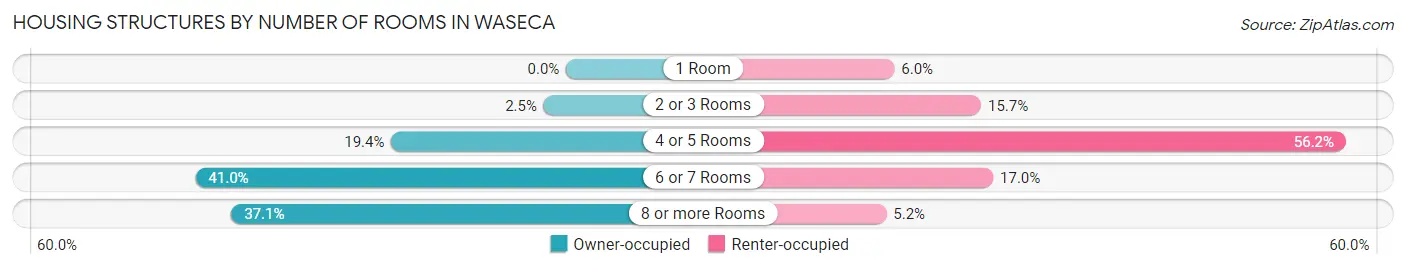
| Number of Rooms | Owner-occupied | Renter-occupied |
| 1 Room | 0 (0.0%) | 54 (6.0%) |
| 2 or 3 Rooms | 67 (2.5%) | 140 (15.7%) |
| 4 or 5 Rooms | 522 (19.4%) | 502 (56.1%) |
| 6 or 7 Rooms | 1,104 (41.0%) | 152 (17.0%) |
| 8 or more Rooms | 997 (37.1%) | 46 (5.1%) |
| Total | 2,690 (100.0%) | 894 (100.0%) |
Housing Structure by Heating Type in Waseca
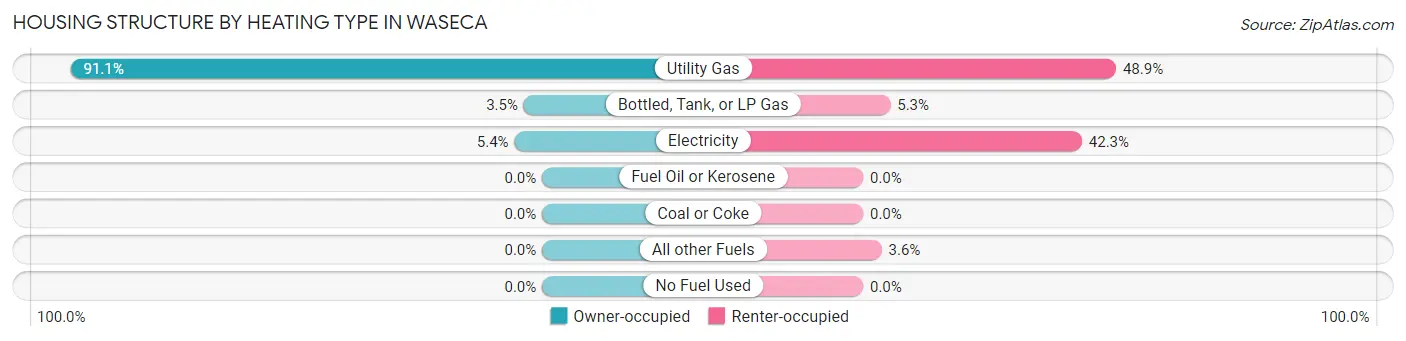
| Heating Type | Owner-occupied | Renter-occupied |
| Utility Gas | 2,451 (91.1%) | 437 (48.9%) |
| Bottled, Tank, or LP Gas | 95 (3.5%) | 47 (5.3%) |
| Electricity | 144 (5.3%) | 378 (42.3%) |
| Fuel Oil or Kerosene | 0 (0.0%) | 0 (0.0%) |
| Coal or Coke | 0 (0.0%) | 0 (0.0%) |
| All other Fuels | 0 (0.0%) | 32 (3.6%) |
| No Fuel Used | 0 (0.0%) | 0 (0.0%) |
| Total | 2,690 (100.0%) | 894 (100.0%) |
Household Vehicle Usage in Waseca
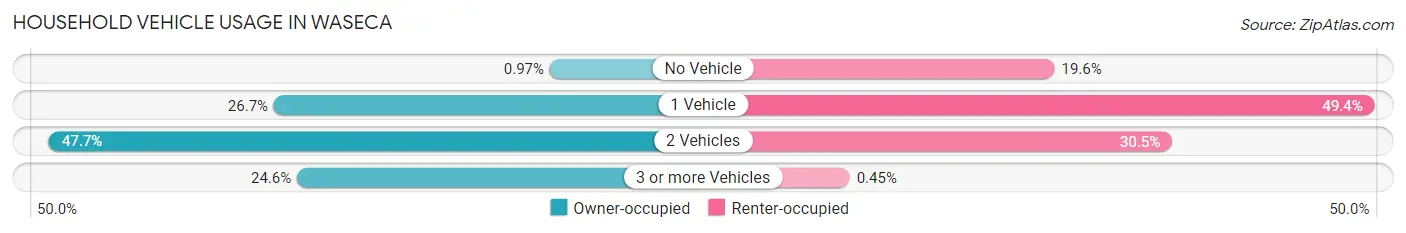
| Vehicles per Household | Owner-occupied | Renter-occupied |
| No Vehicle | 26 (1.0%) | 175 (19.6%) |
| 1 Vehicle | 719 (26.7%) | 442 (49.4%) |
| 2 Vehicles | 1,284 (47.7%) | 273 (30.5%) |
| 3 or more Vehicles | 661 (24.6%) | 4 (0.4%) |
| Total | 2,690 (100.0%) | 894 (100.0%) |
Real Estate & Mortgages in Waseca
Real Estate and Mortgage Overview in Waseca
| Characteristic | Without Mortgage | With Mortgage |
| Housing Units | 885 | 1,805 |
| Median Property Value | $152,200 | $186,600 |
| Median Household Income | $69,609 | $389 |
| Monthly Housing Costs | $594 | $65 |
| Real Estate Taxes | $2,233 | $0 |
Property Value by Mortgage Status in Waseca
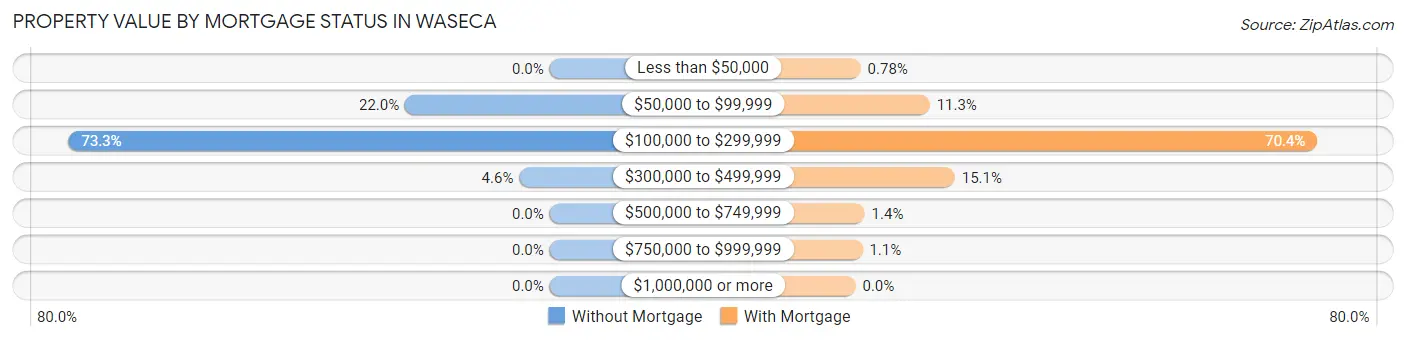
| Property Value | Without Mortgage | With Mortgage |
| Less than $50,000 | 0 (0.0%) | 14 (0.8%) |
| $50,000 to $99,999 | 195 (22.0%) | 204 (11.3%) |
| $100,000 to $299,999 | 649 (73.3%) | 1,270 (70.4%) |
| $300,000 to $499,999 | 41 (4.6%) | 273 (15.1%) |
| $500,000 to $749,999 | 0 (0.0%) | 25 (1.4%) |
| $750,000 to $999,999 | 0 (0.0%) | 19 (1.1%) |
| $1,000,000 or more | 0 (0.0%) | 0 (0.0%) |
| Total | 885 (100.0%) | 1,805 (100.0%) |
Household Income by Mortgage Status in Waseca
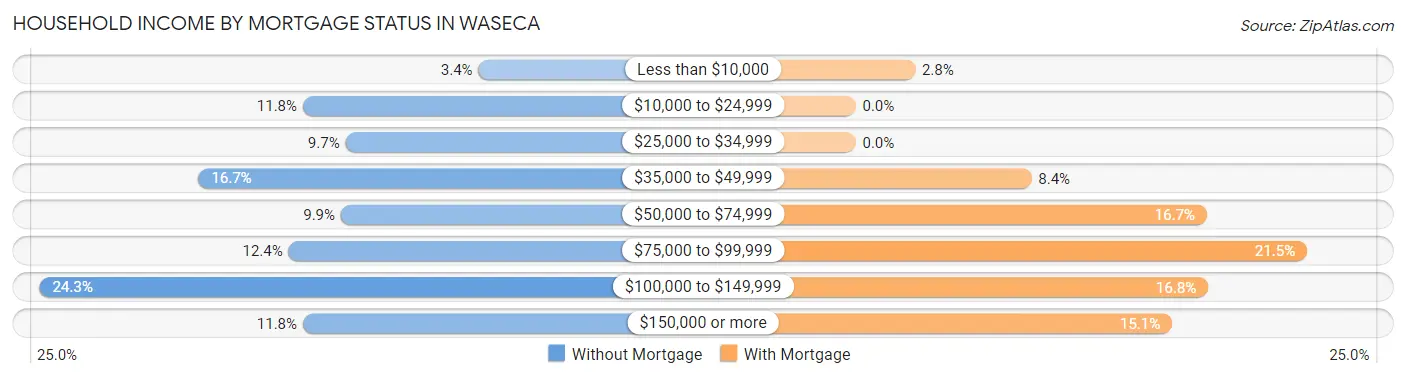
| Household Income | Without Mortgage | With Mortgage |
| Less than $10,000 | 30 (3.4%) | 51 (2.8%) |
| $10,000 to $24,999 | 104 (11.7%) | 0 (0.0%) |
| $25,000 to $34,999 | 86 (9.7%) | 0 (0.0%) |
| $35,000 to $49,999 | 148 (16.7%) | 151 (8.4%) |
| $50,000 to $74,999 | 88 (9.9%) | 302 (16.7%) |
| $75,000 to $99,999 | 110 (12.4%) | 388 (21.5%) |
| $100,000 to $149,999 | 215 (24.3%) | 303 (16.8%) |
| $150,000 or more | 104 (11.7%) | 272 (15.1%) |
| Total | 885 (100.0%) | 1,805 (100.0%) |
Property Value to Household Income Ratio in Waseca
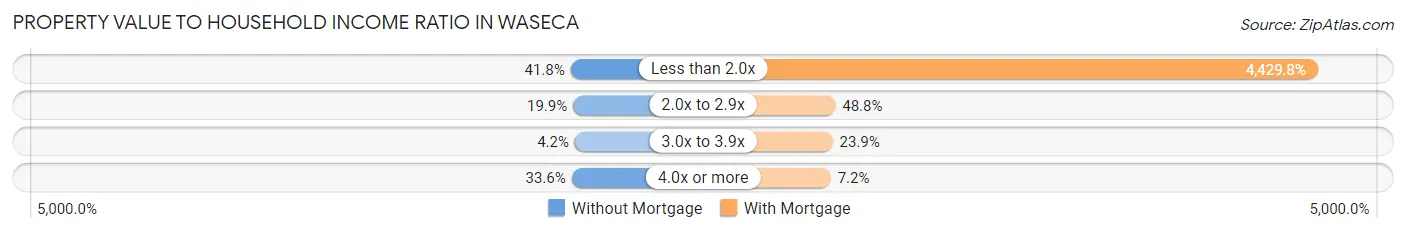
| Value-to-Income Ratio | Without Mortgage | With Mortgage |
| Less than 2.0x | 370 (41.8%) | 79,957 (4,429.7%) |
| 2.0x to 2.9x | 176 (19.9%) | 880 (48.7%) |
| 3.0x to 3.9x | 37 (4.2%) | 431 (23.9%) |
| 4.0x or more | 297 (33.6%) | 129 (7.1%) |
| Total | 885 (100.0%) | 1,805 (100.0%) |
Real Estate Taxes by Mortgage Status in Waseca
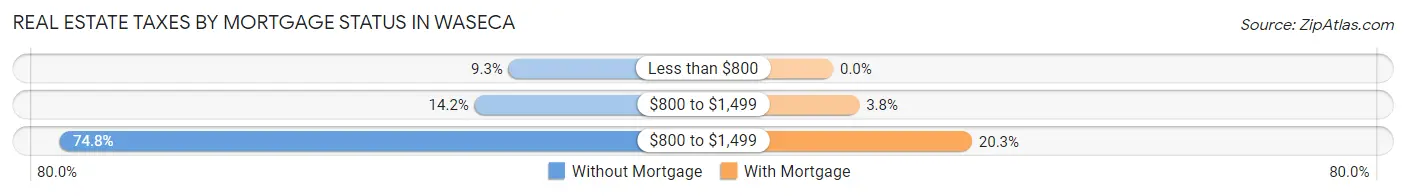
| Property Taxes | Without Mortgage | With Mortgage |
| Less than $800 | 82 (9.3%) | 0 (0.0%) |
| $800 to $1,499 | 126 (14.2%) | 69 (3.8%) |
| $800 to $1,499 | 662 (74.8%) | 366 (20.3%) |
| Total | 885 (100.0%) | 1,805 (100.0%) |
Health & Disability in Waseca
Health Insurance Coverage by Age in Waseca
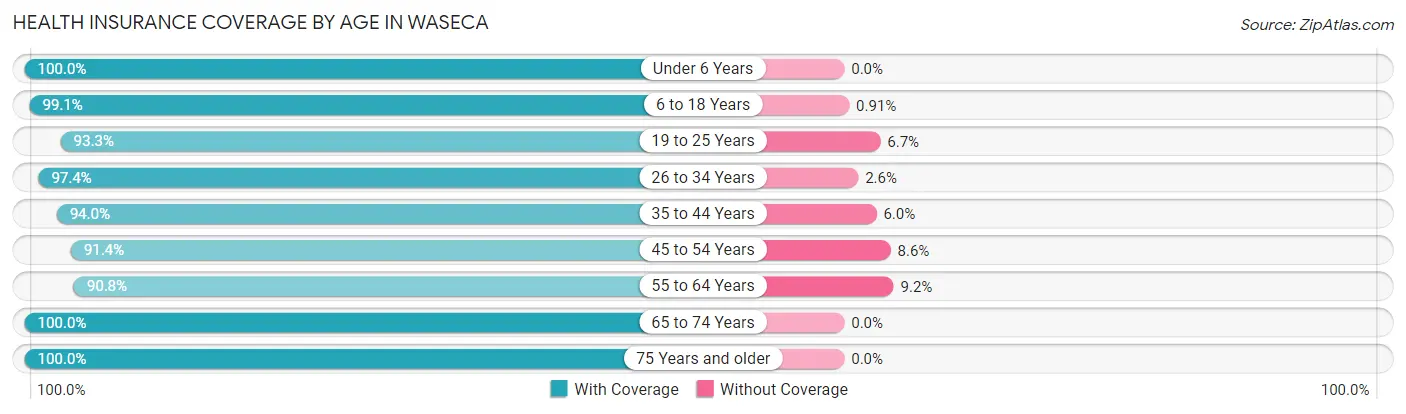
| Age Bracket | With Coverage | Without Coverage |
| Under 6 Years | 854 (100.0%) | 0 (0.0%) |
| 6 to 18 Years | 1,410 (99.1%) | 13 (0.9%) |
| 19 to 25 Years | 569 (93.3%) | 41 (6.7%) |
| 26 to 34 Years | 904 (97.4%) | 24 (2.6%) |
| 35 to 44 Years | 1,174 (94.0%) | 75 (6.0%) |
| 45 to 54 Years | 900 (91.4%) | 85 (8.6%) |
| 55 to 64 Years | 899 (90.8%) | 91 (9.2%) |
| 65 to 74 Years | 781 (100.0%) | 0 (0.0%) |
| 75 Years and older | 703 (100.0%) | 0 (0.0%) |
| Total | 8,194 (96.1%) | 329 (3.9%) |
Health Insurance Coverage by Citizenship Status in Waseca
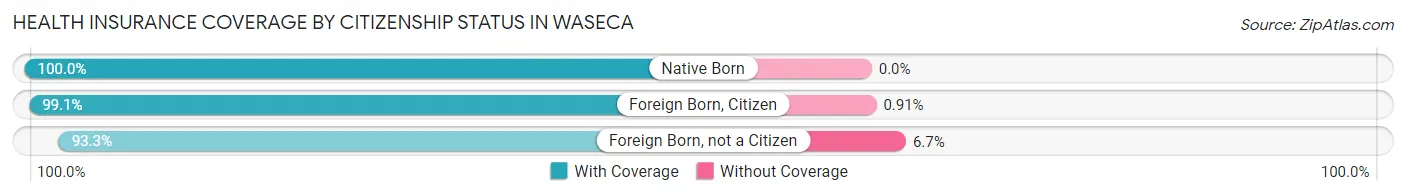
| Citizenship Status | With Coverage | Without Coverage |
| Native Born | 854 (100.0%) | 0 (0.0%) |
| Foreign Born, Citizen | 1,410 (99.1%) | 13 (0.9%) |
| Foreign Born, not a Citizen | 569 (93.3%) | 41 (6.7%) |
Health Insurance Coverage by Household Income in Waseca
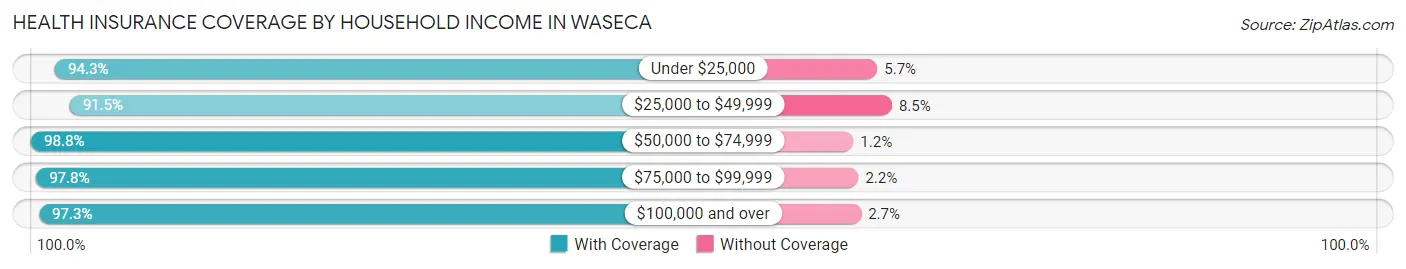
| Household Income | With Coverage | Without Coverage |
| Under $25,000 | 675 (94.3%) | 41 (5.7%) |
| $25,000 to $49,999 | 1,689 (91.5%) | 156 (8.5%) |
| $50,000 to $74,999 | 1,357 (98.8%) | 17 (1.2%) |
| $75,000 to $99,999 | 1,205 (97.8%) | 27 (2.2%) |
| $100,000 and over | 3,174 (97.3%) | 88 (2.7%) |
Public vs Private Health Insurance Coverage by Age in Waseca
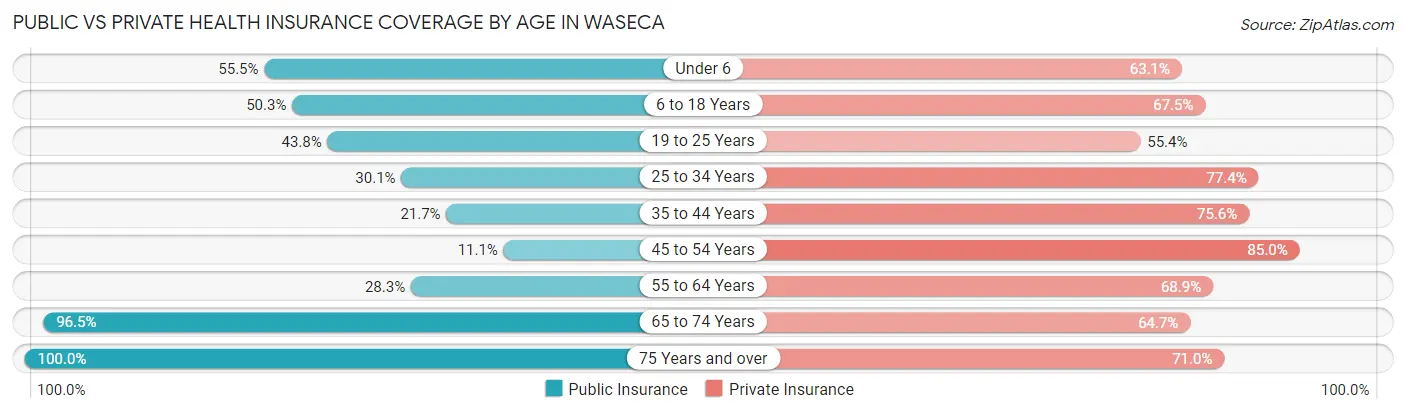
| Age Bracket | Public Insurance | Private Insurance |
| Under 6 | 474 (55.5%) | 539 (63.1%) |
| 6 to 18 Years | 716 (50.3%) | 960 (67.5%) |
| 19 to 25 Years | 267 (43.8%) | 338 (55.4%) |
| 25 to 34 Years | 279 (30.1%) | 718 (77.4%) |
| 35 to 44 Years | 271 (21.7%) | 944 (75.6%) |
| 45 to 54 Years | 109 (11.1%) | 837 (85.0%) |
| 55 to 64 Years | 280 (28.3%) | 682 (68.9%) |
| 65 to 74 Years | 754 (96.5%) | 505 (64.7%) |
| 75 Years and over | 703 (100.0%) | 499 (71.0%) |
| Total | 3,853 (45.2%) | 6,022 (70.7%) |
Disability Status by Sex by Age in Waseca
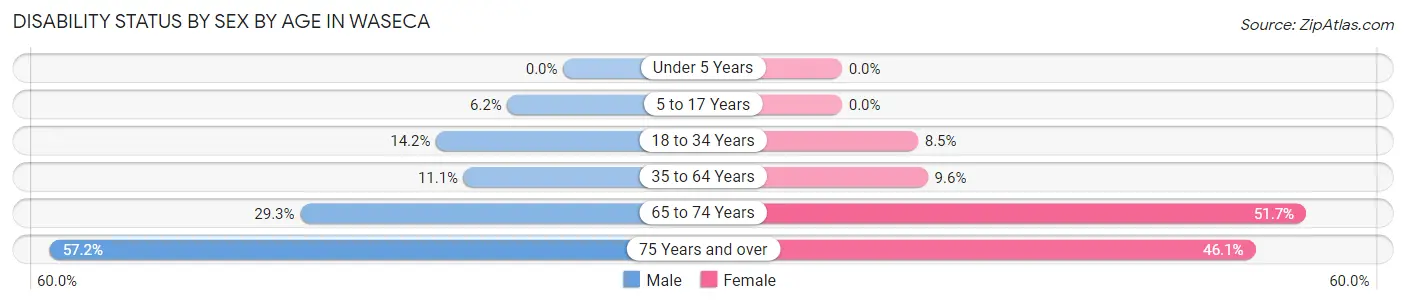
| Age Bracket | Male | Female |
| Under 5 Years | 0 (0.0%) | 0 (0.0%) |
| 5 to 17 Years | 49 (6.2%) | 0 (0.0%) |
| 18 to 34 Years | 102 (14.1%) | 72 (8.5%) |
| 35 to 64 Years | 175 (11.1%) | 157 (9.6%) |
| 65 to 74 Years | 99 (29.3%) | 229 (51.7%) |
| 75 Years and over | 155 (57.2%) | 199 (46.1%) |
Disability Class by Sex by Age in Waseca
Disability Class: Hearing Difficulty
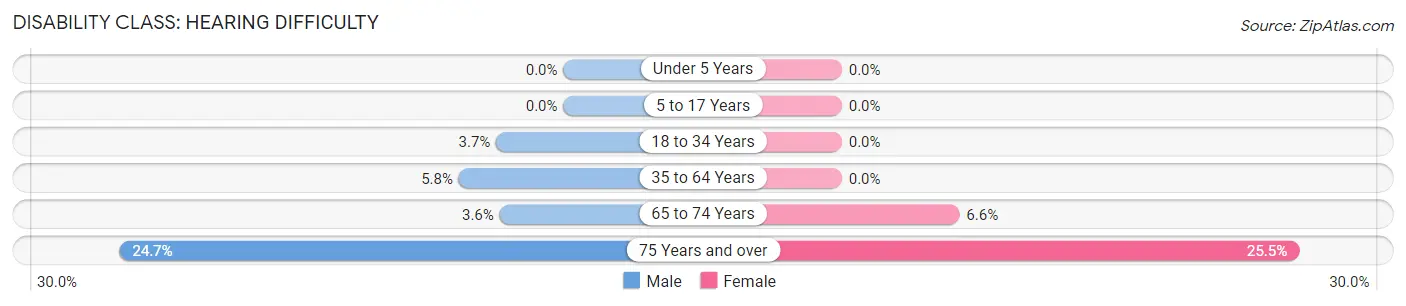
| Age Bracket | Male | Female |
| Under 5 Years | 0 (0.0%) | 0 (0.0%) |
| 5 to 17 Years | 0 (0.0%) | 0 (0.0%) |
| 18 to 34 Years | 27 (3.7%) | 0 (0.0%) |
| 35 to 64 Years | 92 (5.8%) | 0 (0.0%) |
| 65 to 74 Years | 12 (3.5%) | 29 (6.6%) |
| 75 Years and over | 67 (24.7%) | 110 (25.5%) |
Disability Class: Vision Difficulty
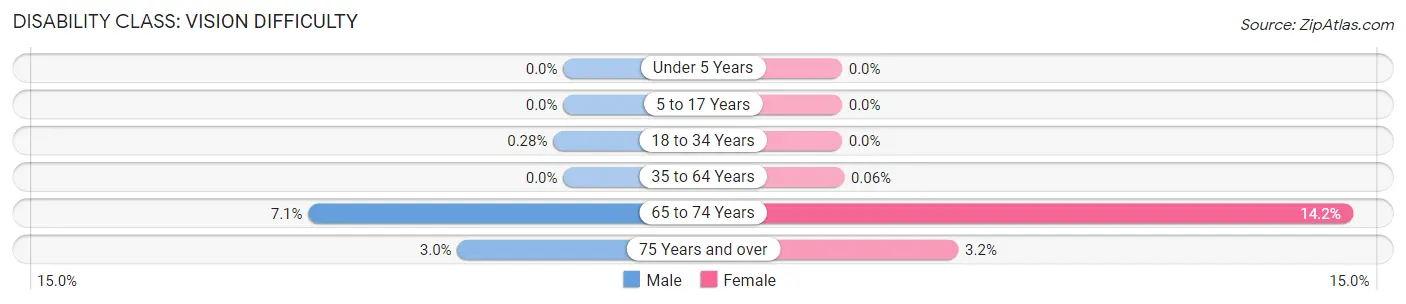
| Age Bracket | Male | Female |
| Under 5 Years | 0 (0.0%) | 0 (0.0%) |
| 5 to 17 Years | 0 (0.0%) | 0 (0.0%) |
| 18 to 34 Years | 2 (0.3%) | 0 (0.0%) |
| 35 to 64 Years | 0 (0.0%) | 1 (0.1%) |
| 65 to 74 Years | 24 (7.1%) | 63 (14.2%) |
| 75 Years and over | 8 (2.9%) | 14 (3.2%) |
Disability Class: Cognitive Difficulty
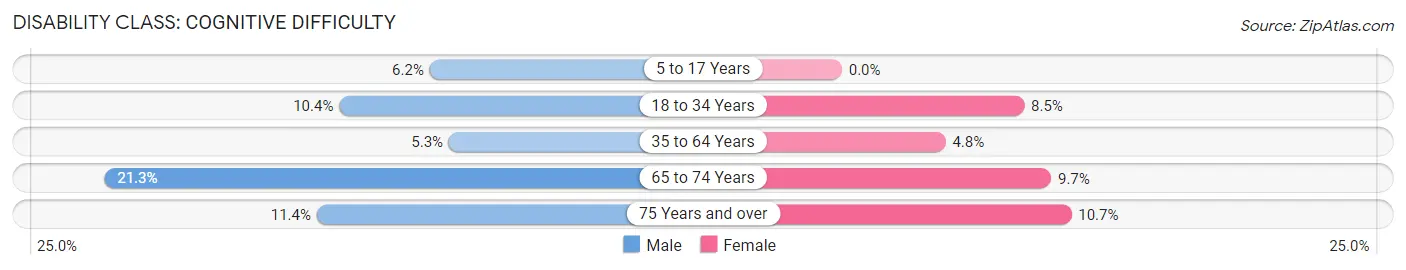
| Age Bracket | Male | Female |
| 5 to 17 Years | 49 (6.2%) | 0 (0.0%) |
| 18 to 34 Years | 75 (10.4%) | 72 (8.5%) |
| 35 to 64 Years | 84 (5.3%) | 79 (4.8%) |
| 65 to 74 Years | 72 (21.3%) | 43 (9.7%) |
| 75 Years and over | 31 (11.4%) | 46 (10.6%) |
Disability Class: Ambulatory Difficulty
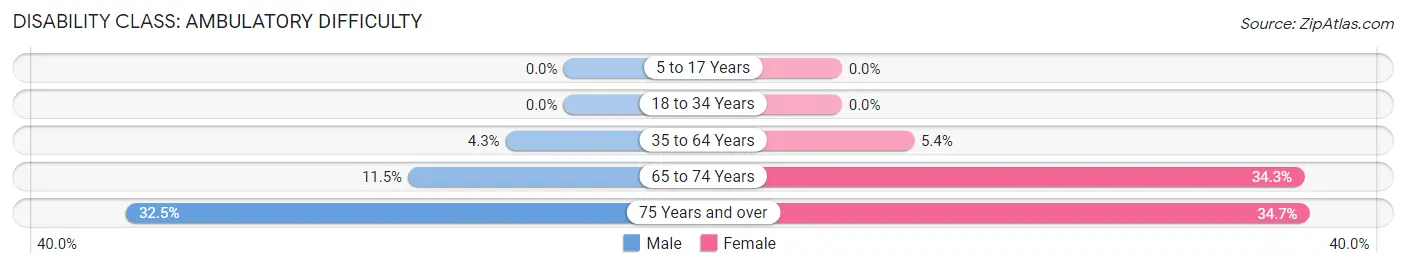
| Age Bracket | Male | Female |
| 5 to 17 Years | 0 (0.0%) | 0 (0.0%) |
| 18 to 34 Years | 0 (0.0%) | 0 (0.0%) |
| 35 to 64 Years | 68 (4.3%) | 88 (5.4%) |
| 65 to 74 Years | 39 (11.5%) | 152 (34.3%) |
| 75 Years and over | 88 (32.5%) | 150 (34.7%) |
Disability Class: Self-Care Difficulty
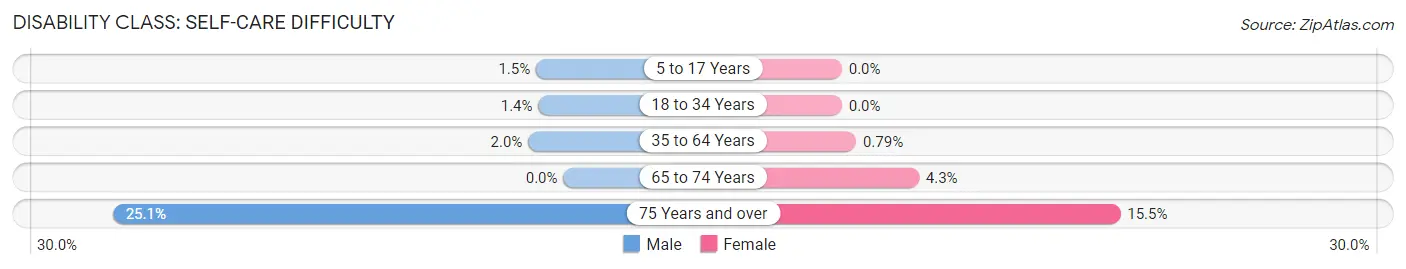
| Age Bracket | Male | Female |
| 5 to 17 Years | 12 (1.5%) | 0 (0.0%) |
| 18 to 34 Years | 10 (1.4%) | 0 (0.0%) |
| 35 to 64 Years | 31 (2.0%) | 13 (0.8%) |
| 65 to 74 Years | 0 (0.0%) | 19 (4.3%) |
| 75 Years and over | 68 (25.1%) | 67 (15.5%) |
Technology Access in Waseca
Computing Device Access in Waseca
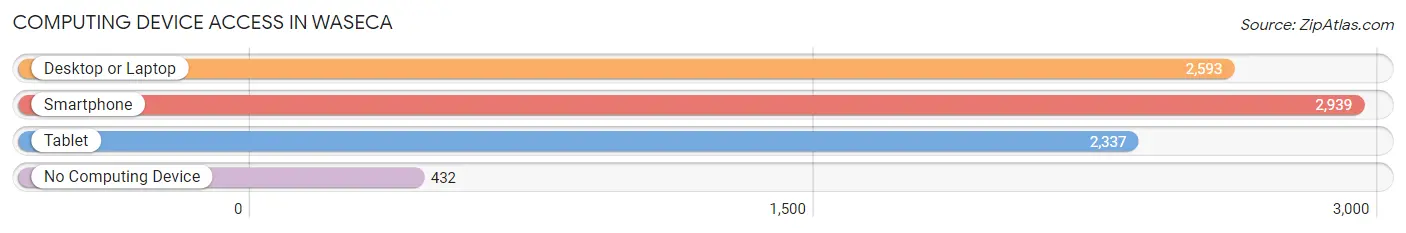
| Device Type | # Households | % Households |
| Desktop or Laptop | 2,593 | 72.4% |
| Smartphone | 2,939 | 82.0% |
| Tablet | 2,337 | 65.2% |
| No Computing Device | 432 | 12.0% |
| Total | 3,584 | 100.0% |
Internet Access in Waseca
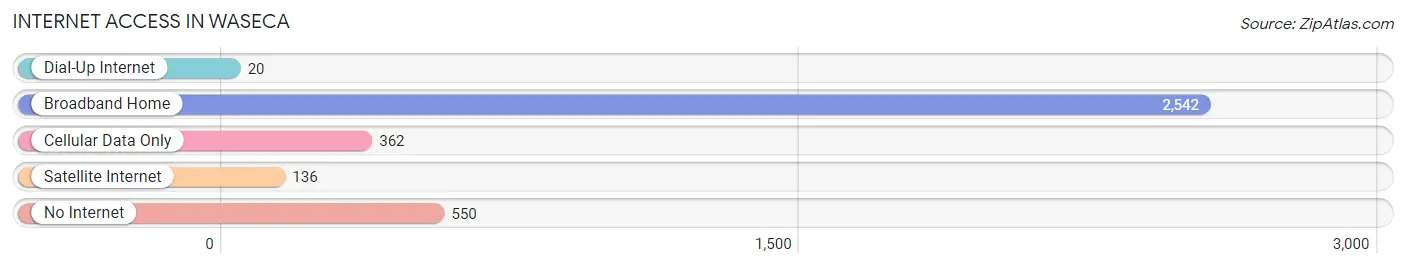
| Internet Type | # Households | % Households |
| Dial-Up Internet | 20 | 0.6% |
| Broadband Home | 2,542 | 70.9% |
| Cellular Data Only | 362 | 10.1% |
| Satellite Internet | 136 | 3.8% |
| No Internet | 550 | 15.3% |
| Total | 3,584 | 100.0% |
Waseca Summary
Waseca is a city located in the south-central region of Minnesota, United States. It is the county seat of Waseca County and is situated along the Blue Earth River. The city is located approximately 70 miles south of Minneapolis and St. Paul. As of the 2010 census, the population of Waseca was 9,410.
History
The area that is now Waseca was first settled in 1854 by a group of settlers from New York. The city was named after the Dakota word for “rich” or “abundant”. The city was officially incorporated in 1857 and was designated as the county seat of Waseca County in 1858.
In the late 19th century, Waseca was a major center for the production of agricultural machinery. The city was home to several factories, including the Waseca Harvester Works, which produced the first successful self-propelled combine harvester. The city also had a thriving lumber industry, with several sawmills located in the area.
Geography
Waseca is located in south-central Minnesota, approximately 70 miles south of Minneapolis and St. Paul. The city is situated along the Blue Earth River and is surrounded by rolling hills and farmland. The city has a total area of 5.6 square miles, all of which is land.
Economy
The economy of Waseca is largely based on agriculture and manufacturing. The city is home to several factories, including the Waseca Harvester Works, which produces agricultural machinery. The city also has a thriving lumber industry, with several sawmills located in the area.
Demographics
As of the 2010 census, the population of Waseca was 9,410. The racial makeup of the city was 94.2% White, 0.7% African American, 0.3% Native American, 0.7% Asian, 0.1% Pacific Islander, 2.3% from other races, and 1.7% from two or more races. Hispanic or Latino of any race were 4.3% of the population.
The median household income in Waseca was $45,945 in 2018. The median age of the city was 38.7 years. The city had a poverty rate of 11.3%.
Conclusion
Waseca is a city located in the south-central region of Minnesota, United States. It is the county seat of Waseca County and is situated along the Blue Earth River. The city is home to several factories, including the Waseca Harvester Works, which produces agricultural machinery. The city also has a thriving lumber industry, with several sawmills located in the area. As of the 2010 census, the population of Waseca was 9,410. The median household income in Waseca was $45,945 in 2018. The median age of the city was 38.7 years. The city had a poverty rate of 11.3%.
Common Questions
What is Per Capita Income in Waseca?
Per Capita income in Waseca is $32,940.
What is the Median Family Income in Waseca?
Median Family Income in Waseca is $82,639.
What is the Median Household income in Waseca?
Median Household Income in Waseca is $62,632.
What is Income or Wage Gap in Waseca?
Income or Wage Gap in Waseca is 34.8%.
Women in Waseca earn 65.2 cents for every dollar earned by a man.
What is Inequality or Gini Index in Waseca?
Inequality or Gini Index in Waseca is 0.45.
What is the Total Population of Waseca?
Total Population of Waseca is 9,208.
What is the Total Male Population of Waseca?
Total Male Population of Waseca is 4,006.
What is the Total Female Population of Waseca?
Total Female Population of Waseca is 5,202.
What is the Ratio of Males per 100 Females in Waseca?
There are 77.01 Males per 100 Females in Waseca.
What is the Ratio of Females per 100 Males in Waseca?
There are 129.86 Females per 100 Males in Waseca.
What is the Median Population Age in Waseca?
Median Population Age in Waseca is 39.2 Years.
What is the Average Family Size in Waseca
Average Family Size in Waseca is 3.0 People.
What is the Average Household Size in Waseca
Average Household Size in Waseca is 2.4 People.
How Large is the Labor Force in Waseca?
There are 4,279 People in the Labor Forcein in Waseca.
What is the Percentage of People in the Labor Force in Waseca?
59.8% of People are in the Labor Force in Waseca.
What is the Unemployment Rate in Waseca?
Unemployment Rate in Waseca is 4.7%.