Northfield, MN Map & Demographics
Northfield Map
Northfield Overview
$37,390
PER CAPITA INCOME
$115,410
AVG FAMILY INCOME
$83,125
AVG HOUSEHOLD INCOME
54.5%
WAGE / INCOME GAP [ % ]
45.5¢/ $1
WAGE / INCOME GAP [ $ ]
0.43
INEQUALITY / GINI INDEX
20,518
TOTAL POPULATION
9,835
MALE POPULATION
10,683
FEMALE POPULATION
92.06
MALES / 100 FEMALES
108.62
FEMALES / 100 MALES
29.4
MEDIAN AGE
3.0
AVG FAMILY SIZE
2.4
AVG HOUSEHOLD SIZE
11,462
LABOR FORCE [ PEOPLE ]
65.3%
PERCENT IN LABOR FORCE
6.2%
UNEMPLOYMENT RATE
Northfield Zip Codes
Northfield Area Codes
Income in Northfield
Income Overview in Northfield
Per Capita Income in Northfield is $37,390, while median incomes of families and households are $115,410 and $83,125 respectively.
| Characteristic | Number | Measure |
| Per Capita Income | 20,518 | $37,390 |
| Median Family Income | 3,820 | $115,410 |
| Mean Family Income | 3,820 | $134,396 |
| Median Household Income | 6,328 | $83,125 |
| Mean Household Income | 6,328 | $105,216 |
| Income Deficit | 3,820 | $0 |
| Wage / Income Gap (%) | 20,518 | 54.54% |
| Wage / Income Gap ($) | 20,518 | 45.46¢ per $1 |
| Gini / Inequality Index | 20,518 | 0.43 |
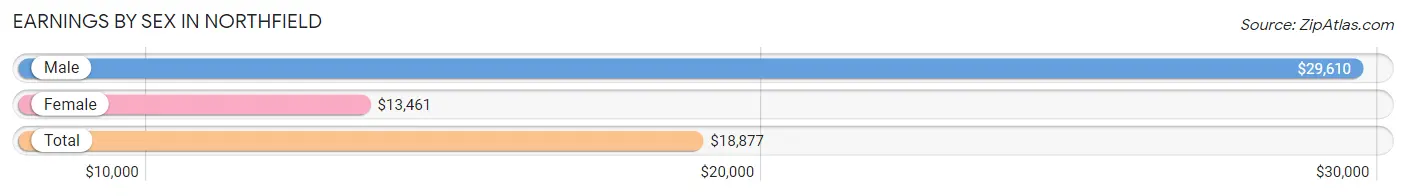
Earnings by Sex in Northfield
Average Earnings in Northfield are $18,877, $29,610 for men and $13,461 for women, a difference of 54.5%.
| Sex | Number | Average Earnings |
| Male | 6,260 (47.9%) | $29,610 |
| Female | 6,797 (52.1%) | $13,461 |
| Total | 13,057 (100.0%) | $18,877 |
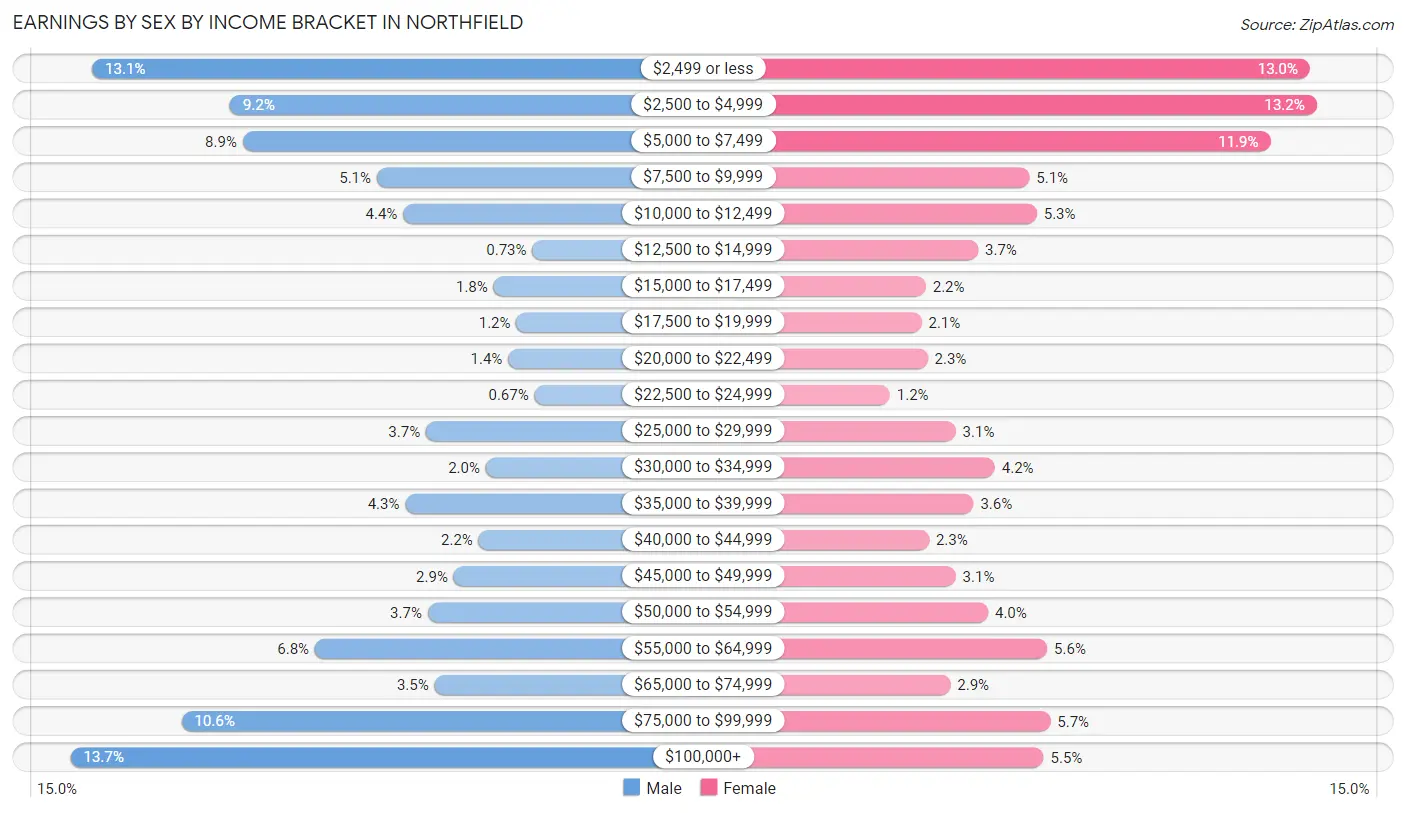
Earnings by Sex by Income Bracket in Northfield
The most common earnings brackets in Northfield are $100,000+ for men (858 | 13.7%) and $2,500 to $4,999 for women (897 | 13.2%).
| Income | Male | Female |
| $2,499 or less | 820 (13.1%) | 884 (13.0%) |
| $2,500 to $4,999 | 578 (9.2%) | 897 (13.2%) |
| $5,000 to $7,499 | 555 (8.9%) | 809 (11.9%) |
| $7,500 to $9,999 | 319 (5.1%) | 349 (5.1%) |
| $10,000 to $12,499 | 273 (4.4%) | 363 (5.3%) |
| $12,500 to $14,999 | 46 (0.7%) | 251 (3.7%) |
| $15,000 to $17,499 | 114 (1.8%) | 151 (2.2%) |
| $17,500 to $19,999 | 74 (1.2%) | 143 (2.1%) |
| $20,000 to $22,499 | 88 (1.4%) | 154 (2.3%) |
| $22,500 to $24,999 | 42 (0.7%) | 82 (1.2%) |
| $25,000 to $29,999 | 233 (3.7%) | 208 (3.1%) |
| $30,000 to $34,999 | 128 (2.0%) | 283 (4.2%) |
| $35,000 to $39,999 | 269 (4.3%) | 242 (3.6%) |
| $40,000 to $44,999 | 140 (2.2%) | 157 (2.3%) |
| $45,000 to $49,999 | 184 (2.9%) | 208 (3.1%) |
| $50,000 to $54,999 | 230 (3.7%) | 270 (4.0%) |
| $55,000 to $64,999 | 428 (6.8%) | 383 (5.6%) |
| $65,000 to $74,999 | 218 (3.5%) | 198 (2.9%) |
| $75,000 to $99,999 | 663 (10.6%) | 389 (5.7%) |
| $100,000+ | 858 (13.7%) | 376 (5.5%) |
| Total | 6,260 (100.0%) | 6,797 (100.0%) |
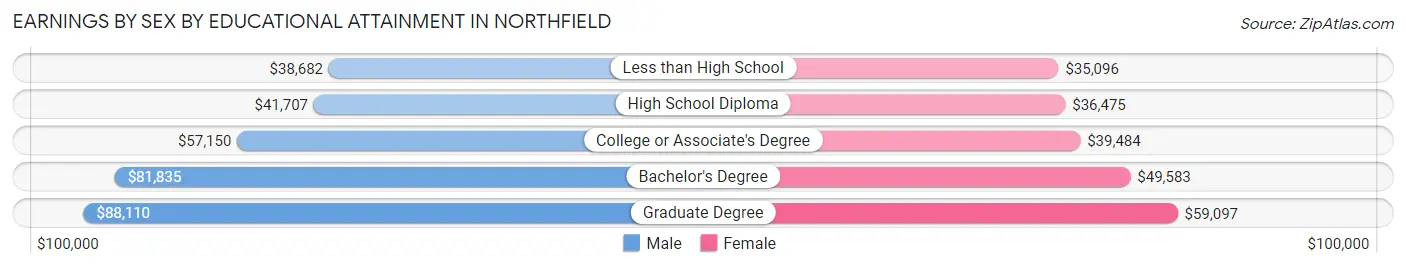
Earnings by Sex by Educational Attainment in Northfield
Average earnings in Northfield are $61,321 for men and $46,654 for women, a difference of 23.9%. Men with an educational attainment of graduate degree enjoy the highest average annual earnings of $88,110, while those with less than high school education earn the least with $38,682. Women with an educational attainment of graduate degree earn the most with the average annual earnings of $59,097, while those with less than high school education have the smallest earnings of $35,096.
| Educational Attainment | Male Income | Female Income |
| Less than High School | $38,682 | $35,096 |
| High School Diploma | $41,707 | $36,475 |
| College or Associate's Degree | $57,150 | $39,484 |
| Bachelor's Degree | $81,835 | $49,583 |
| Graduate Degree | $88,110 | $59,097 |
| Total | $61,321 | $46,654 |
Family Income in Northfield
Family Income Brackets in Northfield
According to the Northfield family income data, there are 1,039 families falling into the $100,000 to $149,999 income range, which is the most common income bracket and makes up 27.2% of all families. Conversely, the less than $10,000 income bracket is the least frequent group with only 31 families (0.8%) belonging to this category.
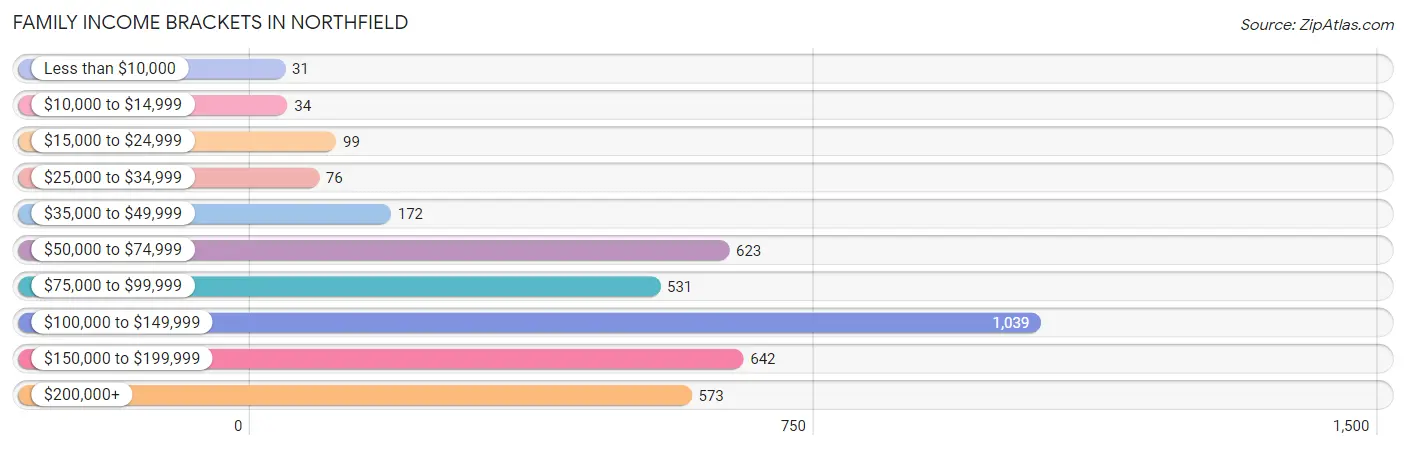
| Income Bracket | # Families | % Families |
| Less than $10,000 | 31 | 0.8% |
| $10,000 to $14,999 | 34 | 0.9% |
| $15,000 to $24,999 | 99 | 2.6% |
| $25,000 to $34,999 | 76 | 2.0% |
| $35,000 to $49,999 | 172 | 4.5% |
| $50,000 to $74,999 | 623 | 16.3% |
| $75,000 to $99,999 | 531 | 13.9% |
| $100,000 to $149,999 | 1,039 | 27.2% |
| $150,000 to $199,999 | 642 | 16.8% |
| $200,000+ | 573 | 15.0% |
Family Income by Famaliy Size in Northfield
7+ person families (36 | 0.9%) account for the highest median family income in Northfield with $178,571 per family, while 2-person families (1,761 | 46.1%) have the highest median income of $55,962 per family member.
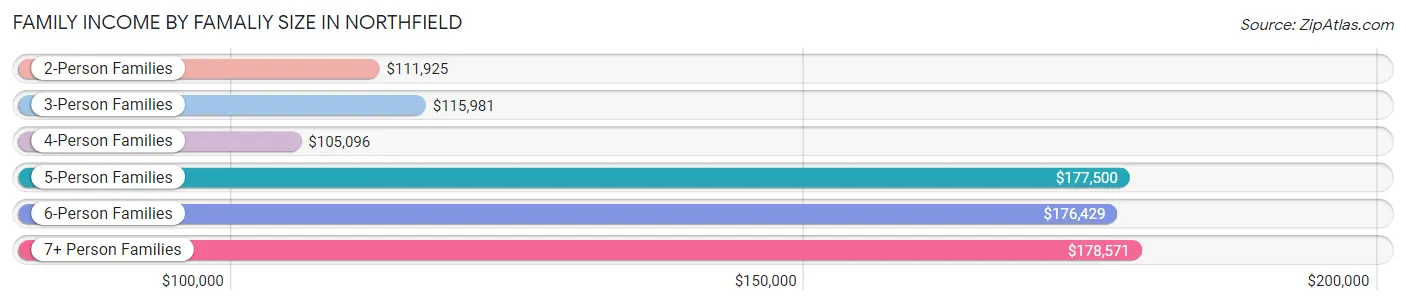
| Income Bracket | # Families | Median Income |
| 2-Person Families | 1,761 (46.1%) | $111,925 |
| 3-Person Families | 947 (24.8%) | $115,981 |
| 4-Person Families | 824 (21.6%) | $105,096 |
| 5-Person Families | 152 (4.0%) | $177,500 |
| 6-Person Families | 100 (2.6%) | $176,429 |
| 7+ Person Families | 36 (0.9%) | $178,571 |
| Total | 3,820 (100.0%) | $115,410 |
Family Income by Number of Earners in Northfield
The median family income in Northfield is $115,410, with families comprising 3+ earners (471) having the highest median family income of $174,125, while families with 1 earner (1,031) have the lowest median family income of $77,563, accounting for 12.3% and 27.0% of families, respectively.
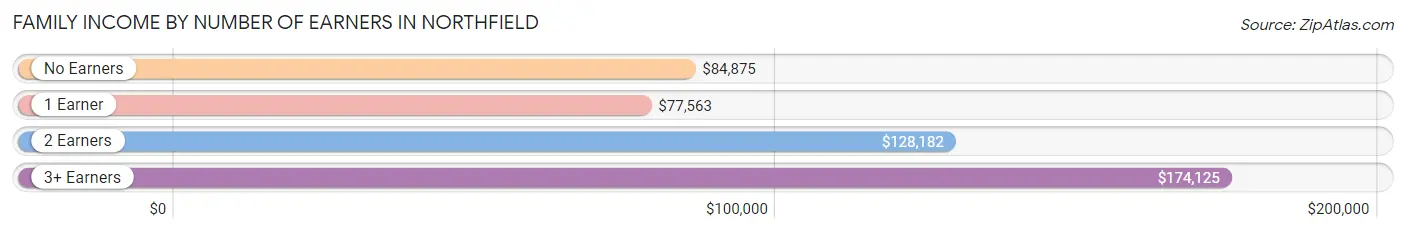
| Number of Earners | # Families | Median Income |
| No Earners | 524 (13.7%) | $84,875 |
| 1 Earner | 1,031 (27.0%) | $77,563 |
| 2 Earners | 1,794 (47.0%) | $128,182 |
| 3+ Earners | 471 (12.3%) | $174,125 |
| Total | 3,820 (100.0%) | $115,410 |
Household Income in Northfield
Household Income Brackets in Northfield
With 1,354 households falling in the category, the $100,000 to $149,999 income range is the most frequent in Northfield, accounting for 21.4% of all households. In contrast, only 95 households (1.5%) fall into the $10,000 to $14,999 income bracket, making it the least populous group.
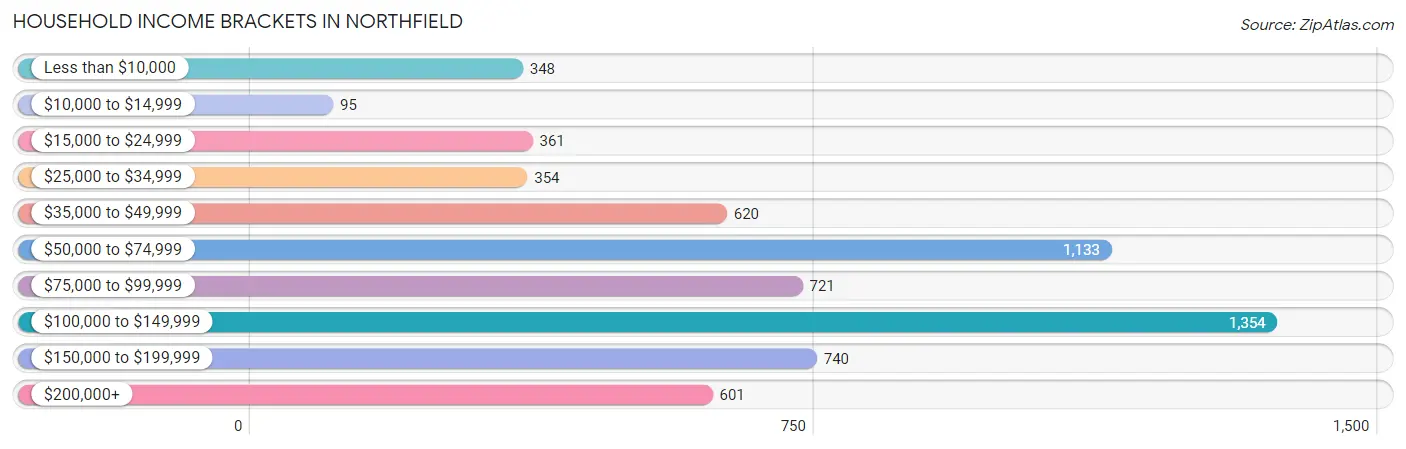
| Income Bracket | # Households | % Households |
| Less than $10,000 | 348 | 5.5% |
| $10,000 to $14,999 | 95 | 1.5% |
| $15,000 to $24,999 | 361 | 5.7% |
| $25,000 to $34,999 | 354 | 5.6% |
| $35,000 to $49,999 | 620 | 9.8% |
| $50,000 to $74,999 | 1,133 | 17.9% |
| $75,000 to $99,999 | 721 | 11.4% |
| $100,000 to $149,999 | 1,354 | 21.4% |
| $150,000 to $199,999 | 740 | 11.7% |
| $200,000+ | 601 | 9.5% |
Household Income by Householder Age in Northfield
The median household income in Northfield is $83,125, with the highest median household income of $103,787 found in the 45 to 64 years age bracket for the primary householder. A total of 2,289 households (36.2%) fall into this category. Meanwhile, the 15 to 24 years age bracket for the primary householder has the lowest median household income of $0, with 220 households (3.5%) in this group.
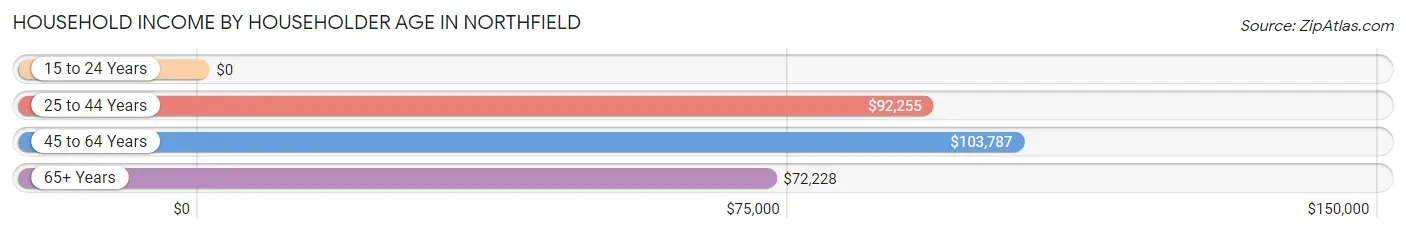
| Income Bracket | # Households | Median Income |
| 15 to 24 Years | 220 (3.5%) | $0 |
| 25 to 44 Years | 1,765 (27.9%) | $92,255 |
| 45 to 64 Years | 2,289 (36.2%) | $103,787 |
| 65+ Years | 2,054 (32.5%) | $72,228 |
| Total | 6,328 (100.0%) | $83,125 |
Poverty in Northfield
Income Below Poverty by Sex and Age in Northfield
With 8.1% poverty level for males and 7.4% for females among the residents of Northfield, 18 to 24 year old males and 18 to 24 year old females are the most vulnerable to poverty, with 185 males (29.0%) and 198 females (33.2%) in their respective age groups living below the poverty level.
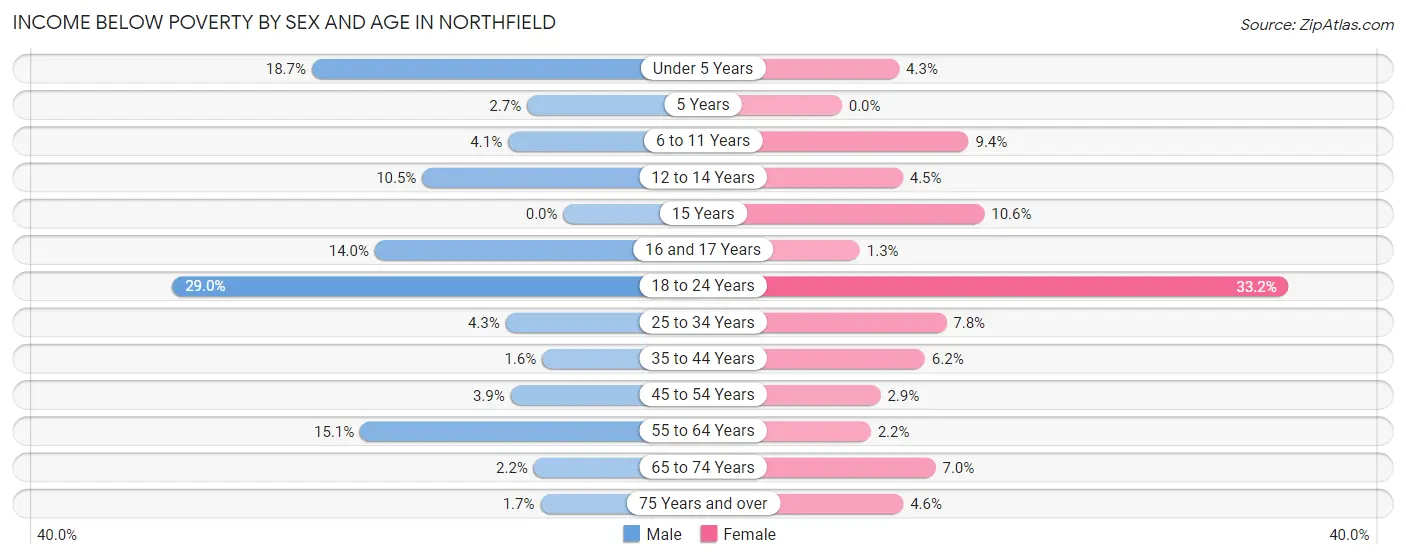
| Age Bracket | Male | Female |
| Under 5 Years | 85 (18.7%) | 14 (4.3%) |
| 5 Years | 2 (2.7%) | 0 (0.0%) |
| 6 to 11 Years | 25 (4.1%) | 45 (9.4%) |
| 12 to 14 Years | 24 (10.5%) | 22 (4.5%) |
| 15 Years | 0 (0.0%) | 20 (10.6%) |
| 16 and 17 Years | 21 (14.0%) | 3 (1.3%) |
| 18 to 24 Years | 185 (29.0%) | 198 (33.2%) |
| 25 to 34 Years | 34 (4.3%) | 65 (7.8%) |
| 35 to 44 Years | 16 (1.6%) | 60 (6.2%) |
| 45 to 54 Years | 45 (3.9%) | 27 (2.9%) |
| 55 to 64 Years | 137 (15.1%) | 21 (2.1%) |
| 65 to 74 Years | 19 (2.2%) | 64 (7.0%) |
| 75 Years and over | 9 (1.7%) | 32 (4.6%) |
| Total | 602 (8.1%) | 571 (7.4%) |
Income Above Poverty by Sex and Age in Northfield
According to the poverty statistics in Northfield, males aged 15 years and females aged 5 years are the age groups that are most secure financially, with 100.0% of males and 100.0% of females in these age groups living above the poverty line.
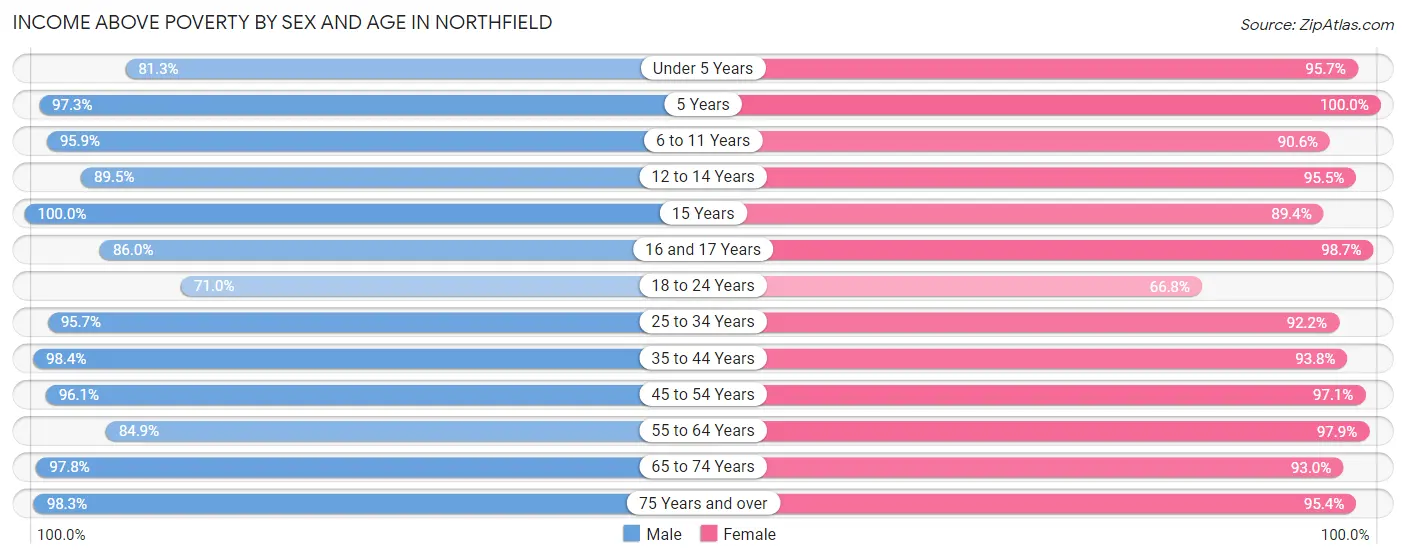
| Age Bracket | Male | Female |
| Under 5 Years | 370 (81.3%) | 315 (95.7%) |
| 5 Years | 72 (97.3%) | 47 (100.0%) |
| 6 to 11 Years | 584 (95.9%) | 433 (90.6%) |
| 12 to 14 Years | 205 (89.5%) | 464 (95.5%) |
| 15 Years | 22 (100.0%) | 169 (89.4%) |
| 16 and 17 Years | 129 (86.0%) | 221 (98.7%) |
| 18 to 24 Years | 452 (71.0%) | 399 (66.8%) |
| 25 to 34 Years | 758 (95.7%) | 773 (92.2%) |
| 35 to 44 Years | 994 (98.4%) | 913 (93.8%) |
| 45 to 54 Years | 1,104 (96.1%) | 913 (97.1%) |
| 55 to 64 Years | 771 (84.9%) | 955 (97.9%) |
| 65 to 74 Years | 846 (97.8%) | 855 (93.0%) |
| 75 Years and over | 518 (98.3%) | 670 (95.4%) |
| Total | 6,825 (91.9%) | 7,127 (92.6%) |
Income Below Poverty Among Married-Couple Families in Northfield
The poverty statistics for married-couple families in Northfield show that 1.9% or 59 of the total 3,094 families live below the poverty line. Families with 1 or 2 children have the highest poverty rate of 4.2%, comprising of 43 families. On the other hand, families with 3 or 4 children have the lowest poverty rate of 0.0%, which includes 0 families.
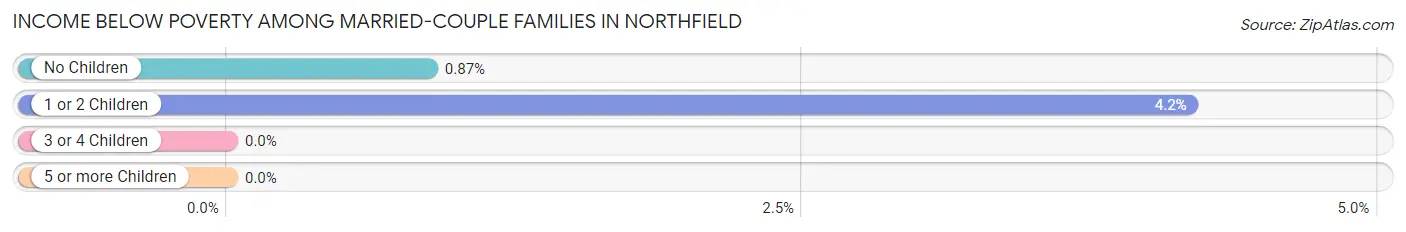
| Children | Above Poverty | Below Poverty |
| No Children | 1,833 (99.1%) | 16 (0.9%) |
| 1 or 2 Children | 986 (95.8%) | 43 (4.2%) |
| 3 or 4 Children | 204 (100.0%) | 0 (0.0%) |
| 5 or more Children | 12 (100.0%) | 0 (0.0%) |
| Total | 3,035 (98.1%) | 59 (1.9%) |
Income Below Poverty Among Single-Parent Households in Northfield
According to the poverty data in Northfield, 2.6% or 8 single-father households and 17.2% or 71 single-mother households are living below the poverty line. Among single-father households, those with 1 or 2 children have the highest poverty rate, with 8 households (5.6%) experiencing poverty. Likewise, among single-mother households, those with 3 or 4 children have the highest poverty rate, with 20 households (29.0%) falling below the poverty line.
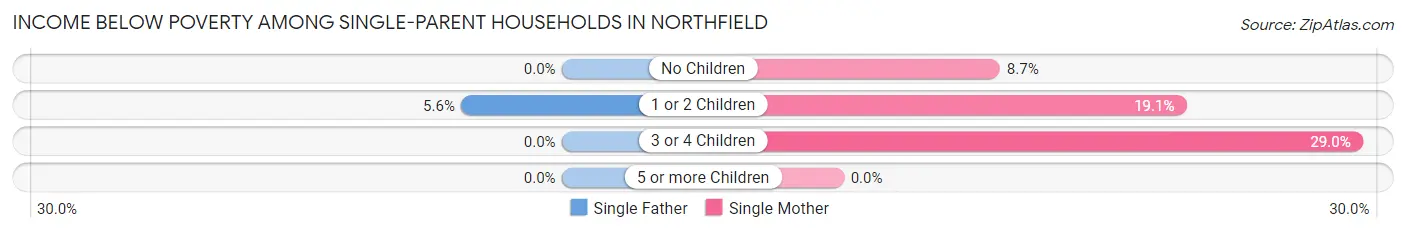
| Children | Single Father | Single Mother |
| No Children | 0 (0.0%) | 11 (8.7%) |
| 1 or 2 Children | 8 (5.6%) | 40 (19.1%) |
| 3 or 4 Children | 0 (0.0%) | 20 (29.0%) |
| 5 or more Children | 0 (0.0%) | 0 (0.0%) |
| Total | 8 (2.6%) | 71 (17.2%) |
Income Below Poverty Among Married-Couple vs Single-Parent Households in Northfield
The poverty data for Northfield shows that 59 of the married-couple family households (1.9%) and 79 of the single-parent households (10.9%) are living below the poverty level. Within the married-couple family households, those with 1 or 2 children have the highest poverty rate, with 43 households (4.2%) falling below the poverty line. Among the single-parent households, those with 3 or 4 children have the highest poverty rate, with 20 household (24.7%) living below poverty.
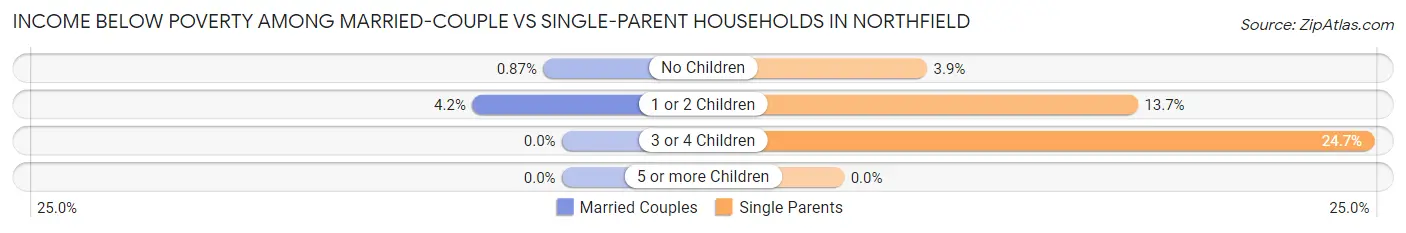
| Children | Married-Couple Families | Single-Parent Households |
| No Children | 16 (0.9%) | 11 (3.9%) |
| 1 or 2 Children | 43 (4.2%) | 48 (13.7%) |
| 3 or 4 Children | 0 (0.0%) | 20 (24.7%) |
| 5 or more Children | 0 (0.0%) | 0 (0.0%) |
| Total | 59 (1.9%) | 79 (10.9%) |
Race in Northfield
The most populous races in Northfield are White / Caucasian (17,090 | 83.3%), Hispanic or Latino (1,786 | 8.7%), and Two or more Races (1,388 | 6.8%).
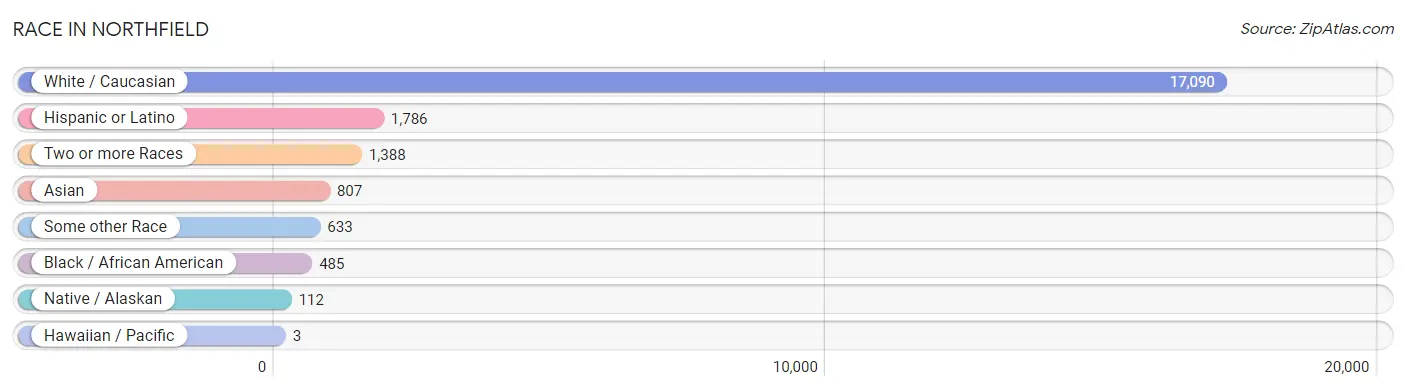
| Race | # Population | % Population |
| Asian | 807 | 3.9% |
| Black / African American | 485 | 2.4% |
| Hawaiian / Pacific | 3 | 0.0% |
| Hispanic or Latino | 1,786 | 8.7% |
| Native / Alaskan | 112 | 0.5% |
| White / Caucasian | 17,090 | 83.3% |
| Two or more Races | 1,388 | 6.8% |
| Some other Race | 633 | 3.1% |
| Total | 20,518 | 100.0% |
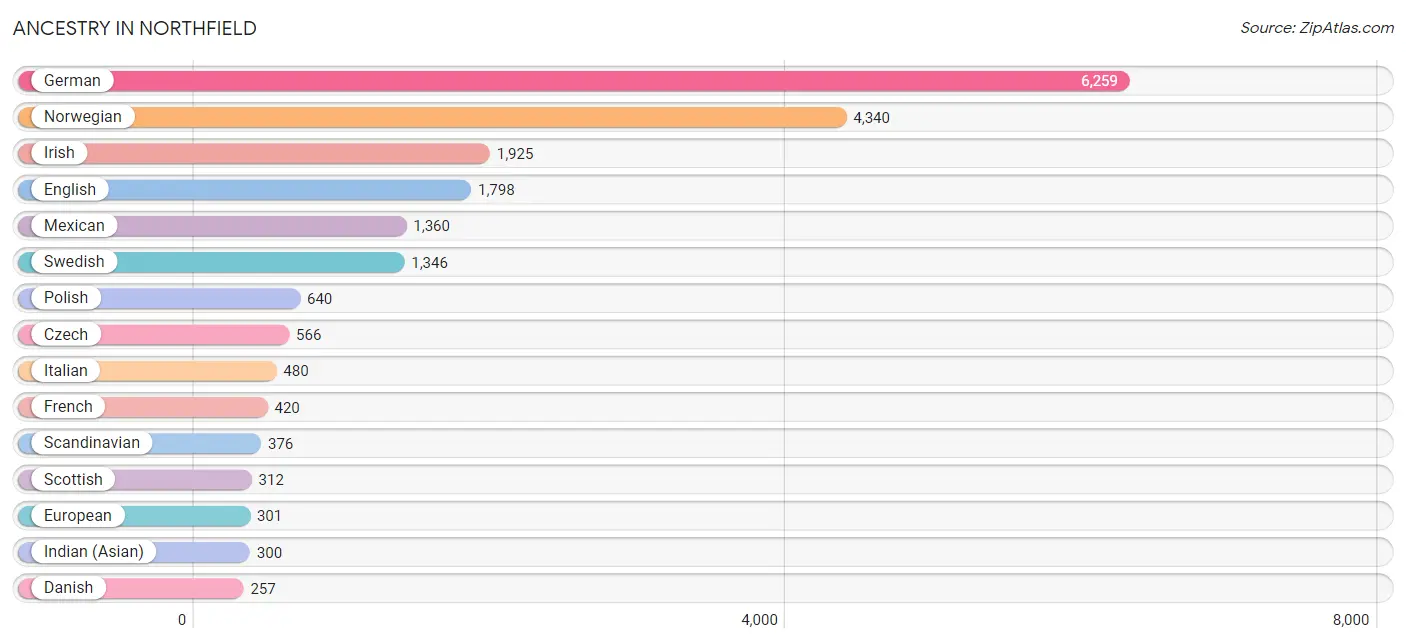
Ancestry in Northfield
The most populous ancestries reported in Northfield are German (6,259 | 30.5%), Norwegian (4,340 | 21.1%), Irish (1,925 | 9.4%), English (1,798 | 8.8%), and Mexican (1,360 | 6.6%), together accounting for 76.4% of all Northfield residents.
| Ancestry | # Population | % Population |
| African | 87 | 0.4% |
| Albanian | 17 | 0.1% |
| American | 214 | 1.0% |
| Arab | 44 | 0.2% |
| Argentinean | 17 | 0.1% |
| Armenian | 10 | 0.1% |
| Australian | 14 | 0.1% |
| Austrian | 78 | 0.4% |
| Bangladeshi | 81 | 0.4% |
| Belgian | 30 | 0.2% |
| Bhutanese | 141 | 0.7% |
| Bolivian | 3 | 0.0% |
| Brazilian | 7 | 0.0% |
| British | 67 | 0.3% |
| Bulgarian | 34 | 0.2% |
| Burmese | 216 | 1.1% |
| Canadian | 43 | 0.2% |
| Central American | 50 | 0.2% |
| Cherokee | 18 | 0.1% |
| Chilean | 38 | 0.2% |
| Chippewa | 58 | 0.3% |
| Choctaw | 14 | 0.1% |
| Colombian | 7 | 0.0% |
| Costa Rican | 5 | 0.0% |
| Croatian | 25 | 0.1% |
| Cuban | 21 | 0.1% |
| Czech | 566 | 2.8% |
| Czechoslovakian | 25 | 0.1% |
| Danish | 257 | 1.3% |
| Dutch | 235 | 1.1% |
| Eastern European | 47 | 0.2% |
| Ecuadorian | 19 | 0.1% |
| English | 1,798 | 8.8% |
| Estonian | 6 | 0.0% |
| European | 301 | 1.5% |
| Filipino | 12 | 0.1% |
| Finnish | 137 | 0.7% |
| French | 420 | 2.1% |
| French American Indian | 17 | 0.1% |
| French Canadian | 109 | 0.5% |
| German | 6,259 | 30.5% |
| Greek | 147 | 0.7% |
| Guamanian / Chamorro | 15 | 0.1% |
| Guatemalan | 24 | 0.1% |
| Guyanese | 24 | 0.1% |
| Haitian | 7 | 0.0% |
| Hungarian | 44 | 0.2% |
| Icelander | 52 | 0.3% |
| Indian (Asian) | 300 | 1.5% |
| Iranian | 27 | 0.1% |
| Irish | 1,925 | 9.4% |
| Italian | 480 | 2.3% |
| Jamaican | 15 | 0.1% |
| Kenyan | 43 | 0.2% |
| Korean | 109 | 0.5% |
| Latvian | 18 | 0.1% |
| Lebanese | 37 | 0.2% |
| Lithuanian | 10 | 0.1% |
| Luxembourger | 14 | 0.1% |
| Mexican | 1,360 | 6.6% |
| Mexican American Indian | 3 | 0.0% |
| Mongolian | 5 | 0.0% |
| Northern European | 16 | 0.1% |
| Norwegian | 4,340 | 21.1% |
| Pakistani | 5 | 0.0% |
| Pennsylvania German | 2 | 0.0% |
| Polish | 640 | 3.1% |
| Portuguese | 20 | 0.1% |
| Puerto Rican | 24 | 0.1% |
| Romanian | 16 | 0.1% |
| Russian | 131 | 0.6% |
| Salvadoran | 21 | 0.1% |
| Samoan | 32 | 0.2% |
| Scandinavian | 376 | 1.8% |
| Scotch-Irish | 192 | 0.9% |
| Scottish | 312 | 1.5% |
| Sioux | 28 | 0.1% |
| Slovak | 19 | 0.1% |
| Slovene | 24 | 0.1% |
| Somali | 7 | 0.0% |
| South American | 85 | 0.4% |
| Spaniard | 6 | 0.0% |
| Spanish | 164 | 0.8% |
| Spanish American Indian | 6 | 0.0% |
| Sri Lankan | 194 | 0.9% |
| Subsaharan African | 199 | 1.0% |
| Swedish | 1,346 | 6.6% |
| Swiss | 111 | 0.5% |
| Syrian | 7 | 0.0% |
| Thai | 87 | 0.4% |
| Ukrainian | 51 | 0.3% |
| Venezuelan | 1 | 0.0% |
| Welsh | 164 | 0.8% |
| Yugoslavian | 5 | 0.0% | View All 94 Rows |
Immigrants in Northfield
The most numerous immigrant groups reported in Northfield came from Latin America (663 | 3.2%), Central America (593 | 2.9%), Mexico (562 | 2.7%), Asia (471 | 2.3%), and Eastern Asia (278 | 1.3%), together accounting for 12.5% of all Northfield residents.
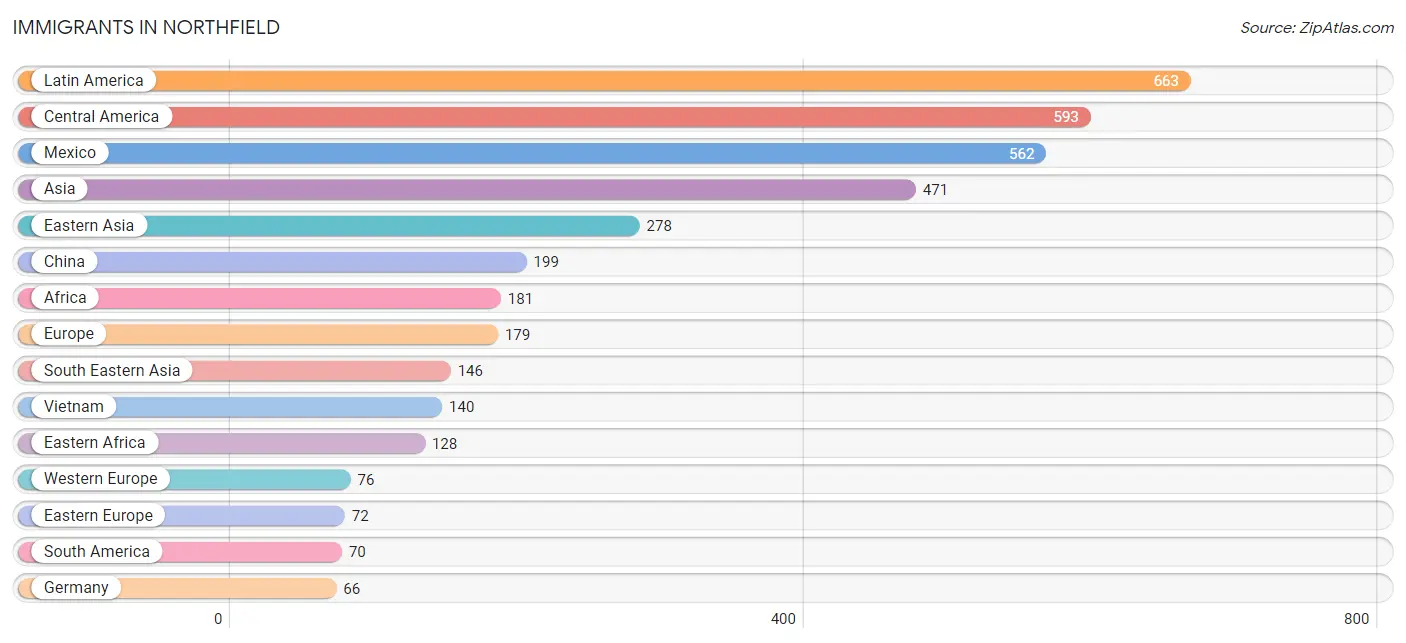
| Immigration Origin | # Population | % Population |
| Africa | 181 | 0.9% |
| Albania | 17 | 0.1% |
| Argentina | 39 | 0.2% |
| Asia | 471 | 2.3% |
| Bangladesh | 2 | 0.0% |
| Brazil | 18 | 0.1% |
| Canada | 18 | 0.1% |
| Central America | 593 | 2.9% |
| China | 199 | 1.0% |
| Costa Rica | 3 | 0.0% |
| Croatia | 5 | 0.0% |
| Eastern Africa | 128 | 0.6% |
| Eastern Asia | 278 | 1.3% |
| Eastern Europe | 72 | 0.4% |
| Ecuador | 9 | 0.0% |
| El Salvador | 21 | 0.1% |
| England | 15 | 0.1% |
| Europe | 179 | 0.9% |
| Germany | 66 | 0.3% |
| Guatemala | 6 | 0.0% |
| Honduras | 1 | 0.0% |
| India | 45 | 0.2% |
| Japan | 21 | 0.1% |
| Kenya | 55 | 0.3% |
| Korea | 58 | 0.3% |
| Latin America | 663 | 3.2% |
| Latvia | 8 | 0.0% |
| Mexico | 562 | 2.7% |
| Netherlands | 10 | 0.1% |
| Northern Europe | 15 | 0.1% |
| Peru | 4 | 0.0% |
| Philippines | 6 | 0.0% |
| Russia | 36 | 0.2% |
| Senegal | 12 | 0.1% |
| South America | 70 | 0.3% |
| South Central Asia | 47 | 0.2% |
| South Eastern Asia | 146 | 0.7% |
| Southern Europe | 16 | 0.1% |
| Spain | 16 | 0.1% |
| Vietnam | 140 | 0.7% |
| Western Africa | 44 | 0.2% |
| Western Europe | 76 | 0.4% |
| Zimbabwe | 7 | 0.0% | View All 43 Rows |
Sex and Age in Northfield
Sex and Age in Northfield
The most populous age groups in Northfield are 15 to 19 Years (1,539 | 15.7%) for men and 15 to 19 Years (1,923 | 18.0%) for women.
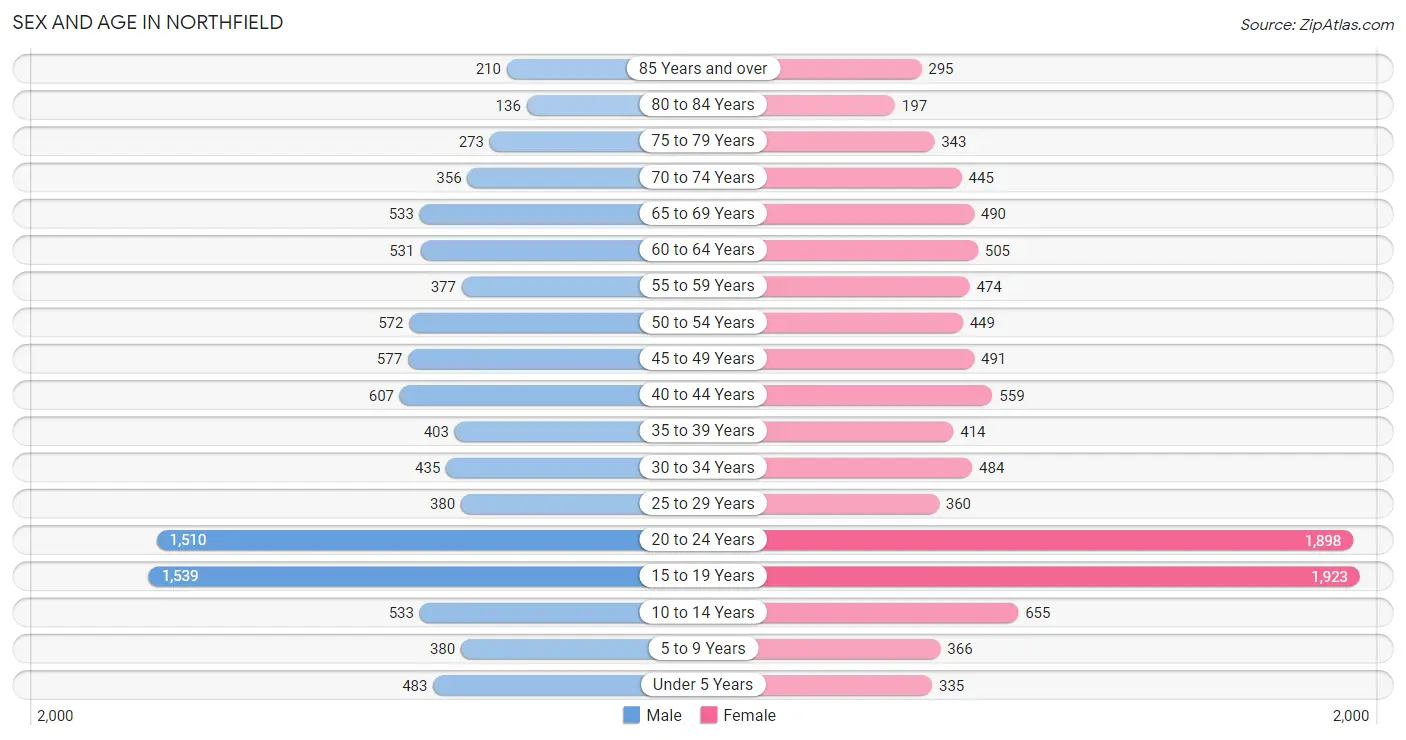
| Age Bracket | Male | Female |
| Under 5 Years | 483 (4.9%) | 335 (3.1%) |
| 5 to 9 Years | 380 (3.9%) | 366 (3.4%) |
| 10 to 14 Years | 533 (5.4%) | 655 (6.1%) |
| 15 to 19 Years | 1,539 (15.7%) | 1,923 (18.0%) |
| 20 to 24 Years | 1,510 (15.3%) | 1,898 (17.8%) |
| 25 to 29 Years | 380 (3.9%) | 360 (3.4%) |
| 30 to 34 Years | 435 (4.4%) | 484 (4.5%) |
| 35 to 39 Years | 403 (4.1%) | 414 (3.9%) |
| 40 to 44 Years | 607 (6.2%) | 559 (5.2%) |
| 45 to 49 Years | 577 (5.9%) | 491 (4.6%) |
| 50 to 54 Years | 572 (5.8%) | 449 (4.2%) |
| 55 to 59 Years | 377 (3.8%) | 474 (4.4%) |
| 60 to 64 Years | 531 (5.4%) | 505 (4.7%) |
| 65 to 69 Years | 533 (5.4%) | 490 (4.6%) |
| 70 to 74 Years | 356 (3.6%) | 445 (4.2%) |
| 75 to 79 Years | 273 (2.8%) | 343 (3.2%) |
| 80 to 84 Years | 136 (1.4%) | 197 (1.8%) |
| 85 Years and over | 210 (2.1%) | 295 (2.8%) |
| Total | 9,835 (100.0%) | 10,683 (100.0%) |
Families and Households in Northfield
Median Family Size in Northfield
The median family size in Northfield is 3.05 persons per family, with single female/mother families (413 | 10.8%) accounting for the largest median family size of 3.16 persons per family. On the other hand, single male/father families (313 | 8.2%) represent the smallest median family size with 2.86 persons per family.
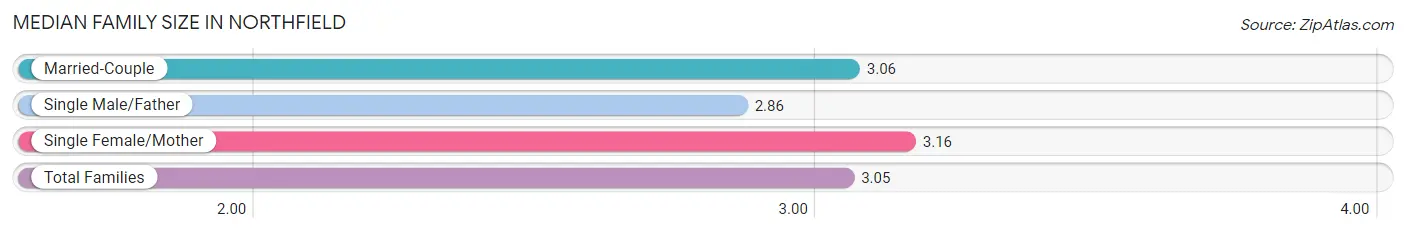
| Family Type | # Families | Family Size |
| Married-Couple | 3,094 (81.0%) | 3.06 |
| Single Male/Father | 313 (8.2%) | 2.86 |
| Single Female/Mother | 413 (10.8%) | 3.16 |
| Total Families | 3,820 (100.0%) | 3.05 |
Median Household Size in Northfield
The median household size in Northfield is 2.38 persons per household, with single female/mother households (413 | 6.5%) accounting for the largest median household size of 3.49 persons per household. non-family households (2,508 | 39.6%) represent the smallest median household size with 1.23 persons per household.
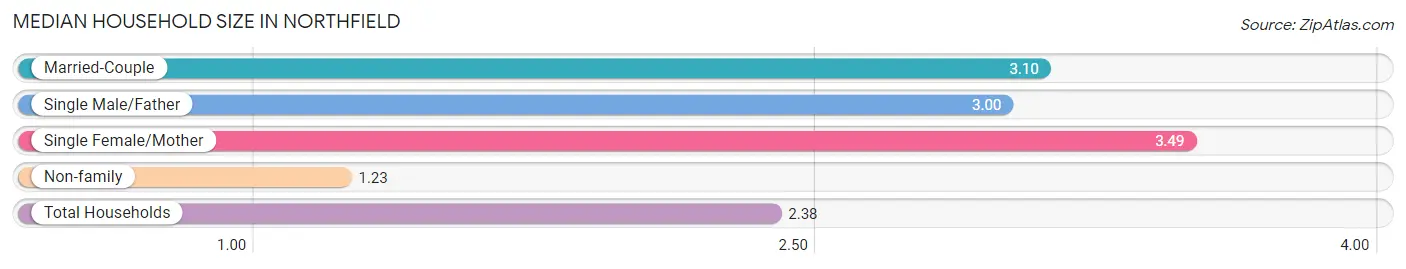
| Household Type | # Households | Household Size |
| Married-Couple | 3,094 (48.9%) | 3.10 |
| Single Male/Father | 313 (5.0%) | 3.00 |
| Single Female/Mother | 413 (6.5%) | 3.49 |
| Non-family | 2,508 (39.6%) | 1.23 |
| Total Households | 6,328 (100.0%) | 2.38 |
Household Size by Marriage Status in Northfield
Out of a total of 6,328 households in Northfield, 3,820 (60.4%) are family households, while 2,508 (39.6%) are nonfamily households. The most numerous type of family households are 2-person households, comprising 1,657, and the most common type of nonfamily households are 1-person households, comprising 2,079.
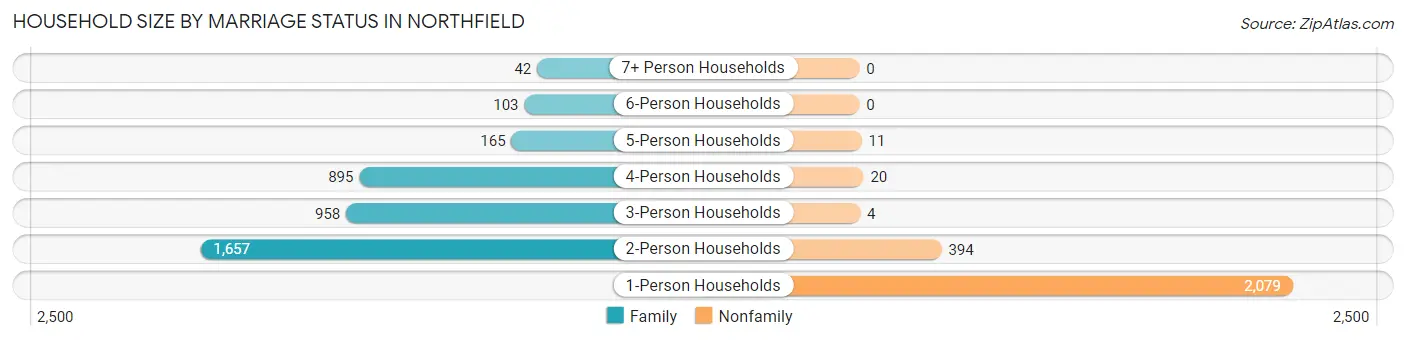
| Household Size | Family Households | Nonfamily Households |
| 1-Person Households | - | 2,079 (32.9%) |
| 2-Person Households | 1,657 (26.2%) | 394 (6.2%) |
| 3-Person Households | 958 (15.1%) | 4 (0.1%) |
| 4-Person Households | 895 (14.1%) | 20 (0.3%) |
| 5-Person Households | 165 (2.6%) | 11 (0.2%) |
| 6-Person Households | 103 (1.6%) | 0 (0.0%) |
| 7+ Person Households | 42 (0.7%) | 0 (0.0%) |
| Total | 3,820 (60.4%) | 2,508 (39.6%) |
Female Fertility in Northfield
Fertility by Age in Northfield
Average fertility rate in Northfield is 28.0 births per 1,000 women. Women in the age bracket of 20 to 34 years have the highest fertility rate with 59.0 births per 1,000 women. Women in the age bracket of 20 to 34 years acount for 94.2% of all women with births.
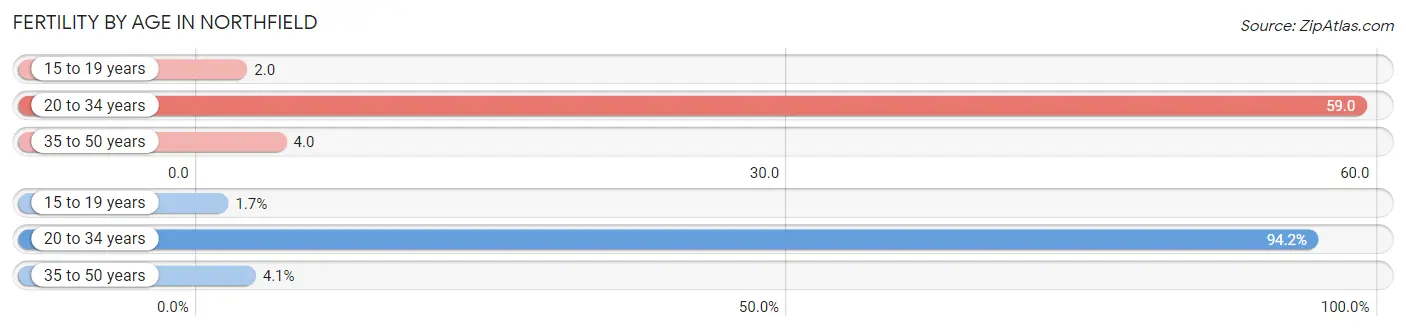
| Age Bracket | Women with Births | Births / 1,000 Women |
| 15 to 19 years | 3 (1.7%) | 2.0 |
| 20 to 34 years | 163 (94.2%) | 59.0 |
| 35 to 50 years | 7 (4.1%) | 4.0 |
| Total | 173 (100.0%) | 28.0 |
Fertility by Age by Marriage Status in Northfield
85.0% of women with births (173) in Northfield are married. The highest percentage of unmarried women with births falls into 15 to 19 years age bracket with 100.0% of them unmarried at the time of birth, while the lowest percentage of unmarried women with births belong to 35 to 50 years age bracket with 0.0% of them unmarried.
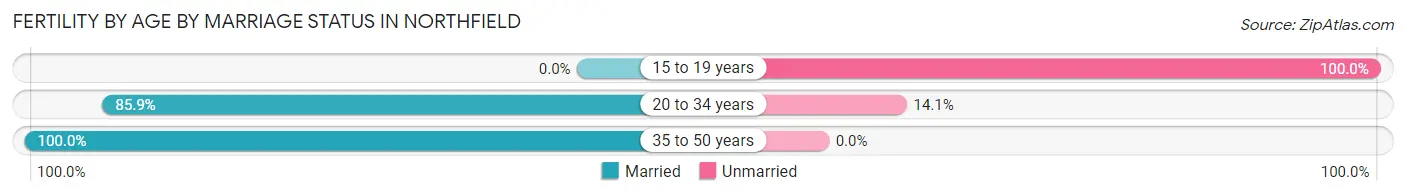
| Age Bracket | Married | Unmarried |
| 15 to 19 years | 0 (0.0%) | 3 (100.0%) |
| 20 to 34 years | 140 (85.9%) | 23 (14.1%) |
| 35 to 50 years | 7 (100.0%) | 0 (0.0%) |
| Total | 147 (85.0%) | 26 (15.0%) |
Fertility by Education in Northfield
Average fertility rate in Northfield is 28.0 births per 1,000 women. Women with the education attainment of bachelor's degree have the highest fertility rate of 75.0 births per 1,000 women, while women with the education attainment of less than high school have the lowest fertility at 5.0 births per 1,000 women. Women with the education attainment of college or associate's degree represent 50.9% of all women with births.
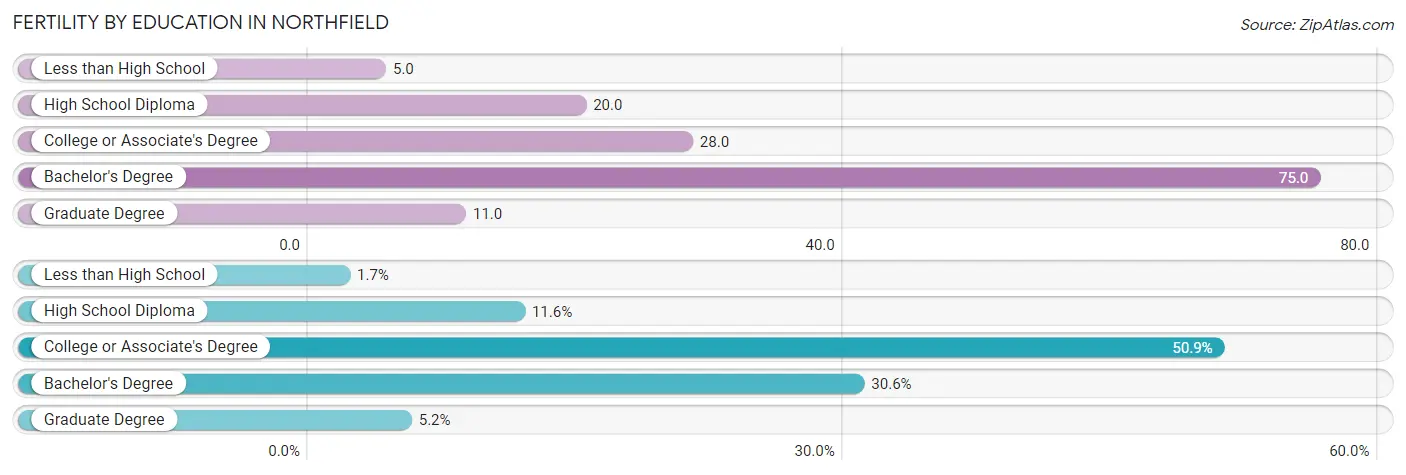
| Educational Attainment | Women with Births | Births / 1,000 Women |
| Less than High School | 3 (1.7%) | 5.0 |
| High School Diploma | 20 (11.6%) | 20.0 |
| College or Associate's Degree | 88 (50.9%) | 28.0 |
| Bachelor's Degree | 53 (30.6%) | 75.0 |
| Graduate Degree | 9 (5.2%) | 11.0 |
| Total | 173 (100.0%) | 28.0 |
Fertility by Education by Marriage Status in Northfield
15.0% of women with births in Northfield are unmarried. Women with the educational attainment of high school diploma are most likely to be married with 100.0% of them married at childbirth, while women with the educational attainment of less than high school are least likely to be married with 100.0% of them unmarried at childbirth.
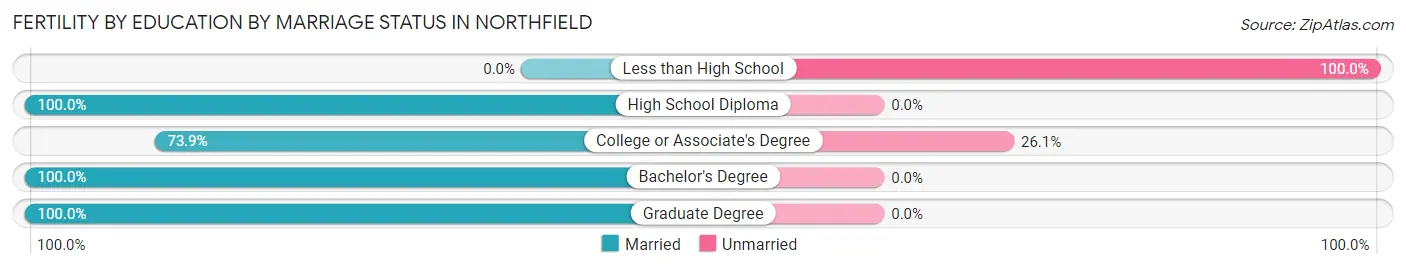
| Educational Attainment | Married | Unmarried |
| Less than High School | 0 (0.0%) | 3 (100.0%) |
| High School Diploma | 20 (100.0%) | 0 (0.0%) |
| College or Associate's Degree | 65 (73.9%) | 23 (26.1%) |
| Bachelor's Degree | 53 (100.0%) | 0 (0.0%) |
| Graduate Degree | 9 (100.0%) | 0 (0.0%) |
| Total | 147 (85.0%) | 26 (15.0%) |
Employment Characteristics in Northfield
Employment by Class of Employer in Northfield
Among the 10,397 employed individuals in Northfield, private company employees (6,306 | 60.7%), not-for-profit organizations (2,288 | 22.0%), and local government employees (649 | 6.2%) make up the most common classes of employment.
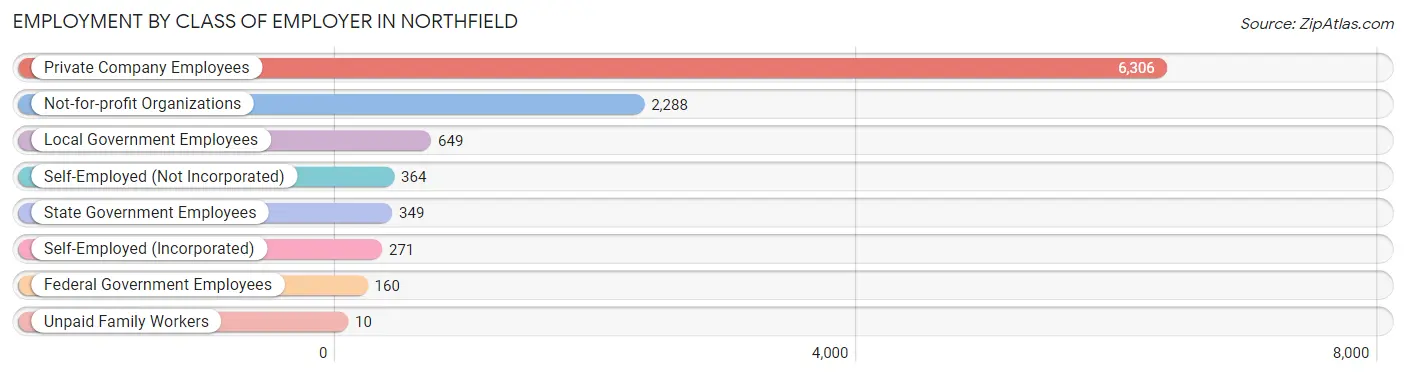
| Employer Class | # Employees | % Employees |
| Private Company Employees | 6,306 | 60.7% |
| Self-Employed (Incorporated) | 271 | 2.6% |
| Self-Employed (Not Incorporated) | 364 | 3.5% |
| Not-for-profit Organizations | 2,288 | 22.0% |
| Local Government Employees | 649 | 6.2% |
| State Government Employees | 349 | 3.4% |
| Federal Government Employees | 160 | 1.5% |
| Unpaid Family Workers | 10 | 0.1% |
| Total | 10,397 | 100.0% |
Employment Status by Age in Northfield
According to the labor force statistics for Northfield, out of the total population over 16 years of age (17,553), 65.3% or 11,462 individuals are in the labor force, with 6.2% or 711 of them unemployed. The age group with the highest labor force participation rate is 30 to 34 years, with 91.8% or 844 individuals in the labor force. Within the labor force, the 60 to 64 years age range has the highest percentage of unemployed individuals, with 16.1% or 126 of them being unemployed.
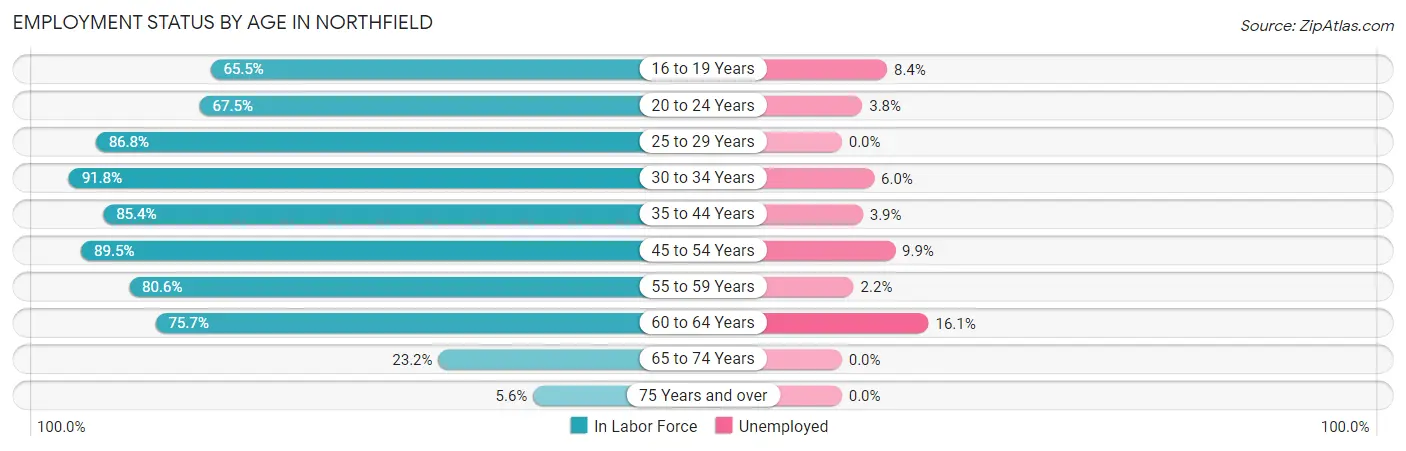
| Age Bracket | In Labor Force | Unemployed |
| 16 to 19 Years | 2,128 (65.5%) | 179 (8.4%) |
| 20 to 24 Years | 2,300 (67.5%) | 87 (3.8%) |
| 25 to 29 Years | 642 (86.8%) | 0 (0.0%) |
| 30 to 34 Years | 844 (91.8%) | 51 (6.0%) |
| 35 to 44 Years | 1,693 (85.4%) | 66 (3.9%) |
| 45 to 54 Years | 1,870 (89.5%) | 185 (9.9%) |
| 55 to 59 Years | 686 (80.6%) | 15 (2.2%) |
| 60 to 64 Years | 784 (75.7%) | 126 (16.1%) |
| 65 to 74 Years | 423 (23.2%) | 0 (0.0%) |
| 75 Years and over | 81 (5.6%) | 0 (0.0%) |
| Total | 11,462 (65.3%) | 711 (6.2%) |
Employment Status by Educational Attainment in Northfield
According to labor force statistics for Northfield, 85.6% of individuals (6,521) out of the total population between 25 and 64 years of age (7,618) are in the labor force, with 6.8% or 443 of them being unemployed. The group with the highest labor force participation rate are those with the educational attainment of less than high school, with 95.6% or 240 individuals in the labor force. Within the labor force, individuals with less than high school education have the highest percentage of unemployment, with 16.7% or 40 of them being unemployed.
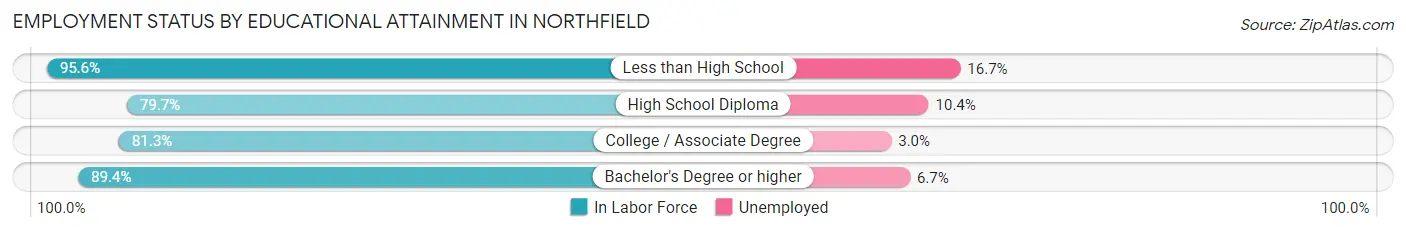
| Educational Attainment | In Labor Force | Unemployed |
| Less than High School | 240 (95.6%) | 42 (16.7%) |
| High School Diploma | 1,152 (79.7%) | 150 (10.4%) |
| College / Associate Degree | 1,674 (81.3%) | 62 (3.0%) |
| Bachelor's Degree or higher | 3,454 (89.4%) | 259 (6.7%) |
| Total | 6,521 (85.6%) | 518 (6.8%) |
Employment Occupations by Sex in Northfield
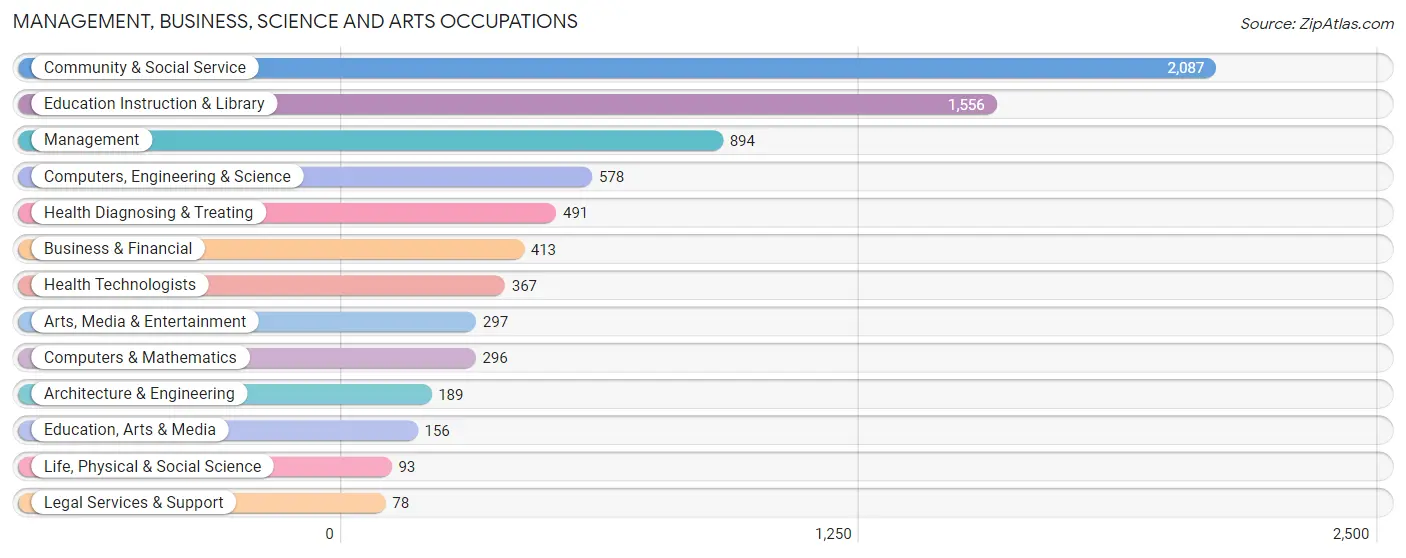
Management, Business, Science and Arts Occupations
The most common Management, Business, Science and Arts occupations in Northfield are Community & Social Service (2,087 | 19.4%), Education Instruction & Library (1,556 | 14.5%), Management (894 | 8.3%), Computers, Engineering & Science (578 | 5.4%), and Health Diagnosing & Treating (491 | 4.6%).
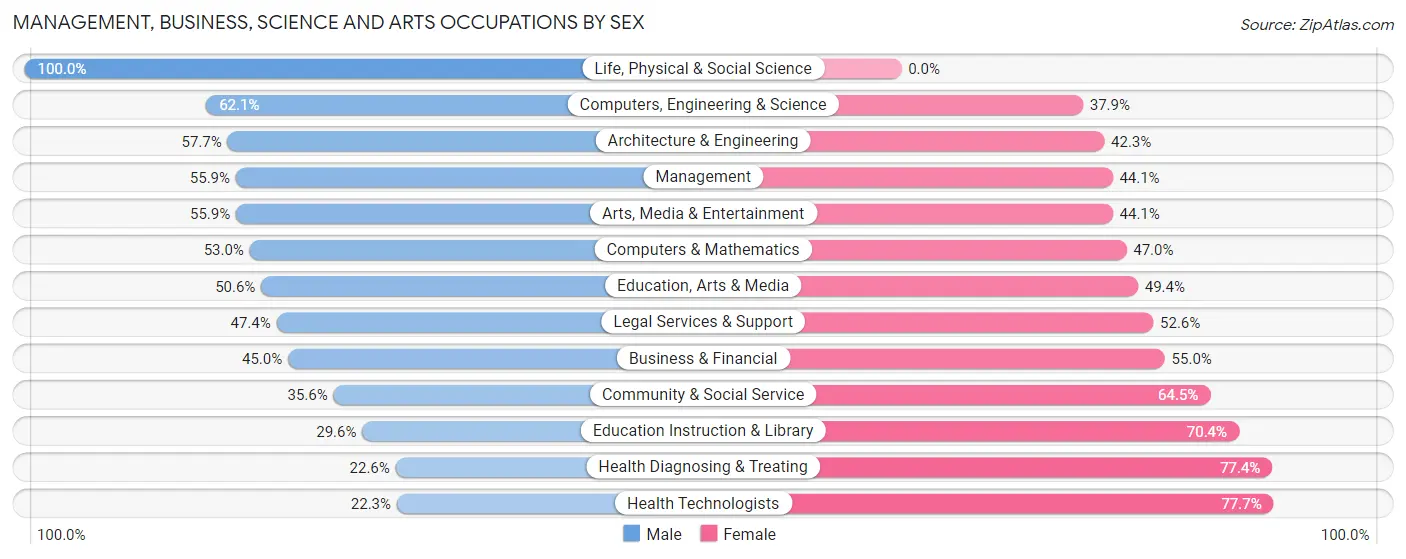
Management, Business, Science and Arts Occupations by Sex
Within the Management, Business, Science and Arts occupations in Northfield, the most male-oriented occupations are Life, Physical & Social Science (100.0%), Computers, Engineering & Science (62.1%), and Architecture & Engineering (57.7%), while the most female-oriented occupations are Health Technologists (77.7%), Health Diagnosing & Treating (77.4%), and Education Instruction & Library (70.4%).
| Occupation | Male | Female |
| Management | 500 (55.9%) | 394 (44.1%) |
| Business & Financial | 186 (45.0%) | 227 (55.0%) |
| Computers, Engineering & Science | 359 (62.1%) | 219 (37.9%) |
| Computers & Mathematics | 157 (53.0%) | 139 (47.0%) |
| Architecture & Engineering | 109 (57.7%) | 80 (42.3%) |
| Life, Physical & Social Science | 93 (100.0%) | 0 (0.0%) |
| Community & Social Service | 742 (35.5%) | 1,345 (64.4%) |
| Education, Arts & Media | 79 (50.6%) | 77 (49.4%) |
| Legal Services & Support | 37 (47.4%) | 41 (52.6%) |
| Education Instruction & Library | 460 (29.6%) | 1,096 (70.4%) |
| Arts, Media & Entertainment | 166 (55.9%) | 131 (44.1%) |
| Health Diagnosing & Treating | 111 (22.6%) | 380 (77.4%) |
| Health Technologists | 82 (22.3%) | 285 (77.7%) |
| Total (Category) | 1,898 (42.5%) | 2,565 (57.5%) |
| Total (Overall) | 5,081 (47.3%) | 5,655 (52.7%) |
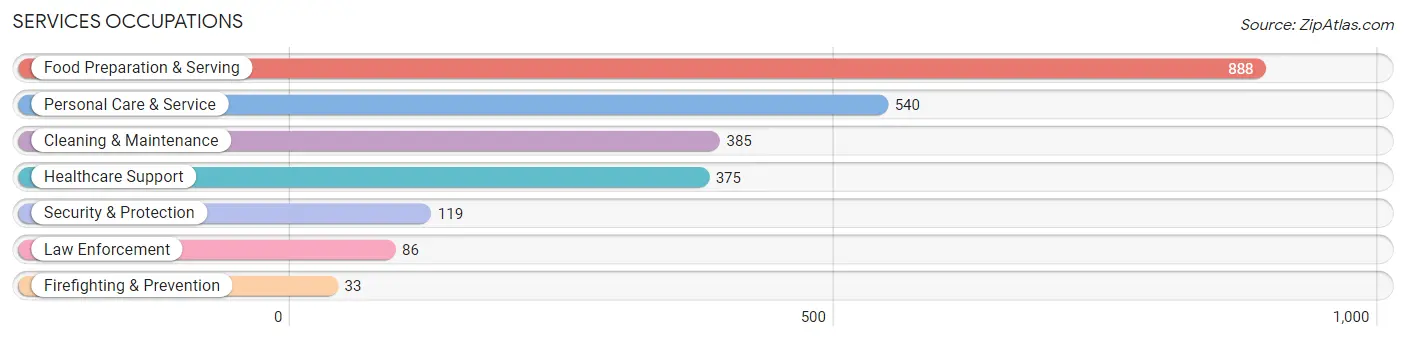
Services Occupations
The most common Services occupations in Northfield are Food Preparation & Serving (888 | 8.3%), Personal Care & Service (540 | 5.0%), Cleaning & Maintenance (385 | 3.6%), Healthcare Support (375 | 3.5%), and Security & Protection (119 | 1.1%).
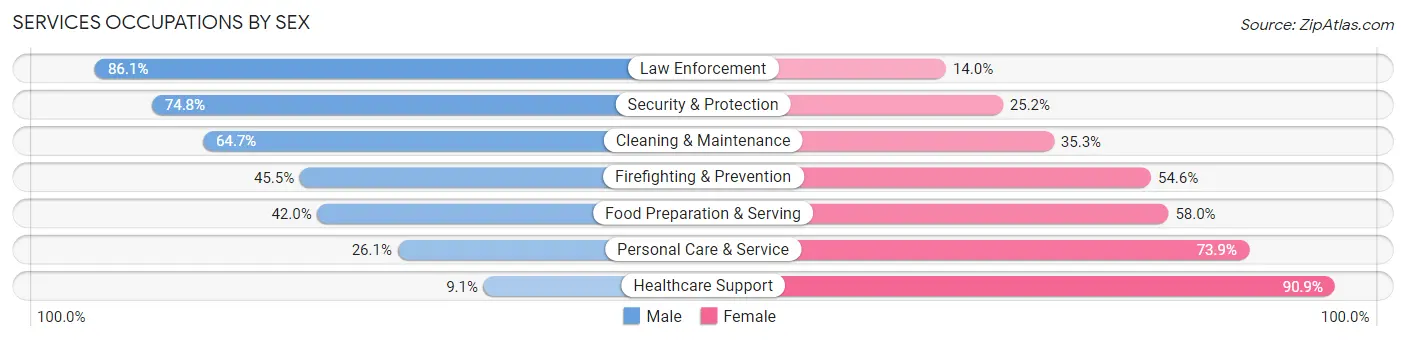
Services Occupations by Sex
Within the Services occupations in Northfield, the most male-oriented occupations are Law Enforcement (86.1%), Security & Protection (74.8%), and Cleaning & Maintenance (64.7%), while the most female-oriented occupations are Healthcare Support (90.9%), Personal Care & Service (73.9%), and Food Preparation & Serving (58.0%).
| Occupation | Male | Female |
| Healthcare Support | 34 (9.1%) | 341 (90.9%) |
| Security & Protection | 89 (74.8%) | 30 (25.2%) |
| Firefighting & Prevention | 15 (45.5%) | 18 (54.5%) |
| Law Enforcement | 74 (86.1%) | 12 (14.0%) |
| Food Preparation & Serving | 373 (42.0%) | 515 (58.0%) |
| Cleaning & Maintenance | 249 (64.7%) | 136 (35.3%) |
| Personal Care & Service | 141 (26.1%) | 399 (73.9%) |
| Total (Category) | 886 (38.4%) | 1,421 (61.6%) |
| Total (Overall) | 5,081 (47.3%) | 5,655 (52.7%) |
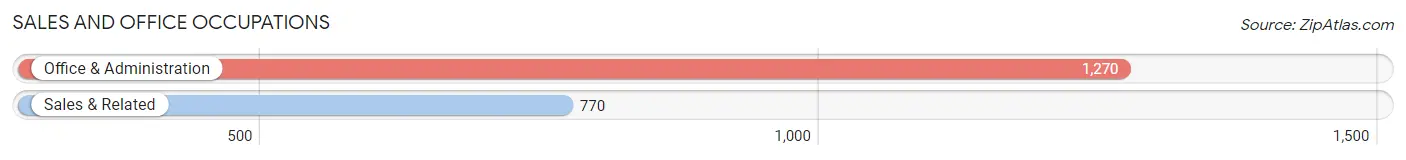
Sales and Office Occupations
The most common Sales and Office occupations in Northfield are Office & Administration (1,270 | 11.8%), and Sales & Related (770 | 7.2%).
Sales and Office Occupations by Sex
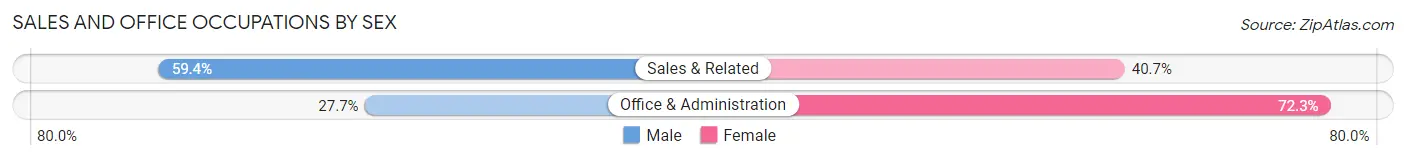
| Occupation | Male | Female |
| Sales & Related | 457 (59.4%) | 313 (40.6%) |
| Office & Administration | 352 (27.7%) | 918 (72.3%) |
| Total (Category) | 809 (39.7%) | 1,231 (60.3%) |
| Total (Overall) | 5,081 (47.3%) | 5,655 (52.7%) |
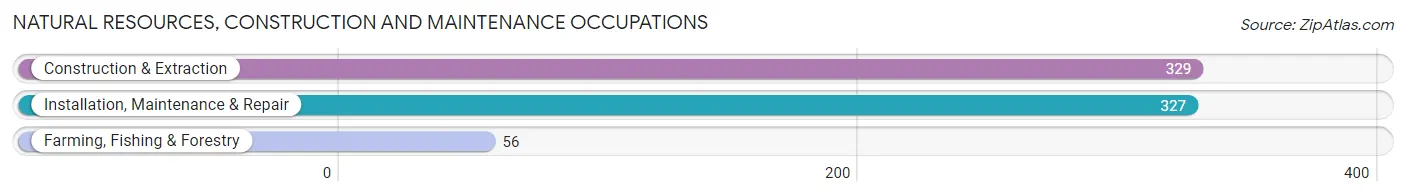
Natural Resources, Construction and Maintenance Occupations
The most common Natural Resources, Construction and Maintenance occupations in Northfield are Construction & Extraction (329 | 3.1%), Installation, Maintenance & Repair (327 | 3.0%), and Farming, Fishing & Forestry (56 | 0.5%).
Natural Resources, Construction and Maintenance Occupations by Sex
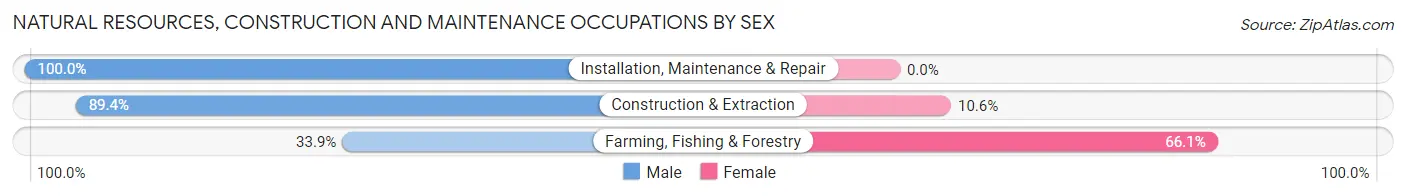
| Occupation | Male | Female |
| Farming, Fishing & Forestry | 19 (33.9%) | 37 (66.1%) |
| Construction & Extraction | 294 (89.4%) | 35 (10.6%) |
| Installation, Maintenance & Repair | 327 (100.0%) | 0 (0.0%) |
| Total (Category) | 640 (89.9%) | 72 (10.1%) |
| Total (Overall) | 5,081 (47.3%) | 5,655 (52.7%) |
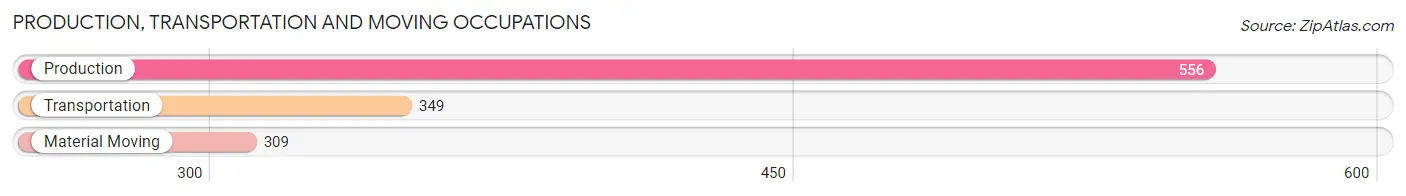
Production, Transportation and Moving Occupations
The most common Production, Transportation and Moving occupations in Northfield are Production (556 | 5.2%), Transportation (349 | 3.3%), and Material Moving (309 | 2.9%).
Production, Transportation and Moving Occupations by Sex
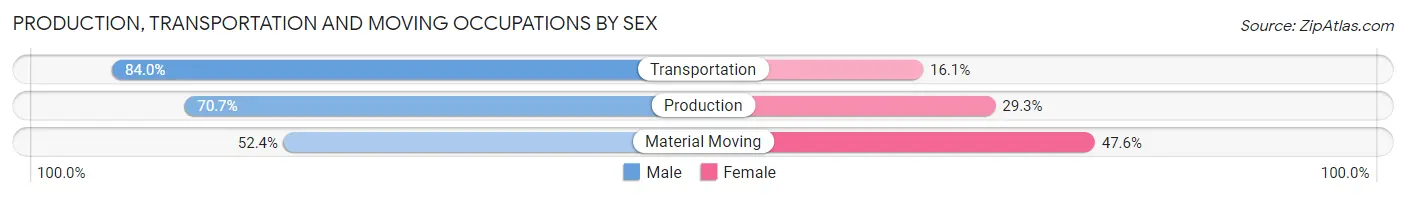
| Occupation | Male | Female |
| Production | 393 (70.7%) | 163 (29.3%) |
| Transportation | 293 (84.0%) | 56 (16.1%) |
| Material Moving | 162 (52.4%) | 147 (47.6%) |
| Total (Category) | 848 (69.9%) | 366 (30.1%) |
| Total (Overall) | 5,081 (47.3%) | 5,655 (52.7%) |
Employment Industries by Sex in Northfield
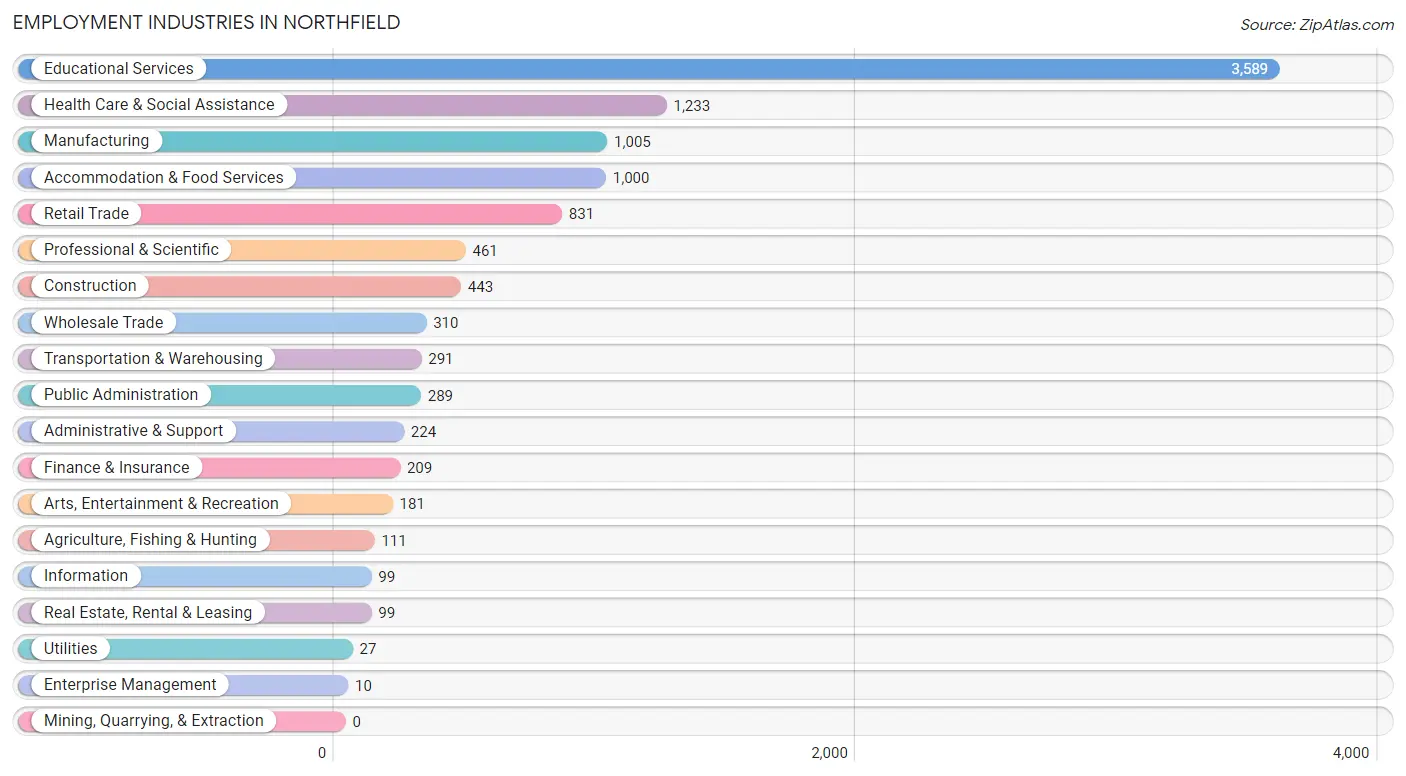
Employment Industries in Northfield
The major employment industries in Northfield include Educational Services (3,589 | 33.4%), Health Care & Social Assistance (1,233 | 11.5%), Manufacturing (1,005 | 9.4%), Accommodation & Food Services (1,000 | 9.3%), and Retail Trade (831 | 7.7%).
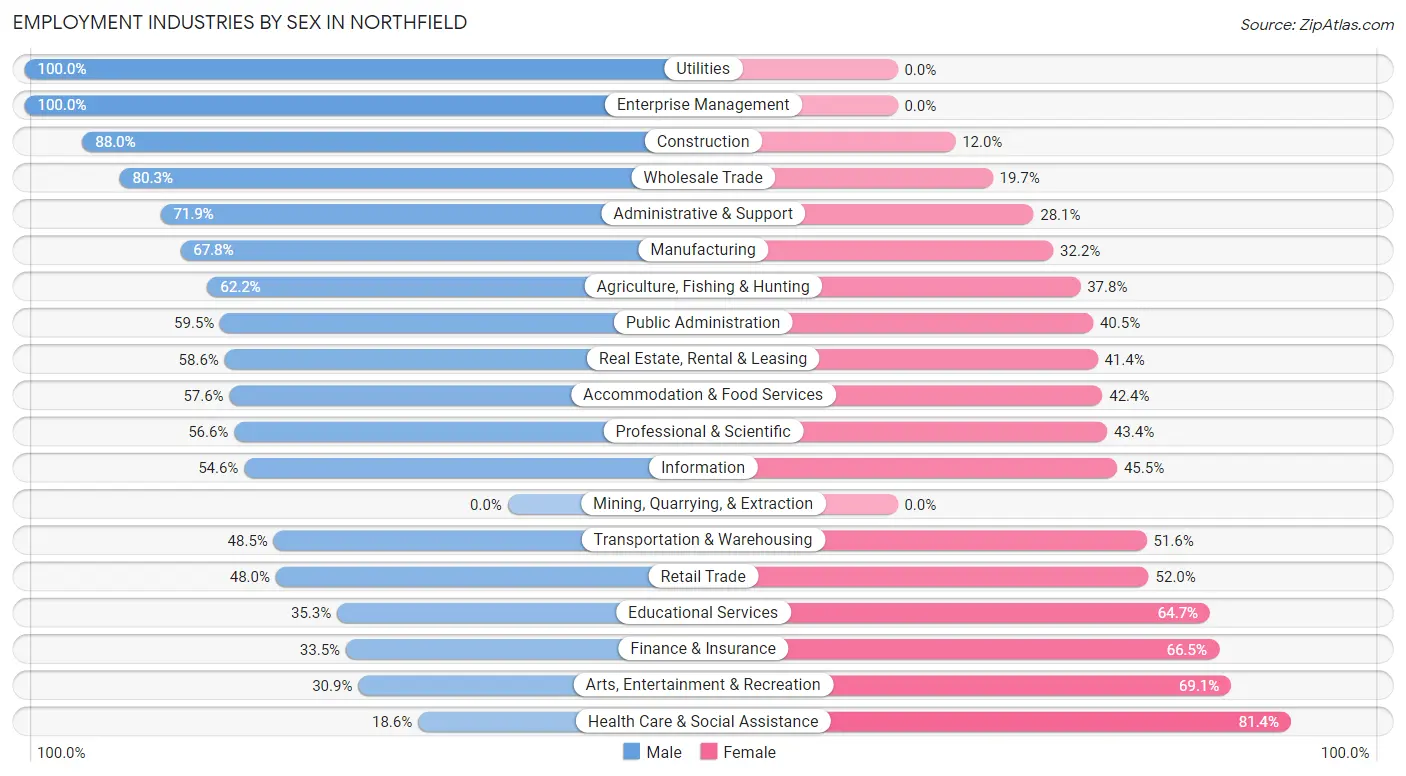
Employment Industries by Sex in Northfield
The Northfield industries that see more men than women are Utilities (100.0%), Enterprise Management (100.0%), and Construction (88.0%), whereas the industries that tend to have a higher number of women are Health Care & Social Assistance (81.4%), Arts, Entertainment & Recreation (69.1%), and Finance & Insurance (66.5%).
| Industry | Male | Female |
| Agriculture, Fishing & Hunting | 69 (62.2%) | 42 (37.8%) |
| Mining, Quarrying, & Extraction | 0 (0.0%) | 0 (0.0%) |
| Construction | 390 (88.0%) | 53 (12.0%) |
| Manufacturing | 681 (67.8%) | 324 (32.2%) |
| Wholesale Trade | 249 (80.3%) | 61 (19.7%) |
| Retail Trade | 399 (48.0%) | 432 (52.0%) |
| Transportation & Warehousing | 141 (48.4%) | 150 (51.5%) |
| Utilities | 27 (100.0%) | 0 (0.0%) |
| Information | 54 (54.5%) | 45 (45.5%) |
| Finance & Insurance | 70 (33.5%) | 139 (66.5%) |
| Real Estate, Rental & Leasing | 58 (58.6%) | 41 (41.4%) |
| Professional & Scientific | 261 (56.6%) | 200 (43.4%) |
| Enterprise Management | 10 (100.0%) | 0 (0.0%) |
| Administrative & Support | 161 (71.9%) | 63 (28.1%) |
| Educational Services | 1,268 (35.3%) | 2,321 (64.7%) |
| Health Care & Social Assistance | 229 (18.6%) | 1,004 (81.4%) |
| Arts, Entertainment & Recreation | 56 (30.9%) | 125 (69.1%) |
| Accommodation & Food Services | 576 (57.6%) | 424 (42.4%) |
| Public Administration | 172 (59.5%) | 117 (40.5%) |
| Total | 5,081 (47.3%) | 5,655 (52.7%) |
Education in Northfield
School Enrollment in Northfield
The most common levels of schooling among the 8,627 students in Northfield are college / undergraduate (5,490 | 63.6%), middle school (1,043 | 12.1%), and high school (873 | 10.1%).
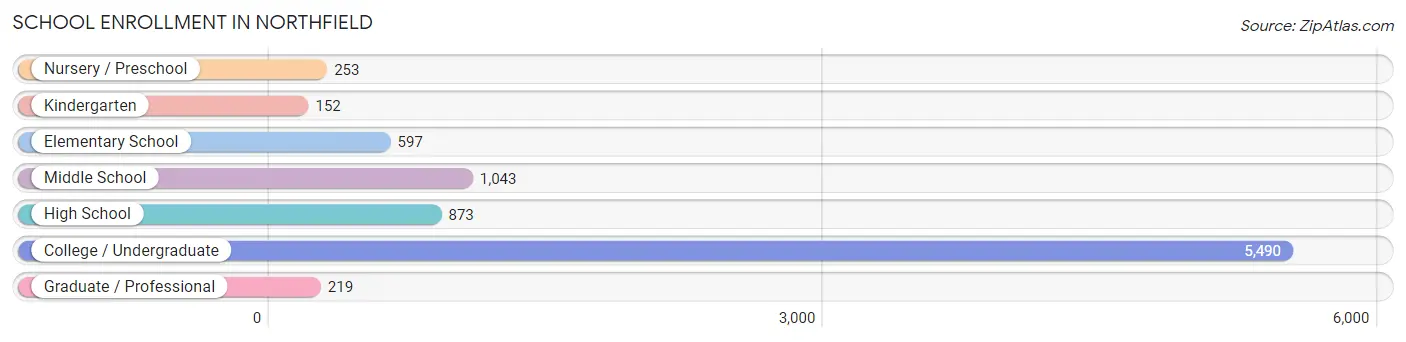
| School Level | # Students | % Students |
| Nursery / Preschool | 253 | 2.9% |
| Kindergarten | 152 | 1.8% |
| Elementary School | 597 | 6.9% |
| Middle School | 1,043 | 12.1% |
| High School | 873 | 10.1% |
| College / Undergraduate | 5,490 | 63.6% |
| Graduate / Professional | 219 | 2.5% |
| Total | 8,627 | 100.0% |
School Enrollment by Age by Funding Source in Northfield
Out of a total of 8,627 students who are enrolled in schools in Northfield, 4,831 (56.0%) attend a private institution, while the remaining 3,796 (44.0%) are enrolled in public schools. The age group of 20 to 24 year olds has the highest likelihood of being enrolled in private schools, with 2,388 (85.7% in the age bracket) enrolled. Conversely, the age group of 15 to 17 year olds has the lowest likelihood of being enrolled in a private school, with 564 (95.9% in the age bracket) attending a public institution.
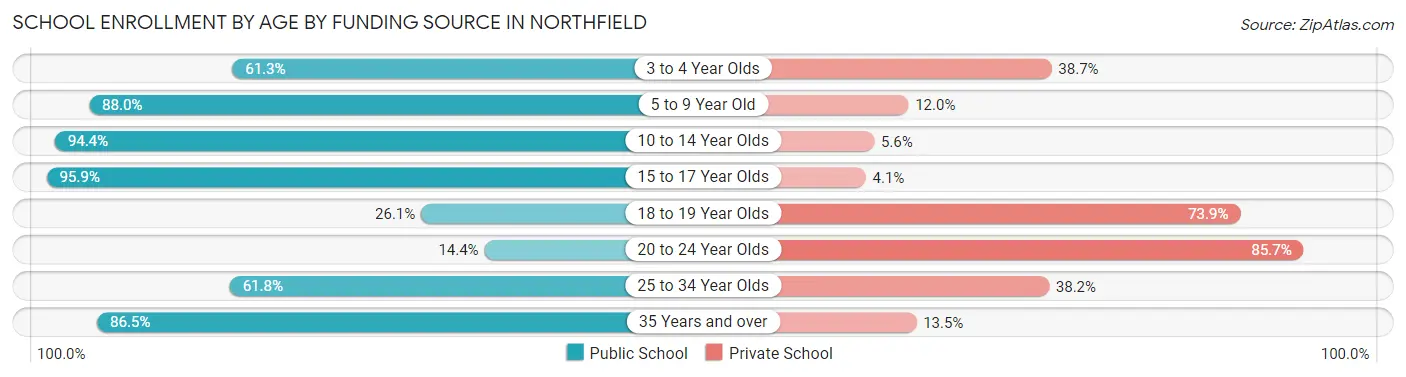
| Age Bracket | Public School | Private School |
| 3 to 4 Year Olds | 122 (61.3%) | 77 (38.7%) |
| 5 to 9 Year Old | 636 (88.0%) | 87 (12.0%) |
| 10 to 14 Year Olds | 1,121 (94.4%) | 67 (5.6%) |
| 15 to 17 Year Olds | 564 (95.9%) | 24 (4.1%) |
| 18 to 19 Year Olds | 742 (26.1%) | 2,097 (73.9%) |
| 20 to 24 Year Olds | 400 (14.3%) | 2,388 (85.7%) |
| 25 to 34 Year Olds | 118 (61.8%) | 73 (38.2%) |
| 35 Years and over | 96 (86.5%) | 15 (13.5%) |
| Total | 3,796 (44.0%) | 4,831 (56.0%) |
Educational Attainment by Field of Study in Northfield
Education (1,006 | 15.3%), social sciences (679 | 10.3%), liberal arts & history (632 | 9.6%), literature & languages (594 | 9.0%), and business (556 | 8.5%) are the most common fields of study among 6,566 individuals in Northfield who have obtained a bachelor's degree or higher.
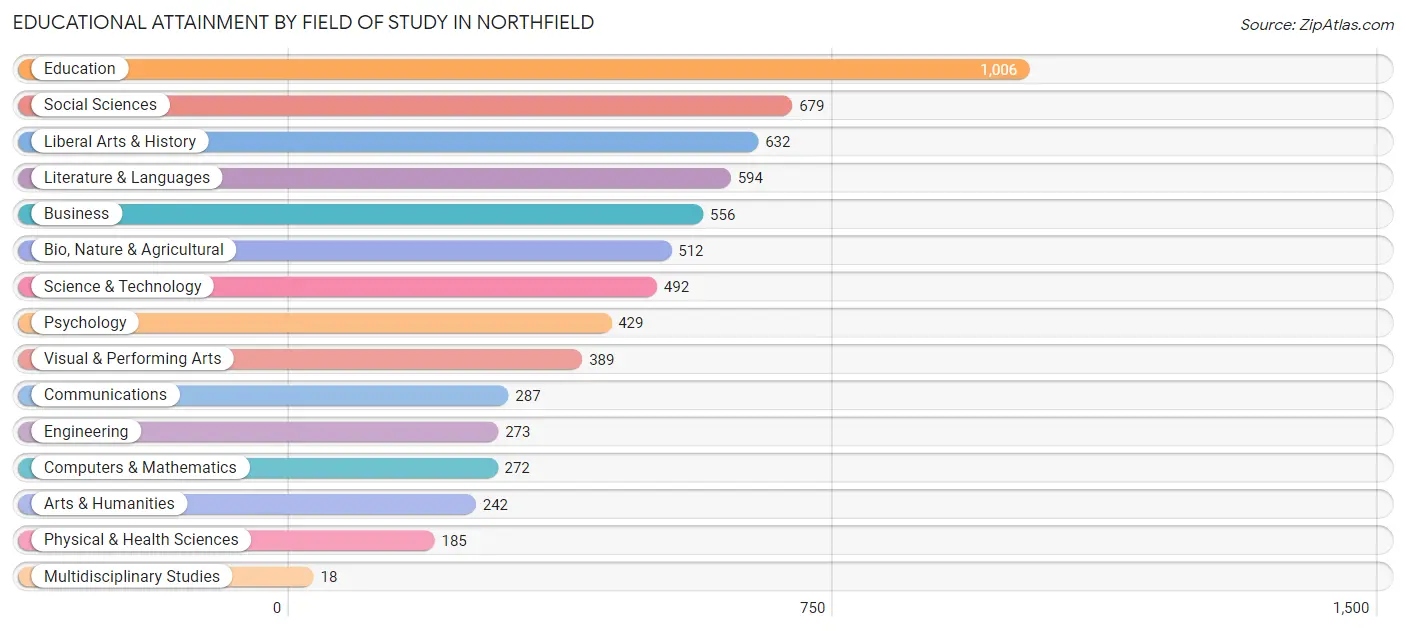
| Field of Study | # Graduates | % Graduates |
| Computers & Mathematics | 272 | 4.1% |
| Bio, Nature & Agricultural | 512 | 7.8% |
| Physical & Health Sciences | 185 | 2.8% |
| Psychology | 429 | 6.5% |
| Social Sciences | 679 | 10.3% |
| Engineering | 273 | 4.2% |
| Multidisciplinary Studies | 18 | 0.3% |
| Science & Technology | 492 | 7.5% |
| Business | 556 | 8.5% |
| Education | 1,006 | 15.3% |
| Literature & Languages | 594 | 9.0% |
| Liberal Arts & History | 632 | 9.6% |
| Visual & Performing Arts | 389 | 5.9% |
| Communications | 287 | 4.4% |
| Arts & Humanities | 242 | 3.7% |
| Total | 6,566 | 100.0% |
Transportation & Commute in Northfield
Vehicle Availability by Sex in Northfield
The most prevalent vehicle ownership categories in Northfield are males with 2 vehicles (2,153, accounting for 56.2%) and females with 2 vehicles (1,657, making up 61.5%).
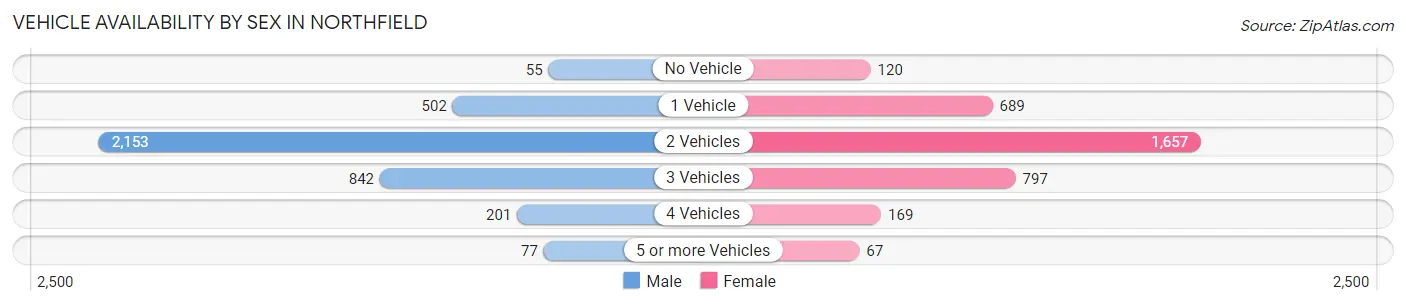
| Vehicles Available | Male | Female |
| No Vehicle | 55 (1.4%) | 120 (3.4%) |
| 1 Vehicle | 502 (13.1%) | 689 (19.7%) |
| 2 Vehicles | 2,153 (56.2%) | 1,657 (47.4%) |
| 3 Vehicles | 842 (22.0%) | 797 (22.8%) |
| 4 Vehicles | 201 (5.2%) | 169 (4.8%) |
| 5 or more Vehicles | 77 (2.0%) | 67 (1.9%) |
| Total | 3,830 (100.0%) | 3,499 (100.0%) |
Commute Time in Northfield
The most frequently occuring commute durations in Northfield are 5 to 9 minutes (2,135 commuters, 26.8%), 10 to 14 minutes (1,667 commuters, 20.9%), and 45 to 59 minutes (742 commuters, 9.3%).
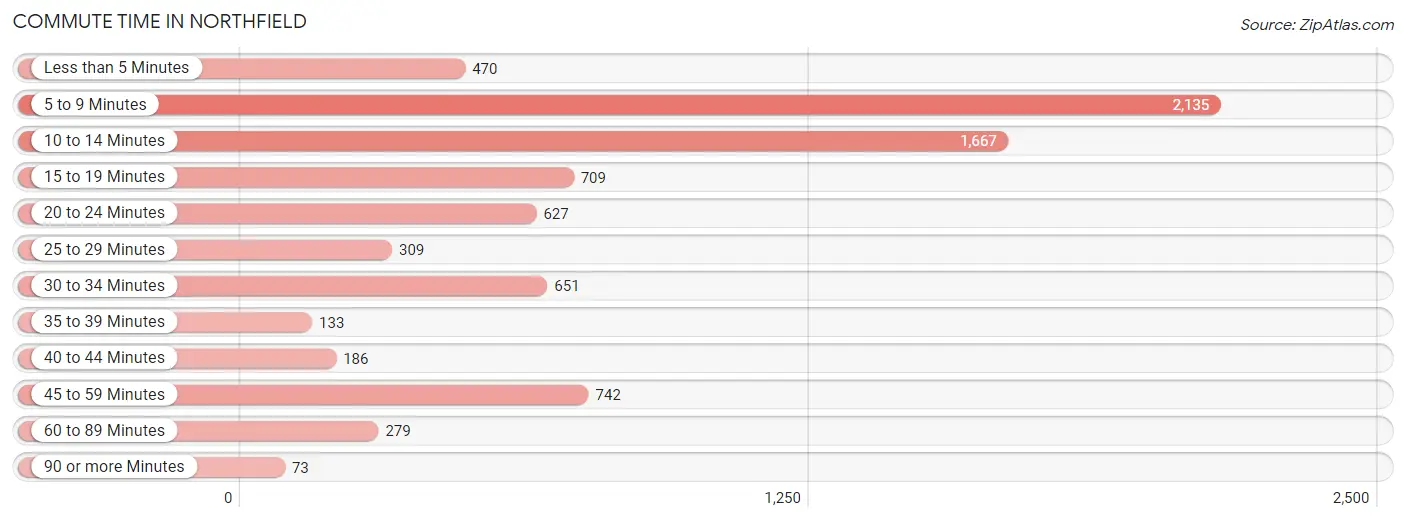
| Commute Time | # Commuters | % Commuters |
| Less than 5 Minutes | 470 | 5.9% |
| 5 to 9 Minutes | 2,135 | 26.8% |
| 10 to 14 Minutes | 1,667 | 20.9% |
| 15 to 19 Minutes | 709 | 8.9% |
| 20 to 24 Minutes | 627 | 7.9% |
| 25 to 29 Minutes | 309 | 3.9% |
| 30 to 34 Minutes | 651 | 8.2% |
| 35 to 39 Minutes | 133 | 1.7% |
| 40 to 44 Minutes | 186 | 2.3% |
| 45 to 59 Minutes | 742 | 9.3% |
| 60 to 89 Minutes | 279 | 3.5% |
| 90 or more Minutes | 73 | 0.9% |
Commute Time by Sex in Northfield
The most common commute times in Northfield are 5 to 9 minutes (851 commuters, 21.9%) for males and 5 to 9 minutes (1,284 commuters, 31.3%) for females.
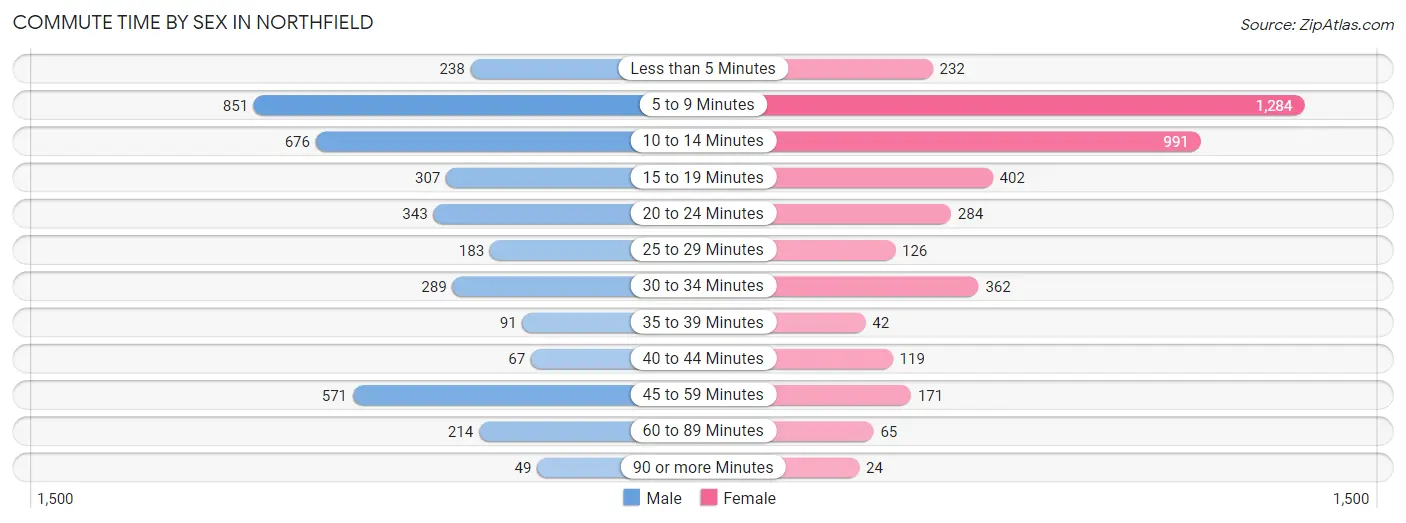
| Commute Time | Male | Female |
| Less than 5 Minutes | 238 (6.1%) | 232 (5.7%) |
| 5 to 9 Minutes | 851 (21.9%) | 1,284 (31.3%) |
| 10 to 14 Minutes | 676 (17.4%) | 991 (24.2%) |
| 15 to 19 Minutes | 307 (7.9%) | 402 (9.8%) |
| 20 to 24 Minutes | 343 (8.8%) | 284 (6.9%) |
| 25 to 29 Minutes | 183 (4.7%) | 126 (3.1%) |
| 30 to 34 Minutes | 289 (7.4%) | 362 (8.8%) |
| 35 to 39 Minutes | 91 (2.4%) | 42 (1.0%) |
| 40 to 44 Minutes | 67 (1.7%) | 119 (2.9%) |
| 45 to 59 Minutes | 571 (14.7%) | 171 (4.2%) |
| 60 to 89 Minutes | 214 (5.5%) | 65 (1.6%) |
| 90 or more Minutes | 49 (1.3%) | 24 (0.6%) |
Time of Departure to Work by Sex in Northfield
The most frequent times of departure to work in Northfield are 7:00 AM to 7:29 AM (568, 14.6%) for males and 12:00 PM to 3:59 PM (828, 20.2%) for females.
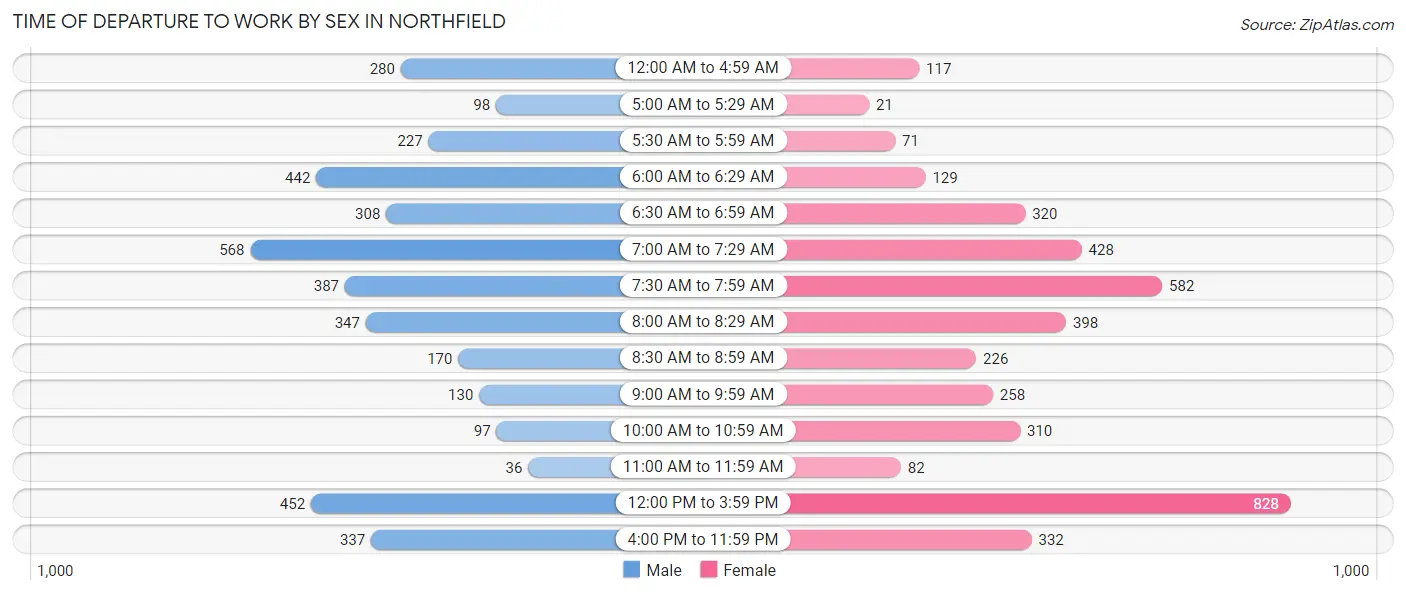
| Time of Departure | Male | Female |
| 12:00 AM to 4:59 AM | 280 (7.2%) | 117 (2.9%) |
| 5:00 AM to 5:29 AM | 98 (2.5%) | 21 (0.5%) |
| 5:30 AM to 5:59 AM | 227 (5.9%) | 71 (1.7%) |
| 6:00 AM to 6:29 AM | 442 (11.4%) | 129 (3.1%) |
| 6:30 AM to 6:59 AM | 308 (7.9%) | 320 (7.8%) |
| 7:00 AM to 7:29 AM | 568 (14.6%) | 428 (10.4%) |
| 7:30 AM to 7:59 AM | 387 (10.0%) | 582 (14.2%) |
| 8:00 AM to 8:29 AM | 347 (8.9%) | 398 (9.7%) |
| 8:30 AM to 8:59 AM | 170 (4.4%) | 226 (5.5%) |
| 9:00 AM to 9:59 AM | 130 (3.4%) | 258 (6.3%) |
| 10:00 AM to 10:59 AM | 97 (2.5%) | 310 (7.6%) |
| 11:00 AM to 11:59 AM | 36 (0.9%) | 82 (2.0%) |
| 12:00 PM to 3:59 PM | 452 (11.7%) | 828 (20.2%) |
| 4:00 PM to 11:59 PM | 337 (8.7%) | 332 (8.1%) |
| Total | 3,879 (100.0%) | 4,102 (100.0%) |
Housing Occupancy in Northfield
Occupancy by Ownership in Northfield
Of the total 6,328 dwellings in Northfield, owner-occupied units account for 4,444 (70.2%), while renter-occupied units make up 1,884 (29.8%).
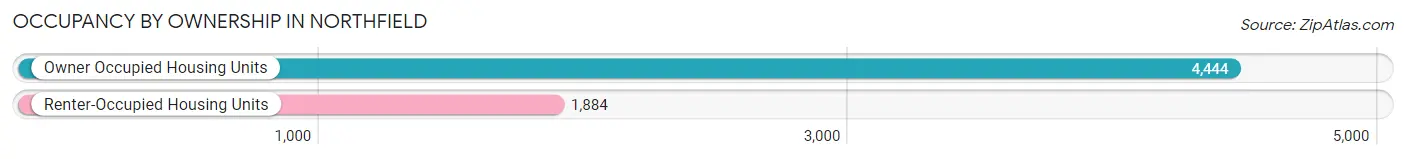
| Occupancy | # Housing Units | % Housing Units |
| Owner Occupied Housing Units | 4,444 | 70.2% |
| Renter-Occupied Housing Units | 1,884 | 29.8% |
| Total Occupied Housing Units | 6,328 | 100.0% |
Occupancy by Household Size in Northfield
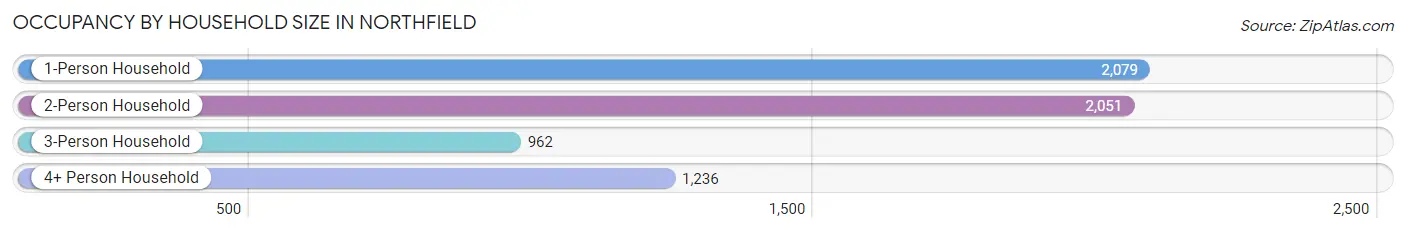
| Household Size | # Housing Units | % Housing Units |
| 1-Person Household | 2,079 | 32.9% |
| 2-Person Household | 2,051 | 32.4% |
| 3-Person Household | 962 | 15.2% |
| 4+ Person Household | 1,236 | 19.5% |
| Total Housing Units | 6,328 | 100.0% |
Occupancy by Ownership by Household Size in Northfield
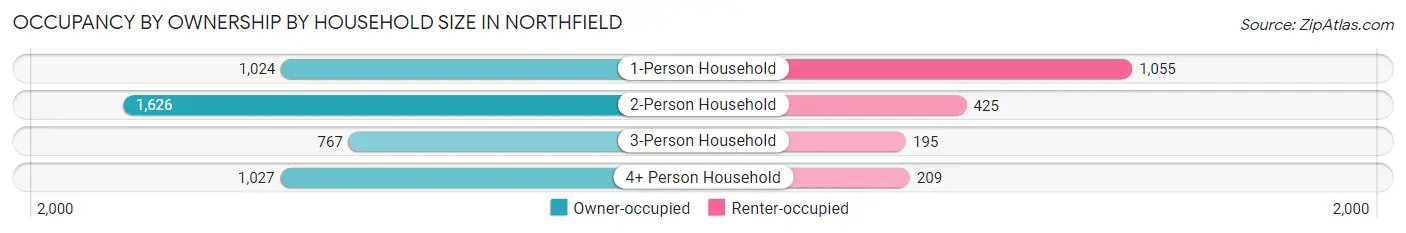
| Household Size | Owner-occupied | Renter-occupied |
| 1-Person Household | 1,024 (49.2%) | 1,055 (50.7%) |
| 2-Person Household | 1,626 (79.3%) | 425 (20.7%) |
| 3-Person Household | 767 (79.7%) | 195 (20.3%) |
| 4+ Person Household | 1,027 (83.1%) | 209 (16.9%) |
| Total Housing Units | 4,444 (70.2%) | 1,884 (29.8%) |
Occupancy by Educational Attainment in Northfield
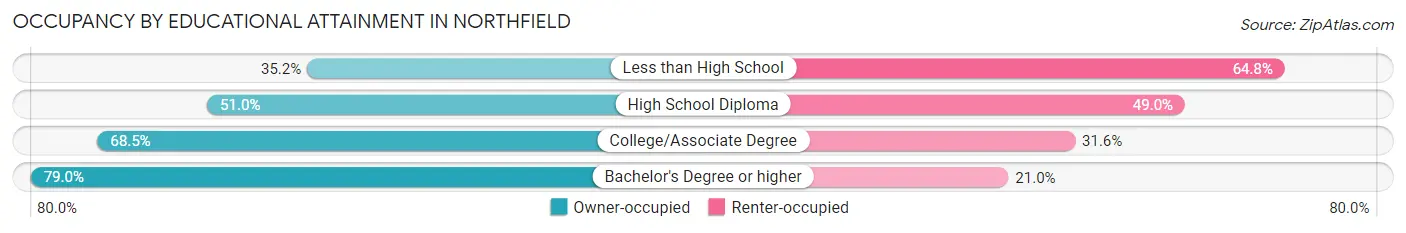
| Household Size | Owner-occupied | Renter-occupied |
| Less than High School | 63 (35.2%) | 116 (64.8%) |
| High School Diploma | 567 (51.0%) | 544 (49.0%) |
| College/Associate Degree | 1,085 (68.4%) | 500 (31.6%) |
| Bachelor's Degree or higher | 2,729 (79.0%) | 724 (21.0%) |
Occupancy by Age of Householder in Northfield
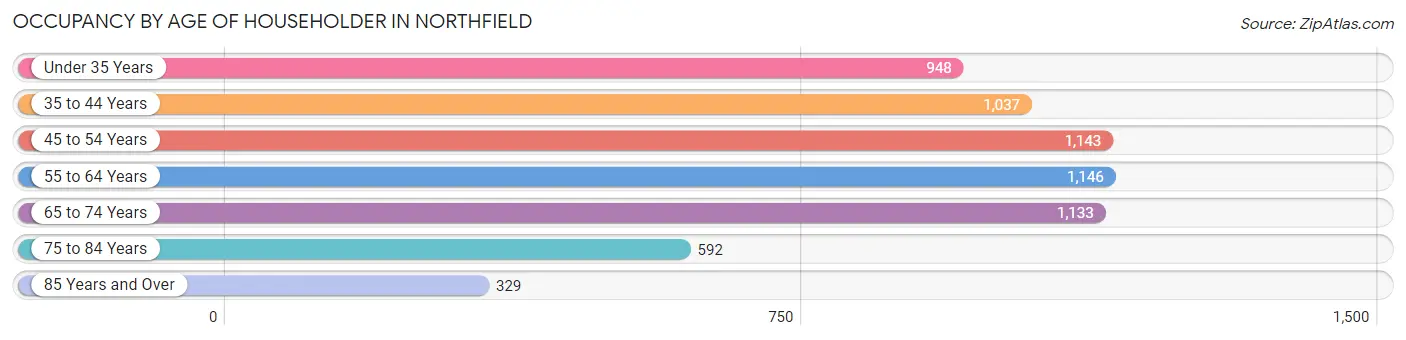
| Age Bracket | # Households | % Households |
| Under 35 Years | 948 | 15.0% |
| 35 to 44 Years | 1,037 | 16.4% |
| 45 to 54 Years | 1,143 | 18.1% |
| 55 to 64 Years | 1,146 | 18.1% |
| 65 to 74 Years | 1,133 | 17.9% |
| 75 to 84 Years | 592 | 9.4% |
| 85 Years and Over | 329 | 5.2% |
| Total | 6,328 | 100.0% |
Housing Finances in Northfield
Median Income by Occupancy in Northfield
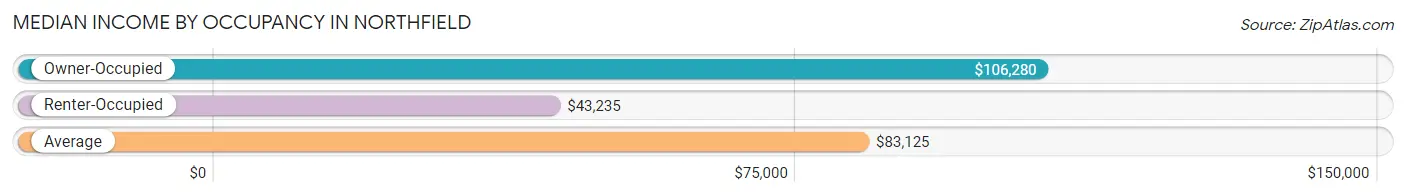
| Occupancy Type | # Households | Median Income |
| Owner-Occupied | 4,444 (70.2%) | $106,280 |
| Renter-Occupied | 1,884 (29.8%) | $43,235 |
| Average | 6,328 (100.0%) | $83,125 |
Occupancy by Householder Income Bracket in Northfield
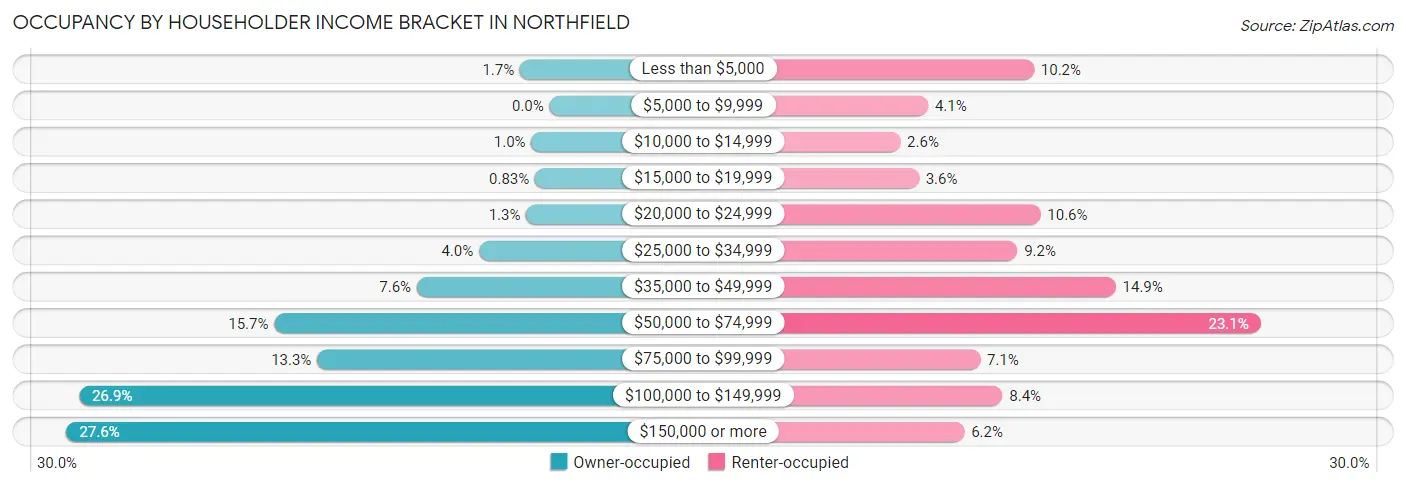
| Income Bracket | Owner-occupied | Renter-occupied |
| Less than $5,000 | 75 (1.7%) | 192 (10.2%) |
| $5,000 to $9,999 | 0 (0.0%) | 78 (4.1%) |
| $10,000 to $14,999 | 46 (1.0%) | 48 (2.5%) |
| $15,000 to $19,999 | 37 (0.8%) | 68 (3.6%) |
| $20,000 to $24,999 | 59 (1.3%) | 199 (10.6%) |
| $25,000 to $34,999 | 179 (4.0%) | 174 (9.2%) |
| $35,000 to $49,999 | 337 (7.6%) | 280 (14.9%) |
| $50,000 to $74,999 | 699 (15.7%) | 436 (23.1%) |
| $75,000 to $99,999 | 590 (13.3%) | 134 (7.1%) |
| $100,000 to $149,999 | 1,195 (26.9%) | 158 (8.4%) |
| $150,000 or more | 1,227 (27.6%) | 117 (6.2%) |
| Total | 4,444 (100.0%) | 1,884 (100.0%) |
Monthly Housing Cost Tiers in Northfield
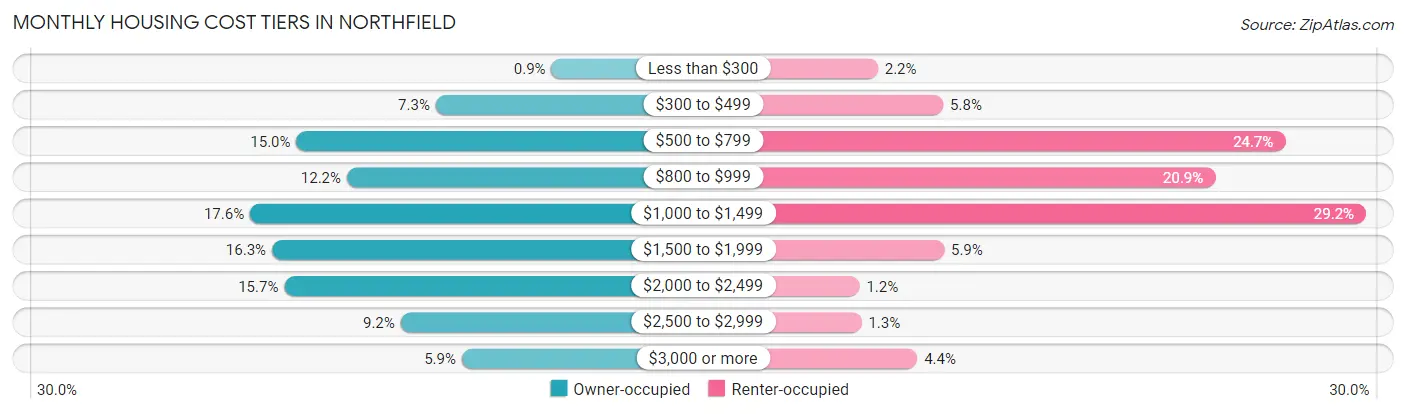
| Monthly Cost | Owner-occupied | Renter-occupied |
| Less than $300 | 40 (0.9%) | 42 (2.2%) |
| $300 to $499 | 324 (7.3%) | 110 (5.8%) |
| $500 to $799 | 666 (15.0%) | 466 (24.7%) |
| $800 to $999 | 542 (12.2%) | 393 (20.9%) |
| $1,000 to $1,499 | 780 (17.5%) | 550 (29.2%) |
| $1,500 to $1,999 | 726 (16.3%) | 111 (5.9%) |
| $2,000 to $2,499 | 696 (15.7%) | 23 (1.2%) |
| $2,500 to $2,999 | 410 (9.2%) | 25 (1.3%) |
| $3,000 or more | 260 (5.9%) | 83 (4.4%) |
| Total | 4,444 (100.0%) | 1,884 (100.0%) |
Physical Housing Characteristics in Northfield
Housing Structures in Northfield
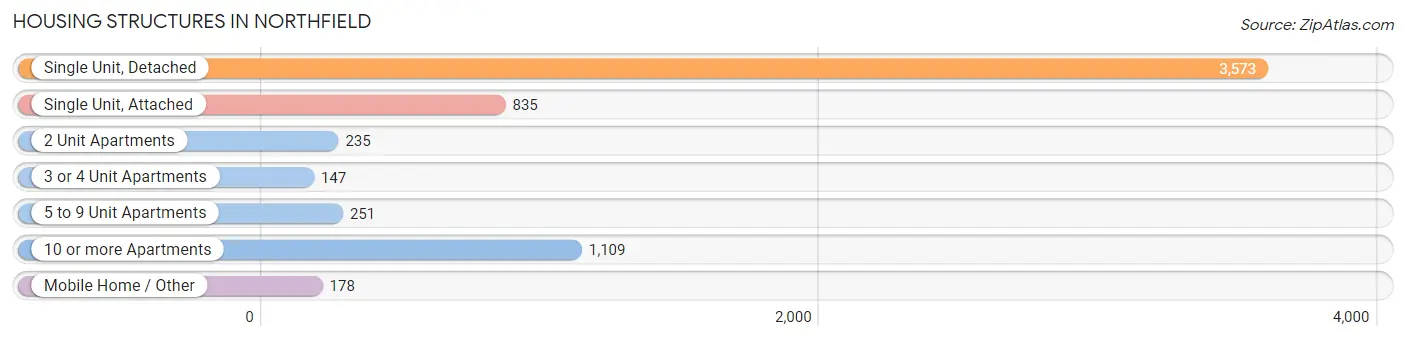
| Structure Type | # Housing Units | % Housing Units |
| Single Unit, Detached | 3,573 | 56.5% |
| Single Unit, Attached | 835 | 13.2% |
| 2 Unit Apartments | 235 | 3.7% |
| 3 or 4 Unit Apartments | 147 | 2.3% |
| 5 to 9 Unit Apartments | 251 | 4.0% |
| 10 or more Apartments | 1,109 | 17.5% |
| Mobile Home / Other | 178 | 2.8% |
| Total | 6,328 | 100.0% |
Housing Structures by Occupancy in Northfield
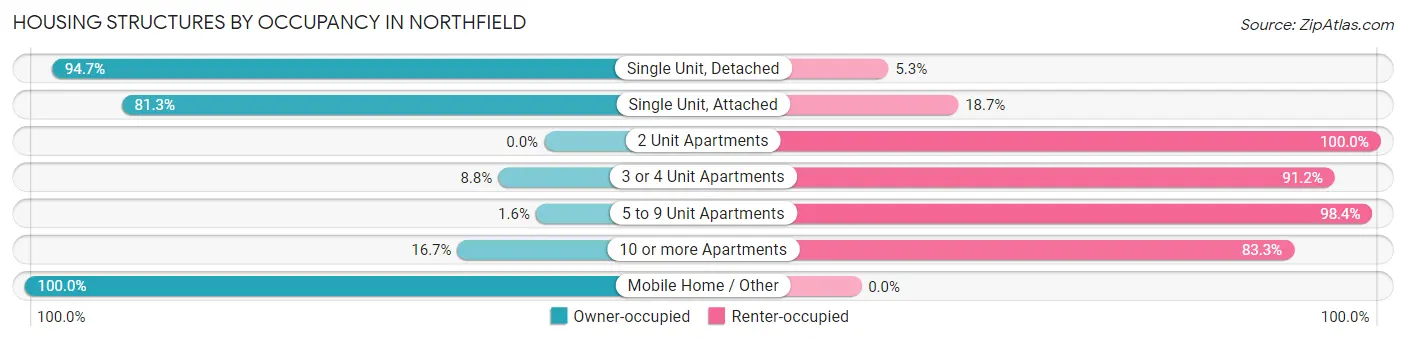
| Structure Type | Owner-occupied | Renter-occupied |
| Single Unit, Detached | 3,385 (94.7%) | 188 (5.3%) |
| Single Unit, Attached | 679 (81.3%) | 156 (18.7%) |
| 2 Unit Apartments | 0 (0.0%) | 235 (100.0%) |
| 3 or 4 Unit Apartments | 13 (8.8%) | 134 (91.2%) |
| 5 to 9 Unit Apartments | 4 (1.6%) | 247 (98.4%) |
| 10 or more Apartments | 185 (16.7%) | 924 (83.3%) |
| Mobile Home / Other | 178 (100.0%) | 0 (0.0%) |
| Total | 4,444 (70.2%) | 1,884 (29.8%) |
Housing Structures by Number of Rooms in Northfield
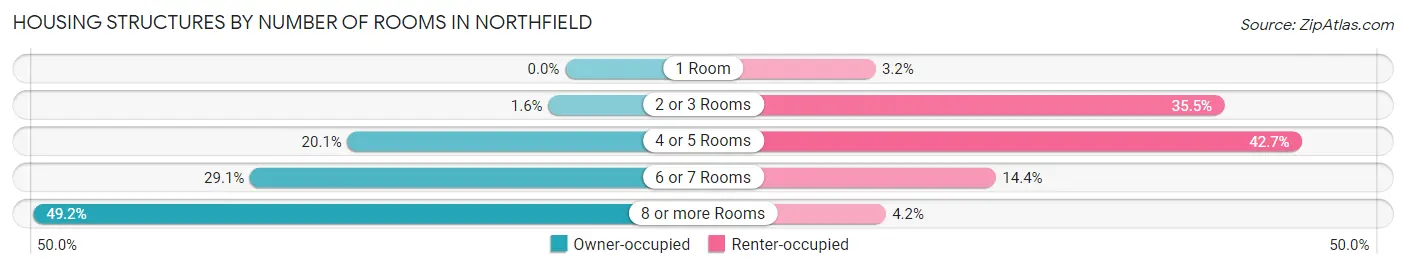
| Number of Rooms | Owner-occupied | Renter-occupied |
| 1 Room | 0 (0.0%) | 61 (3.2%) |
| 2 or 3 Rooms | 69 (1.5%) | 669 (35.5%) |
| 4 or 5 Rooms | 894 (20.1%) | 804 (42.7%) |
| 6 or 7 Rooms | 1,295 (29.1%) | 271 (14.4%) |
| 8 or more Rooms | 2,186 (49.2%) | 79 (4.2%) |
| Total | 4,444 (100.0%) | 1,884 (100.0%) |
Housing Structure by Heating Type in Northfield
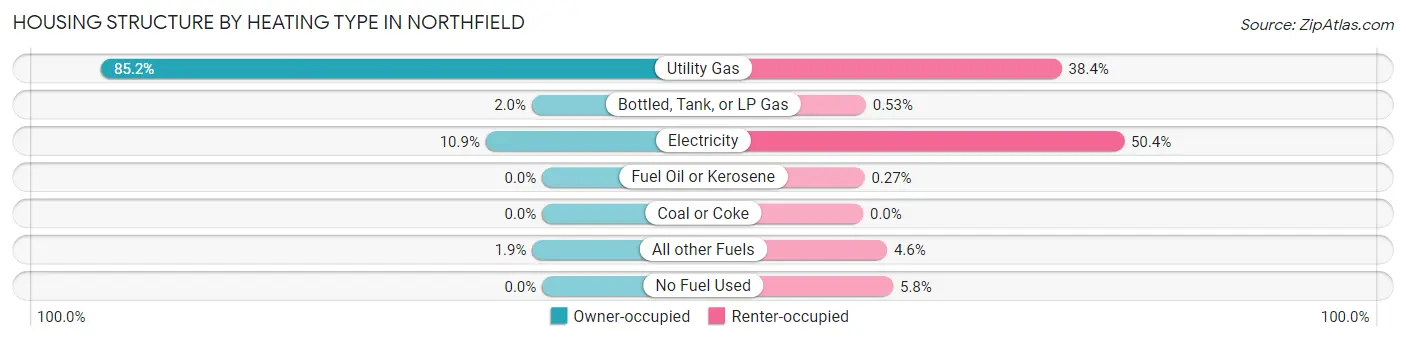
| Heating Type | Owner-occupied | Renter-occupied |
| Utility Gas | 3,788 (85.2%) | 723 (38.4%) |
| Bottled, Tank, or LP Gas | 88 (2.0%) | 10 (0.5%) |
| Electricity | 484 (10.9%) | 950 (50.4%) |
| Fuel Oil or Kerosene | 0 (0.0%) | 5 (0.3%) |
| Coal or Coke | 0 (0.0%) | 0 (0.0%) |
| All other Fuels | 84 (1.9%) | 87 (4.6%) |
| No Fuel Used | 0 (0.0%) | 109 (5.8%) |
| Total | 4,444 (100.0%) | 1,884 (100.0%) |
Household Vehicle Usage in Northfield
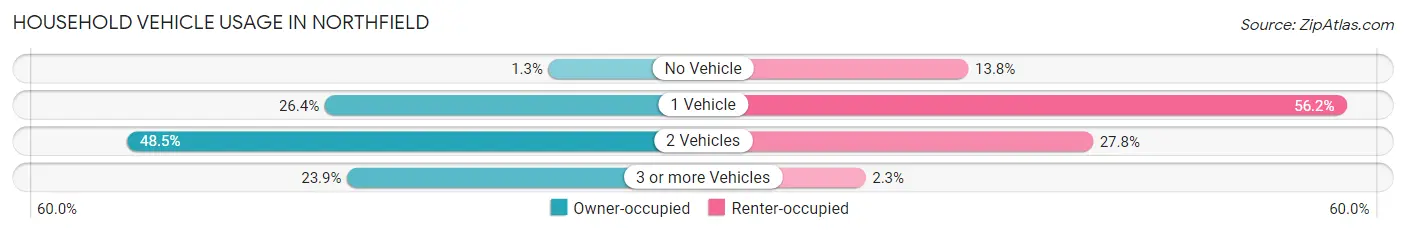
| Vehicles per Household | Owner-occupied | Renter-occupied |
| No Vehicle | 57 (1.3%) | 260 (13.8%) |
| 1 Vehicle | 1,171 (26.4%) | 1,058 (56.2%) |
| 2 Vehicles | 2,156 (48.5%) | 523 (27.8%) |
| 3 or more Vehicles | 1,060 (23.8%) | 43 (2.3%) |
| Total | 4,444 (100.0%) | 1,884 (100.0%) |
Real Estate & Mortgages in Northfield
Real Estate and Mortgage Overview in Northfield
| Characteristic | Without Mortgage | With Mortgage |
| Housing Units | 1,677 | 2,767 |
| Median Property Value | $266,600 | $294,500 |
| Median Household Income | $82,292 | $901 |
| Monthly Housing Costs | $714 | $260 |
| Real Estate Taxes | $3,667 | $122 |
Property Value by Mortgage Status in Northfield
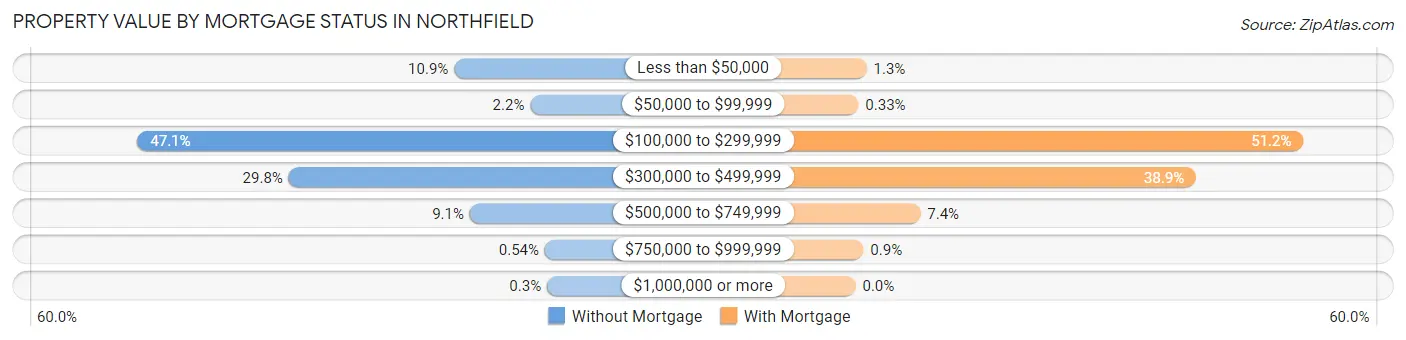
| Property Value | Without Mortgage | With Mortgage |
| Less than $50,000 | 183 (10.9%) | 35 (1.3%) |
| $50,000 to $99,999 | 37 (2.2%) | 9 (0.3%) |
| $100,000 to $299,999 | 790 (47.1%) | 1,416 (51.2%) |
| $300,000 to $499,999 | 500 (29.8%) | 1,077 (38.9%) |
| $500,000 to $749,999 | 153 (9.1%) | 205 (7.4%) |
| $750,000 to $999,999 | 9 (0.5%) | 25 (0.9%) |
| $1,000,000 or more | 5 (0.3%) | 0 (0.0%) |
| Total | 1,677 (100.0%) | 2,767 (100.0%) |
Household Income by Mortgage Status in Northfield
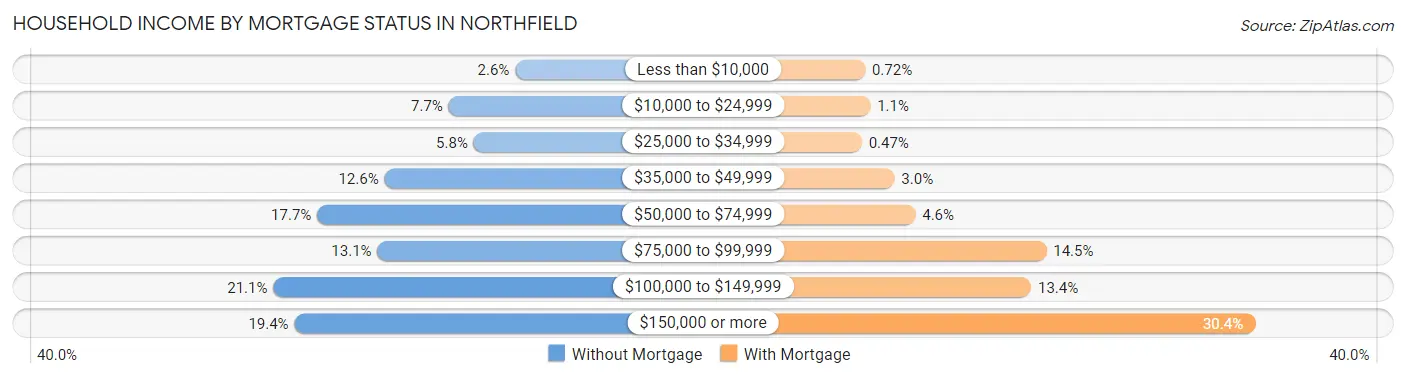
| Household Income | Without Mortgage | With Mortgage |
| Less than $10,000 | 44 (2.6%) | 20 (0.7%) |
| $10,000 to $24,999 | 129 (7.7%) | 31 (1.1%) |
| $25,000 to $34,999 | 97 (5.8%) | 13 (0.5%) |
| $35,000 to $49,999 | 211 (12.6%) | 82 (3.0%) |
| $50,000 to $74,999 | 297 (17.7%) | 126 (4.5%) |
| $75,000 to $99,999 | 220 (13.1%) | 402 (14.5%) |
| $100,000 to $149,999 | 353 (21.0%) | 370 (13.4%) |
| $150,000 or more | 326 (19.4%) | 842 (30.4%) |
| Total | 1,677 (100.0%) | 2,767 (100.0%) |
Property Value to Household Income Ratio in Northfield
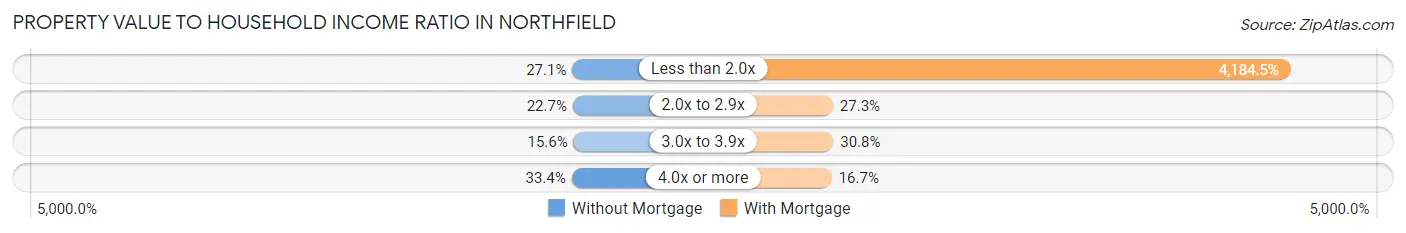
| Value-to-Income Ratio | Without Mortgage | With Mortgage |
| Less than 2.0x | 455 (27.1%) | 115,784 (4,184.5%) |
| 2.0x to 2.9x | 381 (22.7%) | 755 (27.3%) |
| 3.0x to 3.9x | 261 (15.6%) | 851 (30.8%) |
| 4.0x or more | 560 (33.4%) | 461 (16.7%) |
| Total | 1,677 (100.0%) | 2,767 (100.0%) |
Real Estate Taxes by Mortgage Status in Northfield
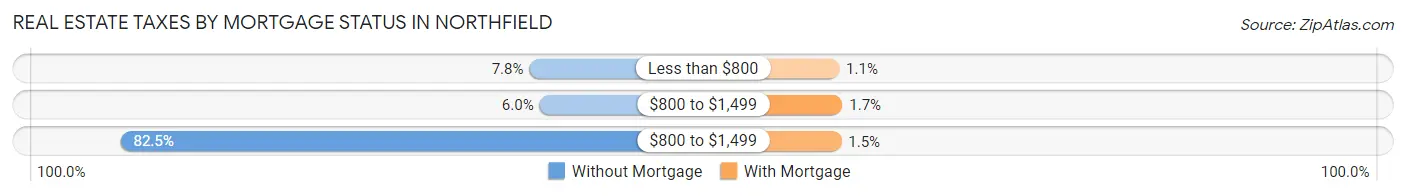
| Property Taxes | Without Mortgage | With Mortgage |
| Less than $800 | 131 (7.8%) | 31 (1.1%) |
| $800 to $1,499 | 100 (6.0%) | 47 (1.7%) |
| $800 to $1,499 | 1,383 (82.5%) | 42 (1.5%) |
| Total | 1,677 (100.0%) | 2,767 (100.0%) |
Health & Disability in Northfield
Health Insurance Coverage by Age in Northfield

| Age Bracket | With Coverage | Without Coverage |
| Under 6 Years | 915 (97.0%) | 28 (3.0%) |
| 6 to 18 Years | 3,692 (98.5%) | 58 (1.5%) |
| 19 to 25 Years | 4,892 (96.7%) | 165 (3.3%) |
| 26 to 34 Years | 1,338 (88.3%) | 178 (11.7%) |
| 35 to 44 Years | 1,760 (88.7%) | 223 (11.3%) |
| 45 to 54 Years | 1,938 (92.8%) | 151 (7.2%) |
| 55 to 64 Years | 1,792 (95.1%) | 92 (4.9%) |
| 65 to 74 Years | 1,723 (96.6%) | 61 (3.4%) |
| 75 Years and older | 1,229 (100.0%) | 0 (0.0%) |
| Total | 19,279 (95.3%) | 956 (4.7%) |
Health Insurance Coverage by Citizenship Status in Northfield
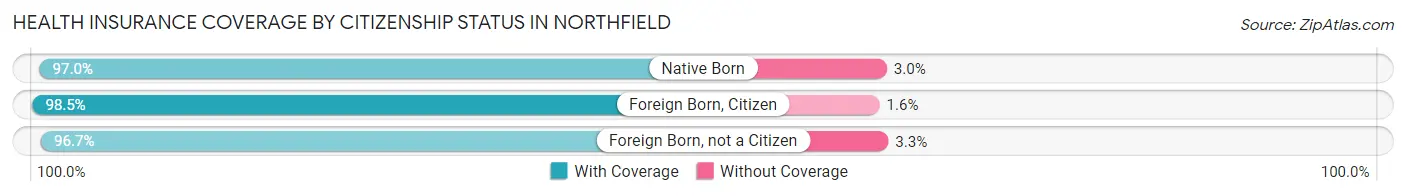
| Citizenship Status | With Coverage | Without Coverage |
| Native Born | 915 (97.0%) | 28 (3.0%) |
| Foreign Born, Citizen | 3,692 (98.5%) | 58 (1.5%) |
| Foreign Born, not a Citizen | 4,892 (96.7%) | 165 (3.3%) |
Health Insurance Coverage by Household Income in Northfield
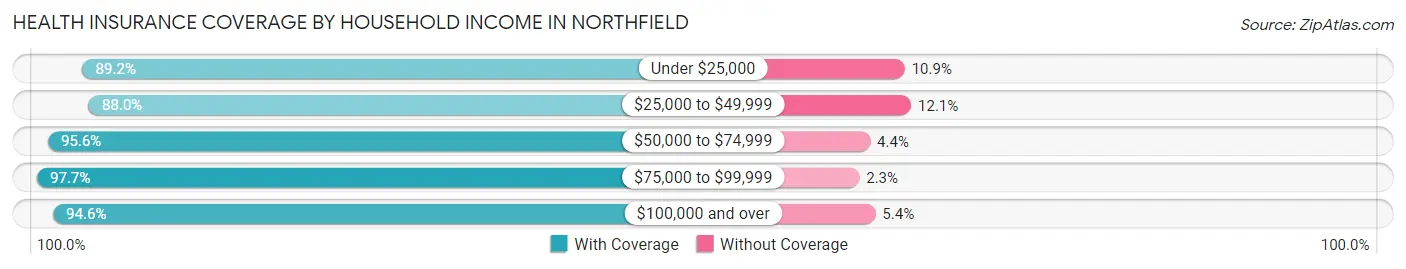
| Household Income | With Coverage | Without Coverage |
| Under $25,000 | 1,093 (89.1%) | 133 (10.8%) |
| $25,000 to $49,999 | 1,314 (87.9%) | 180 (12.0%) |
| $50,000 to $74,999 | 2,576 (95.6%) | 118 (4.4%) |
| $75,000 to $99,999 | 1,589 (97.7%) | 38 (2.3%) |
| $100,000 and over | 7,560 (94.6%) | 428 (5.4%) |
Public vs Private Health Insurance Coverage by Age in Northfield
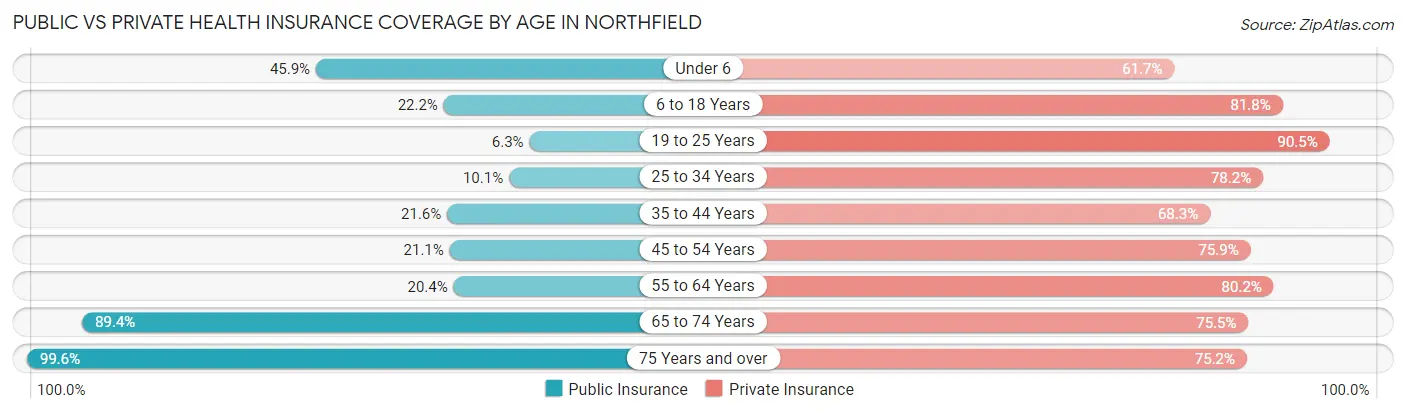
| Age Bracket | Public Insurance | Private Insurance |
| Under 6 | 433 (45.9%) | 582 (61.7%) |
| 6 to 18 Years | 833 (22.2%) | 3,068 (81.8%) |
| 19 to 25 Years | 318 (6.3%) | 4,578 (90.5%) |
| 25 to 34 Years | 153 (10.1%) | 1,185 (78.2%) |
| 35 to 44 Years | 428 (21.6%) | 1,355 (68.3%) |
| 45 to 54 Years | 441 (21.1%) | 1,585 (75.9%) |
| 55 to 64 Years | 384 (20.4%) | 1,510 (80.1%) |
| 65 to 74 Years | 1,594 (89.3%) | 1,346 (75.4%) |
| 75 Years and over | 1,224 (99.6%) | 924 (75.2%) |
| Total | 5,808 (28.7%) | 16,133 (79.7%) |
Disability Status by Sex by Age in Northfield
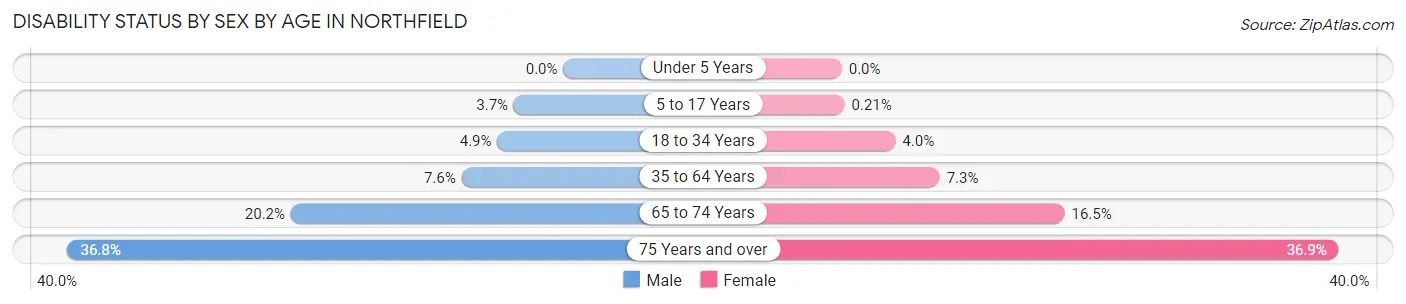
| Age Bracket | Male | Female |
| Under 5 Years | 0 (0.0%) | 0 (0.0%) |
| 5 to 17 Years | 40 (3.7%) | 3 (0.2%) |
| 18 to 34 Years | 180 (4.9%) | 169 (4.0%) |
| 35 to 64 Years | 232 (7.6%) | 210 (7.3%) |
| 65 to 74 Years | 175 (20.2%) | 152 (16.5%) |
| 75 Years and over | 194 (36.8%) | 259 (36.9%) |
Disability Class by Sex by Age in Northfield
Disability Class: Hearing Difficulty
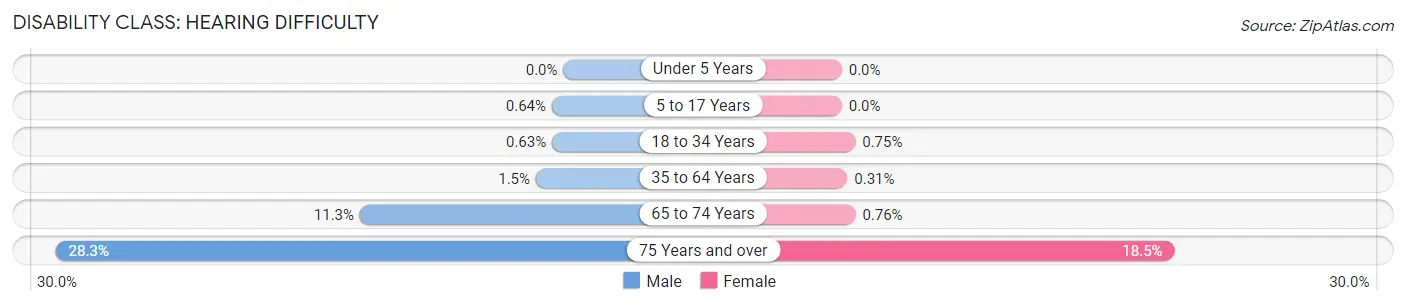
| Age Bracket | Male | Female |
| Under 5 Years | 0 (0.0%) | 0 (0.0%) |
| 5 to 17 Years | 7 (0.6%) | 0 (0.0%) |
| 18 to 34 Years | 23 (0.6%) | 32 (0.7%) |
| 35 to 64 Years | 47 (1.5%) | 9 (0.3%) |
| 65 to 74 Years | 98 (11.3%) | 7 (0.8%) |
| 75 Years and over | 149 (28.3%) | 130 (18.5%) |
Disability Class: Vision Difficulty
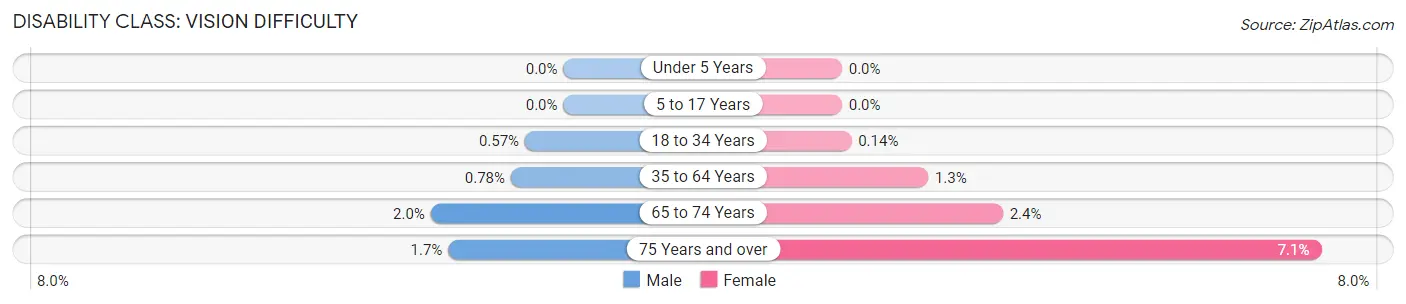
| Age Bracket | Male | Female |
| Under 5 Years | 0 (0.0%) | 0 (0.0%) |
| 5 to 17 Years | 0 (0.0%) | 0 (0.0%) |
| 18 to 34 Years | 21 (0.6%) | 6 (0.1%) |
| 35 to 64 Years | 24 (0.8%) | 37 (1.3%) |
| 65 to 74 Years | 17 (2.0%) | 22 (2.4%) |
| 75 Years and over | 9 (1.7%) | 50 (7.1%) |
Disability Class: Cognitive Difficulty
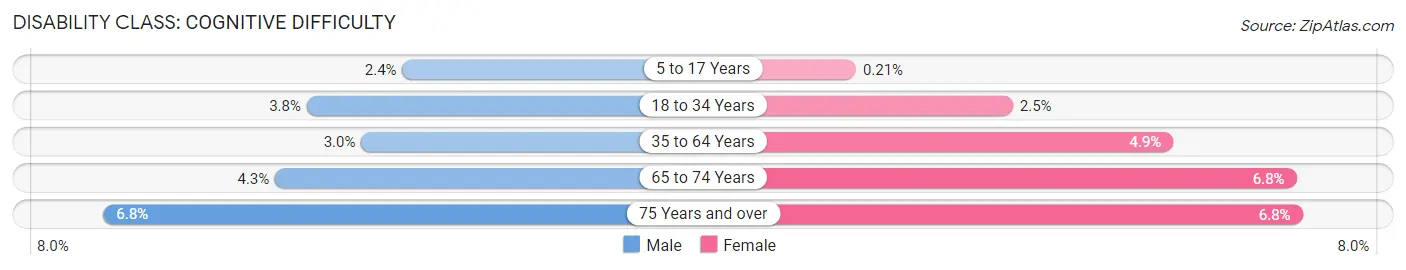
| Age Bracket | Male | Female |
| 5 to 17 Years | 26 (2.4%) | 3 (0.2%) |
| 18 to 34 Years | 140 (3.8%) | 108 (2.5%) |
| 35 to 64 Years | 92 (3.0%) | 142 (4.9%) |
| 65 to 74 Years | 37 (4.3%) | 62 (6.8%) |
| 75 Years and over | 36 (6.8%) | 48 (6.8%) |
Disability Class: Ambulatory Difficulty
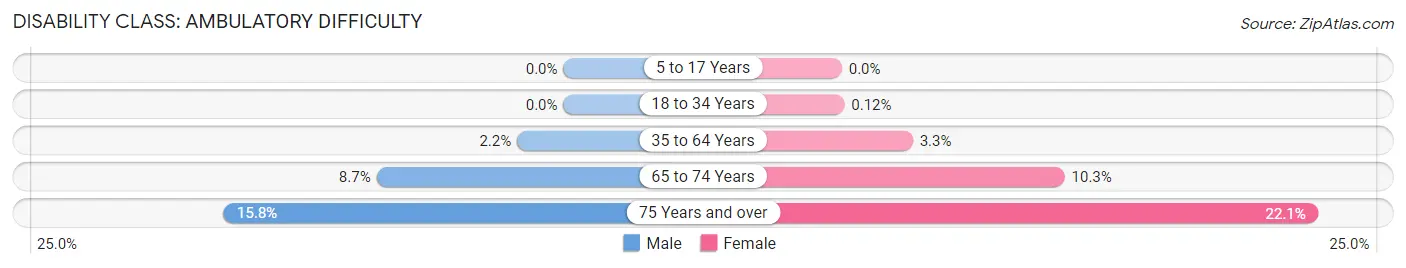
| Age Bracket | Male | Female |
| 5 to 17 Years | 0 (0.0%) | 0 (0.0%) |
| 18 to 34 Years | 0 (0.0%) | 5 (0.1%) |
| 35 to 64 Years | 66 (2.1%) | 95 (3.3%) |
| 65 to 74 Years | 75 (8.7%) | 95 (10.3%) |
| 75 Years and over | 83 (15.8%) | 155 (22.1%) |
Disability Class: Self-Care Difficulty
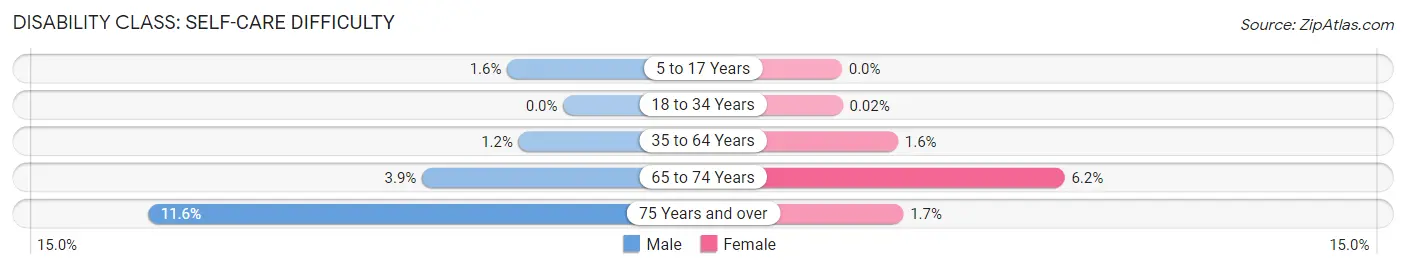
| Age Bracket | Male | Female |
| 5 to 17 Years | 17 (1.6%) | 0 (0.0%) |
| 18 to 34 Years | 0 (0.0%) | 1 (0.0%) |
| 35 to 64 Years | 38 (1.2%) | 45 (1.6%) |
| 65 to 74 Years | 34 (3.9%) | 57 (6.2%) |
| 75 Years and over | 61 (11.6%) | 12 (1.7%) |
Technology Access in Northfield
Computing Device Access in Northfield
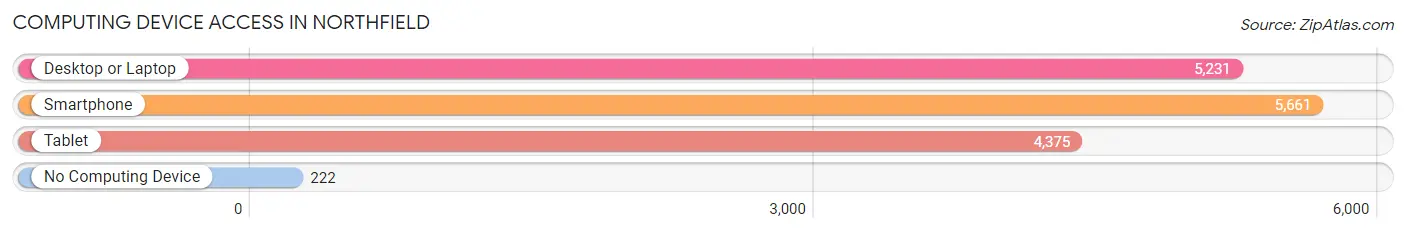
| Device Type | # Households | % Households |
| Desktop or Laptop | 5,231 | 82.7% |
| Smartphone | 5,661 | 89.5% |
| Tablet | 4,375 | 69.1% |
| No Computing Device | 222 | 3.5% |
| Total | 6,328 | 100.0% |
Internet Access in Northfield
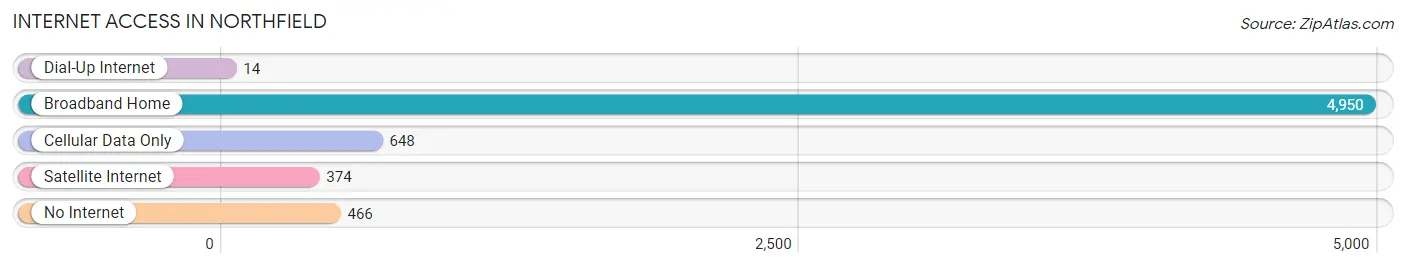
| Internet Type | # Households | % Households |
| Dial-Up Internet | 14 | 0.2% |
| Broadband Home | 4,950 | 78.2% |
| Cellular Data Only | 648 | 10.2% |
| Satellite Internet | 374 | 5.9% |
| No Internet | 466 | 7.4% |
| Total | 6,328 | 100.0% |
Northfield Summary
Northfield, Minnesota is a small city located in Rice County, approximately 50 miles south of the Twin Cities. It is home to two colleges, Carleton College and St. Olaf College, and is known for its historic downtown and its strong sense of community.
History
Northfield was founded in 1855 by John W. North, a former Vermont legislator. Northfield was originally intended to be a utopian community, and the city was laid out in a grid pattern with wide streets and generous lots. The city was named after North’s hometown of Northfield, Vermont.
In 1876, Northfield was the site of the infamous Northfield Raid, when the James-Younger gang attempted to rob the First National Bank of Northfield. The citizens of Northfield fought back and the gang was eventually captured. The event is commemorated each year with the Defeat of Jesse James Days festival.
In the late 19th century, Northfield became a center of higher education with the founding of Carleton College in 1866 and St. Olaf College in 1874. The two colleges have been a major part of the city’s economy and culture ever since.
Geography
Northfield is located in the Cannon River Valley, which is part of the Minnesota River Valley. The city is situated on the banks of the Cannon River, which flows through the city and is a popular spot for fishing and canoeing. The city is surrounded by rolling hills and farmland, and is located approximately 50 miles south of the Twin Cities.
Economy
Northfield’s economy is largely driven by the two colleges, Carleton College and St. Olaf College. The colleges provide jobs for many of the city’s residents, as well as a steady stream of visitors and tourists.
In addition to the colleges, Northfield is home to a number of small businesses, including restaurants, shops, and galleries. The city is also home to several large employers, including the Northfield Hospital and Clinics, the Northfield Public Schools, and the Northfield News.
Demographics
As of the 2010 census, Northfield had a population of 20,007. The median age was 22.7 years, and the median household income was $50,945. The racial makeup of the city was 88.3% White, 4.2% African American, 0.7% Native American, 3.2% Asian, and 3.6% from other races.
Northfield is a diverse and vibrant community, with a strong sense of community and a commitment to preserving its historic downtown. The city is home to a variety of cultural and recreational activities, and is a popular destination for visitors and tourists.
Common Questions
What is Per Capita Income in Northfield?
Per Capita income in Northfield is $37,390.
What is the Median Family Income in Northfield?
Median Family Income in Northfield is $115,410.
What is the Median Household income in Northfield?
Median Household Income in Northfield is $83,125.
What is Income or Wage Gap in Northfield?
Income or Wage Gap in Northfield is 54.5%.
Women in Northfield earn 45.5 cents for every dollar earned by a man.
What is Inequality or Gini Index in Northfield?
Inequality or Gini Index in Northfield is 0.43.
What is the Total Population of Northfield?
Total Population of Northfield is 20,518.
What is the Total Male Population of Northfield?
Total Male Population of Northfield is 9,835.
What is the Total Female Population of Northfield?
Total Female Population of Northfield is 10,683.
What is the Ratio of Males per 100 Females in Northfield?
There are 92.06 Males per 100 Females in Northfield.
What is the Ratio of Females per 100 Males in Northfield?
There are 108.62 Females per 100 Males in Northfield.
What is the Median Population Age in Northfield?
Median Population Age in Northfield is 29.4 Years.
What is the Average Family Size in Northfield
Average Family Size in Northfield is 3.0 People.
What is the Average Household Size in Northfield
Average Household Size in Northfield is 2.4 People.
How Large is the Labor Force in Northfield?
There are 11,462 People in the Labor Forcein in Northfield.
What is the Percentage of People in the Labor Force in Northfield?
65.3% of People are in the Labor Force in Northfield.
What is the Unemployment Rate in Northfield?
Unemployment Rate in Northfield is 6.2%.