Watertown, MN Map & Demographics
Watertown Map
Watertown Overview
$42,718
PER CAPITA INCOME
$135,000
AVG FAMILY INCOME
$101,667
AVG HOUSEHOLD INCOME
33.8%
WAGE / INCOME GAP [ % ]
66.2¢/ $1
WAGE / INCOME GAP [ $ ]
0.30
INEQUALITY / GINI INDEX
4,712
TOTAL POPULATION
2,363
MALE POPULATION
2,349
FEMALE POPULATION
100.60
MALES / 100 FEMALES
99.41
FEMALES / 100 MALES
35.4
MEDIAN AGE
2.9
AVG FAMILY SIZE
2.7
AVG HOUSEHOLD SIZE
2,871
LABOR FORCE [ PEOPLE ]
79.1%
PERCENT IN LABOR FORCE
Watertown Zip Codes
Watertown Area Codes
Income in Watertown
Income Overview in Watertown
Per Capita Income in Watertown is $42,718, while median incomes of families and households are $135,000 and $101,667 respectively.
| Characteristic | Number | Measure |
| Per Capita Income | 4,712 | $42,718 |
| Median Family Income | 1,320 | $135,000 |
| Mean Family Income | 1,320 | $122,715 |
| Median Household Income | 1,748 | $101,667 |
| Mean Household Income | 1,748 | $112,685 |
| Income Deficit | 1,320 | $0 |
| Wage / Income Gap (%) | 4,712 | 33.75% |
| Wage / Income Gap ($) | 4,712 | 66.25¢ per $1 |
| Gini / Inequality Index | 4,712 | 0.30 |
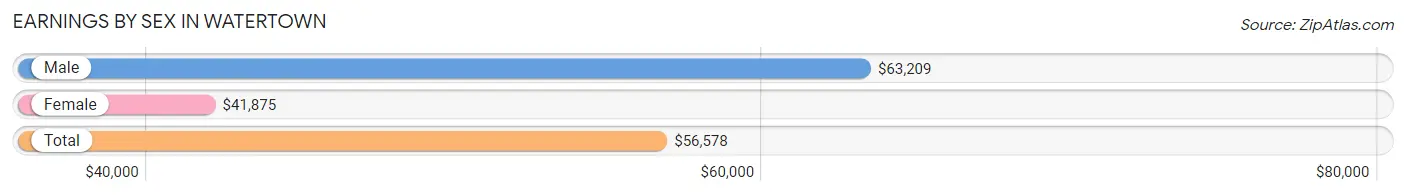
Earnings by Sex in Watertown
Average Earnings in Watertown are $56,578, $63,209 for men and $41,875 for women, a difference of 33.8%.
| Sex | Number | Average Earnings |
| Male | 1,540 (51.7%) | $63,209 |
| Female | 1,437 (48.3%) | $41,875 |
| Total | 2,977 (100.0%) | $56,578 |
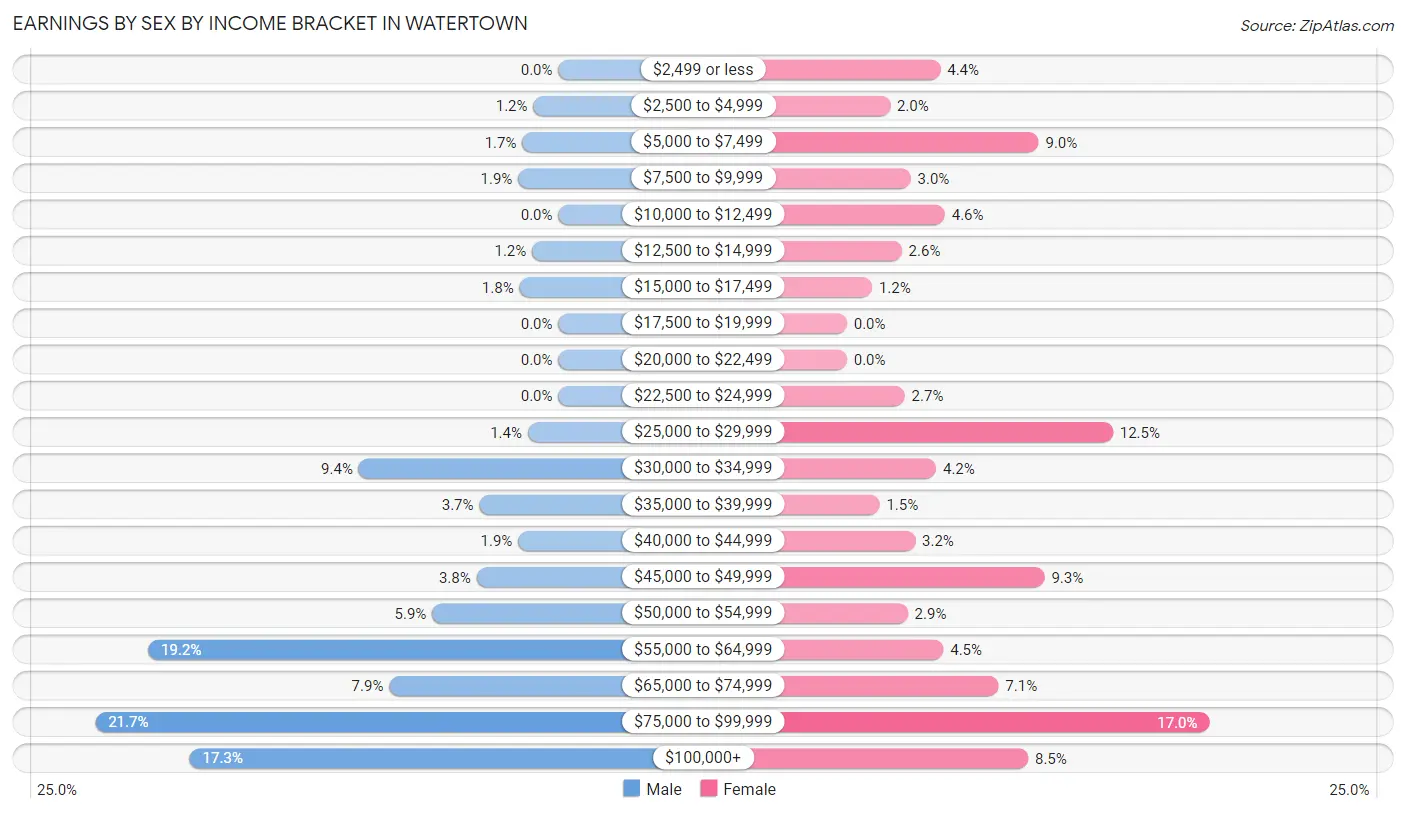
Earnings by Sex by Income Bracket in Watertown
The most common earnings brackets in Watertown are $75,000 to $99,999 for men (334 | 21.7%) and $75,000 to $99,999 for women (244 | 17.0%).
| Income | Male | Female |
| $2,499 or less | 0 (0.0%) | 63 (4.4%) |
| $2,500 to $4,999 | 18 (1.2%) | 29 (2.0%) |
| $5,000 to $7,499 | 26 (1.7%) | 129 (9.0%) |
| $7,500 to $9,999 | 29 (1.9%) | 43 (3.0%) |
| $10,000 to $12,499 | 0 (0.0%) | 66 (4.6%) |
| $12,500 to $14,999 | 19 (1.2%) | 37 (2.6%) |
| $15,000 to $17,499 | 28 (1.8%) | 17 (1.2%) |
| $17,500 to $19,999 | 0 (0.0%) | 0 (0.0%) |
| $20,000 to $22,499 | 0 (0.0%) | 0 (0.0%) |
| $22,500 to $24,999 | 0 (0.0%) | 39 (2.7%) |
| $25,000 to $29,999 | 22 (1.4%) | 179 (12.5%) |
| $30,000 to $34,999 | 144 (9.3%) | 60 (4.2%) |
| $35,000 to $39,999 | 57 (3.7%) | 22 (1.5%) |
| $40,000 to $44,999 | 29 (1.9%) | 46 (3.2%) |
| $45,000 to $49,999 | 59 (3.8%) | 133 (9.3%) |
| $50,000 to $54,999 | 91 (5.9%) | 41 (2.9%) |
| $55,000 to $64,999 | 296 (19.2%) | 65 (4.5%) |
| $65,000 to $74,999 | 122 (7.9%) | 102 (7.1%) |
| $75,000 to $99,999 | 334 (21.7%) | 244 (17.0%) |
| $100,000+ | 266 (17.3%) | 122 (8.5%) |
| Total | 1,540 (100.0%) | 1,437 (100.0%) |
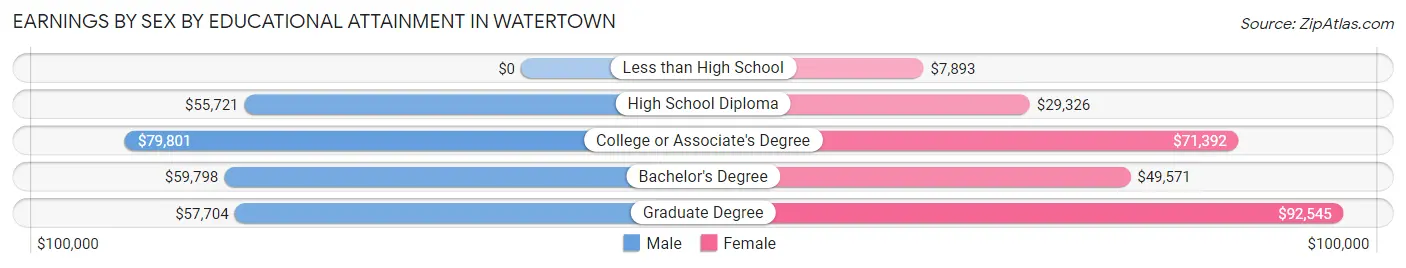
Earnings by Sex by Educational Attainment in Watertown
Average earnings in Watertown are $68,807 for men and $48,964 for women, a difference of 28.8%. Men with an educational attainment of college or associate's degree enjoy the highest average annual earnings of $79,801, while those with high school diploma education earn the least with $55,721. Women with an educational attainment of graduate degree earn the most with the average annual earnings of $92,545, while those with less than high school education have the smallest earnings of $7,893.
| Educational Attainment | Male Income | Female Income |
| Less than High School | - | - |
| High School Diploma | $55,721 | $29,326 |
| College or Associate's Degree | $79,801 | $71,392 |
| Bachelor's Degree | $59,798 | $49,571 |
| Graduate Degree | $57,704 | $92,545 |
| Total | $68,807 | $48,964 |
Family Income in Watertown
Family Income Brackets in Watertown
According to the Watertown family income data, there are 407 families falling into the $150,000 to $199,999 income range, which is the most common income bracket and makes up 30.8% of all families.
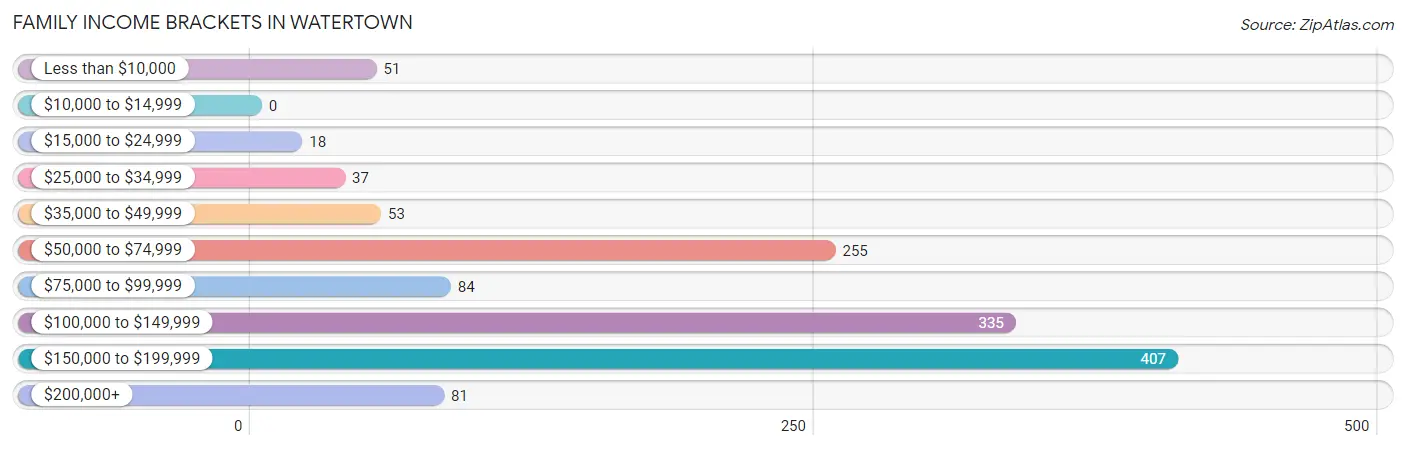
| Income Bracket | # Families | % Families |
| Less than $10,000 | 51 | 3.9% |
| $10,000 to $14,999 | 0 | 0.0% |
| $15,000 to $24,999 | 18 | 1.4% |
| $25,000 to $34,999 | 37 | 2.8% |
| $35,000 to $49,999 | 53 | 4.0% |
| $50,000 to $74,999 | 255 | 19.3% |
| $75,000 to $99,999 | 84 | 6.4% |
| $100,000 to $149,999 | 335 | 25.4% |
| $150,000 to $199,999 | 407 | 30.8% |
| $200,000+ | 81 | 6.1% |
Family Income by Famaliy Size in Watertown
2-person families (542 | 41.1%) account for the highest median family income in Watertown with $146,087 per family, while 2-person families (542 | 41.1%) have the highest median income of $73,044 per family member.
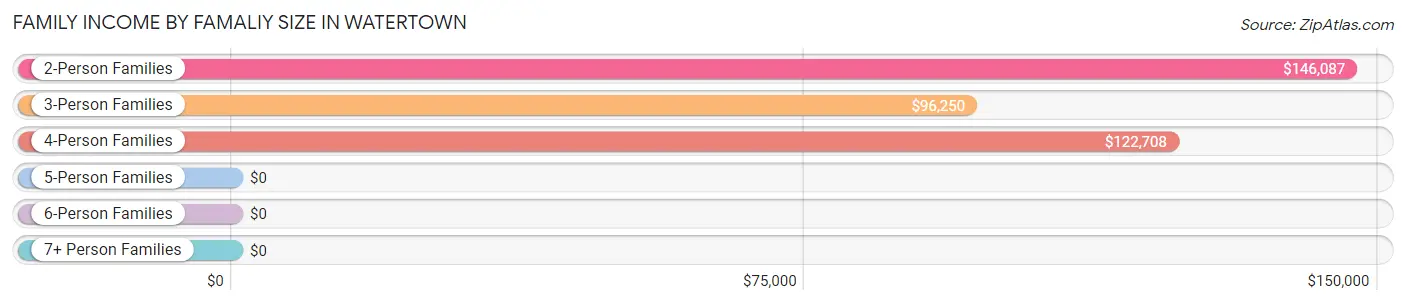
| Income Bracket | # Families | Median Income |
| 2-Person Families | 542 (41.1%) | $146,087 |
| 3-Person Families | 474 (35.9%) | $96,250 |
| 4-Person Families | 256 (19.4%) | $122,708 |
| 5-Person Families | 22 (1.7%) | $0 |
| 6-Person Families | 8 (0.6%) | $0 |
| 7+ Person Families | 18 (1.4%) | $0 |
| Total | 1,320 (100.0%) | $135,000 |
Family Income by Number of Earners in Watertown
The median family income in Watertown is $135,000, with families comprising 2 earners (707) having the highest median family income of $157,653, while families with 1 earner (415) have the lowest median family income of $52,455, accounting for 53.6% and 31.4% of families, respectively.
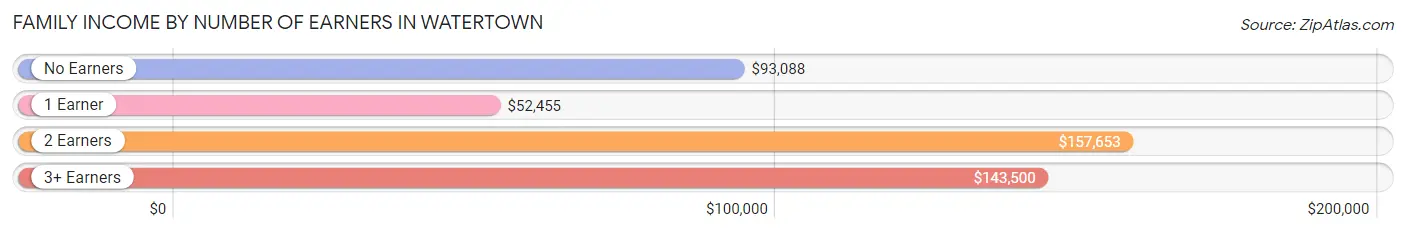
| Number of Earners | # Families | Median Income |
| No Earners | 76 (5.8%) | $93,088 |
| 1 Earner | 415 (31.4%) | $52,455 |
| 2 Earners | 707 (53.6%) | $157,653 |
| 3+ Earners | 122 (9.2%) | $143,500 |
| Total | 1,320 (100.0%) | $135,000 |
Household Income in Watertown
Household Income Brackets in Watertown
With 420 households falling in the category, the $150,000 to $199,999 income range is the most frequent in Watertown, accounting for 24.0% of all households.
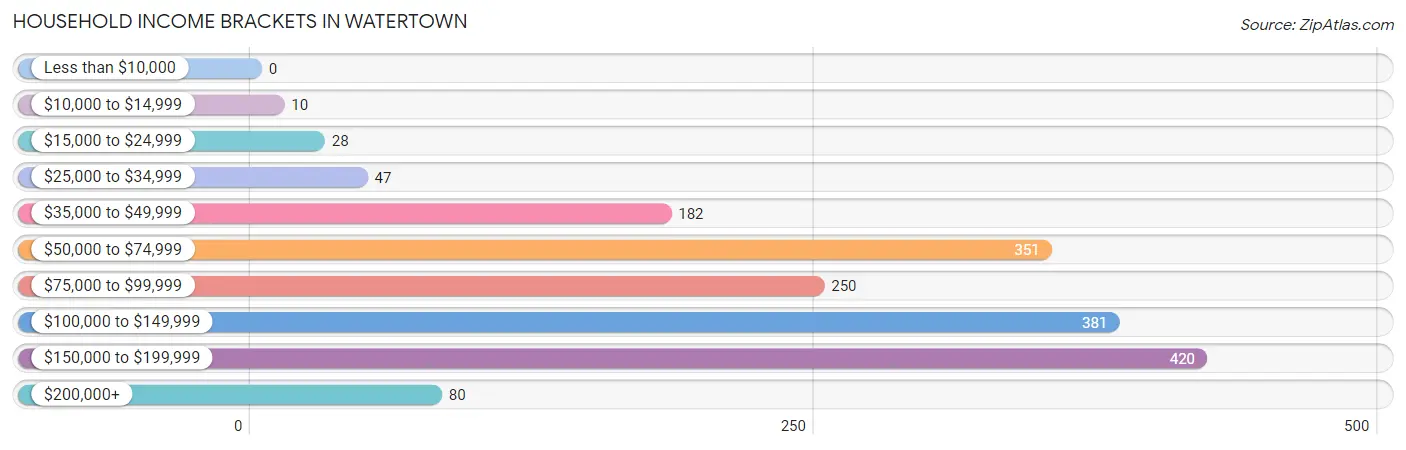
| Income Bracket | # Households | % Households |
| Less than $10,000 | 0 | 0.0% |
| $10,000 to $14,999 | 10 | 0.6% |
| $15,000 to $24,999 | 28 | 1.6% |
| $25,000 to $34,999 | 47 | 2.7% |
| $35,000 to $49,999 | 182 | 10.4% |
| $50,000 to $74,999 | 351 | 20.1% |
| $75,000 to $99,999 | 250 | 14.3% |
| $100,000 to $149,999 | 381 | 21.8% |
| $150,000 to $199,999 | 420 | 24.0% |
| $200,000+ | 80 | 4.6% |
Household Income by Householder Age in Watertown
The median household income in Watertown is $101,667, with the highest median household income of $145,136 found in the 45 to 64 years age bracket for the primary householder. A total of 821 households (47.0%) fall into this category. Meanwhile, the 65+ years age bracket for the primary householder has the lowest median household income of $62,604, with 202 households (11.6%) in this group.
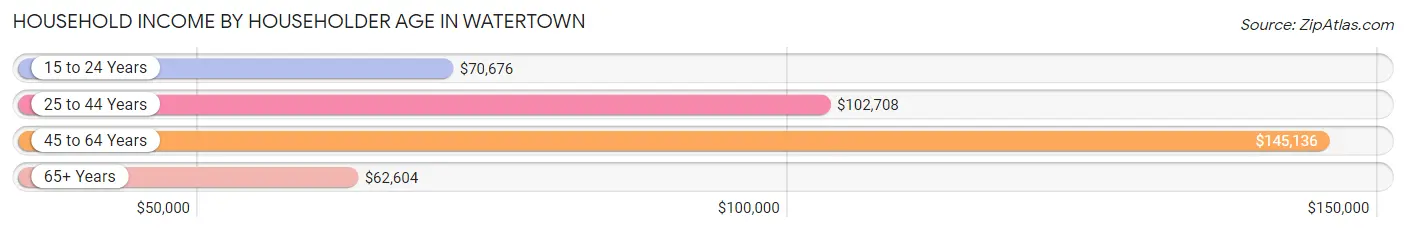
| Income Bracket | # Households | Median Income |
| 15 to 24 Years | 170 (9.7%) | $70,676 |
| 25 to 44 Years | 555 (31.8%) | $102,708 |
| 45 to 64 Years | 821 (47.0%) | $145,136 |
| 65+ Years | 202 (11.6%) | $62,604 |
| Total | 1,748 (100.0%) | $101,667 |
Poverty in Watertown
Income Below Poverty by Sex and Age in Watertown
With 3.3% poverty level for males and 11.4% for females among the residents of Watertown, 18 to 24 year old males and 5 year old females are the most vulnerable to poverty, with 45 males (16.6%) and 17 females (100.0%) in their respective age groups living below the poverty level.
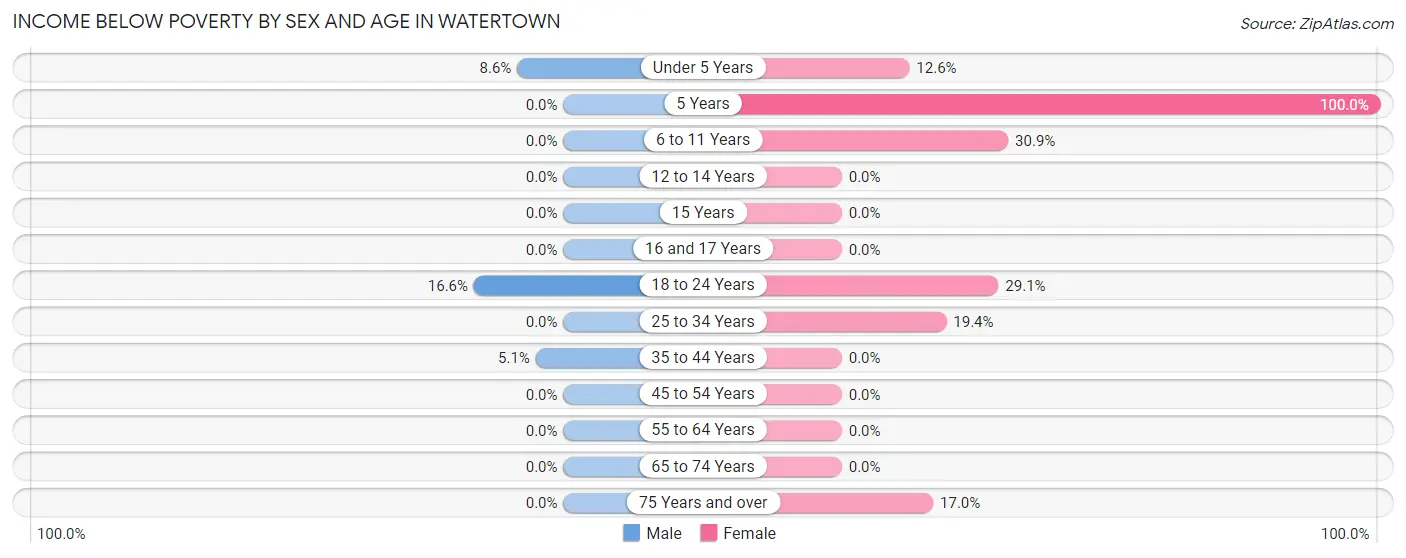
| Age Bracket | Male | Female |
| Under 5 Years | 15 (8.6%) | 31 (12.6%) |
| 5 Years | 0 (0.0%) | 17 (100.0%) |
| 6 to 11 Years | 0 (0.0%) | 63 (30.9%) |
| 12 to 14 Years | 0 (0.0%) | 0 (0.0%) |
| 15 Years | 0 (0.0%) | 0 (0.0%) |
| 16 and 17 Years | 0 (0.0%) | 0 (0.0%) |
| 18 to 24 Years | 45 (16.6%) | 75 (29.1%) |
| 25 to 34 Years | 0 (0.0%) | 66 (19.4%) |
| 35 to 44 Years | 18 (5.1%) | 0 (0.0%) |
| 45 to 54 Years | 0 (0.0%) | 0 (0.0%) |
| 55 to 64 Years | 0 (0.0%) | 0 (0.0%) |
| 65 to 74 Years | 0 (0.0%) | 0 (0.0%) |
| 75 Years and over | 0 (0.0%) | 10 (17.0%) |
| Total | 78 (3.3%) | 262 (11.4%) |
Income Above Poverty by Sex and Age in Watertown
According to the poverty statistics in Watertown, males aged 5 years and females aged 12 to 14 years are the age groups that are most secure financially, with 100.0% of males and 100.0% of females in these age groups living above the poverty line.
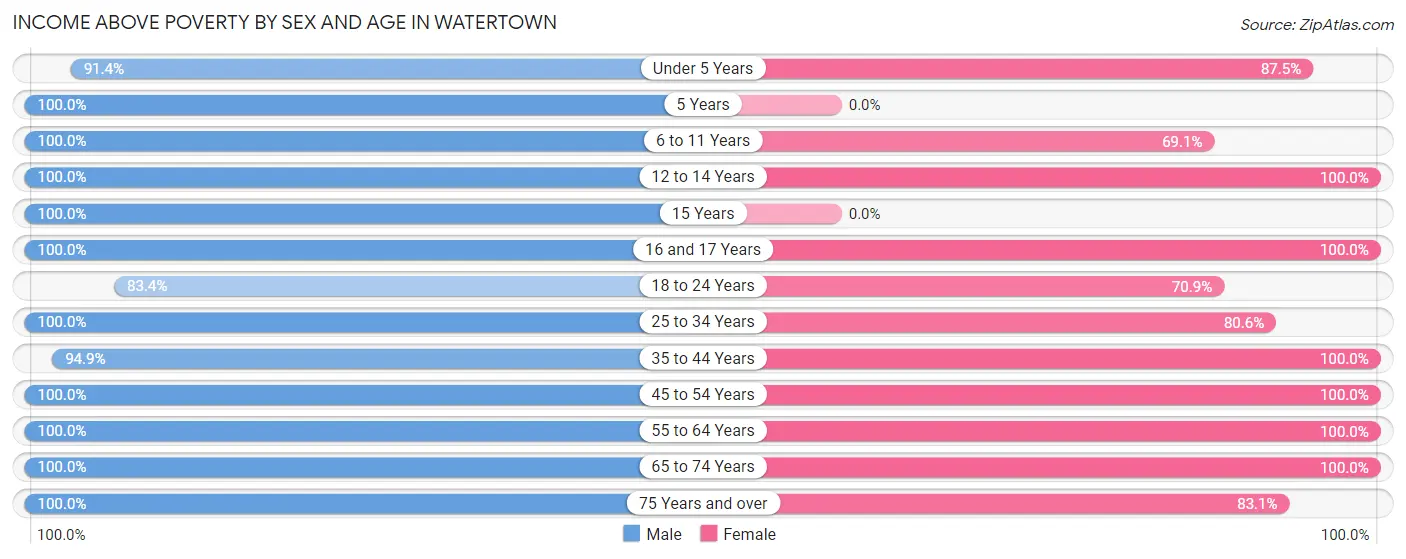
| Age Bracket | Male | Female |
| Under 5 Years | 160 (91.4%) | 216 (87.5%) |
| 5 Years | 129 (100.0%) | 0 (0.0%) |
| 6 to 11 Years | 156 (100.0%) | 141 (69.1%) |
| 12 to 14 Years | 70 (100.0%) | 61 (100.0%) |
| 15 Years | 23 (100.0%) | 0 (0.0%) |
| 16 and 17 Years | 34 (100.0%) | 60 (100.0%) |
| 18 to 24 Years | 226 (83.4%) | 183 (70.9%) |
| 25 to 34 Years | 265 (100.0%) | 274 (80.6%) |
| 35 to 44 Years | 332 (94.9%) | 274 (100.0%) |
| 45 to 54 Years | 360 (100.0%) | 336 (100.0%) |
| 55 to 64 Years | 378 (100.0%) | 318 (100.0%) |
| 65 to 74 Years | 112 (100.0%) | 129 (100.0%) |
| 75 Years and over | 40 (100.0%) | 49 (83.1%) |
| Total | 2,285 (96.7%) | 2,041 (88.6%) |
Income Below Poverty Among Married-Couple Families in Watertown
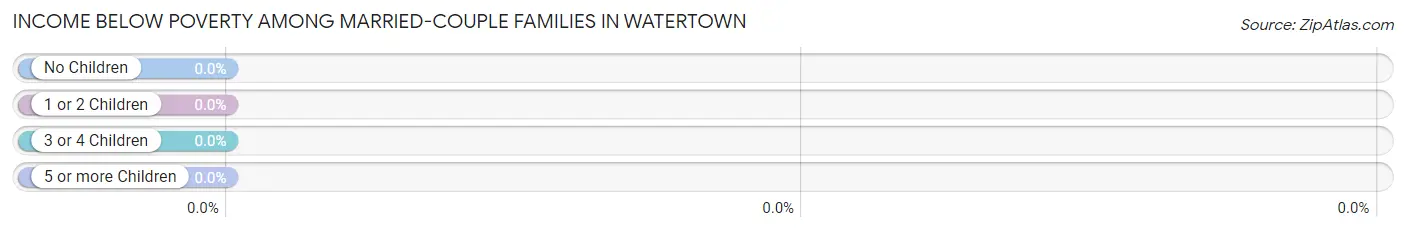
| Children | Above Poverty | Below Poverty |
| No Children | 627 (100.0%) | 0 (0.0%) |
| 1 or 2 Children | 360 (100.0%) | 0 (0.0%) |
| 3 or 4 Children | 30 (100.0%) | 0 (0.0%) |
| 5 or more Children | 18 (100.0%) | 0 (0.0%) |
| Total | 1,035 (100.0%) | 0 (0.0%) |
Income Below Poverty Among Single-Parent Households in Watertown
According to the poverty data in Watertown, 13.4% or 18 single-father households and 33.8% or 51 single-mother households are living below the poverty line. Among single-father households, those with 3 or 4 children have the highest poverty rate, with 18 households (100.0%) experiencing poverty. Likewise, among single-mother households, those with 1 or 2 children have the highest poverty rate, with 51 households (36.2%) falling below the poverty line.
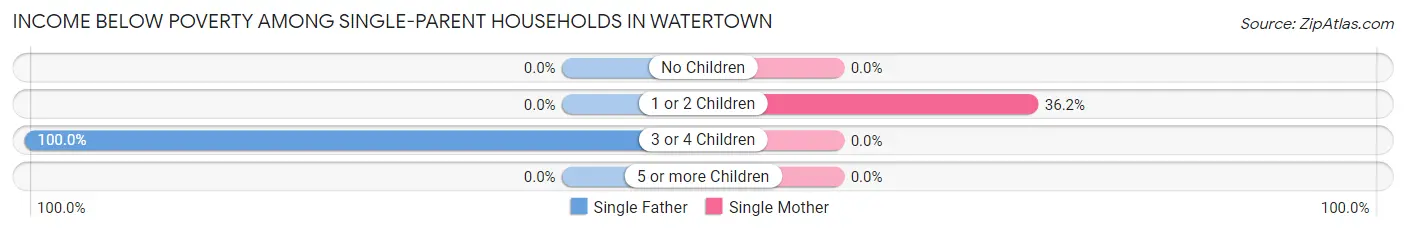
| Children | Single Father | Single Mother |
| No Children | 0 (0.0%) | 0 (0.0%) |
| 1 or 2 Children | 0 (0.0%) | 51 (36.2%) |
| 3 or 4 Children | 18 (100.0%) | 0 (0.0%) |
| 5 or more Children | 0 (0.0%) | 0 (0.0%) |
| Total | 18 (13.4%) | 51 (33.8%) |
Income Below Poverty Among Married-Couple vs Single-Parent Households in Watertown
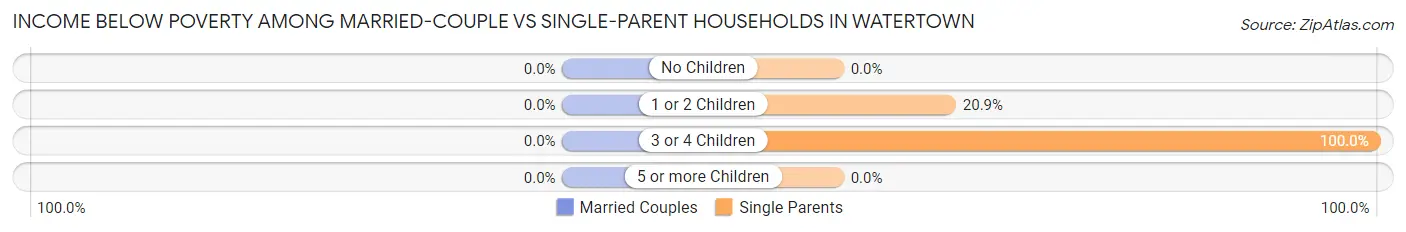
| Children | Married-Couple Families | Single-Parent Households |
| No Children | 0 (0.0%) | 0 (0.0%) |
| 1 or 2 Children | 0 (0.0%) | 51 (20.9%) |
| 3 or 4 Children | 0 (0.0%) | 18 (100.0%) |
| 5 or more Children | 0 (0.0%) | 0 (0.0%) |
| Total | 0 (0.0%) | 69 (24.2%) |
Race in Watertown
The most populous races in Watertown are White / Caucasian (4,574 | 97.1%), Two or more Races (124 | 2.6%), and Hispanic or Latino (77 | 1.6%).
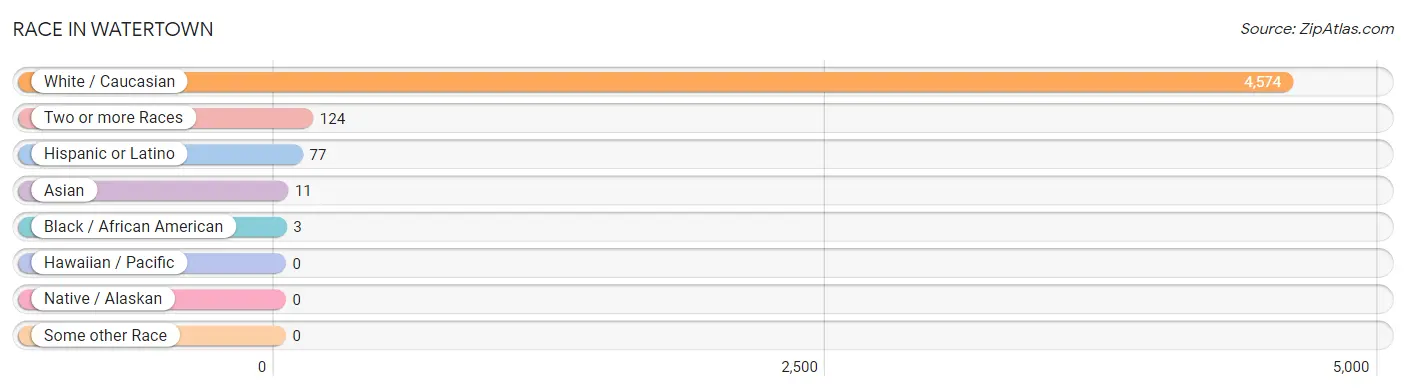
| Race | # Population | % Population |
| Asian | 11 | 0.2% |
| Black / African American | 3 | 0.1% |
| Hawaiian / Pacific | 0 | 0.0% |
| Hispanic or Latino | 77 | 1.6% |
| Native / Alaskan | 0 | 0.0% |
| White / Caucasian | 4,574 | 97.1% |
| Two or more Races | 124 | 2.6% |
| Some other Race | 0 | 0.0% |
| Total | 4,712 | 100.0% |
Ancestry in Watertown
The most populous ancestries reported in Watertown are German (1,884 | 40.0%), Norwegian (1,093 | 23.2%), Swedish (948 | 20.1%), Irish (420 | 8.9%), and Finnish (328 | 7.0%), together accounting for 99.2% of all Watertown residents.
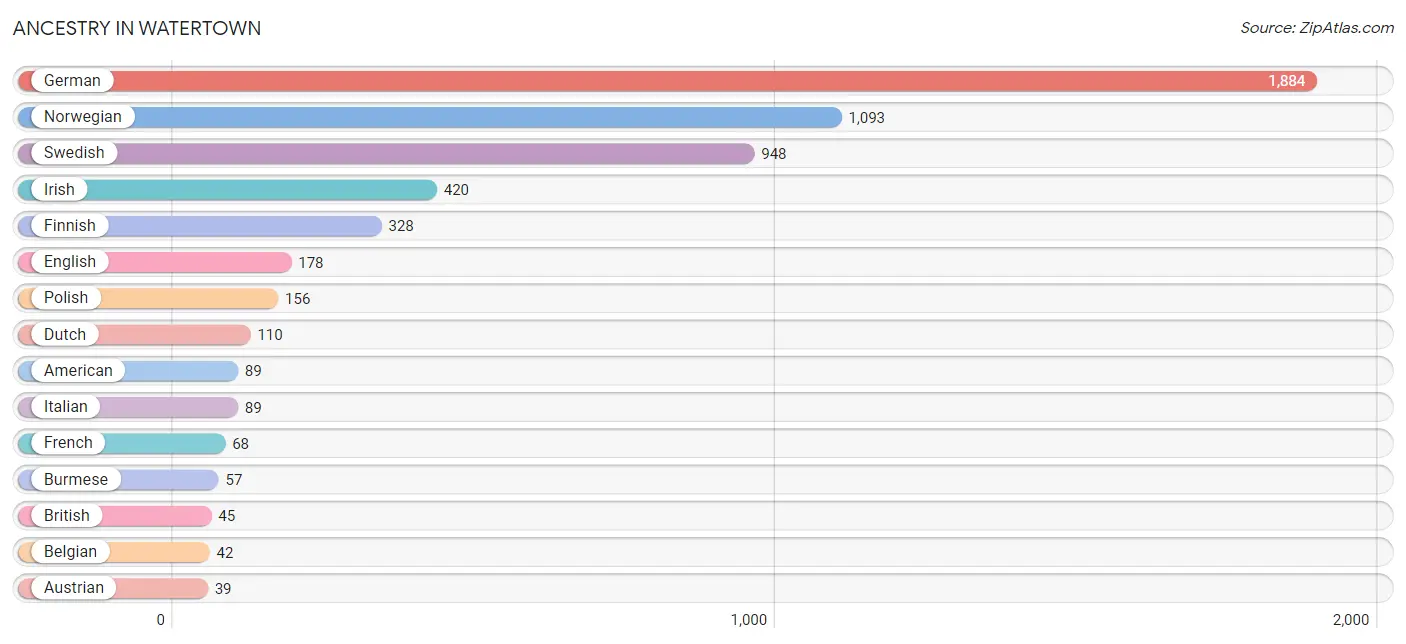
| Ancestry | # Population | % Population |
| American | 89 | 1.9% |
| Austrian | 39 | 0.8% |
| Belgian | 42 | 0.9% |
| British | 45 | 1.0% |
| Burmese | 57 | 1.2% |
| Czech | 17 | 0.4% |
| Danish | 38 | 0.8% |
| Dutch | 110 | 2.3% |
| English | 178 | 3.8% |
| Ethiopian | 3 | 0.1% |
| European | 29 | 0.6% |
| Finnish | 328 | 7.0% |
| French | 68 | 1.4% |
| French Canadian | 31 | 0.7% |
| German | 1,884 | 40.0% |
| Hungarian | 33 | 0.7% |
| Icelander | 31 | 0.7% |
| Irish | 420 | 8.9% |
| Italian | 89 | 1.9% |
| Mexican | 39 | 0.8% |
| Northern European | 14 | 0.3% |
| Norwegian | 1,093 | 23.2% |
| Polish | 156 | 3.3% |
| Portuguese | 14 | 0.3% |
| Scandinavian | 18 | 0.4% |
| Spaniard | 38 | 0.8% |
| Subsaharan African | 3 | 0.1% |
| Swedish | 948 | 20.1% |
| Swiss | 8 | 0.2% | View All 29 Rows |
Immigrants in Watertown
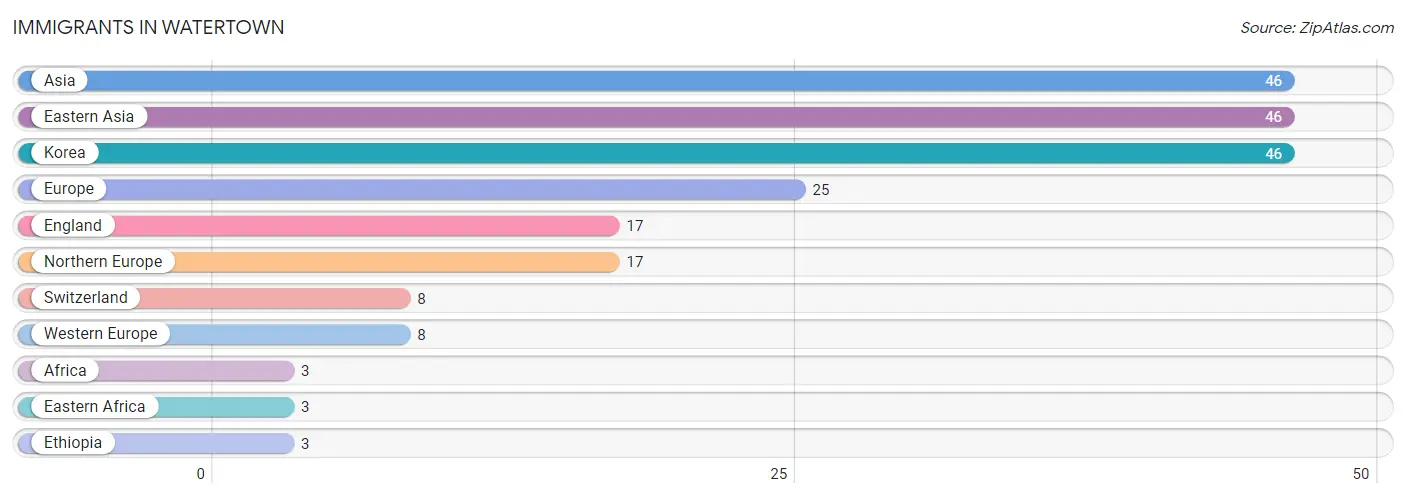
The most numerous immigrant groups reported in Watertown came from Asia (46 | 1.0%), Eastern Asia (46 | 1.0%), Korea (46 | 1.0%), Europe (25 | 0.5%), and England (17 | 0.4%), together accounting for 3.8% of all Watertown residents.
| Immigration Origin | # Population | % Population |
| Africa | 3 | 0.1% |
| Asia | 46 | 1.0% |
| Eastern Africa | 3 | 0.1% |
| Eastern Asia | 46 | 1.0% |
| England | 17 | 0.4% |
| Ethiopia | 3 | 0.1% |
| Europe | 25 | 0.5% |
| Korea | 46 | 1.0% |
| Northern Europe | 17 | 0.4% |
| Switzerland | 8 | 0.2% |
| Western Europe | 8 | 0.2% | View All 11 Rows |
Sex and Age in Watertown
Sex and Age in Watertown
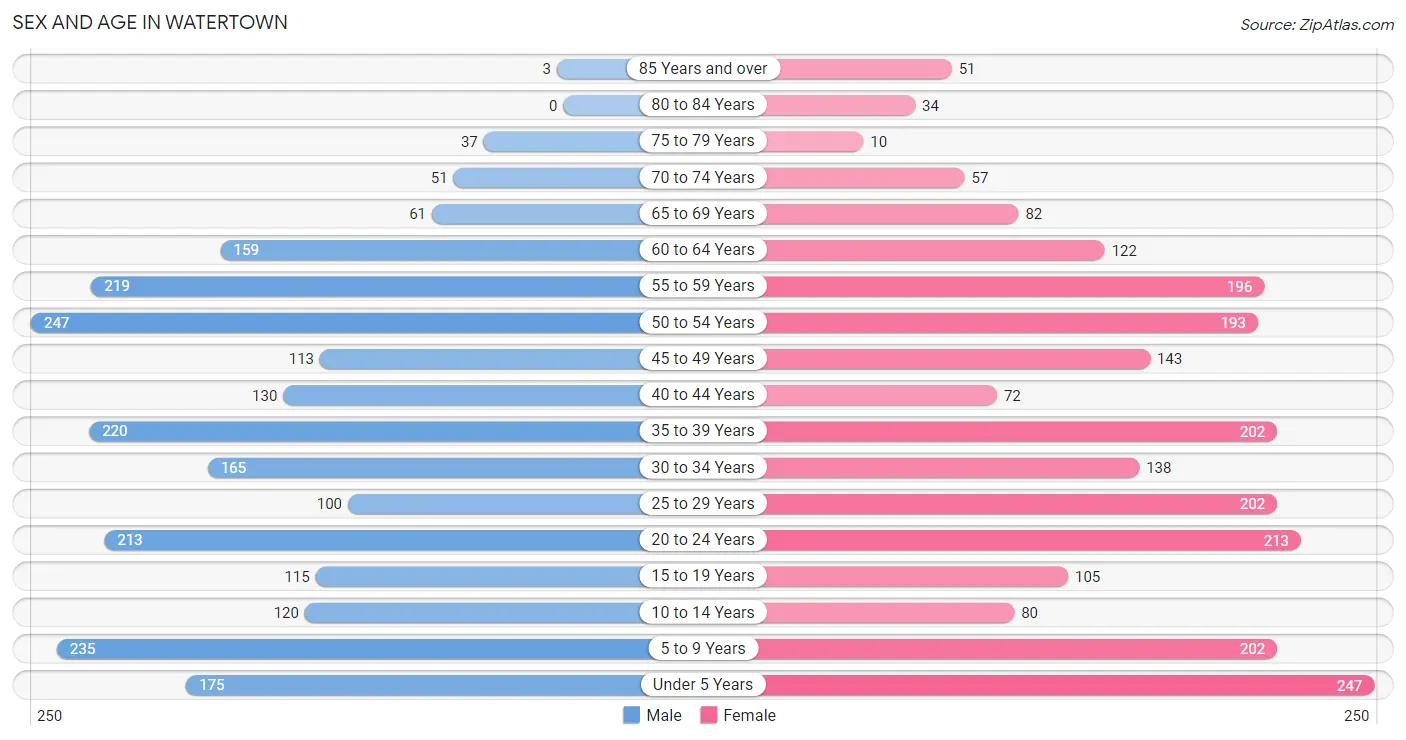
The most populous age groups in Watertown are 50 to 54 Years (247 | 10.4%) for men and Under 5 Years (247 | 10.5%) for women.
| Age Bracket | Male | Female |
| Under 5 Years | 175 (7.4%) | 247 (10.5%) |
| 5 to 9 Years | 235 (9.9%) | 202 (8.6%) |
| 10 to 14 Years | 120 (5.1%) | 80 (3.4%) |
| 15 to 19 Years | 115 (4.9%) | 105 (4.5%) |
| 20 to 24 Years | 213 (9.0%) | 213 (9.1%) |
| 25 to 29 Years | 100 (4.2%) | 202 (8.6%) |
| 30 to 34 Years | 165 (7.0%) | 138 (5.9%) |
| 35 to 39 Years | 220 (9.3%) | 202 (8.6%) |
| 40 to 44 Years | 130 (5.5%) | 72 (3.1%) |
| 45 to 49 Years | 113 (4.8%) | 143 (6.1%) |
| 50 to 54 Years | 247 (10.4%) | 193 (8.2%) |
| 55 to 59 Years | 219 (9.3%) | 196 (8.3%) |
| 60 to 64 Years | 159 (6.7%) | 122 (5.2%) |
| 65 to 69 Years | 61 (2.6%) | 82 (3.5%) |
| 70 to 74 Years | 51 (2.2%) | 57 (2.4%) |
| 75 to 79 Years | 37 (1.6%) | 10 (0.4%) |
| 80 to 84 Years | 0 (0.0%) | 34 (1.5%) |
| 85 Years and over | 3 (0.1%) | 51 (2.2%) |
| Total | 2,363 (100.0%) | 2,349 (100.0%) |
Families and Households in Watertown
Median Family Size in Watertown
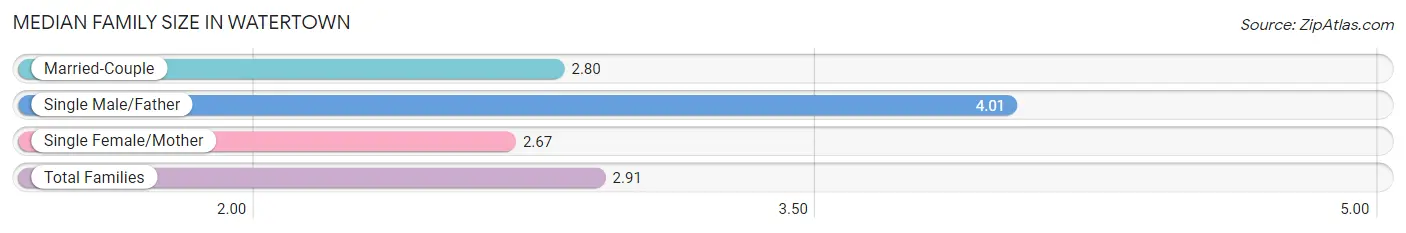
The median family size in Watertown is 2.91 persons per family, with single male/father families (134 | 10.2%) accounting for the largest median family size of 4.01 persons per family. On the other hand, single female/mother families (151 | 11.4%) represent the smallest median family size with 2.67 persons per family.
| Family Type | # Families | Family Size |
| Married-Couple | 1,035 (78.4%) | 2.80 |
| Single Male/Father | 134 (10.2%) | 4.01 |
| Single Female/Mother | 151 (11.4%) | 2.67 |
| Total Families | 1,320 (100.0%) | 2.91 |
Median Household Size in Watertown
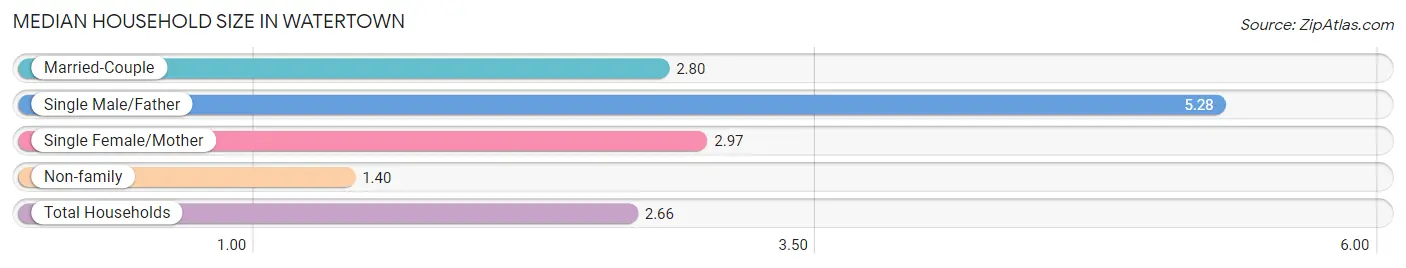
The median household size in Watertown is 2.66 persons per household, with single male/father households (134 | 7.7%) accounting for the largest median household size of 5.28 persons per household. non-family households (428 | 24.5%) represent the smallest median household size with 1.40 persons per household.
| Household Type | # Households | Household Size |
| Married-Couple | 1,035 (59.2%) | 2.80 |
| Single Male/Father | 134 (7.7%) | 5.28 |
| Single Female/Mother | 151 (8.6%) | 2.97 |
| Non-family | 428 (24.5%) | 1.40 |
| Total Households | 1,748 (100.0%) | 2.66 |
Household Size by Marriage Status in Watertown
Out of a total of 1,748 households in Watertown, 1,320 (75.5%) are family households, while 428 (24.5%) are nonfamily households. The most numerous type of family households are 2-person households, comprising 526, and the most common type of nonfamily households are 1-person households, comprising 347.
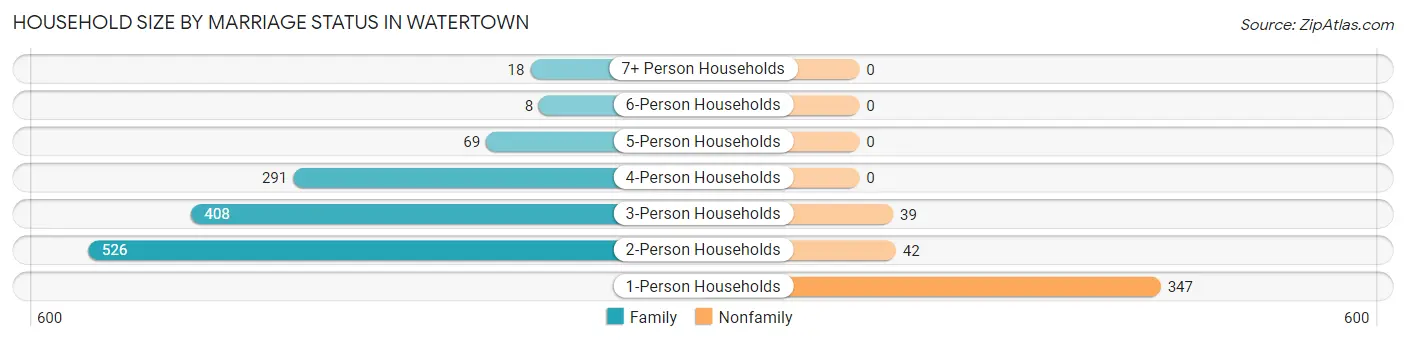
| Household Size | Family Households | Nonfamily Households |
| 1-Person Households | - | 347 (19.9%) |
| 2-Person Households | 526 (30.1%) | 42 (2.4%) |
| 3-Person Households | 408 (23.3%) | 39 (2.2%) |
| 4-Person Households | 291 (16.7%) | 0 (0.0%) |
| 5-Person Households | 69 (4.0%) | 0 (0.0%) |
| 6-Person Households | 8 (0.5%) | 0 (0.0%) |
| 7+ Person Households | 18 (1.0%) | 0 (0.0%) |
| Total | 1,320 (75.5%) | 428 (24.5%) |
Female Fertility in Watertown
Fertility by Age in Watertown
Average fertility rate in Watertown is 130.0 births per 1,000 women. Women in the age bracket of 15 to 19 years have the highest fertility rate with 352.0 births per 1,000 women. Women in the age bracket of 35 to 50 years acount for 60.7% of all women with births.
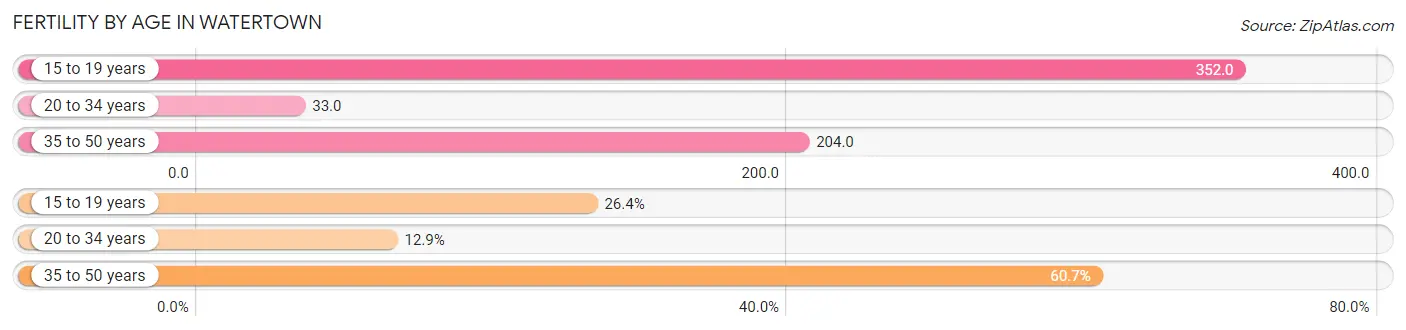
| Age Bracket | Women with Births | Births / 1,000 Women |
| 15 to 19 years | 37 (26.4%) | 352.0 |
| 20 to 34 years | 18 (12.9%) | 33.0 |
| 35 to 50 years | 85 (60.7%) | 204.0 |
| Total | 140 (100.0%) | 130.0 |
Fertility by Age by Marriage Status in Watertown
79.3% of women with births (140) in Watertown are married. The highest percentage of unmarried women with births falls into 35 to 50 years age bracket with 34.1% of them unmarried at the time of birth, while the lowest percentage of unmarried women with births belong to 15 to 19 years age bracket with 0.0% of them unmarried.
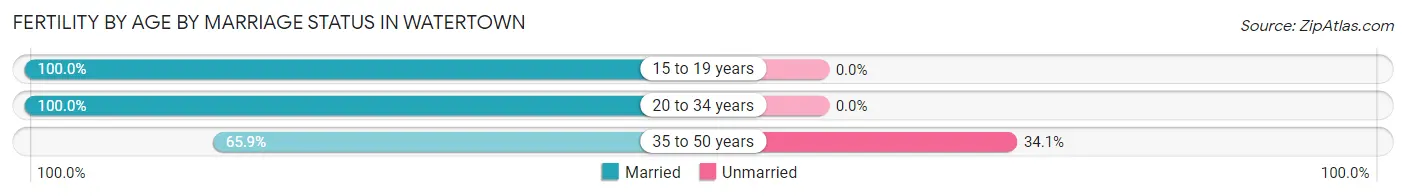
| Age Bracket | Married | Unmarried |
| 15 to 19 years | 37 (100.0%) | 0 (0.0%) |
| 20 to 34 years | 18 (100.0%) | 0 (0.0%) |
| 35 to 50 years | 56 (65.9%) | 29 (34.1%) |
| Total | 111 (79.3%) | 29 (20.7%) |
Fertility by Education in Watertown
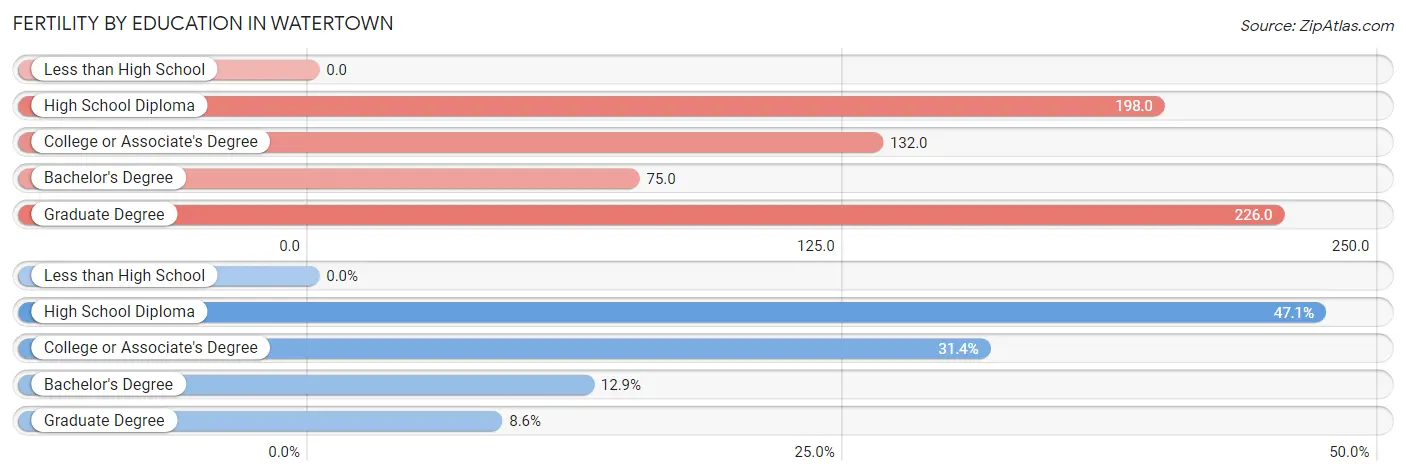
| Educational Attainment | Women with Births | Births / 1,000 Women |
| Less than High School | 0 (0.0%) | 0.0 |
| High School Diploma | 66 (47.1%) | 198.0 |
| College or Associate's Degree | 44 (31.4%) | 132.0 |
| Bachelor's Degree | 18 (12.9%) | 75.0 |
| Graduate Degree | 12 (8.6%) | 226.0 |
| Total | 140 (100.0%) | 130.0 |
Fertility by Education by Marriage Status in Watertown
20.7% of women with births in Watertown are unmarried. Women with the educational attainment of college or associate's degree are most likely to be married with 100.0% of them married at childbirth, while women with the educational attainment of high school diploma are least likely to be married with 43.9% of them unmarried at childbirth.
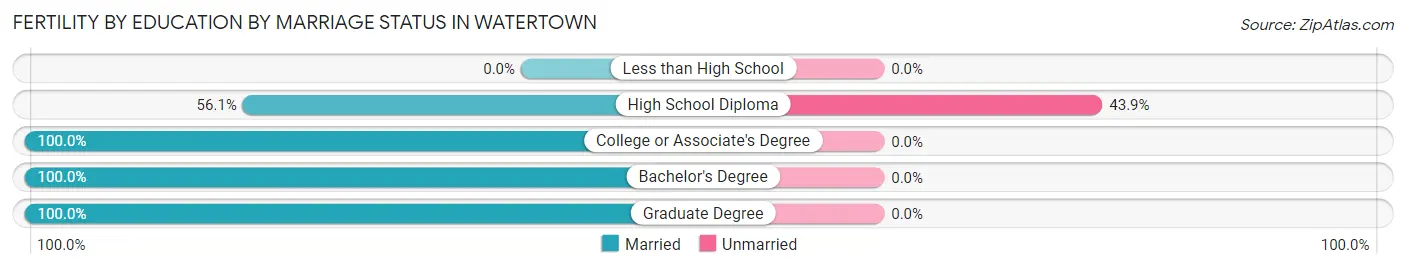
| Educational Attainment | Married | Unmarried |
| Less than High School | 0 (0.0%) | 0 (0.0%) |
| High School Diploma | 37 (56.1%) | 29 (43.9%) |
| College or Associate's Degree | 44 (100.0%) | 0 (0.0%) |
| Bachelor's Degree | 18 (100.0%) | 0 (0.0%) |
| Graduate Degree | 12 (100.0%) | 0 (0.0%) |
| Total | 111 (79.3%) | 29 (20.7%) |
Employment Characteristics in Watertown
Employment by Class of Employer in Watertown
Among the 2,835 employed individuals in Watertown, private company employees (2,106 | 74.3%), not-for-profit organizations (324 | 11.4%), and local government employees (127 | 4.5%) make up the most common classes of employment.
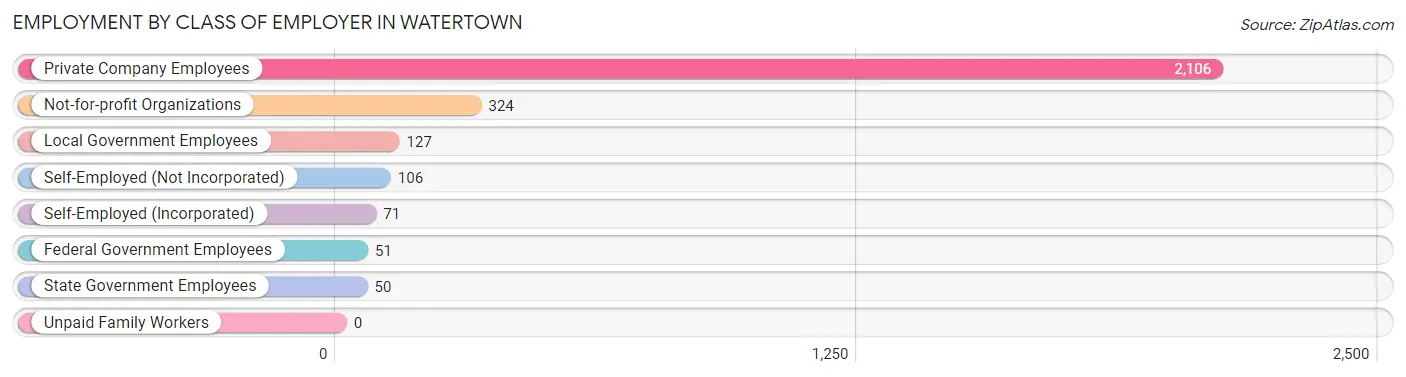
| Employer Class | # Employees | % Employees |
| Private Company Employees | 2,106 | 74.3% |
| Self-Employed (Incorporated) | 71 | 2.5% |
| Self-Employed (Not Incorporated) | 106 | 3.7% |
| Not-for-profit Organizations | 324 | 11.4% |
| Local Government Employees | 127 | 4.5% |
| State Government Employees | 50 | 1.8% |
| Federal Government Employees | 51 | 1.8% |
| Unpaid Family Workers | 0 | 0.0% |
| Total | 2,835 | 100.0% |
Employment Status by Age in Watertown
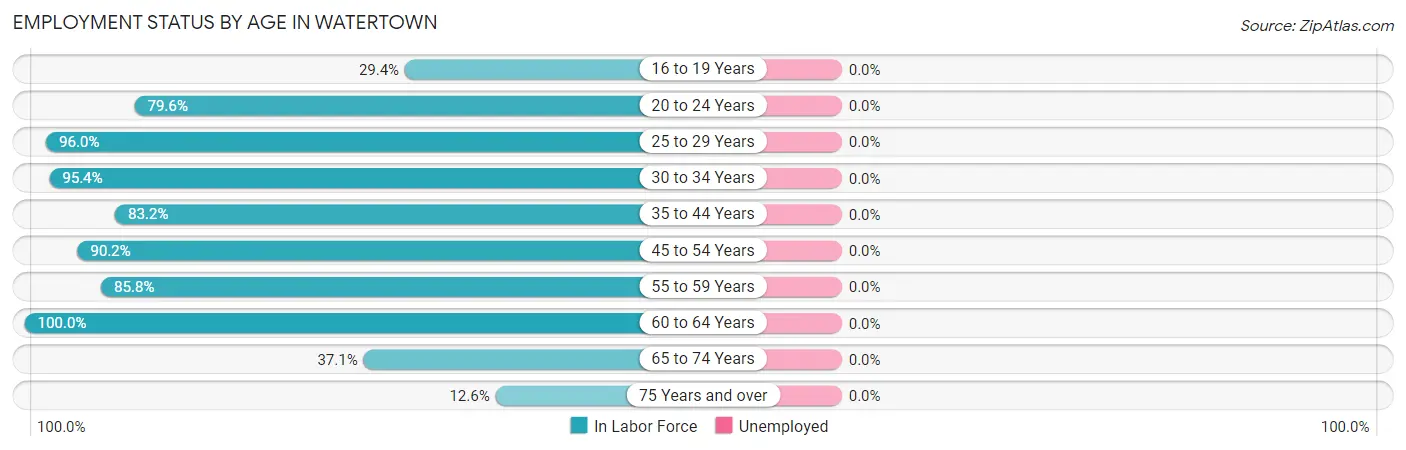
| Age Bracket | In Labor Force | Unemployed |
| 16 to 19 Years | 58 (29.4%) | 0 (0.0%) |
| 20 to 24 Years | 339 (79.6%) | 0 (0.0%) |
| 25 to 29 Years | 290 (96.0%) | 0 (0.0%) |
| 30 to 34 Years | 289 (95.4%) | 0 (0.0%) |
| 35 to 44 Years | 519 (83.2%) | 0 (0.0%) |
| 45 to 54 Years | 628 (90.2%) | 0 (0.0%) |
| 55 to 59 Years | 356 (85.8%) | 0 (0.0%) |
| 60 to 64 Years | 281 (100.0%) | 0 (0.0%) |
| 65 to 74 Years | 93 (37.1%) | 0 (0.0%) |
| 75 Years and over | 17 (12.6%) | 0 (0.0%) |
| Total | 2,871 (79.1%) | 0 (0.0%) |
Employment Status by Educational Attainment in Watertown
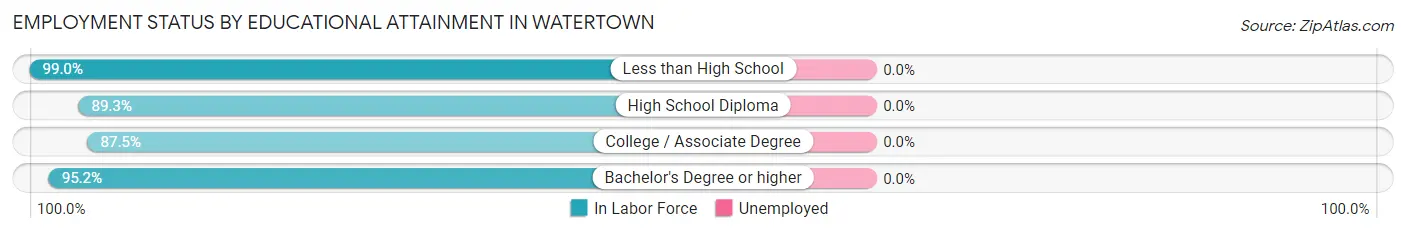
| Educational Attainment | In Labor Force | Unemployed |
| Less than High School | 101 (99.0%) | 0 (0.0%) |
| High School Diploma | 565 (89.3%) | 0 (0.0%) |
| College / Associate Degree | 1,124 (87.5%) | 0 (0.0%) |
| Bachelor's Degree or higher | 572 (95.2%) | 0 (0.0%) |
| Total | 2,364 (90.2%) | 0 (0.0%) |
Employment Occupations by Sex in Watertown
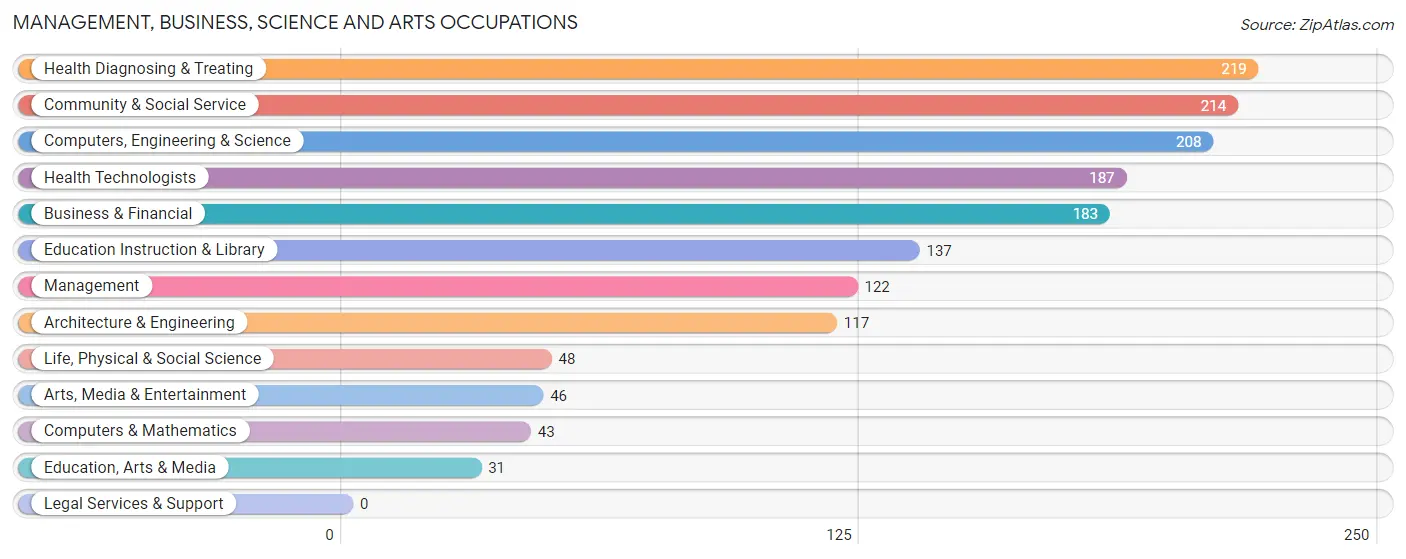
Management, Business, Science and Arts Occupations
The most common Management, Business, Science and Arts occupations in Watertown are Health Diagnosing & Treating (219 | 7.6%), Community & Social Service (214 | 7.5%), Computers, Engineering & Science (208 | 7.2%), Health Technologists (187 | 6.5%), and Business & Financial (183 | 6.4%).
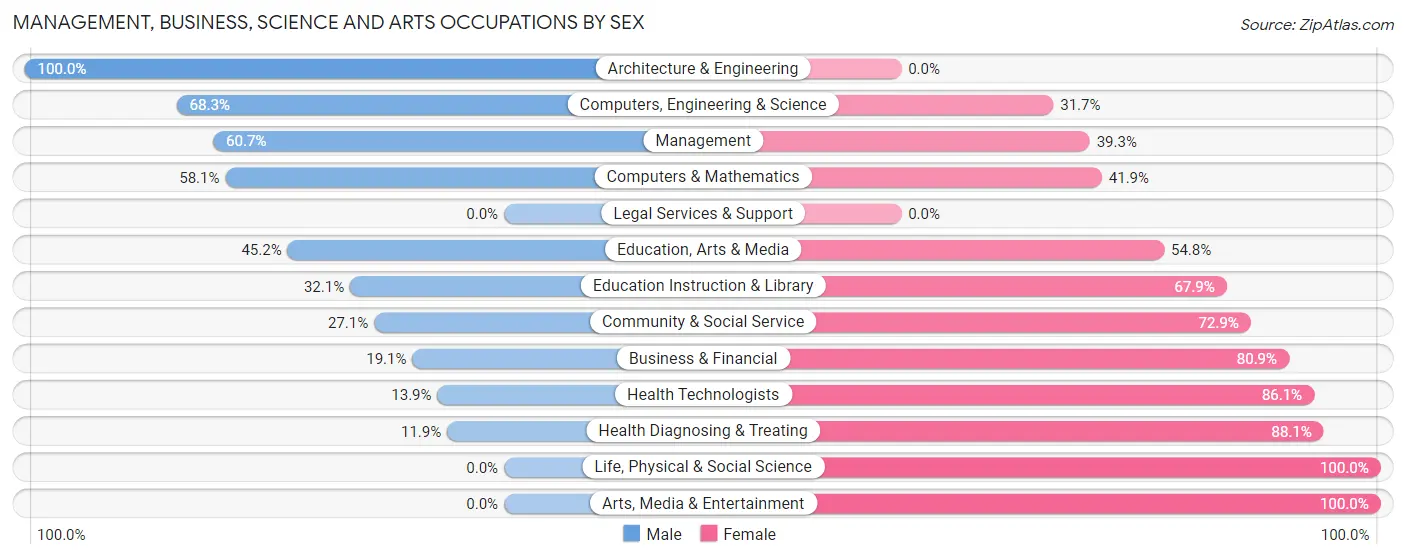
Management, Business, Science and Arts Occupations by Sex
Within the Management, Business, Science and Arts occupations in Watertown, the most male-oriented occupations are Architecture & Engineering (100.0%), Computers, Engineering & Science (68.3%), and Management (60.7%), while the most female-oriented occupations are Life, Physical & Social Science (100.0%), Arts, Media & Entertainment (100.0%), and Health Diagnosing & Treating (88.1%).
| Occupation | Male | Female |
| Management | 74 (60.7%) | 48 (39.3%) |
| Business & Financial | 35 (19.1%) | 148 (80.9%) |
| Computers, Engineering & Science | 142 (68.3%) | 66 (31.7%) |
| Computers & Mathematics | 25 (58.1%) | 18 (41.9%) |
| Architecture & Engineering | 117 (100.0%) | 0 (0.0%) |
| Life, Physical & Social Science | 0 (0.0%) | 48 (100.0%) |
| Community & Social Service | 58 (27.1%) | 156 (72.9%) |
| Education, Arts & Media | 14 (45.2%) | 17 (54.8%) |
| Legal Services & Support | 0 (0.0%) | 0 (0.0%) |
| Education Instruction & Library | 44 (32.1%) | 93 (67.9%) |
| Arts, Media & Entertainment | 0 (0.0%) | 46 (100.0%) |
| Health Diagnosing & Treating | 26 (11.9%) | 193 (88.1%) |
| Health Technologists | 26 (13.9%) | 161 (86.1%) |
| Total (Category) | 335 (35.4%) | 611 (64.6%) |
| Total (Overall) | 1,540 (53.7%) | 1,330 (46.3%) |
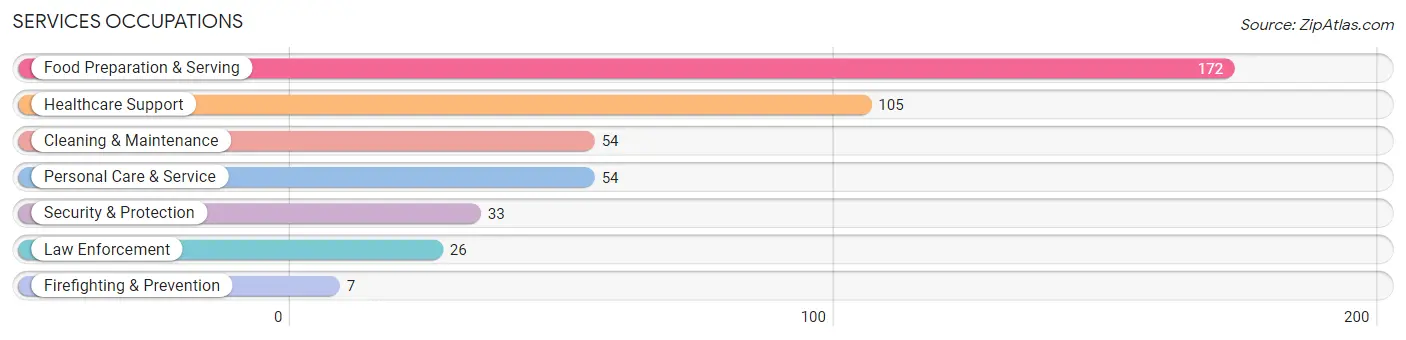
Services Occupations
The most common Services occupations in Watertown are Food Preparation & Serving (172 | 6.0%), Healthcare Support (105 | 3.7%), Cleaning & Maintenance (54 | 1.9%), Personal Care & Service (54 | 1.9%), and Security & Protection (33 | 1.1%).
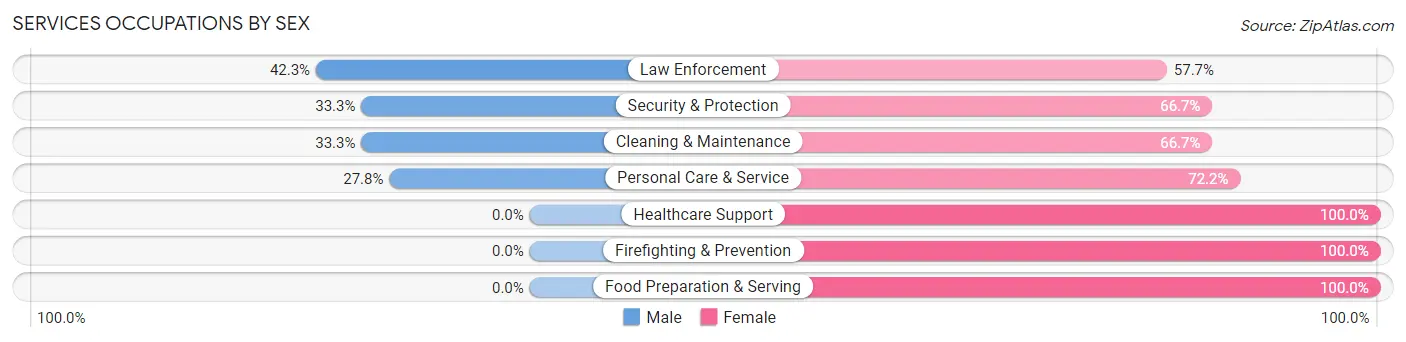
Services Occupations by Sex
Within the Services occupations in Watertown, the most male-oriented occupations are Law Enforcement (42.3%), Security & Protection (33.3%), and Cleaning & Maintenance (33.3%), while the most female-oriented occupations are Healthcare Support (100.0%), Firefighting & Prevention (100.0%), and Food Preparation & Serving (100.0%).
| Occupation | Male | Female |
| Healthcare Support | 0 (0.0%) | 105 (100.0%) |
| Security & Protection | 11 (33.3%) | 22 (66.7%) |
| Firefighting & Prevention | 0 (0.0%) | 7 (100.0%) |
| Law Enforcement | 11 (42.3%) | 15 (57.7%) |
| Food Preparation & Serving | 0 (0.0%) | 172 (100.0%) |
| Cleaning & Maintenance | 18 (33.3%) | 36 (66.7%) |
| Personal Care & Service | 15 (27.8%) | 39 (72.2%) |
| Total (Category) | 44 (10.5%) | 374 (89.5%) |
| Total (Overall) | 1,540 (53.7%) | 1,330 (46.3%) |
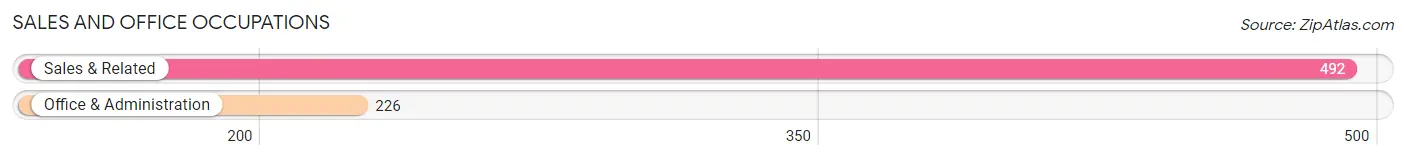
Sales and Office Occupations
The most common Sales and Office occupations in Watertown are Sales & Related (492 | 17.1%), and Office & Administration (226 | 7.9%).
Sales and Office Occupations by Sex

| Occupation | Male | Female |
| Sales & Related | 397 (80.7%) | 95 (19.3%) |
| Office & Administration | 86 (38.1%) | 140 (62.0%) |
| Total (Category) | 483 (67.3%) | 235 (32.7%) |
| Total (Overall) | 1,540 (53.7%) | 1,330 (46.3%) |
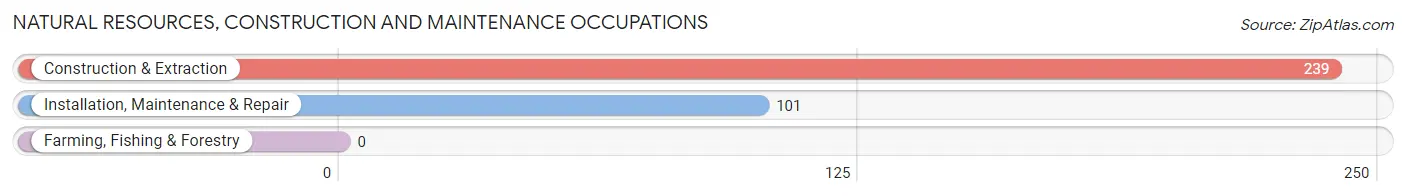
Natural Resources, Construction and Maintenance Occupations
The most common Natural Resources, Construction and Maintenance occupations in Watertown are Construction & Extraction (239 | 8.3%), and Installation, Maintenance & Repair (101 | 3.5%).
Natural Resources, Construction and Maintenance Occupations by Sex
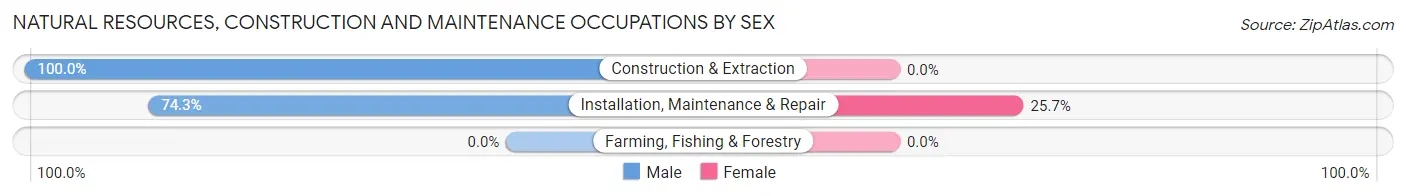
| Occupation | Male | Female |
| Farming, Fishing & Forestry | 0 (0.0%) | 0 (0.0%) |
| Construction & Extraction | 239 (100.0%) | 0 (0.0%) |
| Installation, Maintenance & Repair | 75 (74.3%) | 26 (25.7%) |
| Total (Category) | 314 (92.3%) | 26 (7.6%) |
| Total (Overall) | 1,540 (53.7%) | 1,330 (46.3%) |
Production, Transportation and Moving Occupations
The most common Production, Transportation and Moving occupations in Watertown are Production (269 | 9.4%), Transportation (120 | 4.2%), and Material Moving (59 | 2.1%).
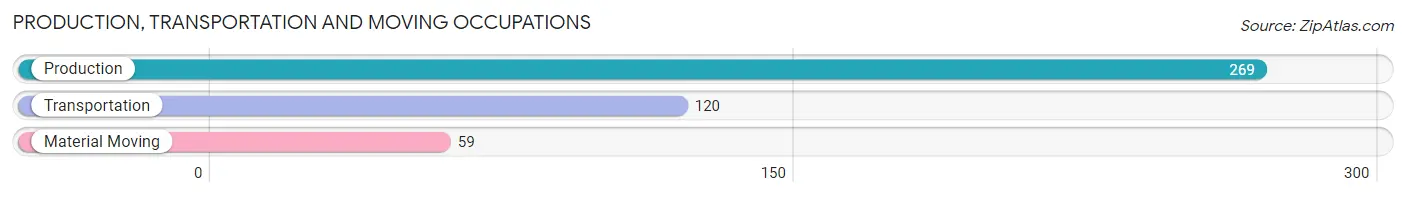
Production, Transportation and Moving Occupations by Sex
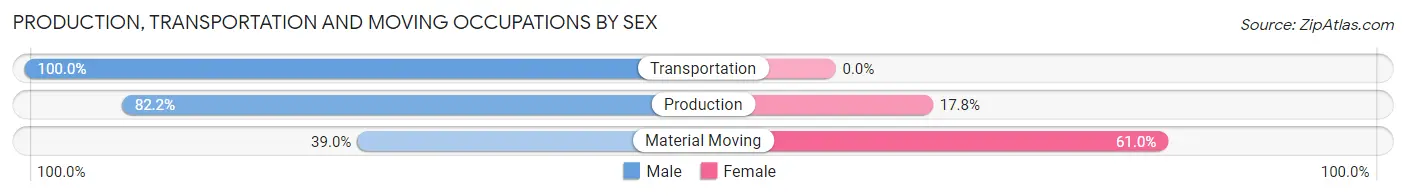
| Occupation | Male | Female |
| Production | 221 (82.2%) | 48 (17.8%) |
| Transportation | 120 (100.0%) | 0 (0.0%) |
| Material Moving | 23 (39.0%) | 36 (61.0%) |
| Total (Category) | 364 (81.2%) | 84 (18.8%) |
| Total (Overall) | 1,540 (53.7%) | 1,330 (46.3%) |
Employment Industries by Sex in Watertown
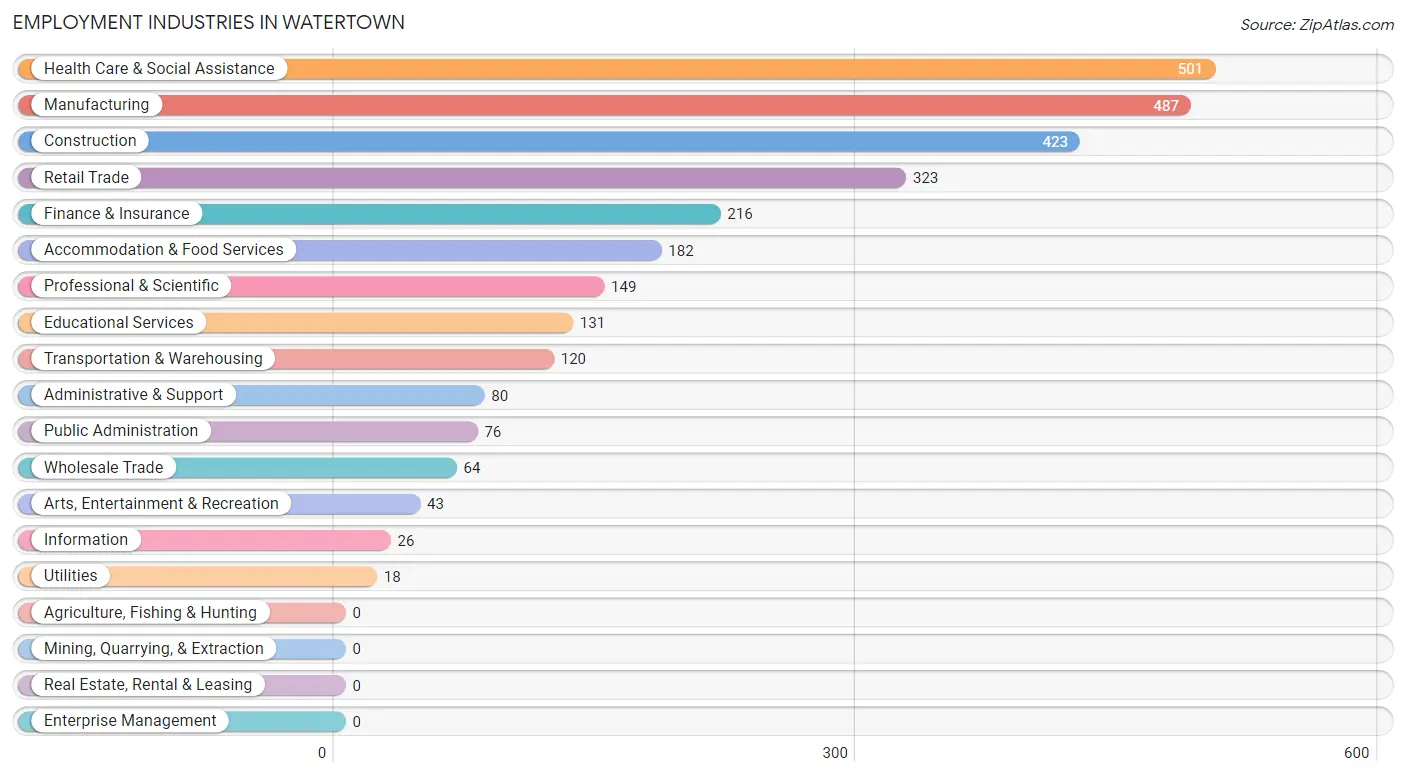
Employment Industries in Watertown
The major employment industries in Watertown include Health Care & Social Assistance (501 | 17.5%), Manufacturing (487 | 17.0%), Construction (423 | 14.7%), Retail Trade (323 | 11.3%), and Finance & Insurance (216 | 7.5%).
Employment Industries by Sex in Watertown
The Watertown industries that see more men than women are Construction (100.0%), Wholesale Trade (100.0%), and Arts, Entertainment & Recreation (81.4%), whereas the industries that tend to have a higher number of women are Utilities (100.0%), Information (100.0%), and Accommodation & Food Services (94.5%).
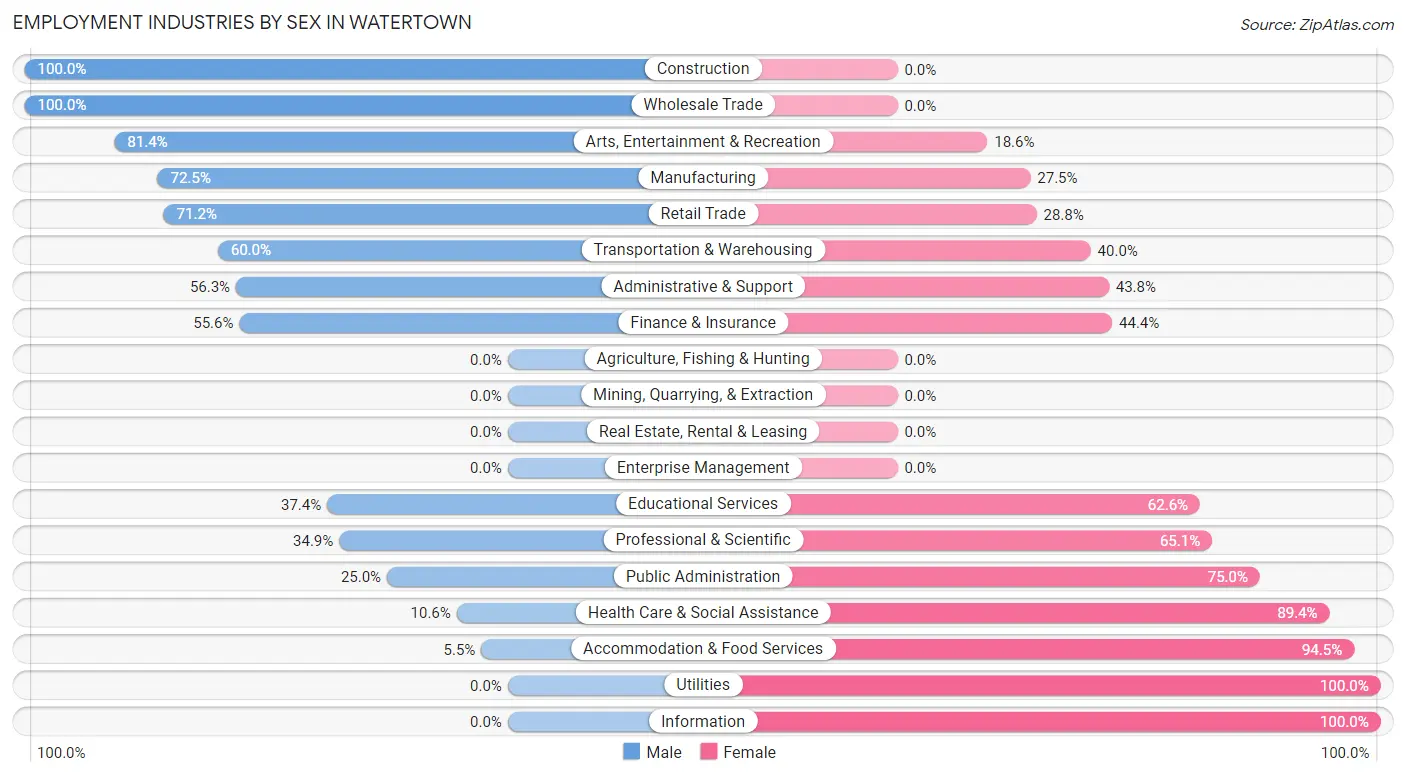
| Industry | Male | Female |
| Agriculture, Fishing & Hunting | 0 (0.0%) | 0 (0.0%) |
| Mining, Quarrying, & Extraction | 0 (0.0%) | 0 (0.0%) |
| Construction | 423 (100.0%) | 0 (0.0%) |
| Manufacturing | 353 (72.5%) | 134 (27.5%) |
| Wholesale Trade | 64 (100.0%) | 0 (0.0%) |
| Retail Trade | 230 (71.2%) | 93 (28.8%) |
| Transportation & Warehousing | 72 (60.0%) | 48 (40.0%) |
| Utilities | 0 (0.0%) | 18 (100.0%) |
| Information | 0 (0.0%) | 26 (100.0%) |
| Finance & Insurance | 120 (55.6%) | 96 (44.4%) |
| Real Estate, Rental & Leasing | 0 (0.0%) | 0 (0.0%) |
| Professional & Scientific | 52 (34.9%) | 97 (65.1%) |
| Enterprise Management | 0 (0.0%) | 0 (0.0%) |
| Administrative & Support | 45 (56.2%) | 35 (43.8%) |
| Educational Services | 49 (37.4%) | 82 (62.6%) |
| Health Care & Social Assistance | 53 (10.6%) | 448 (89.4%) |
| Arts, Entertainment & Recreation | 35 (81.4%) | 8 (18.6%) |
| Accommodation & Food Services | 10 (5.5%) | 172 (94.5%) |
| Public Administration | 19 (25.0%) | 57 (75.0%) |
| Total | 1,540 (53.7%) | 1,330 (46.3%) |
Education in Watertown
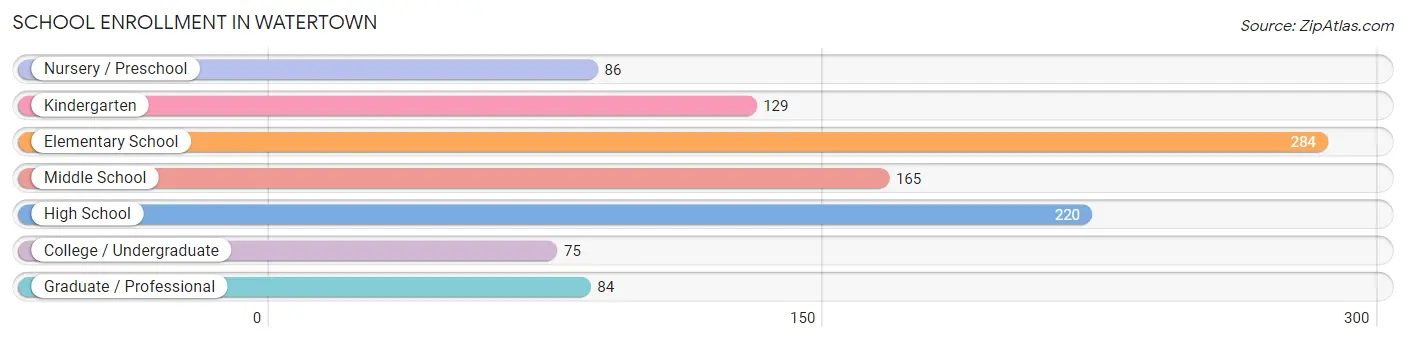
School Enrollment in Watertown
The most common levels of schooling among the 1,043 students in Watertown are elementary school (284 | 27.2%), high school (220 | 21.1%), and middle school (165 | 15.8%).
| School Level | # Students | % Students |
| Nursery / Preschool | 86 | 8.3% |
| Kindergarten | 129 | 12.4% |
| Elementary School | 284 | 27.2% |
| Middle School | 165 | 15.8% |
| High School | 220 | 21.1% |
| College / Undergraduate | 75 | 7.2% |
| Graduate / Professional | 84 | 8.1% |
| Total | 1,043 | 100.0% |
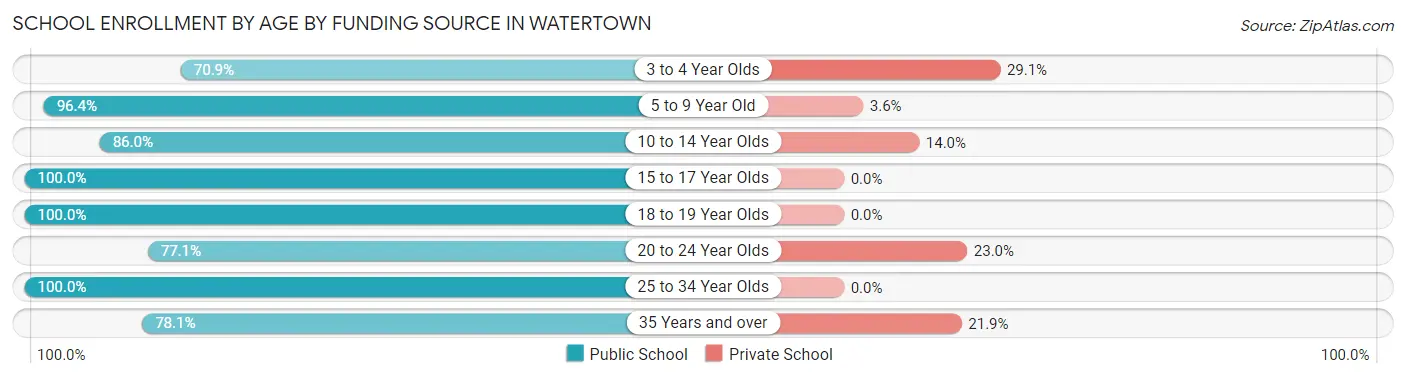
School Enrollment by Age by Funding Source in Watertown
Out of a total of 1,043 students who are enrolled in schools in Watertown, 96 (9.2%) attend a private institution, while the remaining 947 (90.8%) are enrolled in public schools. The age group of 3 to 4 year olds has the highest likelihood of being enrolled in private schools, with 23 (29.1% in the age bracket) enrolled. Conversely, the age group of 15 to 17 year olds has the lowest likelihood of being enrolled in a private school, with 117 (100.0% in the age bracket) attending a public institution.
| Age Bracket | Public School | Private School |
| 3 to 4 Year Olds | 56 (70.9%) | 23 (29.1%) |
| 5 to 9 Year Old | 405 (96.4%) | 15 (3.6%) |
| 10 to 14 Year Olds | 172 (86.0%) | 28 (14.0%) |
| 15 to 17 Year Olds | 117 (100.0%) | 0 (0.0%) |
| 18 to 19 Year Olds | 57 (100.0%) | 0 (0.0%) |
| 20 to 24 Year Olds | 47 (77.0%) | 14 (23.0%) |
| 25 to 34 Year Olds | 36 (100.0%) | 0 (0.0%) |
| 35 Years and over | 57 (78.1%) | 16 (21.9%) |
| Total | 947 (90.8%) | 96 (9.2%) |
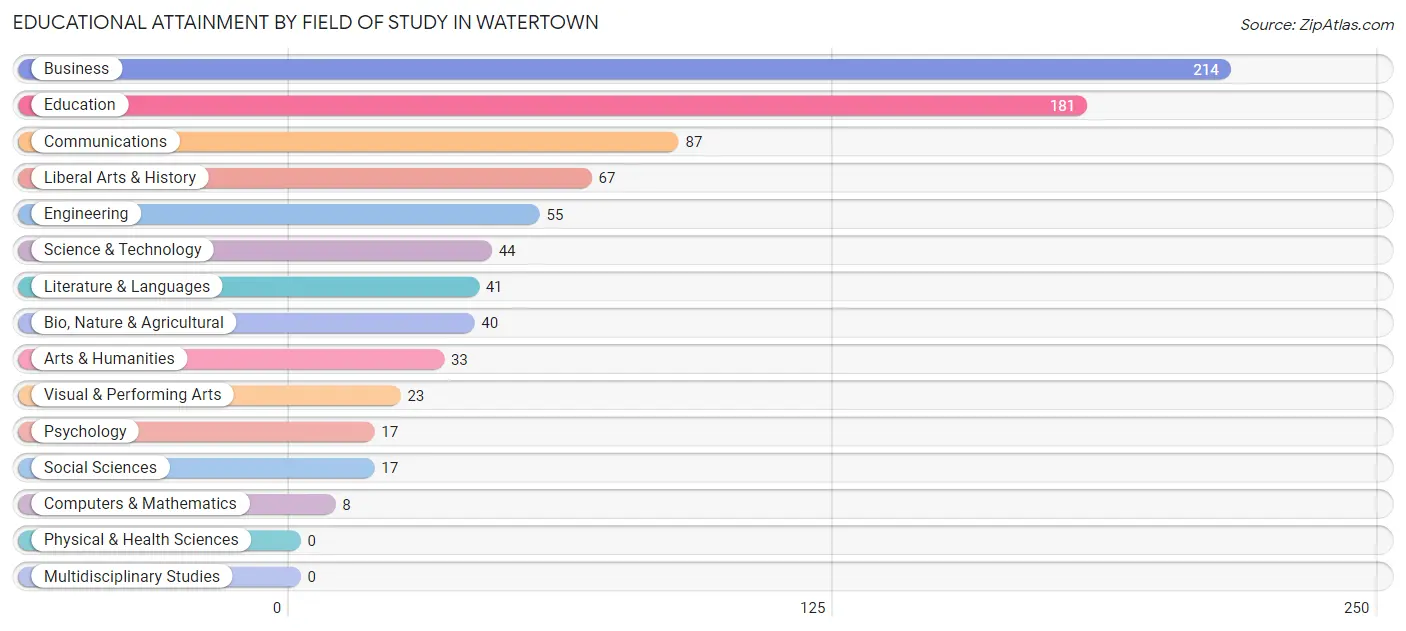
Educational Attainment by Field of Study in Watertown
Business (214 | 25.9%), education (181 | 21.9%), communications (87 | 10.5%), liberal arts & history (67 | 8.1%), and engineering (55 | 6.7%) are the most common fields of study among 827 individuals in Watertown who have obtained a bachelor's degree or higher.
| Field of Study | # Graduates | % Graduates |
| Computers & Mathematics | 8 | 1.0% |
| Bio, Nature & Agricultural | 40 | 4.8% |
| Physical & Health Sciences | 0 | 0.0% |
| Psychology | 17 | 2.1% |
| Social Sciences | 17 | 2.1% |
| Engineering | 55 | 6.7% |
| Multidisciplinary Studies | 0 | 0.0% |
| Science & Technology | 44 | 5.3% |
| Business | 214 | 25.9% |
| Education | 181 | 21.9% |
| Literature & Languages | 41 | 5.0% |
| Liberal Arts & History | 67 | 8.1% |
| Visual & Performing Arts | 23 | 2.8% |
| Communications | 87 | 10.5% |
| Arts & Humanities | 33 | 4.0% |
| Total | 827 | 100.0% |
Transportation & Commute in Watertown
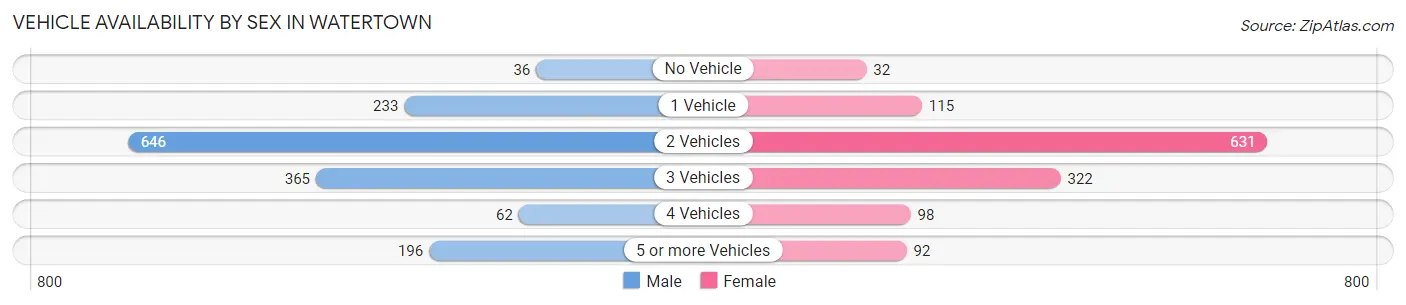
Vehicle Availability by Sex in Watertown
The most prevalent vehicle ownership categories in Watertown are males with 2 vehicles (646, accounting for 42.0%) and females with 2 vehicles (631, making up 50.1%).
| Vehicles Available | Male | Female |
| No Vehicle | 36 (2.3%) | 32 (2.5%) |
| 1 Vehicle | 233 (15.1%) | 115 (8.9%) |
| 2 Vehicles | 646 (42.0%) | 631 (48.9%) |
| 3 Vehicles | 365 (23.7%) | 322 (25.0%) |
| 4 Vehicles | 62 (4.0%) | 98 (7.6%) |
| 5 or more Vehicles | 196 (12.7%) | 92 (7.1%) |
| Total | 1,538 (100.0%) | 1,290 (100.0%) |
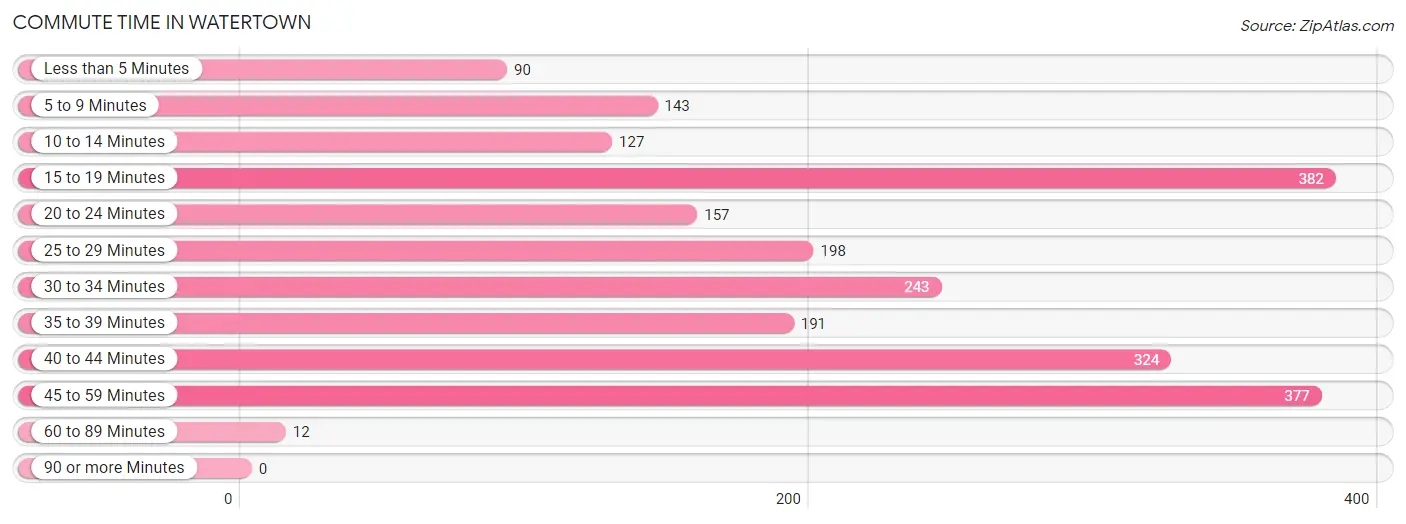
Commute Time in Watertown
The most frequently occuring commute durations in Watertown are 15 to 19 minutes (382 commuters, 17.0%), 45 to 59 minutes (377 commuters, 16.8%), and 40 to 44 minutes (324 commuters, 14.4%).
| Commute Time | # Commuters | % Commuters |
| Less than 5 Minutes | 90 | 4.0% |
| 5 to 9 Minutes | 143 | 6.4% |
| 10 to 14 Minutes | 127 | 5.7% |
| 15 to 19 Minutes | 382 | 17.0% |
| 20 to 24 Minutes | 157 | 7.0% |
| 25 to 29 Minutes | 198 | 8.8% |
| 30 to 34 Minutes | 243 | 10.8% |
| 35 to 39 Minutes | 191 | 8.5% |
| 40 to 44 Minutes | 324 | 14.4% |
| 45 to 59 Minutes | 377 | 16.8% |
| 60 to 89 Minutes | 12 | 0.5% |
| 90 or more Minutes | 0 | 0.0% |
Commute Time by Sex in Watertown
The most common commute times in Watertown are 40 to 44 minutes (290 commuters, 22.0%) for males and 15 to 19 minutes (232 commuters, 25.0%) for females.
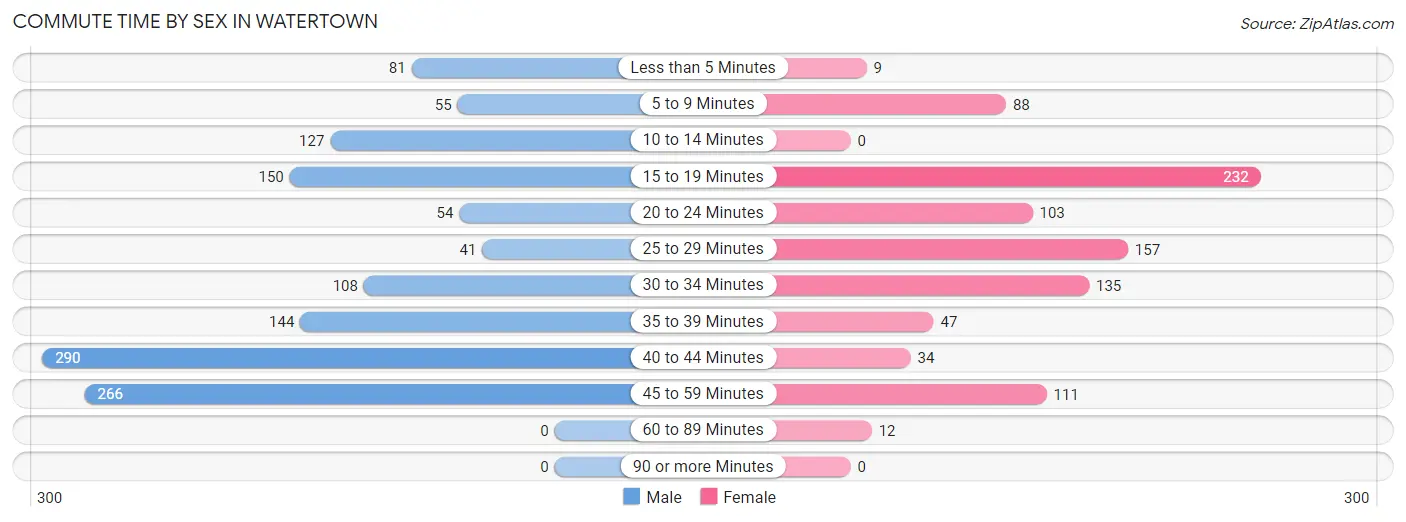
| Commute Time | Male | Female |
| Less than 5 Minutes | 81 (6.2%) | 9 (1.0%) |
| 5 to 9 Minutes | 55 (4.2%) | 88 (9.5%) |
| 10 to 14 Minutes | 127 (9.7%) | 0 (0.0%) |
| 15 to 19 Minutes | 150 (11.4%) | 232 (25.0%) |
| 20 to 24 Minutes | 54 (4.1%) | 103 (11.1%) |
| 25 to 29 Minutes | 41 (3.1%) | 157 (16.9%) |
| 30 to 34 Minutes | 108 (8.2%) | 135 (14.5%) |
| 35 to 39 Minutes | 144 (10.9%) | 47 (5.1%) |
| 40 to 44 Minutes | 290 (22.0%) | 34 (3.7%) |
| 45 to 59 Minutes | 266 (20.2%) | 111 (12.0%) |
| 60 to 89 Minutes | 0 (0.0%) | 12 (1.3%) |
| 90 or more Minutes | 0 (0.0%) | 0 (0.0%) |
Time of Departure to Work by Sex in Watertown
The most frequent times of departure to work in Watertown are 7:00 AM to 7:29 AM (228, 17.3%) for males and 12:00 PM to 3:59 PM (250, 26.9%) for females.
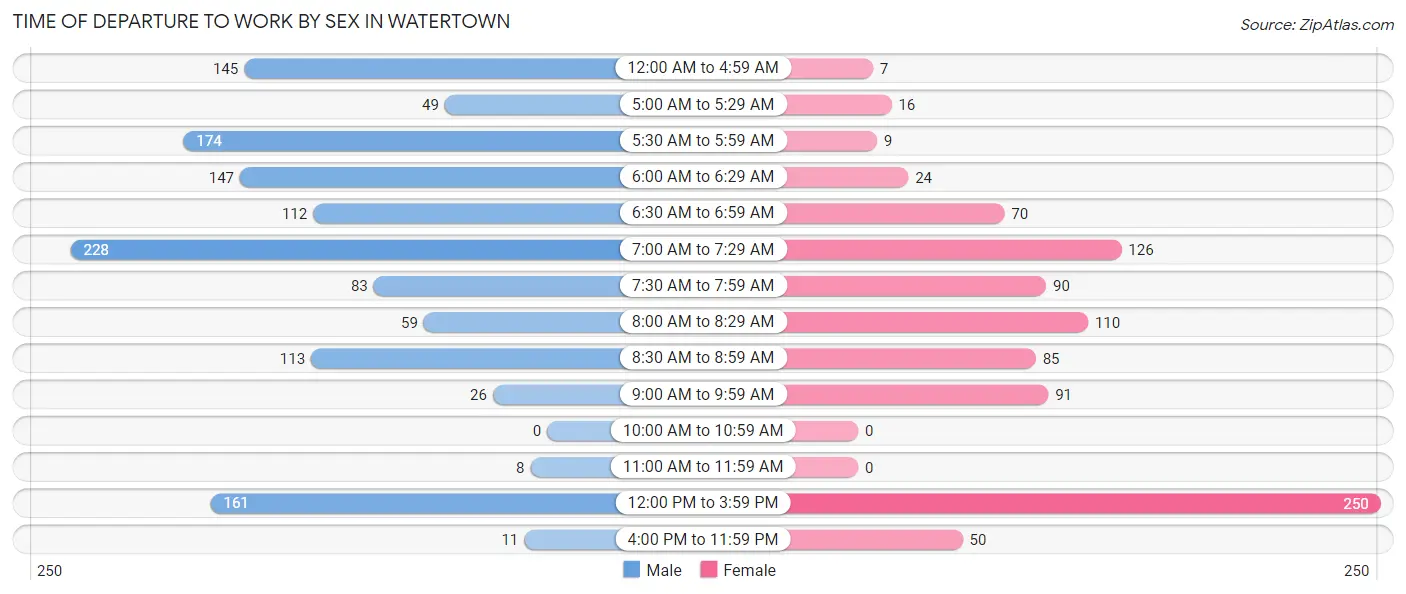
| Time of Departure | Male | Female |
| 12:00 AM to 4:59 AM | 145 (11.0%) | 7 (0.7%) |
| 5:00 AM to 5:29 AM | 49 (3.7%) | 16 (1.7%) |
| 5:30 AM to 5:59 AM | 174 (13.2%) | 9 (1.0%) |
| 6:00 AM to 6:29 AM | 147 (11.2%) | 24 (2.6%) |
| 6:30 AM to 6:59 AM | 112 (8.5%) | 70 (7.5%) |
| 7:00 AM to 7:29 AM | 228 (17.3%) | 126 (13.6%) |
| 7:30 AM to 7:59 AM | 83 (6.3%) | 90 (9.7%) |
| 8:00 AM to 8:29 AM | 59 (4.5%) | 110 (11.8%) |
| 8:30 AM to 8:59 AM | 113 (8.6%) | 85 (9.2%) |
| 9:00 AM to 9:59 AM | 26 (2.0%) | 91 (9.8%) |
| 10:00 AM to 10:59 AM | 0 (0.0%) | 0 (0.0%) |
| 11:00 AM to 11:59 AM | 8 (0.6%) | 0 (0.0%) |
| 12:00 PM to 3:59 PM | 161 (12.2%) | 250 (26.9%) |
| 4:00 PM to 11:59 PM | 11 (0.8%) | 50 (5.4%) |
| Total | 1,316 (100.0%) | 928 (100.0%) |
Housing Occupancy in Watertown
Occupancy by Ownership in Watertown
Of the total 1,748 dwellings in Watertown, owner-occupied units account for 1,448 (82.8%), while renter-occupied units make up 300 (17.2%).
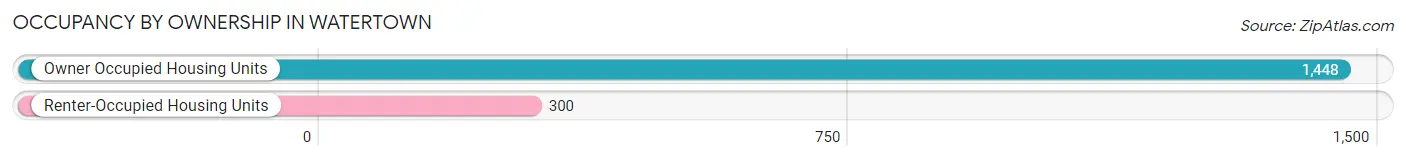
| Occupancy | # Housing Units | % Housing Units |
| Owner Occupied Housing Units | 1,448 | 82.8% |
| Renter-Occupied Housing Units | 300 | 17.2% |
| Total Occupied Housing Units | 1,748 | 100.0% |
Occupancy by Household Size in Watertown
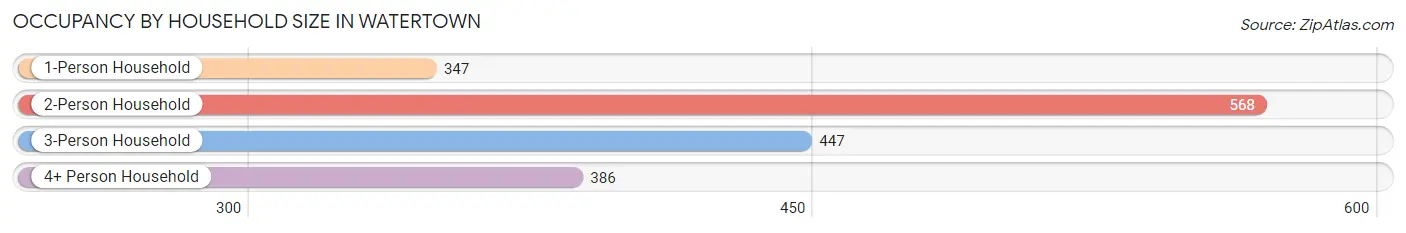
| Household Size | # Housing Units | % Housing Units |
| 1-Person Household | 347 | 19.9% |
| 2-Person Household | 568 | 32.5% |
| 3-Person Household | 447 | 25.6% |
| 4+ Person Household | 386 | 22.1% |
| Total Housing Units | 1,748 | 100.0% |
Occupancy by Ownership by Household Size in Watertown
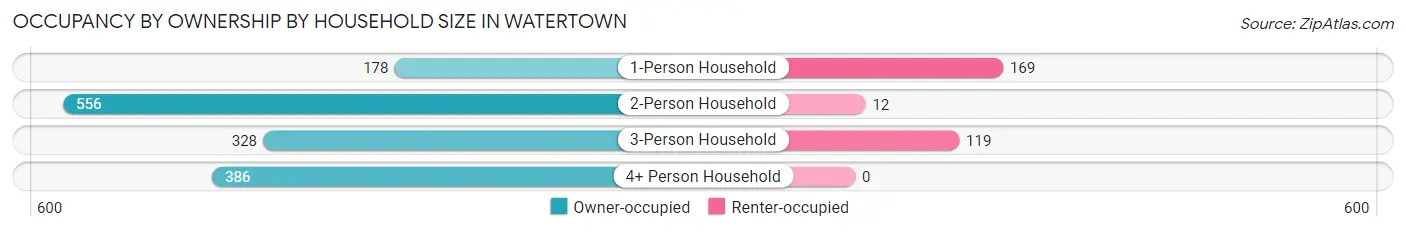
| Household Size | Owner-occupied | Renter-occupied |
| 1-Person Household | 178 (51.3%) | 169 (48.7%) |
| 2-Person Household | 556 (97.9%) | 12 (2.1%) |
| 3-Person Household | 328 (73.4%) | 119 (26.6%) |
| 4+ Person Household | 386 (100.0%) | 0 (0.0%) |
| Total Housing Units | 1,448 (82.8%) | 300 (17.2%) |
Occupancy by Educational Attainment in Watertown
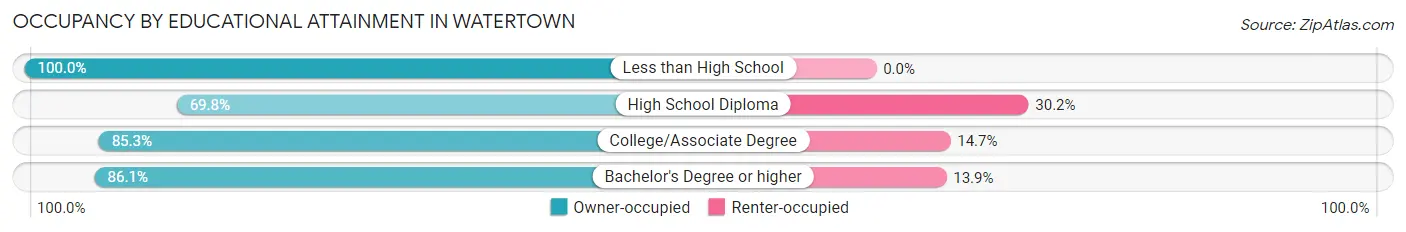
| Household Size | Owner-occupied | Renter-occupied |
| Less than High School | 64 (100.0%) | 0 (0.0%) |
| High School Diploma | 250 (69.8%) | 108 (30.2%) |
| College/Associate Degree | 818 (85.3%) | 141 (14.7%) |
| Bachelor's Degree or higher | 316 (86.1%) | 51 (13.9%) |
Occupancy by Age of Householder in Watertown
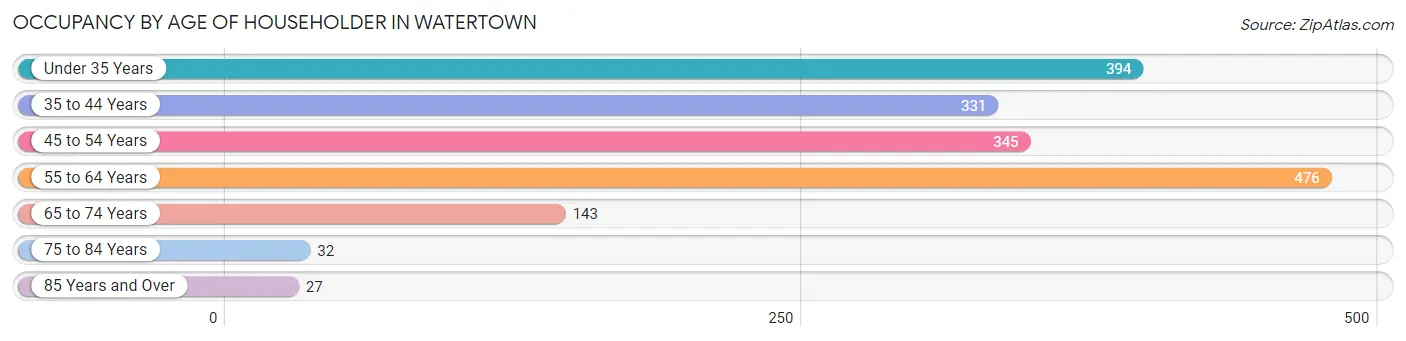
| Age Bracket | # Households | % Households |
| Under 35 Years | 394 | 22.5% |
| 35 to 44 Years | 331 | 18.9% |
| 45 to 54 Years | 345 | 19.7% |
| 55 to 64 Years | 476 | 27.2% |
| 65 to 74 Years | 143 | 8.2% |
| 75 to 84 Years | 32 | 1.8% |
| 85 Years and Over | 27 | 1.5% |
| Total | 1,748 | 100.0% |
Housing Finances in Watertown
Median Income by Occupancy in Watertown
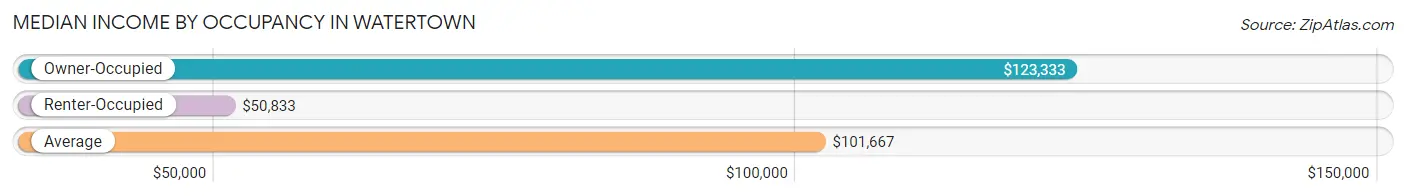
| Occupancy Type | # Households | Median Income |
| Owner-Occupied | 1,448 (82.8%) | $123,333 |
| Renter-Occupied | 300 (17.2%) | $50,833 |
| Average | 1,748 (100.0%) | $101,667 |
Occupancy by Householder Income Bracket in Watertown
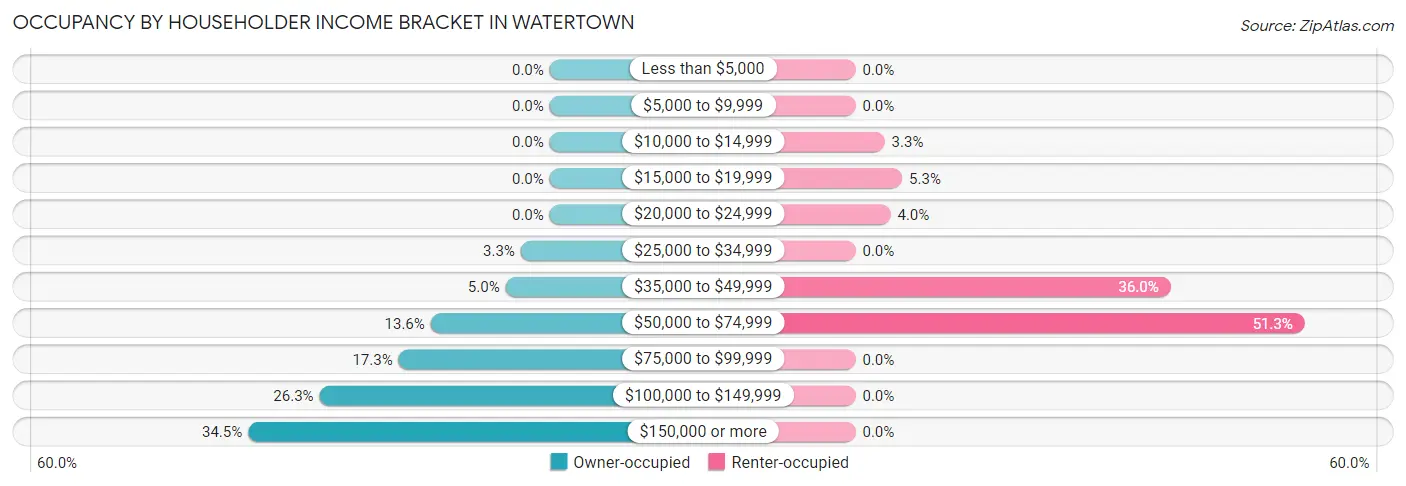
| Income Bracket | Owner-occupied | Renter-occupied |
| Less than $5,000 | 0 (0.0%) | 0 (0.0%) |
| $5,000 to $9,999 | 0 (0.0%) | 0 (0.0%) |
| $10,000 to $14,999 | 0 (0.0%) | 10 (3.3%) |
| $15,000 to $19,999 | 0 (0.0%) | 16 (5.3%) |
| $20,000 to $24,999 | 0 (0.0%) | 12 (4.0%) |
| $25,000 to $34,999 | 48 (3.3%) | 0 (0.0%) |
| $35,000 to $49,999 | 73 (5.0%) | 108 (36.0%) |
| $50,000 to $74,999 | 197 (13.6%) | 154 (51.3%) |
| $75,000 to $99,999 | 250 (17.3%) | 0 (0.0%) |
| $100,000 to $149,999 | 381 (26.3%) | 0 (0.0%) |
| $150,000 or more | 499 (34.5%) | 0 (0.0%) |
| Total | 1,448 (100.0%) | 300 (100.0%) |
Monthly Housing Cost Tiers in Watertown
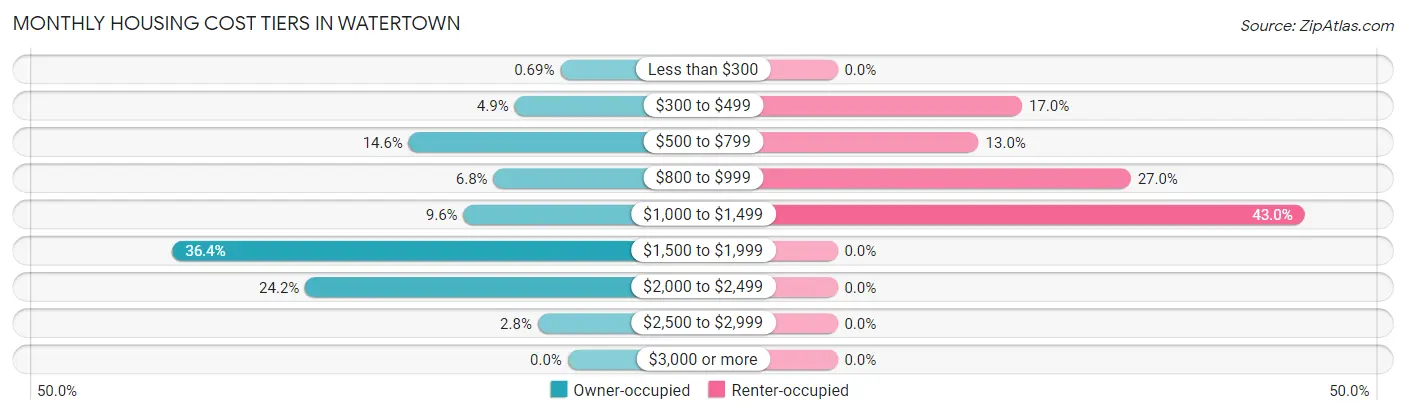
| Monthly Cost | Owner-occupied | Renter-occupied |
| Less than $300 | 10 (0.7%) | 0 (0.0%) |
| $300 to $499 | 71 (4.9%) | 51 (17.0%) |
| $500 to $799 | 212 (14.6%) | 39 (13.0%) |
| $800 to $999 | 99 (6.8%) | 81 (27.0%) |
| $1,000 to $1,499 | 139 (9.6%) | 129 (43.0%) |
| $1,500 to $1,999 | 527 (36.4%) | 0 (0.0%) |
| $2,000 to $2,499 | 350 (24.2%) | 0 (0.0%) |
| $2,500 to $2,999 | 40 (2.8%) | 0 (0.0%) |
| $3,000 or more | 0 (0.0%) | 0 (0.0%) |
| Total | 1,448 (100.0%) | 300 (100.0%) |
Physical Housing Characteristics in Watertown
Housing Structures in Watertown
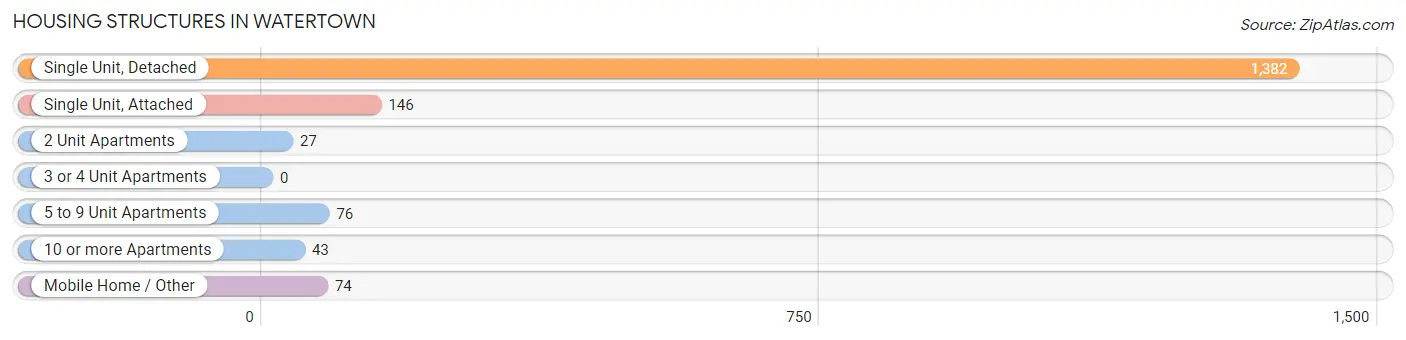
| Structure Type | # Housing Units | % Housing Units |
| Single Unit, Detached | 1,382 | 79.1% |
| Single Unit, Attached | 146 | 8.4% |
| 2 Unit Apartments | 27 | 1.5% |
| 3 or 4 Unit Apartments | 0 | 0.0% |
| 5 to 9 Unit Apartments | 76 | 4.3% |
| 10 or more Apartments | 43 | 2.5% |
| Mobile Home / Other | 74 | 4.2% |
| Total | 1,748 | 100.0% |
Housing Structures by Occupancy in Watertown
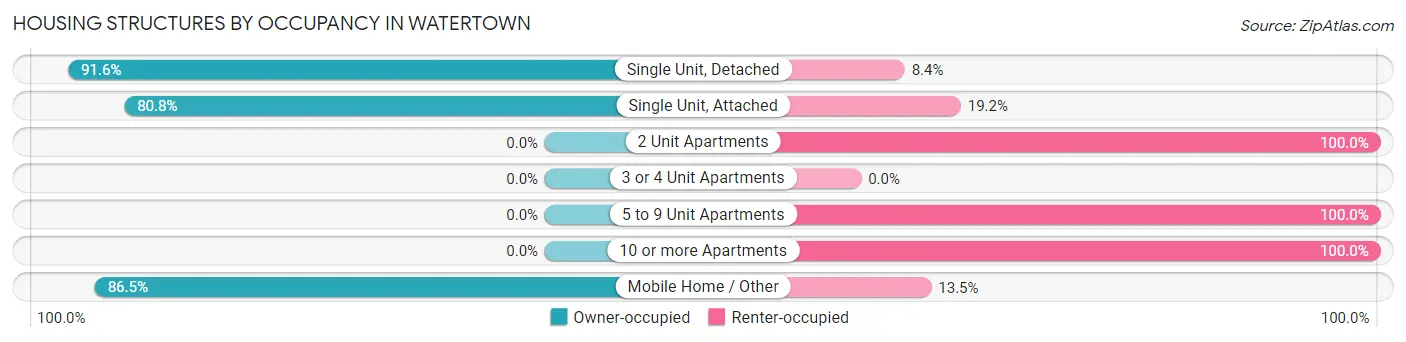
| Structure Type | Owner-occupied | Renter-occupied |
| Single Unit, Detached | 1,266 (91.6%) | 116 (8.4%) |
| Single Unit, Attached | 118 (80.8%) | 28 (19.2%) |
| 2 Unit Apartments | 0 (0.0%) | 27 (100.0%) |
| 3 or 4 Unit Apartments | 0 (0.0%) | 0 (0.0%) |
| 5 to 9 Unit Apartments | 0 (0.0%) | 76 (100.0%) |
| 10 or more Apartments | 0 (0.0%) | 43 (100.0%) |
| Mobile Home / Other | 64 (86.5%) | 10 (13.5%) |
| Total | 1,448 (82.8%) | 300 (17.2%) |
Housing Structures by Number of Rooms in Watertown
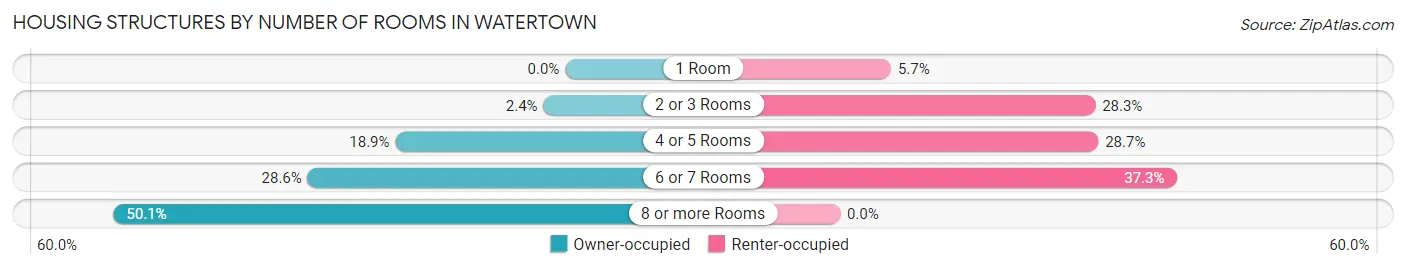
| Number of Rooms | Owner-occupied | Renter-occupied |
| 1 Room | 0 (0.0%) | 17 (5.7%) |
| 2 or 3 Rooms | 35 (2.4%) | 85 (28.3%) |
| 4 or 5 Rooms | 273 (18.9%) | 86 (28.7%) |
| 6 or 7 Rooms | 414 (28.6%) | 112 (37.3%) |
| 8 or more Rooms | 726 (50.1%) | 0 (0.0%) |
| Total | 1,448 (100.0%) | 300 (100.0%) |
Housing Structure by Heating Type in Watertown
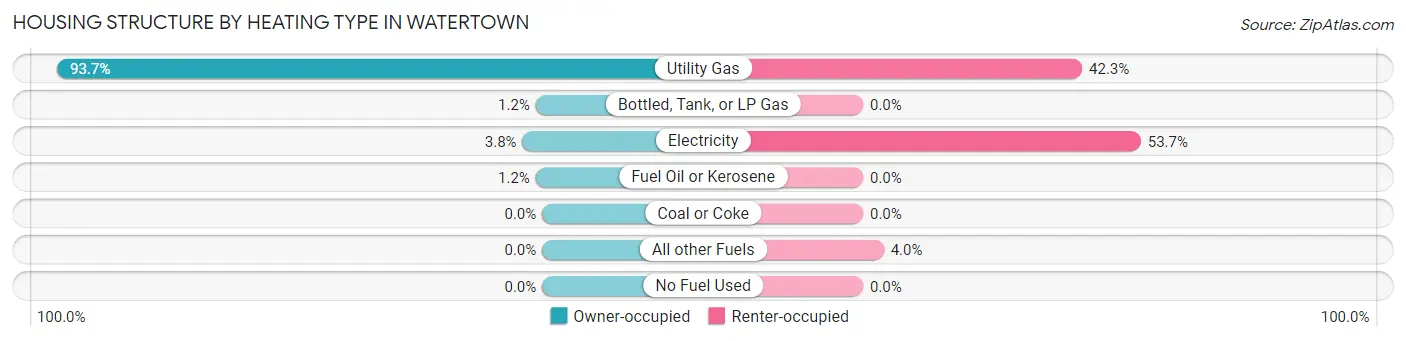
| Heating Type | Owner-occupied | Renter-occupied |
| Utility Gas | 1,357 (93.7%) | 127 (42.3%) |
| Bottled, Tank, or LP Gas | 18 (1.2%) | 0 (0.0%) |
| Electricity | 55 (3.8%) | 161 (53.7%) |
| Fuel Oil or Kerosene | 18 (1.2%) | 0 (0.0%) |
| Coal or Coke | 0 (0.0%) | 0 (0.0%) |
| All other Fuels | 0 (0.0%) | 12 (4.0%) |
| No Fuel Used | 0 (0.0%) | 0 (0.0%) |
| Total | 1,448 (100.0%) | 300 (100.0%) |
Household Vehicle Usage in Watertown
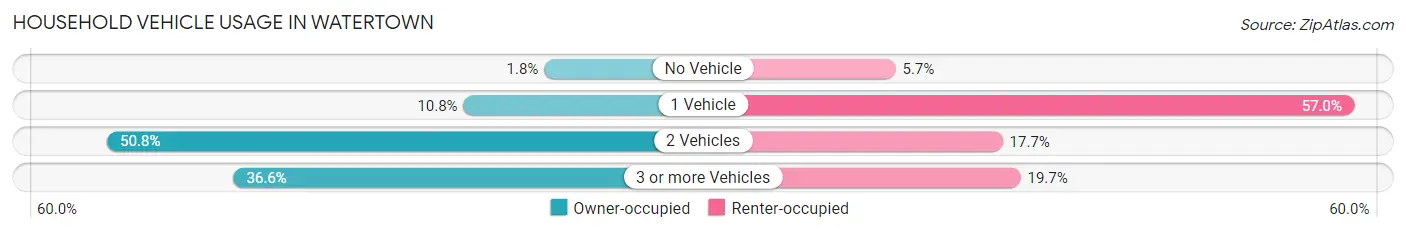
| Vehicles per Household | Owner-occupied | Renter-occupied |
| No Vehicle | 26 (1.8%) | 17 (5.7%) |
| 1 Vehicle | 157 (10.8%) | 171 (57.0%) |
| 2 Vehicles | 735 (50.8%) | 53 (17.7%) |
| 3 or more Vehicles | 530 (36.6%) | 59 (19.7%) |
| Total | 1,448 (100.0%) | 300 (100.0%) |
Real Estate & Mortgages in Watertown
Real Estate and Mortgage Overview in Watertown
| Characteristic | Without Mortgage | With Mortgage |
| Housing Units | 375 | 1,073 |
| Median Property Value | $263,400 | $296,300 |
| Median Household Income | $83,403 | $397 |
| Monthly Housing Costs | $723 | $0 |
| Real Estate Taxes | $2,759 | $0 |
Property Value by Mortgage Status in Watertown
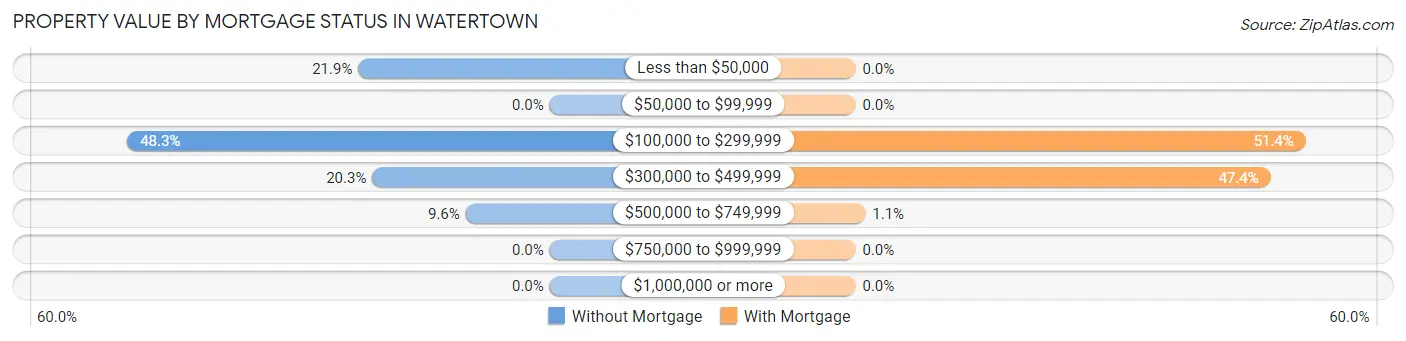
| Property Value | Without Mortgage | With Mortgage |
| Less than $50,000 | 82 (21.9%) | 0 (0.0%) |
| $50,000 to $99,999 | 0 (0.0%) | 0 (0.0%) |
| $100,000 to $299,999 | 181 (48.3%) | 552 (51.4%) |
| $300,000 to $499,999 | 76 (20.3%) | 509 (47.4%) |
| $500,000 to $749,999 | 36 (9.6%) | 12 (1.1%) |
| $750,000 to $999,999 | 0 (0.0%) | 0 (0.0%) |
| $1,000,000 or more | 0 (0.0%) | 0 (0.0%) |
| Total | 375 (100.0%) | 1,073 (100.0%) |
Household Income by Mortgage Status in Watertown
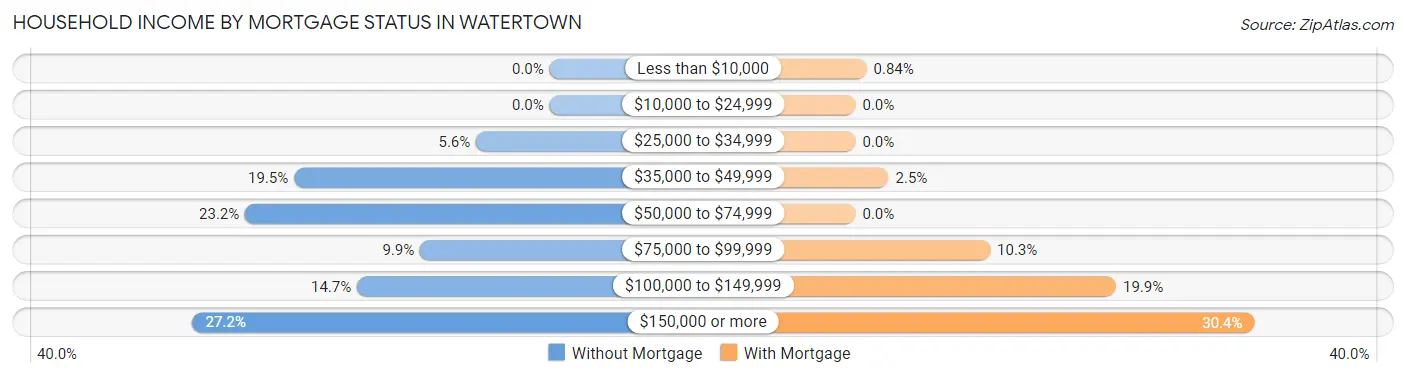
| Household Income | Without Mortgage | With Mortgage |
| Less than $10,000 | 0 (0.0%) | 9 (0.8%) |
| $10,000 to $24,999 | 0 (0.0%) | 0 (0.0%) |
| $25,000 to $34,999 | 21 (5.6%) | 0 (0.0%) |
| $35,000 to $49,999 | 73 (19.5%) | 27 (2.5%) |
| $50,000 to $74,999 | 87 (23.2%) | 0 (0.0%) |
| $75,000 to $99,999 | 37 (9.9%) | 110 (10.2%) |
| $100,000 to $149,999 | 55 (14.7%) | 213 (19.9%) |
| $150,000 or more | 102 (27.2%) | 326 (30.4%) |
| Total | 375 (100.0%) | 1,073 (100.0%) |
Property Value to Household Income Ratio in Watertown
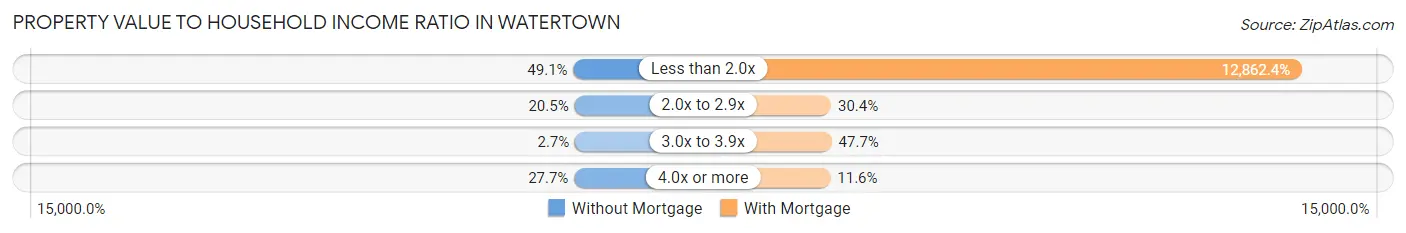
| Value-to-Income Ratio | Without Mortgage | With Mortgage |
| Less than 2.0x | 184 (49.1%) | 138,013 (12,862.4%) |
| 2.0x to 2.9x | 77 (20.5%) | 326 (30.4%) |
| 3.0x to 3.9x | 10 (2.7%) | 512 (47.7%) |
| 4.0x or more | 104 (27.7%) | 124 (11.6%) |
| Total | 375 (100.0%) | 1,073 (100.0%) |
Real Estate Taxes by Mortgage Status in Watertown
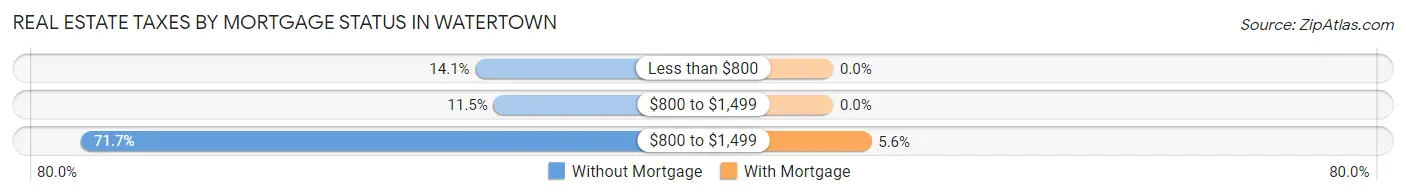
| Property Taxes | Without Mortgage | With Mortgage |
| Less than $800 | 53 (14.1%) | 0 (0.0%) |
| $800 to $1,499 | 43 (11.5%) | 0 (0.0%) |
| $800 to $1,499 | 269 (71.7%) | 60 (5.6%) |
| Total | 375 (100.0%) | 1,073 (100.0%) |
Health & Disability in Watertown
Health Insurance Coverage by Age in Watertown
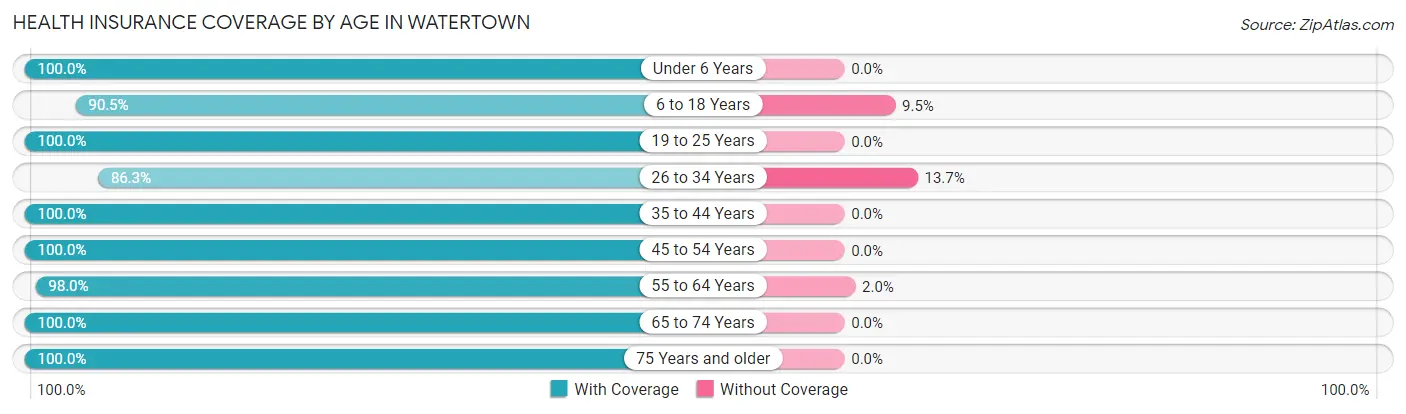
| Age Bracket | With Coverage | Without Coverage |
| Under 6 Years | 568 (100.0%) | 0 (0.0%) |
| 6 to 18 Years | 602 (90.5%) | 63 (9.5%) |
| 19 to 25 Years | 623 (100.0%) | 0 (0.0%) |
| 26 to 34 Years | 392 (86.3%) | 62 (13.7%) |
| 35 to 44 Years | 624 (100.0%) | 0 (0.0%) |
| 45 to 54 Years | 696 (100.0%) | 0 (0.0%) |
| 55 to 64 Years | 682 (98.0%) | 14 (2.0%) |
| 65 to 74 Years | 241 (100.0%) | 0 (0.0%) |
| 75 Years and older | 99 (100.0%) | 0 (0.0%) |
| Total | 4,527 (97.0%) | 139 (3.0%) |
Health Insurance Coverage by Citizenship Status in Watertown
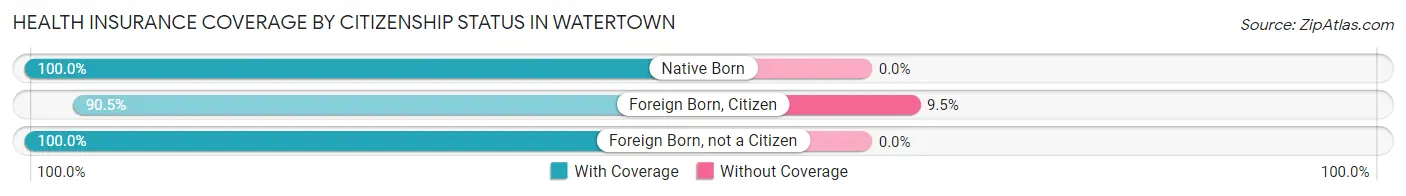
| Citizenship Status | With Coverage | Without Coverage |
| Native Born | 568 (100.0%) | 0 (0.0%) |
| Foreign Born, Citizen | 602 (90.5%) | 63 (9.5%) |
| Foreign Born, not a Citizen | 623 (100.0%) | 0 (0.0%) |
Health Insurance Coverage by Household Income in Watertown
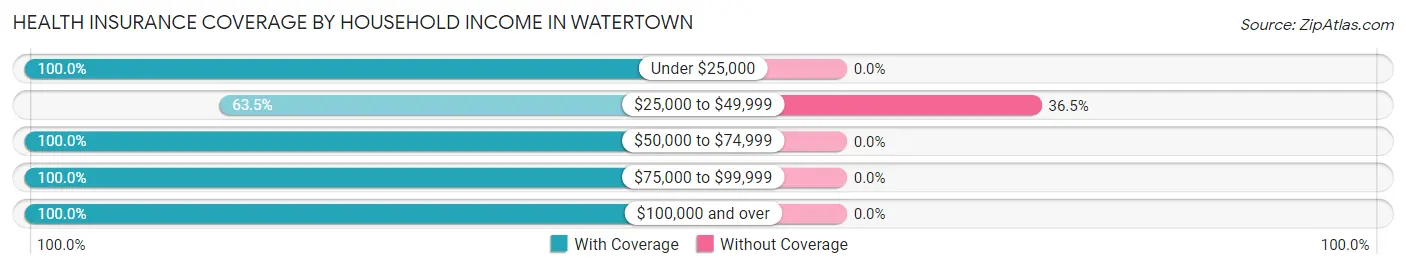
| Household Income | With Coverage | Without Coverage |
| Under $25,000 | 72 (100.0%) | 0 (0.0%) |
| $25,000 to $49,999 | 242 (63.5%) | 139 (36.5%) |
| $50,000 to $74,999 | 1,014 (100.0%) | 0 (0.0%) |
| $75,000 to $99,999 | 776 (100.0%) | 0 (0.0%) |
| $100,000 and over | 2,412 (100.0%) | 0 (0.0%) |
Public vs Private Health Insurance Coverage by Age in Watertown
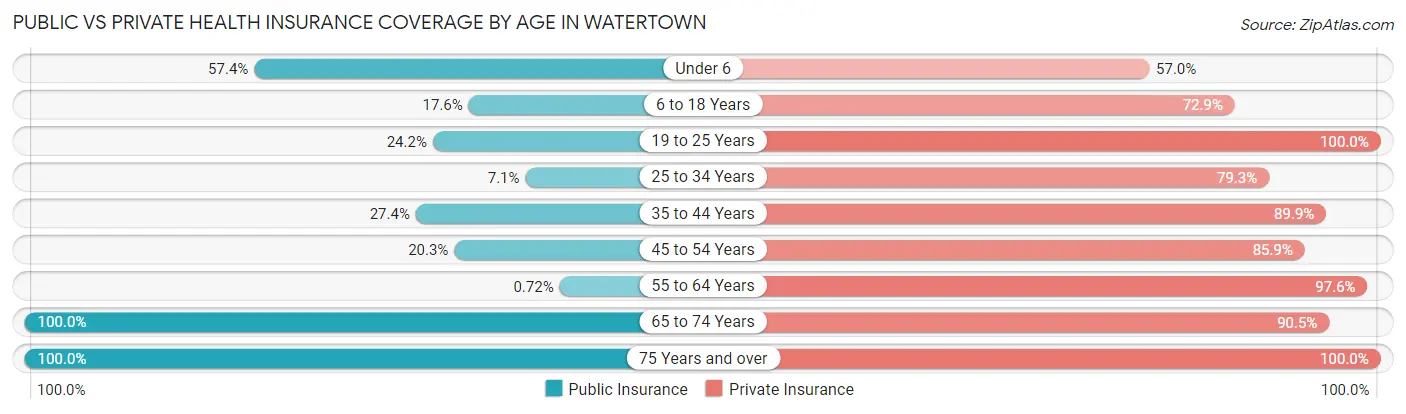
| Age Bracket | Public Insurance | Private Insurance |
| Under 6 | 326 (57.4%) | 324 (57.0%) |
| 6 to 18 Years | 117 (17.6%) | 485 (72.9%) |
| 19 to 25 Years | 151 (24.2%) | 623 (100.0%) |
| 25 to 34 Years | 32 (7.0%) | 360 (79.3%) |
| 35 to 44 Years | 171 (27.4%) | 561 (89.9%) |
| 45 to 54 Years | 141 (20.3%) | 598 (85.9%) |
| 55 to 64 Years | 5 (0.7%) | 679 (97.6%) |
| 65 to 74 Years | 241 (100.0%) | 218 (90.5%) |
| 75 Years and over | 99 (100.0%) | 99 (100.0%) |
| Total | 1,283 (27.5%) | 3,947 (84.6%) |
Disability Status by Sex by Age in Watertown
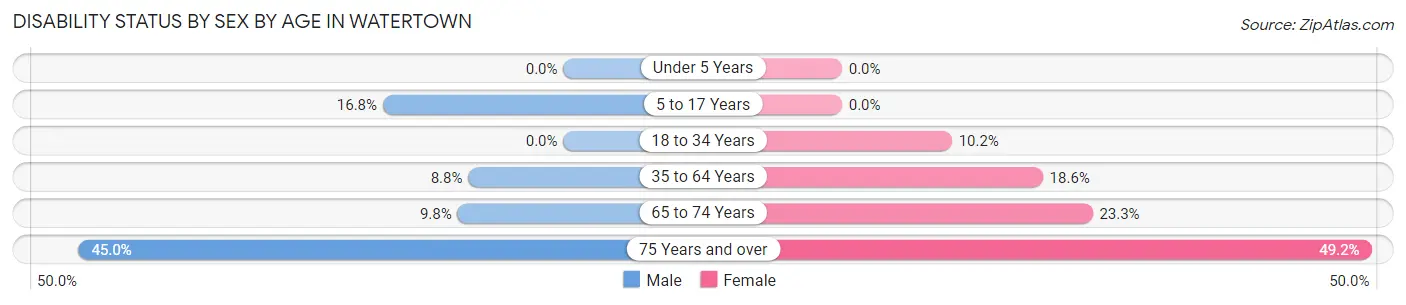
| Age Bracket | Male | Female |
| Under 5 Years | 0 (0.0%) | 0 (0.0%) |
| 5 to 17 Years | 69 (16.8%) | 0 (0.0%) |
| 18 to 34 Years | 0 (0.0%) | 61 (10.2%) |
| 35 to 64 Years | 96 (8.8%) | 173 (18.6%) |
| 65 to 74 Years | 11 (9.8%) | 30 (23.3%) |
| 75 Years and over | 18 (45.0%) | 29 (49.1%) |
Disability Class by Sex by Age in Watertown
Disability Class: Hearing Difficulty
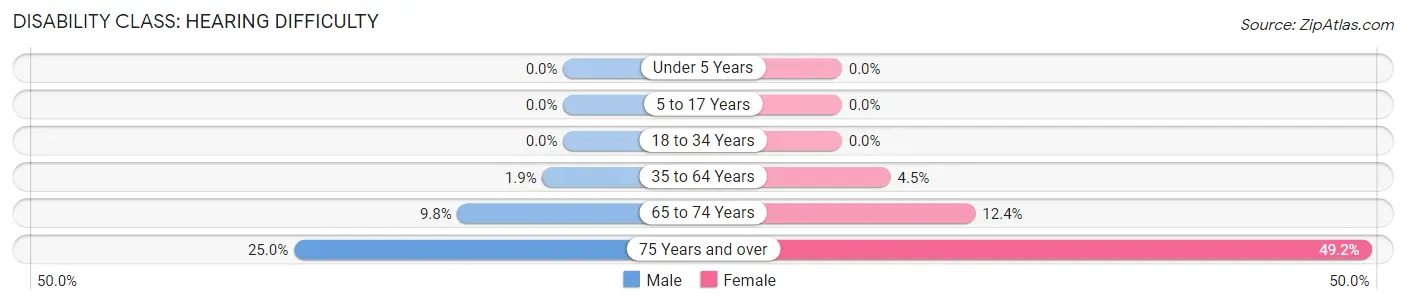
| Age Bracket | Male | Female |
| Under 5 Years | 0 (0.0%) | 0 (0.0%) |
| 5 to 17 Years | 0 (0.0%) | 0 (0.0%) |
| 18 to 34 Years | 0 (0.0%) | 0 (0.0%) |
| 35 to 64 Years | 21 (1.9%) | 42 (4.5%) |
| 65 to 74 Years | 11 (9.8%) | 16 (12.4%) |
| 75 Years and over | 10 (25.0%) | 29 (49.1%) |
Disability Class: Vision Difficulty
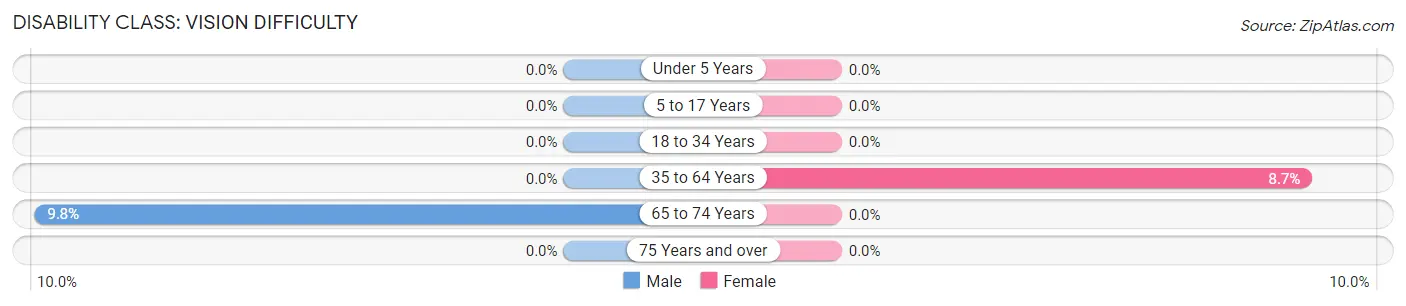
| Age Bracket | Male | Female |
| Under 5 Years | 0 (0.0%) | 0 (0.0%) |
| 5 to 17 Years | 0 (0.0%) | 0 (0.0%) |
| 18 to 34 Years | 0 (0.0%) | 0 (0.0%) |
| 35 to 64 Years | 0 (0.0%) | 81 (8.7%) |
| 65 to 74 Years | 11 (9.8%) | 0 (0.0%) |
| 75 Years and over | 0 (0.0%) | 0 (0.0%) |
Disability Class: Cognitive Difficulty
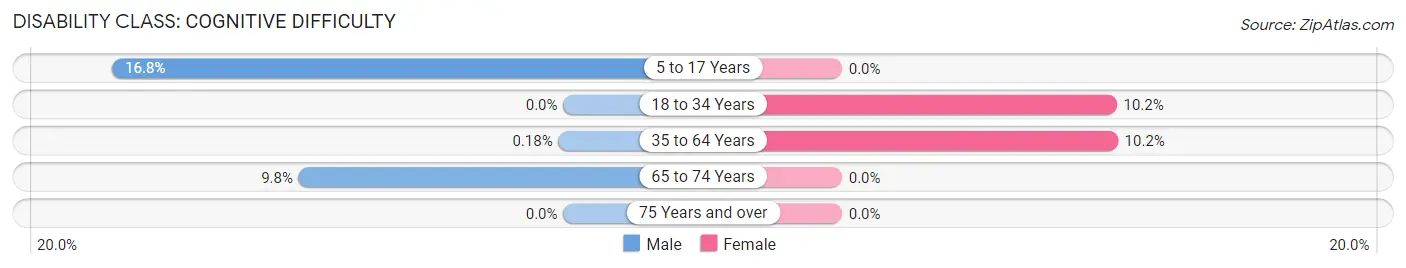
| Age Bracket | Male | Female |
| 5 to 17 Years | 69 (16.8%) | 0 (0.0%) |
| 18 to 34 Years | 0 (0.0%) | 61 (10.2%) |
| 35 to 64 Years | 2 (0.2%) | 95 (10.2%) |
| 65 to 74 Years | 11 (9.8%) | 0 (0.0%) |
| 75 Years and over | 0 (0.0%) | 0 (0.0%) |
Disability Class: Ambulatory Difficulty
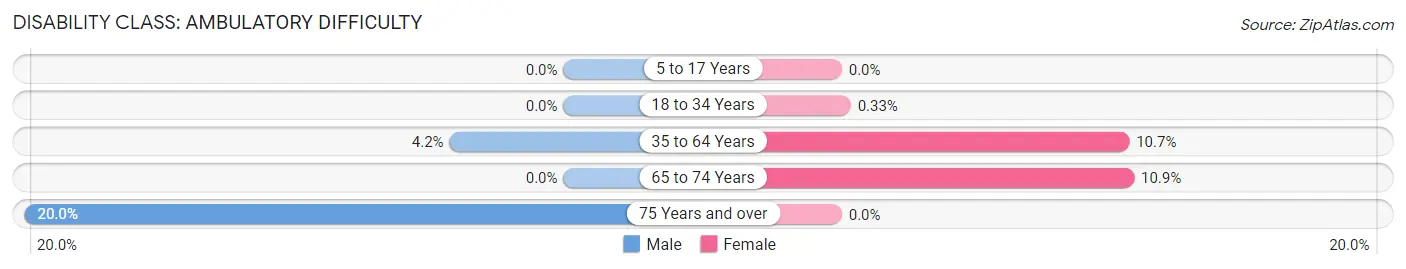
| Age Bracket | Male | Female |
| 5 to 17 Years | 0 (0.0%) | 0 (0.0%) |
| 18 to 34 Years | 0 (0.0%) | 2 (0.3%) |
| 35 to 64 Years | 46 (4.2%) | 99 (10.7%) |
| 65 to 74 Years | 0 (0.0%) | 14 (10.8%) |
| 75 Years and over | 8 (20.0%) | 0 (0.0%) |
Disability Class: Self-Care Difficulty
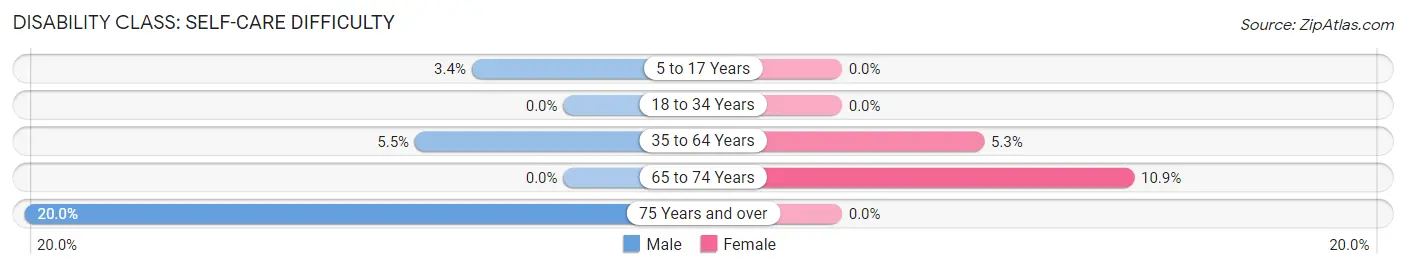
| Age Bracket | Male | Female |
| 5 to 17 Years | 14 (3.4%) | 0 (0.0%) |
| 18 to 34 Years | 0 (0.0%) | 0 (0.0%) |
| 35 to 64 Years | 60 (5.5%) | 49 (5.3%) |
| 65 to 74 Years | 0 (0.0%) | 14 (10.8%) |
| 75 Years and over | 8 (20.0%) | 0 (0.0%) |
Technology Access in Watertown
Computing Device Access in Watertown
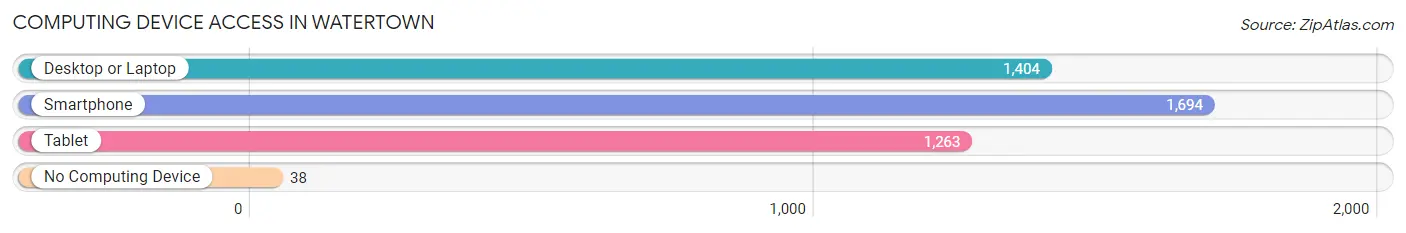
| Device Type | # Households | % Households |
| Desktop or Laptop | 1,404 | 80.3% |
| Smartphone | 1,694 | 96.9% |
| Tablet | 1,263 | 72.3% |
| No Computing Device | 38 | 2.2% |
| Total | 1,748 | 100.0% |
Internet Access in Watertown
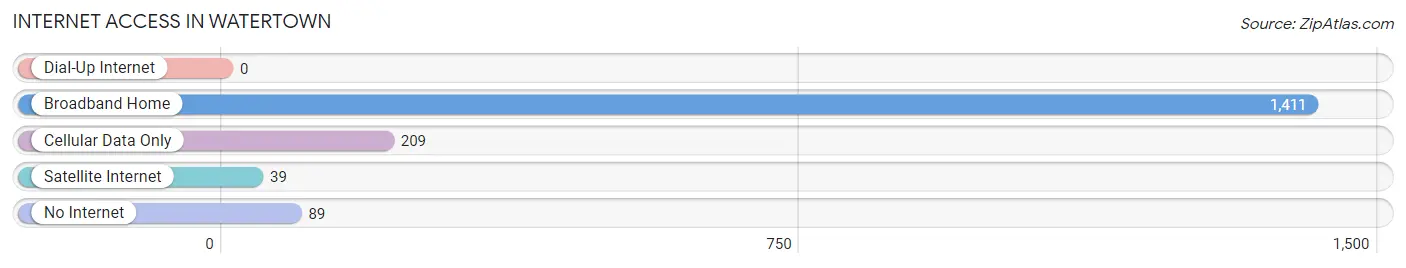
| Internet Type | # Households | % Households |
| Dial-Up Internet | 0 | 0.0% |
| Broadband Home | 1,411 | 80.7% |
| Cellular Data Only | 209 | 12.0% |
| Satellite Internet | 39 | 2.2% |
| No Internet | 89 | 5.1% |
| Total | 1,748 | 100.0% |
Watertown Summary
History
Watertown, Minnesota is a small city located in Carver County, Minnesota. It is situated on the banks of the Crow River, about 25 miles west of Minneapolis. The city was founded in 1856 by a group of settlers from Watertown, Wisconsin. The city was originally known as Watertown Township, but was incorporated as a city in 1876.
The city was named after Watertown, Wisconsin, which was named after Watertown, New York. The city was originally settled by German immigrants, and the city was known for its strong German heritage. The city was also known for its strong agricultural industry, and was home to many dairy farms.
In the early 1900s, the city began to grow and develop. The city was home to several factories, including a flour mill, a creamery, and a canning factory. The city also had a railroad station, which connected it to the Twin Cities.
The city continued to grow and develop throughout the 20th century. In the 1950s, the city was home to a large number of manufacturing plants, including a paper mill, a furniture factory, and a printing plant. The city also had a large number of retail stores, including a department store, a grocery store, and a drug store.
The city continued to grow and develop throughout the late 20th century. In the 1980s, the city was home to a large number of technology companies, including a computer software company and a medical device manufacturer. The city also had a large number of retail stores, including a mall and a number of restaurants.
Geography
Watertown is located in Carver County, Minnesota. It is situated on the banks of the Crow River, about 25 miles west of Minneapolis. The city has a total area of 4.2 square miles, all of which is land. The city is located in the Central Minnesota region, and is part of the Twin Cities metropolitan area.
The city is located in a flat, open area, with rolling hills and wooded areas. The city is located in a temperate climate, with hot summers and cold winters. The average temperature in the summer is around 75 degrees Fahrenheit, and the average temperature in the winter is around 20 degrees Fahrenheit.
Economy
Watertown has a strong and diverse economy. The city is home to a number of manufacturing companies, including a paper mill, a furniture factory, and a printing plant. The city also has a large number of retail stores, including a department store, a grocery store, and a drug store.
The city is also home to a number of technology companies, including a computer software company and a medical device manufacturer. The city also has a large number of restaurants, including fast food restaurants, family restaurants, and fine dining establishments.
The city is also home to a number of educational institutions, including a community college and a technical college. The city is also home to a number of healthcare facilities, including a hospital and a number of clinics.
Demographics
As of the 2010 census, the population of Watertown was 8,719. The population is made up of a diverse mix of people, including African Americans, Hispanics, Asians, and Native Americans. The median age of the population is 37.7 years, and the median household income is $50,945.
The city is home to a number of religious institutions, including churches, synagogues, and mosques. The city is also home to a number of cultural institutions, including museums, theaters, and libraries.
Conclusion
Watertown, Minnesota is a small city located in Carver County, Minnesota. It is situated on the banks of the Crow River, about 25 miles west of Minneapolis. The city was founded in 1856 by a group of settlers from Watertown, Wisconsin. The city has a strong and diverse economy, and is home to a number of manufacturing companies, technology companies, retail stores, restaurants, educational institutions, and healthcare facilities. The population of Watertown is made up of a diverse mix of people, and the median age of the population is 37.7 years. The city is home to a number of religious institutions, cultural institutions, and other attractions.
Common Questions
What is Per Capita Income in Watertown?
Per Capita income in Watertown is $42,718.
What is the Median Family Income in Watertown?
Median Family Income in Watertown is $135,000.
What is the Median Household income in Watertown?
Median Household Income in Watertown is $101,667.
What is Income or Wage Gap in Watertown?
Income or Wage Gap in Watertown is 33.8%.
Women in Watertown earn 66.2 cents for every dollar earned by a man.
What is Inequality or Gini Index in Watertown?
Inequality or Gini Index in Watertown is 0.30.
What is the Total Population of Watertown?
Total Population of Watertown is 4,712.
What is the Total Male Population of Watertown?
Total Male Population of Watertown is 2,363.
What is the Total Female Population of Watertown?
Total Female Population of Watertown is 2,349.
What is the Ratio of Males per 100 Females in Watertown?
There are 100.60 Males per 100 Females in Watertown.
What is the Ratio of Females per 100 Males in Watertown?
There are 99.41 Females per 100 Males in Watertown.
What is the Median Population Age in Watertown?
Median Population Age in Watertown is 35.4 Years.
What is the Average Family Size in Watertown
Average Family Size in Watertown is 2.9 People.
What is the Average Household Size in Watertown
Average Household Size in Watertown is 2.7 People.
How Large is the Labor Force in Watertown?
There are 2,871 People in the Labor Forcein in Watertown.
What is the Percentage of People in the Labor Force in Watertown?
79.1% of People are in the Labor Force in Watertown.